Article

Research on Identification and Location of Mining Landslide in Mining Area Based on Improved YOLO Algorithm

1
School of Mining Engineering, Taiyuan University of Technology, Taiyuan 030024, China
2
Sinosteel Maanshan General Institute of Mining Research Co., Ltd., Maanshan 243000, China
3
State Key Laboratory of Safety and Health for Metal Mines, Maanshan 243000, China
*
Author to whom correspondence should be addressed.
Drones 2024, 8(4), 150; https://doi.org/10.3390/drones8040150
Submission received: 6 March 2024 / Revised: 25 March 2024 / Accepted: 10 April 2024 / Published: 14 April 2024
(This article belongs to the Special Issue Drones for Natural Hazards)

Abstract

:
The wide range and high intensity of landslides in the mining area pose a great threat to the safety of human life and property. It is particularly important to identify and monitor them. However, due to the serious surface damage, small landslide scale, complex background and other factors in the mining area, it is impossible to accurately identify and detect the landslide in the mining area. It is necessary to select an efficient detection model to detect it. In this paper, aiming at the problem of landslide identification in mining area, the remote sensing image of mining area is obtained by unmanned aerial vehicle (UAV), and the landslide data set of mining area is constructed by data enhancement method. An improved YOLOv8 algorithm is proposed. By adding a mixed attention mechanism in the channel and spatial dimensions, the detection accuracy of the model for mining landslide is improved, and the monitoring of landslide changes in the mining area is successfully completed. At the same time, an algorithm for locating the landslide position is proposed. Through this algorithm, the detected landslide pixel coordinates can be converted into geodetic coordinates. The results show that the improved YOLOv8 algorithm proposed in this paper has a recognition accuracy of 93.10% for mining area landslides. Compared with the [email protected] of the original YOLOv8 algorithm and YOLOv5 algorithm, the improved YOLOv8 algorithm has an increase of 4.2% and 5.1%. This study has realized the monitoring and positioning of the landslide in the mining area, which can provide the necessary data support for the ecological restoration on mining area.

1. Introduction

Landslide is a kind of geological disaster that is recognized as one of the most severe hazards. It is widely distributed, can have a potent impact, and is particularly destructive. Landslides represent a significant threat not only to human life and safety but also to damage to property, environmental degradation, and resource depletion [1]. For instance, there is a deep loess landslide that took place in Zaoling, Shanxi Province, China, on 15 March 2019, resulting in the loss of 20 lives and injuring 13 people [2]. On 3 July 2021, a landslide occurred in the Izu Mountain region of Shizuoka County, Japan, which resulted in the loss of 26 lives, and devastated 131 residences [3].
Shanxi is in the north-central part of China. The terrain is the loess gully area. This is a special geological structure between the plain area and the plateau area. The geological conditions in this area are quite complex. As a major coal province, Shanxi Province has a coal-bearing area of about 6.2 × 10⁴ km2 and about 1000 coal mines [4]. For a long time, human engineering activities have become increasingly active. Mineral resources have been continuously exploited, and the scale of mining area construction has been continuously expanded, which has led to more frequent occurrence of geological disasters. Shanxi Province has become a serious province of mining landslide geological disasters [5,6].
After the landslide disaster occurs, accurate and rapid acquisition of landslide location information is very important for subsequent rescue and governance work [7]. Indeed, the rapid identification and location of landslide-prone areas has become an urgent issue that needs to be addressed. However, with the latest advancements in remote sensing and artificial intelligence technologies, it has become feasible to utilize remote sensing technology to identify regions susceptible to landslides. This innovative approach can not only reduce the risk of loss of life and property damage, but also provide essential information to aid in disaster response and relief efforts. Huang et al. used high-resolution satellite images to extract landslide information through object-oriented analysis technology, selected appropriate feature parameters to construct classification rules, and completed landslide identification [8]. Based on the GeoEye-1 satellite data, Ding et al. used the object-oriented classification method to complete the rapid identification of landslide disasters according to the spectral and shape characteristics of landslides [9].
In the paper of Wang et al., a three-dimensional reconstruction and disaster identification classification method of slope based on UAV oblique photography was proposed, and the three-dimensional model of slope was reconstructed by using UAV multi-view images. Combined with PointNet++ classification neural network algorithm, the intelligent identification of landslide is realized [10]. In the work by Cai et al., they put forward a modeling methodology that employs convolutional neural networks (CNN) and integrates terrain characteristics. To construct landslide samples, they combined terrain factors with Landsat OLI remote sensing images. A lightweight convolutional neural network (FN-CNN) was designed, and the optimal model was trained to identify landslides [11]. Xin et al. used optical remote sensing images, digital elevation model (DEM) data, geological data and rainfall data to construct a landslide multi-source data set and designed a multi-source heterogeneous data preprocessing process and fusion model. Then, the Res-UNet model is constructed to realize the recognition of landslide [12].
The purpose of this study is to use the improved YOLO algorithm, combined with the high-resolution and large-scale characteristics of UAV low-altitude remote sensing images, to establish a landslide sample database in the mining area, and to realize the identification and location of mining landslides in the mining area. Currently, there exists a wide array of algorithms for landslide recognition that are based on optical remote sensing images. However, there remain certain shortcomings in the application of landslide recognition methods that rely on low-altitude remote sensing images captured by UAV particularly in mining regions. Most of the existing work only completes the content of landslide identification [13]. In the context of mining areas, precise positioning of landslides using UAV images is essential to gather the necessary data required for subsequent ecological restoration efforts in these areas.

2. Study Area and Data Collection
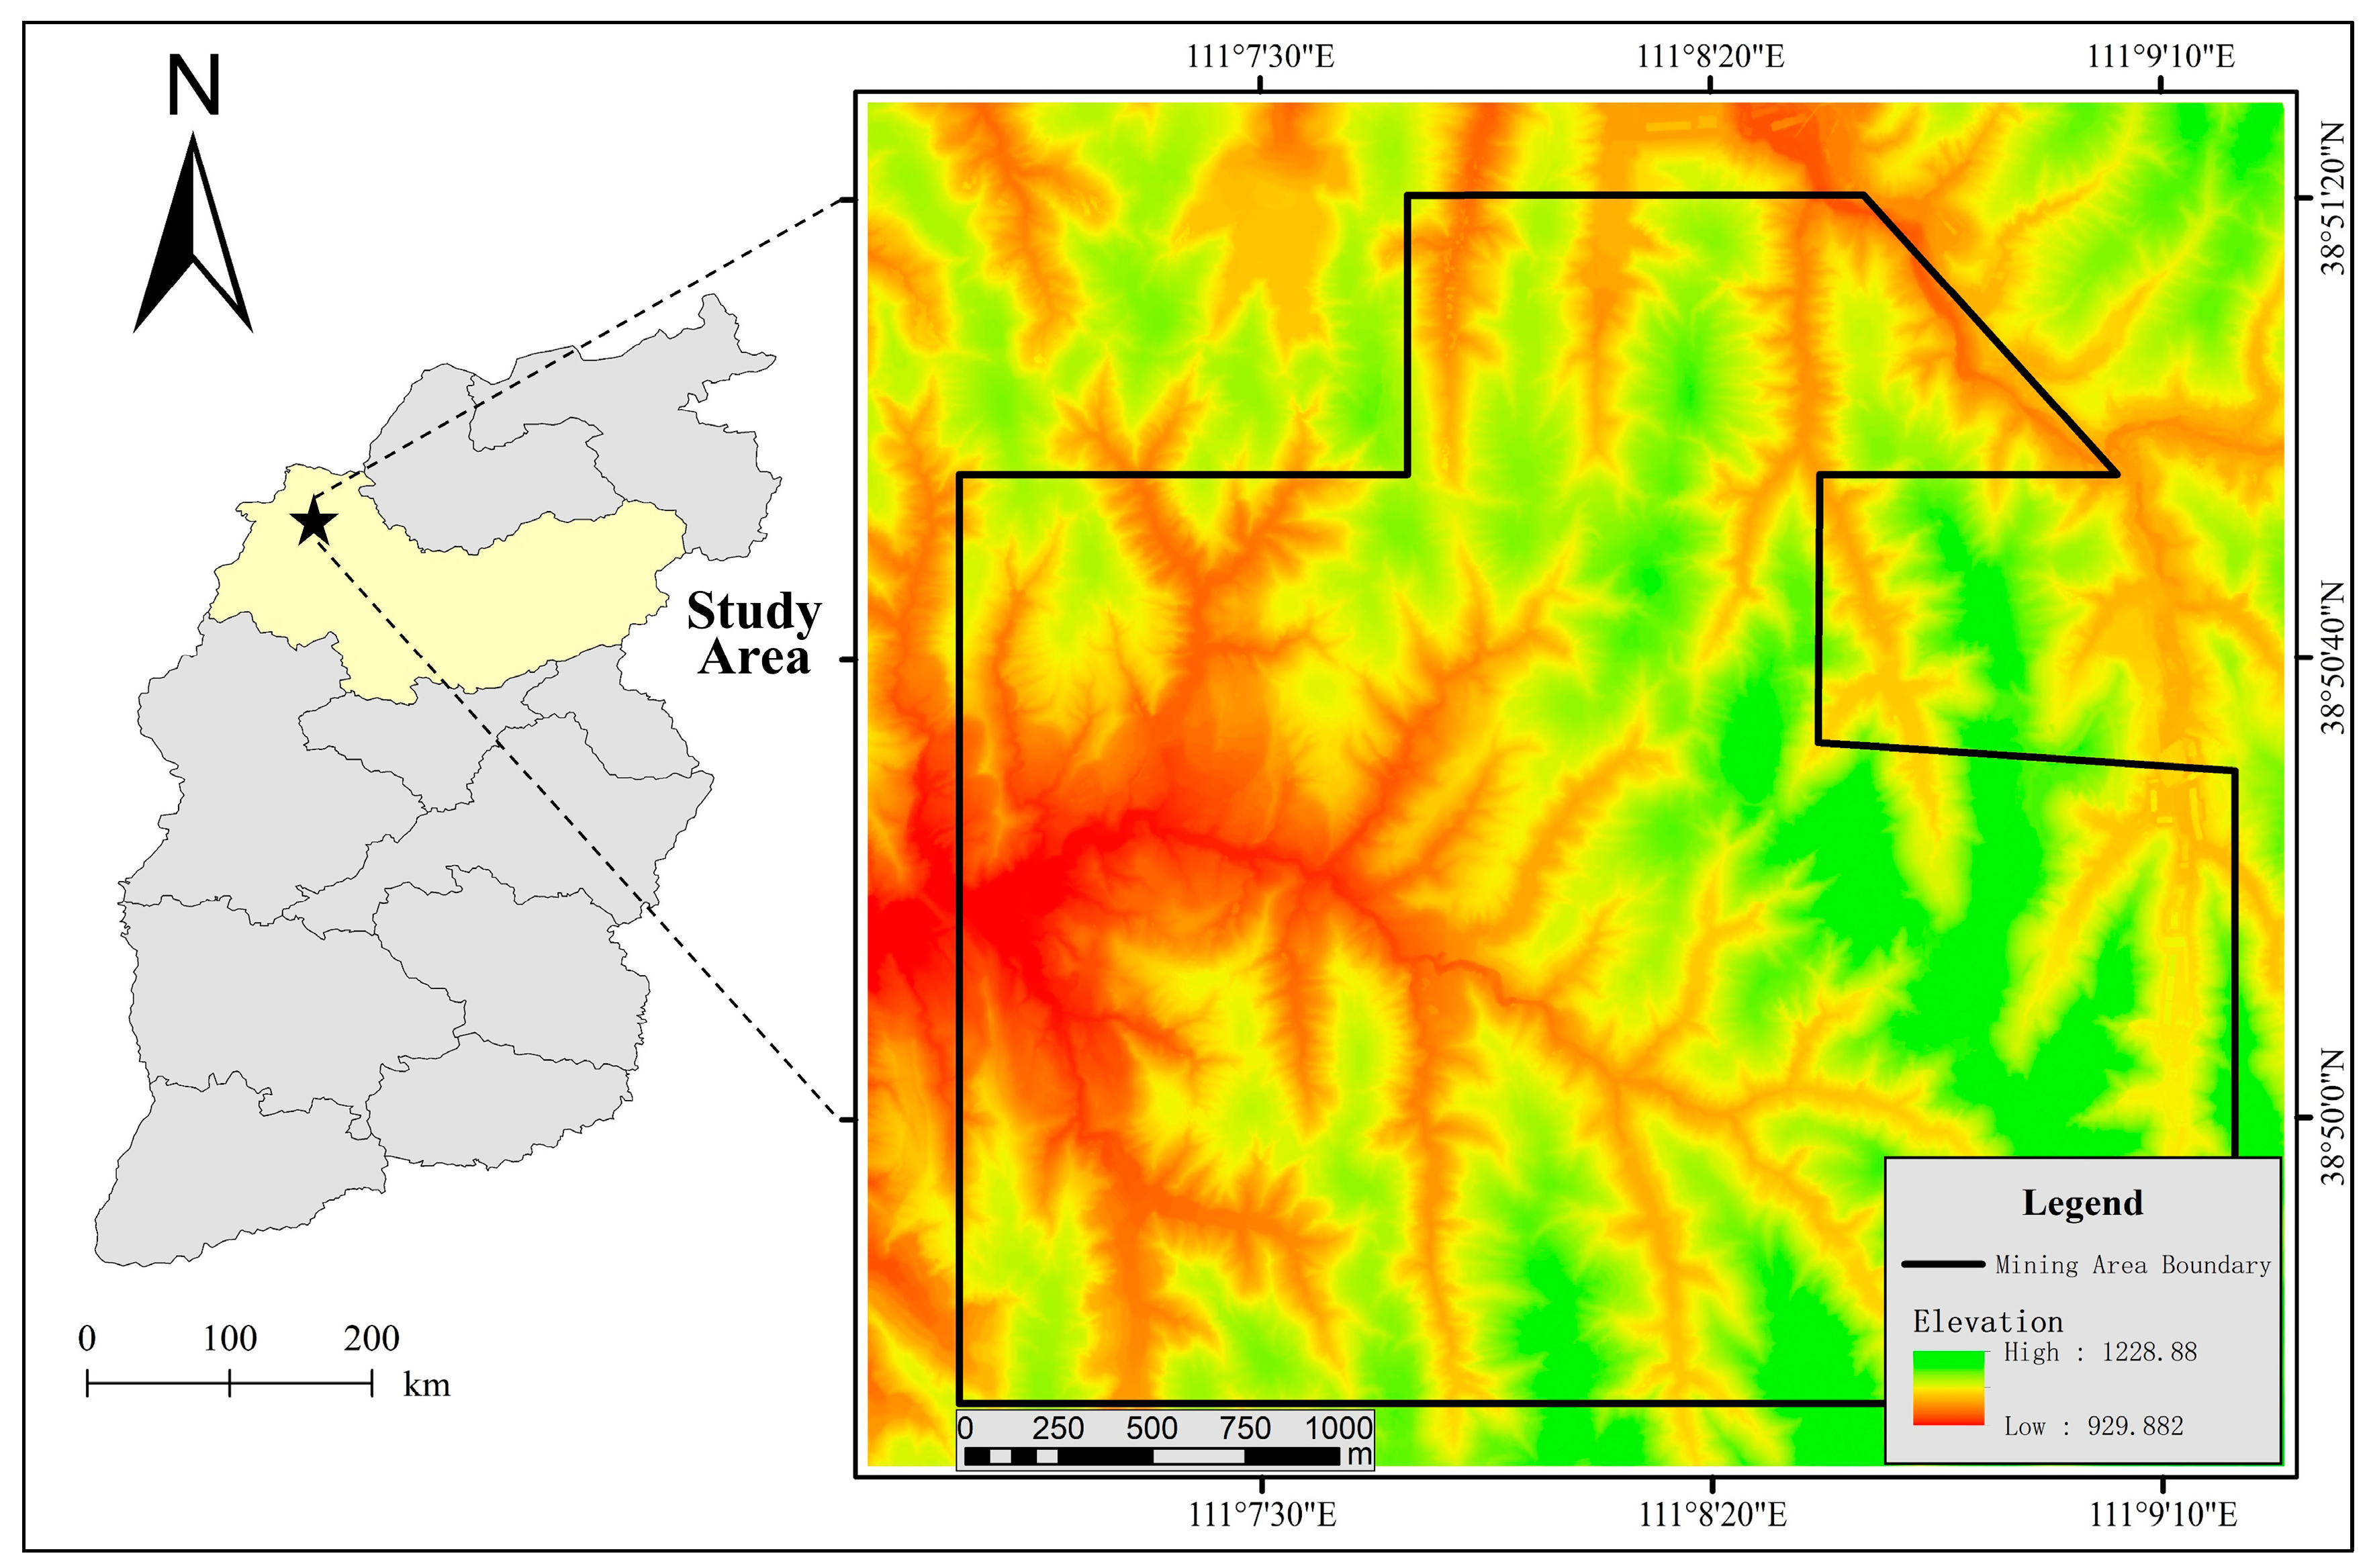
2.1. Study Area

The research area is Sunjiagou Coal Mine, located in Baode County, Xinzhou City, Shanxi Province. Geographical coordinates: east longitude: 111°06′55″–111°09′16″; north latitude: 38°49′34″–38°51′19″. The study area exhibits a maximum elevation of 1160 m, a minimum elevation of 1028 m, and an average elevation of 1095 m. This area is located in the eastern part of the Yellow River, the northwest edge of Shanxi, which belongs to the Zhongshan loess landform. The terrain is undulating, the valleys are crisscrossed, the terrain is seriously cut, and the vegetation is poor. The regular mining operations have altered the inertia exerted on the slope, resulting in surface deformation, heightened fissures, and accelerated landslide formation. The location of the research site is shown in Figure 1.

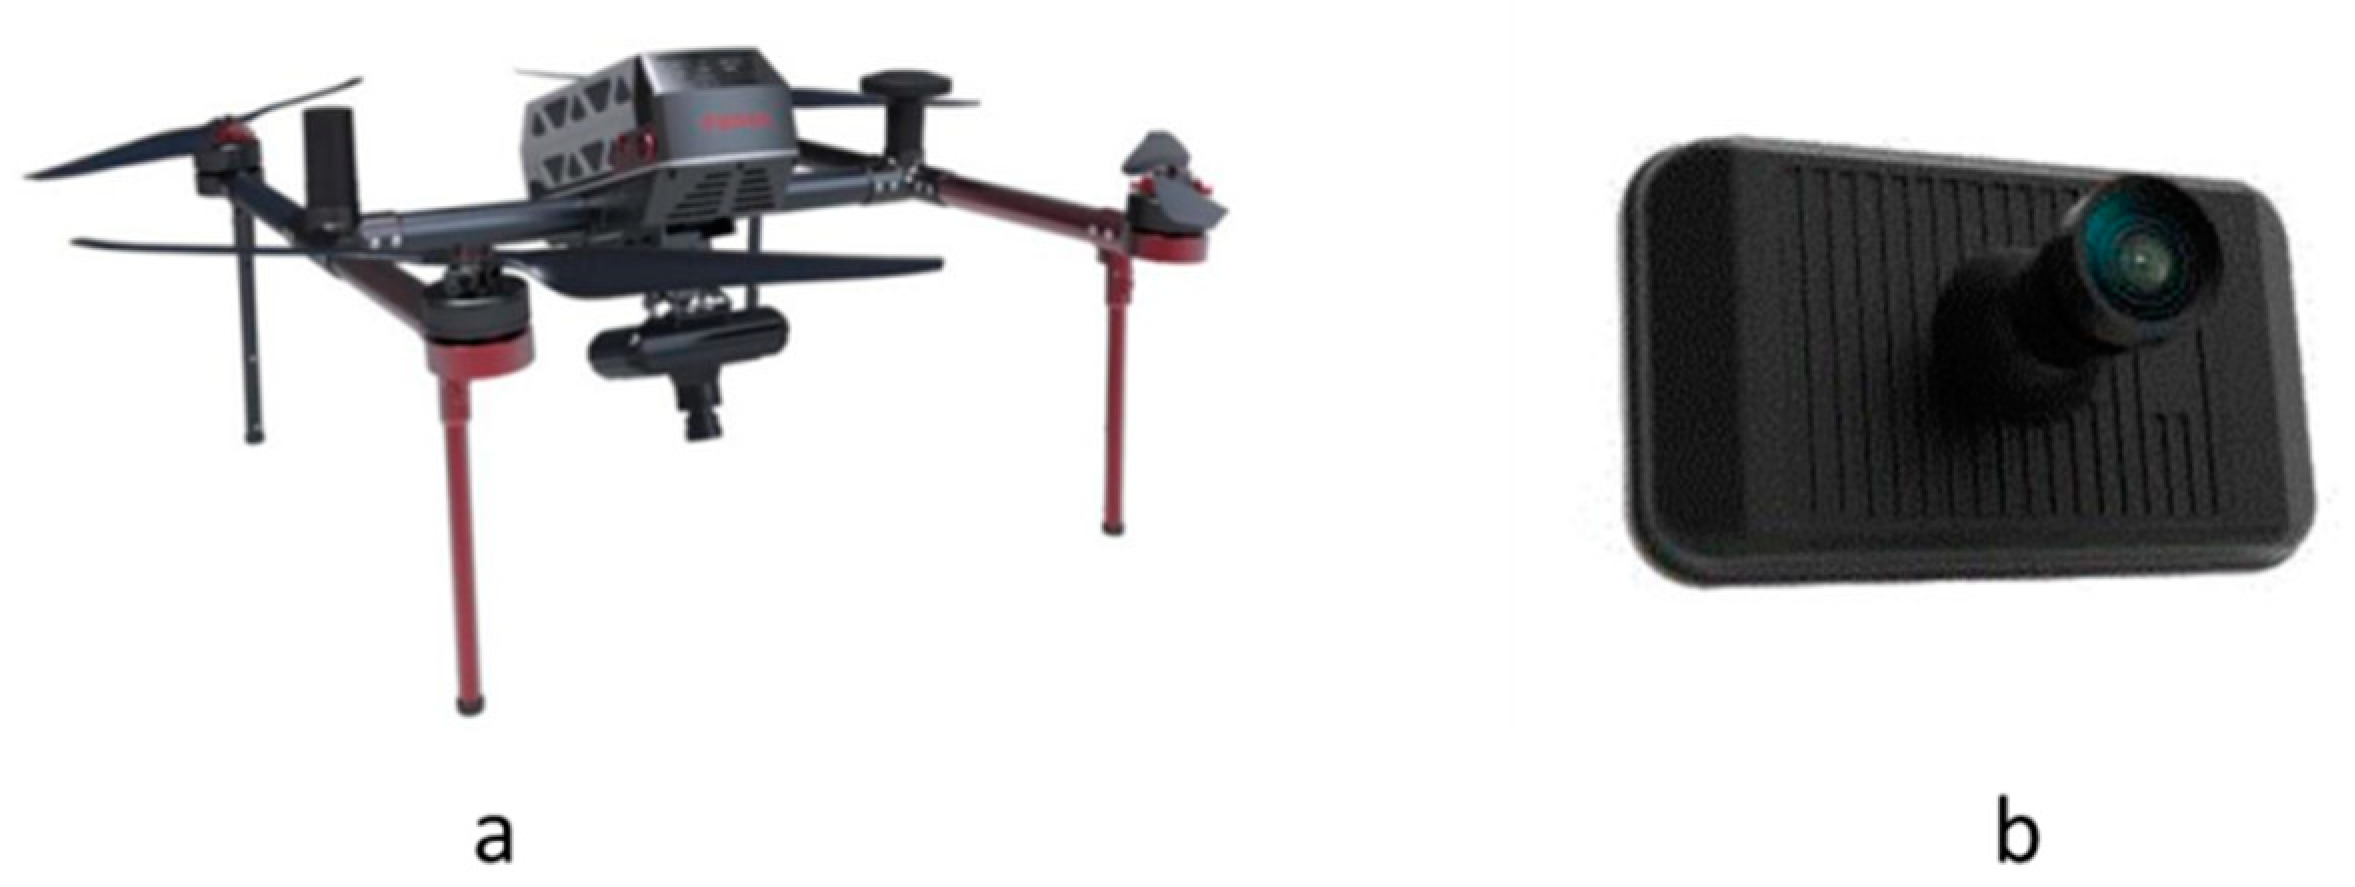
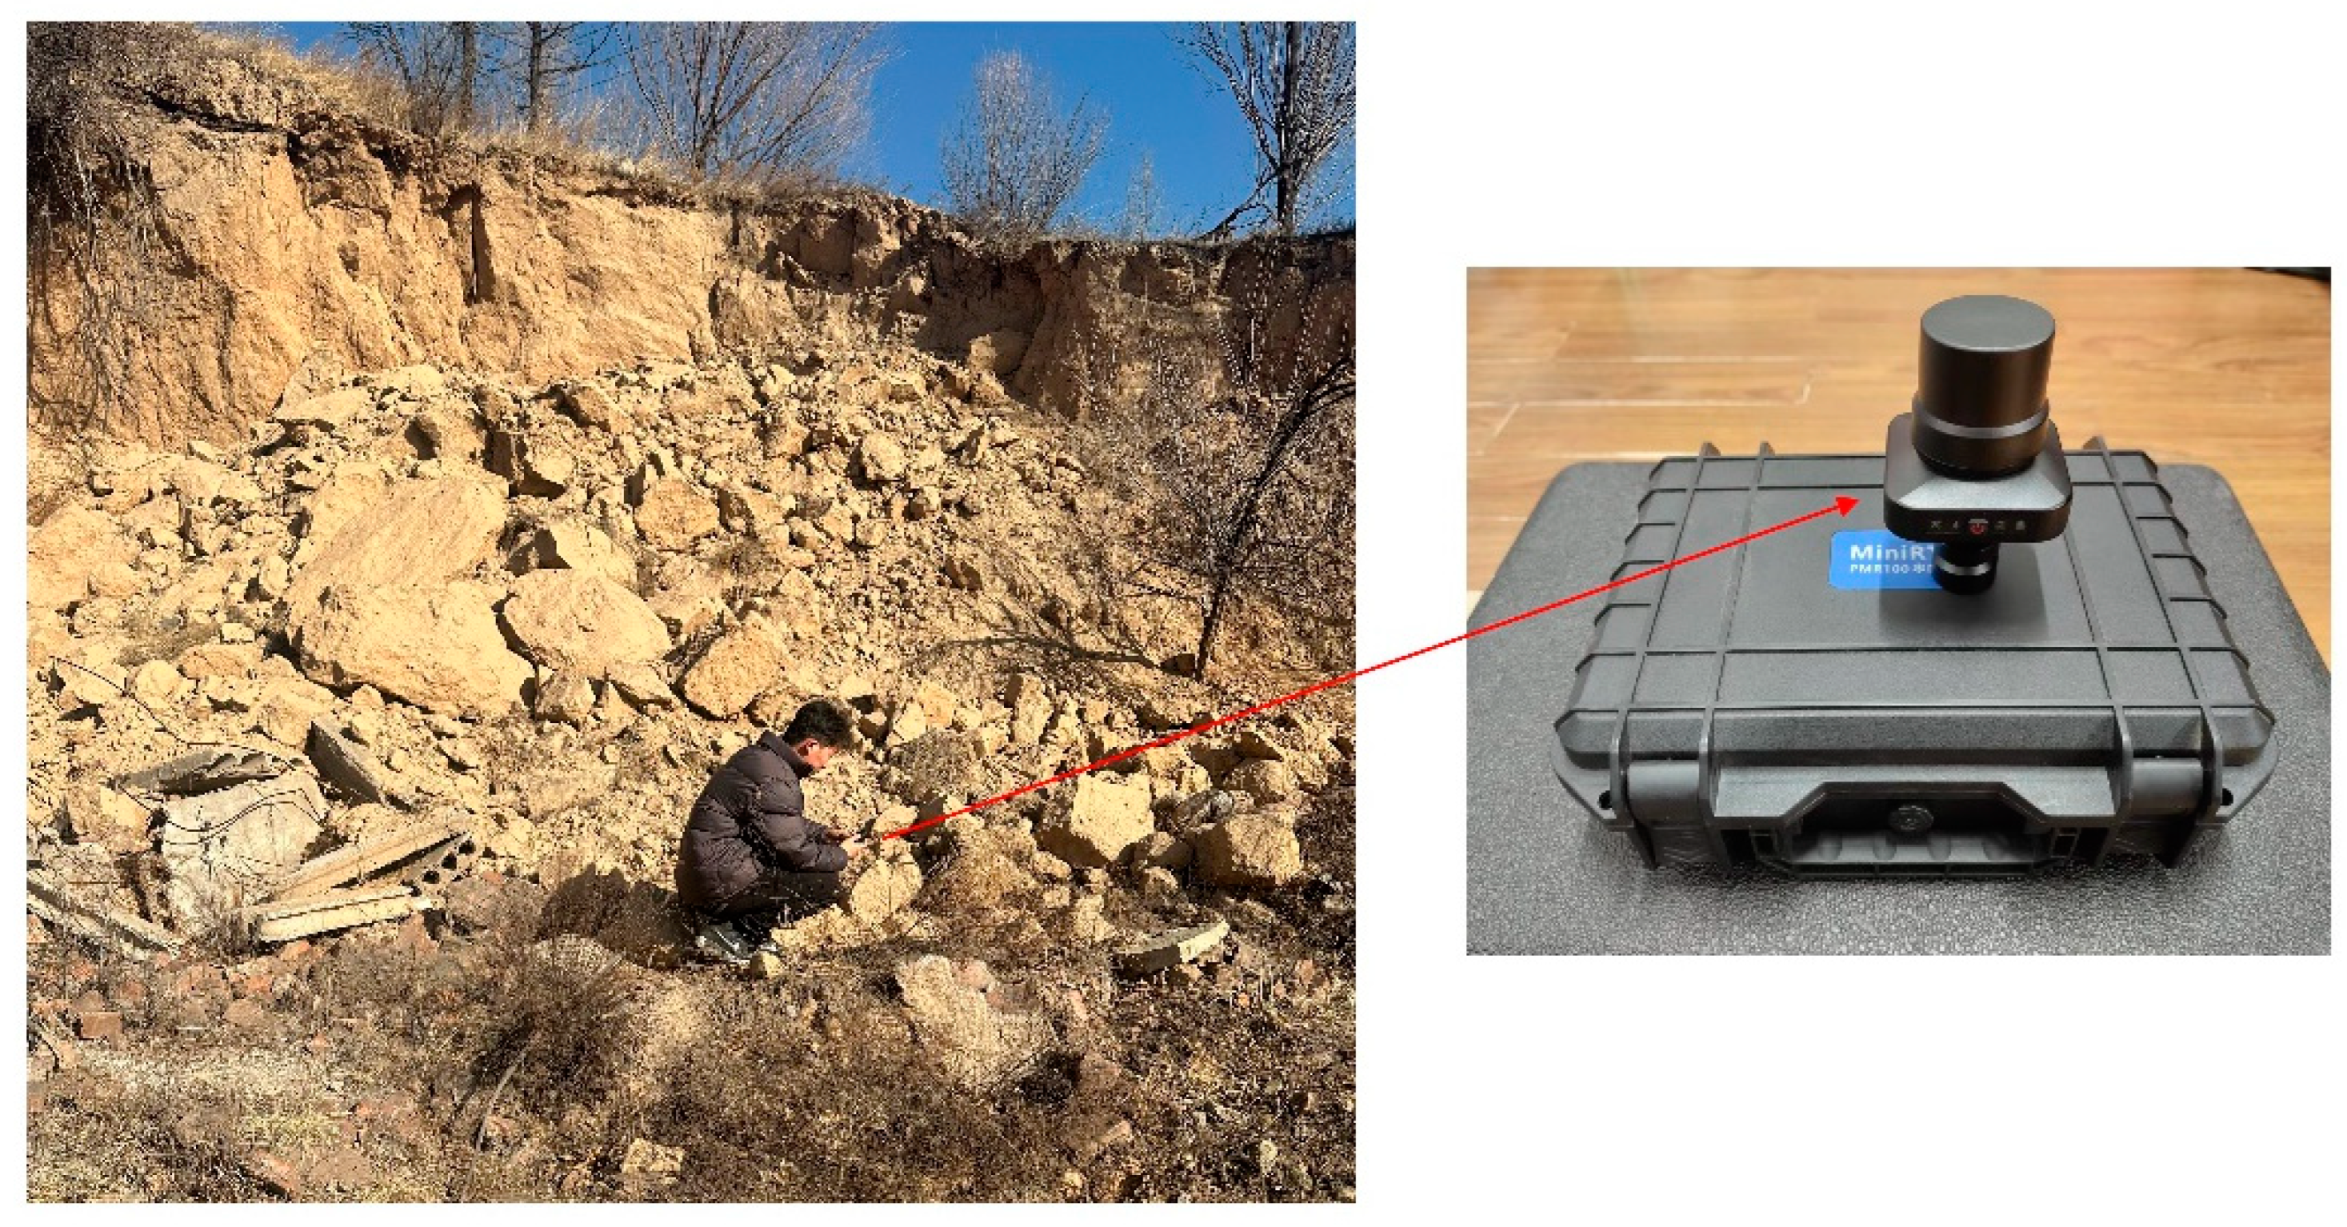
2.2. Data Collection

In this paper, the orthophoto of the region is obtained by UAV. The equipment is FEIMA D2000 UAV (Figure 2a) equipped with a D-CAM2000 visible light module (Figure 2b), which is manufactured by Shenzhen Feima Robotics Co., Ltd., China. The standard take-off weight is 2800 g, and the standard load is 200 g. The detailed parameters of UAV platform and aerial photography module are shown in Table 1. The use of variable height flight mode can ensure the consistency of image resolution. The experimental area was captured through aerial photography following the predetermined flight path, and finally 10 digital orthophoto maps (DOM) of the study area were obtained. Collection time and data format are shown in Table 2.

3. Method

The purpose of our study is to build a deep learning database using UAV images of surface landslides in mining areas. The goal is to enhance the detection speed and accuracy of the model, enabling it to identify and detect landslides from UAV images. By obtaining the geographic location of the landslide, it becomes possible to monitor the changes occurring in the landslide in the mining area. This provides valuable data to support the later ecological restoration of the mining area.

3.1. Construct a Landslide Sample Data Set

The original data for the landslide sample data set consists of UAV images with a spatial resolution of 0.05 m. The accurate location of the landslide is determined by field investigation, as shown in Figure 3. We used Real-time kinematic (RTK) to survey the landslide in the study area and obtained the latitude and longitude coordinates of the landslide area. In the study area, UAV images were collected at different time periods to obtain a Digital Orthophoto Map (DOM). Table 2 lists the specific details of the acquisition date, parameters, and other related information of the UAV image during each DOM generation process. The orthographic image is a three-channel (RGB) data. The landslide samples are screened, and the image of the landslide area is obtained by cutting, and it is scaled to 1280 × 1280 pixels to obtain the landslide samples.
Enhancing the data of landslide samples can augment the diversity of training data, thereby enhancing the generalization capability of the model. Two fundamental approaches for enhancing data include geometric transformation and color transformation techniques.
The heterogeneity of remote sensing image collection arises from variations in both data acquisition time and the diversity of acquisition environments. It is necessary to perform color transformation on the orthophoto image to eliminate the influence of color deviation on the performance of the convolutional neural network model. In addition, geometric transformation techniques can be employed to allow the deep learning model to observe the landslide from various perspectives. As a result, the robustness of the model is enhanced. We use LabelImg to mark the landslide area in the landslide sample in YOLO format.

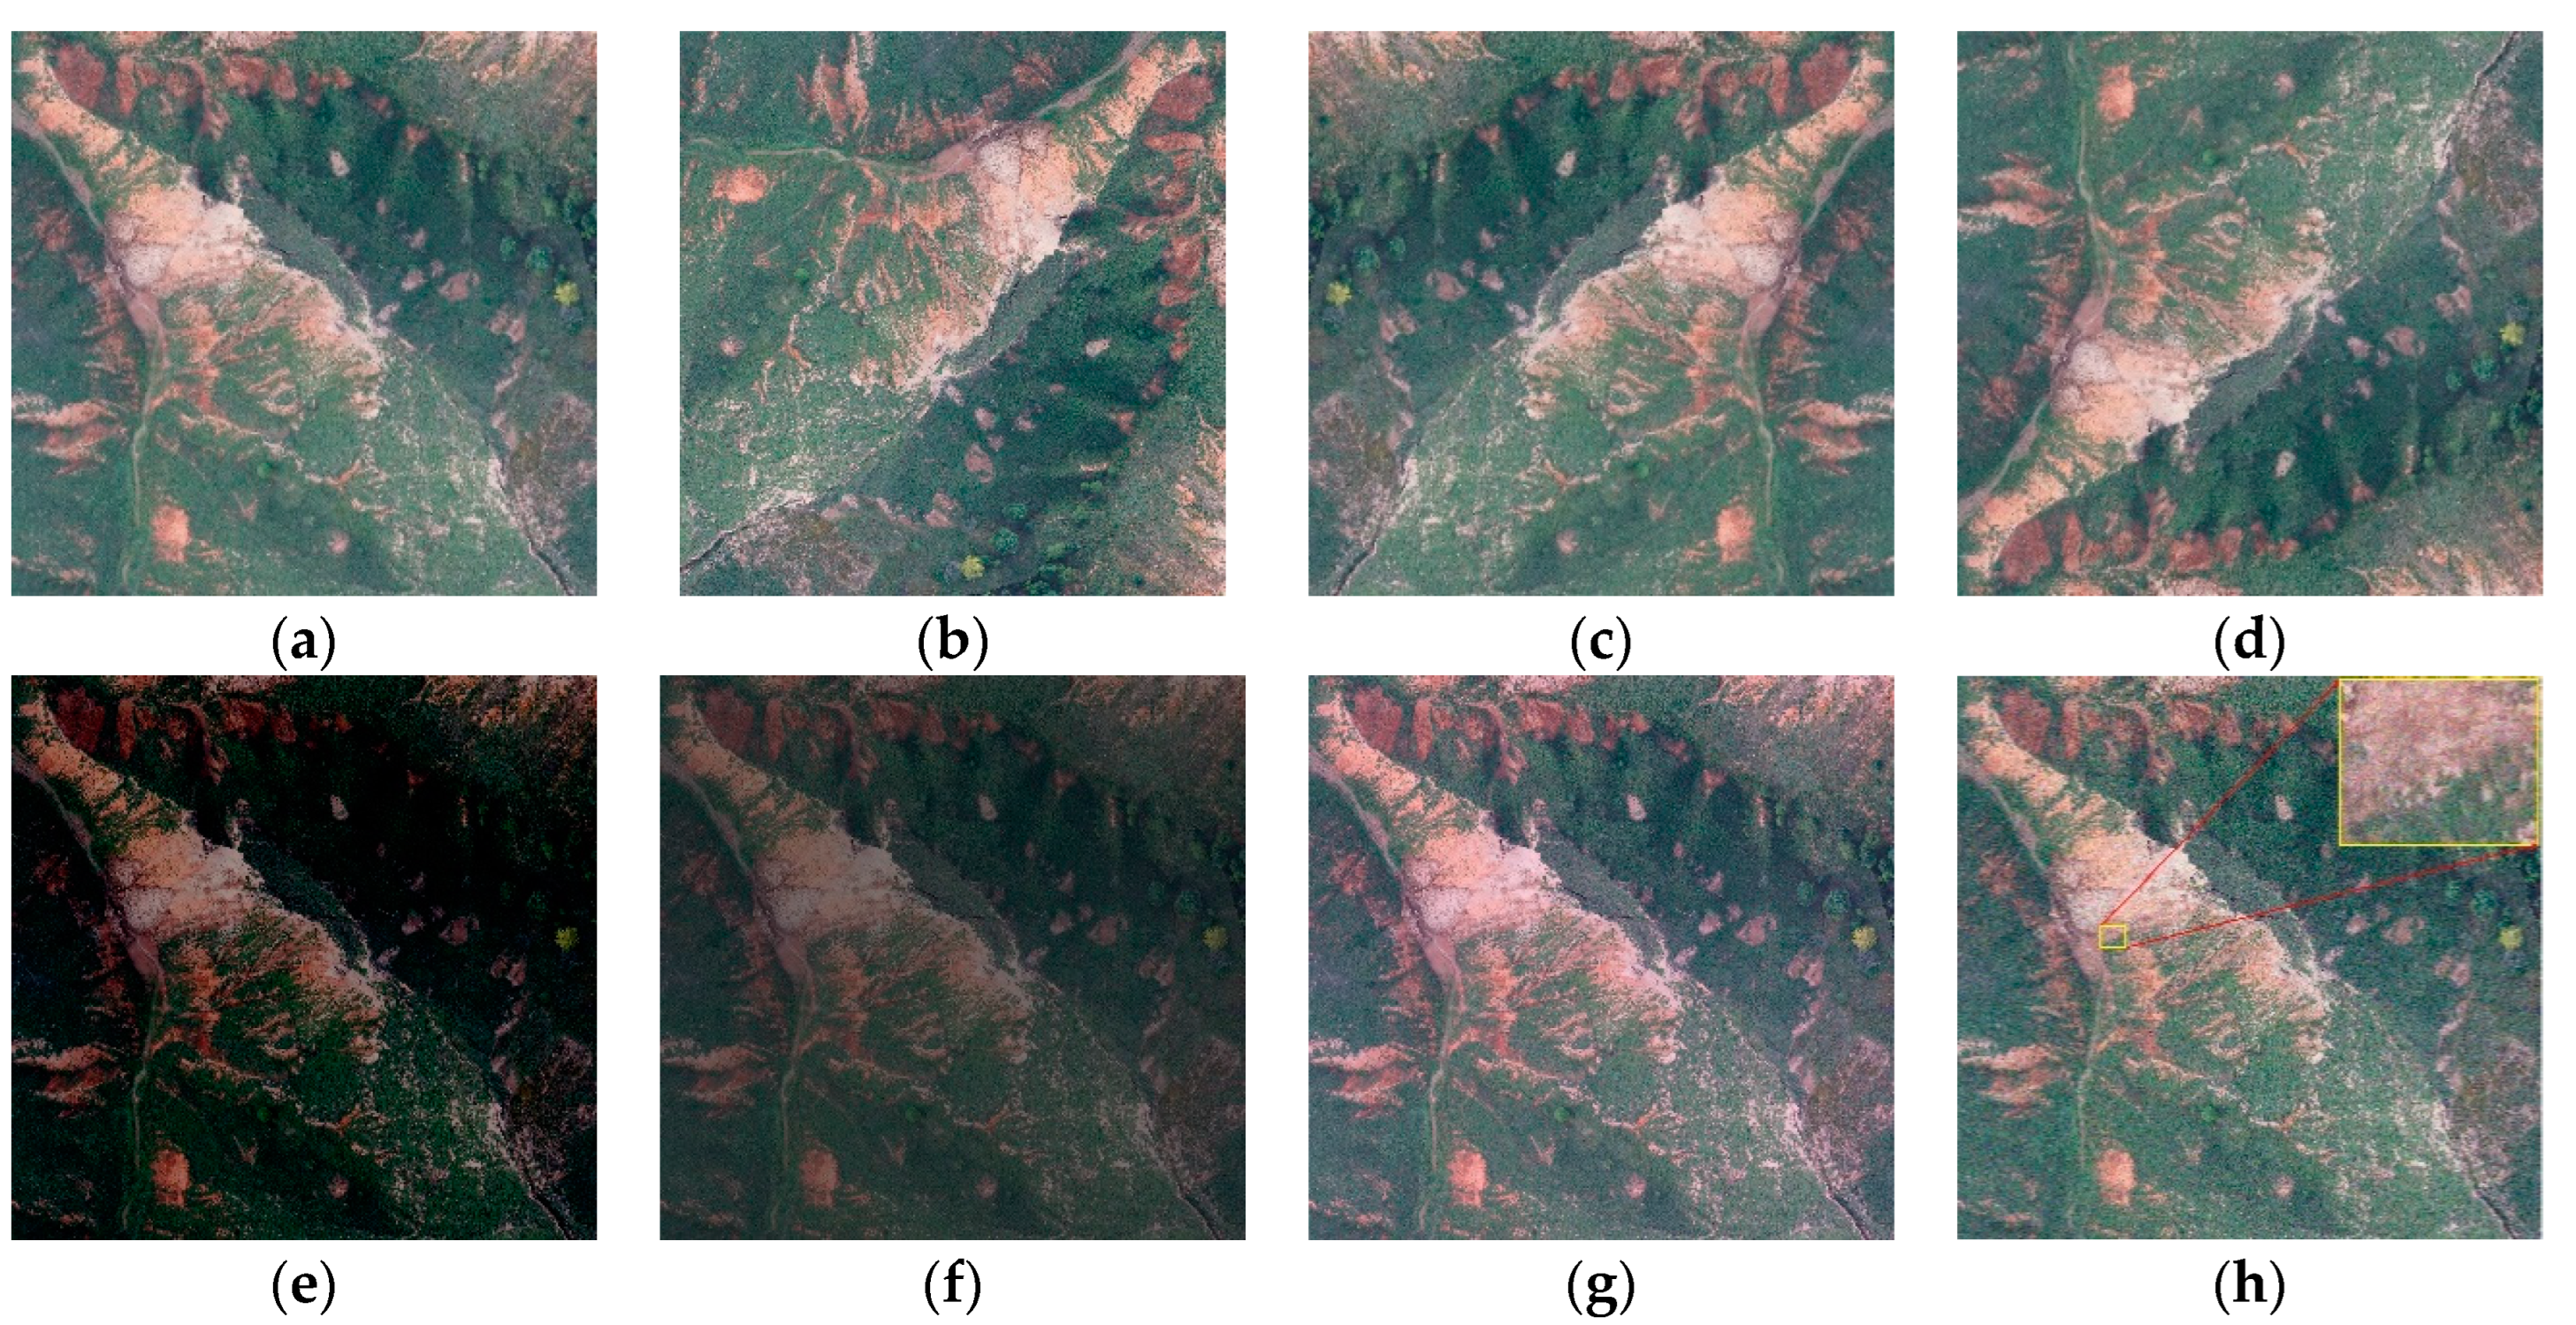
3.1.1. Geometric Transformation

Geometric transformation involves applying various transformations to the geometric information of an image, such as rotation, scaling, translation, and shearing, to generate a new transformed image. These transformations can modify the spatial properties, orientation, and scale of the image, allowing the model to observe the data from different angles and perspectives. The geometric transformations used in this paper include rotation, vertical and horizontal flips. They are shown in Figure 4b–d.
Rotary transformation is a kind of rigid body transformation, which rotates the image with a point as the axis to obtain a new image.
Image reversal is an image processing operation used to change the direction or perspective of the image. The image can be flipped horizontally and vertically. Typically, this procedure is executed by utilizing the central axis of the image as the focal point. The image coordinate system is centered at the origin of the image, where the positive x-axis extends towards the right and the positive y-axis extends downward.
The variables x and y denote the coordinates in the original image, while x′ and y′ represent the coordinates in the inverted image. In this coordinate system, the principle of image flipping is as follows:
Vertical flipping: The image is flipped up and down with the image center as the central axis.
x y 1 = 1 0 0 0 1 h 1 0 0 1 x y 1
After flipping, the new coordinates of each pixel are (x′, y′), where the calculation formula of x′ is x = x , and the calculation formula of y′ is y = h 1 y . The variable h represents the vertical dimension of the image, which quantifies the number of rows in the image.
Horizontal flipping: The image is flipped left and right with the image center as the central axis.
x y 1 = 1 0 w 1 0 1 0 0 0 1 x y 1
After flipping, the new coordinate of each pixel is (x′, y′), where the calculation formula of x′ is x = w 1 x , and the calculation formula of y′ is y = y . The variable w represents the horizontal dimension of the image, which measures the width of the image in terms of columns or pixels.

3.1.2. Color Transformation

Color transformation is to change the content of the image. This method used in this paper is to change the brightness, contrast and saturation of the image, and add Gaussian noise. As shown in Figure 4e–h.
Brightness adjustment refers to the operation of changing the brightness of the image. The brightness adjustment operation can increase the recognition ability of the model for objects under different illumination conditions.
Contrast adjustment is an operation to change the image contrast. The contrast adjustment operation can increase the recognition ability for different object texture and detail features.
Saturation adjustment is usually the operation of changing image contrast. Saturation denotes the intensity or luminosity of the color, and its value spans from 0 to 100%. When the saturation is 0, the color shows a gray effect; when the saturation is 100%, the color is the purest and most saturated.
Gaussian noise refers to a kind of noise that exhibits a probability density function following a Gaussian distribution, also known as a normal distribution. This noise is present at every point and possesses a deterministic location, but the amplitude of the noise is random.

3.2. Landslide Detection Method in Mining Area
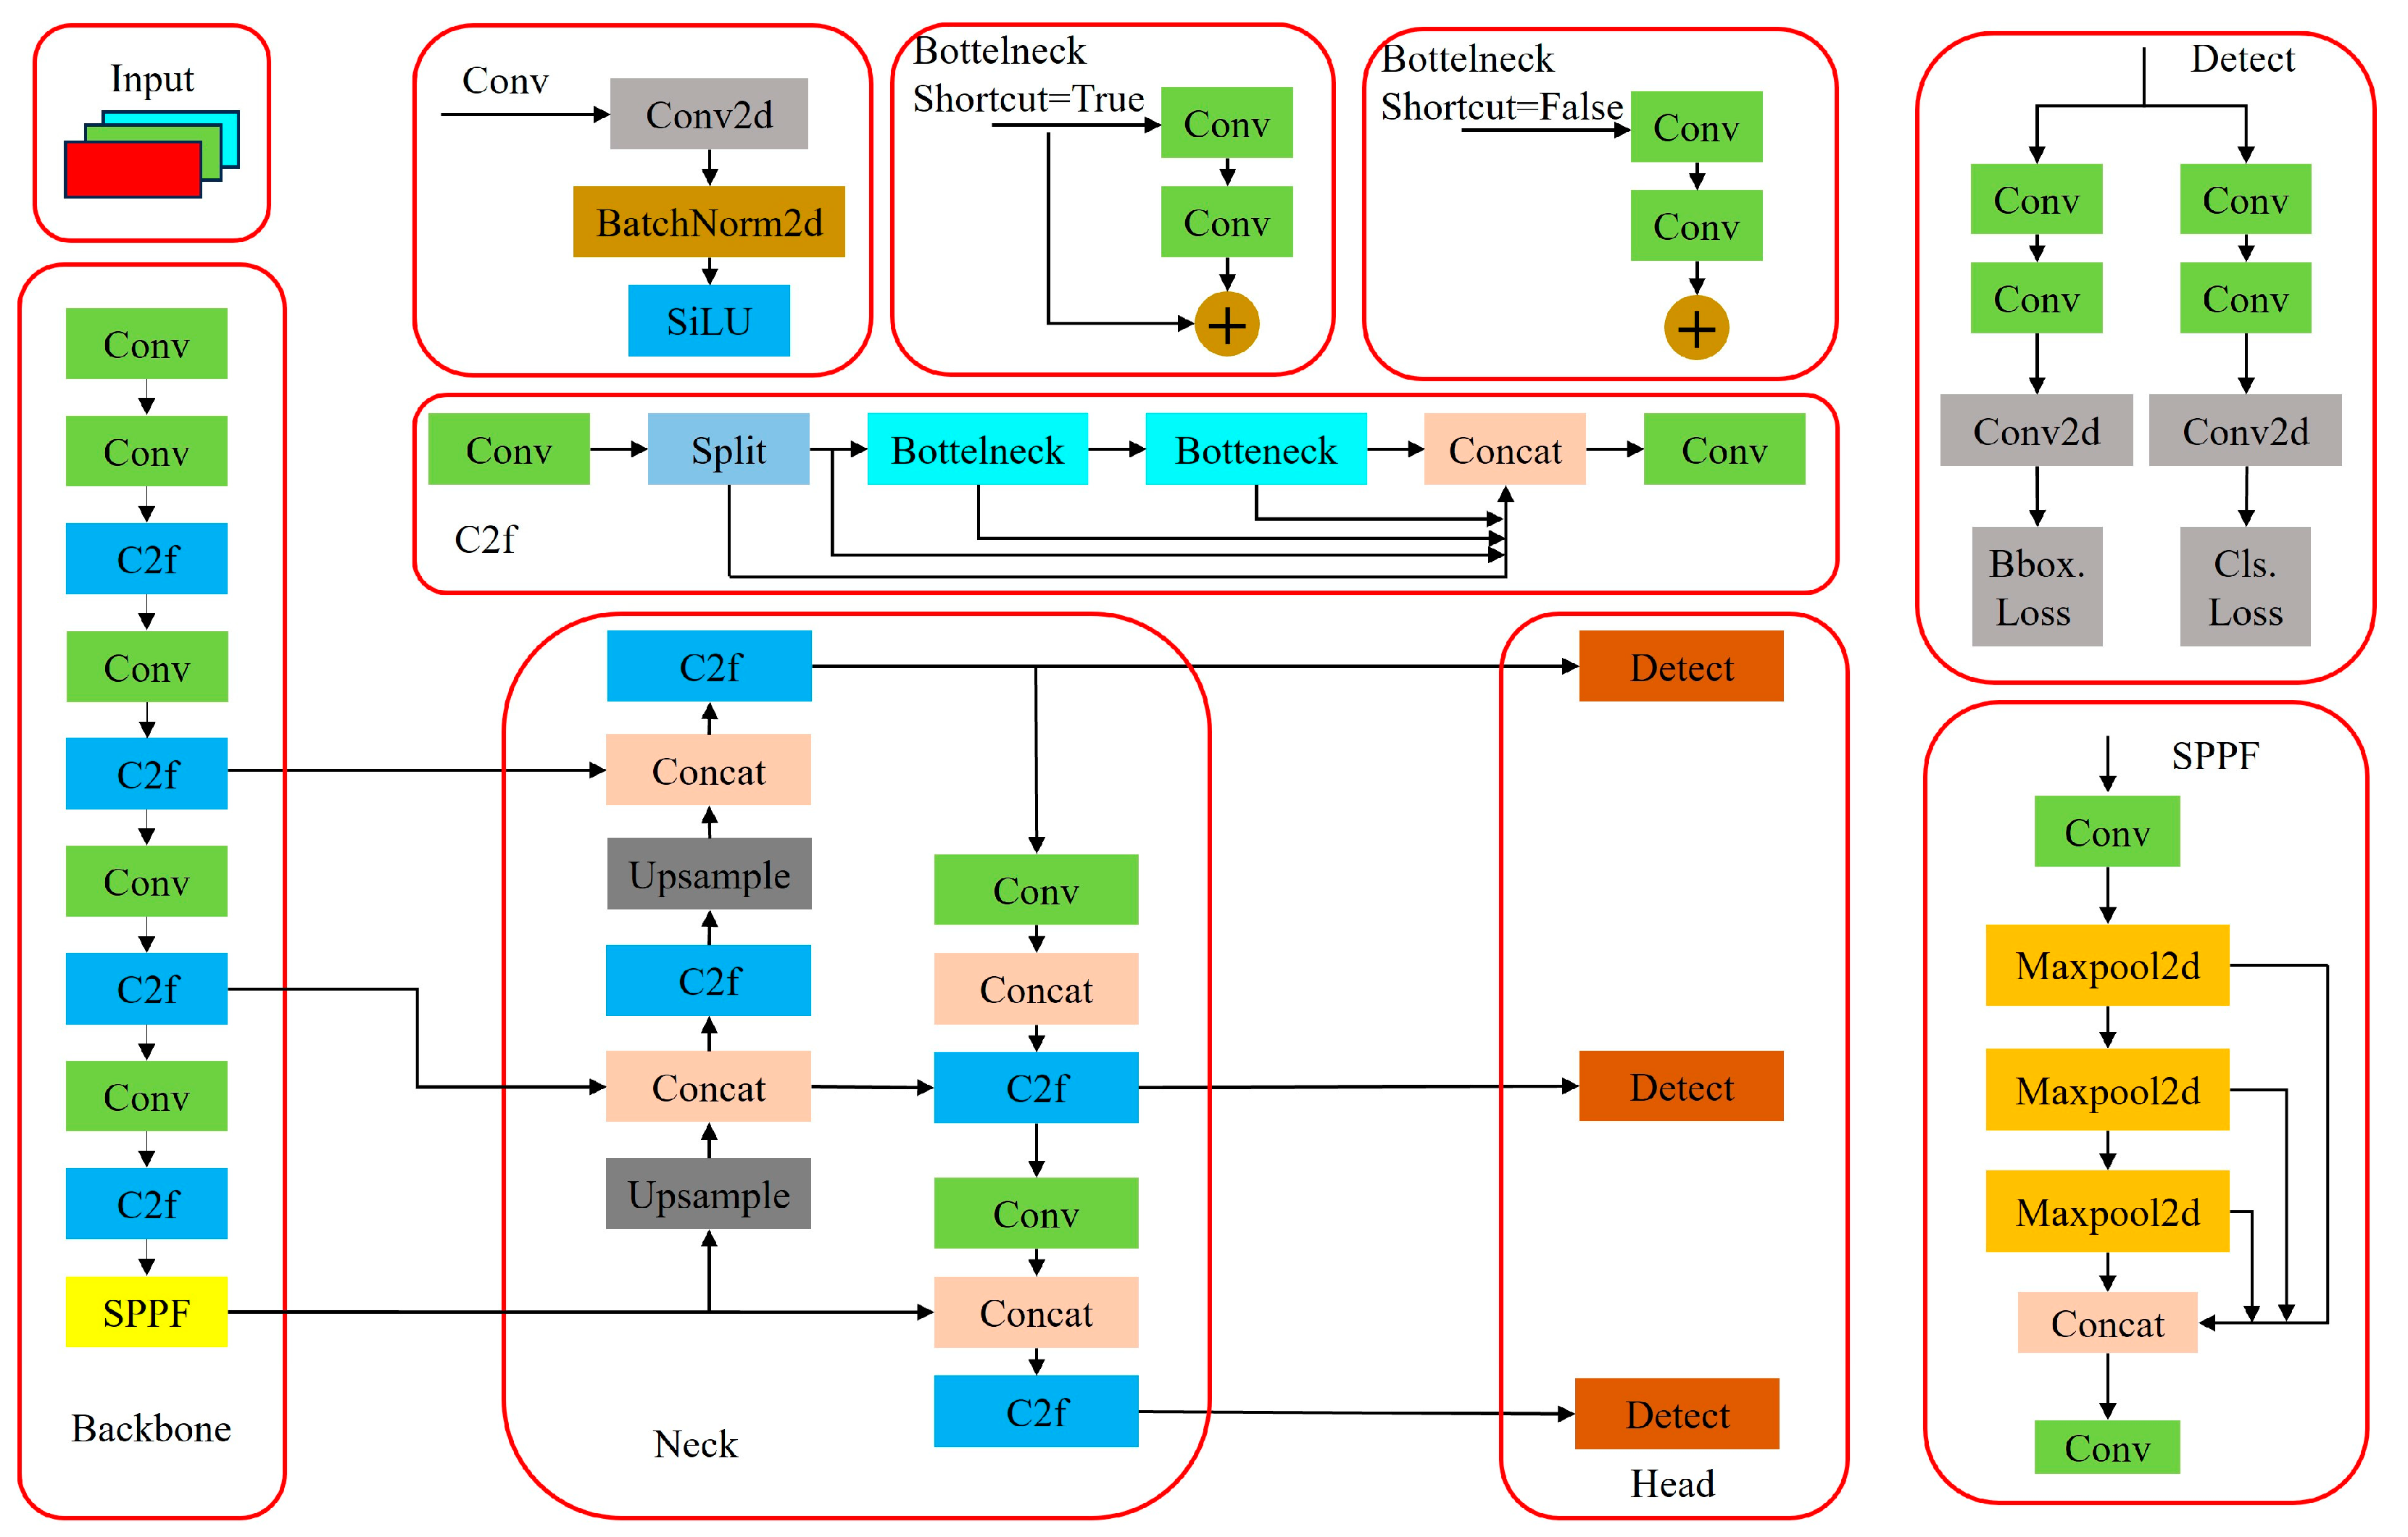
3.2.1. YOLOv8 Model

The surface damage of the mining area is more serious, and many false detections and missed detections are prone to occur when identifying landslides. At the same time, the small scale and complex background of a single landslide also increase the difficulty of detection. These problems make it impossible to accurately identify and detect mining landslides in UAV images. Therefore, it is necessary to select a more effective detection model to detect mining landslides. YOLO (You Only Look Once) is a target detection model that can directly obtain the category probability and position coordinates of different targets by only one convolutional neural network, which can better distinguish the target area and background area. The YOLO series generally includes YOLO, YOLO9000, YOLOv3, YOLOv4, YOLOv5, YOLOv6, YOLOv7 and YOLOv8. In this study, the YOLOv8 target detection model is used, which can be roughly divided into four parts: input, backbone, neck and head. The network structure is showed in Figure 5.
YOLOv8 has more advantages than previous versions:
  • Compared with YOLOv5 and YOLOv7 algorithms, YOLOv8 has greatly improved training time and detection accuracy, and the weight file of the model is only 6 MB, which can be deployed to any embedded device. It can meet the needs of real-time detection with its fast and efficient performance.
  • Since the YOLOv8 algorithm is an inherited version of YOLOv5, it provides models of different scales such as n, s, m, l, and x to meet the needs of different scenarios. While the accuracy is greatly improved, it can be smoothly trained and installed on various hardware platforms.
  • On the input side, the YOLOv8 uses Mosaic data enhancement [14], adaptive anchor box calculation [15] and other methods. The Mosaic data enhancement technique involves splicing images using random scaling, random cropping, and random arrangement to augment the detection data set. Through differential computation, reverse updating, and other operations, the calculation of adaptive anchor box enables the determination of optimal anchor frame values.
  • At the output end, the YOLOv8 uses the decoupling head to replace the previous coupling head, decouples the classification and regression into two independent branches, and makes the task more focused through decoupling, which solves the problem of inaccurate positioning and classification errors in complex backgrounds. At the same time, the YOLOv8 also borrows the idea of DFL [16] and uses the Anchor-free target detection method [17] to make the network focus on the adjacent points of the target position faster, so that the prediction box is closer to the actual bounding box area.

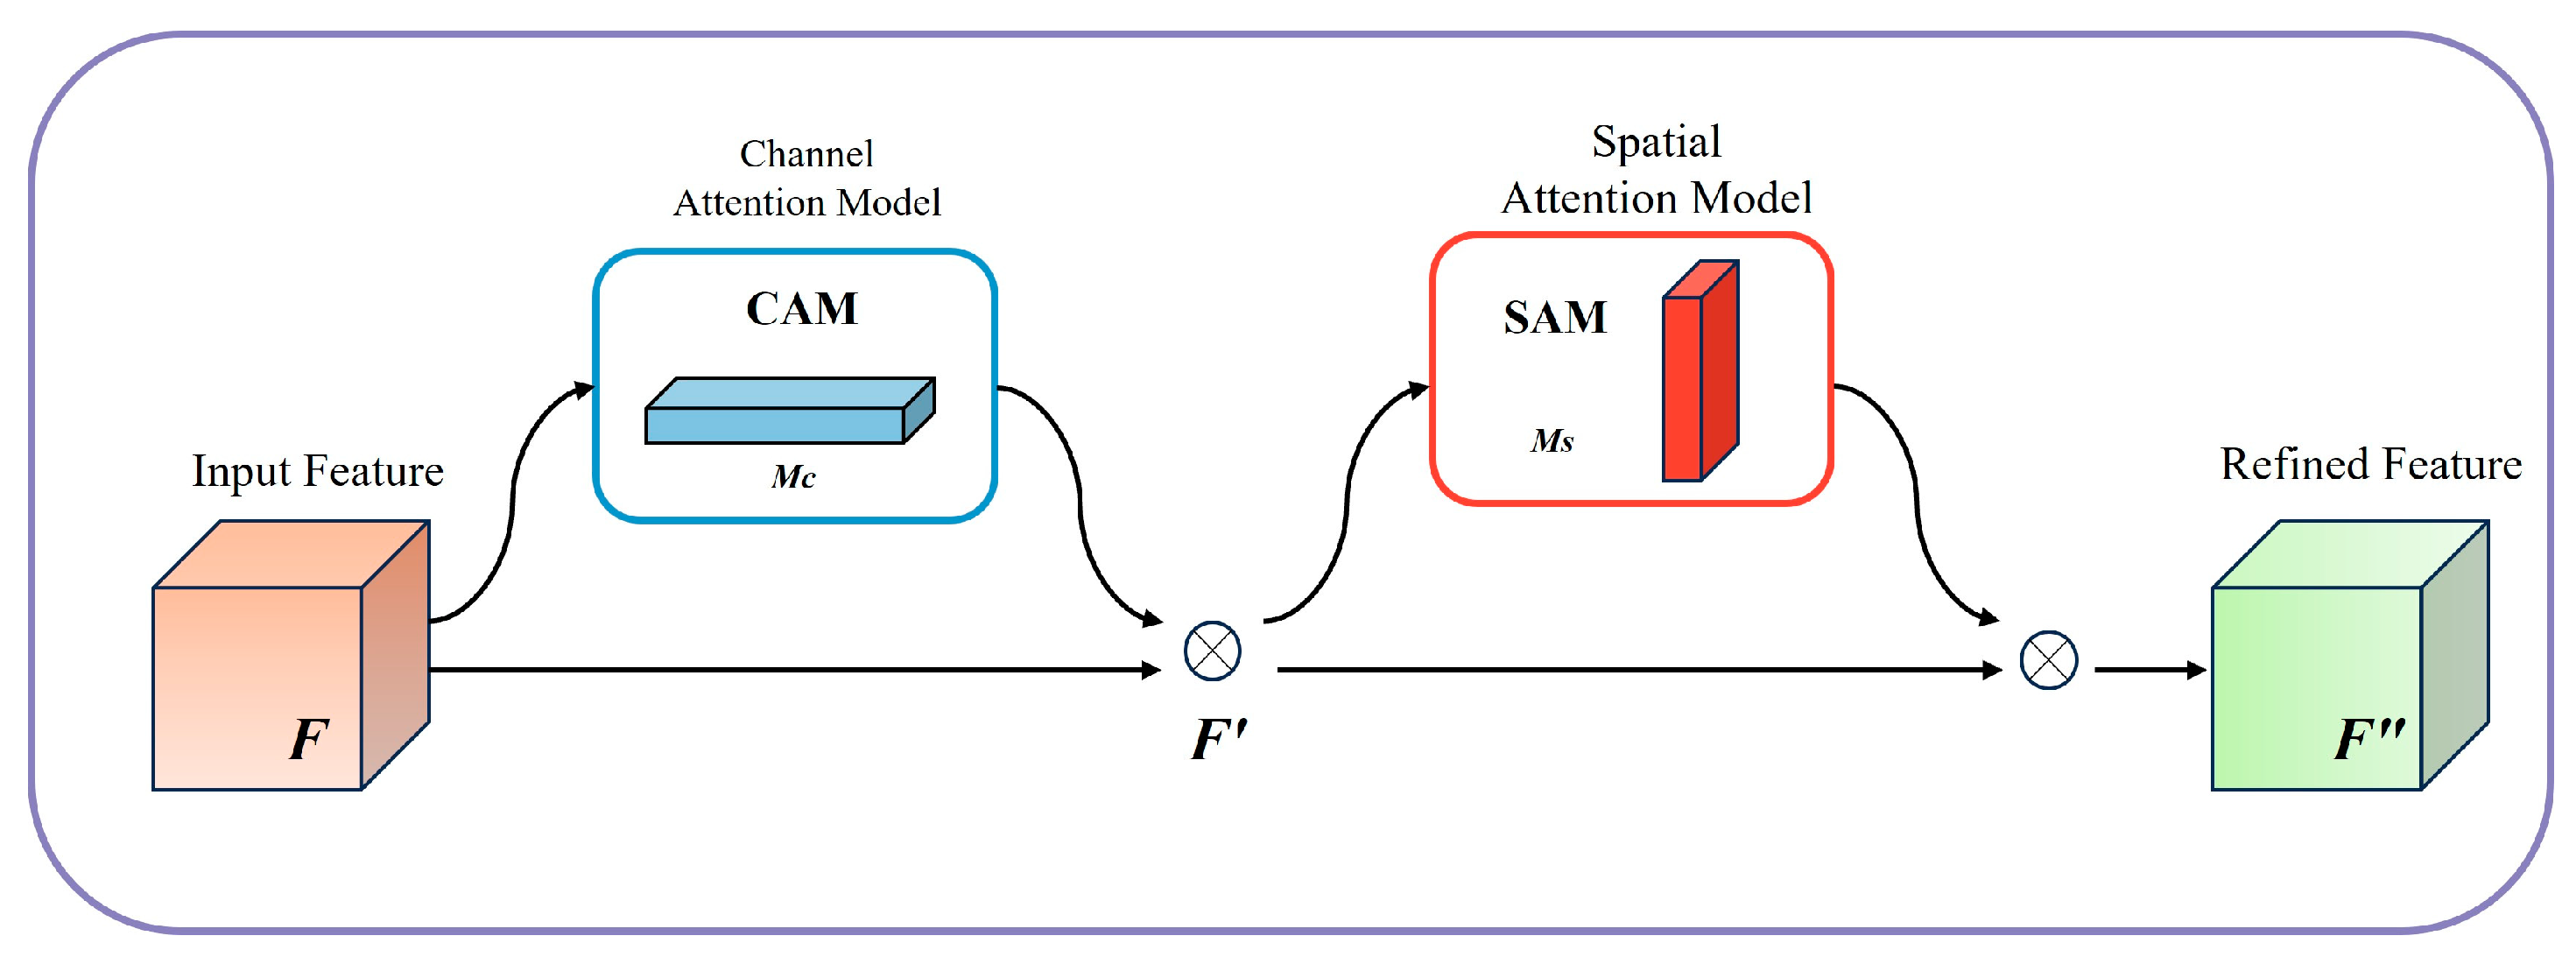
3.2.2. Embedding Attention Mechanism

For the past few years, the attention mechanism has gained significant popularity and has been extensively utilized in various domains, such as image processing [18,19], speech recognition [20], and language processing [21,22], where it has shown excellent results. It can allocate distinct weights to various channels or regions within the space. This facilitates the model’s ability to concentrate on extracting crucial information. For the specific task of mining landslide recognition, we hope to enable the network to focus on the landslide area in both channel and space without increasing the complexity of the model. Therefore, we choose the Convolutional Block Attention Module (CBAM), whose structure is shown in Figure 6.
(1)
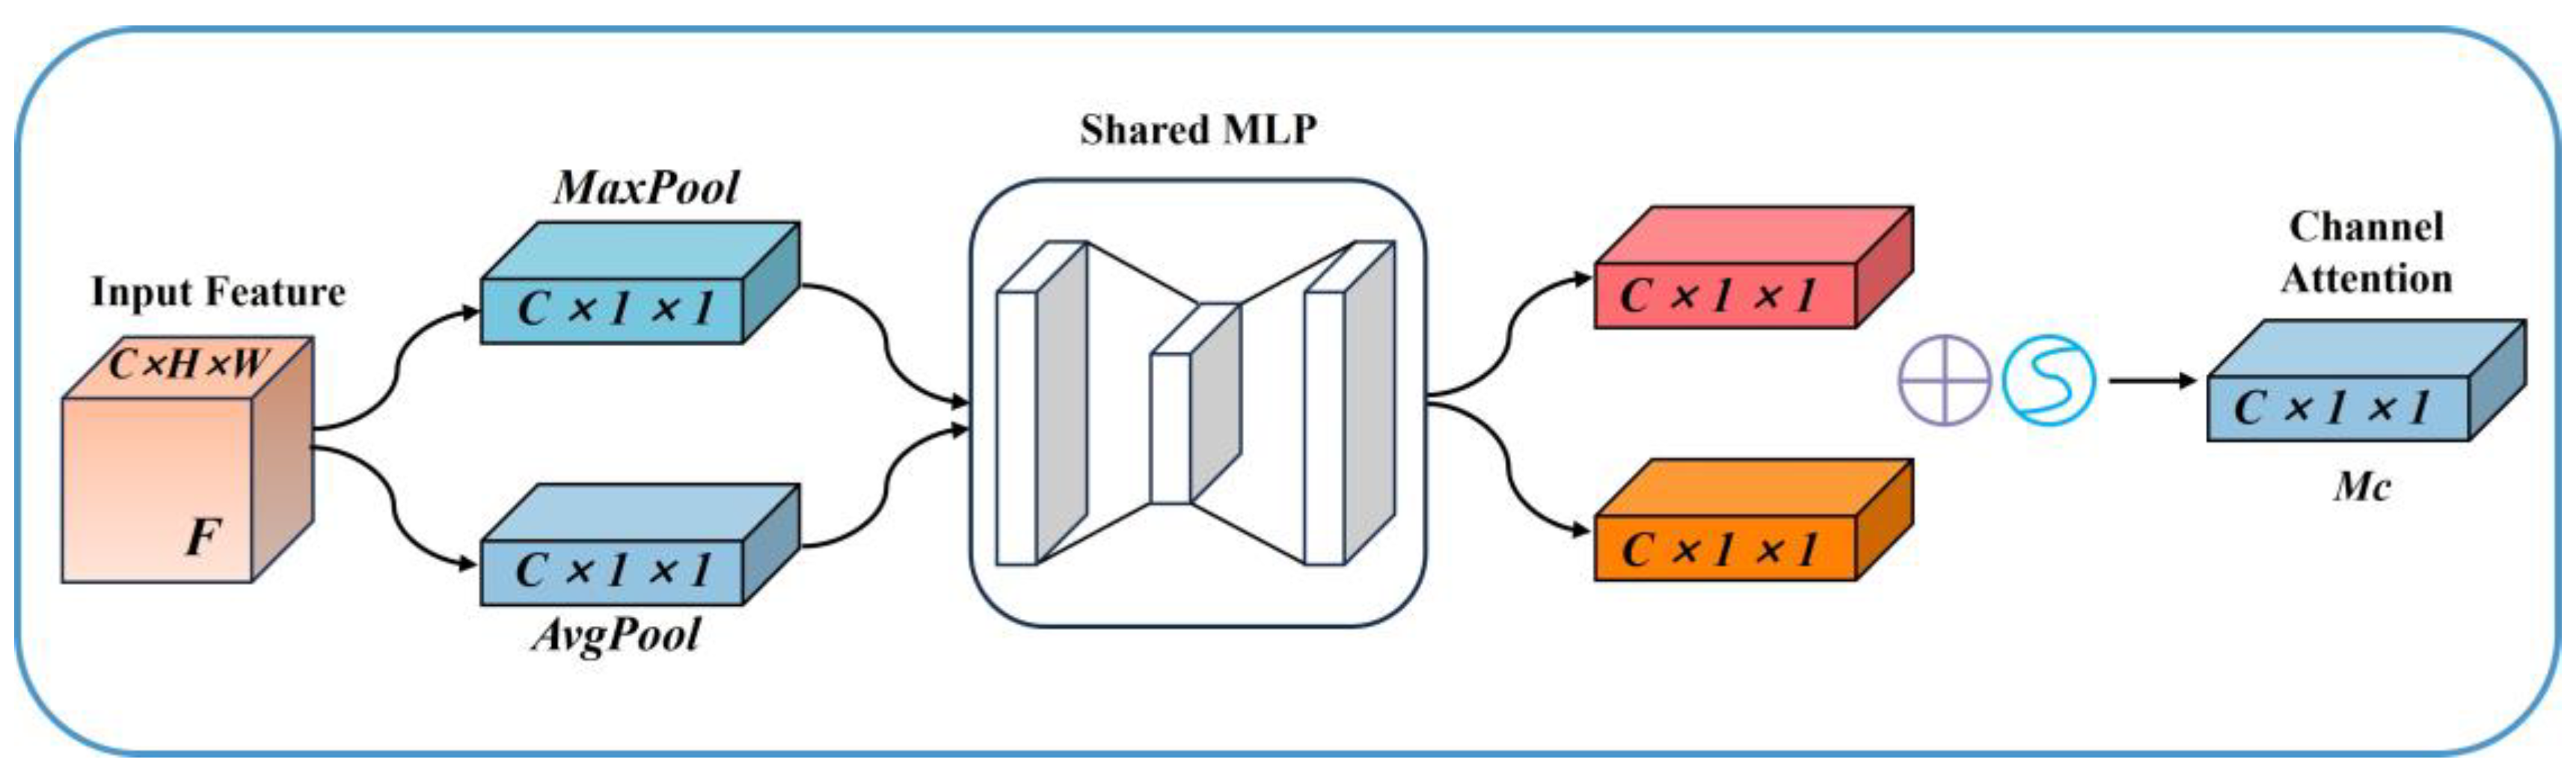
Channel attention module (CAM)
This module can direct its focus towards significant information within an image that assists in landslide identification within the mining area. This module effectively compresses the spatial dimensions H and W while maintaining the unaltered channel dimension C. The calculation process of the CAM is illustrated in Figure 7.
F is input into the module, and F passes through the MaxPool (maximum pooling) layers and the AvgPool (average pooling) layers in parallel to obtain the maximum pooling feature F max c and the average pooling feature F a v g c . The feature is propagated forward to the shared Multilayer Perceptron (MLP). After MLP, the features are added at the element-wise level, and the nonlinear transformation is performed by the Sigmoid function to obtain the channel attention feature Mc, which is shown in the Equation (3):
M c ( F ) = σ ( M L P ( A v g P o o l ( F ) ) + M L P ( M a x P o o l ( F ) ) ) = σ ( W 1 ( W 0 ( F a v g c ) ) + W 1 ( W 0 ( F max c ) ) )
where F a v g c and F max c represent the average pooling feature and the maximum pooling feature, and σ represents the sigmoid function.
(2)
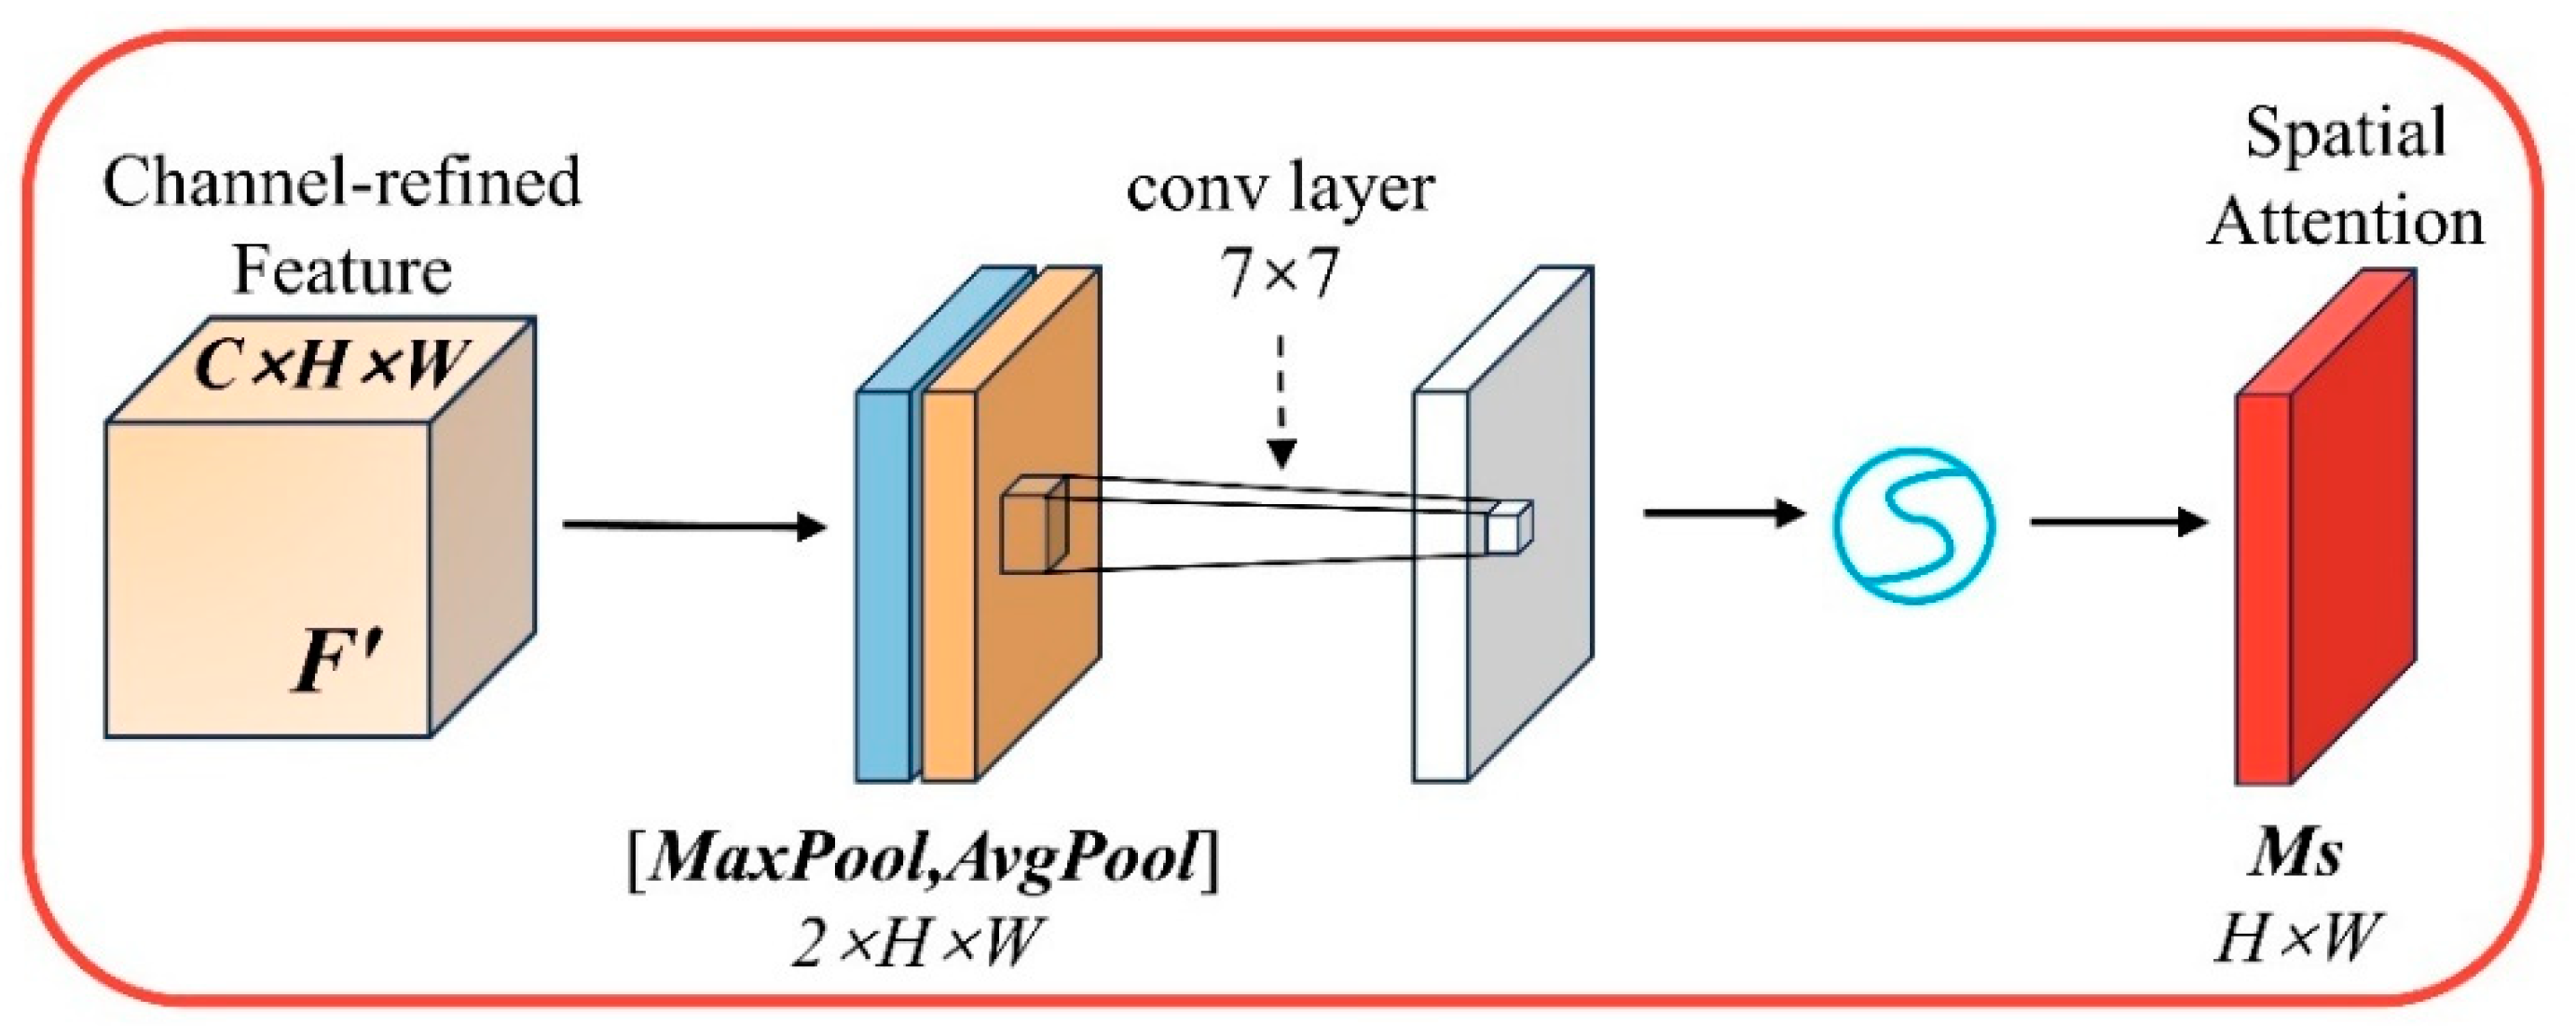
Spatial Attention Module (SAM)
By using the spatial correlation of features, this module is introduced to pay attention to the location information of landslides in the picture, and the channel attention features are effectively supplemented. Maintain the spatial dimensions H and W unchanged, and compress the channel dimension C.
In Figure 8, the F′ passes through MaxPool and AvgPool along the channel direction to acquire the cross-channel spatial feature maps F max s and F a v g s .
Channel splicing and 7 × 7 convolution are performed on F max s and F a v g s , and they are transformed into single-channel feature maps. Nonlinear transformation is performed by sigmoid function to obtain spatial attention feature Ms, as shown in Equation (4):
M s ( F ) = σ ( f 7 × 7 ( [ A v g P o o l ( F ) ; M a x P o o l ( F ) ] ) ) = σ ( f 7 × 7 ( [ F a v g s ; F max s ] ) )
where σ is the sigmoid function, and f 7 × 7 is the convolution operation with a convolution kernel of 7 × 7.

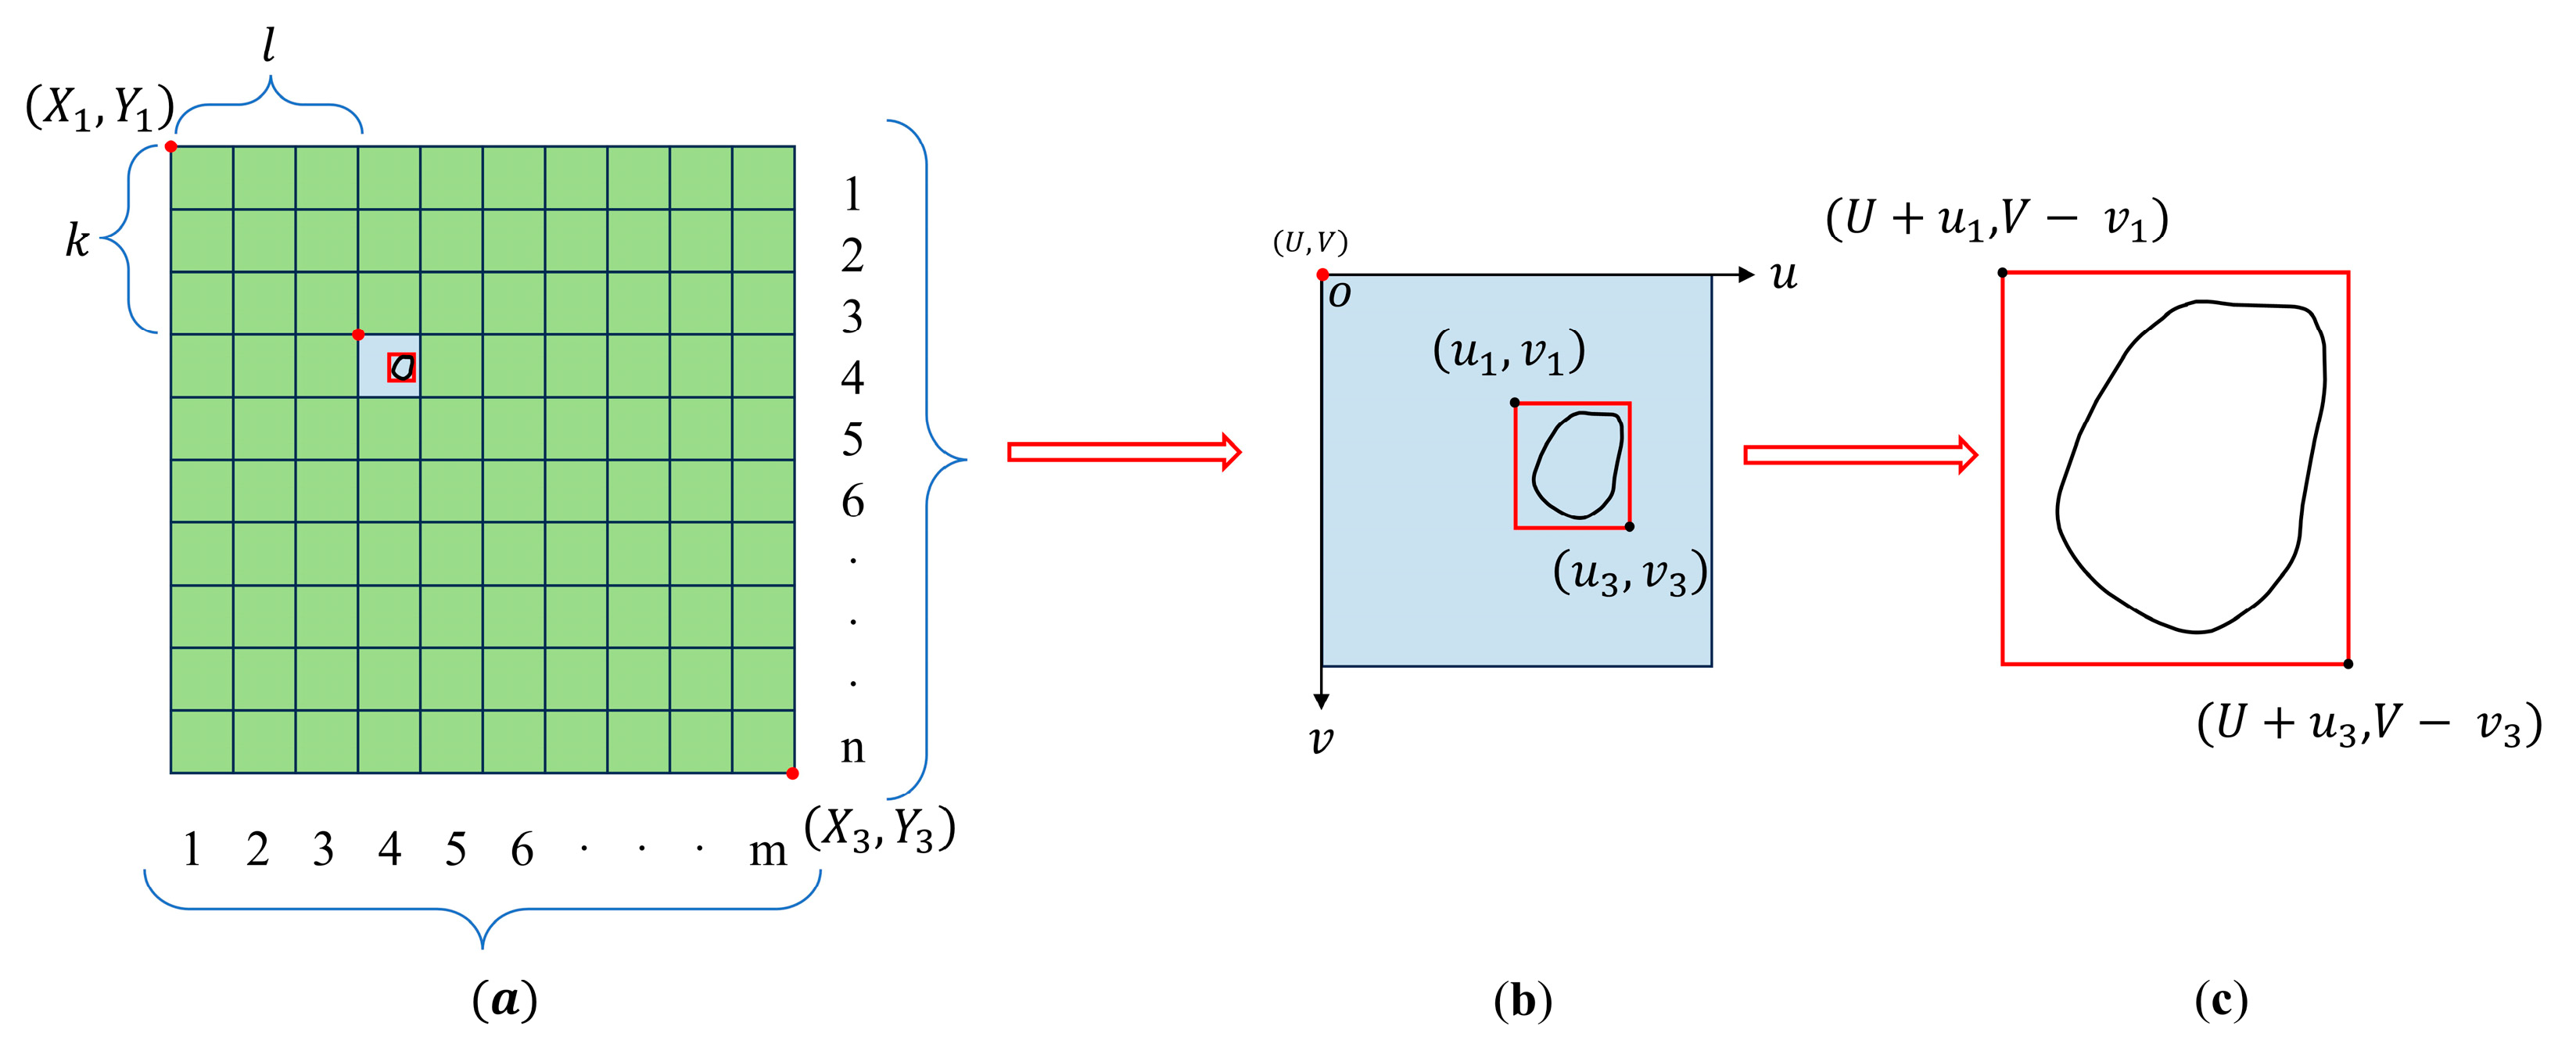
3.3. Landslide Identification Results Positioning Method

In this study, the problem of excessive image range in the study area was solved by using deep learning algorithm to automatically identify landslides. In order to input the image into the network, it has to be cropped. However, the cropped image will result in the loss of image coordinate information, which in turn affects the geographical location identification and positioning of the landslide.
To address this issue, the current investigation puts forth a novel methodology to attain the geolocation of landslides during the deep learning process. In this method, the coordinate system used in the original image is the geographic coordinate system, and the appropriate projection coordinate system is selected according to the different study areas. The purpose of this is to be able to accurately obtain the location information of the landslide.
First of all, through the image segmentation technology, the acquired image is cut. The cropped image is divided into n rows and m columns, as shown in Figure 9a. Then, the deep learning algorithm is used to identify the landslide of each cropped image. Not only to identify the landslide itself, the algorithm also stores the geographic coordinate information of each clipped image.
In order to locate the landslide geographically, we will use the known geographic reference points and pixel coordinate system for calibration. By matching with the reference points in the image, we can restore the geographic coordinate information of the cropped image. By employing this technique, we can obtain the accurate position of the landslide in the geographical space, so as to realize the geographical location identification and positioning of the landslide.
X = l ( X 3 X 1 ) m Y = k ( Y 3 Y 1 ) n
where X and Y represent the upper left corner coordinates of the required image, and k and l represent the number of rows and columns of the required image in the entire cropped image. According to this formula, we can get the coordinates of the corner of the cropped image.
The image through the network will lose the projection coordinate information, and the identified target position is its coordinate in the pixel coordinate system. The coordinates ( u 1 , v 1 ) represent the upper left corner of the detection box, while the coordinates ( u 3 , v 3 ) represent the lower right corner. These coordinates define the boundaries of the detection box, allowing for precise localization of the landslide within the image. As shown in Figure 9b.
U = X 1 + l ( X 3 X 1 ) m V = Y 1 + k ( Y 3 Y 1 ) n
where U and V represent the real coordinates of the origin in the pixel coordinate system. The coordinate transformation of the origin of the pixel coordinate system is carried out, and the projection coordinates of the origin of the pixel coordinate are obtained.
Through the Formula (7), the coordinates of the detection box in the projection coordinate system can be obtained in Figure 9c.
x = U + u y = V v
where x and y represent the projection coordinates, u and v represent the coordinates of the detection box in the pixel coordinate system.

4. Results and Analysis

4.1. Experiment Environment

This experiment is carried out under the 64-bit Windows 10 operating system. The CPU is Intel(R) Xeon(R) W-2245, and the operating frequency is 3.90 GHz. The GPU is NVIDIA Quadro P2200, the host memory is 128 GB, and the programming language is Python 3.9. We train the model based on the deep learning framework Pytorch 1.13.
The pre-training weight of the model is YOLOv8n.pt. In the training stage, the SGD function is used to optimize the parameters, the learning rate (lr0) is set to 0.01, and the batch size is set to 8. The training of the model consists of 200 epochs.

4.2. Model Accuracy Assessment

In order to evaluate the performance of the improved model, the P (precision), R (recall), mean average precision (mAP) and F1 score are considered as evaluation indicators. In this study, the precision refers to the proportion of the number of samples that the model correctly predicts as a landslide to the number of samples that are predicted as a landslide. That is, in all the samples predicted as positive samples, the proportion of correctly predicted samples.
The recall rate refers to the proportion of samples that are correctly predicted as landslides in all samples that are actually landslide areas. The F1 score is a metric that takes into account both precision and recall, which can be calculated as the harmonic mean of precision and recall. This score provides a comprehensive evaluation of the model’s performance. The high F1 score indicates that the model achieves a good balance when considering both precision and recall.
P = T P T P + F P
R = T P T P + F N
F 1 = 2 P R P + R
where TP is the correct number of predicted landslides, FP is the non-landslide area judged as landslide, and FN is the landslide area predicted as non-landslide.
In the mAP (mean average precision), m represents the average. [email protected] refers to the average accuracy of this type of sample when the threshold of the IoU of the confusion matrix is 0.5, and [email protected] is the average of the Precision values of all categories of samples. It reflects the trend of the P of the model with the recall R. The higher the value of [email protected], the easier it is for the model to maintain high precision at high recall rates. The calculation formula is as follows:
A P = 0 1 P ( R ) d R
m A P = 1 n i = 1 n ( A P ) i
where AP represents the average precision, and ( A P ) i represents the AP value of class i.
To assess the effectiveness of the improved method described in the paper, experiments were conducted on a dataset using the same training parameters. The performance of the improved method was then compared with that of YOLOv8 and YOLOv5.
The detection precision and recall of the improved YOLOv8 model are significantly improved. The specific numerical results are shown in Table 3. The addition of CBAM effectively enhances the performance of the model. In comparison to the original model, the enhanced YOLOv8 model demonstrated an increase in F1 score by 8.2 and [email protected] by 4.2%. The results show that the improved YOLOv8 model can better meet the detection requirements of landslide in mining area.

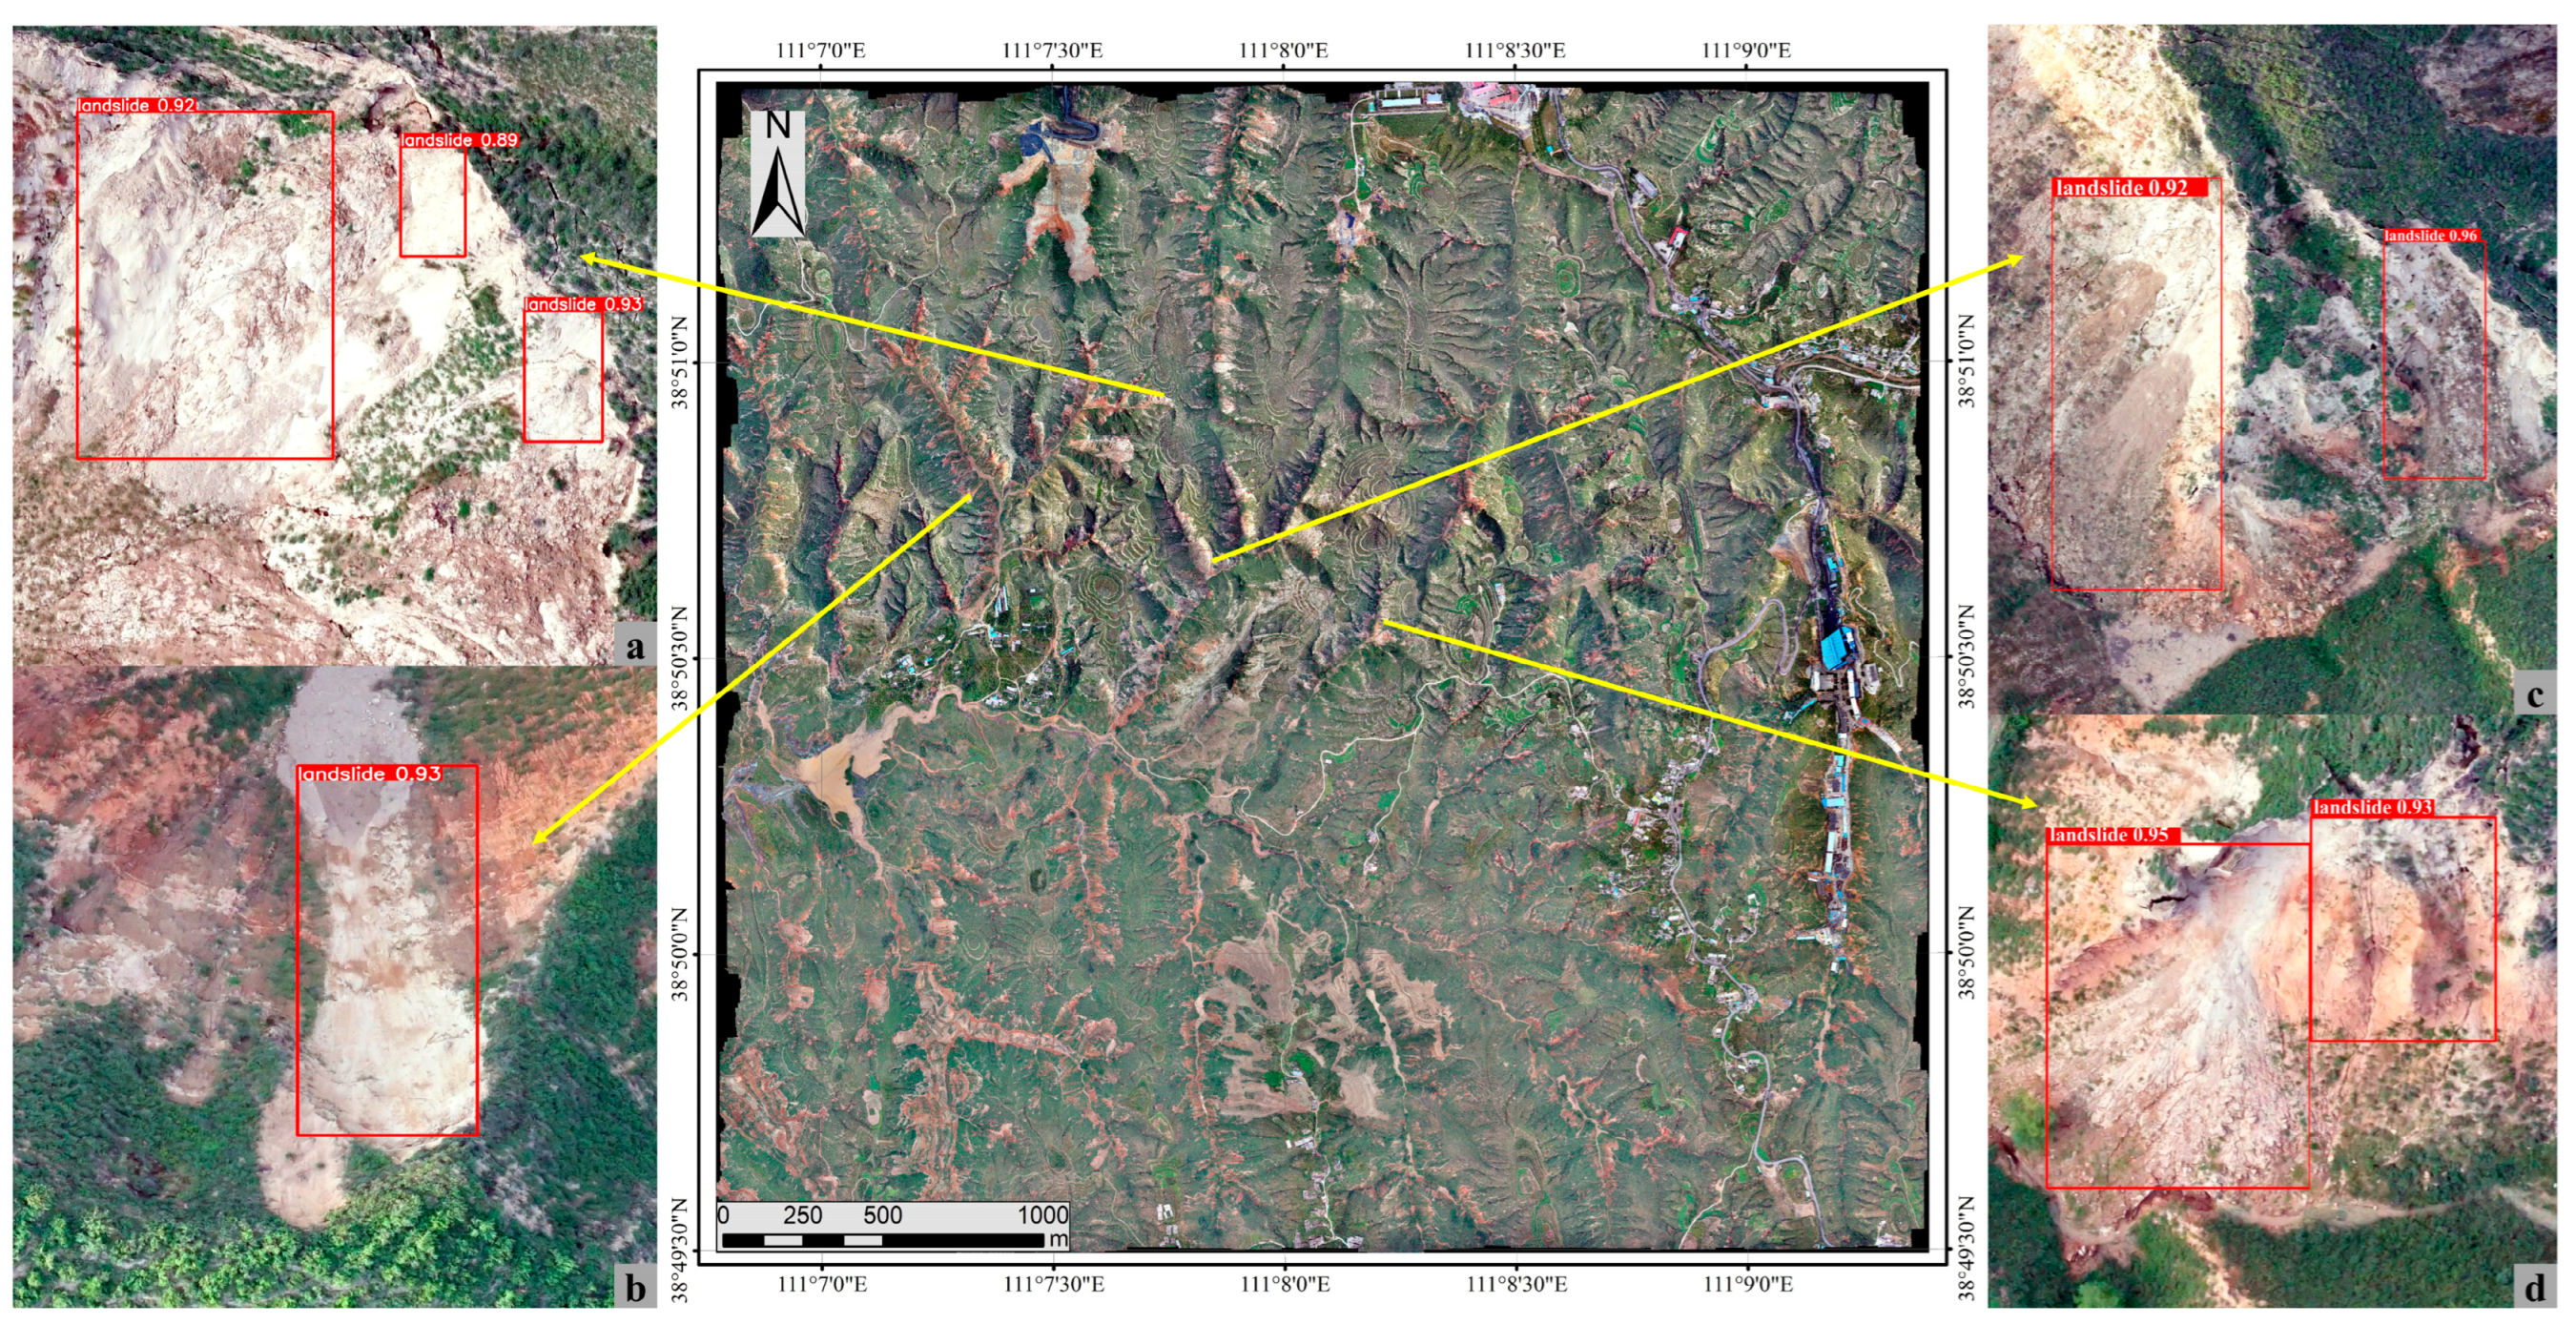
4.3. Landslide Detection Results

The model is used to identify landslides in the study area with an area of 13.88 square kilometers, and a total of 246 landslides are identified. However, some of the recognition results overlap, that is, multiple recognition frames are selected at different positions of the same landslide, as shown in Figure 10a,d. After considering the above situation, a total of 208 landslides were detected through the model in this paper. Through field investigation and visual interpretation of images, there are 203 landslides in the study area, of which 189 were correctly detected and 14 were not detected. The recognition accuracy rate reached 93.10% and the missed detection rate was 6.89%.
Some of the identification results shown in Figure 10 show that this study has successfully detected the surface landslides in the mining area, which can provide corresponding data support for the subsequent ecological restoration of the mining area.

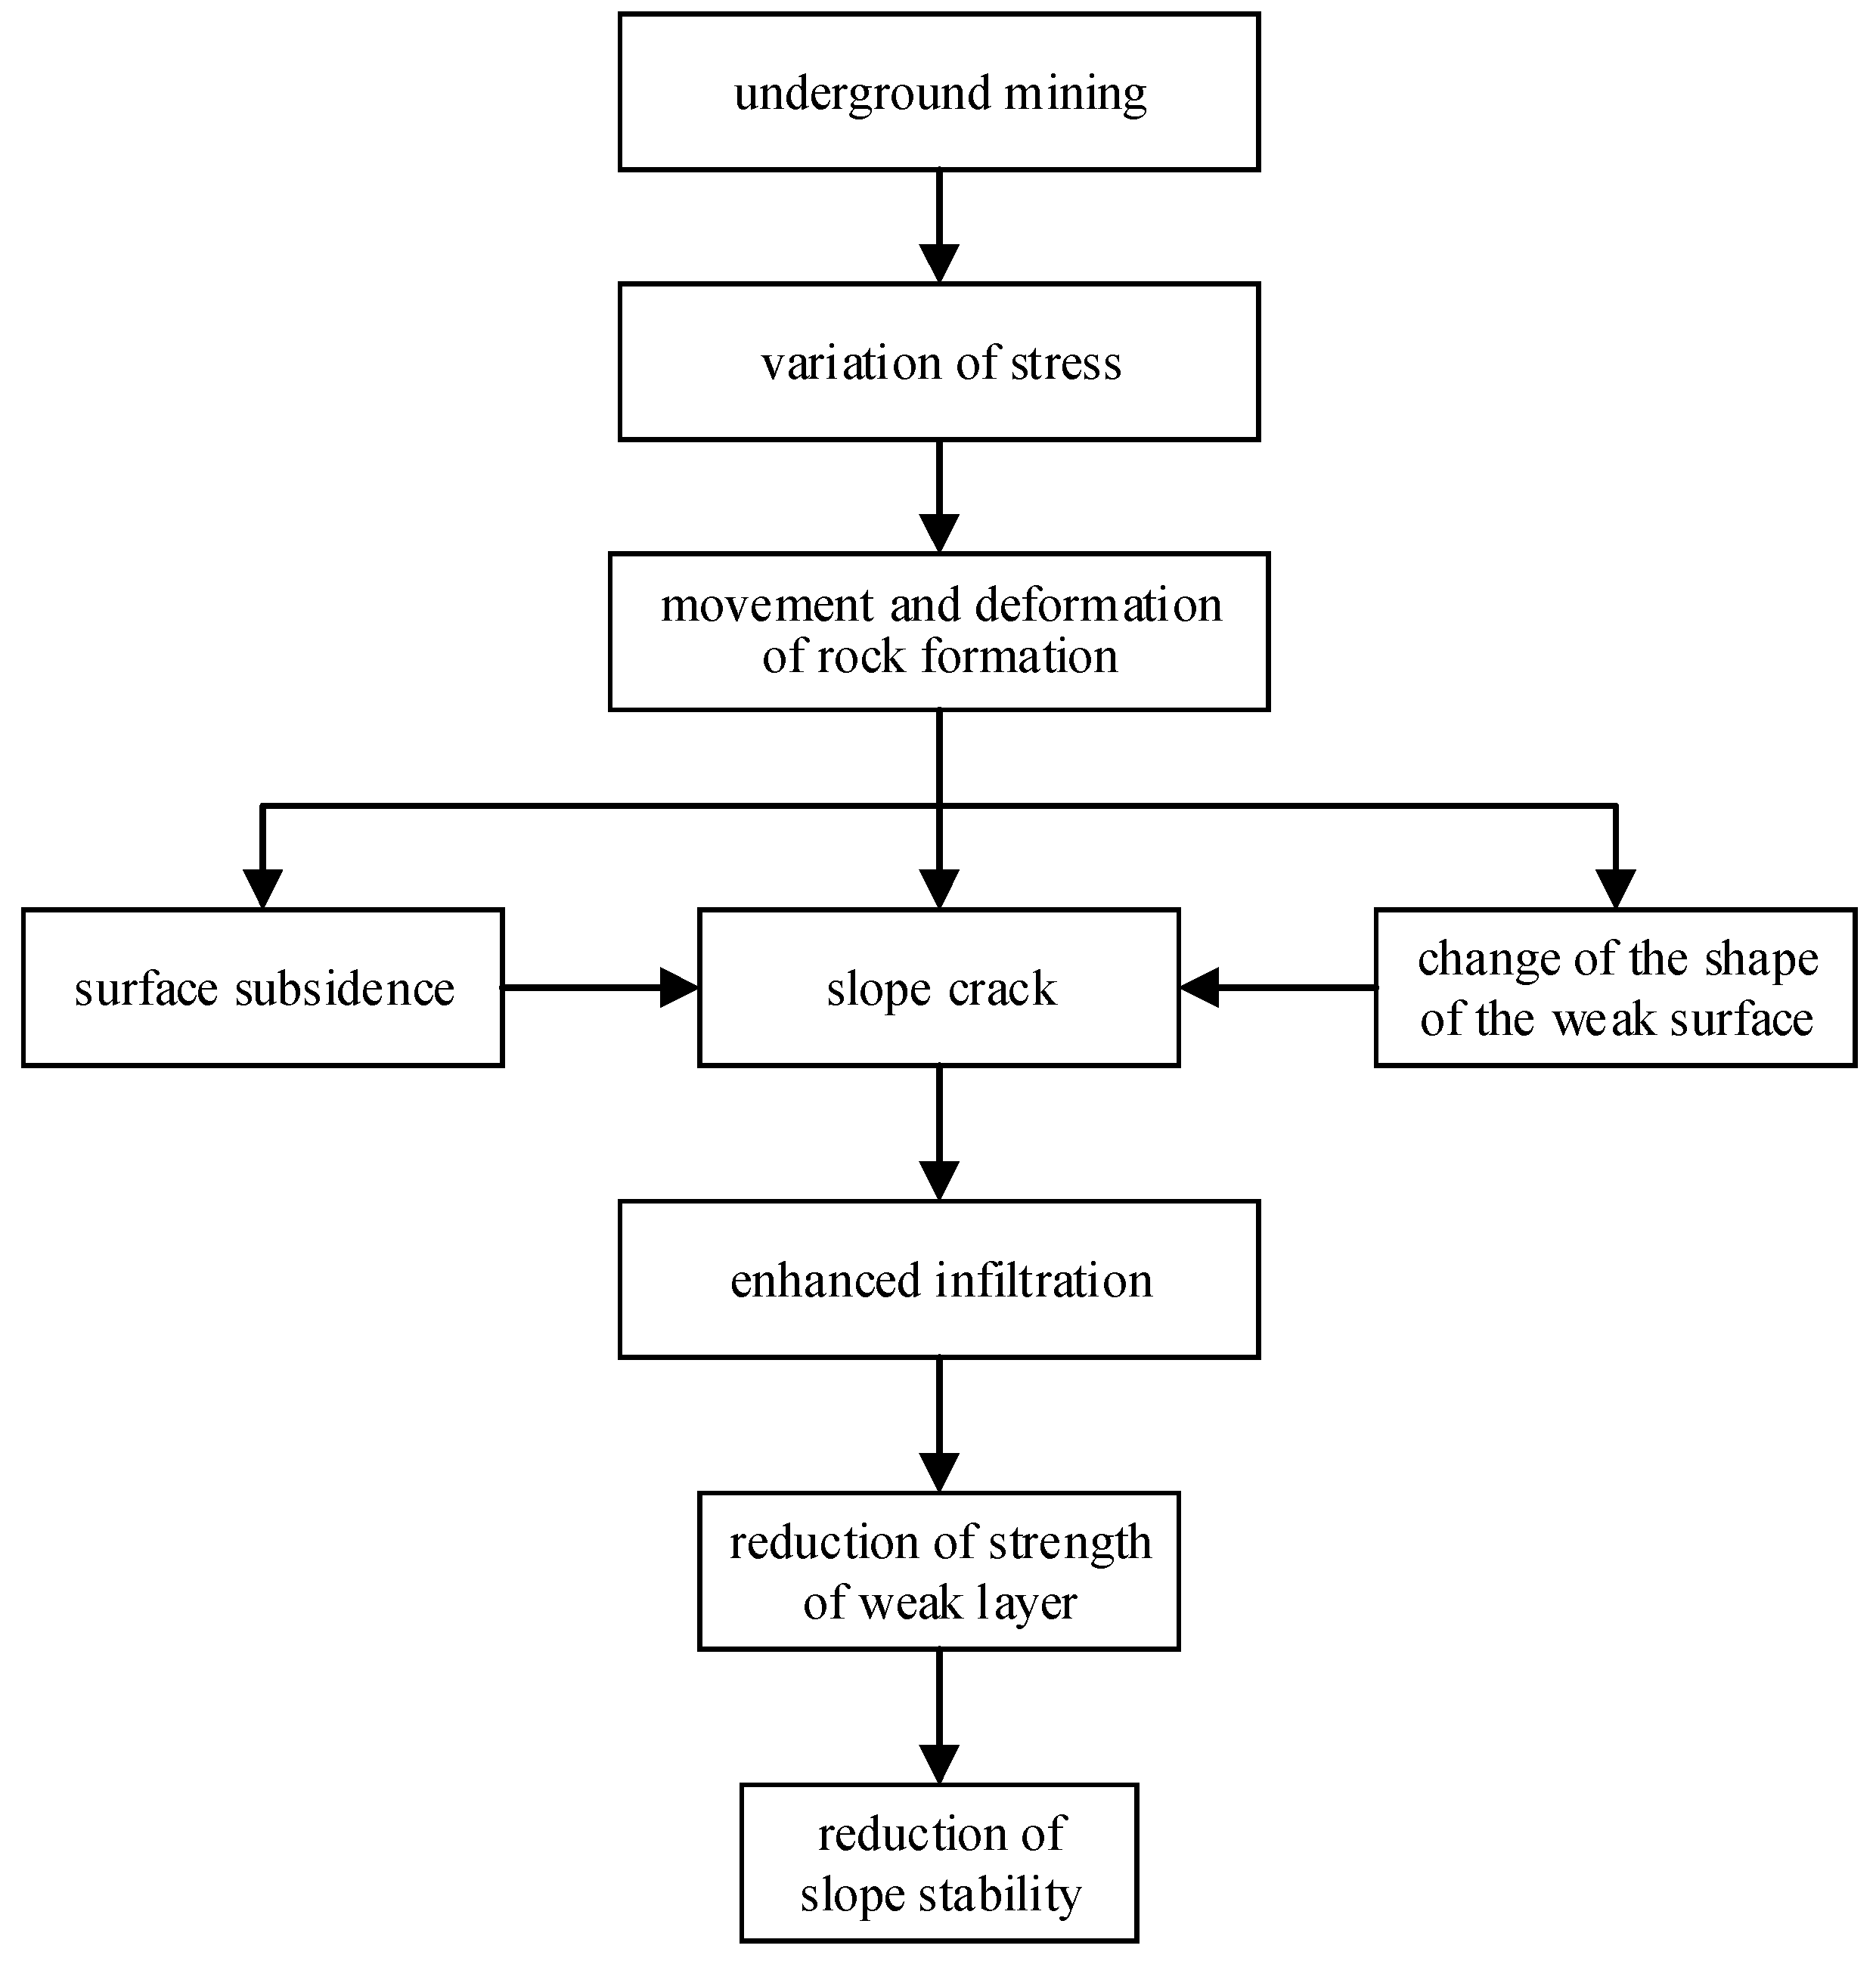
4.4. The Influence of Underground Mining on Landslide in Mining Area

In the study area, which is a mining area, the occurrence of landslides is significantly influenced by mining activities. In order to study the influence of underground mining on the distribution of landslide in mining area, we obtained the relevant data of the mining area, including working face data, mining area boundary and so on. The formation of landslide is often the result of the interaction of internal and external factors. The internal factors mainly include the factors of the slope itself, and the geometric shape of the slope and the structural conditions. The landslide in the mining area is affected by many factors, mainly underground mining, and its deformation and instability mechanism is very different from that of general landslides. The effect of underground mining on the slope is manifested in many aspects. The correlation between the effects leads to the reduction of slope stability and ultimately leads to the formation of landslides in mining areas, which is shown in Figure 11.
The boundary of the mining area and the data of the working face are corresponding to the study area, in Figure 12. It can be found that the landslides in the mining area are mostly distributed near the working face within the mining boundary. Many working faces in the mine area have been mined, resulting in a large area of goaf in the underground, and the stability of the overlying strata on the surface is affected, which induces the formation of landslides. There are also some landslides outside the mine boundary. These landslides are mostly affected by the mining of adjacent mining areas. The stability of the overlying strata is destroyed, and the mechanical properties are changed, resulting in the formation of surface landslides.

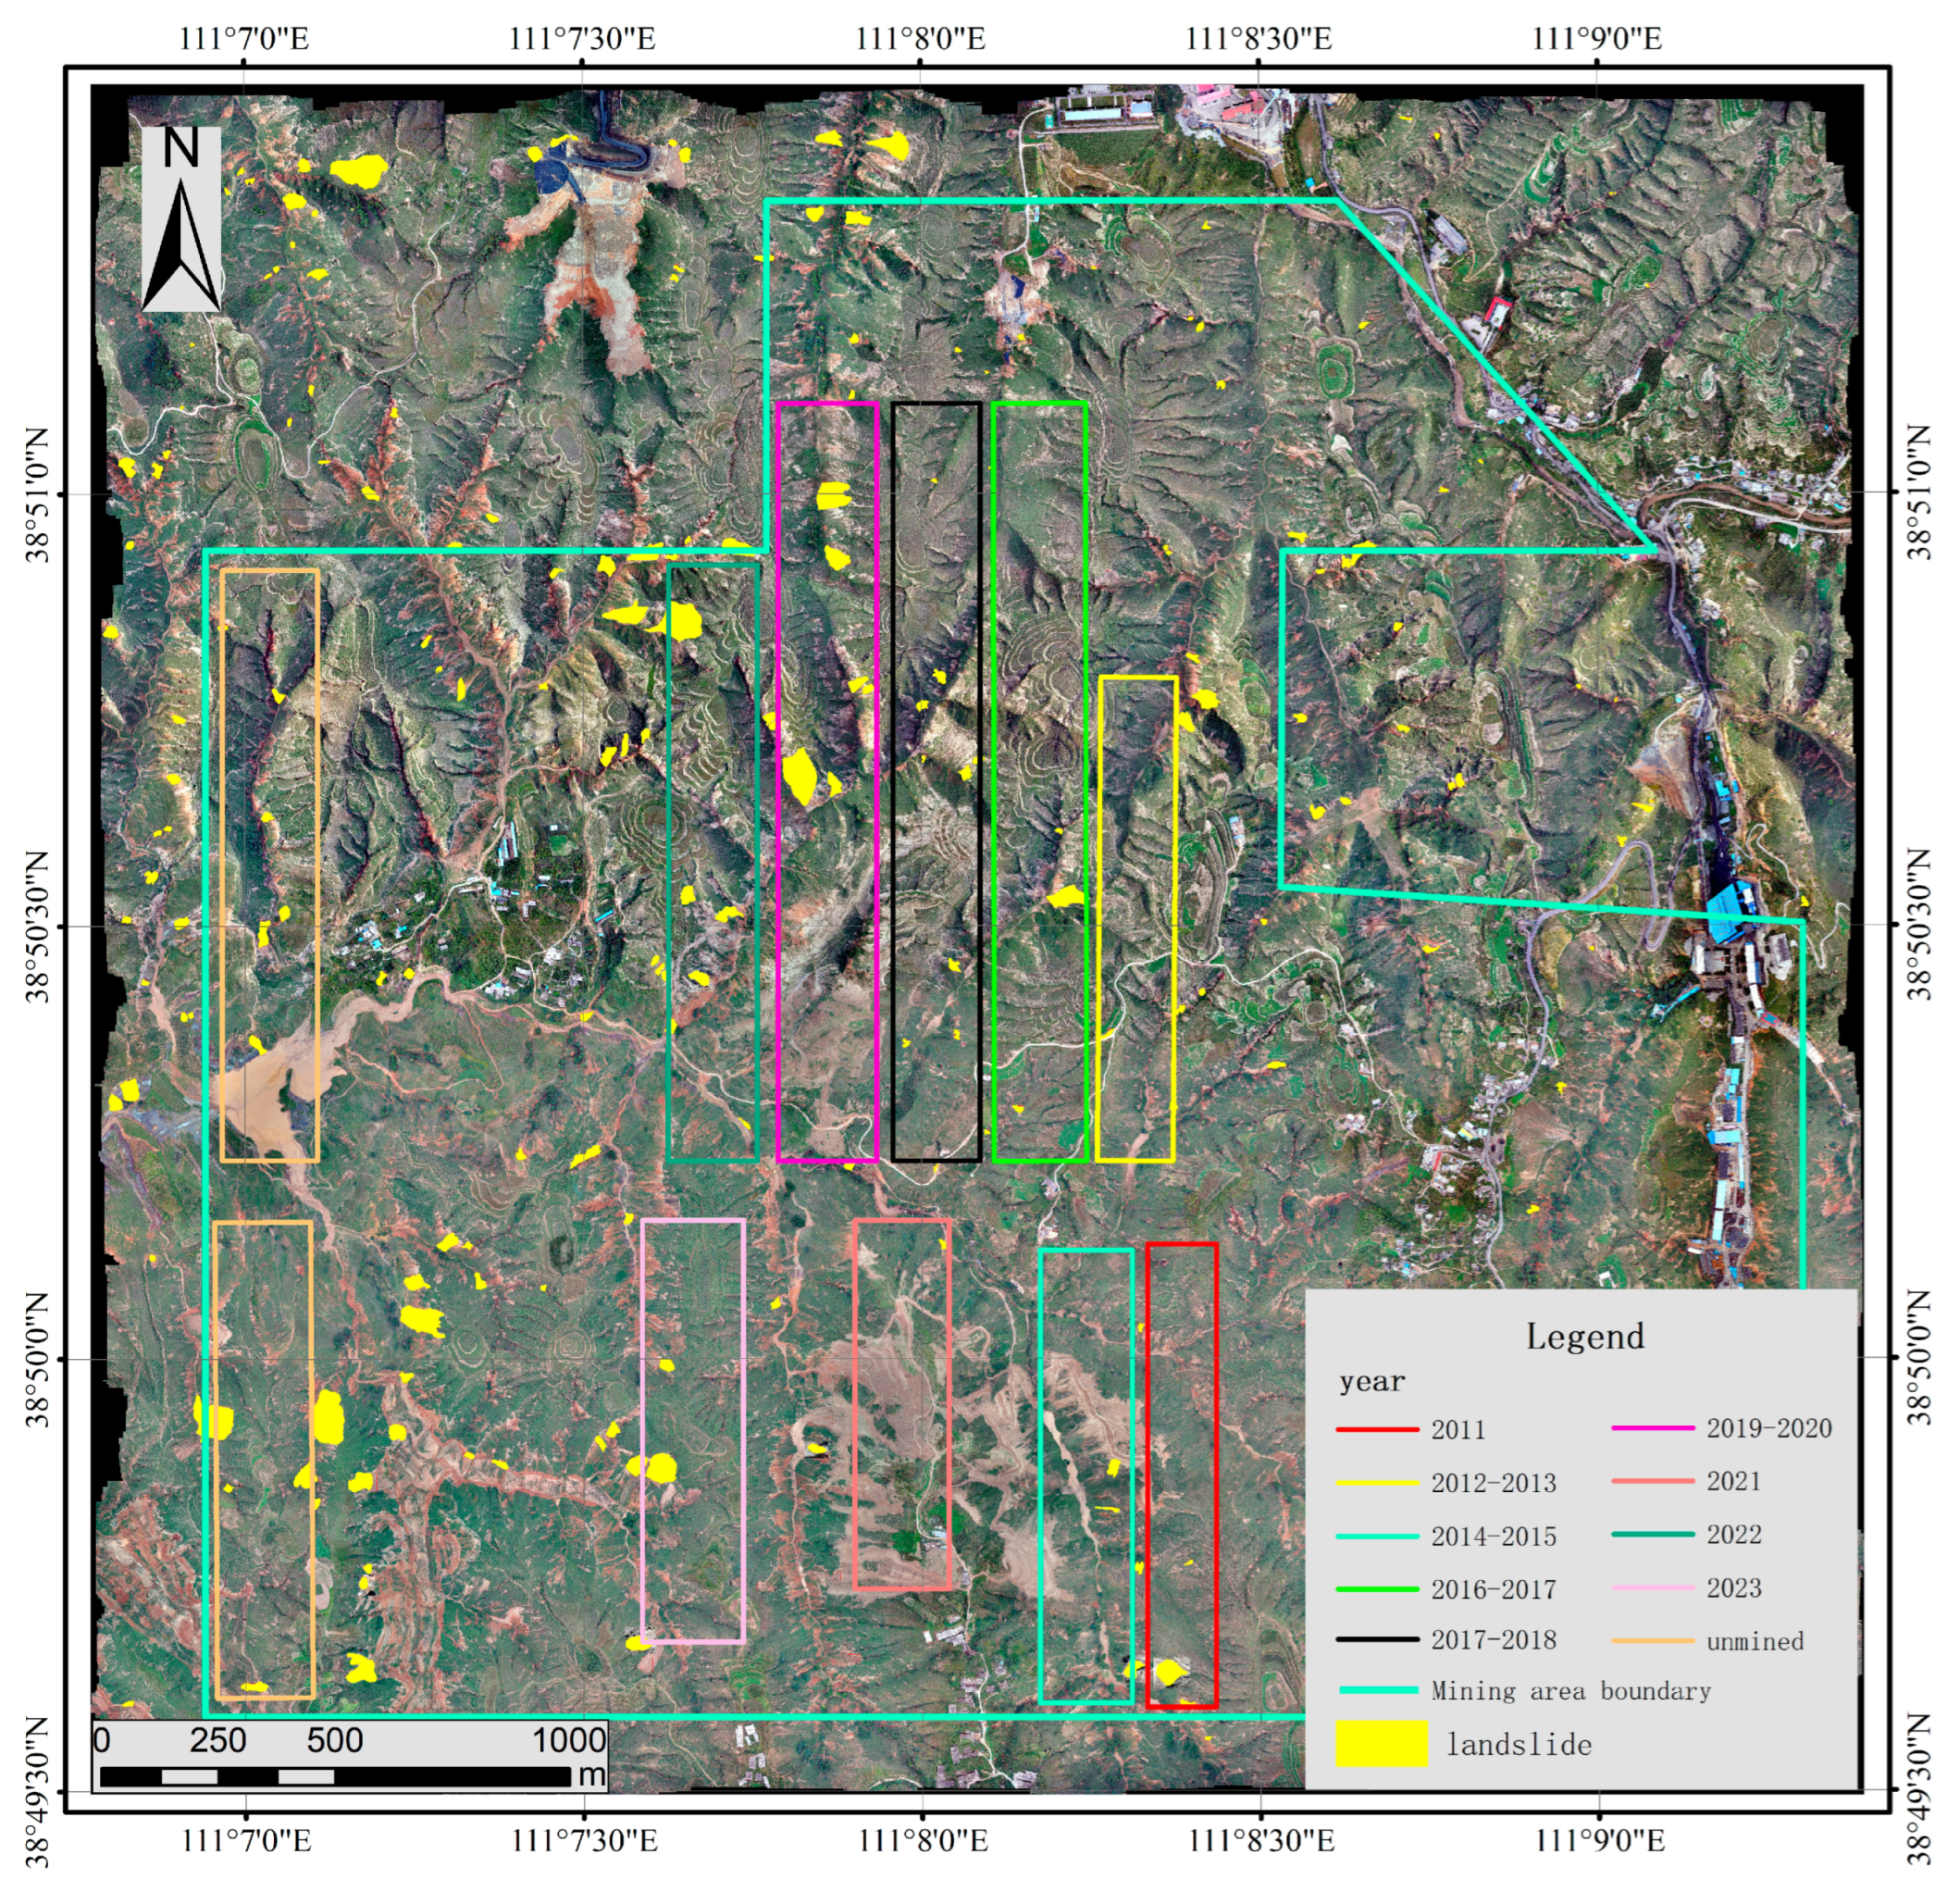
4.5. Landslide Changes

In this research, the orthophoto images of the study area were obtained in July 2022 and April 2023 respectively, and the landslide in the mining area was identified by the model in this paper. We use ArcGIS to mark the recognition results on the image based on the first phase of orthophoto. The yellow area is the landslide area marked on the first phase of the image, and the red area is the landslide area newly discovered on the last phase of the image, as shown in Figure 13. Due to the short interval between the first and last images, there is no significant difference in the range and number of landslides, but 10 new landslides are still formed, and the range of many landslides has changed. The newly developed landslide is marked as L1-L10 in order. In Figure 14, the changes of them in the two images are shown respectively. The model employed in this study exhibits the capability to facilitate the monitoring of landslide variations and timely detection of emerging landslides.

5. Discussion

In this study, the landslide data set of UAV remote sensing image in mining area was established, and the improved YOLO algorithm was used to realize the identification and location of mining landslide in mining area. The study evaluated the applicability of the landslide data set, the recognition accuracy of the improved algorithm, and the feasibility of monitoring landslide changes. These contents are discussed below:
  • In this study, a landslide data set of UAV remote sensing image in mining area was constructed. However, due to the insufficient amount of data, we enhanced the image to achieve the purpose of expanding the dataset. The expanded landslide dataset can complete the training of the model, which is suitable for the training of the mining landslide recognition model in the mining area. However, there are also some shortcomings: image enhancement methods may cause image distortion or unreality, affecting the generalization performance of the model.
  • This study innovatively uses the improved model to monitor the landslide in the mining area, which can accurately identify the location of the landslide area. The precision of landslide identification in [8] is 83.9%, and the precision of landslide identification using the model in this paper reaches 93.1%. Compared with the method in [8], the landslide recognition method proposed in this study has significantly improved the recognition accuracy. However, the model in the paper cannot calculate the specific parameters such as the area and slope of the landslide, and the relevant parameters can be obtained by means of image segmentation.
  • Cheng et al. [23] used the improved YOLOv4 model to complete the identification of landslides, and the precision was 94.08%, which was equivalent to the precision of the model in this paper. However, due to the limitations of its algorithm, it is impossible to obtain the location information of the recognition results. The landslide recognition result positioning algorithm proposed in this paper can accurately obtain the location information of the landslide, effectively make up for the shortcomings of reference [23], and provide the necessary positioning for the accurate treatment of landslides.
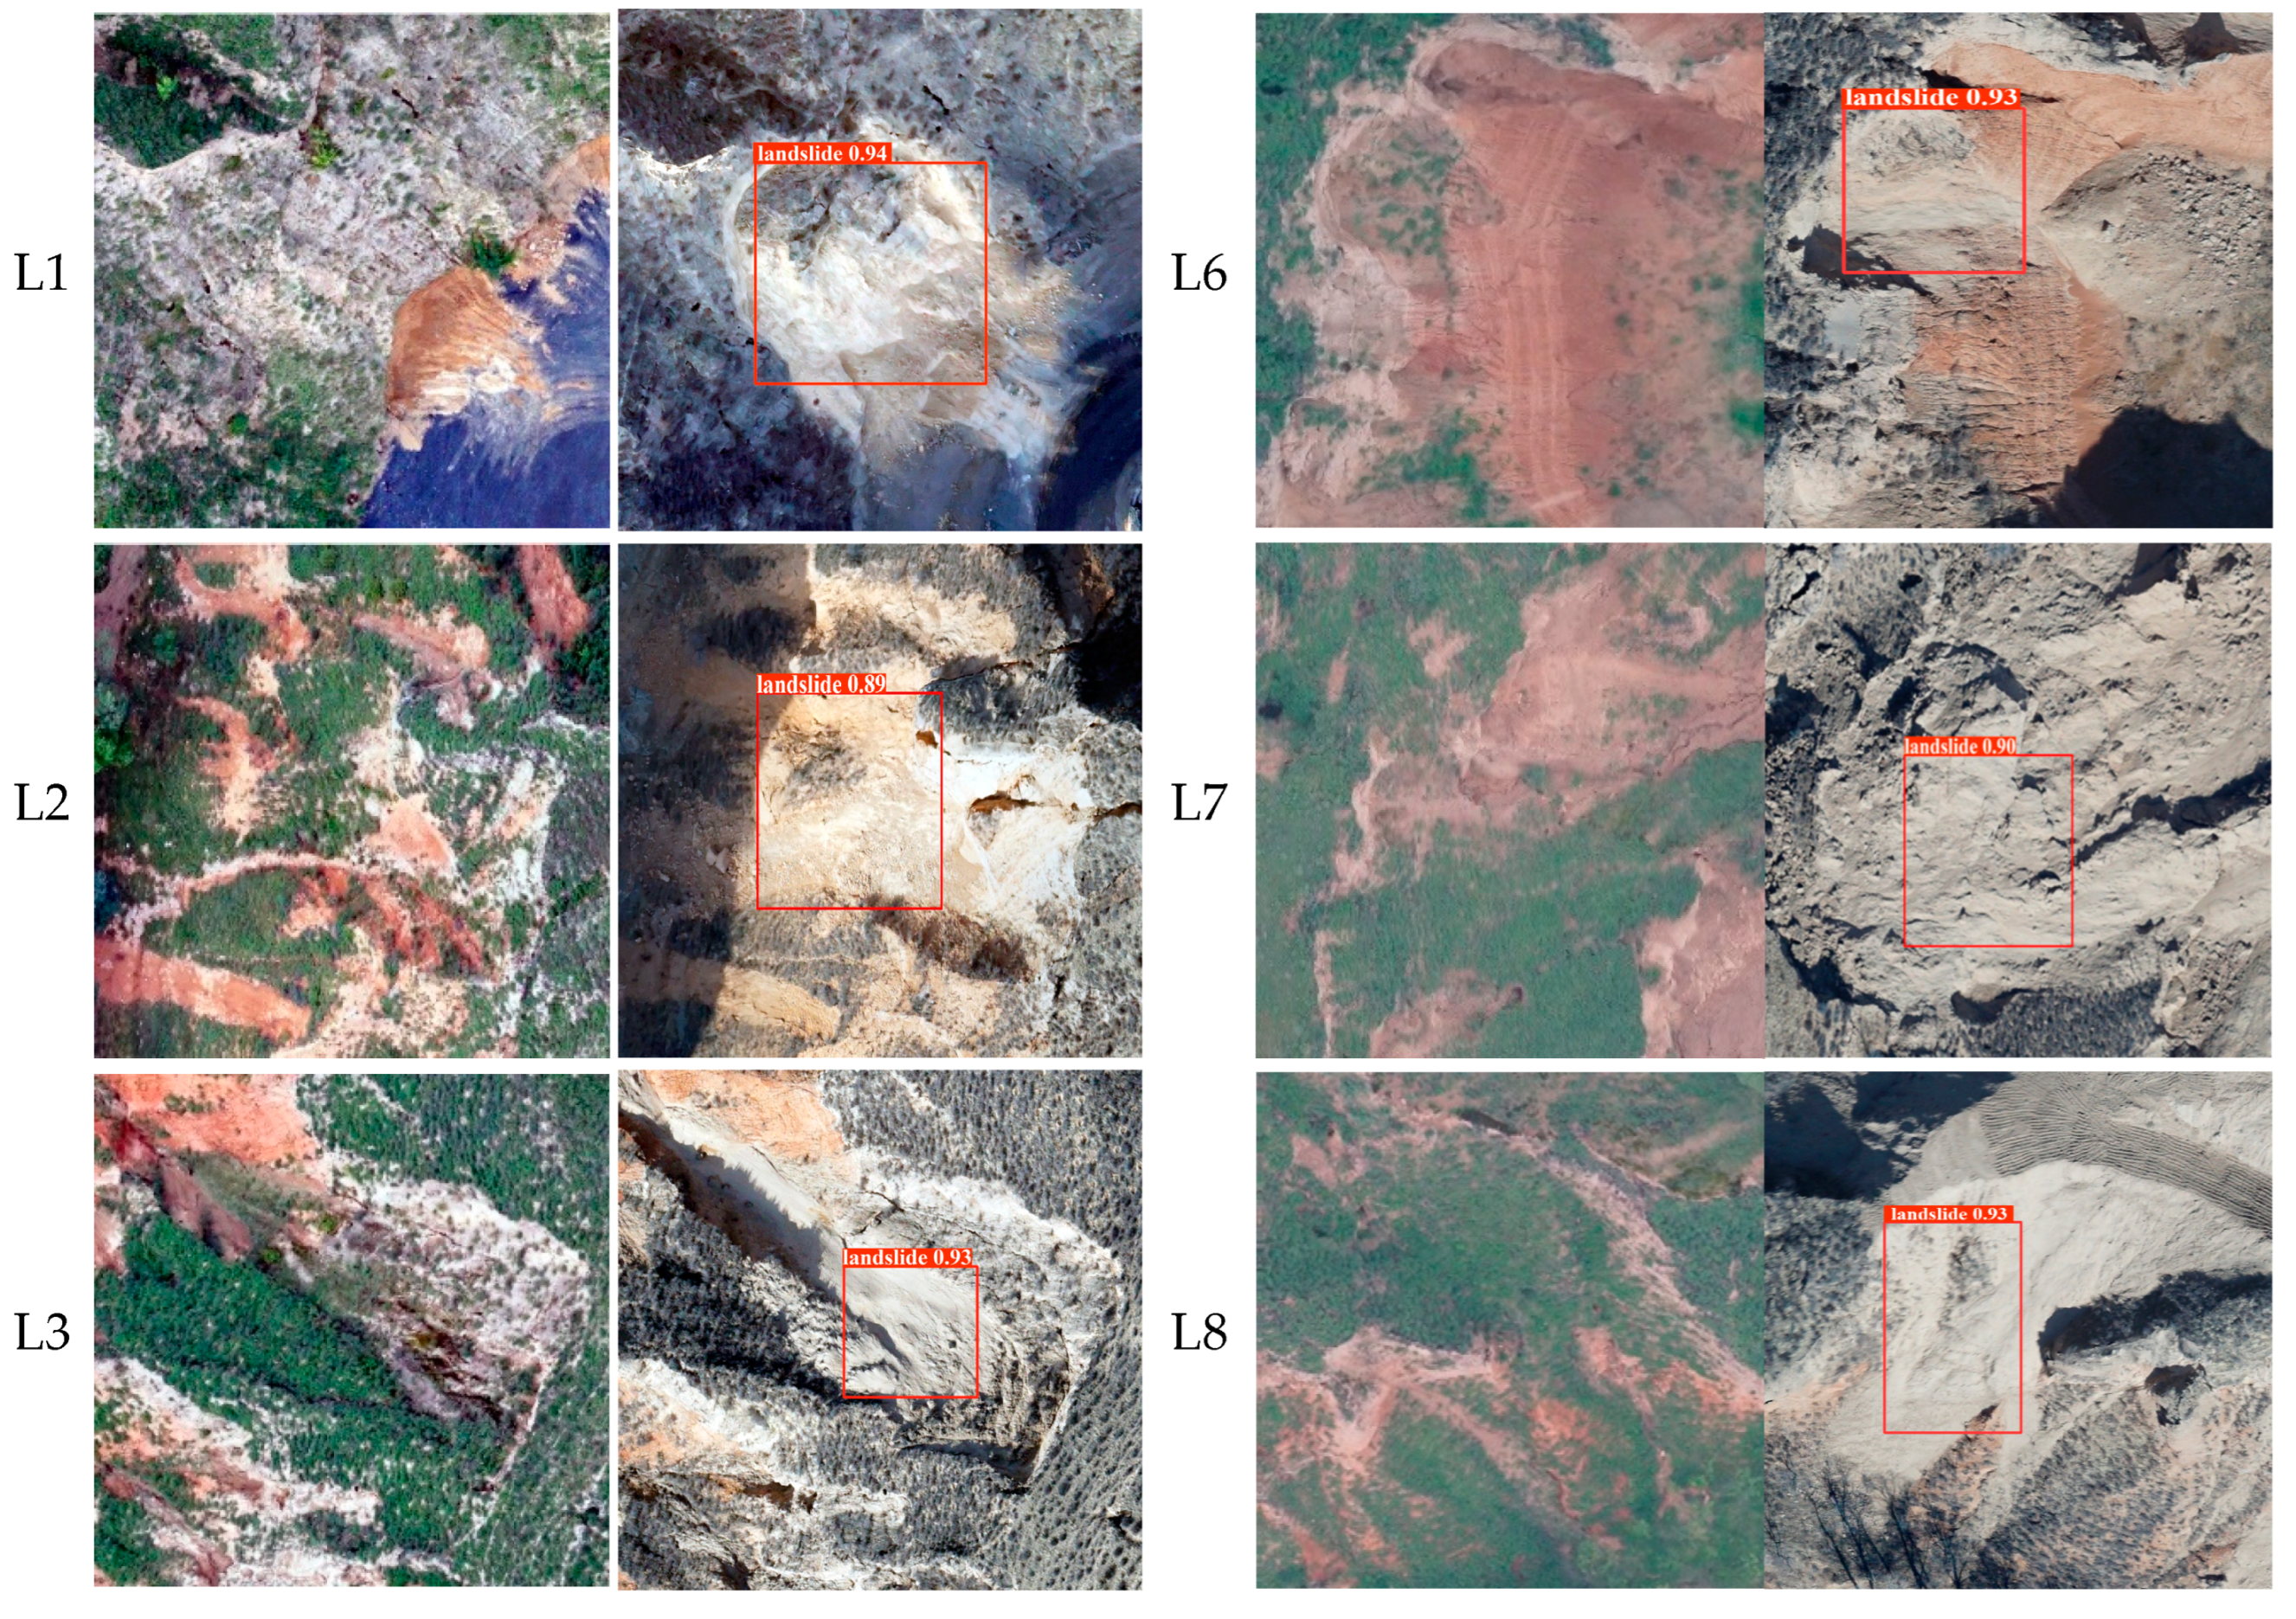
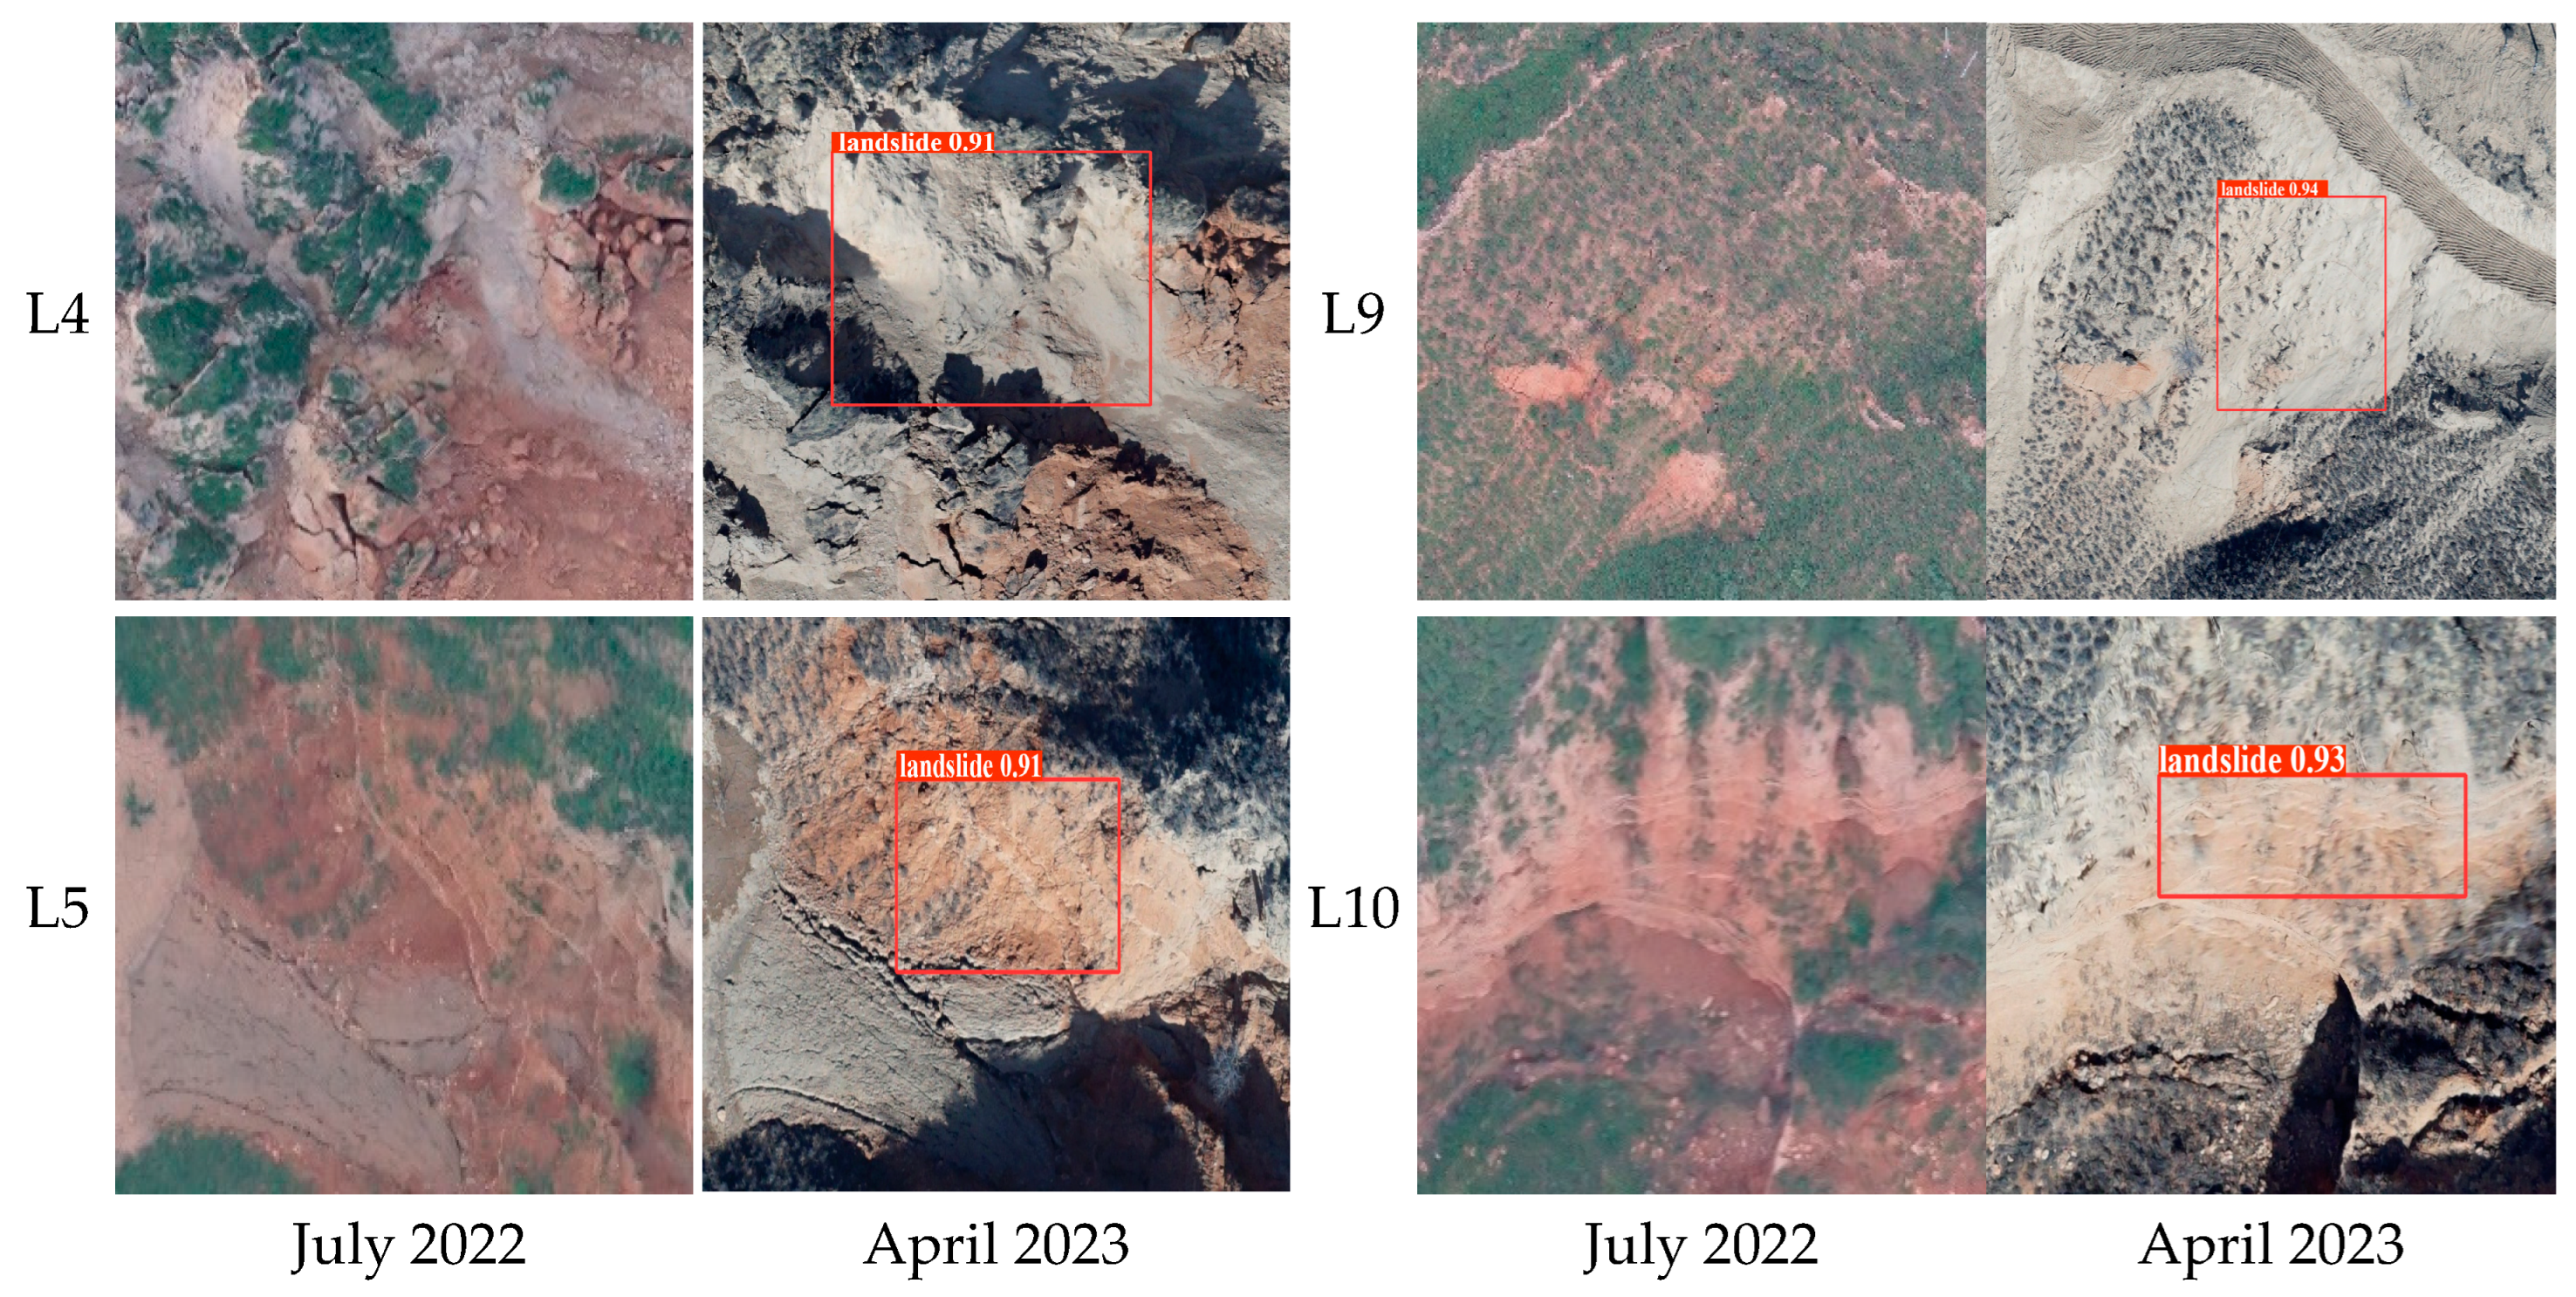
  • We use the model in this paper to detect landslides in multi-period UAV images of mining areas, and successfully realize the monitoring of landslide changes in mining areas. Figure 13 shows the change of landslide during July 2022–April 2023, but the time span of the two images is short and has certain limitations. In the follow-up study, the interval time of the image can be appropriately increased to obtain a clearer change of the landslide in the mining area.

6. Conclusions

In this study, the landslide dataset of UAV remote sensing image in mining area was established. The recognition and location of landslide in mining area were realized by reconstructing YOLO algorithm, and the monitoring of landslide change in mining area was realized by using multi-period image. The research results are summarized as follows:
  • We use the UAV images of mining area to construct a landslide data set in the mining area and use LabelImg to label the corresponding landslide area on the data set. By reconstructing the structure of YOLOv8, CBAM is embedded into the YOLOv8 model, which effectively improves the landslide detection performance of the model in UAV images.
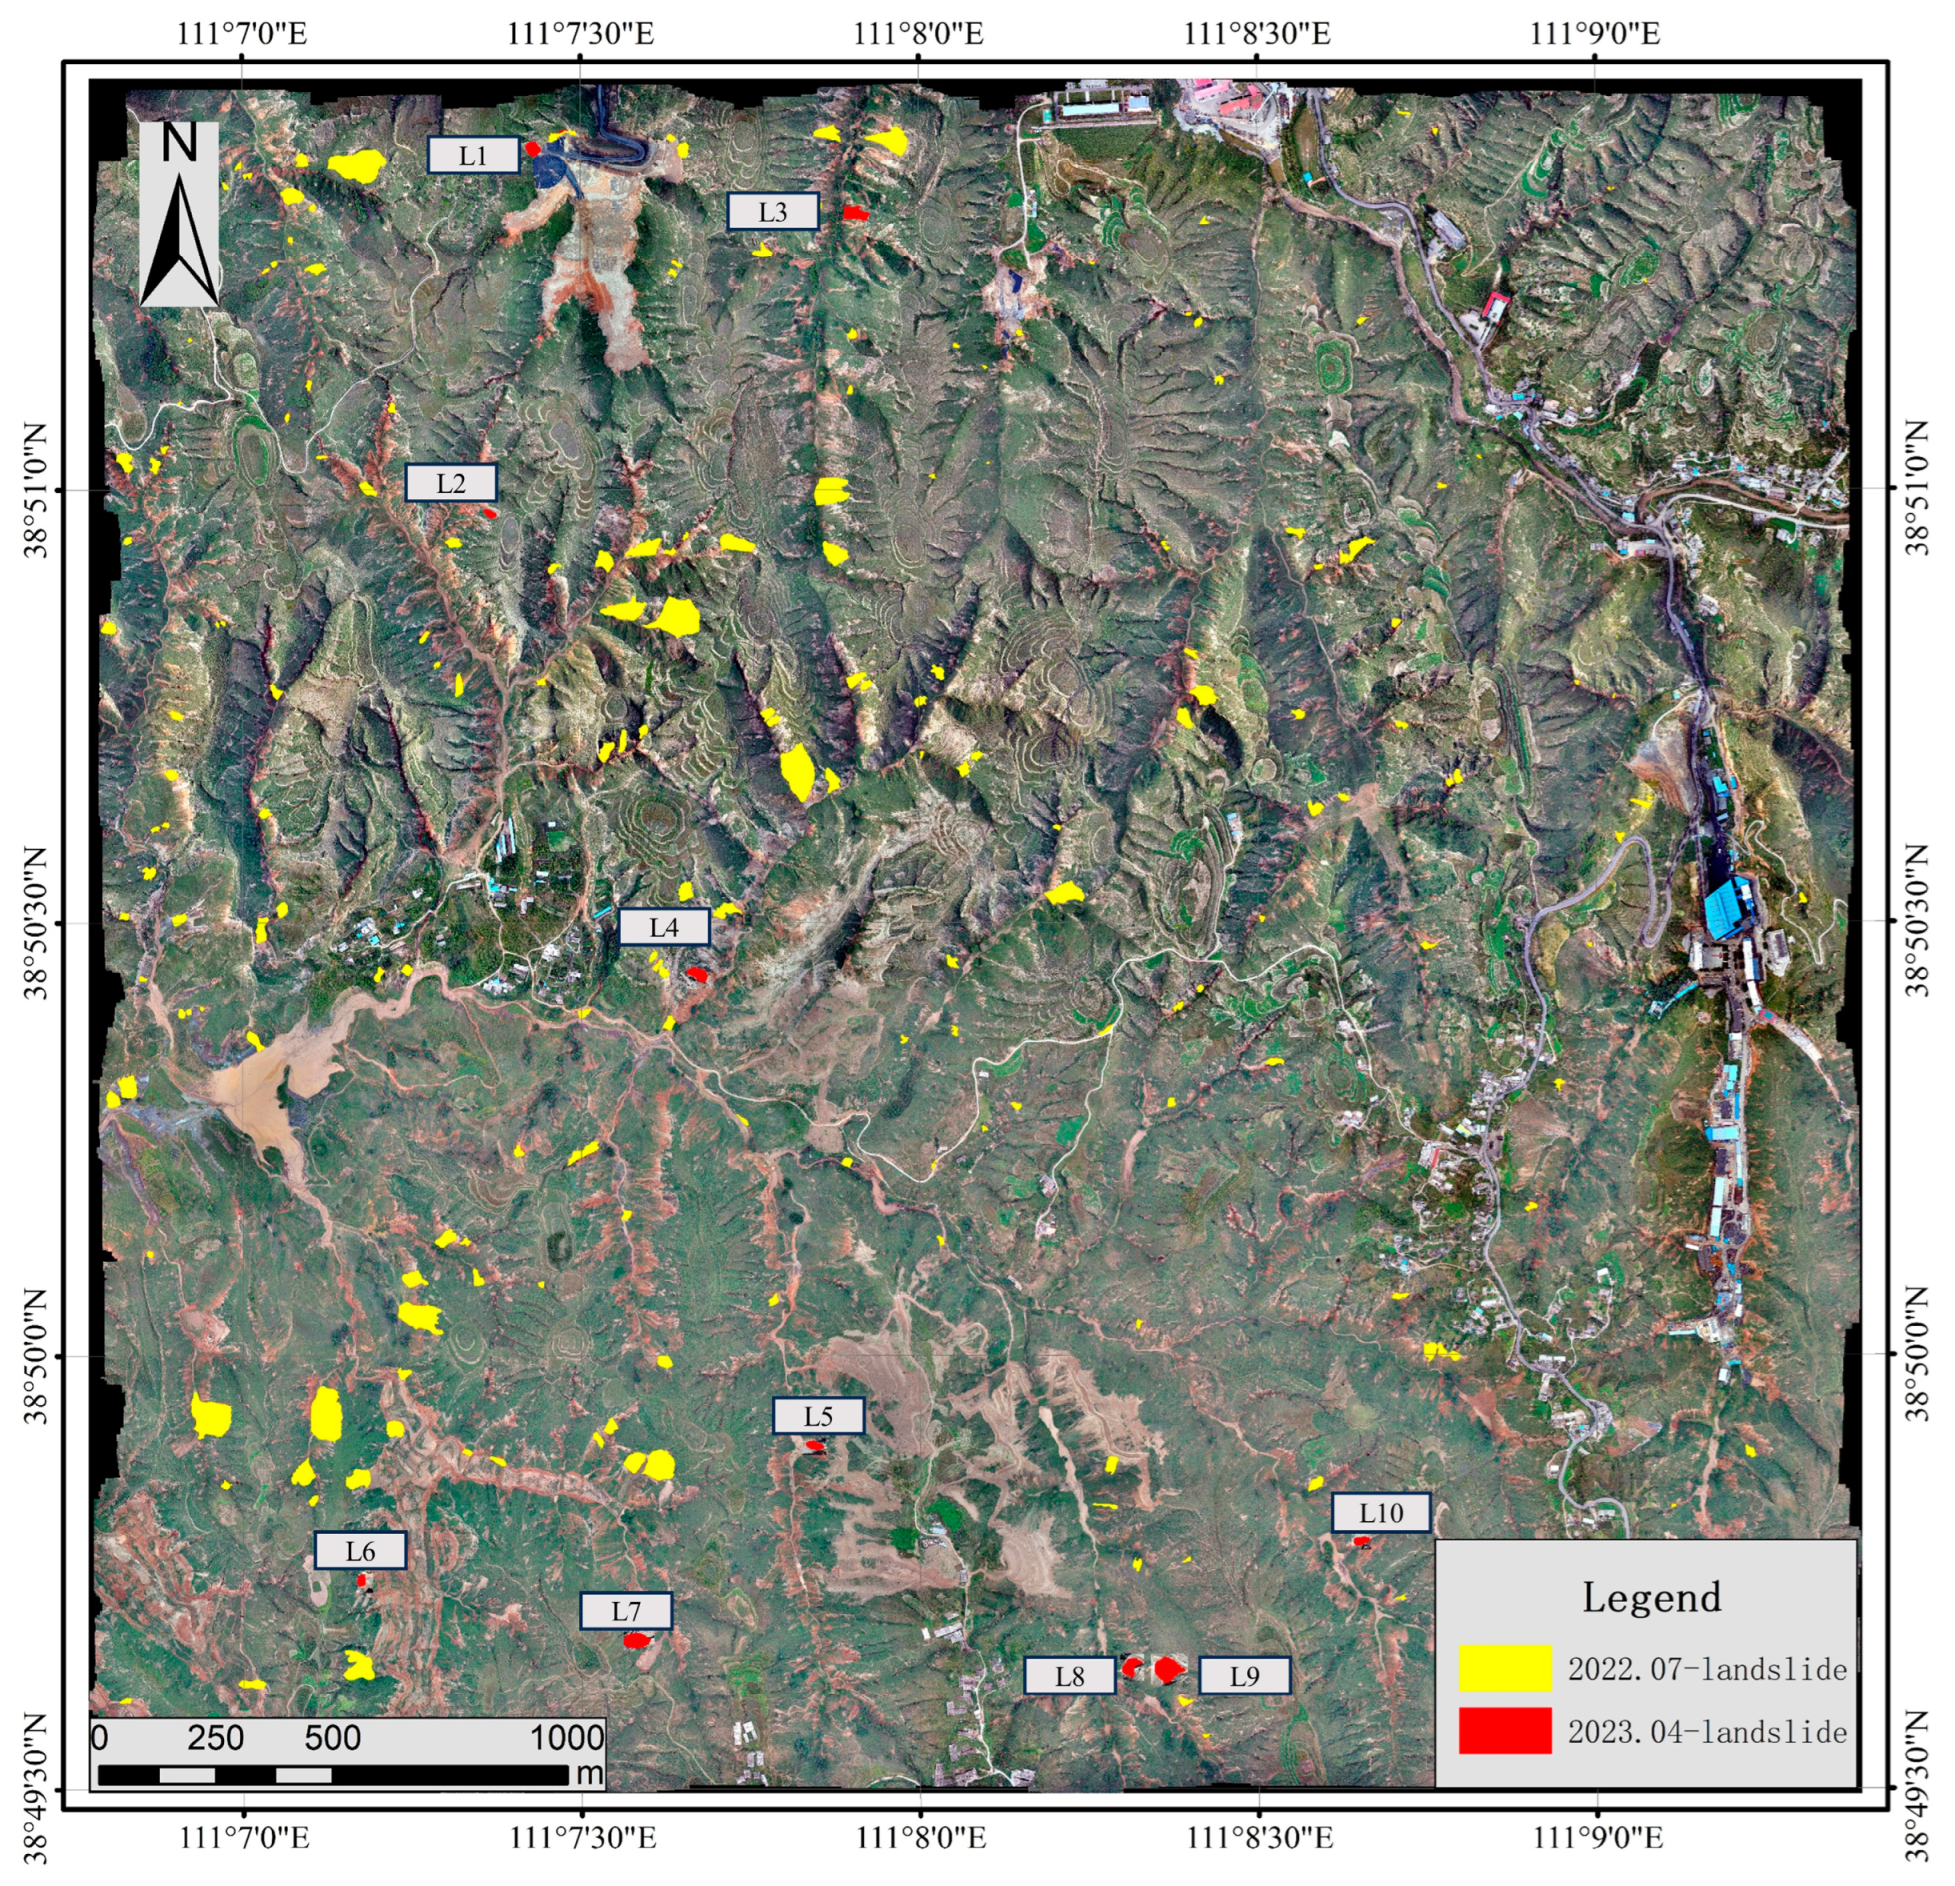
  • The feasibility of this model for landslide detection on UAV large-scale images in mining areas is verified. The area of the study area is 13.88 square kilometers. A total of 208 landslides were detected through the model in this paper. Through field investigation and visual interpretation of images, there are 203 landslides in the study area, of which 189 were correctly detected and 14 were not detected. The model F1 score was 97.10%, the missed detection rate was 6.89%, and the recognition accuracy was 93.10%.
  • This study solves the problem of landslide location in images and proposes an algorithm to realize landslide location. The algorithm solves the problem of coordinate information loss in the conventional model and realizes the accurate positioning of the detected landslide area under the geographic coordinate system.
  • The feasibility of using the model to monitor the change of landslide in mining area is confirmed, multi-stage UAV images are obtained, and the improved model is used to identify. By comparing the identification results, the landslide changes in the mining area can be obtained in time. This capability offers valuable data support for subsequent ecological restoration efforts in the mining area.

Author Contributions

Conceptualization, X.L. and Y.L.; methodology, X.L.; software, Y.L.; validation, X.W.; formal analysis, L.S.; investigation, C.X.; resources, X.L.; data curation, Y.L.; writing—original draft preparation, X.L.; writing—review and editing, X.L.; visualization, X.L.; supervision, L.S.; project administration, X.L.; funding acquisition, X.L. All authors have read and agreed to the published version of the manuscript.

Funding

This research was funded by the Shanxi Natural Science Foundation of China (Award Number: 202203021211153), National Natural Science Foundation of China (Award Number: 51704205) and Shanxi water conservancy technology and research promotion project of China (Award Number: 2023GM12).

Data Availability Statement

The data supporting the conclusions of this article will be made available by the authors on request.

Acknowledgments

We would like to thank all the reviewers for the good comments.

Conflicts of Interest

The authors declare no conflict of interest.

References

  1. Pollock, W.; Wartman, J. Human vulnerability to landslides. GeoHealth 2020, 4, e2020GH000287. [Google Scholar] [CrossRef] [PubMed]
  2. Cui, Y.L.; Xu, C.; Xu, S.Y.; Xu, S.Y.; Chai, S.F.; Fu, G.; Bao, P.P. Small-scale catastrophic landslides in loess areas of China: An example of the 15 March 2019, Zaoling landslide in Shanxi Province. Landslides 2020, 17, 669–676. [Google Scholar] [CrossRef]
  3. Sun, T.; Sun, D.Y.; Wang, X.K.; Ma, Q.; Philippe, G.; Daisuke, N. Numerical analysis of landslide-generated debris flow on 3 July 2021 in Izu Mountain area, Shizuoka County, Japan. J. Mt. Sci. 2022, 19, 1738–1747. [Google Scholar] [CrossRef]
  4. Huo, C. Study on Coal Resources Distribution Features and Exploration, Exploitation Layout in Shanxi Province. Coal Geol. China 2020, 32, 159–162. [Google Scholar]
  5. Guo, Z.Z.; Pei, H.H.; Huang, W.X.; Yang, Q.M. Thoughts on Environmental Geological Survey of Coal Mines in Shanxi Province. Hydrogeol. Eng. Geol. 2004, 31, 101–104. [Google Scholar]
  6. Jiao, S.; Long, J.H.; Yu, H.L. Characteristic and classification of landslide in Shanxi coal mine area. Coal Geol. Explor. 2017, 45, 101–106. [Google Scholar]
  7. Shi, W.H.; Li, Y.R.; Zhang, W.W.; Liu, J.; He, S.D.; Mo, P.; Guan, F.F. The loess landslide on 15 March 2019 in Shanxi Province, China. Landslides 2020, 17, 677–686. [Google Scholar] [CrossRef]
  8. Huang, T.; Bai, X.F.; Zhuang, Q.F.; Xu, J.H. Research on Landslides Extraction Based on the Wenchuan Earthquake in GF-1 Remote Sensing Image. Bull. Surv. Mapp. 2018, 2, 67–71. [Google Scholar] [CrossRef]
  9. Ding, Y.H.; Zhang, Q.; Yang, C.S.; Wang, M.; Ding, H. Landslide identification in Jinsha River basin based on high-resolution remote sensing: Taking Wangdalong village of Batang county as an example. Bull. Surv. Mapp. 2022, 4, 51–55. [Google Scholar] [CrossRef]
  10. Wang, Y.H.; Li, D.H.; Ding, Y. Surface change identification of exposed slope based on UAV inclined photogrammetry. Bull. Surv. Mapp. 2023, 8, 45–50. [Google Scholar] [CrossRef]
  11. Cai, H.J.; Han, H.H.; Zhang, Y.L.; Wang, L.S. Convolutional Neural Network Landslide Recognition Based on Terrain Feature Fusion. J. Earth Sci. Environ. 2022, 44, 568–579. [Google Scholar] [CrossRef]
  12. Xin, L.B.; Han, L.; Li, L.Z. Landslide Intelligent Recognition Based on Multi-source Data Fusion. J. Earth Sci. Environ. 2023, 45, 920–928. [Google Scholar] [CrossRef]
  13. Han, Z.; Fang, Z.X.; Li, Y.E.; Fu, B.J. A novel Dynahead-Yolo neural network for the detection of landslides with variable proportions using remote sensing images. Front. Earth Sci. 2023, 10, 1077153. [Google Scholar] [CrossRef]
  14. Bochkovskiy, A.; Wang, C.Y.; Liao, H.Y.M. YOLOv4: Optimal Speed and Accuracy of Object Detection. arXiv 2020, arXiv:2004.10934. [Google Scholar] [CrossRef]
  15. Zhang, S.F.; Chi, C.; Yao, Y.Q.; Lei, Z.; Li, S.Z. Bridging the gap between anchor-based and anchor-free detection via adaptive training sample selection. In Proceedings of the IEEE/CVF Conference on Computer Vision and Pattern Recognition, Long Beach, CA, USA, 15–20 June 2019; pp. 9759–9768. [Google Scholar] [CrossRef]
  16. Li, X.; Wang, W.H.; Hu, X.L.; Li, J.; Tang, J.H.; Yang, J. Generalized Focal Loss V2: Learning Reliable Localization Quality Estimation for Dense Object Detection. In Proceedings of the IEEE/CVF Conference on Computer Vision and Pattern Recognition, Nashville, TN, USA, 20–25 June 2021. [Google Scholar] [CrossRef]
  17. Tian, Z.; Shen, C.; Chen, H.; He, T. FCOS: Fully Convolutional One-Stage Object Detection. arXiv 2019, arXiv:1904.01355. [Google Scholar] [CrossRef]
  18. Fu, J.; Liu, J.; Jiang, J.; Li, Y.; Bao, Y.J.; Lu, H.Q. Scene Segmentation with Dual Relation-Aware Attention Network. IEEE Trans. Neural Netw. Learn. Syst. 2020, 32, 2547–2560. [Google Scholar] [CrossRef]
  19. Peng, Y.; He, X.; Zhao, J. Object-Part Attention Driven Discriminative Localization for Fine-grained Image Classification. IEEE Trans. Image Process. 2017, 27, 1487–1500. [Google Scholar] [CrossRef] [PubMed]
  20. Ning, X.; Gong, K.; Li, W.J.; Zhang, L.P. JWSAA: Joint weak saliency and attention aware for person re-identification. Neurocomputing 2021, 453, 801–811. [Google Scholar] [CrossRef]
  21. Basiri, M.E.; Nemati, S.; Abdar, M.; Cambria, E.; Acharya, U. ABCDM: An attention-based bidirectional CNN-RNN deep model for sentiment analysis. Future Gener. Comput. Syst. 2021, 115, 279–294. [Google Scholar] [CrossRef]
  22. Galassi, A.; Lippi, M.; Torroni, P. Attention in Natural Language Processing. IEEE Trans. Neural Netw. Learn. Syst. 2020, 32, 4291–4308. [Google Scholar] [CrossRef]
  23. Cheng, L.B.; Li, J.; Duan, P.; Wang, M.G. A small attentional YOLO model for landslide detection from satellite remote sensing images. Landslides 2021, 18, 2751–2765. [Google Scholar] [CrossRef]
Figure 1. Location of the study area.
Drones 08 00150 g001
Figure 2. (a) FEIMA D2000 (b) D-CAM2000.
Drones 08 00150 g002
Figure 3. Field survey.
Drones 08 00150 g003
Figure 4. Original image data enhancement, (a) Original image (b) Rotate the original image by 90° (c) Horizontal flipping (d) Vertical flipping (e) Brightness adjustment (f) Contrast adjustment (g) Saturation adjustment (h) Gaussian noise.
Drones 08 00150 g004
Figure 5. YOLOv8 structure.
Drones 08 00150 g005
Figure 6. CBAM structure.
Drones 08 00150 g006
Figure 7. Channel attention module structure.
Drones 08 00150 g007
Figure 8. Spatial attention module structure.
Drones 08 00150 g008
Figure 9. Landslide identification results positioning method diagram. (a) Original orthographic image (b) Clipped images (c) Identification box.
Drones 08 00150 g009
Figure 10. Part of the landslide identification results. (ad) in the figure represents the enlarged identification results of landslides, with the marker boxes.
Drones 08 00150 g010
Figure 11. Effect of underground mining on slope body.
Drones 08 00150 g011
Figure 12. Landslide distribution in mining area.
Drones 08 00150 g012
Figure 13. July 2022–April 2023 Landslide changes in the study area.
Drones 08 00150 g013
Figure 14. Comparison of landslide areas L1–L10 in images of different periods.
Drones 08 00150 g014aDrones 08 00150 g014b
Table 1. UAV platform and aerial survey module.
D2000D-CAM2000
Take-off weight2.8 kgCamera modelSONY a6000
Standard load200 gEfficiency pixel2430 million
Endurance time74 minSensor size23.5 × 15.6 mm (aps-c)
Measurement radius20 kmCamera lens25 mm
Table 2. Data record table.
TimeFormatArea (km2)
22 July 2022TIF13.87
22 August 2022TIF13.86
22 September 2022TIF13.90
22 October 2022TIF13.75
22 November 2022TIF13.87
22 December 2022TIF13.88
23 January 2023TIF13.70
23 February 2023TIF13.82
23 March 2023TIF13.88
23 April 2023TIF13.85
Table 3. Comparison of model accuracy evaluation indexes.
ModelP/%R/%F1/%[email protected]/%
YOLOv589.387.388.392.5
YOLOv890.487.588.993.4
improved model98.396.097.197.6
Disclaimer/Publisher’s Note: The statements, opinions and data contained in all publications are solely those of the individual author(s) and contributor(s) and not of MDPI and/or the editor(s). MDPI and/or the editor(s) disclaim responsibility for any injury to people or property resulting from any ideas, methods, instructions or products referred to in the content.

