Abstract
Fusarium head blight (FHB), a severe ailment triggered by fungal pathogens, poses a considerable risk to both the yield and quality of winter wheat worldwide, underscoring the urgency for precise detection measures that can effectively mitigate and manage the spread of FHB. Addressing the limitations of current deep learning models in capturing detailed features from UAV imagery, this study proposes an advanced identification model for FHB in wheat based on multispectral imagery from UAVs. The model leverages the U2Net network as its baseline, incorporating the Coordinate Attention (CA) mechanism and the RFB-S (Receptive Field Block—Small) multi-scale feature extraction module. By integrating key spectral features from multispectral bands (SBs) and vegetation indices (VIs), the model enhances feature extraction capabilities and spatial information awareness. The CA mechanism is used to improve the model’s ability to express image features, while the RFB-S module increases the receptive field of convolutional layers, enhancing multi-scale spatial feature modeling. The results demonstrate that the improved U2Net model, termed U2Net-plus, achieves an identification accuracy of 91.73% for FHB in large-scale wheat fields, significantly outperforming the original model and other mainstream semantic segmentation models such as U-Net, SegNet, and DeepLabV3+. This method facilitates the rapid identification of large-scale FHB outbreaks in wheat, providing an effective approach for large-field wheat disease detection.
1. Introduction
FHB is a devastating disease in winter wheat caused by the fungal pathogen Fusarium graminearum [1]. This disease can lead to severe grain yield losses and a decline in food quality [2]. Additionally, the mycotoxins produced by Fusarium graminearum contaminate the grain, posing significant health risks to humans and animals [3]. In recent years, factors such as climate change and alterations in cultivation practices have contributed to the regional expansion of FHB in China, with increased frequency and disease severity indices. Consequently, FHB has become one of the most critical constraints on wheat production safety and food quality in the country [4]. On 15 September 2020, the Ministry of Agriculture and Rural Affairs of the People’s Republic of China classified FHB as a “Class I Crop Disease and Pest” [5]. Therefore, timely detection of FHB is of paramount importance for improving the management of infected fields.
However, traditional monitoring of FHB predominantly focuses on the scale of individual spikes or ears, lacking solutions that can encompass the scale of entire fields and broader regions for disease monitoring [6,7,8,9]. Although some researchers have developed remote monitoring methods for FHB in large wheat fields using specific large machinery such as tractors or utility vehicles [9,10,11], these methods are often complex, potentially damaging to crops, and challenging to implement for comprehensive and continuous field disease monitoring. In recent years, unmanned aerial vehicle (UAV) remote sensing technology has provided a new approach to field-scale disease monitoring with its flexibility, nondestructiveness, and efficiency. UAV remote sensing can quickly acquire environmental and crop growth information, playing a crucial role in smart agriculture and precision agriculture [12]. Currently, UAV remote sensing technology has been widely applied in various fields, including soil salinity assessment [13], vegetation classification [14], crop growth parameter estimation [15], yield prediction [16,17], and crop disease monitoring [18]. Additionally, some researchers have attempted to use UAV-based multispectral imagery to monitor FHB at the field scale [19]. These findings have inspired further exploration into the application of UAV-based multispectral imagery for the detection of FHB in wheat fields.
In recent years, the widespread use of multispectral imagery has provided new concepts and methods for crop disease monitoring. Infection of plants by different pathogens causes specific changes in the biochemical composition of plants, such as the content and distribution of chlorophyll, water, and cellulose. These changes lead to differences in the response of plants to spectra, such as damage to the cell wall and cell membrane due to pathogen infection, changes in cell structure affecting light scattering and absorption, impaired physiological functions such as photosynthesis altering spectral characteristics and efficiency of light use, and changes in leaf morphology and color affecting spectral response. Multispectral imaging technology can accurately detect these subtle spectral changes caused by specific pathogens, thus providing a basis for disease identification and monitoring. Compared to hyperspectral equipment, multispectral equipment has lower costs associated with purchase and maintenance. In fields such as agriculture and forestry, where there is a need for rapidly acquiring large-area surface information, multispectral imagery has broad application prospects. Rodriguez et al. [20] used five machine learning algorithms, including random forest (RF), Gradient Boosting Classifier (GB), Support Vector Machine (SVM), and k-Nearest Neighbors (KNN), to monitor potato late blight using UAV-based multispectral imagery. Ye et al. [21] applied Artificial Neural Network (ANN), RF, and SVM classification algorithms to UAV multispectral images (including blue, green, red, red-edge, and near-infrared bands) to monitor Fusarium wilt of banana. The overall accuracies of the SVM, RF, and ANN were 91.4%, 90.0%, and 91.1%. Nahrstedt et al. [22] classified clover and grass plants based on spectral information (red, green, blue, red-edge, near-infrared) from high-resolution UAV multispectral imagery and texture features from a random forest classifier, with a final overall accuracy of more than 86%. These studies emphasize the potential of UAV multispectral imaging for crop disease monitoring.
To extract more critical information on crop diseases from multispectral remote sensing data, researchers have proposed a variety of spectral features, among which vegetation indices (VIs) are the most representative. Gao et al. [23] constructed normalized difference texture index (NDTI), difference texture index (DTI), and ratio texture index (RTI) features, which are sensitive to wheat FHB, and constructed a monitoring model by using KNN and so forth to achieve a final monitoring accuracy of 93.63% for the disease. Zeng et al. [24] optimized the feature space constructed by 22 vegetation index features and 40 texture features, combined with KNN, RF, and SVM algorithms to construct a PM monitoring model for rubber trees, achieving more than 88% accuracy rate to monitor whether it is infected with rubber powdery mildew. Narmilan et al. [25] used vegetation indices, such as the Modified Soil-Adjusted Vegetation Index (MSAVI), Normalized Difference Vegetation Index (NDVI), and Excess Green (ExG) in XGBoost (XGB), random forest (RF), and decision tree (DT) to detect sugarcane white leaf disease and achieved 94% accuracy in detecting the disease using XGB and RF and KNN. Feng et al. [26] extracted thermal infrared parameters and texture features from thermal infrared images and red, green, blue (RGB) images, combined with vegetation indices from hyperspectral data, and used SVM and other algorithms to achieve detection of wheat powdery mildew. Rivera-Romero et al. [27] identified different disease levels of powdery mildew on cucurbit plants using RGB images and color transformations based on SVM with up to 94% recognition accuracy. Geng et al. [28] integrated diverse multispectral band configurations, encompassing RGB (red–green–blue), NRG (near-infrared–red–green), NER (near-infrared–red edge–red), and additional spectral bands, to conduct a comparative analysis of the segmentation performance of various algorithms, including Mask R-CNN, YOLOv5, YOLOv8, and other exemplar segmentation techniques specifically tailored for maize seedling plants. Their findings revealed that the YOLOv8 model, when applied to the NRG bands, achieved remarkable accuracy levels, surpassing 95.2% in bbox_mAP50 and 94% in segm_mAP50, demonstrating its superiority for this application. These studies demonstrate the effectiveness of VIs and RGB in crop disease monitoring. However, previous research has typically used VIs and RGB separately. The combined performance of VIs and RGB in crop disease monitoring has not been studied, indicating a potential area for further investigation.
Existing research on FHB identification in wheat predominantly employs machine learning techniques such as RF, SVM, ANN, and KNN. However, these machine learning methods face limitations when dealing with complex image tasks. Traditional machine learning methods are relatively constrained in handling high-dimensional, nonlinear, and abstract features, often requiring manual feature engineering to enhance model performance. Additionally, the performance of machine learning methods may be limited when processing large-scale data. In contrast, deep learning methods offer greater flexibility in learning abstract features directly from data, reducing the reliance on manual feature engineering. Deep learning models, through hierarchical learning, can automatically capture complex patterns and relationships within images, making them more suitable for addressing the diversity and complexity of FHB in wheat. This capability positions deep learning as a more robust approach for FHB identification, capable of handling the intricacies associated with this disease.
Based on the comprehensive review of previous studies, this research employs a deep learning approach, utilizing the U2Net neural network model that can efficiently and accurately identify target objects or features in an image. The study selects the optimal vegetation index for identifying FHB in wheat. Subsequently, the selected vegetation indices are fused with multispectral bands such as RGB, red edge (RE), and near-infrared (NIR). This fused data are then used to train a high-recognition-rate neural network classification model tailored for field-scale FHB identification in wheat fields. To address the issue of insufficient detail capture in UAV imagery by deep learning networks, this study introduces the Coordinate Attention (CA) mechanism and the RFB-S multi-scale feature extraction module to enhance the model. The CA attention mechanism highlights important spatial positions, thereby enhancing the network’s perception of local spatial details and improving reconstruction of details and edges. The RFB-S multi-scale feature extraction module extracts richer features, enhancing the network’s representational capacity and robustness. The technical flowchart adopted in this paper is shown in Figure 1.
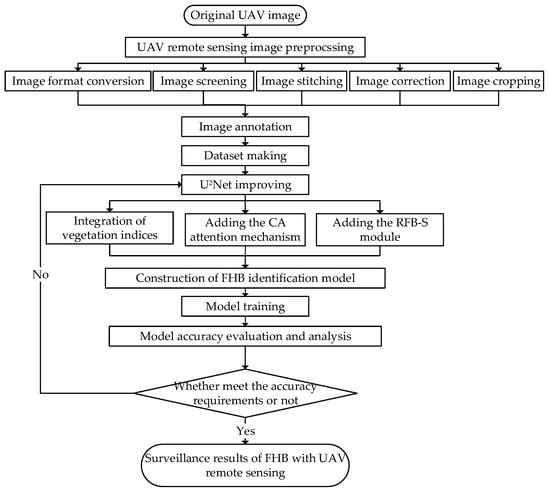
Figure 1.
Workflow diagram for FHB identification with UAV.
2. Materials and Methods
2.1. Data Acquisition
The experimental data were collected at the experimental farm of Henan Agricultural University in Xuchang City (34°08′ N, 113°47′ E), as depicted in Figure 2. The experimental field boasted a predominantly flat terrain, with the soil categorized as loam. The research area encompassed a meticulous arrangement of 60 experimental plots, neatly divided into three parallel rows, each accommodating 20 plots. Each plot measured approximately 1.5 m in length and 1 m in width. Spanning the years 2019 to 2020, the experimental wheat varieties found their way into the soil during the autumnal season. Uniformity was the cornerstone of plot management, with identical practices such as irrigation and fertilization applied across all plots.
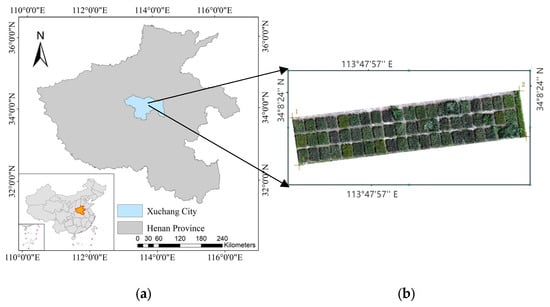
Figure 2.
Overview of the experimental area. (a) Location of Xuchang City in Henan Province. (b) Distribution and location of the experimental plots.
In the budding phase of wheat flowering, specifically in April 2021, a team of experts embarked on a precise operation. They methodically selected wheat plants from each plot at random and employed a micropipette to delicately inject a Fusarium oxysporum spore suspension into the central and upper florets of the wheat ears. Following inoculation, the ears were meticulously marked through awn cutting and subsequently enclosed in bags for a duration ranging from 1 to 7 days. The incidence of the targeted phenomenon was primarily orchestrated by a combination of artificial drip irrigation and natural cross-infection.
Data collection occurred on 18 May 2021. A DJI Phantom 4 Multispectral (SZ DJI Technology Co., Shenzhen, China) was utilized for data acquisition, as depicted in Figure 3. A DJI Phantom 4 is an integrated aerial surveying drone with multi-band imaging capabilities, capable of capturing imagery data in multiple bands [29]. The drone is equipped with six 1/2.9-inch CMOS sensors, including one color sensor for capturing true-color images and five monochrome sensors for capturing RGB, RE, and NIR bands, as detailed in Table 1. A top-mounted multispectral irradiance sensor continuously monitors the light intensity of these five bands in real time, ensuring the accuracy of captured multispectral data through compensation adjustments. The flight took place between 12:00 and 14:00 on a clear and windless day, with a flight altitude of 4 m and a ground spatial resolution of 1 cm. The shooting interval was set to 2 s, with a 75% overlap in the flight direction and a 70% overlap in the lateral direction. Each flight lasted approximately 27 min. To detect millisecond-level errors in camera imaging time, the TimeSync time synchronization system was employed for simultaneous triggering of photographs.
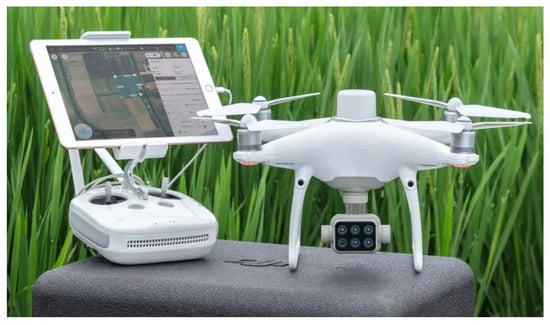
Figure 3.
Diagram of DJI Phantom 4 Multispectral. Retrieved from (https://www.dji.com/cn/p4-multispectral, accessed on 28 August 2024).

Table 1.
Band information of DJI Phantom 4 Multispectral.
2.2. Data Preprocessing
Using Pix4Dmapper (version 4.8.0), the original images captured by the drone are stitched together. Firstly, the corresponding points are identified utilizing the flight POS (Position and Orientation System) data. Then, the true positions and stitching parameters of the original images are calculated through spatio-temporal measurements to establish a point cloud model. Ultimately, utilizing the calibration panels with reflectance values of 0.25, 0.5, and 0.75, the pixel values are transformed into surface reflectance values across each spectral band, facilitating automatic calibration. This process is then optimized through image content enhancement and application of the block adjustment technique, resulting in the generation of an orthophoto map.
The orthophoto map was opened using the ENVI software (version 5.6.3), where the specific areas infected by FHB in the wheat fields were cropped out from the image and exported as TIFF-formatted image files. Subsequently, a vector file was created in the TIFF image coordinate system to annotate the target areas, and attribute fields were added. In these attribute fields, the diseased parts were set to 255, representing the infected regions, while the healthy areas were set to 128. The annotated information was effectively converted into raster data through vector-to-raster conversion. Finally, the raster data were cropped based on the range of the original TIFF images to ensure consistency between the label data and the original images. The resulting labels are shown in Figure 4.
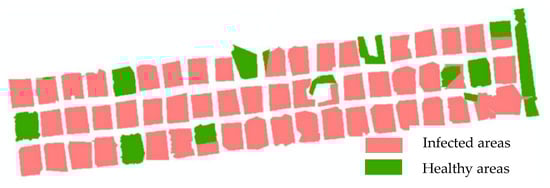
Figure 4.
Annotation information of experimental plots.
Due to the large size of the data images in this experiment, directly training them on deep networks may lead to memory overflow issues. Due to limitations in physical device performance, it is necessary to crop the images into smaller blocks before inputting them into the network. The cropping methods include regular grid cropping, sliding window cropping, and random cropping. In this experiment, the sliding window method was adopted, which is an exhaustive search image segmentation algorithm. It involves moving a fixed-size window with a fixed interval across the image [30]. The sliding window method was initially used for object detection and later applied to extract spatial and spectral information for remote sensing classification. Through sliding window segmentation, three-dimensional data blocks are extracted from the original multispectral image. In this work, these blocks must be resized to fit the GPU. Finally, a size of 64 × 64 was selected as the input dimension for the model. Since the multispectral images in the experiment need to retain geographic information such as latitude and longitude, the cropped images are not regular rectangles. It should be noted that the areas outside the AOI were ignored.
After data processing, data augmentation was performed using geometric transformation methods such as rotation, mirroring, and flipping. A total of 3212 enhanced images were obtained. The dataset of 3212 wheat multispectral images were divided into training, validation, and test sets in a ratio of 8:1:1. The final dataset comprised 2570 images for training, 321 for validation, and 321 for testing.
2.3. Experimental Environment and Parameter Configuration
The Adam Optimizer was selected as the optimizer for training the network model, with a maximum training iteration of Epoch = 100 and an initial learning rate Ir = 0.0001. If the loss on the validation set does not decrease for three consecutive epochs, the learning rate is halved, with a decay factor of 0.5. The decayed learning rate is the product of the decay factor and the current learning rate. To reduce training time, the training of the model is terminated early if the loss on the validation set does not decrease for ten consecutive epochs. A small batch size leads to prolonged training time and severe gradient oscillations, hindering convergence, while a large batch size may result in getting stuck in local minima. Considering the constraints of the physical hardware, a batch size of 16 is deemed reasonable. The specific experimental environment configuration is presented in Table 2.
Table 2.
Experimental platform configuration parameters.
2.4. Evaluation Metrics
This study evaluates the performance of the network model using evaluation metrics such as accuracy, recall, Intersection over Union (IoU), Mean Intersection over Union (MIoU), Frequency Weighted Intersection over Union (FWIoU), and F1 score. Here, TP (true positive) represents correctly classified positive instances, FP (false positive) represents negative instances misclassified as positive, TN (true negative) represents correctly classified negative instances, and FN (false negative) represents positive instances misclassified as negative.
- (1)
- Accuracy
Accuracy is the most intuitive evaluation metric. The formula for calculation is:
- (2)
- Recall
Recall measures the proportion of actual positive samples that are correctly identified as positive by the model. The formula for calculation is:
- (3)
- IoU
IoU represents the degree of overlap between the bounding box detected by the model and the bounding box of the true target. The formula for calculation is:
- (4)
- MIoU
MIoU is the average IoU across all classes, used to measure the segmentation accuracy of the model for each class and average accuracy across all classes. The formula for calculation is:
- (5)
- FWIoU
FWIoU considers the frequency weight of each class by weighting the IoU for each class, where the weight is the proportion of that class in the ground truth labels. The formula for calculation is:
- (6)
- F1
F1 is the harmonic mean of precision and recall, used to balance between these two metrics. The formula for calculation is:
3. The Design of the U2Net-Plus Network Architecture
3.1. Coordinate Attention Mechanism
Most deep neural networks use attention mechanisms like SE [31] and CBAM [32] to effectively enhance performance. However, the SE mechanism tends to overlook spatial localization information, whereas in visual tasks, the spatial structure of the object plays a crucial role. In contrast, BAM and CBAM perform global pooling over channels, only introducing short-range positional information, making it difficult to capture long-range correlations. To address this issue, a new attention mechanism called Coordinate Attention (CA) [33] is proposed, which preserves precise positional information while also capturing a wider range of contextual information. The module structure of the CA attention mechanism is illustrated in Figure 5. Here, H represents the height of the input feature map, W represents the width, C represents the number of channels, and r is the reduction ratio used to decrease computational complexity. ‘Residual’ denotes the retained input feature map. ‘X Avg Pool’ and ‘Y Avg Pool’ refer to one-dimensional horizontal and vertical global pooling, respectively. ‘Concat’ refers to the concatenation operation, while ‘Conv2d’ denotes a two-dimensional convolution. ‘BatchNorm’ is applied for batch normalization. ‘Non-liner’ denotes the utilization of a non-linear activation function. Sigmoid is an activation function. ‘Re-weight’ is the process of applying these processed weights to the original input feature map to generate the final output.
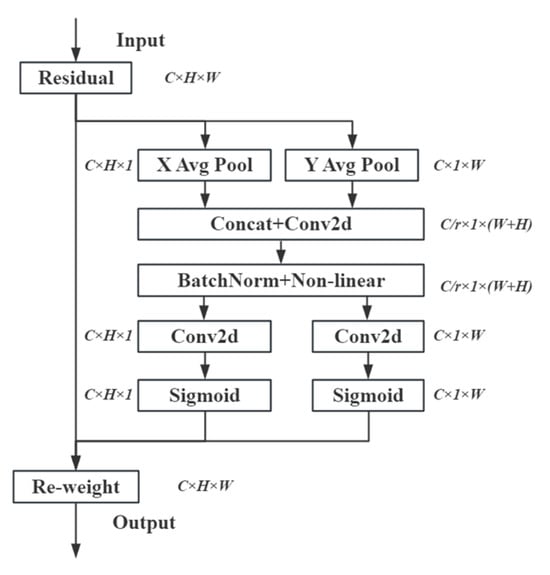
Figure 5.
Structure diagram of CA attention mechanism.
To address the limitations of channel attention, CA models both channel correlation and long-range dependencies through precise positional information. Specifically, CA consists of two steps: Coordinate Information Embedding (CIE) and Coordinate Attention Generation (CAG). CIE achieves the effect of global pooling through one-dimensional feature encoding, enabling the module to obtain precise positional information. Meanwhile, CAG fully utilizes the representations generated by CIE, allowing the network to acquire a broader range of information while effectively preserving precise positional information.
3.2. Multi-Scale Feature Extraction Module RFB-S
The RFB (Receptive Field Block) module is a module designed based on the receptive field structure, inspired by the characteristics of receptive fields in the human visual system. Receptive field refers to the area of the input image that influences the value of a single pixel in the feature map output of a neural network layer. The RFB module considers the eccentricity and size of the receptive field, allowing for a more comprehensive perception of input information at different positions.
The design goal of this module is to effectively extract highly discriminative features while using lightweight network structures. To achieve this goal, the RFB module incorporates the idea of dilated convolution in its design. Dilated convolution expands the effective receptive field of the convolutional kernel by introducing gaps between the kernel elements, allowing the module to better capture contextual information from different positions in the image.
The RFB-S (Receptive Field Block—Small) module, compared to the RFB module, has a smaller convolutional kernel size and fewer parameters, which can reduce the parameter count and computational complexity of the network to some extent. The structure diagrams of RFB and RFB-S are shown in Figure 6. Compared to RFB, RFB-S replaces the original 5 × 5 convolution with a 3 × 3 convolution. This not only reduces the number of parameters in the module but also enhances its ability to capture nonlinear relationships. Additionally, RFB-S uses 1 × 3 and 3 × 1 convolutional layers instead of the original 3 × 3 convolutional layer. In the input feature map module, the channel number is first reduced through 1 × 1 convolution, followed by 1 × 3, 3 × 1, and 3 × 3 convolutional layers to obtain multi-scale features. Finally, to expand the module’s receptive field, dilated convolutions (with dilation rates of 1, 3, and 5) are applied to the module, and feature fusion is achieved by merging the outputs of the four convolutional kernels.
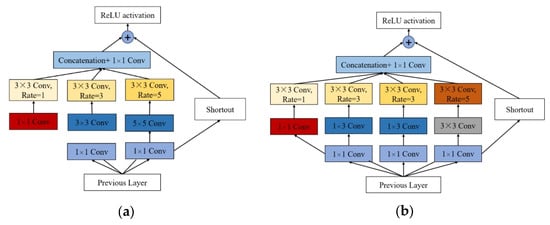
Figure 6.
Structure diagram of RFB and RFB-S: (a) structure diagram of RFB; (b) structure diagram of RFB-S.
3.3. Vegetation Indices
Vegetation indices utilize the spectral properties of vegetation by combining satellite visible and near-infrared bands to digitally reflect the vegetation status of the Earth’s surface. The Normalized Difference Vegetation Index (NDVI) is one of the most commonly used vegetation indices, which quantifies the extent and growth conditions of surface vegetation by combining satellite visible and near-infrared band data. The calculation formula is as follows:
The Enhanced Vegetation Index (EVI) is an improvement over the NDVI. In order to mitigate the influence of soil background and atmospheric interference on the NDVI, especially in dense vegetation areas, and to alleviate saturation issues, the EVI is proposed by adjusting the NDVI. It can better adapt to the effects of atmospheric and soil noise, enhance applicability in dense vegetation areas, and alleviate saturation issues in most cases. The calculation formula is as follows:
The Difference Vegetation Index-RedEdge (DVIRE) reflects the biochemical characteristics of vegetation leaves by comparing data from visible and near-infrared bands. It is primarily used for monitoring vegetation growth changes and water and nutrient status. The calculation formula is as follows:
The Normalized Difference Vegetation Index RedEdge (NDVIrededge) reflects the photosynthetic capacity and chlorophyll content of vegetation by comparing data from visible and near-infrared bands. It is commonly used for monitoring vegetation growth changes, vegetation type classification, land cover changes, and other applications. The calculation formula is as follows:
Currently, manual extraction work in agricultural remote sensing has been widely developed, especially with the establishment of various vegetation indices. However, deep learning, as a typical data-driven approach, struggles to integrate various artificial features with strong prior knowledge and theoretical analysis, thus affecting its accuracy, speed, and reliability in agricultural applications. Therefore, this paper employs the aforementioned formulas to perform inter-band operations on the input multispectral images, resulting in corresponding vegetation index feature maps. Subsequently, abnormal vegetation index values (where the denominator is zero or negative values) are removed and normalized. Finally, the processed results are merged with the original input images.
3.4. U2Net-Plus
Due to the limited spatial resolution of UAV images, it may not capture the subtle features of FHB in wheat, and the wheat spikes may occlude each other, resulting in some diseased areas not being fully presented in the images. These situations make it difficult to accurately extract targets using the U2Net network, often leading to under-segmentation or over-segmentation of the images. To address these issues, this paper proposes integrating the CA attention mechanism and the RFB-S multi-scale feature extraction module, combining multispectral bands and vegetation indices into the FHB in wheat identification model U2Net-Plus.
The U2Net architecture, as shown in Figure 7, is a deep learning network designed specifically for image segmentation tasks, aiming to accurately divide input images into multiple semantically meaningful regions [34]. U2Net adopts a two-level nested U-shaped structure, consisting of a six-stage encoder, a five-stage decoder, and a feature fusion output module that connects the final stage encoder and decoder. Each stage is filled with a well-configured RSU (Residual U-block). In this case, the encoder consists of six consecutive stages, each of which is responsible for the progressive downsampling of the input image. Downsampling is achieved by reducing the spatial resolution of the image, which helps the network to capture more abstract image features. The RSU is a specially designed network block that is able to reduce the problem of gradient vanishing during the training process through residual connectivity while maintaining feature transfer. The decoder, on the other hand, consists of five stages whose main task is to perform an upsampling operation that gradually restores the original resolution of the image. In this process, the decoder remaps the abstract features from the encoder into a higher resolution feature space. Each decoding stage also uses a well-configured RSU to ensure efficient transfer of information during the feature reconstruction process.
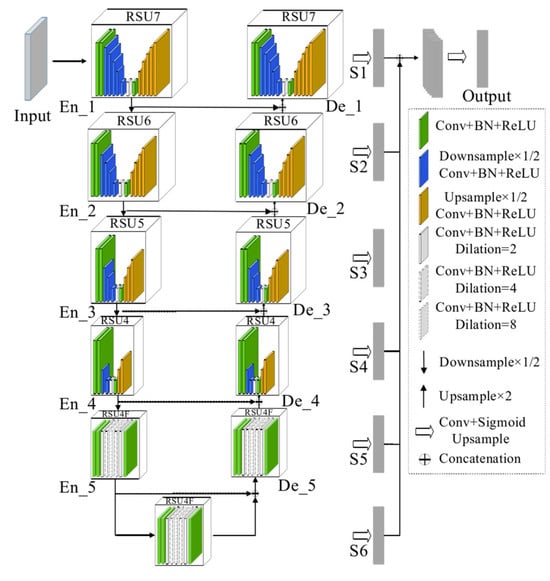
Figure 7.
Structure diagram of U2Net.
The network architecture first adopts an encoder–decoder structure, connecting the encoder (upsampling path) and decoder (downsampling path) through skip connections to maintain multi-scale information. This structure helps the network better capture both local and global information in the image. U2Net introduces depth-wise separable convolutions at various stages of the network, enabling U2Net to more effectively capture spatial and channel information in the image, thereby improving the extraction of image features. U2Net uses multiple repeated U-Net modules to further expand the receptive field and enhance its understanding of complex images. Effective strategies are employed for image upsampling and downsampling to ensure effective information processing at different scales. In addition, a feature fusion module is introduced, which concatenates the original input feature map with the feature maps generated during the encoding and decoding process via shortcut branches, enhancing the network’s perception of global information [35]. In terms of performance, U2Net stands out for its powerful feature extraction and sensitivity to image details. It accurately segments objects in images and maintains good recognition performance for fine structures. By ingeniously integrating the U-Net structure with advanced deep learning techniques, U2Net successfully addresses the complex challenges in image segmentation tasks, making it a highly regarded tool in the field of image segmentation [36].
U2Net-plus is an improvement based on U2Net. In the bottom-downsampling part of the left encoder of U2Net, this paper introduces the CA attention mechanism and the RFB-S module to enhance the extraction capability of detailed information of the target, better capture tiny features in the image, and improve the localization ability of target edges, thereby improving the segmentation accuracy of the results. The structural diagram of the improved network U2Net-plus is shown in Figure 8. Since the encoder is responsible for progressively extracting semantic information and edge features from the image, introducing the RFB-S module can enhance the segmentation accuracy and receptive field of the network while reducing the computational complexity. Introducing the CA attention mechanism allows the network to focus more on important spatial positions, enhancing the expressive and perceptual capabilities of features.
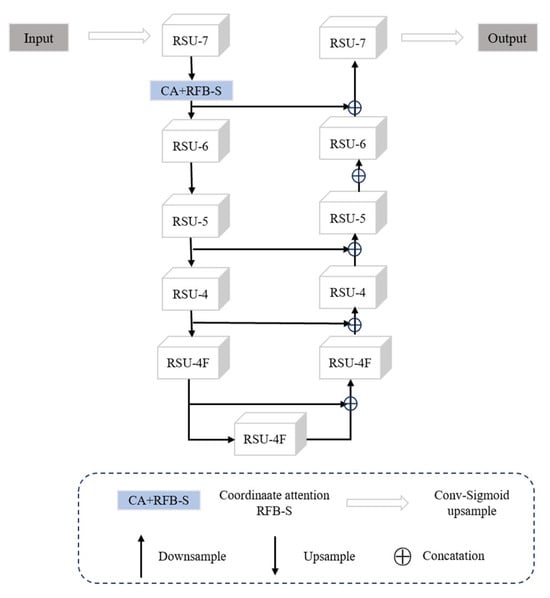
Figure 8.
Structure diagram of the improved U2Net-plus.
Specifically, in the encoding part of the network, after passing through the RSU-7 module, the input feature map introduces the RFB-S module and the CA module in the downsampling part. In the RFB-S module, by introducing convolutional kernels of different scales and smaller parameter sizes, as well as using dilated convolutions and multi-scale convolutional kernels, the output image is inputted into the CA module. In the CA module, by encoding the feature map, a pair of feature maps with directional awareness and position sensitivity are obtained. One feature map captures long-range dependencies, while the other feature map retains precise positional information. These two types of feature maps complement each other and are applied to the input feature map, thereby enhancing the representation capability of the object of interest. The output feature map is then used for feature extraction in the next stage of the RSU module, followed by upsampling using bilinear interpolation.
4. Results
4.1. Analysis of Vegetation Index Selection Results
Different vegetation indices have different sensitivities to plant physiological characteristics. Therefore, the selection of appropriate vegetation indices can more accurately reflect the physiological changes caused by FHB in wheat. In this study, by testing the performance of four vegetation indices, as outlined in Section 3.3, in different combinations with multispectral bands fused models, the optimal vegetation indices for monitoring FHB in wheat were selected to improve the accuracy and practicality of the model. The experiments were conducted based on the RGB + RE + NIR five spectral bands, incorporating the CA attention mechanism and RFB-S module.
The experimental results are shown in Table 3. In terms of accuracy, NDVI alone has a higher accuracy compared to other single indices, indicating the effectiveness of NDVI in reflecting vegetation health status. When combined with EVI, the accuracy further increased to 91.73%, the highest among all combinations of vegetation indices, indicating that the combination of the two can provide more comprehensive vegetation health information. Observing recall and F1 scores, the NDVI + EVI combination also showed high values, indicating that this combination can accurately segment the target of interest while maintaining a low false positive rate and a high accuracy in recall. IoU and MIoU are used to evaluate the overlap between predicted and true regions. In both of these metrics, the NDVI + EVI combination performed well, especially in MIoU, reflecting the consistency and stability of this combination across all classes. The FWIoU metric reflects the Accuracy of each class in semantic segmentation, and on this metric, the NDVI + EVI combination still maintained high performance, indicating that this combination can provide more accurate monitoring results for important classes.
Table 3.
Performance comparison of different vegetation indices.
In summary, the NDVI + EVI combination performed well on various evaluation metrics, demonstrating its superiority in monitoring wheat FHB. Therefore, this study chooses to fuse the NDVI and EVI vegetation indices with multispectral bands.
4.2. Analysis of Ablation Experiment Results
The U2Net-plus model proposed in this chapter improves on the original U2Net model in three aspects: first, the fusion of multispectral bands (SBs) with vegetation indices (VIs); second, the addition of the CA attention mechanism; and third, the introduction of the multi-scale feature extraction module RFB-S. To analyze the impact of the various improvement methods proposed in this algorithm on the segmentation results of wheat fusarium head blight, ablation experiments were designed for evaluation. The ablation experiments were divided into five groups: the first group used the original U2Net model, the second group added the CA attention mechanism to the U2Net network, the third group added the RFB-S module to the U2Net network, the fourth group fused vegetation indices on the basis of multispectral bands, and the fifth group simultaneously added the CA attention mechanism, introduced the RFB-S module, and fused vegetation indices. The training parameters used in the experiments were consistent. The specific results of the ablation experiments are shown in Table 4.
Table 4.
Comparison of ablation experimental results.
The original U2Net model, serving as the baseline, demonstrated the initial performance of wheat fusarium head blight segmentation, with an accuracy of 83.26%. After introducing the CA attention mechanism, the model showed improvements in all performance metrics, with the accuracy increasing to 84.45%. Recall and F1 also increased correspondingly, indicating the enhancement of the attention mechanism on critical features. Next, when only the RFB-S module was added, the accuracy slightly increased to 84.32%, and there was a significant growth in F1 and recall, indicating the positive impact of the RFB-S module on the wheat FHB segmentation task in handling multi-scale features. In another experiment group, by fusing multispectral bands with vegetation indices, the model’s performance was significantly improved, with the accuracy jumping to 89.51%, demonstrating the effectiveness of this fusion strategy in enhancing the model’s ability to identify fusarium blight. Finally, when the fusion of the CA attention mechanism, RFB-S module, and vegetation indices was combined, the model achieved the best performance on all metrics, with an accuracy of 91.73%. This result emphasizes the synergistic effect of composite strategies in improving model performance and demonstrates the importance of fine-tuning model structures for specific tasks. This comprehensive improvement method not only significantly improves segmentation accuracy but also achieves the best results in recall and F1 metrics, indicating the superiority of this method in identifying diseased areas.
4.3. Analysis of Performance Comparison Results of Different Models
To evaluate the effectiveness and rationality of the improved U2Net-plus network, this paper compares it with mainstream deep learning segmentation networks SegNet, U-Net, DeepLabV3+, and the original U2Net model through experiments. These networks are trained on the same dataset and tested on the same test set. Subsequently, the segmentation results are evaluated using the same evaluation metrics to qualitatively analyze their model performance. The results are shown in Table 5.
Table 5.
Comparison of experimental results of various models.
For U2Net-plus, as an improved version of U2Net, all evaluation metrics have been significantly improved and outperform other models, with an accuracy of 91.73%, recall of 87.29%, F1 score of 87.51%, and IoU of 78.36%. These data indicate that U2Net-plus has high generalization ability and accuracy in this task, significantly outperforming other comparative models. In comparison, the U-Net model also demonstrates a considerable accuracy of 87.25%. Although slightly lower than U2Net-plus, its robust performance still demonstrates effective identification capabilities for FHB in wheat disease images. Relatively, the performance of the SegNet and DeepLabV3+ models is less satisfactory for this task. SegNet has an accuracy of 82.14%, surpassing DeepLabV3+’s 79.36% but still lower than U-Net and U2Net-plus. Its performance limitation stems from its simple encoder–decoder network structure, which fails to capture sufficient contextual information and details when dealing with complex rust disease images. DeepLabV3+ performs the worst in terms of performance because although it has a more complex network structure and parameter quantity, its use of depth-wise separable convolution and dilated convolution cannot learn generalized feature representations when the training data are insufficient, making it prone to overfitting on small sample datasets.
5. Discussion
5.1. Selection of the U2Net Model
U2Net is selected for monitoring FHB in wheat based on UAV remote sensing imagery due to its exceptional image segmentation capabilities, specifically designed to accurately delineate objects within an image. Its nested U-shaped architecture with Residual U-blocks (RSUs) facilitates comprehensive multi-scale feature extraction, capturing both local and global features essential for identifying disease symptoms at various scales. U2Net’s ability to handle fine-grained segmentation and its proven performance in segmentation benchmarks make it ideal for detecting the subtle and varied manifestations of FHB. Additionally, U2Net’s flexibility for incorporating enhancements, such as CA mechanisms and RFB-S multi-scale feature extraction modules, further improves its ability to focus on relevant features and capture spatial dependencies, thereby enhancing the accuracy and reliability of FHB detection in agricultural applications.
5.2. Selection of the CA Mechanism
In this study, the choice to introduce the CA mechanism in improving U2Net was motivated by the fact that although most deep neural networks employ attention mechanisms, such as SE, BAM, and CBAM, to effectively enhance network performance, in the context of UAV multispectral remote sensing image recognition, accurate spatial positional information is equally crucial alongside channel correlations for target identification. However, the SE mechanism has a drawback of potentially overlooking spatial localization information. While BAM and CBAM perform global pooling on channels, they still struggle to capture long-range contextual information, thereby limiting their applicability in UAV imagery. To address this issue, the study opted for the Coordinate Attention mechanism, known as Coordinate Attention. This attention mechanism not only effectively preserves precise positional information but also enables the extraction of a broader range of contextual information, thereby facilitating improved network performance, particularly suitable for accurately capturing target locations and surrounding environmental features in UAV multispectral remote sensing imagery.
5.3. Selection of the Vegetation Indices
To determine the optimal vegetation indices for monitoring FHB in wheat, the effects of combining four specific vegetation indices—NDVI, DVIRE, EVI, and NDVIrededge—with multispectral bands on model performance were tested. These indices were selected over others due to their proven effectiveness in prior research which demonstrated that NDVI and EVI are reliable spectral features for classifying healthy and FHB-affected wheat. Additionally, DVIRE and NDVIrededge are highly sensitive to changes in vegetation health and physiological characteristics, enabling the detection of areas impacted by FHB. This comprehensive analysis supports the selection of these four vegetation indices for identifying the most effective combination for monitoring FHB in wheat.
5.4. Application and Scalability
U2Net-plus’s ability to accurately segment fine-grained details in images stems from its deep hierarchical architecture and nested U-structure. This structure enables the model to capture both low-level and high-level semantic features, which are crucial for identifying disease symptoms, crop growth stages, or nutrient deficiencies across different plant species. As such, the model can potentially be fine-tuned or retrained with datasets specific to other crops, allowing it to generalize its segmentation capabilities.
Given the abundance of labeled data for certain crops and the scarcity for others, transfer learning becomes a powerful tool to extend U2Net-plus’s applicability. By pre-training the model on a large, diverse dataset (e.g., ImageNet) and then fine-tuning it on a smaller, targeted dataset of a specific crop, the model can rapidly adapt to the unique visual characteristics of that crop. This approach has proven effective in numerous computer vision tasks and can significantly reduce the need for extensive data collection and labeling efforts for each new crop.
However, there are many potential challenges in deployment. As with any machine learning model, the quality and quantity of training data directly impact U2Net-plus’s performance. For less common or specialized crops, obtaining sufficient labeled images can be challenging and costly. Moreover, variability in imaging conditions (e.g., lighting, weather, camera angles) can introduce noise into the dataset, affecting the model’s accuracy.
Agricultural landscapes vary significantly in terms of soil type, climate, and irrigation practices, all of which can affect the appearance of crops. U2Net-plus’s robustness to these variations needs to be rigorously tested and potentially enhanced through data augmentation or more sophisticated domain adaptation techniques.
6. Conclusions
This study proposes an improved U2Net-plus unmanned aerial vehicle multispectral remote sensing wheat stripe rust identification model to achieve rapid monitoring of wheat stripe rust in large-scale farmland and improve the accuracy of wheat stripe rust monitoring at the field scale. By introducing the CA coordinate attention mechanism, integrating the multi-scale feature extraction module RFB-S, and combining the key spectral features of multispectral bands with the optimal vegetation index, this model is based on the semantic segmentation model U2Net. The following conclusions can be drawn through comparative analysis of experimental results:
- (1)
- By fusing multispectral bands with different combinations of four vegetation indices, namely NDVI, DVIRE, EVI and NDVIrededge, the most favorable vegetation index combination for monitoring FHB was selected, namely NDVI + EVI. After fusing this vegetation index combination, the monitoring accuracy rate increased to 91.73%, which was improved compared with 84.17% before the vegetation index was not fused.
- (2)
- After combining the multispectral bands with the optimal vegetation index, this paper continued to improve the original U-Net model by introducing the CA attention mechanism and the multi-scale feature extraction model RFB-S. The effectiveness of the improvement was verified through a series of ablation experiments. After the improvement, the monitoring accuracy of FHB increased from 89.51% to 91.73%, an increase of 1.86%.
- (3)
- Compared with the traditional image segmentation network SegNet (82.14%), DeepLabV3+ (79.36%), U-Net (87.25%), and the original model U2Net (83.26%), the improved model U2Net-plus has significantly higher accuracy. The rapid improvement fully confirms the great potential and effectiveness of the combination of deep learning and multispectral remote sensing technology in the field of agricultural disease monitoring.
This achievement provides an efficient and pragmatic novel methodology for monitoring diseases in medium-sized farmlands, spanning from tens to hundreds of hectares, with the potential to significantly contribute to precision agriculture management practices. Notably, despite the current constraints on UAV coverage, technological advancements and cost reductions herald a promising future where multifaceted strategies—encompassing the deployment of multiple UAVs for coordinated missions and seamless integration with satellite data—will broaden UAV reach and enhance the scalability of the monitoring system, thereby revolutionizing disease surveillance in agriculture.
Furthermore, the utilization of time series analysis represents a promising research direction in the future. Developing multispectral data analysis methods based on time series can be leveraged to monitor the development trends and transmission patterns of FHB. It is also crucial to explore identification methods for FHB in wheat at different stages, enabling timely interventions during various periods of disease occurrence.
Author Contributions
Conceptualization, P.D.; methodology, P.D. and H.Q.; software, M.W. and K.L.; validation, P.D. and M.W.; formal analysis, M.W.; investigation, M.W. and K.L.; resources, W.G.; data curation, P.D. and L.S.; writing—original draft preparation, M.W.; writing—review and editing, P.D. and F.B.; visualization, Y.Z.; supervision, H.S.; project administration, H.Q., P.D. and H.S.; funding acquisition, H.Q., P.D., L.S. and W.G. All authors have read and agreed to the published version of the manuscript.
Funding
This research was funded by the Key Research and Development Project of Henan Province, China (241111110800); Natural Science Foundation of Henan Province, China (232300420186); Key Scientific and Technological Project of Henan Province (242102111193); National Natural Science Foundation of China (32271993); Joint Fund of Science and Technology Research Development program (Cultivation project of preponderant discipline) of Henan Province, China (222301420113, 222301420114); Key Research and Development Project of Henan Province, China (231111110100); and Henan Center for Outstanding Overseas Scientists (Project No. GZS2024006). FCT (Fundação para a Ciência e a Tecnologia), under the project-UIDB/04152/2020-Centro de Investigação em Gestão de Informação (MagIC)/NOVA IMS).
Data Availability Statement
Data are contained within the article.
Conflicts of Interest
The authors declare no conflicts of interest.
References
- Feng, G.; Gu, Y.; Wang, C.; Zhou, Y.; Huang, S.; Luo, B. Wheat Fusarium Head Blight Automatic Non-Destructive Detection Based on Multi-Scale Imaging: A Technical Perspective. Plants 2024, 13, 1722. [Google Scholar] [CrossRef]
- Shi, L.; Liu, Z.; Yang, C.; Lei, J.; Wang, Q.; Yin, F.; Wang, J. Lightweight U-Net-Based Method for Estimating the Severity of Wheat Fusarium Head Blight. Agriculture 2024, 14, 938. [Google Scholar] [CrossRef]
- Janaviciene, S.; Suproniene, S.; Kadziene, G.; Pavlenko, R.; Berzina, Z.; Bartkevics, V. Toxigenicity of F. graminearum Residing on Host Plants Alternative to Wheat as Influenced by Environmental Conditions. Toxins 2022, 14, 541. [Google Scholar] [CrossRef]
- Buttar, Z.A.; Cheng, M.; Wei, P.; Zhang, Z.; Lv, C.; Zhu, C.; Ali, N.F.; Kang, G.; Wang, D.; Zhang, K. Update on the Basic Understanding of Fusarium graminearum Virulence Factors in Common Wheat Research. Plants 2024, 13, 1159. [Google Scholar] [CrossRef]
- Ministry of Agriculture and Rural Affairs of the People’s Republic of China. Announcement No. 333 of the Ministry of Agriculture and Rural Affairs of the People’s Republic of China. Available online: http://www.moa.gov.cn/govpublic/ZZYGLS/202009/t20200917_6352227.htm (accessed on 28 August 2024).
- Zhang, J.; Huang, Y.; Pu, R.; Moreno, G.P.; Yuan, L.; Wu, K.; Huang, W. Monitoring plant diseases and pests through remote sensing technology: A review. Comput. Electron. Agric. 2019, 165, 104943. [Google Scholar] [CrossRef]
- Zhang, D.Y.; Chen, G.; Yin, X.; Hu, R.J.; Gu, C.Y.; Pan, Z.G.; Zhou, X.G.; Chen, Y. Integrating spectral and image data to detect Fusarium head blight of wheat. Comput. Electron. Agric. 2020, 175, 105588. [Google Scholar] [CrossRef]
- Gu, C.; Wang, D.; Zhang, H.; Zhang, J.; Zhang, D.; Liang, D. Fusion of deep convolution and shallow features to recognize the severity of wheat Fusarium head blight. Front. Plant Sci. 2020, 11, 599886. [Google Scholar] [CrossRef] [PubMed]
- Jin, X.; Jie, L.; Wang, S.; Qi, H.J.; Li, S.W. Classifying Wheat Hyperspectral Pixels of Healthy Heads and Fusarium Head Blight Disease Using a Deep Neural Network in the Wild Field. Remote Sens. 2018, 10, 395. [Google Scholar] [CrossRef]
- Whetton, R.L.; Waine, T.W.; Mouazen, A.M. Hyperspectral measurements of yellow rust and fusarium head blight in cereal crops: Part 2: On-line field measurement. Biosyst. Eng. 2018, 167, 144–158. [Google Scholar] [CrossRef]
- Dammer, K.H.; Möller, B.; Rodemann, B.; Heppner, D. Detection of head blight (Fusarium ssp.) in winter wheat by color and multispectral image analyses. Crop Prot. 2011, 30, 420–428. [Google Scholar] [CrossRef]
- Boursiani, A.D.; Papadopoulou, M.S.; Diamantoulakis, P.; Tsakalidi, A.L.; Barouchas, P.; Salahas, G.; Karagiannidis, G.; Wan, S.; Goudos, S.K. Internet of Things (IoT) and Agricultural Unmanned Aerial Vehicles (UAVs) in smart farming: A comprehensive review. Internet Things 2022, 18, 100187. [Google Scholar] [CrossRef]
- Tan, J.; Ding, J.; Wang, Z.; Han, L.; Wang, X.; Li, Y.; Zhang, Z.; Meng, S.; Cai, W.; Hong, Y. Estimating soil salinity in mulched cotton fields using UAV-based hyperspectral remote sensing and a Seagull Optimization Algorithm-Enhanced Random Forest Model. Comput. Electron. Agric. 2024, 221, 109017. [Google Scholar] [CrossRef]
- Wang, G.; Chen, J.; Mo, L.; Wu, P.; Yi, X. Border-Enhanced Triple Attention Mechanism for High-Resolution Remote Sensing Images and Application to Land Cover Classification. Remote Sens. 2024, 16, 2814. [Google Scholar] [CrossRef]
- Tao, H.; Feng, H.; Xu, L.; Miao, M.; Long, H.; Yue, J.; Li, Z.; Yang, G.; Yang, X.; Fan, L. Estimation of Crop Growth Parameters Using UAV-Based Hyperspectral Remote Sensing Data. Sensors 2020, 20, 1296. [Google Scholar] [CrossRef] [PubMed]
- de Villiers, C.; Mashaba-Munghemezulu, Z.; Munghemezulu, C.; Chirima, G.J.; Tesfamichael, S.G. Assessing Maize Yield Spatiotemporal Variability Using Unmanned Aerial Vehicles and Machine Learning. Geomatics 2024, 4, 213–236. [Google Scholar] [CrossRef]
- Maimaitijiang, M.; Sagan, V.; Sidike, P.; Hartling, S.; Esposito, F.; Fritschi, F. Soybean yield prediction from UAV using multimodal data fusion and deep learning. Remote Sens. Environ. 2020, 237, 111599. [Google Scholar] [CrossRef]
- Joshi, P.; Sandhu, K.; Dhillon, G.S.; Chen, J.; Bohara, K. Detection and monitoring wheat diseases using unmanned aerial vehicles (UAVs). Comput. Electron. Agric. 2024, 224, 109158. [Google Scholar] [CrossRef]
- Liu, L.; Dong, Y.; Huang, W.; Du, X.; Ma, H. Monitoring Wheat Fusarium Head Blight Using Unmanned Aerial Vehicle Hyperspectral Imagery. Remote Sens. 2020, 12, 3811. [Google Scholar] [CrossRef]
- Rodriguez, J.; Lizarazo, I.; Prieto, F.; Morales, V.A. Assessment of potato late blight from UAV-based multispectral imagery. Comput. Electron. Agric. 2021, 184, 106061. [Google Scholar] [CrossRef]
- Ye, H.; Huang, W.; Huang, S.; Cui, B.; Dong, Y.; Guo, A.; Ren, Y.; Jin, Y. Identification of banana fusarium wilt using supervised classification algorithms with UAV-based multi-spectral imagery. Int. J. Agric. Biol. Eng. 2020, 13, 136–142. [Google Scholar] [CrossRef]
- Nahrstedt, K.; Reuter, T.; Trautz, D.; Waske, B.; Jarmer, T. Classifying Stand Compositions in Clover Grass Based on High-Resolution Multispectral UAV Images. Remote Sens. 2024, 16, 2684. [Google Scholar] [CrossRef]
- Gao, C.; Ji, X.; He, Q.; Gong, Z.; Sun, H.; Wen, T.; Guo, W. Monitoring of Wheat Fusarium Head Blight on Spectral and Textural Analysis of UAV Multispectral Imagery. Agriculture 2023, 13, 293. [Google Scholar] [CrossRef]
- Zeng, T.; Fang, J.; Yin, C.; Li, Y.; Fu, W.; Zhang, H.; Wang, J.; Zhang, X. Recognition of Rubber Tree Powdery Mildew Based on UAV Remote Sensing with Different Spatial Resolutions. Drones 2023, 7, 533. [Google Scholar] [CrossRef]
- Narmilan, A.; Gonzalez, F.; Salgadoe, A.S.A.; Powell, K. Detection of White Leaf Disease in Sugarcane Using Machine Learning Techniques over UAV Multispectral Images. Drones 2022, 6, 230. [Google Scholar] [CrossRef]
- Feng, Z.; Song, L.; Duan, J.; He, L.; Zhang, Y.; Wei, Y.; Feng, W. Monitoring Wheat Powdery Mildew Based on Hyperspectral, Thermal Infrared, and RGB Image Data Fusion. Sensors 2022, 22, 31. [Google Scholar] [CrossRef] [PubMed]
- Rivera-Romero, C.A.; Palacios-Hernández, E.R.; Vite-Chávez, O.; Reyes-Portillo, I.A. Early-Stage Identification of Powdery Mildew Levels for Cucurbit Plants in Open-Field Conditions Based on Texture Descriptors. Inventions 2024, 9, 8. [Google Scholar] [CrossRef]
- Geng, T.; Yu, H.; Yuan, X.; Ma, R.; Li, P. Research on Segmentation Method of Maize Seedling Plant Instances Based on UAV Multispectral Remote Sensing Images. Plants 2024, 13, 1842. [Google Scholar] [CrossRef]
- Xie, Y.H.; Shi, J.K.; Sun, X.H.; Wu, W.J.; Li, X.W. Xisha Vegetation Monitoring based on UAV Multispectral Images Obtained with the DJI Phantom 4 Platform. Remote Sens. Technol. Appl. 2022, 37, 1170–1178. [Google Scholar]
- Gaur, P.; Gupta, H.; Chowdhury, A.; McCreadie, K.; Pachori, R.B.; Wang, H. A Sliding Window Common Spatial Pattern for Enhancing Motor Imagery Classification in EEG-BCI. IEEE Trans. Instrum. Meas. 2021, 70, 1–9. [Google Scholar] [CrossRef]
- Hu, J.; Shen, L.; Albanie, S.; Sun, G.; Wu, E. Squeeze-and-excitation networks. In Proceedings of the 2018 IEEE/CVF Conference on Computer Vision and Pattern Recognition, Salt Lake City, UT, USA, 18–23 June 2018; pp. 7132–7141. [Google Scholar]
- Woo, S.; Park, J.; Lee, J.Y.; Kweon, I.S. CBAM: Convolutional block attention module. In Proceedings of the Computer Vision-ECCV, Munich, Germany, 8–14 September 2018. [Google Scholar] [CrossRef]
- Liu, J. Jenss–Bayley Latent Change Score Model with Individual Ratio of the Growth Acceleration in the Framework of Individual Measurement Occasions. J. Educ. Behav. Stat. 2021, 47, 507–543. [Google Scholar] [CrossRef]
- Qin, X.; Zhang, Z.; Huang, C.; Dehghan, M.; Zaiane, O.R.; Jagersand, M. U2-Net: Going deeper with nested U-structure for salient object detection. Pattern Recognit. 2020, 106, 107404. [Google Scholar] [CrossRef]
- Shu, X.F.; Wu, X.H.; Qin, L.B.; Luo, B.B. Image Segmentation of Rock Thin Sections Based on Improved U2Net. Comput. Syst. Appl. 2024, 33, 159–165. [Google Scholar]
- Su, J.; Liu, C.; Coombes, M.; Hu, X.; Wang, C.; Xu, X.; Li, Q.; Guo, L.; Chen, W. Wheat yellow rust monitoring by learning from multispectral UAV aerial imagery. Comput. Electron. Agric. 2018, 155, 157–166. [Google Scholar] [CrossRef]
Disclaimer/Publisher’s Note: The statements, opinions and data contained in all publications are solely those of the individual author(s) and contributor(s) and not of MDPI and/or the editor(s). MDPI and/or the editor(s) disclaim responsibility for any injury to people or property resulting from any ideas, methods, instructions or products referred to in the content. |
© 2024 by the authors. Licensee MDPI, Basel, Switzerland. This article is an open access article distributed under the terms and conditions of the Creative Commons Attribution (CC BY) license (https://creativecommons.org/licenses/by/4.0/).