Article

A Lightweight Real-Time Infrared Object Detection Model Based on YOLOv8 for Unmanned Aerial Vehicles

College of Information Science and Technology, Donghua University, Shanghai 201620, China
*
Author to whom correspondence should be addressed.
Drones 2024, 8(9), 479; https://doi.org/10.3390/drones8090479
Submission received: 3 August 2024 / Revised: 10 September 2024 / Accepted: 10 September 2024 / Published: 12 September 2024

Abstract

:
Deploying target detection models on edge devices such as UAVs is challenging due to their limited size and computational capacity, while target detection models typically require significant computational resources. To address this issue, this study proposes a lightweight real-time infrared object detection model named LRI-YOLO (Lightweight Real-time Infrared YOLO), which is based on YOLOv8n. The model improves the C2f module’s Bottleneck structure by integrating Partial Convolution (PConv) with Pointwise Convolution (PWConv), achieving a more lightweight design. Furthermore, during the feature fusion stage, the original downsampling structure with ordinary convolution is replaced with a combination of max pooling and regular convolution. This modification retains more feature map information. The model’s structure is further optimized by redesigning the decoupled detection head with Group Convolution (GConv) instead of ordinary convolution, significantly enhancing detection speed. Additionally, the original BCELoss is replaced with EMASlideLoss, a newly developed classification loss function introduced in this study. This loss function allows the model to focus more on hard samples, thereby improving its classification capability. Compared to the YOLOv8n algorithm, LRI-YOLO is more lightweight, with its parameters reduced by 46.7% and floating-point operations (FLOPs) reduced by 53.1%. Moreover, the mean average precision (mAP) reached 94.1%. Notably, on devices with moderate computational power that only have a Central Processing Unit (CPU), the detection speed reached 42 frames per second (FPS), surpassing most mainstream models. This indicates that LRI-YOLO offers a novel solution for real-time infrared object detection on edge devices such as drones.

1. Introduction

With technological advancements, Unmanned Aerial Vehicles (UAVs) have emerged as a cutting-edge platform for image acquisition. Due to their small size, flexible and variable flight altitudes, good concealment, high efficiency, and relatively low cost [1], UAVs are increasingly utilized in both civilian and military environments. The use of drones allows for efficient and flexible data collection over large or inaccessible areas, making them a valuable tool for tasks that benefit from an aerial perspective [2]. UAVs are commonly paired with object detection algorithms and have broad applications in fields such as military reconnaissance [3], disaster search and rescue [4,5], traffic surveillance [6,7,8], road planning [9], and daily life [10]. However, when using traditional visible light images for detection, performance can be significantly affected by weather and light conditions. This is especially problematic in nighttime environments, where issues such as insufficient brightness, loss of detail, and reduced contrast may arise [11]. Infrared imaging can overcome these shortcomings. Infrared imaging technology offers advantages such as resistance to interference, long detection range, and all-weather capabilities, allowing detection tasks to be completed at night or under adverse weather conditions [12,13]. Consequently, with the advancement of deep learning, infrared object detection using UAVs has become a rapidly growing field of research.
Implementing target detection tasks on UAVs requires processing computations and storing data directly on UAV nodes [14]. This necessitates equipping UAVs with high-performance computing resources. However, due to their small size and cost considerations, the computational capabilities of UAVs are typically limited. Deploying object detection algorithms directly on edge devices such as drones brings computational resources closer to the user, reducing communication latency and overhead [15]. Current mainstream object detection models are characterized by large parameter sizes and slow detection speeds, making it difficult to meet real-time demands when deployed on edge devices with constrained computational resources, such as UAVs. Consequently, this paper aims to streamline the structure of detection models, reducing their size to achieve efficient detection with minimal computational resources.
Given the typically small size of targets in UAV aerial imagery, often less than 32 × 32 pixels, most of these objects are classified as small objects [16] and provide limited informational content. This presents a significant challenge for UAV infrared object detection. Traditional object detection methods identify objects by combining sliding windows, feature extraction techniques, and feature classifiers. These algorithms have limited feature representation capabilities, struggle with scale variations, and involve high computational costs and slow detection speeds when using sliding windows. Conversely, deep learning object detection algorithms provide outstanding detection performance and can be updated as necessary [17], which enhances the accuracy and efficiency of infrared target detection [18]. In recent years, deep learning-based object detection technologies have developed rapidly [19,20,21]. Deep learning detection algorithms are generally classified into two-stage algorithms and one-stage algorithms. Two-stage algorithms include RCNN [22], Fast-RCNN [23], and Faster-RCNN [24]. Research has shown that two-stage algorithms are appropriate for scenarios requiring high accuracy [25,26]. One-stage algorithms, such as the SSD [27] and YOLO series [28,29,30,31], directly infer class probabilities and bounding box positions. One-stage algorithms are quicker than two-stage algorithms because they eliminate the need to generate a large quantity of candidate boxes, making them more efficient and better suited for UAV platform usage scenarios. Among these, the YOLO series of algorithms, after years of improvement, has demonstrated satisfactory performance in real-time detection and classification of multiple objects [32].
To improve the speed of detecting infrared objects on mobile devices like UAVs, this paper proposes a new model called LRI-YOLO. We introduce Faster-C2f to optimize the backbone and neck networks of YOLOv8, reducing computational resource consumption and accelerating inference speed while enhancing the detection performance. The Super-Downsample structure replaces the standard convolution downsampling structure in the neck, preserving richer object feature information and improving detection accuracy. Additionally, the convolutional layers in the original detection head are optimized, and a novel detection head structure, Efficient-Head, is implemented to substantially decrease the model’s FLOPs and parameters. Finally, the EMASlideLoss function enhances the model’s classification capabilities.
The main contributions of this study are summarized below:
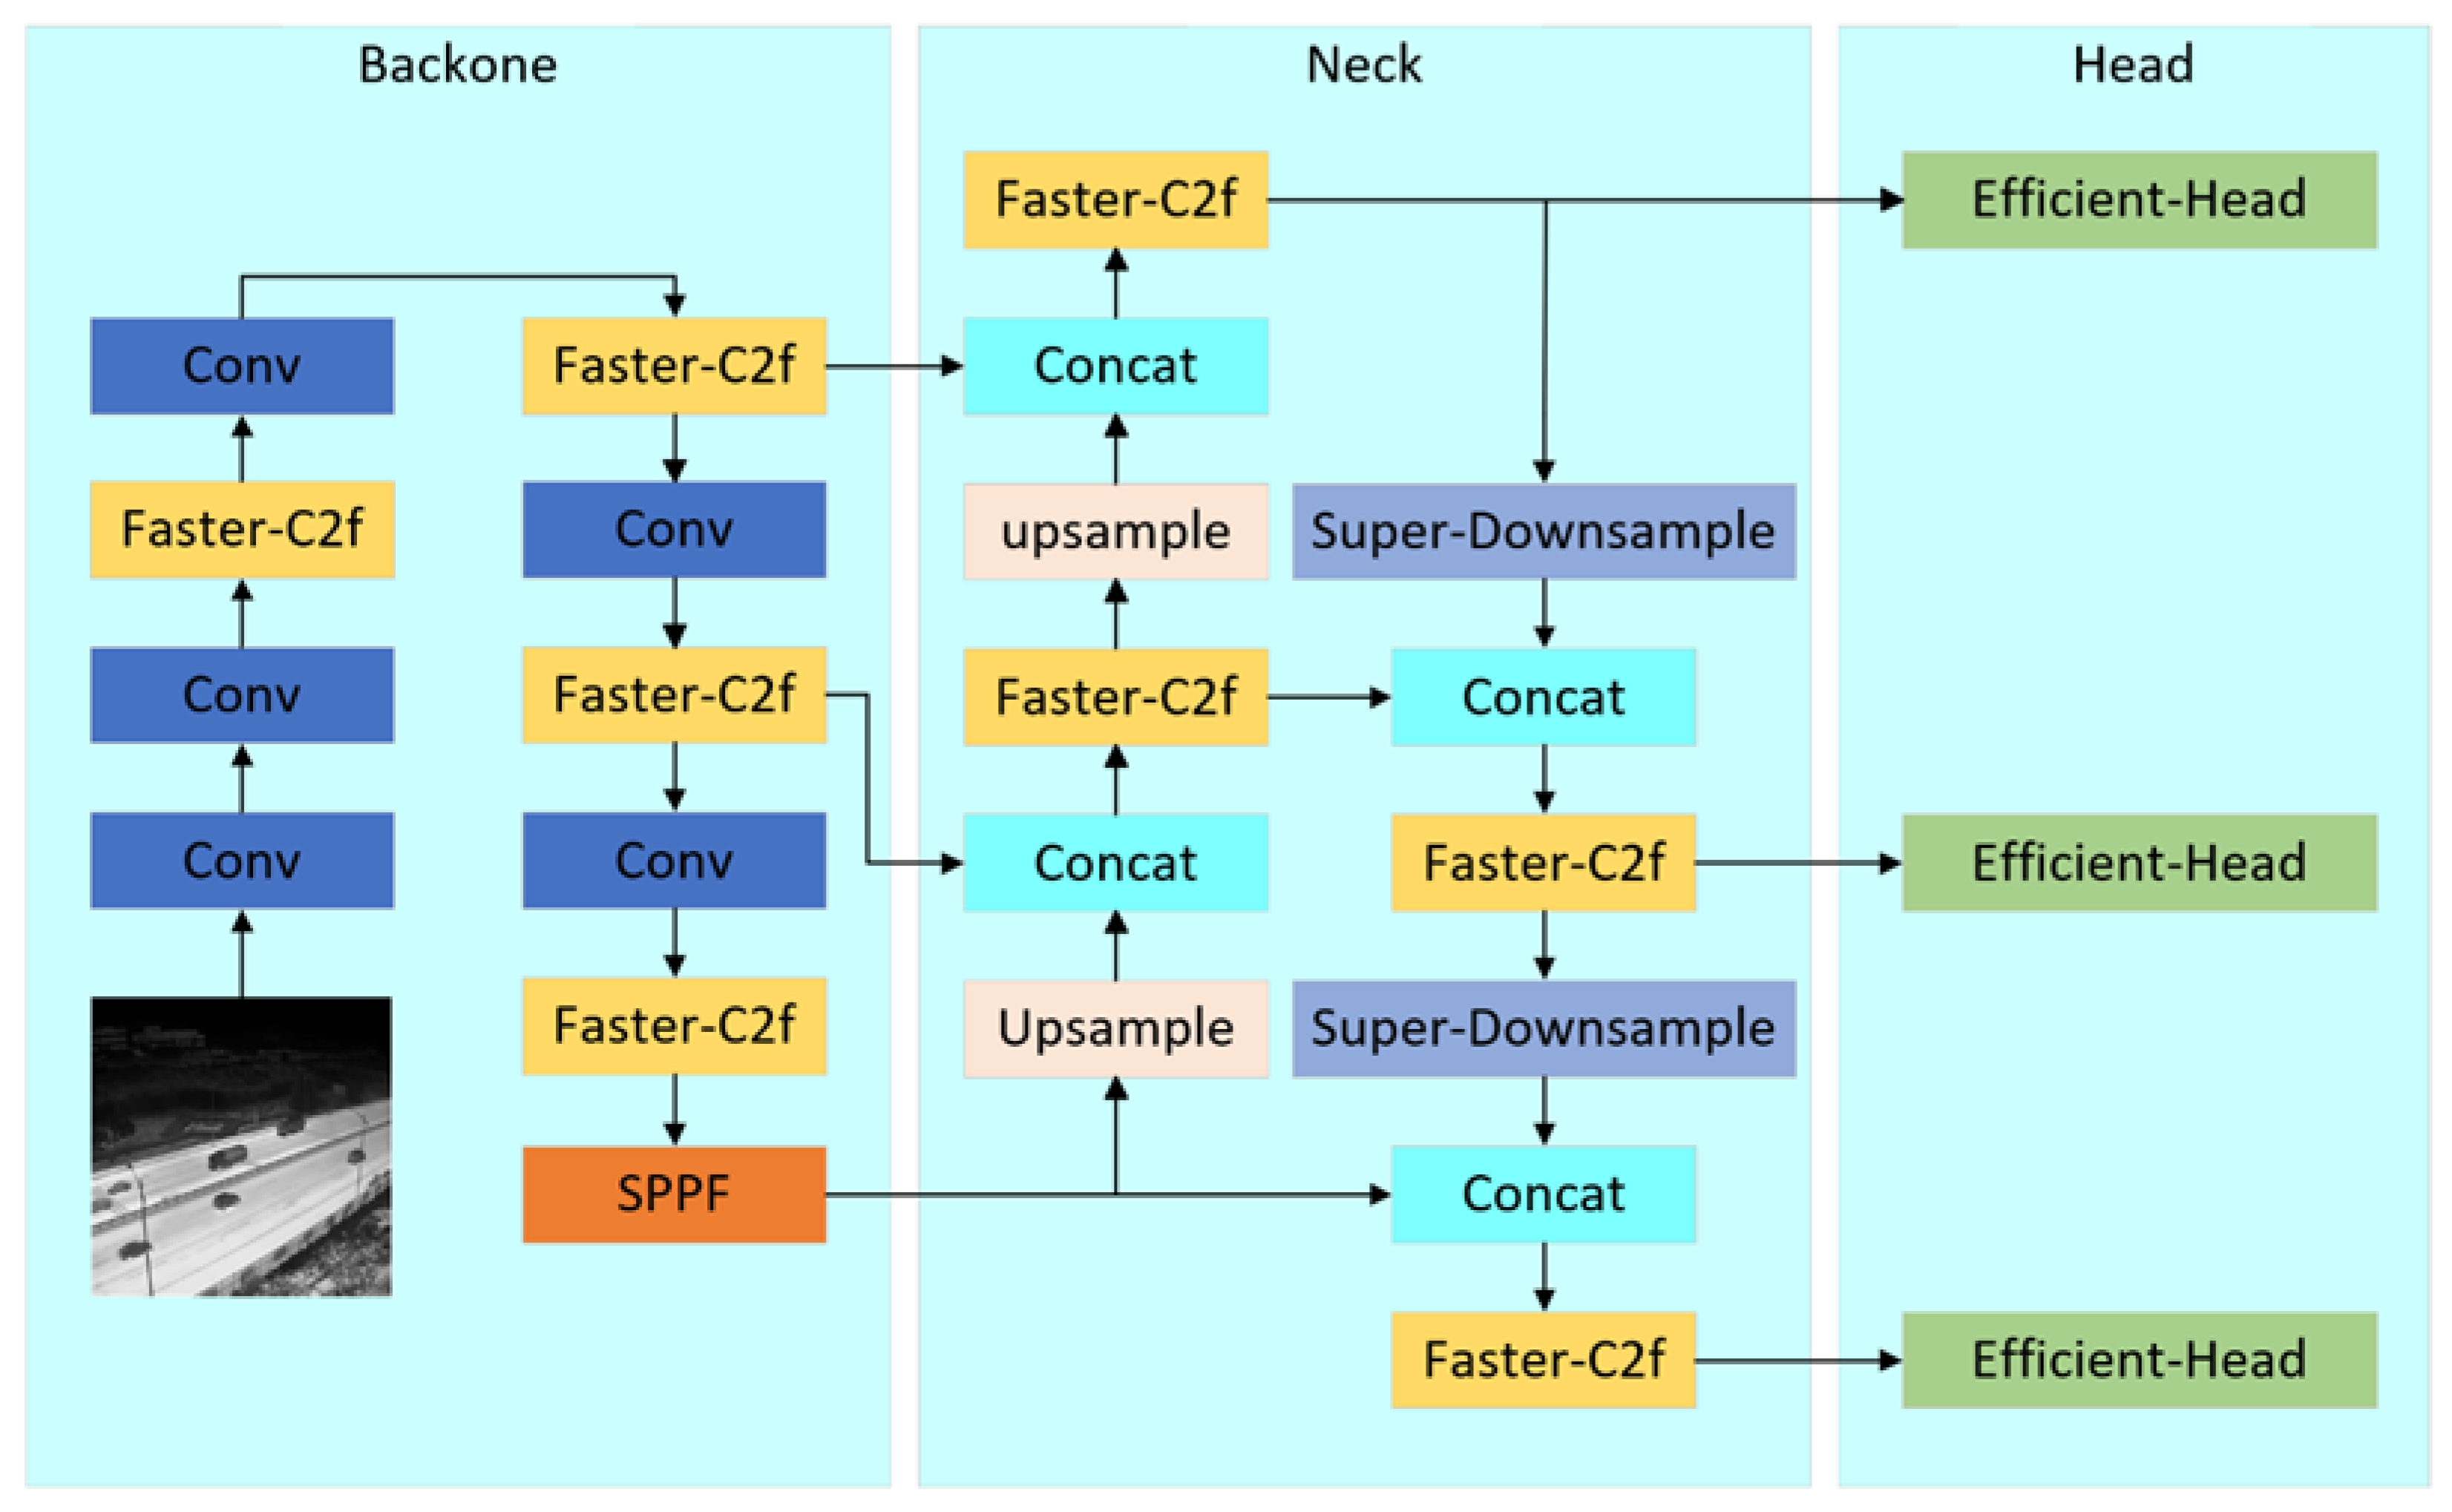
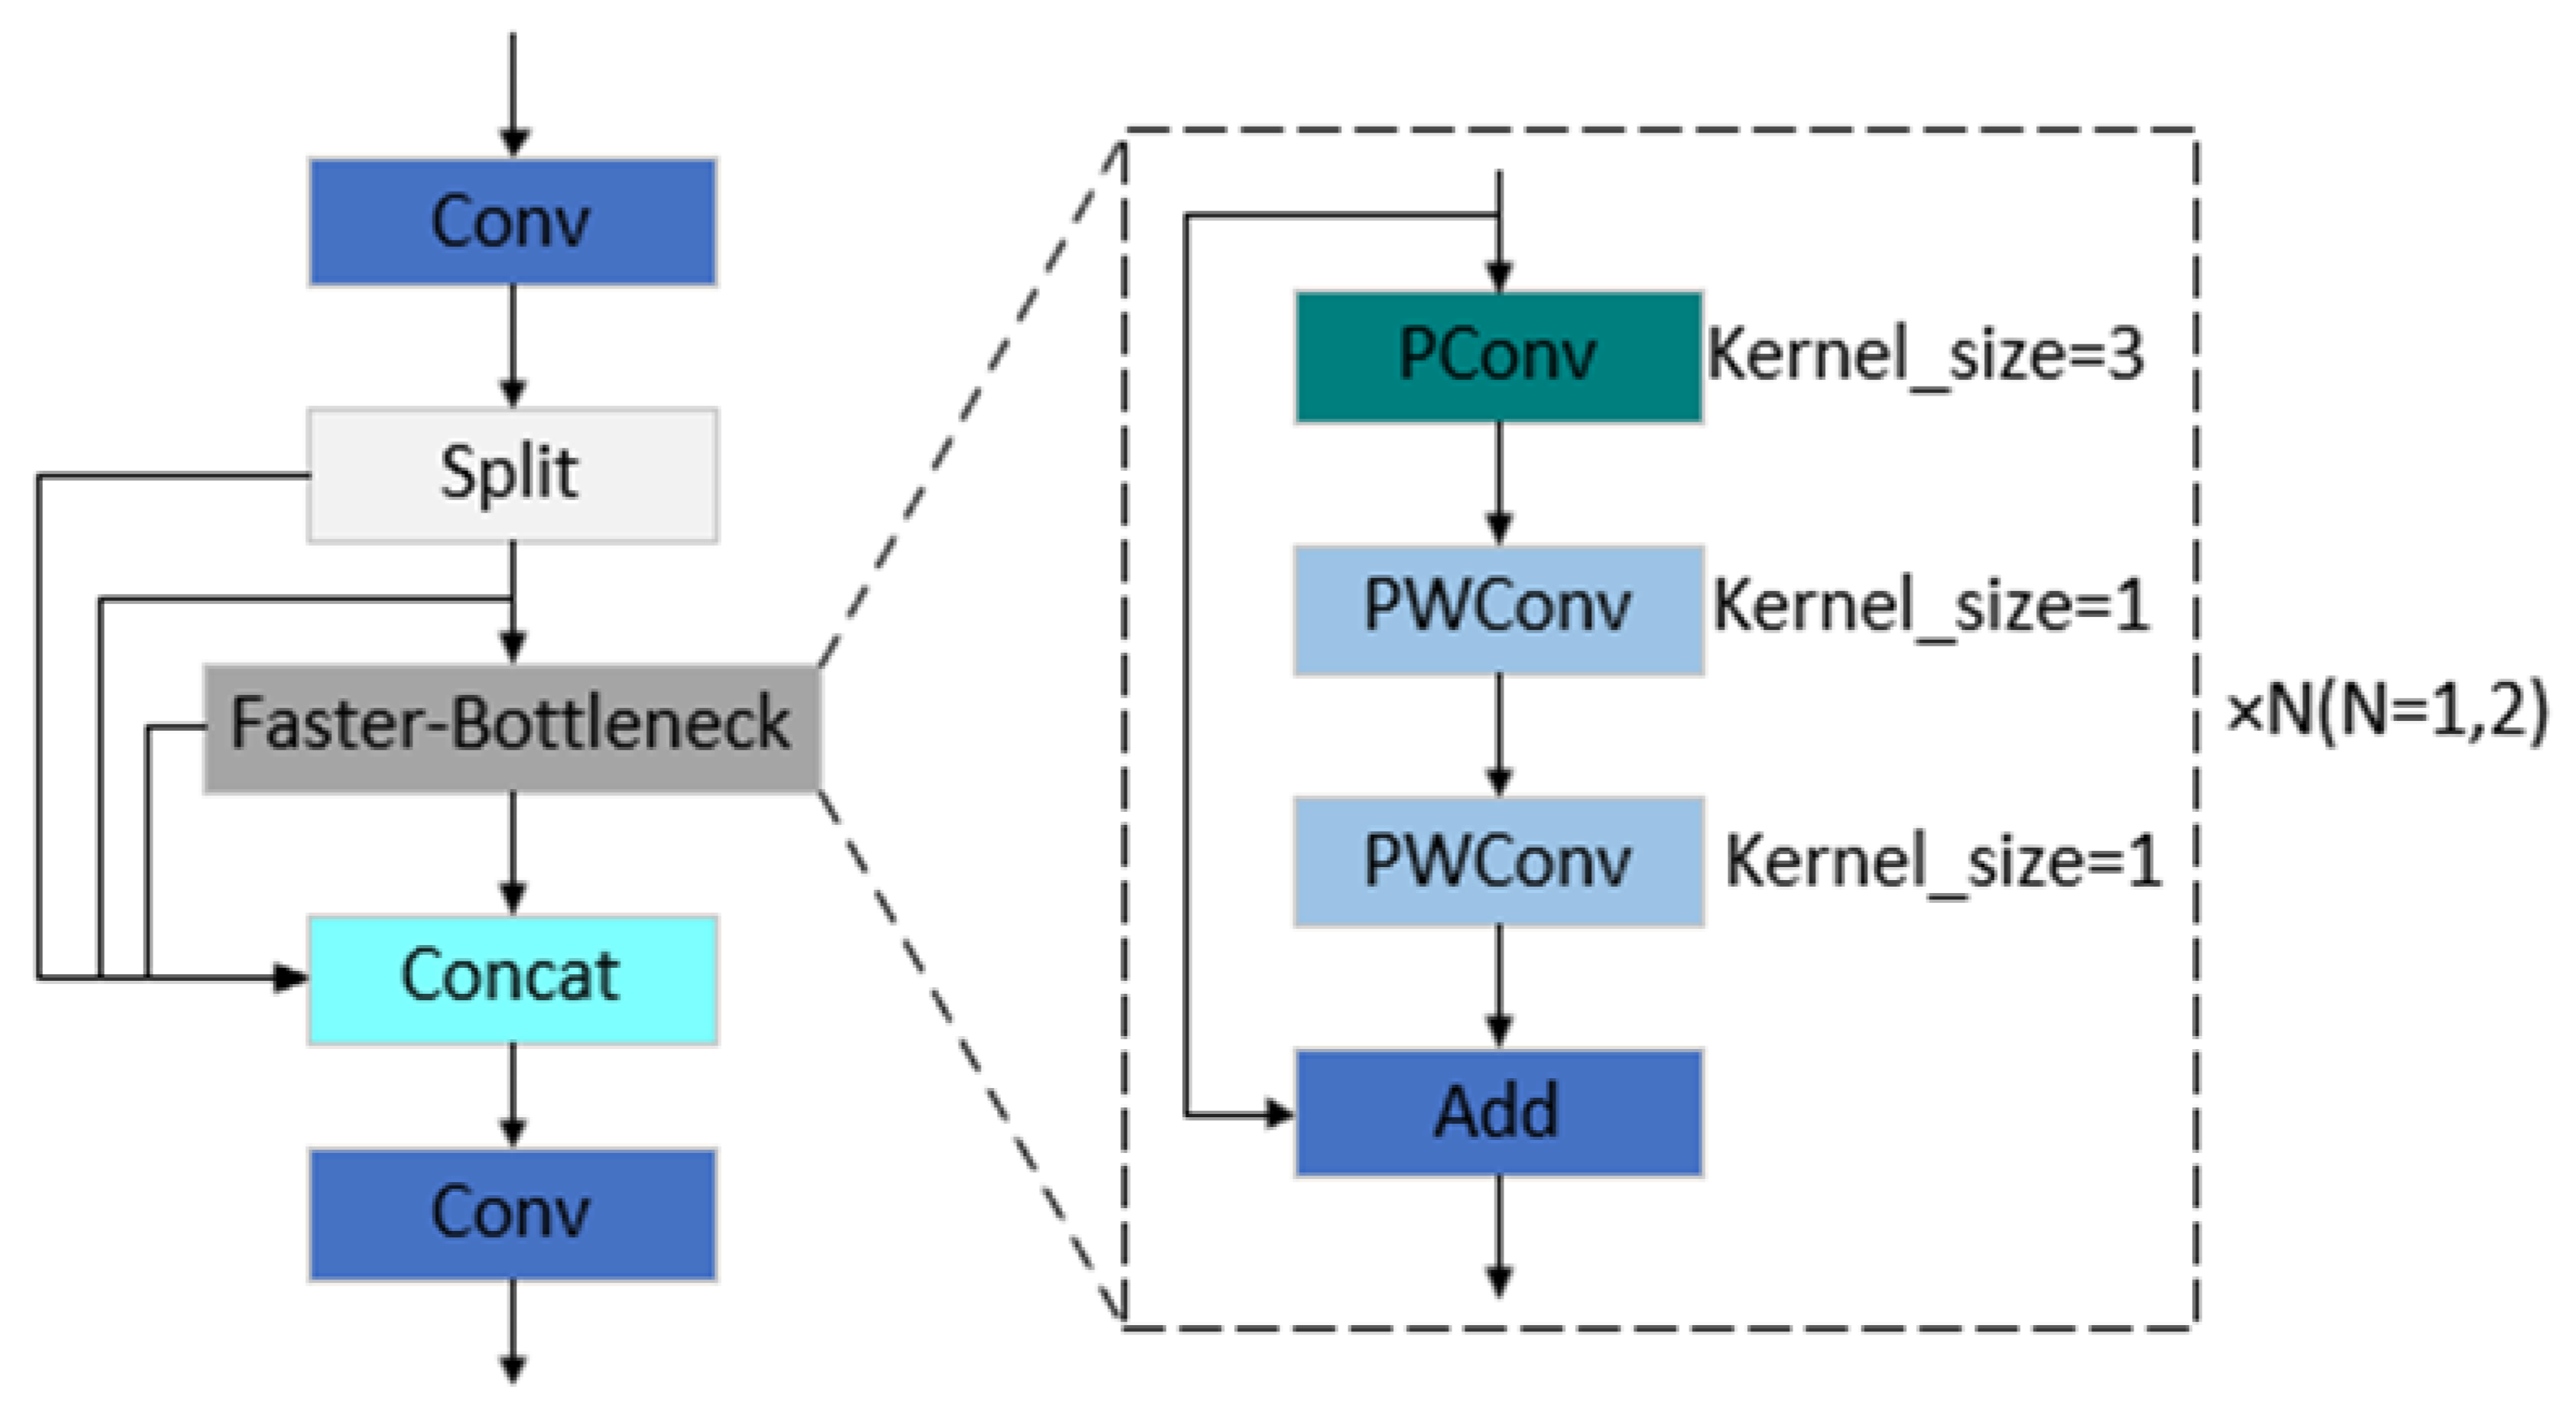
  • This paper introduces a new lightweight module, Faster-C2f, which mainly uses Partial Convolution and Pointwise Convolution to improve the Bottleneck structure in C2f. By significantly decreasing both the model’s parameters and computational complexity, this method enhances detection performance.
  • A new downsampling module, Super-Downsample, is utilized in the neck network. This module combines the advantages of ordinary convolution and max pooling, retaining multi-scale features to the maximum extent during the feature fusion stage.
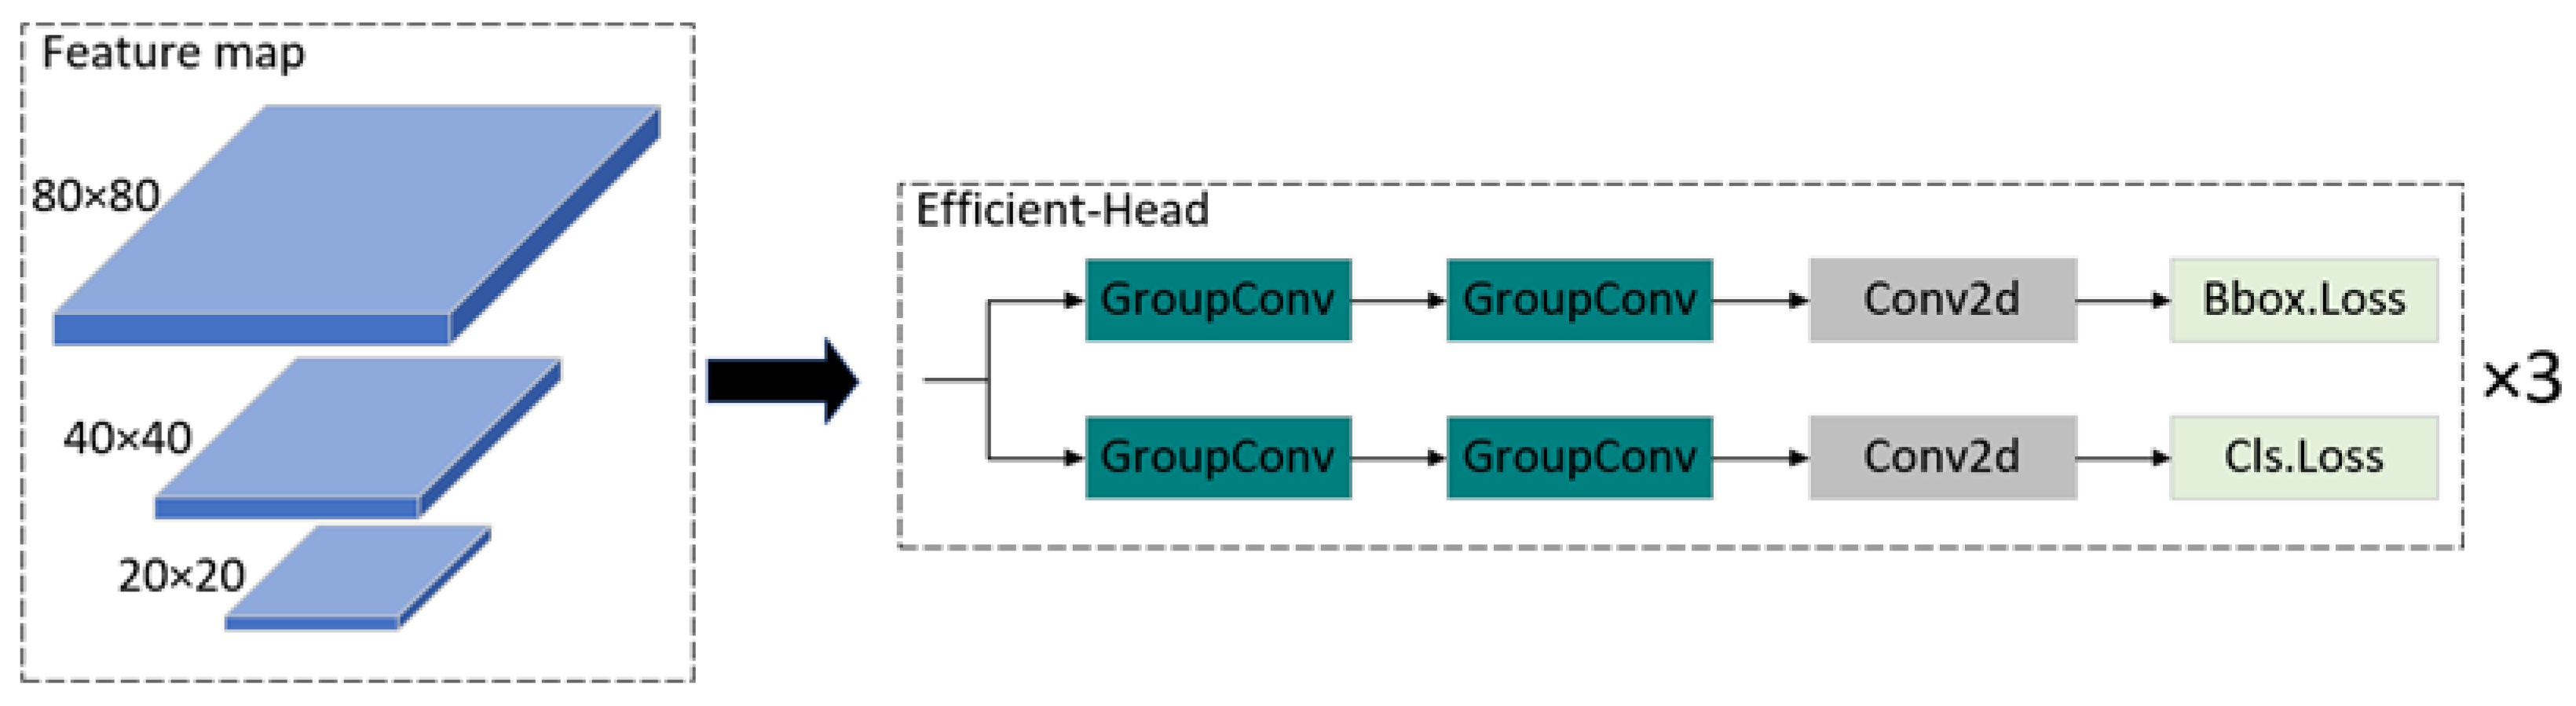
  • The decoupled detection head is redesigned using highly efficient Group Convolution instead of ordinary convolution, increasing the model’s detection speed. Given the prevalence of easy samples and the relative sparsity of difficult samples in object detection datasets, we introduce EMASlideLoss to replace the original BCELoss, improving the ability of the model to concentrate on difficult samples and smoothing the loss function.
  • Considering the limited computational power of edge devices like UAVs, this research introduces a lightweight network for infrared target detection, LRI-YOLO. Compared to other state-of-the-art methods, LRI-YOLO demonstrates excellent performance on the HIT-UAV dataset.

2. Related Work

The YOLO series algorithms are widely recognized for their outstanding performance in object detection. Liang et al. [33] implemented a lightweight object detection framework called Edge-YOLO by utilizing pruned feature extraction networks and compressed feature fusion networks, significantly improving detection efficiency. Wu et al. [34] proposed CDYL to address the challenge of detecting small and difficult targets in both visible light and infrared images. This algorithm employs the CFC-DC structure to thoroughly analyze image edges and relevant information, enhancing the capability to detect small objects and boosting accuracy in tasks involving densely packed small object detection. Similarly, Jing et al. [35] developed a framework for UAV infrared target detection to process videos and images. This framework employs the YOLO model to extract features from ground infrared videos and images taken by Forward-Looking Infrared cameras. The model that performs best according to evaluation metrics is applied for the detection of objects in UAV infrared videos.
In UAV scenarios, infrared images often contain noise. To address this, Pan et al. [14] developed an enhanced object detection network based on YOLOv7, incorporating various feature enhancement strategies tailored for infrared objects, adapted to infrared objects, and optimized for edge computing scenarios. By reducing model complexity, this approach improves the robustness and accuracy of the model in small target detection. Zhao et al. [36] introduced a YOLO-ViT model designed for detecting infrared objects on the ground in UAVs that improves the YOLOv7 backbone by integrating the lightweight MobileViT network, allowing for better capturing of local and global features and enhanced detection performance. To address the challenges presented by the intricate ground environment and varying object scales in infrared images captured by UAVs, Zhao et al. [37] proposed the ITD-YOLOv8 method. This method utilizes the lightweight GhostHGNetV2 network with an improved YOLOv8 backbone for feature extraction, capable of capturing object features at different scales, thereby reducing false detections and missed detections.

3. Materials and Methods
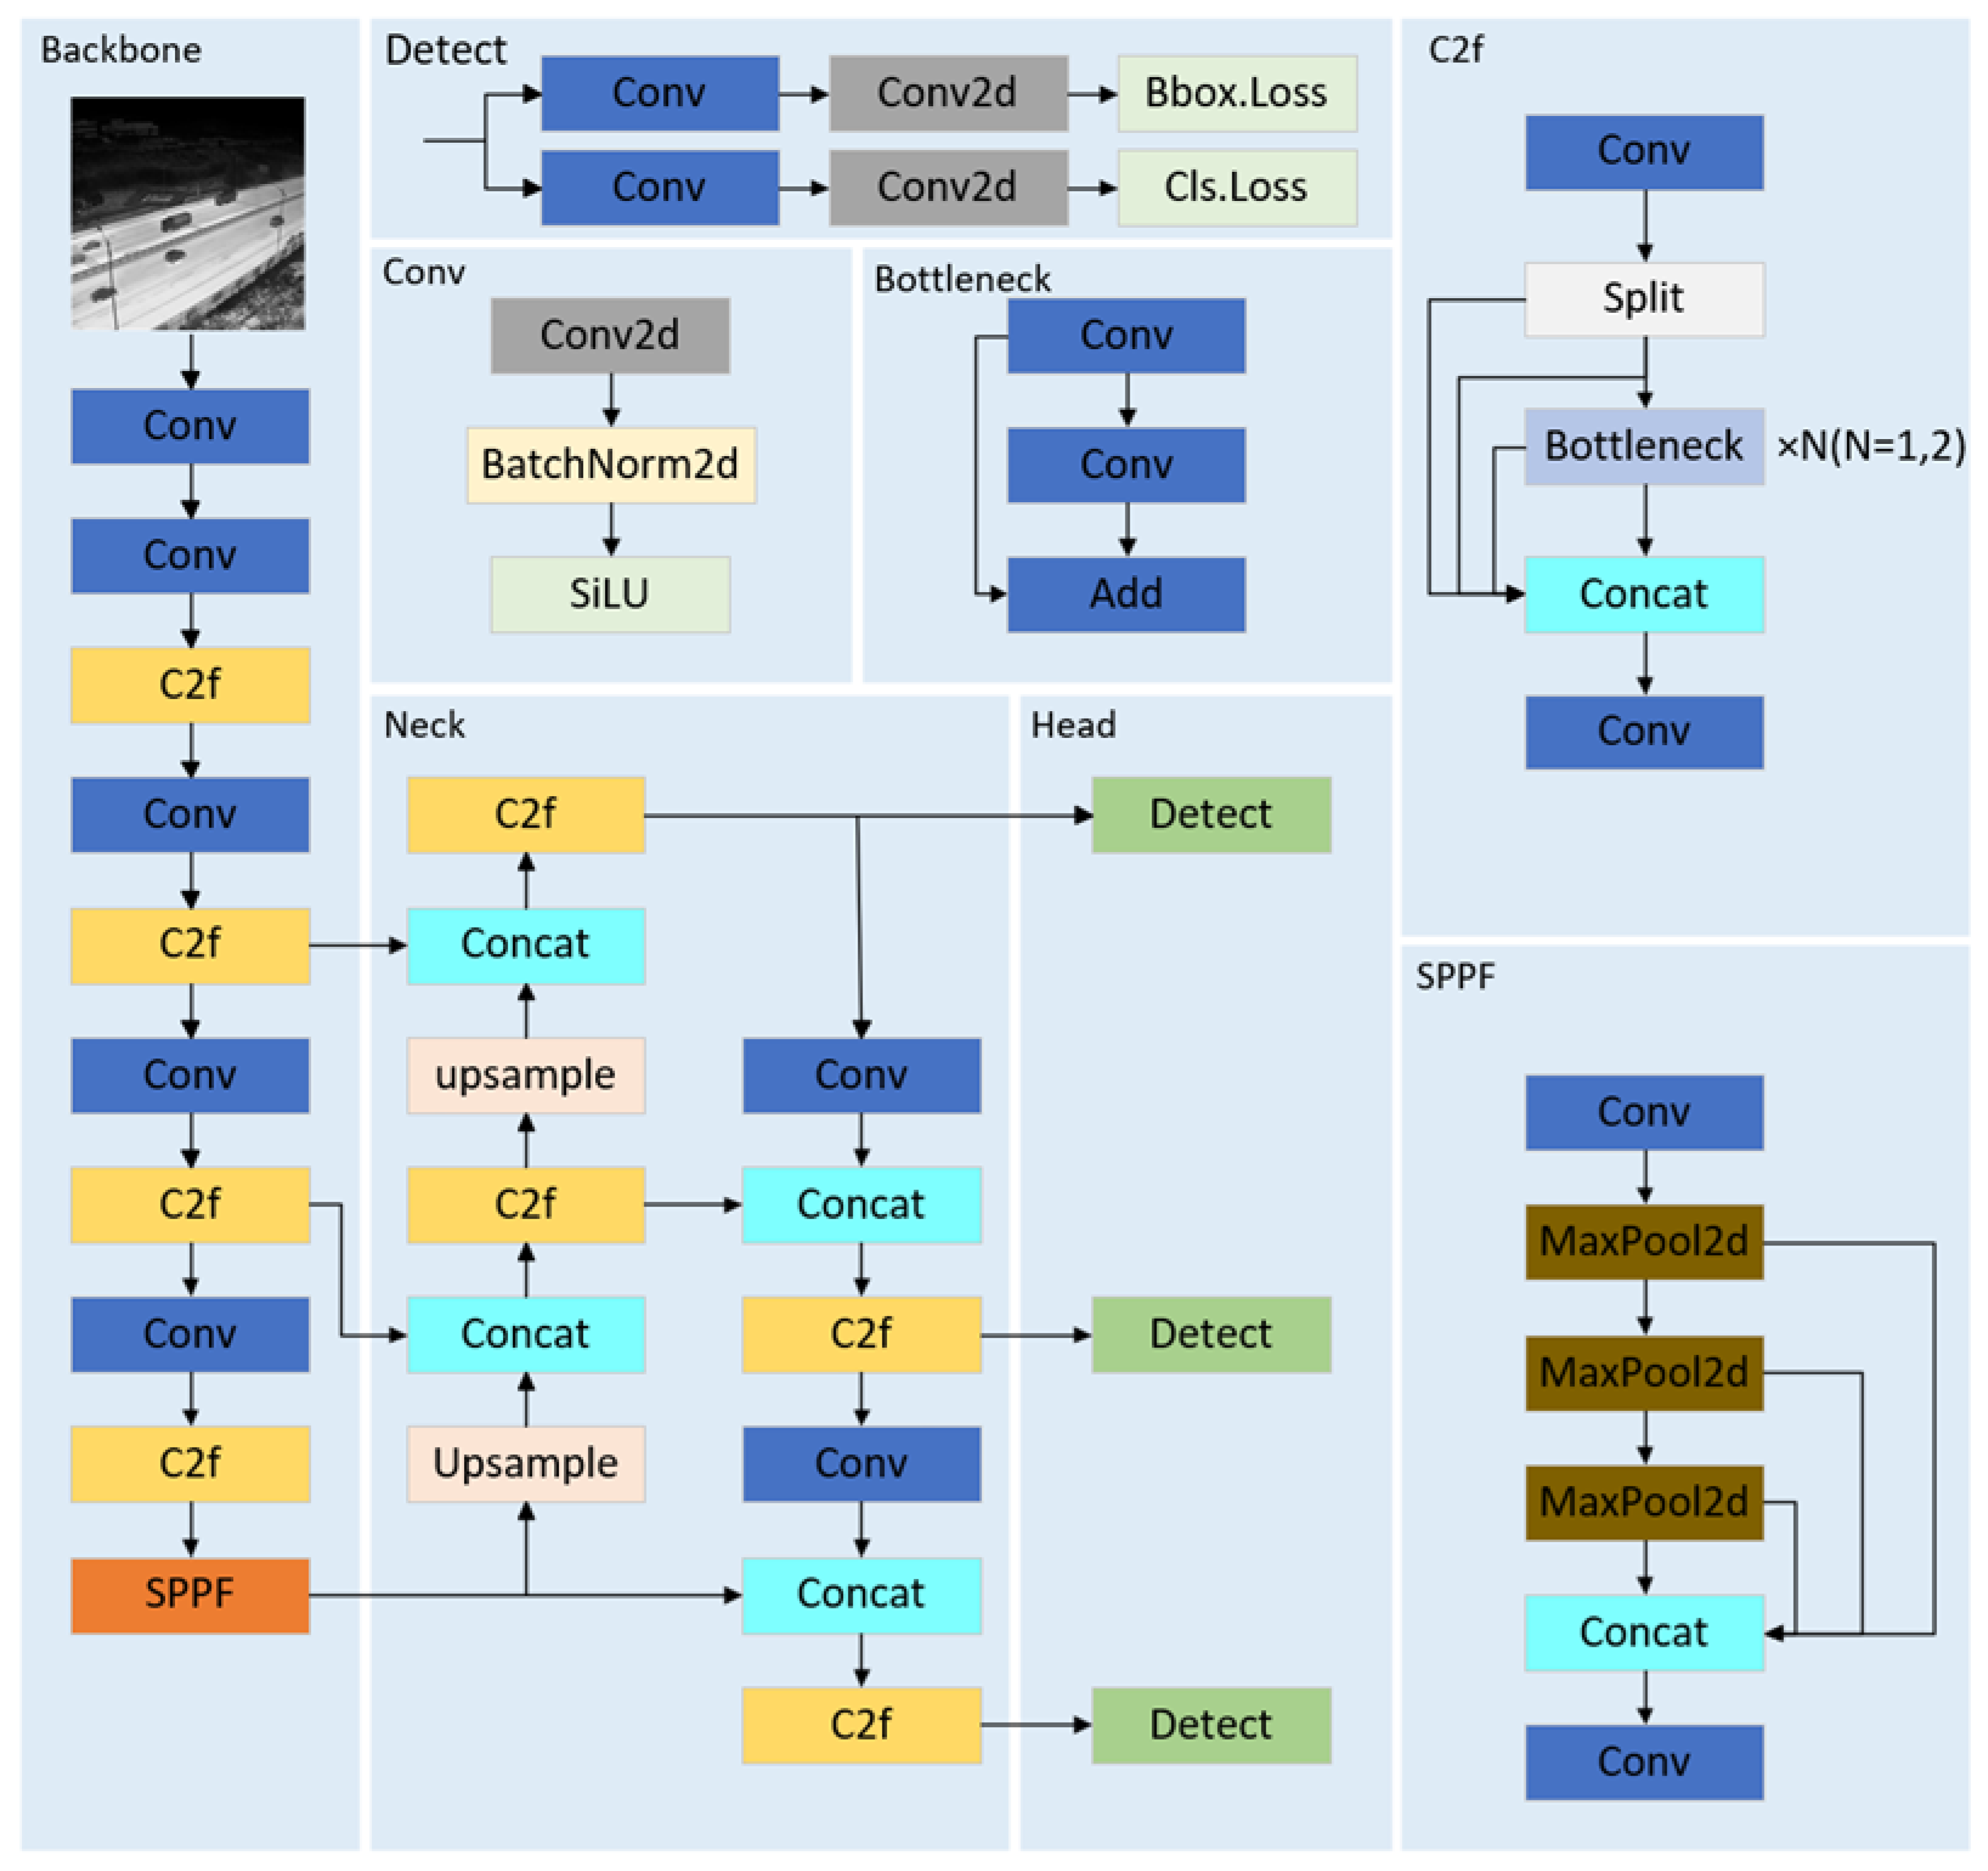
3.1. YOLOv8

Figure 1 illustrates the architecture of YOLOv8 [31]. YOLOv8 is divided into several series (n, s, m, l, x) by altering the network’s width and depth, with the primary difference being the scaling factors. The deeper and wider series yield better detection results but have higher computational demands. Conversely, the series with shallower networks significantly reduce computational load and improve detection speed, albeit with somewhat diminished detection performance. Therefore, different sizes of models can be selected according to different usage scenarios: if the detection task requires high accuracy, the model with coefficient x is available for selection; on the contrary, if the focus is on a high detection speed rather than high accuracy for the task, the model with coefficient n can be selected.
Adopting YOLOv5’s design philosophy, YOLOv8 comprises the backbone, the neck, and the detection head as its three primary components. In YOLOv8, the C3 structure from YOLOv5 is replaced with the C2f structure in both the backbone and neck networks. The C2f structure offers richer gradient flow, achieves further lightweighting, and changes the channel configuration according to the model’s scale. The YOLOv8 architecture still includes the SPPF (Spatial Pyramid Pooling-Fast) module from YOLOv5. For feature enhancement, YOLOv8 incorporates the PA-FPN (Path Aggregation Network–Feature Pyramid Network) concept into its design [38]. YOLOv8 employs a decoupled head in its detection head, as opposed to the coupled head used in YOLOv5, resulting in greater efficiency during both training and inference.

3.2. LRI-YOLO

Considering the large parameters and slow detection speed of current mainstream target detection networks, this study introduces a lightweight infrared aerial target detection network, LRI-YOLO, based on YOLOv8n. Firstly, the original C2f module in YOLOv8 is redesigned, introducing the Faster-C2f module, which significantly decreases the model’s parameters and computational complexity, boosting detection speed. Secondly, during the neck feature fusion stage, a Super-Downsample module is proposed to replace the original ordinary convolution downsampling. Compared to ordinary convolution, this method better preserves multi-scale features, improving detection accuracy. Although YOLOv8 uses a decoupled detection head which improves detection accuracy, it also consumes a considerable number of computational resources. Therefore, this paper optimizes the detection head structure by using lightweight Group Convolution [39] to replace the ordinary convolution in the detection head, and names this optimized structure Efficient-Head. Finally, to deal with the challenge of sample imbalance in datasets, EMASlideLoss is utilized to replace the original BCELoss [40] classification loss function, enabling the model to concentrate more on challenging samples. LRI-YOLO is illustrated in Figure 2.
The design of LRI-YOLO aims to optimize the network structure while maintaining a high detection accuracy and reducing the model size to facilitate deployment on mobile devices. The model size is closely related to both detection speed and accuracy. In theory, a smaller model results in faster detection on the same device. However, reducing the number of parameters can decrease the model’s capacity to learn features, potentially affecting the final detection performance. LRI-YOLO addresses this by utilizing high-performance lightweight convolutions to optimize the parameter-heavy standard convolutions, thus compressing the model size without compromising accuracy.

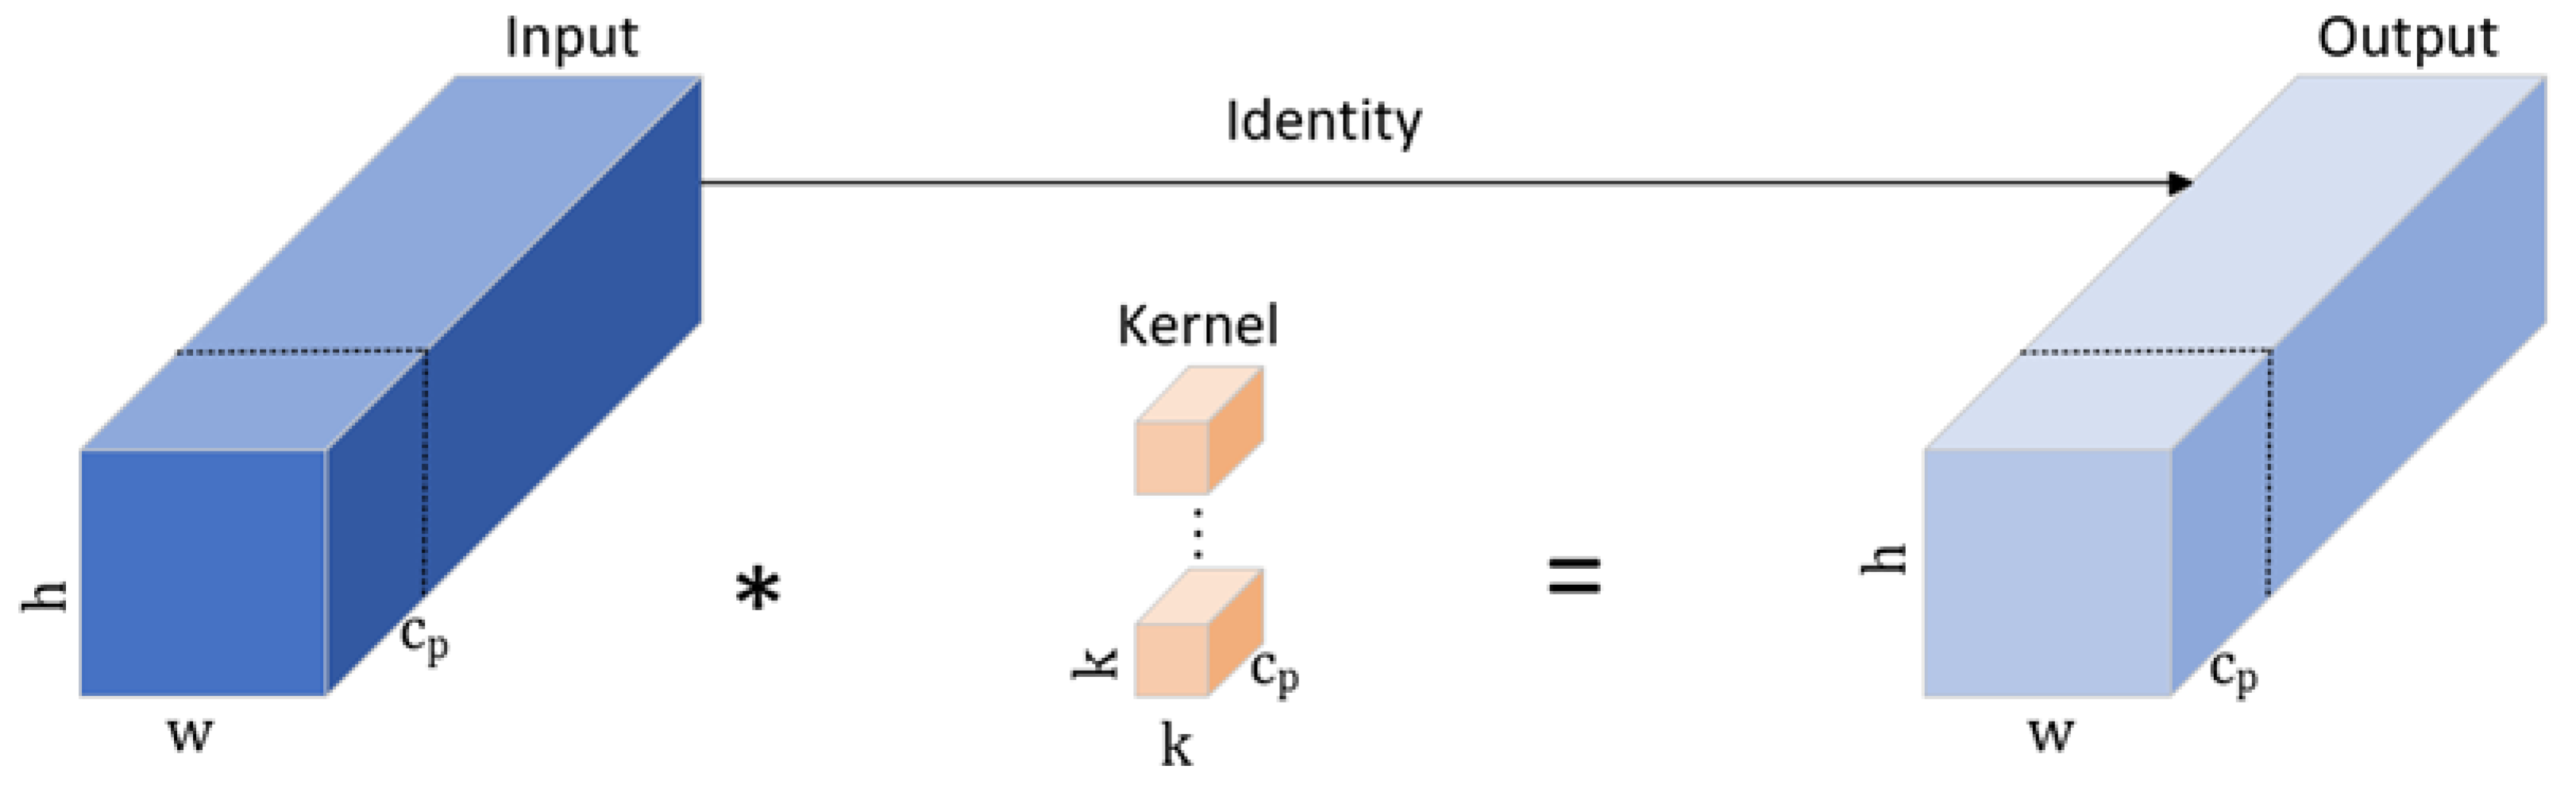
3.2.1. The Faster-C2f Module Based on Partial Convolution

The Faster-C2f module primarily focuses on redesigning the Bottleneck structure in the original C2f, resulting in the development of the Faster-Bottleneck. Faster-C2f is presented in Figure 3.
Faster-Bottleneck, while retaining the original dual-branch structure, uses Partial Convolution (PConv) [41] and Pointwise Convolution (PWConv) [42] to replace the original ordinary convolution. The idea of using PConv in combination with PWConv is derived from the FasterNet structure [41]. In this paper, we utilize the concept of PConv combined with PWConv to transform the C2f structure, substantially decreasing the parameters of model and complexity of computations.
By significantly decreasing computational redundancy, the PConv decreases memory access requirements. As depicted in Figure 4, w and h indicate the width and height of the output and input feature maps; c p stands for the count of channels involved in convolution; and k indicates the kernel size. The PConv applies convolution to a portion of the input channels to extract spatial features, maintaining the rest of the channels unmodified. For efficient memory access, the entire feature map is represented by either the first or last continuous channel during computation. Provided that the input and output feature maps have equal channels, the FLOPs for PConv can be computed using Equation (1).
h × w × k 2 × c p 2
Furthermore, the PConv requires comparatively little memory access, as shown in Equation (2).
h × w × 2 c p + k 2 × c p 2 h × w × 2 c p
Following the PConv, a PWConv is added to effectively utilize information from all channels. The PWConv employs a kernel size of 1, preserving the feature map’s dimensions while adjusting the channel count based on the number of kernels used. As illustrated in Figure 5, if the input feature map has dimensions of height h , width w , and c channels, applying PWConv with n kernels will maintain the feature map’s height and width while changing the channels to n. In summary, the integration of PConv and PWConv creates an effective receptive field on the input feature map that resembles a T-shape, enhancing the focus on the central area compared to standard convolution.
To prevent overfitting during model training, the DropPath [43] function is employed within the Fast-C2f module. The main idea of DropPath is to randomly ignore the outputs of certain layers or blocks. This approach is similar to Dropout, but DropPath operates at a higher structural level, targeting entire layers or paths instead of individual neurons or activations. During each forward pass, DropPath randomly determines whether a specific path participates in the computation. Specifically, for a given forward pass sample, DropPath sets the output of a path to zero with a probability P while retaining other paths. In this module, DropPath is applied to the outputs of pointwise convolutions to prevent overfitting, introducing randomness during training and making the model more robust.

3.2.2. The Super-Downsample Module Based on Max Pooling and Convolution

Downsample operations are used very frequently in object detection networks. In the early stages, max pooling[n] operations were commonly used for downsampling, but later, convolution operations became more prevalent. Max pooling downsampling is simple and has a low computational cost, allowing it to preserve significant features. However, it could lead to a reduction in detailed information. Convolutional downsampling can retain more original feature information but requires higher computational resources. To balance the strengths and weaknesses of these methods, this study proposes a Super-Downsample structure as a replacement for the convolutional downsampling structure in the neck of YOLOv8. The Super-Downsample module structural diagram is depicted in Figure 6.
The Super-Downsample module is composed of two branches. In the first branch, max pooling is applied first, followed by a 1 × 1 convolution to modify channels. In the second branch, one 1 × 1 convolution is initially utilized to modify the count of channels, followed by 3 × 3 convolution. The super-downsampling result is formed by combining the outputs from both branches. Since the feature layer using the 3 × 3 convolution has fewer features, this module has slightly fewer parameters and reduced computational complexity compared to standard convolution. Additionally, it combines the advantages of both downsampling techniques, thereby retaining more comprehensive feature map information.

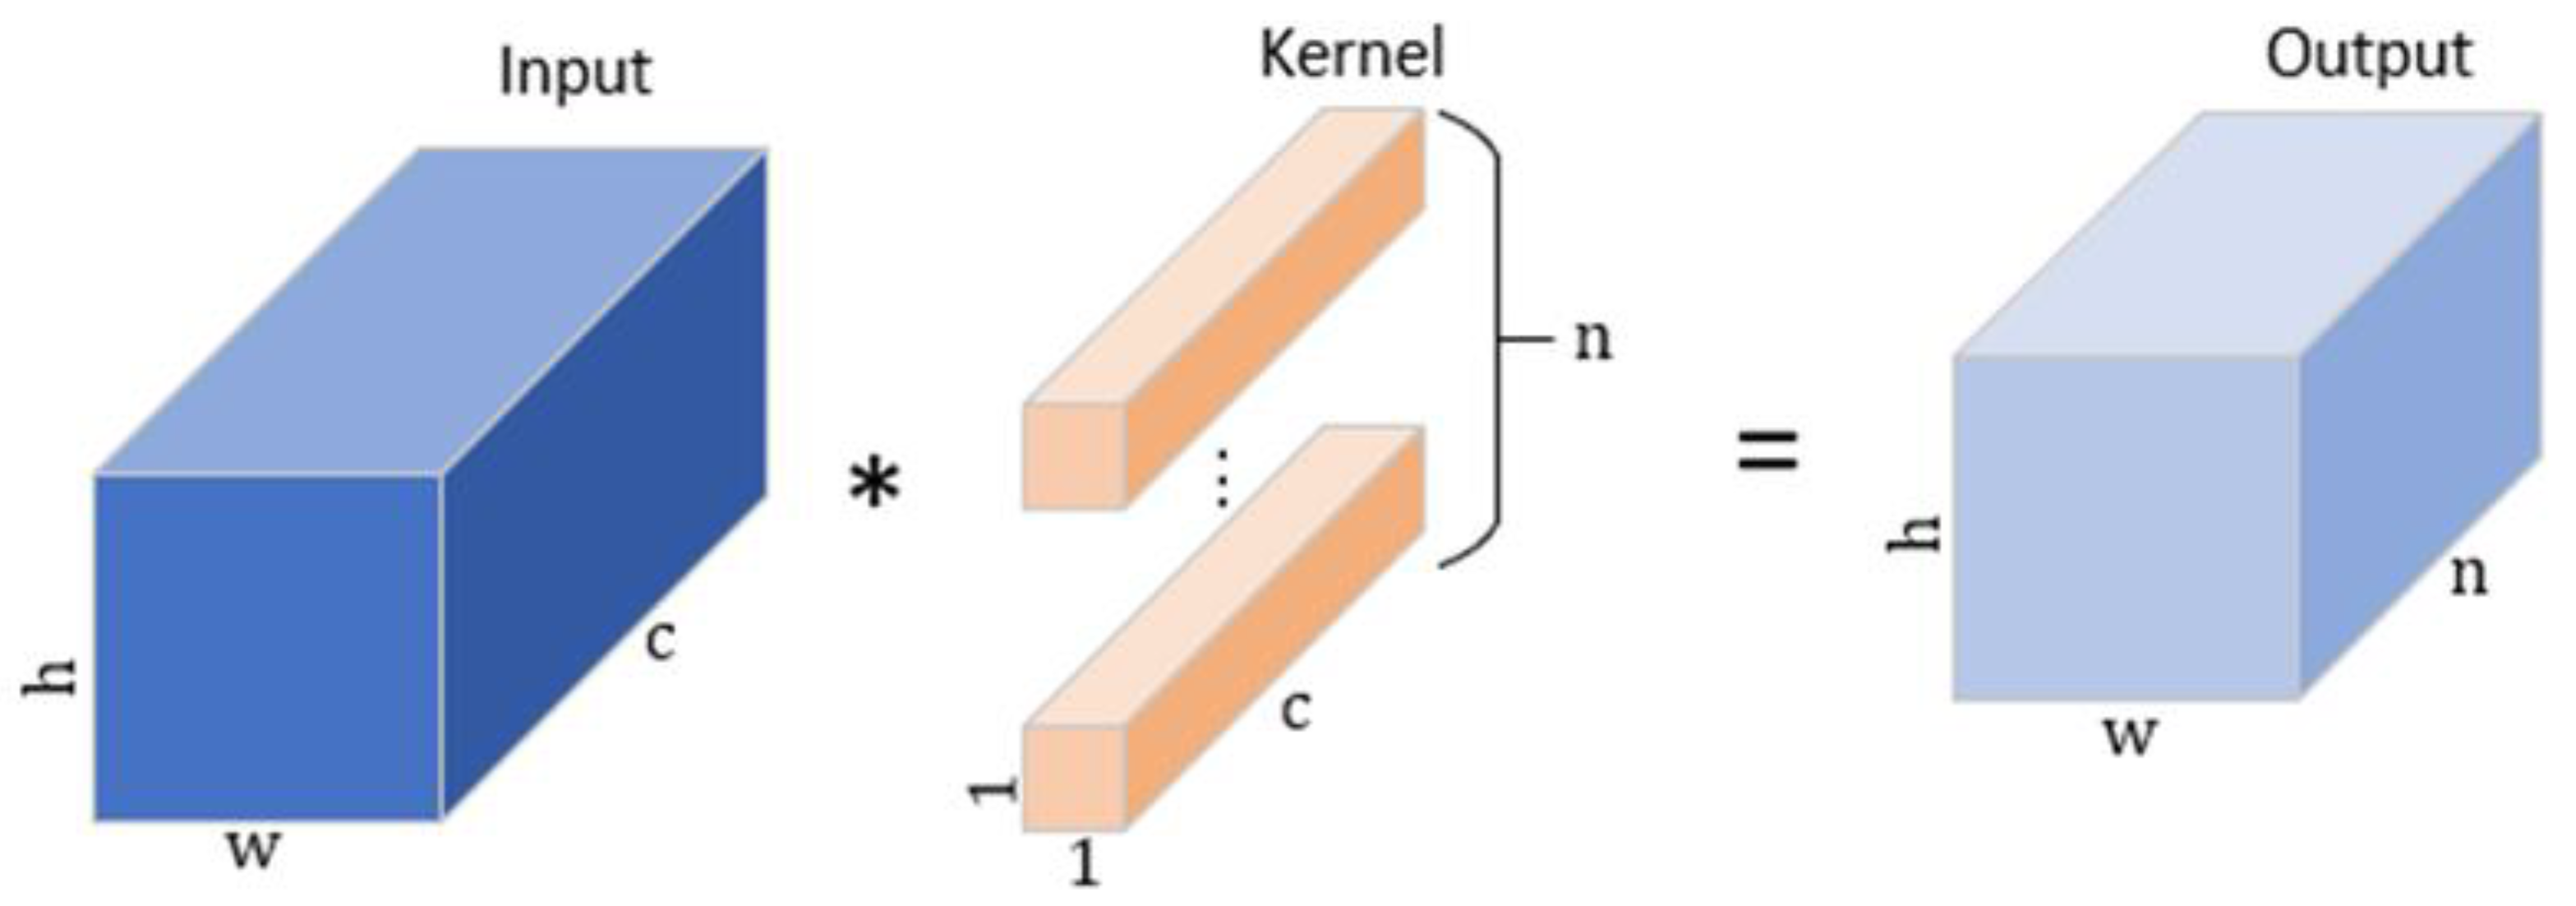
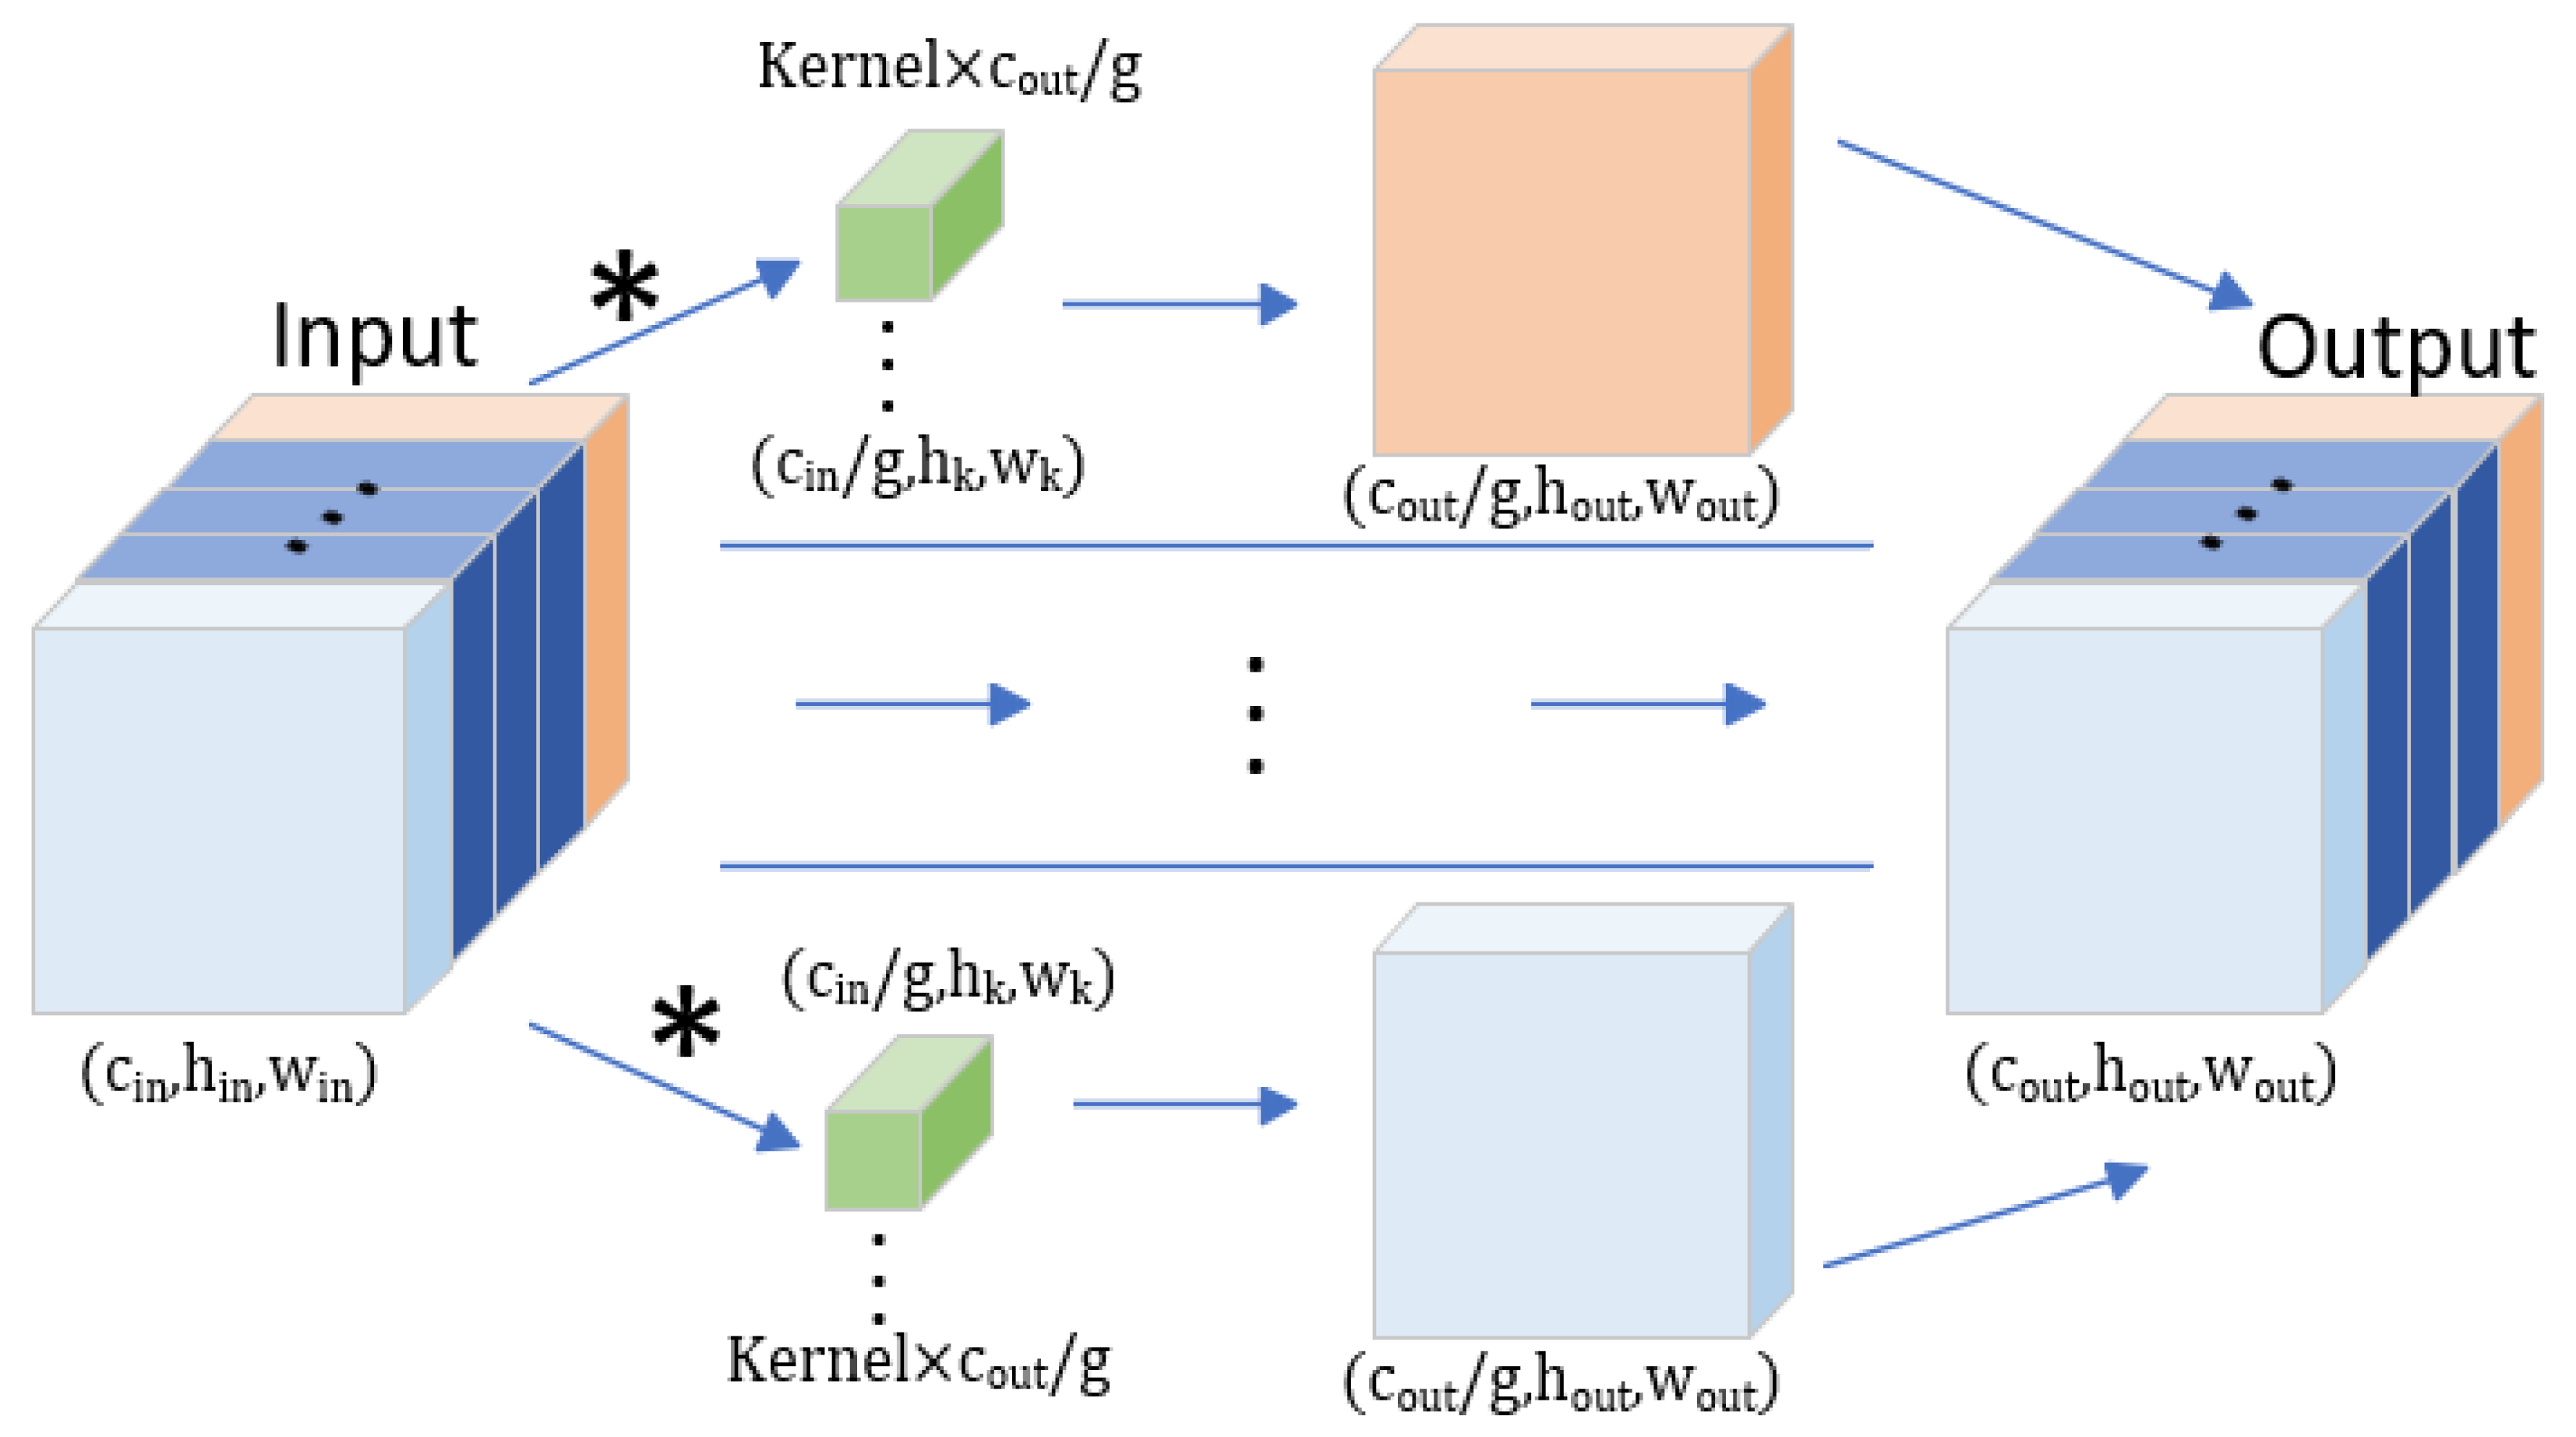
3.2.3. The Efficient-Head Module Based on Group Convolution

The detection head in YOLOv8 [31] employs a decoupled head architecture with two distinct branches, each containing two 3 × 3 convolutions and one 1 × 1 convolution, responsible for classification and bounding box regression, respectively. Compared to coupled heads, this design improves the overall detection capabilities. However, it substantially raises the parameters and FLOPs. The detection head in YOLOv8 accounts for about one-fourth of the total model parameters. Given the restricted computational resources of edge devices like UAVs, it is necessary to use high-performance, lightweight convolution to substitute the 3 × 3 convolution in the detection head. We decided to use Group Convolution (GConv) [39] to replace the original ordinary convolution, resulting in the Efficient-Head structure. The Efficient-Head module is displayed in Figure 7.
The GConv serves a similar purpose to regularization by preventing overfitting and also decreases the training parameters and reduces the complexity of computations. The parameters and computational complexity of GConv are 1/g of those of ordinary convolution, where g denotes the count of groups. In GConv, the feature map is divided into g groups, and the convolution kernels are divided similarly. Convolution is performed within each corresponding group, and the outputs generated by each group are combined along the channel dimension. This principle is illustrated in Figure 8. Theoretically, the parameters and computational complexity of GConv are 1/g of those of ordinary convolution. The parameters for ordinary convolution are depicted in Equation (3), and in Equation (4), the FLOPs are presented. Equation (5) displays the parameters for GConv, and the FLOPs are shown in Equation (6). Comparing Equations (3) and (5), it is evident that GConv’s parameters are only 1/g of those of ordinary convolution. Similarly, comparing Equations (4) and (6), it is clear that the computational complexity is also 1/g of that of ordinary convolution. The value of g is a hyperparameter in the Efficient-Head module. We performed experiments to determine the best possible value for g, considering detection accuracy, model parameters, and computational complexity, with g determined to be 16.
k × k × c i n × c o u t = k 2 c i n c o u t
h i n × w i n × c i n × c o u t × k × k = k 2 h i n w i n c i n c o u t
( ( c i n g ) × ( c o u t g ) × k × k ) × g = k 2 c i n c o u t g
h i n × w i n × ( c i n g ) × ( c o u t g ) × k × k × g = k 2 h i n h i n c i n c o u t g
In these equations, c i n stands for the channels in the input feature map, c o u t represents the count of channels in the output feature map, h i n refers to the height of the input feature map, w i n indicates the width of the input feature map, and g represents the count of groups in the GConv.

3.2.4. The EMASlideLoss Based on SlideLoss and Exponential Moving Average Concept

The YOLOv8 loss function is divided into classification branch and regression branch. For bounding boxes, the regression branch utilizes a combination of D F L [44] and C I o U Loss [45]. The D F L , a modified version of focal loss, aims to improve the precision of the predicted bounding box positions and sizes. It achieves this by predicting a probability distribution for the bounding box’s location and dimensions, then optimizing this distribution using a focal loss function.
D F L ( S i , S i + 1 ) = ( ( y i + 1 y ) log ( S i ) + ( y y i ) log ( S i + 1 ) )
Here, S i and S i + 1 denote the predicted value and adjacent predicted value output, while y , y i , and y i + 1 represent the actual value, label integral value, and adjacent label integral value, respectively.
C I o U [45] is an enhancement of I o U [46]. I o U quantifies the intersection between the ground truth box and the predicted box, detailed in Equation (8).
I o U = A B A B
A signifies the predicted box, and B refers to the ground truth box. C I o U extends I o U loss by including both the aspect ratio and the distance between the center points in its calculation. This improvement ensures that the predicted box more accurately fits the object box and mitigates issues such as divergence.
The typical calculation for C I o U [45] is as follows:
C I o U = I o U ρ 2 ( b , b g t ) c 2 α v
In this context, b and b g t denote the central points of the predicted and ground truth boxes. ρ 2 signifies the Euclidean distance between two center points. The term c denotes the diagonal length of the smallest bounding box that can encompass both the ground truth boxes and predicted boxes. α is a weight function, and v assesses the alignment of the aspect ratio between the ground truth boxes and predicted boxes. The formulas for this calculation are as follows:
v = 4 π 2 ( arctan w g t h g t arctan w p h p ) 2
In this context, h p and w p refer to the height and width of the predicted box, respectively, while h g t and w g t relate to the height and width of the ground truth box.
The C I o U loss function [45] is calculated as follows:
L C I o U = 1 C I o U
Common classification loss functions include the Cross-Entropy Loss [40] and Binary Cross-Entropy Loss [40]. The Cross-Entropy Loss is a conventional loss function widely used in classification tasks, effectively measuring the difference between the model’s predicted probability distribution and the true labels. However, it is sensitive to class imbalance, a common issue in object detection, where positive samples (targets) are usually much fewer than negative samples (background). Additionally, Cross-Entropy Loss can lead to overfitting, as the model calculates loss for every class, even for classes that rarely appear. Binary Cross-Entropy Loss, on the other hand, is used for binary classification problems and is suitable for multi-label classification scenarios in object detection, where each grid cell independently determines the presence of a specific object. This loss is computationally simple, as it independently calculates loss for each class. However, like the regular Cross-Entropy Loss, Binary Cross-Entropy is also sensitive to class imbalance.
The original YOLOv8 model utilizes the Binary Cross-Entropy Loss (BCELoss) as its classification loss function, as shown in Equation (12). However, BCELoss is quite sensitive to class imbalance issues. To address this, this paper proposes replacing BCELoss with SlideLoss [47], and further optimizes SlideLoss using the Exponential Moving Average (EMA) approach, resulting in EMASlideLoss, as shown in Equation (13).
L B C E = y log ( p ^ ) ( 1 y ) log ( 1 p ^ )
L E S L = L B C E × E S ( x , μ )
In these equations, L B C E represents the Binary Cross-Entropy Loss, where p ^ denotes the predicted probability for each sample, and y represents the true label of the sample. L E S L refers to the EMASlideLoss, while E S ( x , μ ) denotes the sample loss weight coefficient.
Since network models often struggle to effectively recognize hard samples, they cannot fully utilize the data during training. To effectively address this issue, we designed a weighting function E S ( x , μ ) that assigns larger weights to hard samples and smaller weights to easy samples. This approach ensures that hard samples receive more attention in the loss function, enhancing the model’s ability to learn from more complex instances in the dataset. By prioritizing hard samples, the model can better handle outliers and edge cases, ultimately improving prediction accuracy and robustness. Additionally, we introduced the Exponential Moving Average (EMA) concept to more smoothly assign different weights to samples, thereby optimizing the overall loss function curve. E S ( x , μ ) is defined as shown in Equation (14). Here, x represents the I o U value of the current predicted sample, and μ denotes the average IoU value across all samples, which is automatically updated through EMA each time it is called. The update function is shown in Equation (15).
E S ( x , μ ) = { 1 e 1 μ e 1 x , x μ 0.1 , μ 0.1 < x < μ + 0.1 , x μ + 0.1
{ μ n = β μ n 1 + ( 1 β ) μ n β = β 0 ( 1 e n τ )
In this context, μ n represents the current average I o U value of all samples, and μ n 1 is the average I o U value from the previous update. β 0 is the initial exponential moving weight decay rate, while β denotes the Exponential Moving Average decay factor. n represents the number of loss calculation updates, and τ is the time constant controlling the rate of temporal decay.

3.3. Experimental Dataset

The HIT-UAV dataset [48] was utilized to evaluate the effectiveness of the model and its ability to generalize in high-altitude infrared image detection tasks.
As a specialized dataset, the HIT-UAV dataset provides high-altitude infrared thermal data for object detection in UAV applications. This dataset features images taken from UAVs in diverse environments, such as educational institutions, parking spaces, streets, and recreational facilities, as shown in Figure 9. It covers a wide array of conditions, with altitudes varying between 30 and 60 m and covering camera angles from 30 to 90 degrees. Consequently, the objects to be detected vary in size and shape, which aids the object detection model in more effectively understanding and capturing the dataset’s diversity and complexity. This variety increases the generalization capability of the model, allowing it to deal with inputs of different scales and improving its robustness.
The refined dataset comprises 2898 images with dimensions of 640 × 512 pixels, categorized into humans, bicycles, and vehicles. For this experiment, the dataset was partitioned into three sections, the training, validation, and test sets, using a 7:1:2 ratio. Specifically, the training set included 2008 pictures, the validation set contained 287 pictures, and the test set contained 571 pictures. The HIT-UAV dataset is a vital resource for research in infrared object detection and recognition using UAVs. As shown in Table 1, it includes a total of 24,751 object labels, distributed across different sizes: 17,118 labels are for small objects, which measure less than 32 × 32 pixels and make up only 0.01% of an image’s pixels; 7249 labels are for medium-sized objects, which are below 96 × 96 pixels; and 384 labels are for large objects. This dataset provides an essential foundation for improving the capabilities of UAV-based infrared object detection.

3.4. Evaluation Indicators

In this research, we utilized precision (P), recall (R), mean average precision (mAP), frames per second (FPS), parameters, and floating-point operations (FLOPs) as evaluation metrics to evaluate our algorithm’s performance. The mAP is crucial for evaluating the detection accuracy. The parameters and FLOPs indicate the size of the model and computational complexity, while FPS measures detection speed.
The proportion of correctly detected results among all detections is called precision, and is illustrated in Equation (16).
Precision = TP TP + FP
TP (True Positive) indicates the total count of positive samples correctly detected, while FP (False Positive) signifies the count of negative samples wrongly detected signifies the total of negative samples that the model has incorrectly labeled as positive.
Recall measures the fraction of accurately detected objects relative to the total count of objects, as detailed in Equation (17).
Recall = TP TP + FN
FN (False Negative) is the count of positive samples that the model has inaccurately identified as negative.
Average precision (AP) is employed to evaluate the accuracy of model for each category. A better AP value means superior performance. This concept is detailed in Equation (18).
AP = 0 1 P ( R ) dR
The mAP measures the mean precision across all categories, reflecting the model’s overall performance across different classes. A higher mAP value signifies superior overall model performance. This is detailed in Equation (19).
mAP = i = 1 n AP i n
FPS signifies the count of images the object detection network can analyze each second. The calculation formula is provided in Equation (20).
FPS = N T
Here, N signifies the count of processed images, and T indicates the total processing time.
The number of parameters indicates the total count within the model, usually reflecting the model’s size. FLOPs are a metric used to quantify the model’s complexity. The larger these evaluation metrics are, the more hardware computational resources are required for training and inference.

4. Experimental Results

4.1. Experimental Platform and Parameter Settings

The configuration is detailed in Table 2. The experiment was conducted using an Intel(R) Xeon(R) Platinum 8352V processor (Intel Corporation, Santa Clara, CA, USA), an NVIDIA RTX 4090 GPU (NVIDIA Corporation, Santa Clara, CA, USA), and the Linux operating system. The Python version used was 3.10, and the deep learning framework used was Pytorch 2.1.1. During the experiment, model detection speed was measured under two scenarios: one using a GPU and the other using only a CPU. Considering that GPUs can significantly accelerate the inference of deep learning models, but drones and other edge devices often do not include GPUs due to size and cost constraints, the second scenario restricts GPU usage. Instead, the detection speed is measured using only the CPU to simulate environments with limited computational resources.
The experimental parameter settings are detailed in Table 3. In the experiments, the SGD optimizer was utilized with an initial learning rate of 0.01%, momentum set at 0.937, and weight decay at 0.0005. Mosaic data augmentation was applied during training, with batch size of 32 and image size of 640 × 640. To prevent local optima, the model was trained for 300 epochs.
To maintain the consistency of all subsequent experimental results, all experiments were performed on the same platform with identical parameters.

4.2. The Efficient-Head Hyperparameter Experiment

Efficient-Head replaces the two 3 × 3 convolutions in the original detection head with grouped convolutions. Grouped convolution has a hyperparameter g that determines how many groups the input feature map is divided into for convolution. To find the most suitable hyperparameter g, seven sets of experiments were conducted for comparison. The experiments included the original YOLOv8n and YOLOv8n using Efficient-Head with g set to 2, 4, 8, 16, 32, and 64, resulting in a total of seven experimental groups. The results are displayed in Table 4.
The experiments revealed that, although increasing g should theoretically reduce the parameters and FLOPs, in practice, it was found that increasing the number of groups introduced additional computational overhead. Therefore, larger values of g do not always yield better results. The experimental results indicate that when g = 32, the highest precision of 93.7% was achieved. However, this configuration also resulted in suboptimal parameter count, computational load, and FPS performance. When g = 16, the precision was slightly lower by 0.1% compared to g = 32. Despite this minor drop in precision, the configuration with g = 16 exhibited significantly better performance concerning parameter count, computational demands, and detection frame rate. Therefore, based on these experimental results, it was ultimately decided to set the number of groups for Group Convolution in the Efficient-Head to 16.

4.3. Ablation Experiments

A set of ablation experiments was performed utilizing the HIT-UAV dataset to evaluate the effectiveness of LRI-YOLO’s different modules. These experiments were intended to evaluate the influence of each module on LRI-YOLO. To maintain the validity of the results, all experiments were conducted under identical conditions. The results are displayed in Table 5. In this table, A refers to the Faster-C2f structure, B denotes the use of the Efficient-Head module, C relates to the use of the Super-Downsample module, and D is associated with the use of the EMASlideLoss function.
Table 5 demonstrates that the optimized LRI-YOLO considerably decreased model size and FLOPs, with higher detection frame rates on both GPU and CPU. After incorporating the lightweight Faster-C2f module, the accuracy slightly improved, while the parameters were reduced by 23.5% and FLOPs by 22.2%. The detection speed increased by 8% on the GPU and 23.3% on the CPU. Using the Super-Downsample module, the detection accuracy reached 94%, indicating that this module can better preserve features during the downsampling phase of the feature fusion stage. Additionally, the module slightly reduced the model size and FLOPs and provided a slight improvement in detection FPS. After incorporating the Efficient-Head structure, the mAP decreased by 0.2%, but the parameters and FLOPS were reduced by 19.7% and 30.9%, respectively. The detection speed reached 274 FPS on the GPU and 39 FPS on the CPU. Finally, combining all the improvements resulted in our LRI-YOLO model. Our model attained a detection accuracy of 94.1%, reflecting a 0.3% improvement. The count of parameters was reduced to 1.6 M, a 46.7% decrease from the original model. The computational complexity was reduced to 3.9 GFLOPs, only 46.9% of the original model. The detection frame rate on the GPU was 240 FPS, a 5% improvement, and on the CPU, it was 42 FPS, a 40% improvement. This indicates that our model can fulfill real-time detection requirements on computationally constrained mobile devices.
To verify whether overfitting occurred during the training of LRI-YOLO, the data generated from the training process were plotted into the curve graphs shown in Figure 10. The figure displays the precision, recall, and mAP at an I o U threshold of 0.5, and the mean mAP calculated across multiple I o U thresholds (from 0.5 to 0.95 with a step size of 0.05). As observed, the accuracy, recall, and mAP curves under different conditions steadily increase during the first 100 epochs, followed by a slow rise over the next 200 epochs, and finally stabilize. None of these curves show a downward trend after reaching their peak values, indicating that overfitting did not occur during the training of our LRI-YOLO model.

4.4. Contrast Experiments

To demonstrate the effectiveness of LRI-YOLO in infrared aerial target detection tasks, the HIT-UAV dataset was used to perform a series of comparative experiments. Currently, mainstream object detection models can be broadly categorized into two types: the YOLO series and the transformer-based DETR [49,50,51] series. YOLO models are widely used due to their fast detection speed. In contrast, DETR models generally have higher computational complexity and slower inference speeds. Therefore, most comparison experiments select YOLO models as the primary benchmark. However, to ensure the comprehensiveness of the comparison, the RT-DETR [52] model, known for its faster detection speed, was also included in the experiments for evaluation.
The models selected for the comparison experiment were all trained on the HIT-UAV dataset. After training, a simple validation was performed on the validation set, and the model weights with the highest accuracy were saved. These saved weights were then used for final testing on the test set, where various evaluation metrics were computed. These metrics allow for the comparison of different models. The overall process of the comparison experiment is illustrated in Figure 11.
In the comparative experiments, we maintained consistent training settings with LRI-YOLO on the HIT-UAV dataset. The final outcomes are presented in Table 6. As indicated by these results, our algorithm exhibits outstanding detection performance on the aerial infrared dataset. The model with the highest detection accuracy is YOLOv5s, with an accuracy of 94.2%. This is followed by our improved model, LRI-YOLO, and YOLOv5m, both achieving an accuracy of 94.1%, just 0.1% less than the highest accuracy. The RT-DETR model did not perform well on this dataset, achieving an accuracy of only 93.1%. This indicates that our model has excellent detection accuracy.
Additionally, we selected four images from different scenes in the test set to compare the detection performance of the highest-accuracy YOLOv5s model with LRI-YOLO. The detection results are shown in Figure 12. The first image in each group represents the real label, the second image represents the detection results of Yolov5s, and the third image represents the detection results of LRI-YOLO. The occurrence of misdetections is marked with a yellow box, and the occurrence of missed detections is marked with a blue box. In the first and second groups, LRI-YOLO successfully detected all true labels, and YOLOv5s, with the highest detection accuracy, also detected all labeled objects. This is mainly because the targets in these groups, such as cars and bicycles, are relatively large, leading to better detection performance. From a drone’s perspective, human targets are smaller and carry limited feature information, which increases the likelihood of false positives and missed detections. In the third and fourth groups, LRI-YOLO successfully detected most of the human targets; however, in the third group, it mistakenly identified another object as a human in the upper-left corner, and in the fourth group, it failed to detect one human target. YOLOv5s, the most accurate model, also made the same mistakes in the third and fourth images. Through the analysis of these four images, it is evident that LRI-YOLO can correctly detect the majority of infrared targets, though there is a slight chance of false positives and missed detections, particularly with human targets.
LRI-YOLO has 1.8M parameters and a computational complexity of only 3.8 GFLOPs, placing it among the leading models in terms of efficiency. Among the YOLO series, the lightest model is YOLOv5n; however, its parameter count and computational complexity are still significantly higher than those of LRI-YOLO. As for the RT-DETR model, both its parameter count and computational complexity are more than ten times that of LRI-YOLO. Although our improved model did not achieve the highest detection accuracy, LRI-YOLO has the fewest training parameters and the lowest computational complexity. The parameter count is only 1.5M, and the computational complexity is just 3.9 GFLOPs. Compared to the highest-accuracy model, YOLOv5s, LRI-YOLO’s parameter count is only 1/60th and its computational complexity is only 1/7th. This means that the improved LRI-YOLO can achieve excellent detection performance without consuming excessive computational resources.
Since GPUs accelerate neural network inference tasks, most mainstream object detection models can meet real-time requirements when running on GPUs. However, on edge devices like drones, which only have CPUs, executing detection tasks is challenging due to the lack of computational resources, making it difficult to achieve the same speed as on GPU-equipped devices. Therefore, in the comparison experiments, GPU usage was restricted, and inference was performed using only the CPU to simulate resource-constrained devices. As shown in Table 6, LRI-YOLO achieved the fastest detection speed using a CPU, reaching 42 frames per second (FPS), which meets real-time detection requirements. Next was YOLOv6, with a speed of 38 FPS, while RT-DETR achieved only 8 FPS on the CPU. To more clearly demonstrate the superiority of LRI-YOLO in terms of detection speed on the CPU, a subset of the data from Table 6 was collected and plotted as a scatter plot shown in Figure 13. The horizontal axis represents the model’s detection speed, the vertical axis represents the model’s detection accuracy, and the size of the points reflects the model size. From the figure, it can be seen that LRI-YOLO is the smallest among all models and performs well in terms of detection accuracy, providing a new solution for real-time infrared object detection tasks on edge computing devices such as drones.
To validate the effectiveness of LRI-YOLO in different scenarios, we also selected several lightweight object detection models and tested them, along with LRI-YOLO, on the infrared aerial human–vehicle detection dataset provided by the Iraytek company. This dataset was captured by drones equipped with professional infrared camera gimbals, recording human and vehicle targets in various scenarios. The dataset contains a large amount of infrared image data taken from a surveillance overhead perspective, with the drone flying at an altitude of approximately 10–15 m above the ground. The collected data mainly consist of small infrared targets. The images were annotated with six types of infrared targets: pedestrians, cars, buses, bicycles, cyclists, and trucks. The image resolution is 640 × 512. The test results are shown in Table 7. LRI-YOLO achieved an accuracy of 86.7% on this dataset, which, while not the highest, was still among the leading models. Additionally, LRI-YOLO has the smallest number of parameters and the lowest computational complexity among these lightweight models. YOLOv8s achieved the highest accuracy at 90.0%, but its parameter count is about eight times that of LRI-YOLO, and its computational complexity is about five times higher, meaning it requires significantly more computational resources. LRI-YOLO, when using a GPU for detection on this dataset, achieved a speed of 231 FPS, leading the group. On a CPU, the detection speed reached 38 FPS, meeting the requirements for real-time detection.

5. Conclusions

A new lightweight infrared object detection algorithm, LRI-YOLO, has been proposed for aerial infrared images, making it well suited for aerial infrared object detection tasks. Most mainstream models have large parameter counts and high computational complexity, enabling real-time detection on powerful devices with substantial computational resources. However, on edge devices without GPUs, these models tend to have slower detection speeds, failing to meet real-time requirements. In contrast, LRI-YOLO, with its lightweight model structure, can execute real-time detection on CPU devices that have restricted computational power.
The LRI-YOLO model was developed by enhancing the YOLOv8n baseline model. These improvements have resulted in increased detection accuracy and a more lightweight model structure. Tests on the HIT-UAV dataset demonstrate that the enhanced LRI-YOLO achieved a 0.3% accuracy improvement, reaching 94.1%. Additionally, the model’s parameters were reduced to 53.3% of the baseline, and its computational complexity was just 46.9% of the original. As a result, the detection speed significantly increased, with the model achieving an additional 10 FPS on GPU (totaling 240 FPS) and 10 FPS on CPU (totaling 42 FPS).
Although our model performed well on both datasets, these datasets lack infrared images captured under complex conditions, such as low contrast or infrared noise. Therefore, in practical applications where infrared scenes are more complicated, it is necessary to collect infrared images under these challenging conditions for targeted training.
The LRI-YOLO model is a lightweight aerial infrared object detection model. It can be deployed on edge devices such as drones for real-time detection, making it suitable for infrared object detection tasks in various scenarios, including wilderness, urban areas, and roads. This model has promising application prospects.

Author Contributions

Conceptualization, B.D.; methodology, B.D.; software, B.D.; validation, B.D. and S.M.; formal analysis, B.D.; investigation, B.D.; resources, B.D.; data curation, B.D.; writing—original draft preparation, B.D.; writing—review and editing, B.D. and S.M.; visualization, B.D.; supervision, Y.Z.; project administration, Y.Z.; funding acquisition, Y.Z. All authors have read and agreed to the published version of the manuscript.

Funding

This research was funded by the Shanghai Industrial Collaborative Innovation Project, grant number XTCX-KJ-2023-2-18.

Data Availability Statement

The HIT-UAV dataset used in this study is publicly accessible and can be obtained from the official repository: https://github.com/suojiashun/HIT-UAV-Infrared-Thermal-Dataset (accessed on 25 March 2024). The infrared aerial human–vehicle detection dataset provided by the Iraytek company can be accessed via the following link: http://openai.iraytek.com/apply/Aerial_mancar.html/ (accessed on 25 May 2024). The code used in this study can be obtained from the first author upon request.

Conflicts of Interest

The authors declare no conflicts of interest.

References

  1. Wu, X.; Li, W.; Hong, D.; Tao, R.; Du, Q. Deep Learning for Unmanned Aerial Vehicle-Based Object Detection and Tracking: A Survey. IEEE Geosci. Remote Sens. Mag. 2022, 10, 91–124. [Google Scholar] [CrossRef]
  2. Yue, M.; Zhang, L.; Huang, J.; Zhang, H. Lightweight and Efficient Tiny-Object Detection Based on Improved YOLOv8n for UAV Aerial Images. Drones 2024, 8, 276. [Google Scholar] [CrossRef]
  3. Cao, S.; Deng, J.; Luo, J.; Li, Z.; Hu, J.; Peng, Z. Local Convergence Index-Based Infrared Small Target Detection against Complex Scenes. Remote Sens. 2023, 15, 1464. [Google Scholar] [CrossRef]
  4. Fan, X.; Li, H.; Chen, Y.; Dong, D. UAV Swarm Search Path Planning Method Based on Probability of Containment. Drones 2024, 8, 132. [Google Scholar] [CrossRef]
  5. Oh, D.; Han, J. Smart Search System of Autonomous Flight UAVs for Disaster Rescue. Sensors 2021, 21, 6810. [Google Scholar] [CrossRef]
  6. Qiu, Z.; Bai, H.; Chen, T. Special Vehicle Detection from UAV Perspective via YOLO-GNS Based Deep Learning Network. Drones 2023, 7, 117. [Google Scholar] [CrossRef]
  7. Niu, C.; Song, Y.; Zhao, X. SE-Lightweight YOLO: Higher Accuracy in YOLO Detection for Vehicle Inspection. Appl. Sci. 2023, 13, 13052. [Google Scholar] [CrossRef]
  8. Shokouhifar, M.; Hasanvand, M.; Moharamkhani, E.; Werner, F. Ensemble Heuristic–Metaheuristic Feature Fusion Learning for Heart Disease Diagnosis Using Tabular Data. Algorithms 2024, 17, 34. [Google Scholar] [CrossRef]
  9. Patel, T.; Guo, B.H.W.; van der Walt, J.D.; Zou, Y. Effective Motion Sensors and Deep Learning Techniques for Unmanned Ground Vehicle (UGV)-Based Automated Pavement Layer Change Detection in Road Construction. Buildings 2023, 13, 5. [Google Scholar] [CrossRef]
  10. Seth, A.; James, A.; Kuantama, E.; Mukhopadhyay, S.; Han, R. Drone High-Rise Aerial Delivery with Vertical Grid Screening. Drones 2023, 7, 300. [Google Scholar] [CrossRef]
  11. Zhang, S.; Liu, F. Infrared and Visible Image Fusion Based on Non-subsampled Shearlet Transform, Regional Energy, and Co-occurrence Filtering. Electron. Lett. 2020, 56, 761–764. [Google Scholar] [CrossRef]
  12. Fan, Y.; Qiu, Q.; Hou, S.; Li, Y.; Xie, J.; Qin, M.; Chu, F. Application of Improved YOLOv5 in Aerial Photographing Infrared Vehicle Detection. Electronics 2022, 11, 2344. [Google Scholar] [CrossRef]
  13. Yang, L.; Xie, T.; Liu, M.; Zhang, M.; Qi, S.; Yang, J. Infrared Small-Target Detection under a Complex Background Based on a Local Gradient Contrast Method. Int. J. Appl. Math. Comput. Sci. 2023, 33, 7–70. [Google Scholar] [CrossRef]
  14. Pan, L.; Liu, T.; Cheng, J.; Cheng, B.; Cai, Y. AIMED-Net: An Enhancing Infrared Small Target Detection Net in UAVs with Multi-Layer Feature Enhancement for Edge Computing. Remote Sens. 2024, 16, 1776. [Google Scholar] [CrossRef]
  15. Feng, H.; Mu, G.; Zhong, S.; Zhang, P.; Yuan, T. Benchmark Analysis of YOLO Performance on Edge Intelligence Devices. Cryptography 2022, 6, 16. [Google Scholar] [CrossRef]
  16. Lin, T.-Y.; Maire, M.; Belongie, S.; Hays, J.; Perona, P.; Ramanan, D.; Dollár, P.; Zitnick, C.L. Microsoft COCO: Common Objects in Context. In Computer Vision—ECCV 2014; Fleet, D., Pajdla, T., Schiele, B., Tuytelaars, T., Eds.; Lecture Notes in Computer Science; Springer International Publishing: Cham, Switzerland, 2014; Volume 8693, pp. 740–755. ISBN 978-3-319-10601-4. [Google Scholar]
  17. Wang, Y.; Tian, Y.; Liu, J.; Xu, Y. Multi-Stage Multi-Scale Local Feature Fusion for Infrared Small Target Detection. Remote Sens. 2023, 15, 4506. [Google Scholar] [CrossRef]
  18. Chang, Y.; Li, D.; Gao, Y.; Su, Y.; Jia, X. An Improved YOLO Model for UAV Fuzzy Small Target Image Detection. Appl. Sci. 2023, 13, 5409. [Google Scholar] [CrossRef]
  19. Wu, A.; Deng, C. TIB: Detecting Unknown Objects via Two-Stream Information Bottleneck. IEEE Trans. Pattern Anal. Mach. Intell. 2024, 46, 611–625. [Google Scholar] [CrossRef]
  20. Wu, A.; Deng, C.; Liu, W. Unsupervised Out-of-Distribution Object Detection via PCA-Driven Dynamic Prototype Enhancement. IEEE Trans. Image Process. 2024, 33, 2431–2446. [Google Scholar] [CrossRef]
  21. Wu, A.; Deng, C. Single-Domain Generalized Object Detection in Urban Scene via Cyclic-Disentangled Self-Distillation. In Proceedings of the 2022 IEEE/CVF Conference on Computer Vision and Pattern Recognition (CVPR), New Orleans, LA, USA, 19–24 June 2022; pp. 837–846. [Google Scholar]
  22. Girshick, R.; Donahue, J.; Darrell, T.; Malik, J. Rich Feature Hierarchies for Accurate Object Detection and Semantic Segmentation. arXiv 2014, arXiv:1311.2524. pp. 580–587. [Google Scholar]
  23. Girshick, R. Fast R-CNN. arXiv 2015, arXiv:1504.08083. pp. 1440–1448. [Google Scholar]
  24. Ren, S.; He, K.; Girshick, R.; Sun, J. Faster R-CNN: Towards Real-Time Object Detection with Region Proposal Networks. In Proceedings of the Advances in Neural Information Processing Systems; Curran Associates: New York, NY, USA, 2015; Volume 28. [Google Scholar]
  25. Liu, M.; Wang, X.; Zhou, A.; Fu, X.; Ma, Y.; Piao, C. Uav-Yolo: Small Object Detection on Unmanned Aerial Vehicle Perspective. Sensors 2020, 20, 2238. [Google Scholar] [CrossRef] [PubMed]
  26. Wu, X.; Hong, D.; Ghamisi, P.; Li, W.; Tao, R. MsRi-CCF: Multi-Scale and Rotation-Insensitive Convolutional Channel Features for Geospatial Object Detection. Remote Sens. 2018, 10, 1990. [Google Scholar] [CrossRef]
  27. Liu, W.; Anguelov, D.; Erhan, D.; Szegedy, C.; Reed, S.; Fu, C.-Y.; Berg, A.C. SSD: Single Shot MultiBox Detector. In Proceedings of the Computer Vision—ECCV 2016; Leibe, B., Matas, J., Sebe, N., Welling, M., Eds.; Springer International Publishing: Cham, Switzerland, 2016; pp. 21–37. [Google Scholar]
  28. Redmon, J.; Divvala, S.; Girshick, R.; Farhadi, A. You Only Look Once: Unified, Real-Time Object Detection. In Proceedings of the 2016 IEEE Conference on Computer Vision and Pattern Recognition (CVPR), Las Vegas, NV, USA, 27–30 June 2016; pp. 779–788. [Google Scholar]
  29. Redmon, J.; Farhadi, A. YOLOv3: An Incremental Improvement. arXiv 2018, arXiv:1804.02767. [Google Scholar]
  30. Wang, C.-Y.; Bochkovskiy, A.; Liao, H.-Y.M. YOLOv7: Trainable Bag-of-Freebies Sets New State-of-the-Art for Real-Time Object Detectors. arXiv 2023, arXiv:2207.02696. pp. 7464–7475. [Google Scholar]
  31. Reis, D.; Kupec, J.; Hong, J.; Daoudi, A. Real-Time Flying Object Detection with YOLOv8. arXiv 2024, arXiv:2305.09972. [Google Scholar]
  32. Chen, C.; Zheng, Z.; Xu, T.; Guo, S.; Feng, S.; Yao, W.; Lan, Y. YOLO-Based UAV Technology: A Review of the Research and Its Applications. Drones 2023, 7, 190. [Google Scholar] [CrossRef]
  33. Liang, S.; Wu, H.; Zhen, L.; Hua, Q.; Garg, S.; Kaddoum, G.; Hassan, M.M.; Yu, K. Edge YOLO: Real-Time Intelligent Object Detection System Based on Edge-Cloud Cooperation in Autonomous Vehicles. IEEE Trans. Intell. Transp. Syst. 2022, 23, 25345–25360. [Google Scholar] [CrossRef]
  34. Wu, H.; Zhu, Y.; Li, S. CDYL for Infrared and Visible Light Image Dense Small Object Detection. Sci. Rep. 2024, 14, 3510. [Google Scholar] [CrossRef]
  35. Jiang, C.; Ren, H.; Ye, X.; Zhu, J.; Zeng, H.; Nan, Y.; Sun, M.; Ren, X.; Huo, H. Object Detection from UAV Thermal Infrared Images and Videos Using YOLO Models. Int. J. Appl. Earth Obs. Geoinf. 2022, 112, 102912. [Google Scholar] [CrossRef]
  36. Zhao, X.; Xia, Y.; Zhang, W.; Zheng, C.; Zhang, Z. YOLO-ViT-Based Method for Unmanned Aerial Vehicle Infrared Vehicle Target Detection. Remote Sens. 2023, 15, 3778. [Google Scholar] [CrossRef]
  37. Zhao, X.; Zhang, W.; Zhang, H.; Zheng, C.; Ma, J.; Zhang, Z. ITD-YOLOv8: An Infrared Target Detection Model Based on YOLOv8 for Unmanned Aerial Vehicles. Drones 2024, 8, 161. [Google Scholar] [CrossRef]
  38. Liu, S.; Qi, L.; Qin, H.; Shi, J.; Jia, J. Path Aggregation Network for Instance Segmentation. arXiv 2018, arXiv:1803.01534. pp. 8759–8768. [Google Scholar]
  39. Krizhevsky, A.; Sutskever, I.; Hinton, G.E. ImageNet Classification with Deep Convolutional Neural Networks. In Proceedings of the Advances in Neural Information Processing Systems; Curran Associates: New York, NY, USA, 2012; Volume 25. [Google Scholar]
  40. Shannon, C.E. A Mathematical Theory of Communication. Bell Syst. Tech. J. 1948, 27, 379–423. [Google Scholar] [CrossRef]
  41. Chen, J.; Kao, S.; He, H.; Zhuo, W.; Wen, S.; Lee, C.-H.; Chan, S.-H.G. Run, Don’t Walk: Chasing Higher FLOPS for Faster Neural Networks. arXiv 2023, arXiv:2303.03667. pp. 12021–12031. [Google Scholar]
  42. Howard, A.G.; Zhu, M.; Chen, B.; Kalenichenko, D.; Wang, W.; Weyand, T.; Andreetto, M.; Adam, H. MobileNets: Efficient Convolutional Neural Networks for Mobile Vision Applications. arXiv 2017, arXiv:1704.04861. [Google Scholar]
  43. Larsson, G.; Maire, M.; Shakhnarovich, G. FractalNet: Ultra-Deep Neural Networks without Residuals. arXiv 2016, arXiv:1605.07648. [Google Scholar] [CrossRef]
  44. Li, X.; Wang, W.; Hu, X.; Li, J.; Tang, J.; Yang, J. Generalized Focal Loss V2: Learning Reliable Localization Quality Estimation for Dense Object Detection. arXiv 2021, arXiv:2011.12885. pp. 11632–11641. [Google Scholar]
  45. Zheng, Z.; Wang, P.; Liu, W.; Li, J.; Ye, R.; Ren, D. Distance-IoU Loss: Faster and Better Learning for Bounding Box Regression. In Proceedings of the AAAI Conference on Artificial Intelligence, New York, NY, USA, 7–12 February 2020; Volume 34, pp. 12993–13000. [Google Scholar]
  46. Everingham, M.; Van Gool, L.; Williams, C.K.I.; Winn, J.; Zisserman, A. The Pascal Visual Object Classes (VOC) Challenge. Int. J. Comput. Vis. 2010, 88, 303–338. [Google Scholar] [CrossRef]
  47. Yu, Z.; Huang, H.; Chen, W.; Su, Y.; Liu, Y.; Wang, X. YOLO-FaceV2: A Scale and Occlusion Aware Face Detector. Pattern Recognit. 2024, 155, 110714. [Google Scholar] [CrossRef]
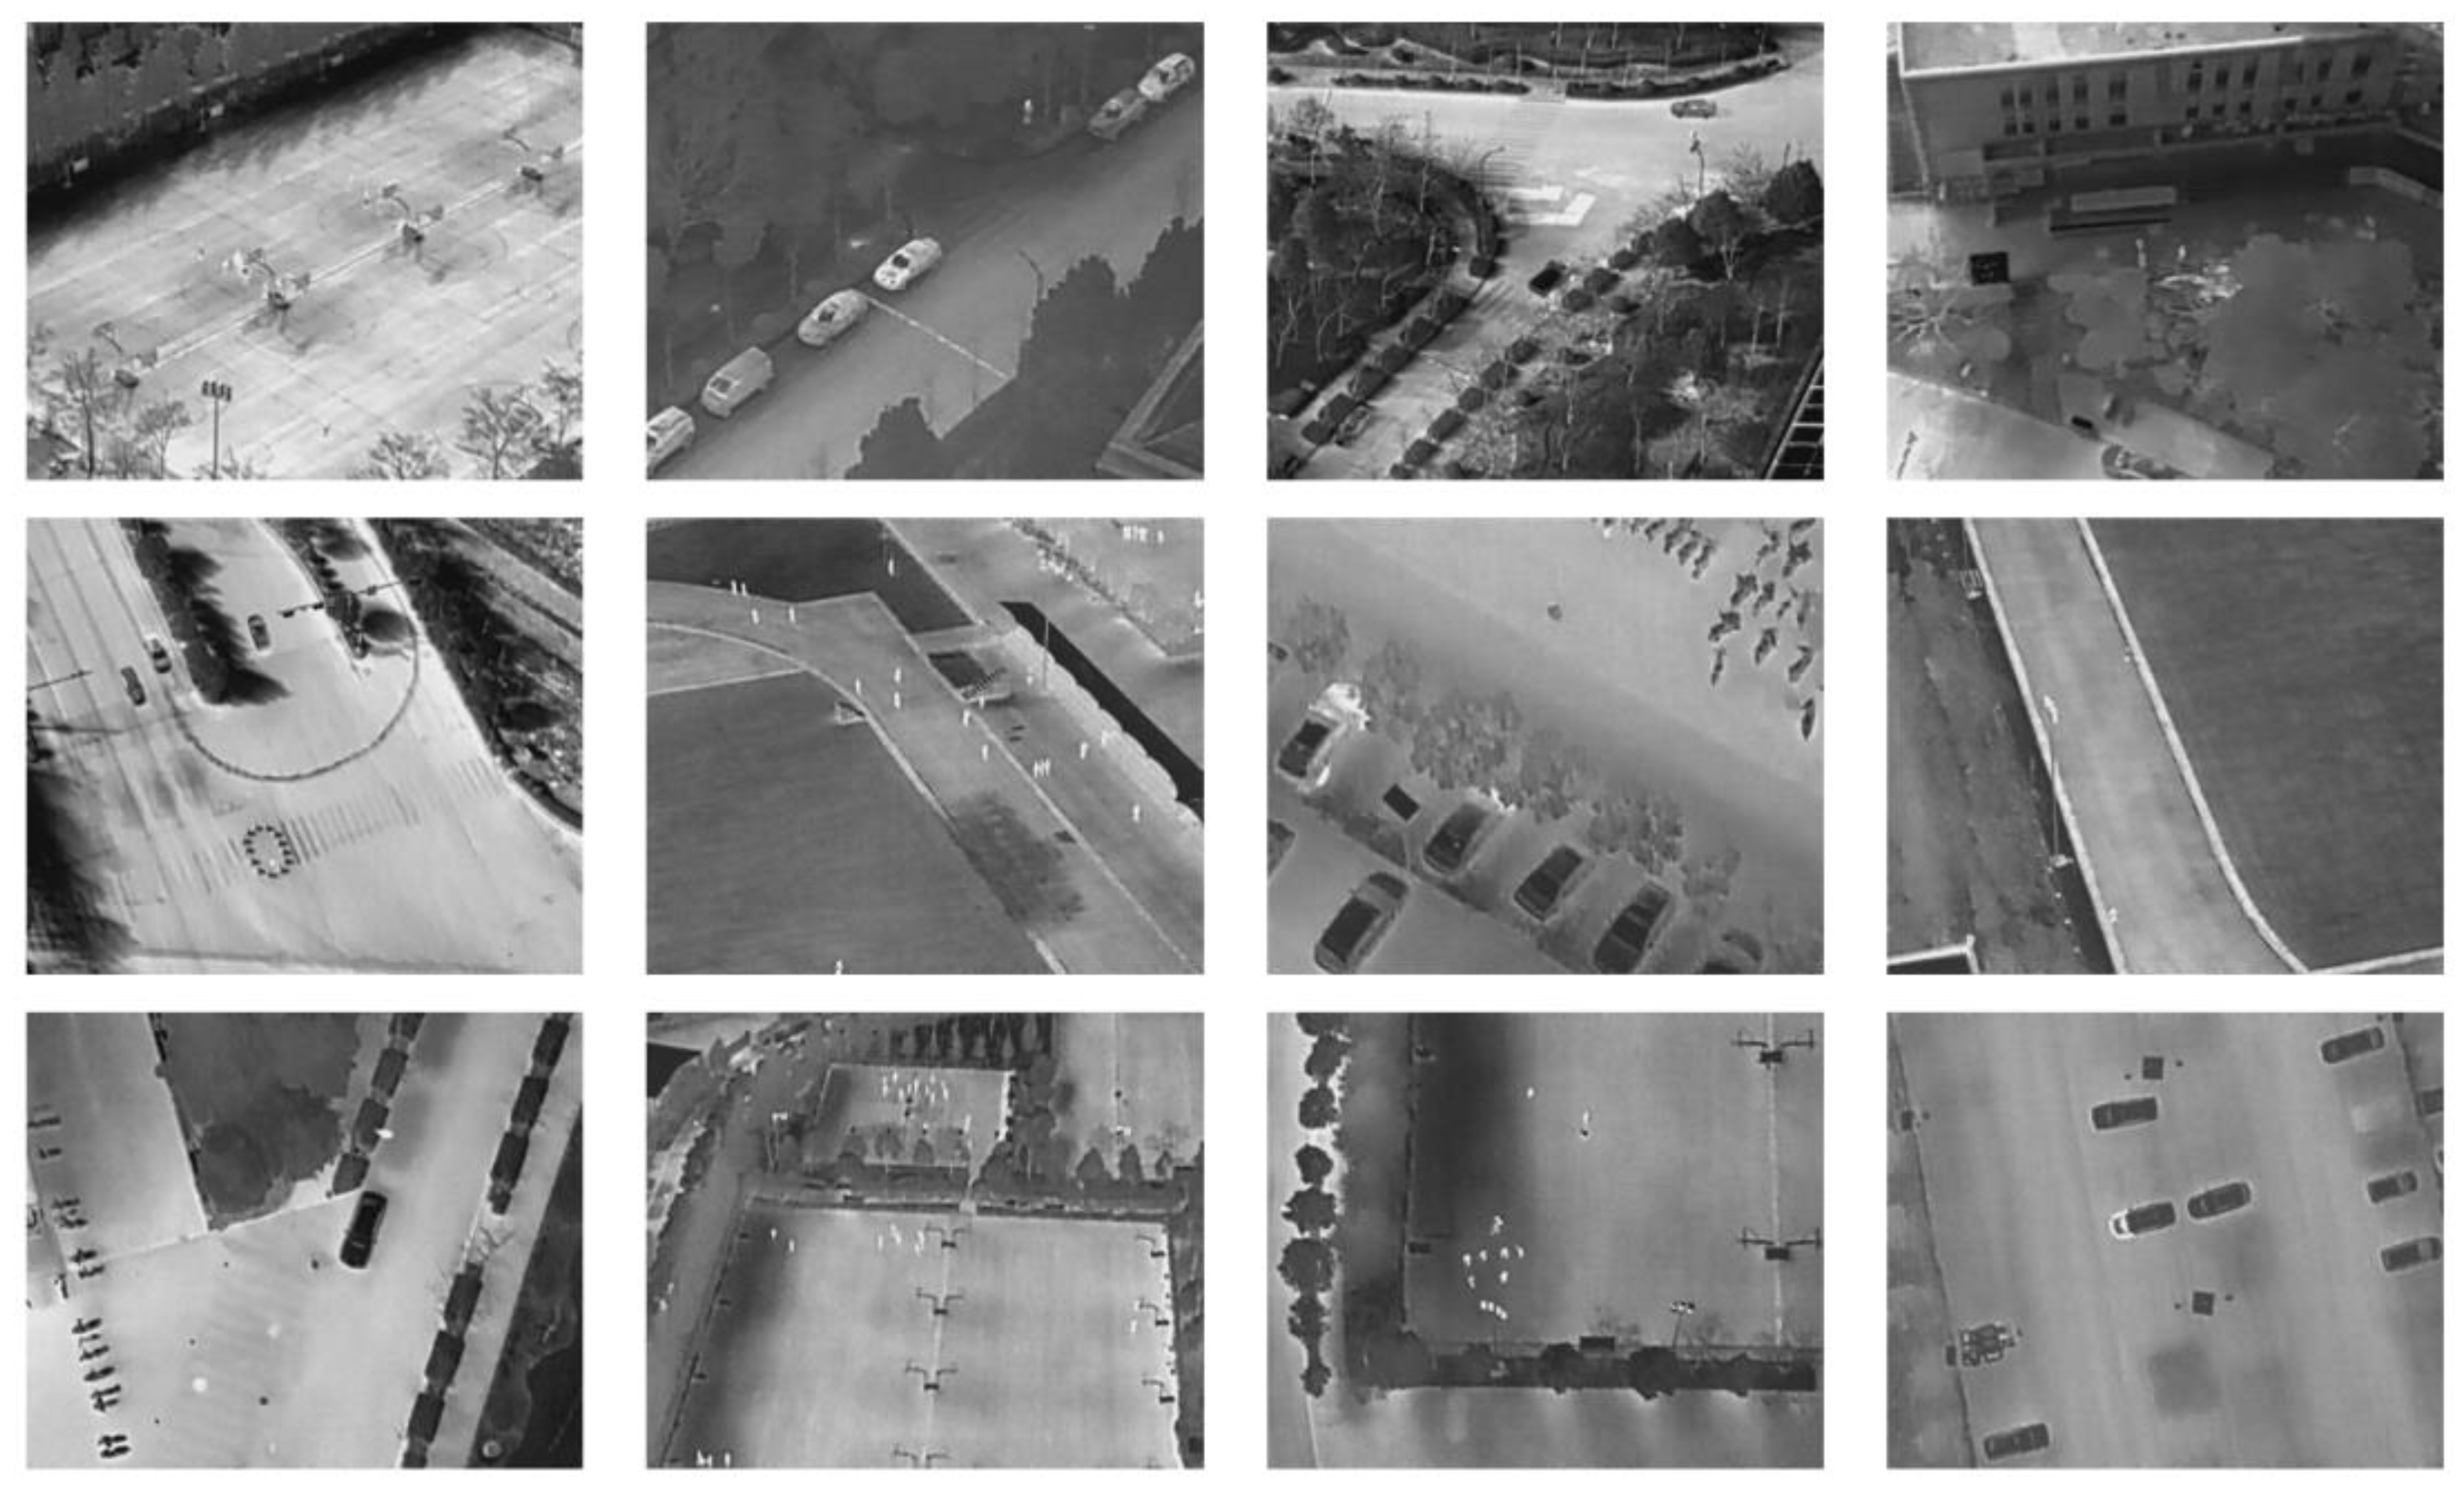
  48. Suo, J.; Wang, T.; Zhang, X.; Chen, H.; Zhou, W.; Shi, W. HIT-UAV: A High-Altitude Infrared Thermal Dataset for Unmanned Aerial Vehicle-Based Object Detection. Sci. Data 2023, 10, 227. [Google Scholar] [CrossRef] [PubMed]
  49. Zhu, X.; Su, W.; Lu, L.; Li, B.; Wang, X.; Dai, J. Deformable DETR: Deformable Transformers for End-to-End Object Detection. arXiv 2010, arXiv:2010.04159. [Google Scholar] [CrossRef]
  50. Dai, Z.; Cai, B.; Lin, Y.; Chen, J. UP-DETR: Unsupervised Pre-Training for Object Detection with Transformers. arXiv 2021, arXiv:2011.09094. pp. 1601–1610. [Google Scholar]
  51. Dai, X.; Chen, Y.; Yang, J.; Zhang, P.; Yuan, L.; Zhang, L. Dynamic DETR: End-to-End Object Detection with Dynamic Attention. In Proceedings of the IEEE/CVF International Conference on Computer Vision (ICCV), Montreal, BC, Canada, 11–17 October 2021; pp. 2988–2997. [Google Scholar]
  52. Lv, W.; Zhao, Y.; Xu, S.; Wei, J.; Wang, G.; Cui, C.; Du, Y.; Dang, Q.; Liu, Y. DETRs Beat YOLOs on Real-Time Object Detection. arXiv 2023, arXiv:2304.08069. [Google Scholar] [CrossRef]
Figure 1. The YOLOv8 network structure diagram.
Drones 08 00479 g001
Figure 2. The LRI-YOLO network structure diagram. Faster-C2f, Super-Downsample, and Efficient-Head are the three modules proposed in this paper, and the details of these modules will be presented in the following text.
Drones 08 00479 g002
Figure 3. The Faster-C2f module structure diagram.
Drones 08 00479 g003
Figure 4. The Partial Convolution schematic diagram (* denotes a convolution operation).
Drones 08 00479 g004
Figure 5. The Pointwise Convolution schematic diagram (* denotes a convolution operation).
Drones 08 00479 g005
Figure 6. The Super-Downsample module structure diagram.
Drones 08 00479 g006
Figure 7. The Efficient-Head module structure diagram.
Drones 08 00479 g007
Figure 8. The Group Convolution schematic diagram (* denotes a convolution operation).
Drones 08 00479 g008
Figure 9. The partial image of the HIT-UAV dataset.
Drones 08 00479 g009
Figure 10. The evaluation metric curves.
Drones 08 00479 g010
Figure 11. Flow chart of comparison experiment.
Drones 08 00479 g011
Figure 12. Visualization of detection results where pink boxes indicate car targets, red boxes indicate human targets, and orange boxes indicate bicycle targets (areas framed in green indicate a false detection; areas framed in blue indicate a missed detection).
Drones 08 00479 g012
Figure 13. Scatterplot of combined mAP and speed on CPU parameters (the size of the dots in the graph indicates the size of the number of parameters, with smaller dots indicating fewer parameters).
Drones 08 00479 g013
Table 1. Number of objects of different sizes in the HIT-UAV dataset.
SmallMediumLarge
HIT-UAV17,1187249268
Training set12,0455205268
Validation set174266546
Test set3331137970
Table 2. Experimental platform configuration.
NamesConfigurations
GPUNVIDIA RTX 4090
CPUIntel(R) Xeon(R) Platinum 8352V
GPU memory size24 G
Operating systemLinux
Python versionPython3.10
Deep learning frameworkPytorch2.1.2
Table 3. Model training parameter settings.
ParametersValue
OptimizerSGD
Initial learning rate0.01%
Momentum0.937
Weight decay0.0005
Data augmentationMosaic
Batch size32
Image size640 × 640
Number of epochs300
Table 4. The Efficient-Head hyperparameter experimental results on the HIT-UAV dataset.
ModelP
(%)
R
(%)
Parameters
(M)
FLOPs
(G)
mAP50
(%)
Speed on GPU
(FPS)
Speed on CPU
(FPS)
Yolov8n9189.438.193.822930
Yolov8n+Efficient-Head (g = 2)90.987.72.35.393.327138
Yolov8n+Efficient-Head (g = 4)91.188.32.35.393.327039
Yolov8n+Efficient-Head (g = 8)91.388.12.45.493.427140
Yolov8n+Efficient-Head (g = 16)91.589.32.45.693.627439
Yolov8n+Efficient-Head (g = 32)91.988.62.5693.726239
Yolov8n+Efficient-Head (g = 64) 91.788.52.86.993.226037
Table 5. Results of ablation experiments on HIT-UAV.
Yolov8ABCDP
(%)
R
(%)
Parameters
(M)
FLOPs
(G)
mAP0.5
(%)
Speed on GPU
(FPS)
Speed on CPU
(FPS)
91.089.438.193.822930
91.4 (+0.4)89.3 (−0.1)2.39 (−0.61)6.3 (−1.8)94.0 (+0.2)232 (+3)37 (+7)
91.5 (+0.5)89.3 (−0.1)2.4 (−0.6)5.6 (−2.5)93.6 (−0.2)274 (+45)39 (+9)
91.2 (+0.2)89.4 (−0.0)2.9 (−0.1)8.0 (−0.1)94.0 (+0.2)235 (+6)33 (+3)
91.9 (+0.9)88.7 (−0.7)3 (−0.0)8.1 (−0.0)93.8 (+0.0)229 (+0)30 (+0)
90.5 (−0.5)87.3 (−2.1)1.7 (−1.3)3.9 (−4.2)93.4 (−0.4)238 (+9)34 (+4)
91.4 (+0.4)89.1 (−0.3)1.6 (−1.4)3.8 (−4.3)93.9 (+0.1)240 (+11)42 (+12)
90.7 (−0.3)89.1 (−0.3)1.6 (−1.4)3.8 (−4.3)94.1 (+0.3)240 (+11)42 (+12)
Table 6. Comparison of experimental results on HIT-UAV dataset.
ModelP
(%)
R
(%)
Parameters
(M)
FLOPs
(G)
mAP50
(%)
Speed on GPU
(FPS)
Speed on CPU
(FPS)
RTDETR-r1889.488.819.956.993.1648
Yolov3-tiny86.880.412.118.987.630032.8
Yolov391.390.2103.7282.293.7121.84.8
Yolov5n91.488.72.57.193.7234.337.3
Yolov5s91.990.29.123.894.2237.323.9
Yolov5m91.091.0256494.1187.712.4
Yolov5l92.589.853.1134.793.5157.48
Yolov690.387.44.211.892.628538
Yolov8n91.089.438.193.822930
Yolov8s91.489.911.128.494.122822.1
Yolov8m92.388.925.878.793.8202.312.6
Ours90.789.11.63.894.124042
Table 7. Comparison of experimental results on the infrared aerial human–vehicle detection dataset.
ModelP
(%)
R
(%)
Parameters
(M)
FLOPs
(G)
mAP50
(%)
Speed on GPU
(FPS)
Speed on CPU
(FPS)
RT-DETR-r1885.182.919.956.987.5637
Yolov3-tiny83.778.612.118.983.728017
Yolov5n84.580.02.57.186.421327
Yolov5s86.284.79.123.889.821115
Yolov682.775.94.211.882.226235
Yolov7-tiny85.080.26.0213.286.220326
Yolov8n83.980.638.186.622028
Yolov8s85.985.511.128.490.021014
Ours83.681.01.63.886.723138
Disclaimer/Publisher’s Note: The statements, opinions and data contained in all publications are solely those of the individual author(s) and contributor(s) and not of MDPI and/or the editor(s). MDPI and/or the editor(s) disclaim responsibility for any injury to people or property resulting from any ideas, methods, instructions or products referred to in the content.

