Article

Detecting Canopy Gaps in Uneven-Aged Mixed Forests through the Combined Use of Unmanned Aerial Vehicle Imagery and Deep Learning

by
Nyo Me Htun
1,
Toshiaki Owari
2,*,
Satoshi Tsuyuki
1 and
Takuya Hiroshima
1
1
Department of Global Agricultural Sciences, Graduate School of Agricultural and Life Sciences, The University of Tokyo, Tokyo 113-8657, Japan
2
The University of Tokyo Hokkaido Forest, Graduate School of Agricultural and Life Sciences, The University of Tokyo, Furano 079-1563, Japan
*
Author to whom correspondence should be addressed.
Drones 2024, 8(9), 484; https://doi.org/10.3390/drones8090484
Submission received: 10 August 2024 / Revised: 6 September 2024 / Accepted: 12 September 2024 / Published: 13 September 2024

Abstract

:
Canopy gaps and their associated processes play an important role in shaping forest structure and dynamics. Understanding the information about canopy gaps allows forest managers to assess the potential for regeneration and plan interventions to enhance regeneration success. Traditional field surveys for canopy gaps are time consuming and often inaccurate. In this study, canopy gaps were detected using unmanned aerial vehicle (UAV) imagery of two sub-compartments of an uneven-aged mixed forest in northern Japan. We compared the performance of U-Net and ResU-Net (U-Net combined with ResNet101) deep learning models using RGB, canopy height model (CHM), and fused RGB-CHM data from UAV imagery. Our results showed that the ResU-Net model, particularly when pre-trained on ImageNet (ResU-Net_2), achieved the highest F1-scores—0.77 in Sub-compartment 42B and 0.79 in Sub-compartment 16AB—outperforming the U-Net model (0.52 and 0.63) and the non-pre-trained ResU-Net model (ResU-Net_1) (0.70 and 0.72). ResU-Net_2 also achieved superior overall accuracy values of 0.96 and 0.97, outperforming previous methods that used UAV datasets with varying methodologies for canopy gap detection. These findings underscore the effectiveness of the ResU-Net_2 model in detecting canopy gaps in uneven-aged mixed forests. Furthermore, when these trained models were applied as transfer models to detect gaps specifically caused by selection harvesting using pre- and post-UAV imagery, they showed considerable potential, achieving moderate F1-scores of 0.54 and 0.56, even with a limited training dataset. Overall, our study demonstrates that combining UAV imagery with deep learning techniques, particularly pre-trained models, significantly improves canopy gap detection accuracy and provides valuable insights for forest management and future research.

1. Introduction

There are a number of definitions of canopy gaps. According to Yamamoto (2000) [1], gaps are small openings in the forest canopy caused by the mortality or damage of one or a few canopy trees or by the fall of large branches, generally <0.1 ha in area, in different forest types. Brokaw (1987) [2] also defined a canopy gap as a hole that extends through layers of surrounding vegetation, extending down to within 2 m of the ground. Watt (1947) [3] described forest canopy gaps as openings in the forest canopy created by human activities such as selection harvesting [4], or mortality due to natural or human disturbances such as windthrow, logging, insect outbreaks, and wildfires [5]. These gaps play a crucial role in shaping forest structure, light availability, and understory vegetation. The gaps in the canopy represent the cumulative effects of tree failure and mortality, followed by subsequent regrowth and succession [6]. They play a significant role in the ecological processes that occur in natural forests, and their activities influence the structure of these ecosystems [7]. The monitoring of forest canopy variables in small areas on a regular and consistent basis is of critical importance in the context of precision forestry, sustainable management, ecological modeling, and plant physiology assessments.
Ground-based measurement methods, such as the vertical projection of the tree crowns or hemispherical photographs, are labor-intensive and cannot rapidly provide canopy cover estimates [5]. It has been demonstrated that high-resolution remote sensing methods utilizing active sensors, in particular airborne light detection and ranging (LiDAR), offer the most advantageous approach in terms of accuracy and ease of data acquisition. However, the main disadvantage of this approach is the high monetary cost [5,8,9]. In addition to LiDAR, satellite imagery, such as that provided by WorldView-3, has been used in combination with traditional machine learning methods for canopy gap detection [4]. Although satellite data can cover larger areas at a lower cost compared to airborne LiDAR, the resolution and accuracy may be limited to extracting small canopy gaps [5,10,11].
The advent of unmanned aerial vehicles (UAVs) offers a new solution to these problems, providing the potential to map forest stand gaps with remarkable precision. Particularly, previous studies have shown that high-resolution UAVs with an optical RGB sensor provide the most cost-effective data for forest remote sensing applications [9,12,13,14,15]. One of the key advantages of UAV-acquired images is their high resolution, which, combined with the relatively lower cost of data acquisition and processing, makes them particularly appealing for the detailed monitoring of small to medium-sized forest areas [16]. While UAV-mounted LiDAR systems are highly effective in capturing detailed 3D structural information, they are generally more expensive and require more complex processing than UAV-mounted RGB systems. Therefore, UAVs with photogrammetric capabilities offer an affordable, easy-to-use, and sufficiently accurate alternative for applications where 2D data are adequate [17,18], such as in the identification of canopy gaps. A few studies have also already shown the applicability of UAV remote sensing for canopy gaps identification. Chen et al. (2023) [9] used UAV RGB imagery with conventional classification algorithms to detect canopy gaps (with a height of ≤10 m and an area ≥ 5 m2) in species-rich subtropical forests. They achieved a high overall accuracy of 0.96 when validated with field data and 0.85 when validated with LiDAR data. Getzin et al. (2014) [5] demonstrated that UAV photogrammetry is effective for identifying even very small forest canopy gaps (less than 5 m²) in temperate managed and unmanaged forests in Germany.
Additionally, the feasibility of deep learning architectures for the forestry sector has been acknowledged, especially for classification/segmentation tasks [19]. Previous studies explored the applicability of a combined application of deep learning models and UAV RGB imagery for forest applications such as tree species mapping, canopy mapping, detecting bark beetle damage to fir trees, and land cover classification [20,21,22,23,24]. In particular, because of the ability of deep learning to automatically extract features, its nature of robustness to variability, and its efficiency in processing large datasets, the combined application of UAV photogrammetric data and deep learning technology can also be very useful for canopy gap identification even in structurally complex forests. However, to our knowledge, the study of the applicability of this combined technology for canopy gap detection in uneven-aged mixed forests is lacking.
In this study, we demonstrated the applicability of UAV photogrammetric remote sensing data to detect canopy gaps in an uneven-aged mixed forest using deep learning models. For the models, we selected deep learning models called U-Net and ResU-Net, which combines U-Net with ResNet (Residual Network), and examined their feasibility for canopy gap detection. Specifically, we compared the performance of the U-Net and ResU-Net models in detecting canopy gaps. Moreover, we further investigated the applicability of RGB information from UAV imagery compared to the canopy height model (CHM) for canopy gap detection in this study. We integrated the RGB data, CHM data, and the fused RGB and CHM data into deep learning models and rigorously evaluated their performance in detecting canopy gaps. Additionally, we examined whether the trained models developed for canopy gap detection could be repurposed as transfer models to detect canopy gaps specifically caused by selection harvesting. To evaluate the performance of our trained models, the ResU-Net model was also used to detect gaps resulting from selection harvesting. This aimed to assess the versatility and generalizability of the models across different canopy disturbance scenarios, thereby expanding their potential applications in forestry management practices.

2. Materials and Methods

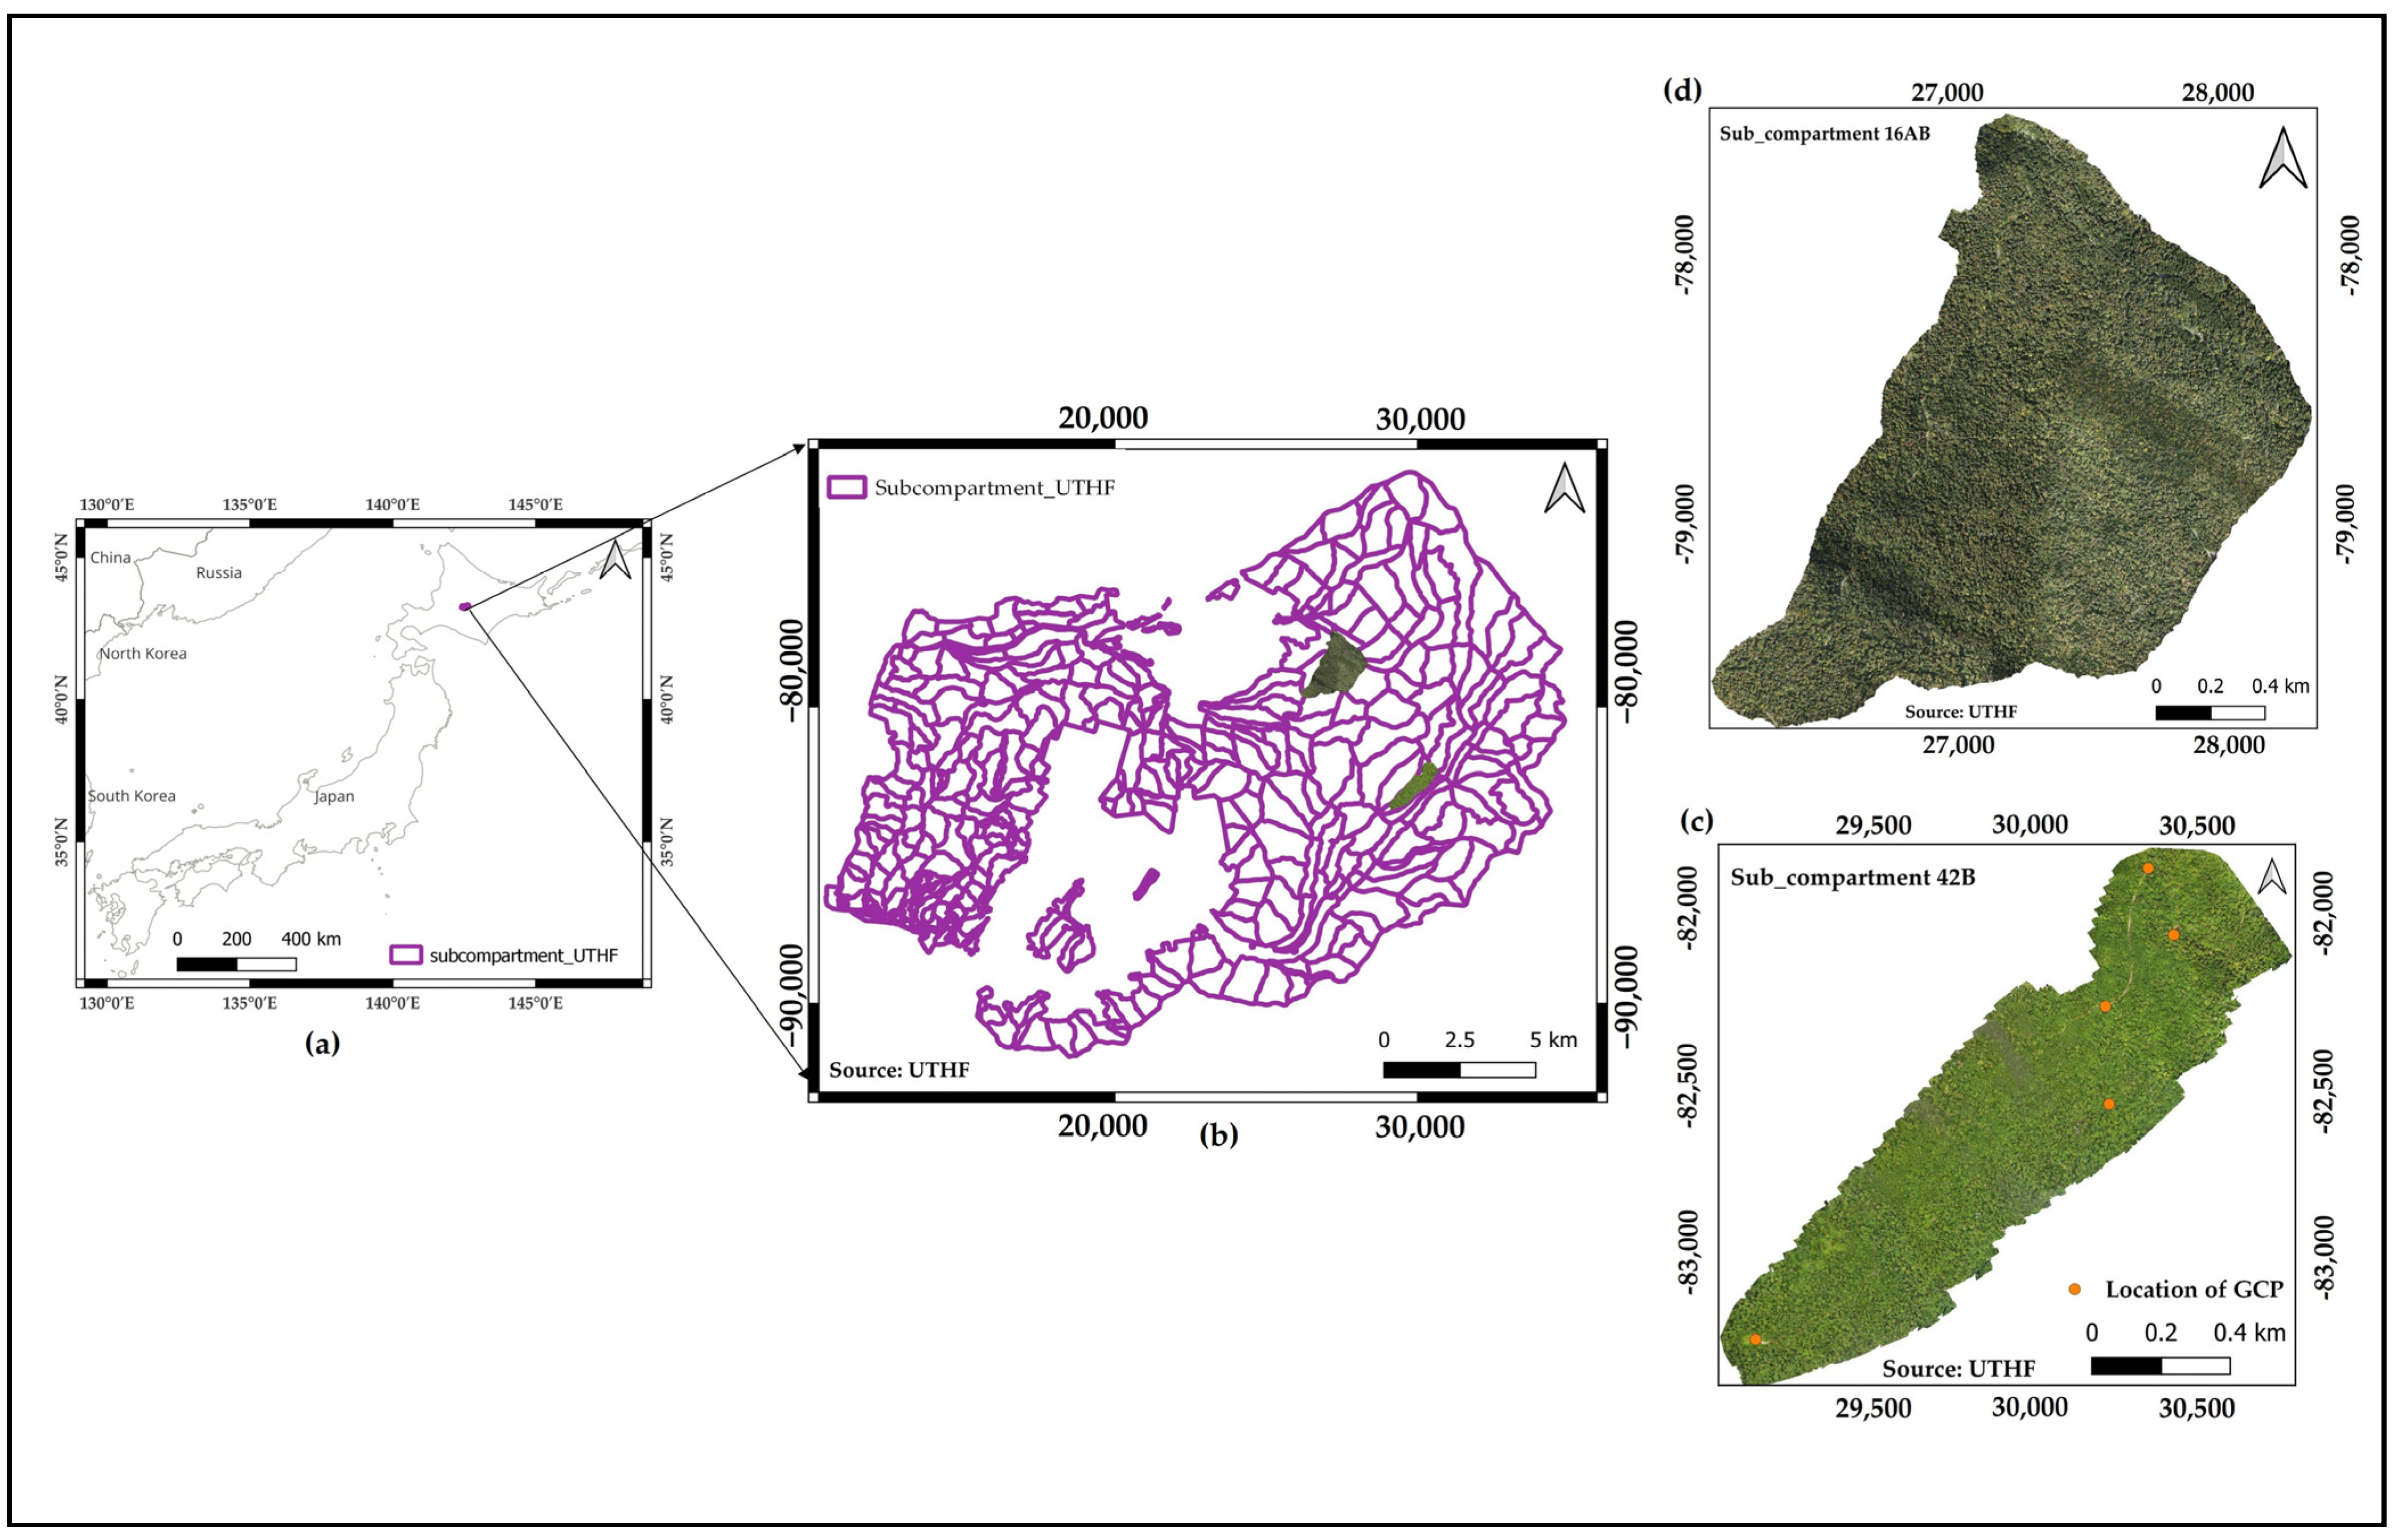
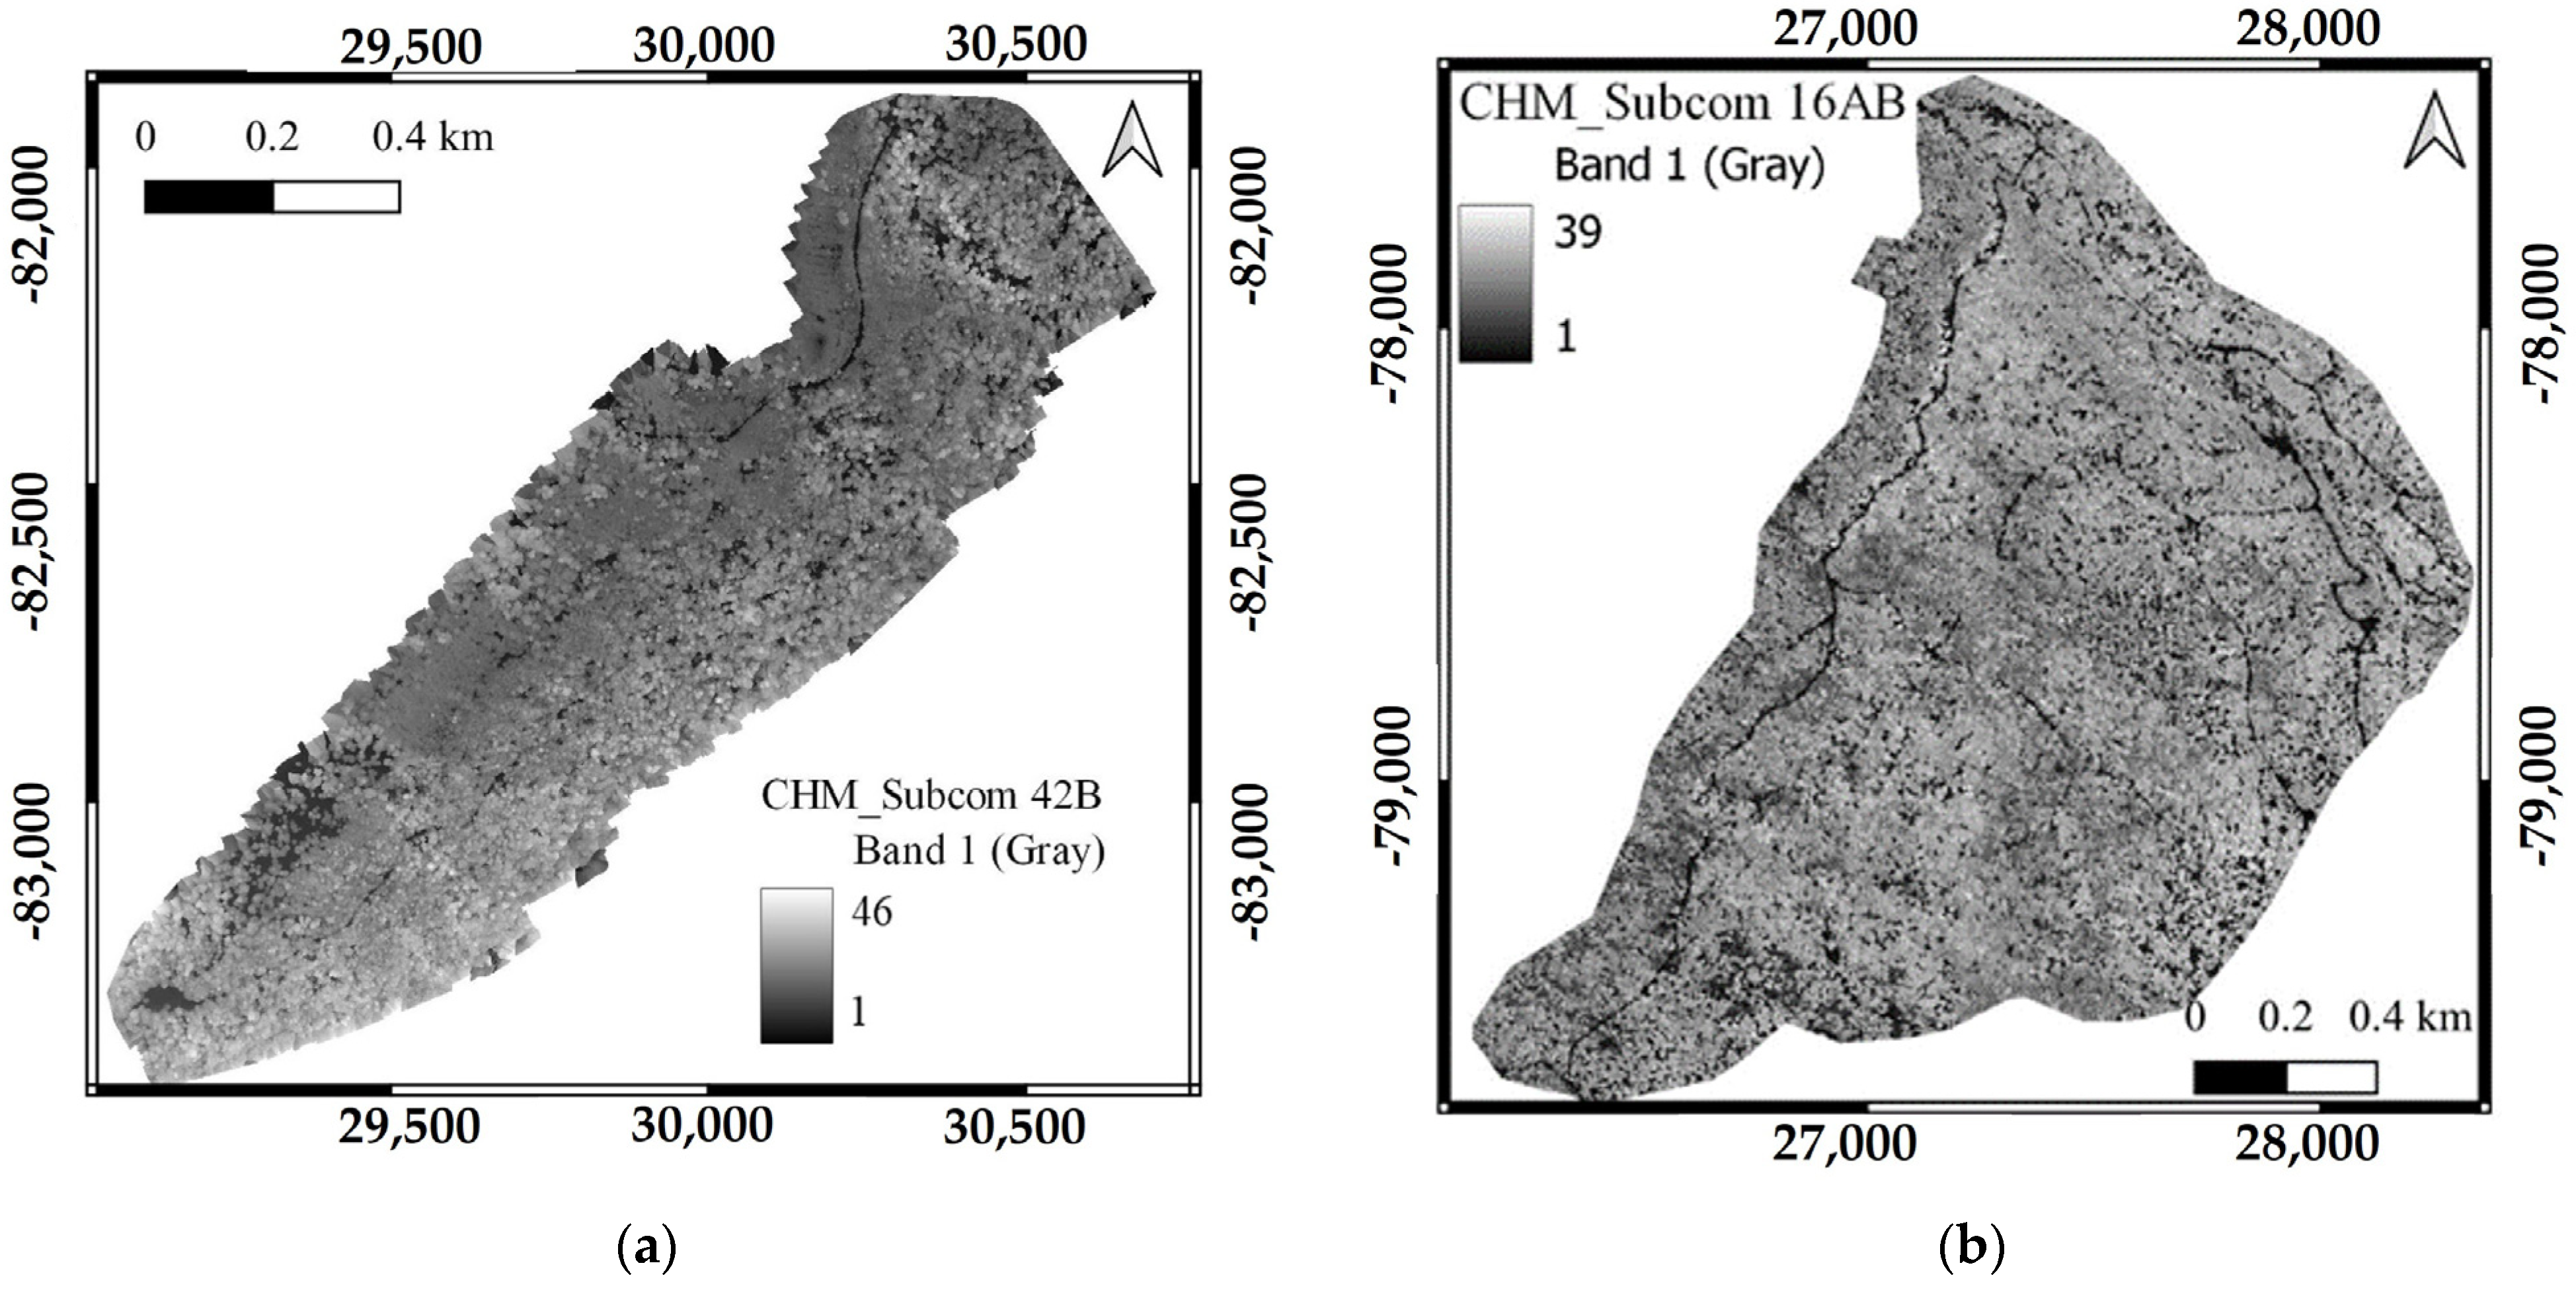
2.1. Study Sites and Remote Sensing Datasets

This study was undertaken at the University of Tokyo Hokkaido Forest (UTHF), situated in Furano City in central Hokkaido Island, northern Japan (43°10–20′ N, 142°18–40′ E, 190–1459 m asl) (Figure 1a,b). The UTHF features an uneven-aged mixed forest with both coniferous and broadleaf trees. Spanning a total area of 22,708 ha, the major tree species includes Abies sachalinensis, Picea jezoensis, Acer pictum var. mono, P. glehnii, Fraxinus mandshurica, Kalopanax septemlobus, Quercus crispula, Betula maximowicziana, Taxus cuspidata, and Tilia japonica. Additionally, the forest floor is populated with dwarf bamboo species, including Sasa senanensis and S. kurilensis [25]. The mean annual temperature and annual precipitation at the arboretum, located at 230 m asl, were 6.6 °C and 1196 mm, respectively, from 2011 to 2020 (The University of Tokyo Hokkaido Forest, 2023. Available online: https://www.uf.a.u-tokyo.ac.jp/hokuen/pamphlet.pdf, accessed on 6 July 2024). The ground is typically covered with about 1 m of snow from the end of November to the beginning of April [26].
Specifically, the study was carried out in two distinct sub-compartments of the UTHF to ensure a diverse representation of terrain conditions and stand structure. Sub-compartment 42B (Figure 1c) spans an elevation range of 490 m to 694 m, encompassing diverse topographic features such as gentle to steep slopes, ridges, and small valleys, all of which can influence gap dynamics. Dominated by deciduous species, this area has an average of 1052 trees per hectare, with a predominance of young broadleaf trees. The mean Diameter at Breast Height (DBH) is 14.88 cm, and the growing stock is 259 m³ per hectare for trees with a DBH greater than 5 cm (source: UTHF 2022 inventory data). Meanwhile, Sub-compartment 16AB (Figure 1d), extending from 460 m to 590 m, begins with a gentle downward slope and transitions into a continuous upward slope. In contrast to Sub-compartment 42B, conifers are abundant in Sub-compartment 16AB. According to the UTHF 2022 inventory data, Sub-compartment 16AB has an average of 614 trees per hectare, a mean DBH of 21.06 cm, and a growing stock of 350 m³ per hectare for trees with a DBH greater than 5 cm.
The UAV datasets from our previous publication [27] were utilized in this study. Specifically, we employed the UAV orthophotos with resolutions of 11 cm for Sub-compartment 42B and 7 cm for Sub-compartment 16AB, as detailed in our earlier work. Additionally, we also created a digital surface model (DSM) using the first return of the UAV photogrammetric point cloud in ArcGIS Pro (version 2.8.0) to generate CHM. The spatial resolution of the UAV_DSM was 11 cm in Sub-compartment 42B and 7 cm in Sub-compartment 16AB, which matched the resolution of their orthophotos. Due to inaccuracies in the UAV-derived digital terrain model (DTM) caused by canopy occlusion [28], we utilized the LiDAR_DTM created by UTHF in 2018. This was generated using an Optech Airborne Laser Terrain Mapper (ALTM) Orion M300 sensor (Teledyne Technologies, Thousand Oaks, CA, USA) mounted on a helicopter. The specifications of the LiDAR data are summarized in Table 1. We generated CHM by subtracting the LiDAR_DTM from the UAV_DSM for each pixel value. The CHM of Sub-compartment 42B ranges from 1 to 46 m while that of Sub-compartment 16AB falls within the range of 1 to 39 m (Figure 2).
In addition, since the selection harvesting was carried out in Sub-compartment 42B in the Year 2022–2023 according to the forest management plan of the UTHF, the pre- and post-selection harvesting UAV images were also collected for additional analysis to determine the potential of the trained model in predicting the canopy gaps created by selection harvesting.
The pre- and post-selection harvesting UAV images were collected on 17 October 2022 and 13 October 2023, respectively, using the same DJI Matrice 300 RTK UAV platform with Zenmuse P1 RGB camera that was used in Sub-compartment 16AB. The UAV flight specifications: flight speed (7 m/s), altitude (130 m), overlap (82% longitudinal overlap and 85% lateral overlap), and ground resolution (1.5 cm/pixel) were also set to be the same for both flights. For subsequent analysis, the orthmosaics with a ground resolution of 1.5 cm were also generated using Pix4Dmapper, following the same image processing technique described above (Figure 3).

2.2. Data Analysis

This study compared the U-Net model with the ResU-Net model, which integrates U-Net with a Residual Network, to evaluate their effectiveness in canopy gap detection using UAV imagery. After identifying the best-performing model, we implemented it as a transfer model to detect canopy gaps caused by selection harvesting. To ensure compatibility, we conducted extended training to normalize the image resolution of the new dataset with that of the transfer model. The general workflow of the study is shown in Figure 4.

2.2.1. Deep Learning Algorithms

The U-Net model, initially created by Ronneberger et al. (2015) [29], was designed for biomedical image segmentation. Characterized by its prominent U-shaped structure, the U-Net model is widely recognized for its effectiveness in image segmentation tasks due to its encoder–decoder architecture, which enables precise localization of objects and features. The encoder compresses the input image into a compact representation, capturing essential spatial information, while the decoder progressively reconstructs the image to the original resolution, allowing for detailed segmentation. Skip connections in the U-Net directly link corresponding layers in the encoder and decoder, facilitating accurate and detailed segmentation [30,31,32]. This architecture facilitates accurate identification and delineation of various elements within an image. In the context of forestry, U-Net’s applicability has been demonstrated in several applications such as canopy species group mapping, forest type classification, forest change detection, and post-forest-fire monitoring [27,30,33,34,35]. It was also anticipated that this model could accurately delineate canopy gaps by outlining the boundaries between vegetation and gaps, even when understory vegetation exists beneath the canopy gaps, in aerial or satellite imagery.
Despite these strengths, U-Net can sometimes face the gradient vanishing problem, a common issue in deep networks [36] where gradients become too small for effective training. This problem arises when the gradients used to update the network’s weights during backpropagation become exceedingly small, leading to slow or stalled learning in the initial layers of the network. The gradient vanishing issue is more pronounced in very deep networks, where the multiplication of many small gradient values can result in an almost negligible gradient by the time it reaches the earlier layers [37].
An effective approach to address the gradient vanishing issue in very deep networks is the use of Residual Networks (ResNets). Proposed by He et al. (2016) [38], ResNets incorporate residual blocks that allow gradients to flow more directly through the network layers. These blocks contain shortcut connections that aid in training deeper networks by mitigating the vanishing gradient problem, thereby enhancing the model’s ability to learn intricate patterns and details from the input data [39,40]. Consequently, ResNets can be used to enhance the training of deep U-Net models by providing a more robust gradient flow, which can lead to better performance in complex image segmentation tasks.
The applicability of combining U-Net and ResNet architectures (ResU-Net model) for detailed tasks, such as individual tree analysis, has been demonstrated in past studies [40,41,42]. In the context of canopy gap extraction, which involves detailed analysis, this combined ResU-Net model can likely improve performance by distinguishing fine-scale details and subtle variations in vegetation cover. This enhancement can also potentially increase the precision and reliability of identifying and mapping gaps in vegetation. The ResU-Net model is illustrated in Figure 5.

2.2.2. Detection of Canopy Gaps Using UAV Remote Sensing Datasets and Deep Learning Models

Input Data and Preprocessing

The orthophotos and CHMs were cut into small patches with a size of 512 × 512 pixels. For each dataset, we then selected 313 images (out of 360 images) containing the canopy areas from the Sub-compartment 42B UAV datasets. Likewise, we selected 313 images (out of 1600 images), consisting of canopy gap areas, from the Sub-compartment 16AB UAV datasets to match the number of images in the 42B dataset.
Then, we trained each of the deep learning models (U-Net and ResU-Net) using each of the UAV datasets: RGB, CHM, and fused RGB and CHM. Terrain conditions posed challenges, with Sub-compartment 42B ranging from 490 m to 694 m and Sub-compartment 16AB from 460 m to 590 m, leading to variations in data density and terrain effects like shadows and complex topography. Therefore, during CHM data preprocessing, we opted to use a fixed height threshold technique instead of potentially unreliable raw height values. This method is commonly employed in canopy gap detection for its robustness in initial detection [7,43,44]. By applying a standardized height threshold, we aimed to ensure consistent and reliable identification of canopy gaps across different datasets and environmental conditions. Threshold values were determined based on visual interpretation using very high-resolution UAV imagery, histogram evaluation of CHMs in QGIS (analyzing pixel value distributions representing heights), and results from test runs. In Sub-compartment 42B, a height threshold of 6 meters was applied to classify pixels as gaps, while in Sub-compartment 16AB, the threshold was set lower at 4 meters. These adjustments were made to account for the diverse terrain conditions encountered and aimed to optimize the identification of canopy gaps across different environmental contexts.

Generation of Labeled Masks for Canopy Gaps

The labeled canopy gap masks were created using Labkit, a Fiji plugin, by referring to [27]. In this study, we annotated those pixels in the RGB UAV images that are not a canopy within the study area as the canopy gap class. The background class includes all pixels that represent a canopy cover and the outer areas of the study sites. They were denoted as class 0 and 1, respectively. The same labeled masks prepared were used for training with all datasets: RGB, CHM, and fused RGB and CHM.
When creating the labeled mask for the pre-selection harvesting UAV dataset, we defined the canopies of the trees that were marked for harvesting as canopy gaps. For the post-selection harvesting UAV dataset, the canopy gaps were defined as the gaps caused by the harvested trees. Canopy gaps were manually annotated by referring to the locations of harvested trees provided by the UTHF. They were recorded using a Garmin GPSMAP 64csx (manufactured by Garmin Ltd., United States), which has an accuracy of within 10 m to 14 m. The harvesting rate in Sub-compartment 42B was 10 %, which was decided by the UTHF based on the growth rate and natural regeneration of this sub-compartment. Each pre- and post-harvesting dataset consists of 72 images (512 × 512 pixels) with a total of 37 gaps.

Model Configuration and Hyperparameter Settings

U-Net model: As detailed in our previous study [27], we trained the U-Net model using the “HeNormal” initializer and the Rectified Linear Unit (ReLU) activation function in the convolutional layers. The softmax activation function was employed in the output layer. As the classification in this study is binary, we used binary_crossentropy. The Adam optimizer was used with a learning rate of 0.0001. All models were trained for 100 epochs, and the best-performing models were saved using the ModelCheckpoint callback function in the Keras library.
ResU-Net model: For the combined U-Net and ResNet (ResU-Net) model (Figure 5), we used models from the “segmentation_models” library, a Python library for image segmentation based on Keras and TensorFlow (https://github.com/qubvel/segmentation_models, accessed on 30 November 2023). This library facilitates easy instantiation of the U-Net model with various pre-trained backbones, including VGG16, VGG19, ResNet, and MobileNet. In this study, we chose ResNet101 as the backbone of the U-Net model. The backbone ResNet101, originally pre-trained on ImageNet, is conventionally designed to process 3-channel RGB images. However, to accommodate diverse datasets such as CHM (single-channel grayscale images) and fused CHM and RGB (multi-channel data), we modified the input layer without leveraging pre-trained weights. Consequently, when dealing with the RGB dataset, the U-Net model was trained twice: firstly, utilizing the ResNet101 backbone with an adjusted input layer and no pre-trained weights (referred to as “ResU-Net_1”), and secondly, with the ResNet101 backbone pre-trained on the ImageNet dataset (referred to as “ResU-Net_2”). This approach aimed to highlight the effectiveness of pre-trained models in canopy gap prediction specifically for RGB data. Meanwhile, for the CHM and the merged RGB and CHM datasets, only ResU-Net_1 was used. The same training procedure as with the U-Net model was applied: 100 epochs, Adam optimizer (learning rate of 0.0001), binary_crossentropy loss, and the ModelCheckpoint callback in Keras.

2.2.3. Extended Training for Canopy Gap Detection

After training our models with UAV datasets from Sub-compartments 42B and 16AB, we selected those with the highest F1-scores and overall accuracies (OA) to use as pre-trained models for detecting canopy gaps resulting from selection harvesting. The spatial resolution of the pre- and post-harvesting UAV images (1.5 cm) was different from the resolutions used in the original training datasets (11 cm for 42B and 7 cm for 16AB). This resolution difference can impact model performance, as the original models were optimized for specific resolutions [45]. To address this, we conducted an extended training phase, retraining the models with 150 pre-harvesting UAV images from Sub-compartment 42B, which had a resolution of 1.5 cm and dimensions of 512 × 512 pixels. These images were labeled into two classes—canopy gaps and background—consistent with our initial training approach. This extended training was crucial for adapting the models to the finer resolution, allowing them to capture detailed features and identify subtle canopy gaps that might have been missed by the original models.

2.2.4. Training Transfer Models and ResU-Net Model for the Detection of Canopy Gaps Caused by Selection Harvesting

Before training the transfer models on new datasets, the pre- and post-selection harvesting UAV images, along with their corresponding masks, were loaded separately. These images were then concatenated into a single dataset, which was split into a training dataset (90%) and a validation dataset (10%). The transfer model was trained for 100 epochs, and the model was saved using the ModelCheckpoint callback function. To evaluate the performance of the transfer models, we also trained the ResU-Net model using the pre- and post-selection harvesting UAV images, following the same workflow. The models were coded in the Spyder environment (version 5.1.5) using Python on a 2ML54VSB laptop (ASUSTeK COMPUTER INC.,Taiwan) with an AMD Ryzen 7 4800H processor and 16.0 GB of RAM.

2.2.5. Evaluation Metrics for the Models

The performance of the models was evaluated using F1 score, precision, recall, OA, and IoU values based on the validation dataset specifically for the canopy gaps class. The F1 score provides a balanced view by combining precision and recall into a single metric through their harmonic mean, offering a comprehensive assessment of the model’s performance in canopy detection. Precision measures the accuracy of the model’s positive predictions for canopy gaps, indicating how many of the predicted canopy gaps are correctly identified. Recall evaluates the model’s ability to identify all actual canopy gaps, reflecting how many of the true canopy gap pixels are correctly predicted. OA assesses the model’s performance by measuring how accurately it classifies all pixels, including those identifying canopy gaps. It is calculated as the ratio of correctly classified pixels (both canopy gap and background classes) to the total number of pixels in the dataset. IoU (Intersection over Union) calculates the overlap between the predicted canopy gaps and the actual canopy gaps, defined as the intersection of the predicted and actual gaps divided by their union. Combined, these metrics provide a comprehensive assessment of the model’s ability to detect and classify canopy gaps, taking into account OA, prediction reliability, detection capability, and the balance between false positives and false negatives. The following formulas were used to calculate F1 scores, precision, recall, OA, and IoU values.
Precision = TP/(TP + FP)
Recall = TP/(TP + FN)
F1 = 2 × {(Precision × Recall)/(Precision + Recall)}
Overall accuracy (OA) = Number of correctly predicted pixels/total number of pixels
IoU = (Area of Intersection)/(Area of Union)
where
  • TP (True Positives): The number of pixels correctly predicted as canopy gaps.
  • FP (False Positives): The number of pixels incorrectly predicted as canopy gaps (predicted as gaps but actually not gaps).
  • FN (False Negatives): The number of pixels that are actually canopy gaps but were incorrectly predicted as background.
For visualizing the performance of the trained models in comparison with the ResU-Net model in predicting canopy gaps caused by selection harvesting, confusion matrices were also used in addition to the above metrics. Moreover, the training and validation F1-scores (average) and losses of the trained models and ResU-Net were monitored to understand the overfitting and underfitting status of the models. The training F1-score and loss reflect the model’s performance on the training dataset, indicating how well the model is learning from the data it was trained on. The validation F1-score and loss measure the model’s performance on a separate validation dataset, providing insight into how well the model generalizes to new, unseen data. A high training F1-score coupled with a low validation F1-score can indicate overfitting, where the model performs well on training data but poorly on validation data. Conversely, similar training and validation F1-scores with high losses might indicate underfitting, where the model is not capturing the underlying patterns in the data effectively. Monitoring these scores and losses helps in adjusting the model to achieve better generalization and avoid overfitting or underfitting.

3. Results

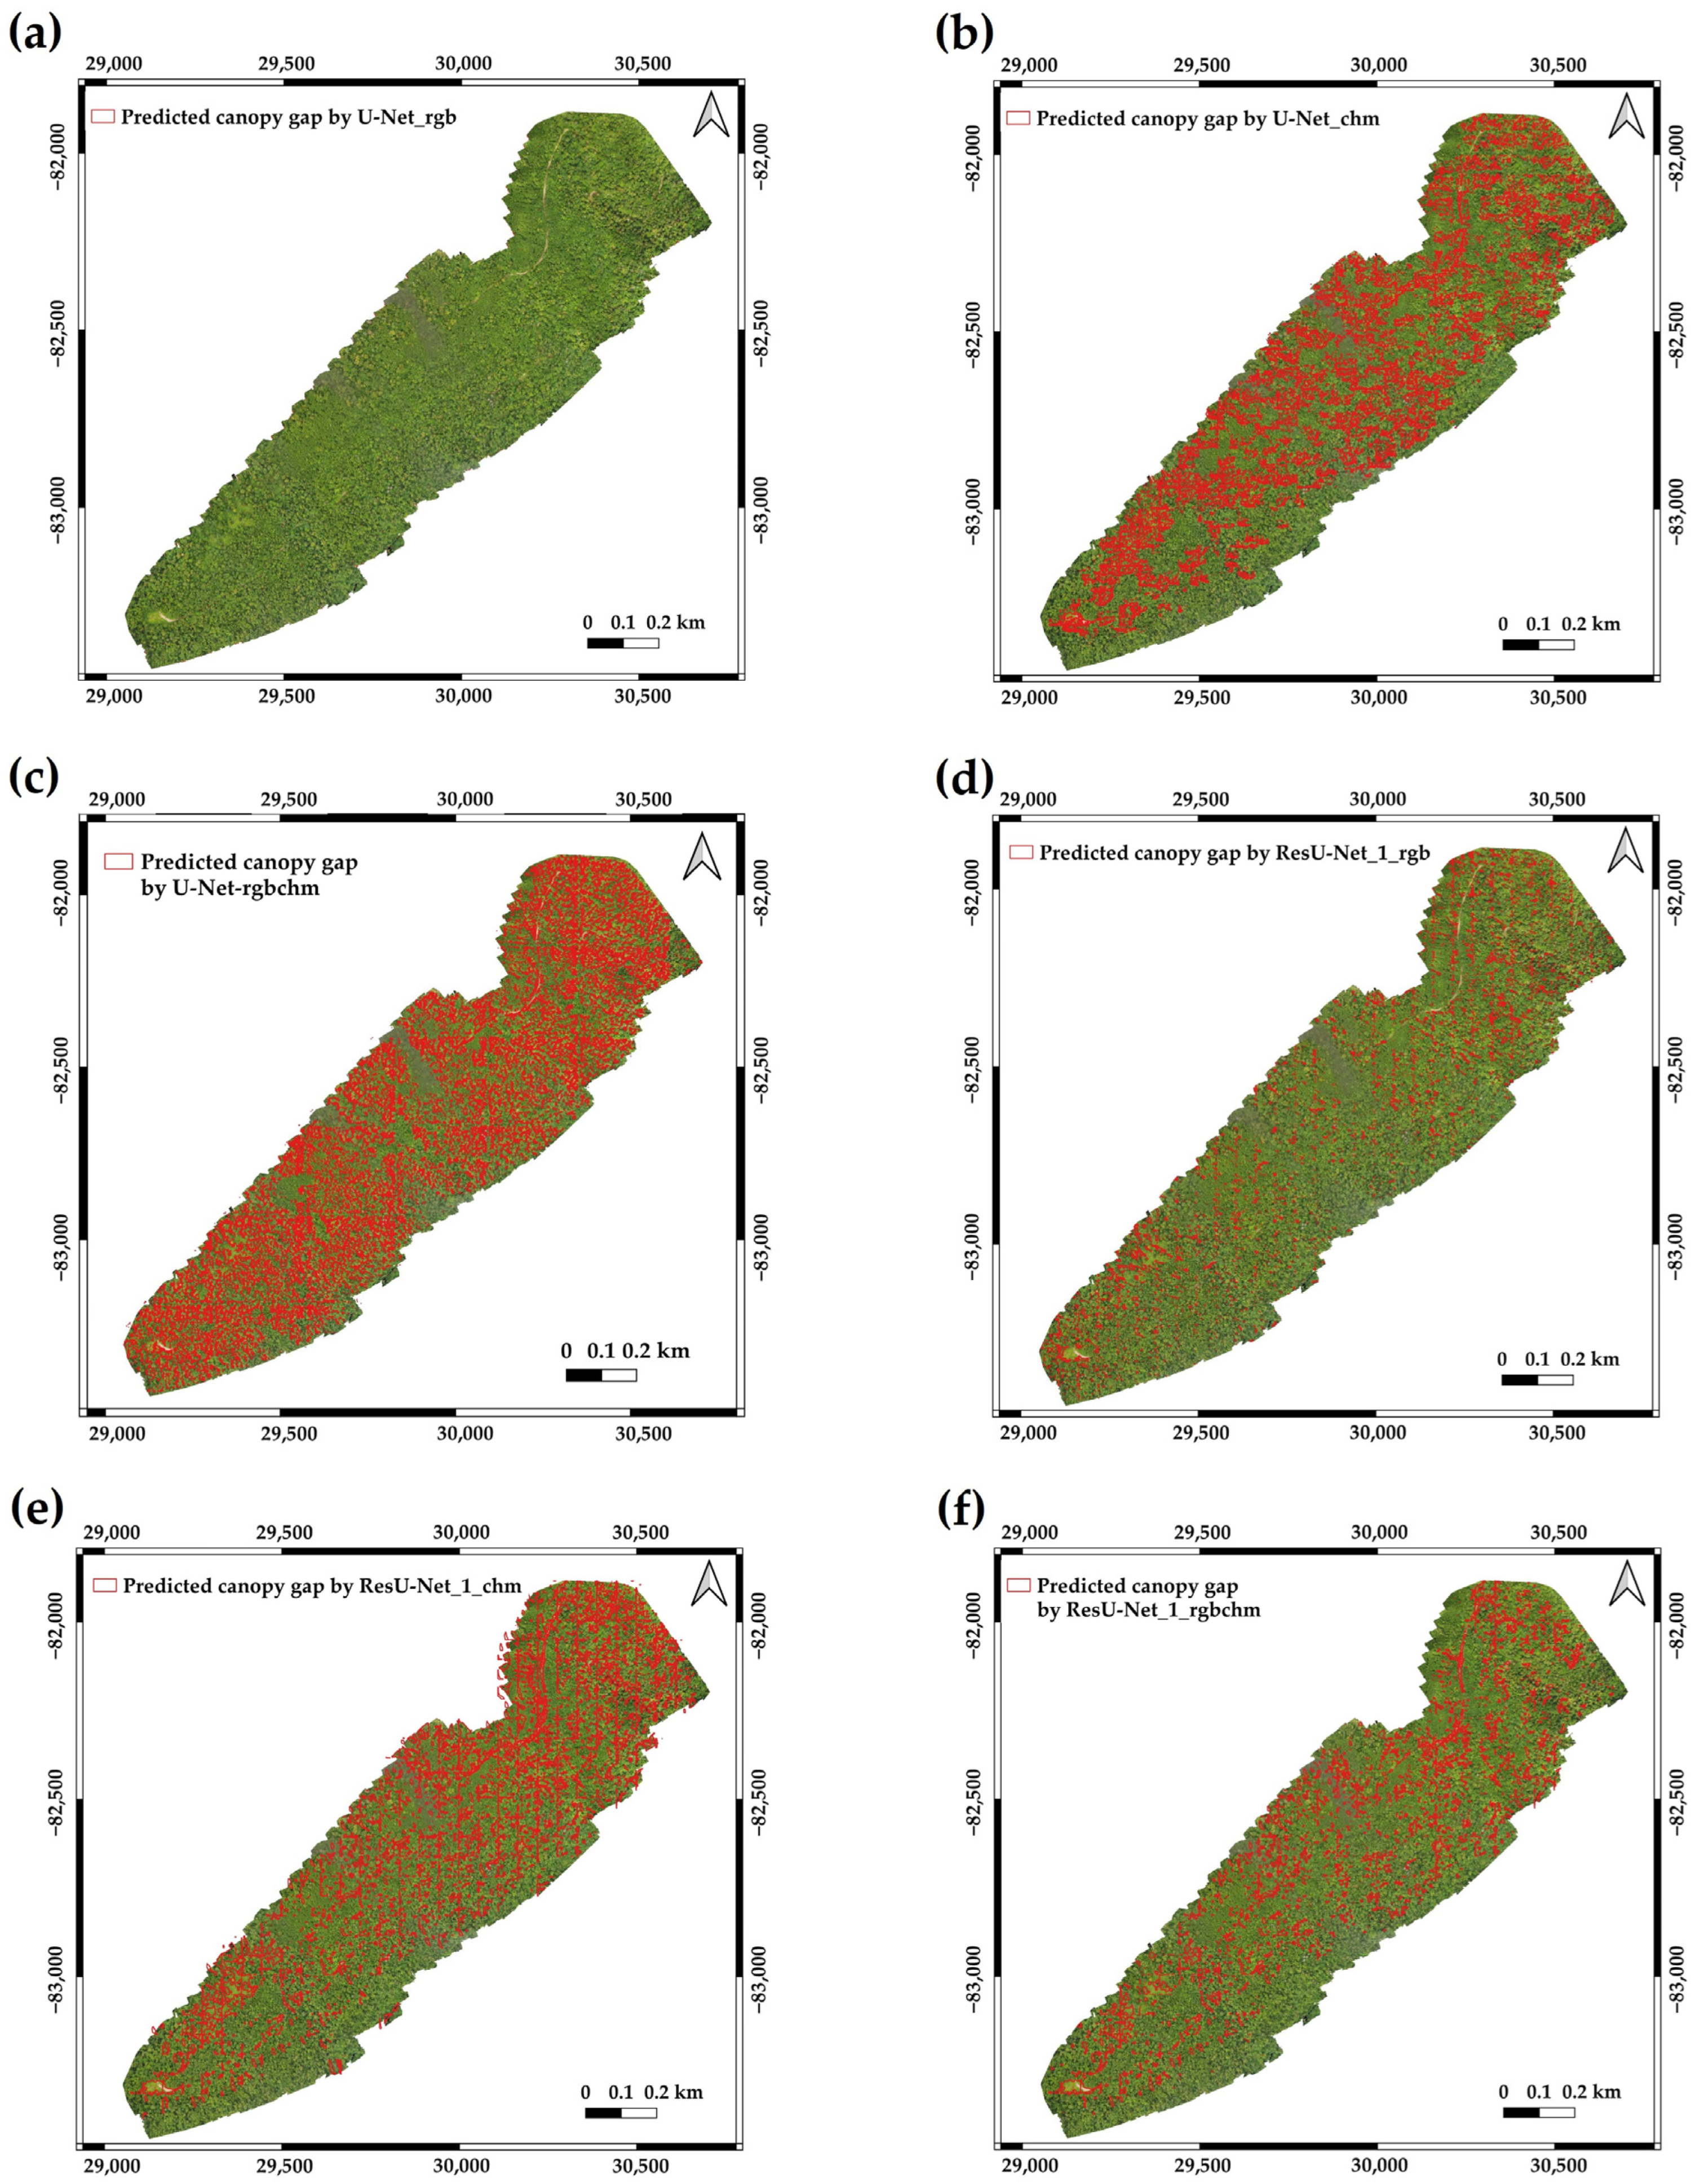
3.1. Accuracy for Detection of Canopy Gap Using Deep Learning Models and UAV Remote Sensing Datasets of Sub-Compartment 42B

As summarized in Table 2, among the UAV remote sensing datasets, the CHM dataset obtained the highest F1-score, Recall, OA, and IoU values through the U-Net model (0.52, 0.50, 0.94, and 0.36), followed by the merged RGB_CHM dataset (0.48, 0.37, 0.94, and 0.31). Meanwhile, the U-Net model combined with the RGB dataset failed almost completely to detect canopy gaps. In terms of precision, the RGB_CHM dataset was slightly better than the CHM dataset. However, the overall metrics indicate that the CHM dataset remains superior in canopy gap detection performance.
In the case of the UAV datasets combined with ResU-Net_1 (the U-Net model with the ResNet101 backbone with the modified input layer), the merged RGB_CHM dataset achieved the best accuracy scores: F1-score (0.70), precision (0.74), recall (0.67), OA (0.96), and IoU (0.54) values. In terms of all accuracy scores (Table 2), the ResU-Net_1 model showed higher performance with the RGB dataset, and the CHM dataset achieved the lowest performance between the RGB and CHM datasets.
Of the three models, the accuracy of ResU-Net_2 (the U-Net model with the ResNet101 backbone pre-trained on the ImageNet dataset) with the RGB dataset was superior to the U-Net model and ResU-Net_1 model for all evaluation metrics. The ResU-Net_2 model also demonstrated an improved ability to distinguish canopy gaps from shadow areas compared to the other models. This enhancement in handling shadows contributes to the higher precision observed in the ResU-Net_2 model. The distribution of canopy gaps predicted by the ResU-Net_2 model is visualized in Figure 6. The predictions by the remaining models are shown in Appendix A (Figure A1).

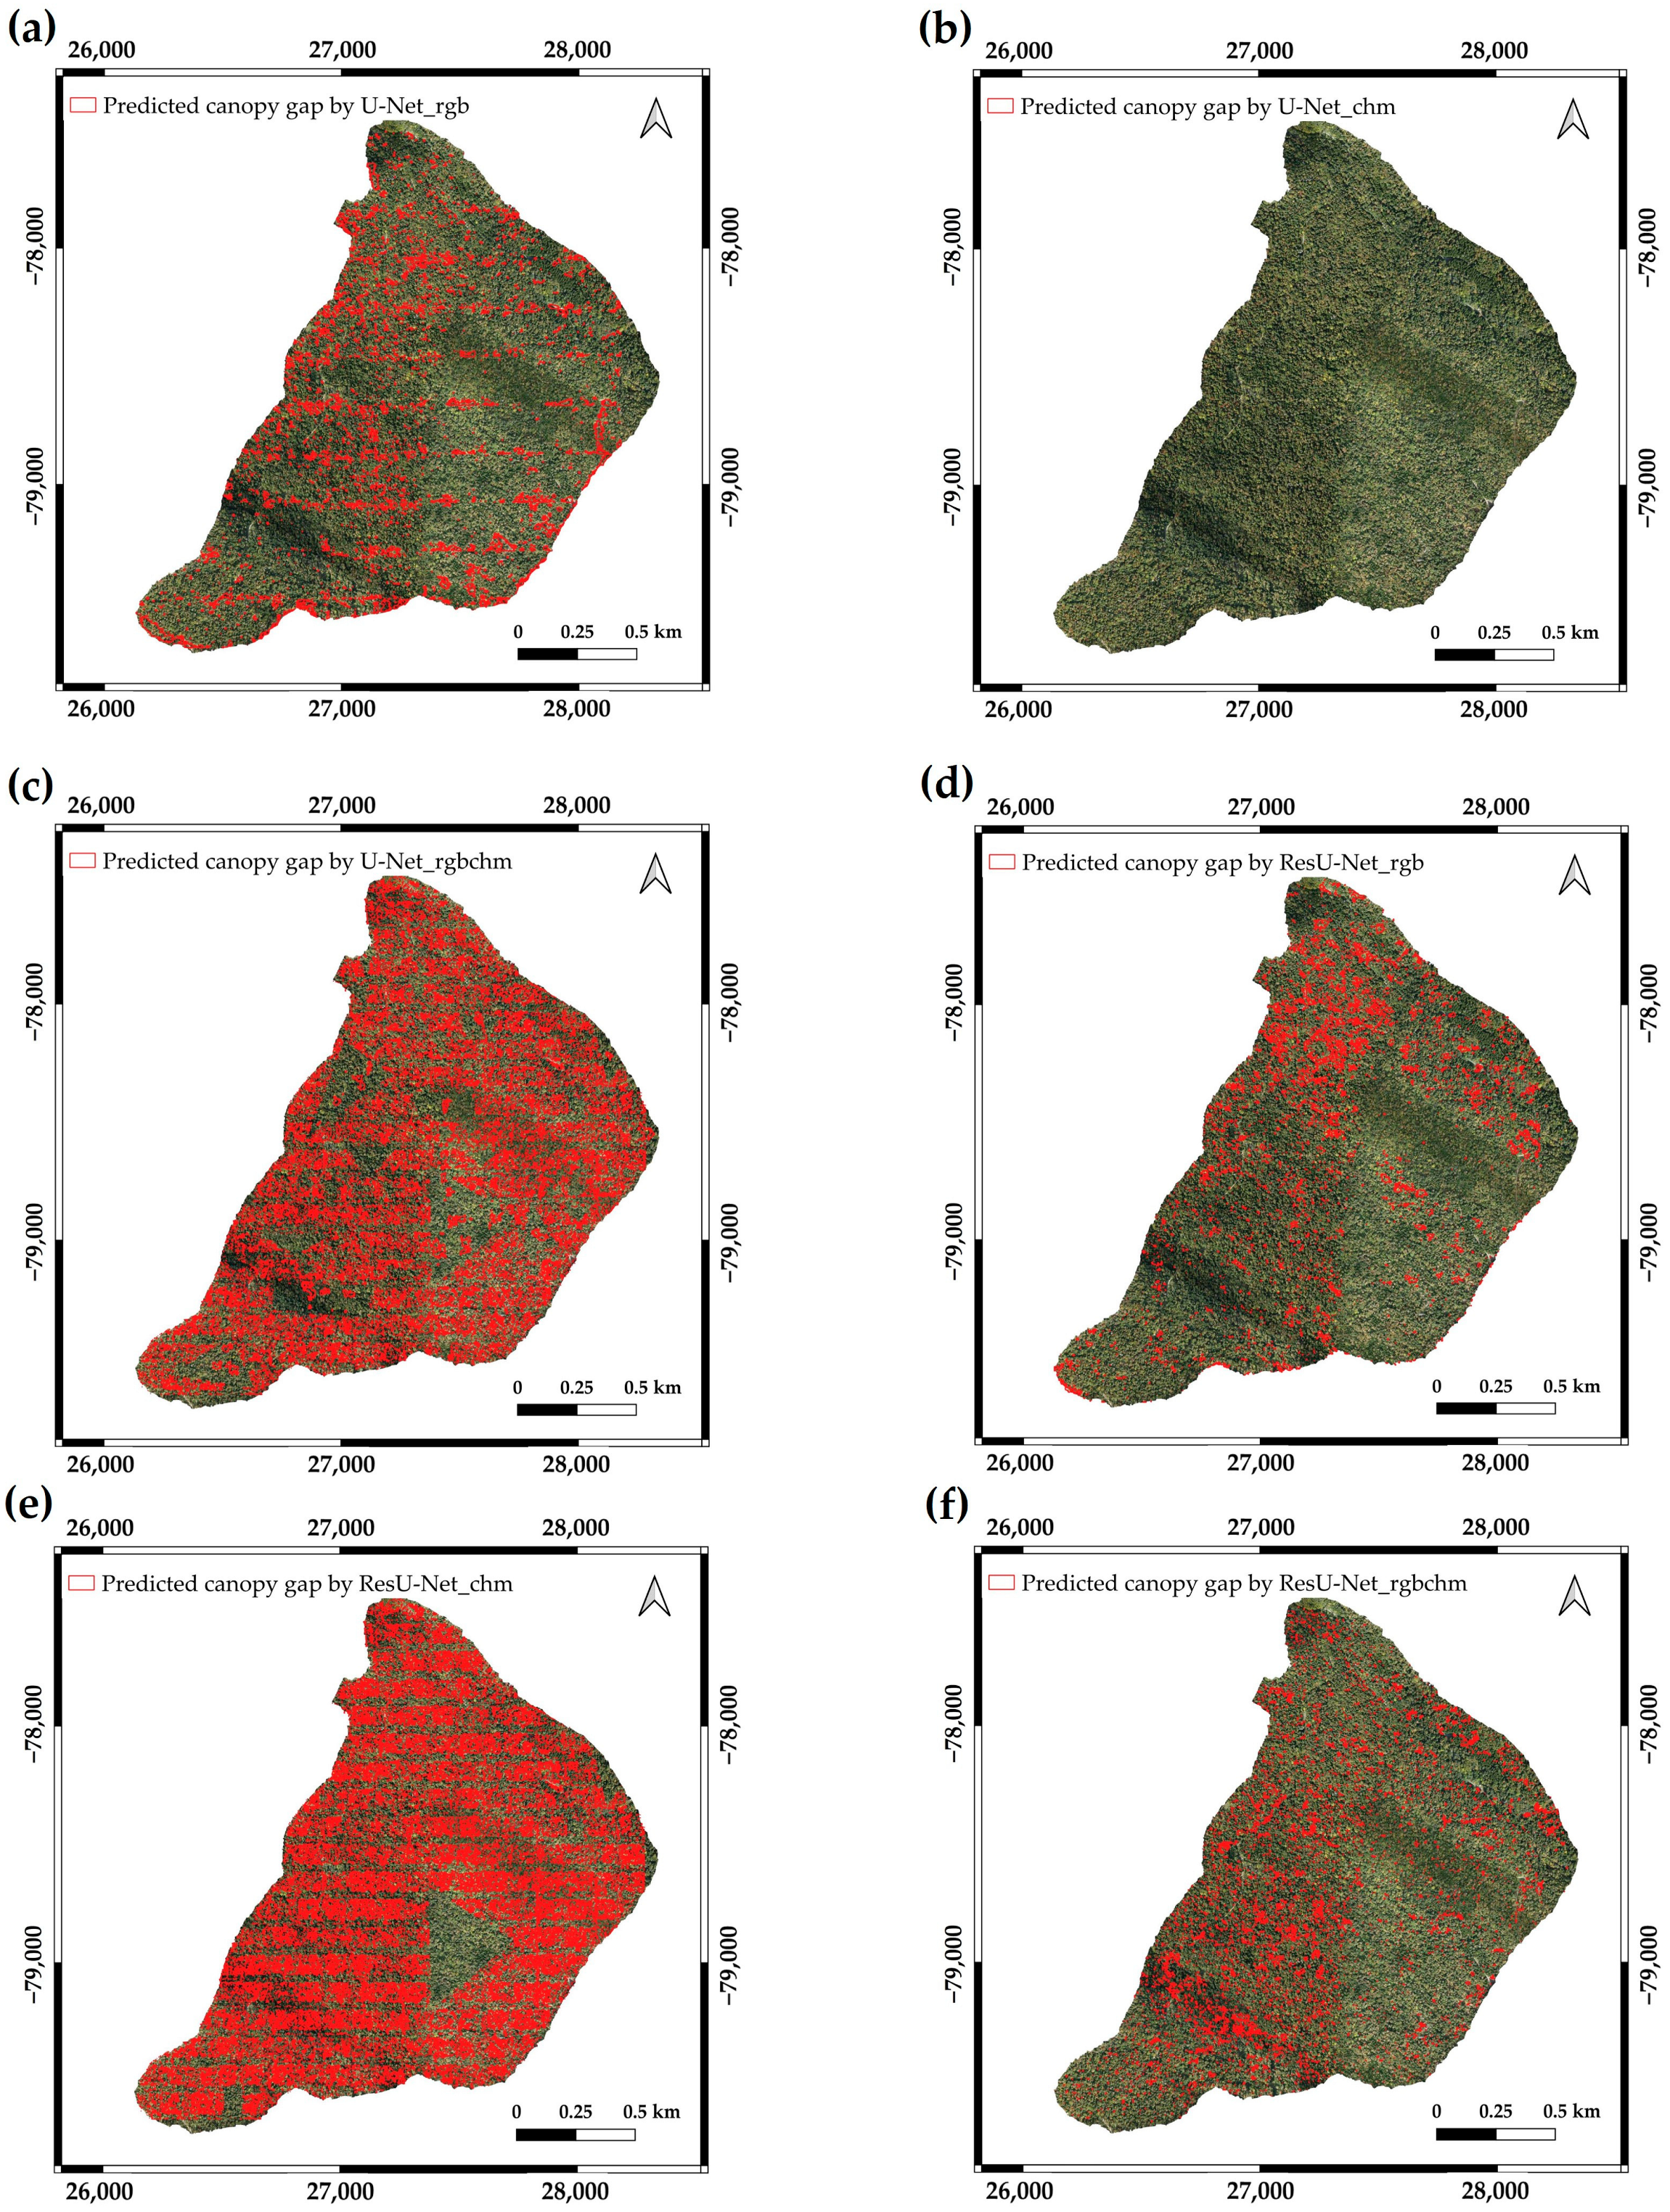
3.2. Accuracy for Detection of Canopy Gap Using Deep Learning Models and UAV Remote Sensing Datasets of Sub-Compartment 16AB

Contrary to the case of the Sub-compartment 42B UAV datasets and U-Net model, among the UAV datasets of Sub-compartment 16AB, the RGB dataset through the U-Net model provided the best F1-score, Recall, OA, and IoU values (0.63, 0.66, 0.93, and 0.46), though the precision value was lower than RGB_CHM. The CHM dataset was poor in detecting canopy gap here in terms of all accuracy scores (Table 3).
When the datasets were used to train the ResU-Net_1 model, RGB_CHM achieved the best results in terms of F1-score, recall, and IoU value (0.72, 0.68, and 0.56), but the value of precision was slightly lower than the RGB dataset while the OA value was the same. The ResU-Net_1 model with the CHM dataset showed the lowest performance in this case (Table 3).
According to Table 4, similar to the case of the Sub-compartment 42B dataset, the performance of the ResU-Net_2 model with the RGB dataset was the best compared to other models in terms of all accuracy results. Additionally, as in Section 3.1, the ResU-Net_2 model exhibited better performance in distinguishing shadows from canopy gaps. Figure 7 shows the distribution of canopy gaps predicted using the ResU-Net_2 model. The visualized figures for the predictions by the remaining models can been seen in Figure A2 (Appendix A).

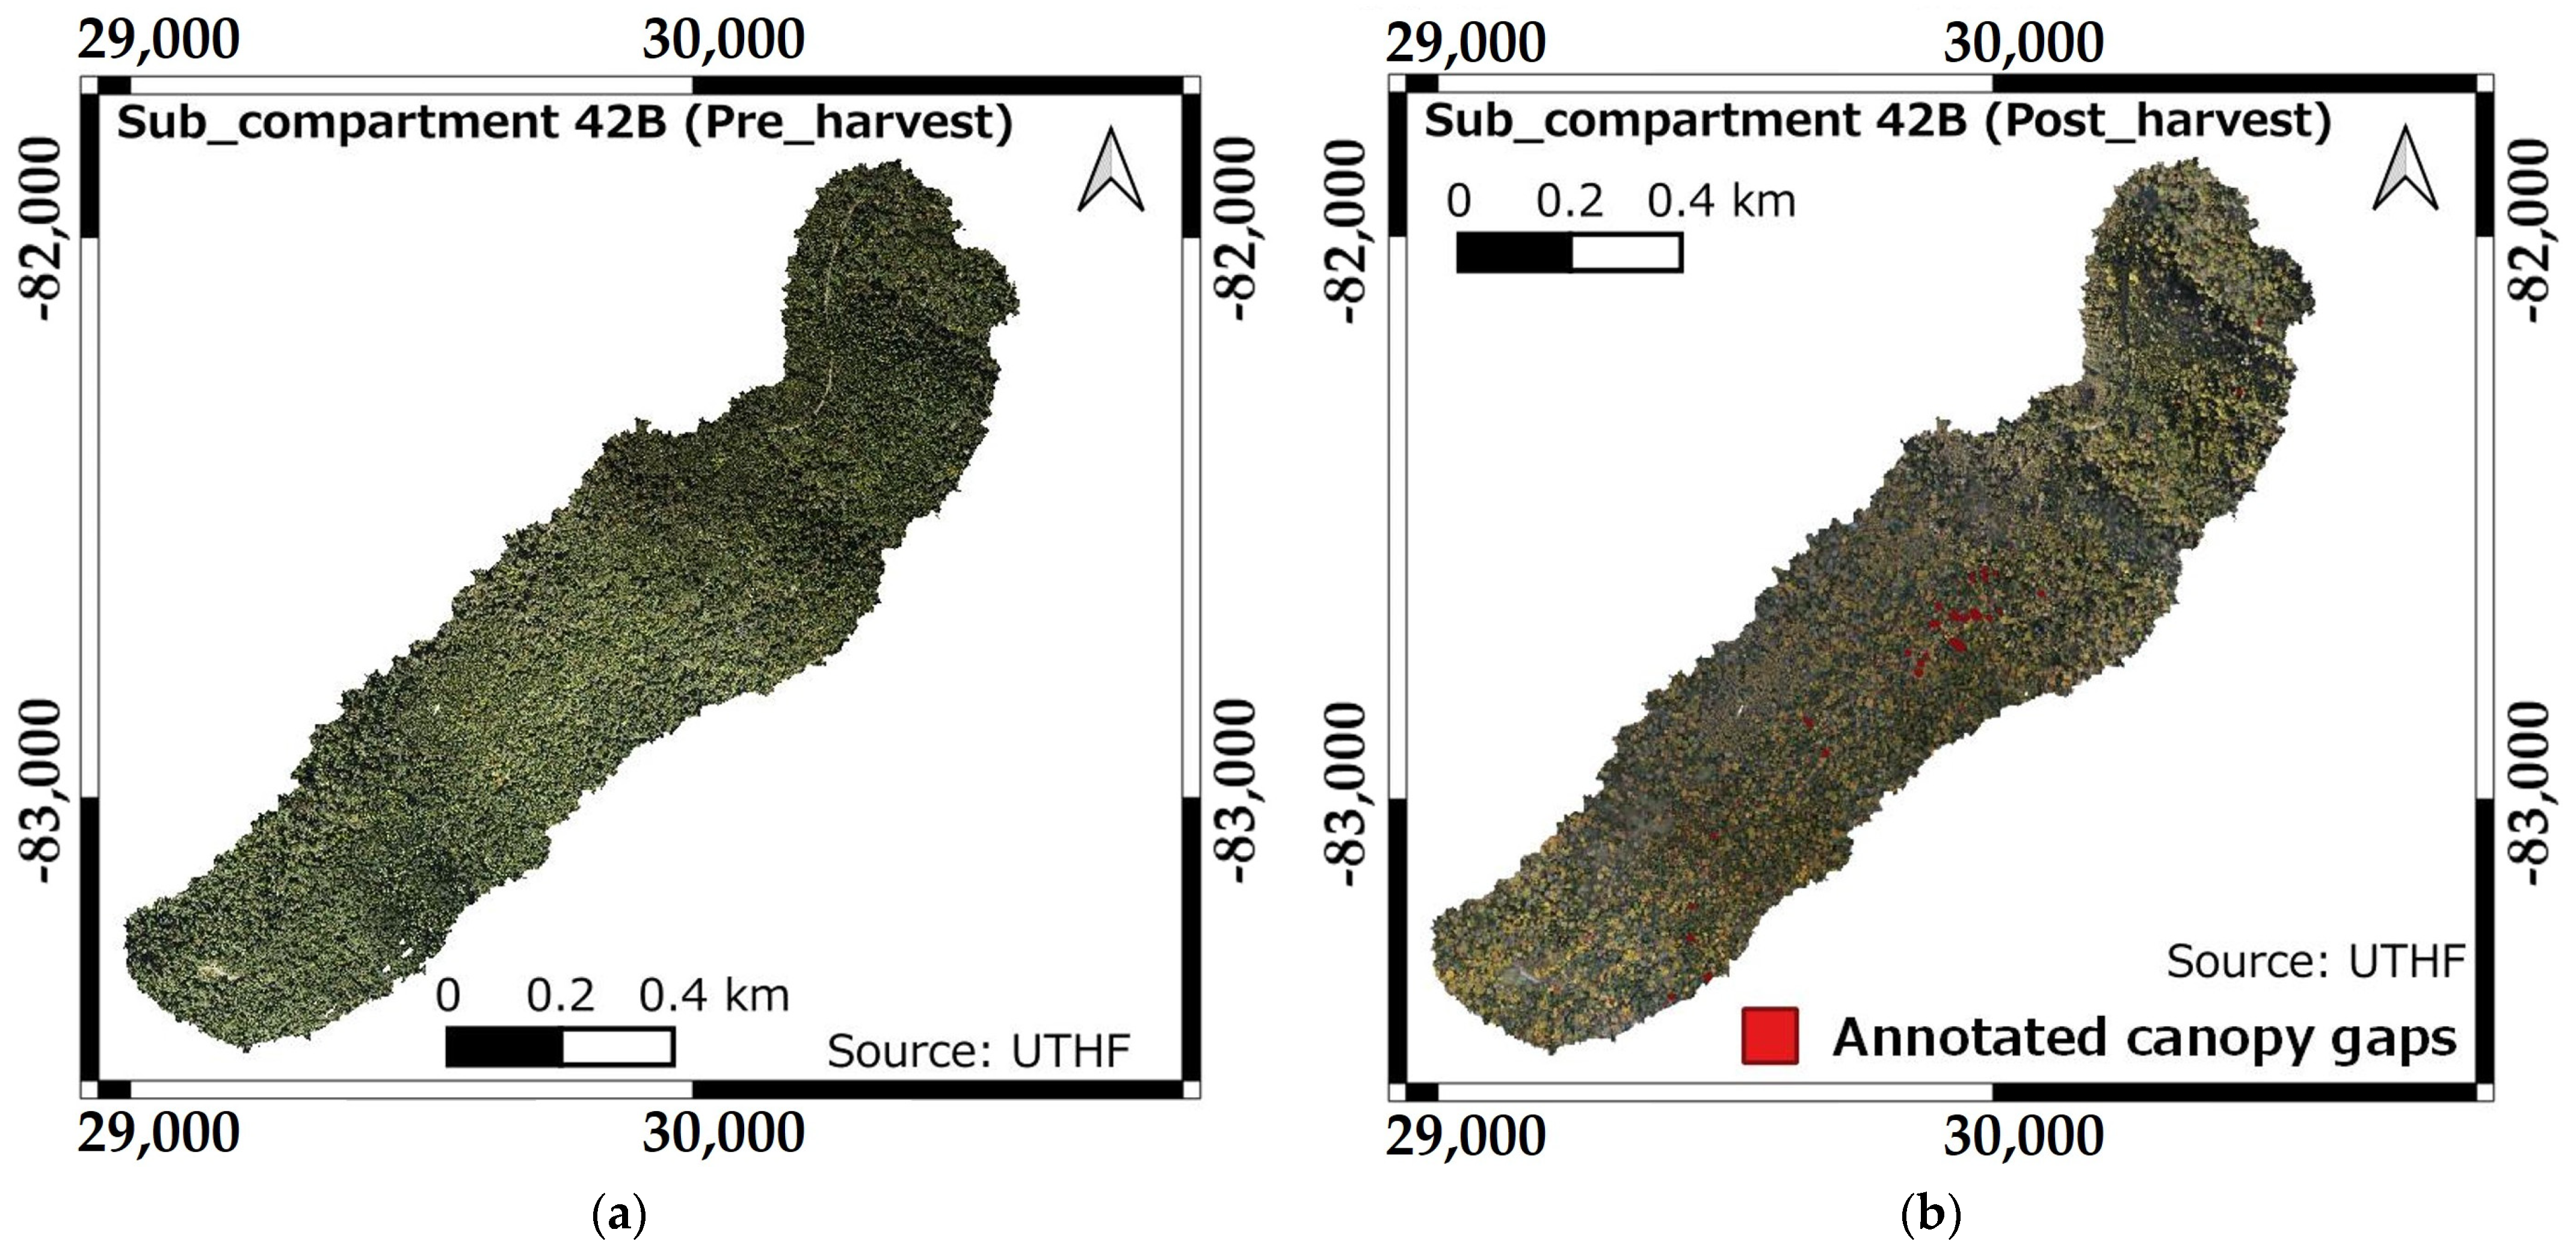
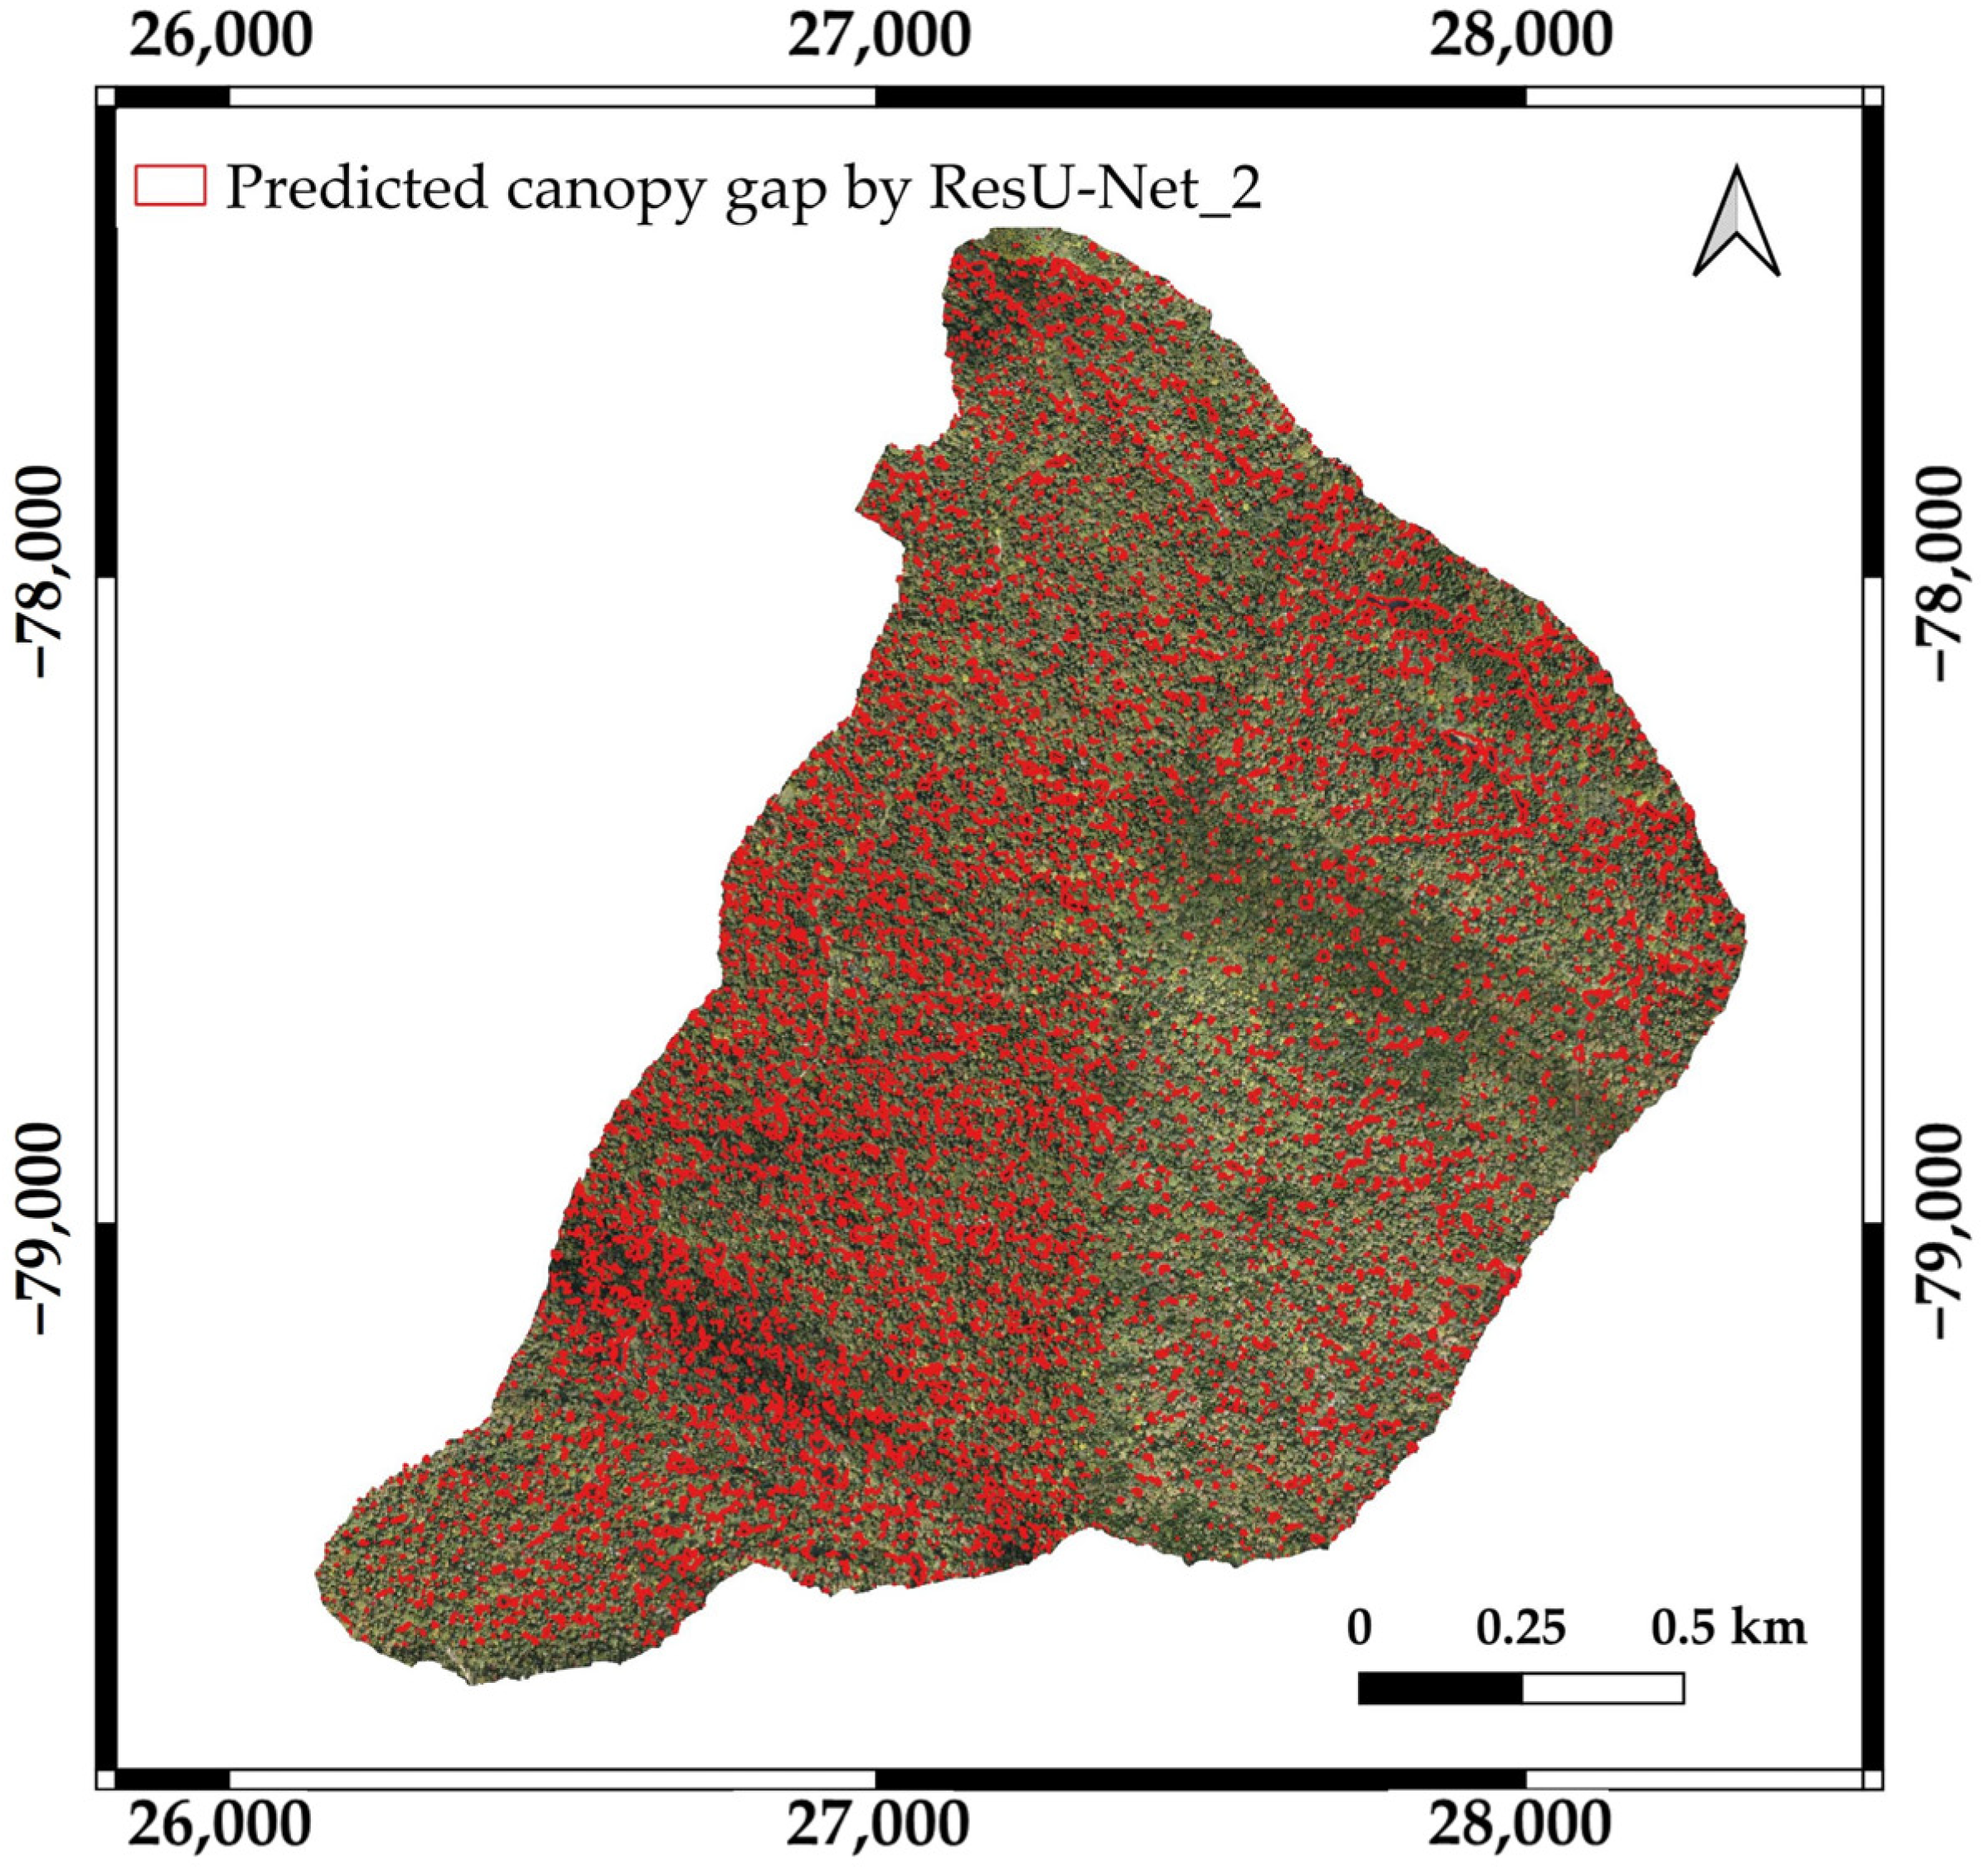
3.3. Performance of the Trained Models (Transfer Models) in Comparison with the ResU-Net Model for the Detection of Canopy Gap Resulting from Selective Harvesting Using the Trained Deep Learning Models and Pre- and Post-UAV Imagery

As described in Section 2.2.3, our trained models, which showed the highest performance in terms of evaluation metrics in Section 3.1 and Section 3.2, were used as transfer models before and after the extended training. Moreover, the ResU-Net model was also trained to compare it with the performance of the transfer models. As the summarized accuracy results in Table 4 show, the transfer model using the Sub-compartment 16AB UAV dataset (after extended training) achieved the highest performance in terms of F1-scores, recall, OA, and IoU values. In terms of precision, the ResU-Net model achieved the highest score and was followed by the transfer model using the Sub-compartment 42B UAV dataset (after extended training).
On the other hand, the performance of the transfer models after extended training increased the accuracy in terms of all evaluation metrics compared to the performance of the trained models before extended training. The performance of transfer models (after extended training) was better than that of the ResU-Net model in terms of F1-score, recall, and IoU values. It was also observed that both transfer models (after extended training) and the ResU-Net model obtained the same OA value (0.83). Particularly, in this study, the transfer model using the Sub-compartment 16AB UAV dataset showed slightly better performance with an F1-score of 0.56, a recall score of 0.56, and an IoU score of 0.39 than the transfer model using the Sub-compartment 42B UAV dataset with an F1-score of 0.54, a recall score of 0.49, and an IoU score of 0.37, although the precision score was a bit lower and the OA value was the same (Table 4).
According to the confusion metrics (Figure 8), the transfer models using the Sub-compartment 16AB dataset showed a slightly higher rate of prediction of canopy gap resulting from harvesting in both cases of before and after extended training (42.21% and 55.92%), while the transfer models using the Sub-compartment 42B dataset were able to detect the canopy gaps at rates of 27.63% and 49.47%. Meanwhile, the ResU-Net model could predict the canopy gap at a rate of 35.07%, which was lower than all of the transfer models except the transfer model using the 42B dataset (before extended training). However, the rate of misclassification from the background class to the canopy gap class by the ResU-Net model was the lowest (5.56%). Among the transfer models, the misclassification rates of the models using 42B (in both cases of before and after extended training) (5.10% and 8.29%) were lower than those by the models using 16AB (8.91% and 10.86%). Some predicted results are visualized in Figure 9.
As described in Section 2.2.5, when we monitored the training and validation F1-scores (average) of the transfer models and ResU-Net model for 100 epochs, we obtained the 0.70 and 0.59 for the transfer model derived from the Sub-compartment 42B (before extended training), 0.81 and 0.65 for the transfer model derived from the Sub-compartment 16AB (before extended training), 0.86 and 0.68 for the trained model derived from the Sub-compartment 42B (after extended training), 0.91 and 0.72 for the transfer model derived from the Sub-compartment 16AB (after extended training), and 0.93 and 0.62 for the ResU-Net model, respectively. The difference between the training and validation F1-scores of the trained models before extended training was slightly smaller than the transfer models after extended training. However, the latter was smaller than the ResU-Net model. The gaps between training and validation losses for the transfer models before and after extended training were also not as large as that of the ResU-Net model. The training and validation F1-scores (average) and loss values are visualized in Figure 10.

4. Discussion

In this study, we used RGB, CHM, and fused RGB and CHM information from UAV imagery to identify canopy gaps in uneven-aged mixed forests using U-Net and ResU-Net models. It was found that all UAV datasets through the ResU-Net model provided higher accuracy results than the U-Net model in both Sub-compartments 42B and 16AB (Table 2 and Table 3). However, it was also noted that the OA values of the U-Net model with all datasets were above 0.90, which were comparable to the ResU-Net models in both sub-compartments. This may be due to the nature of deep learning architectures, being biased towards the majority class, resulting in lower performance in detecting the minority class [46,47]. In addition, although the U-Net encoder–decoder structure can maintain spatial resolution through symmetric skip connections, the overall depth of the network is relatively shallow. This shallowness limits its ability to capture very complex features and hierarchical representations [36,41], which are critical for distinguishing subtle differences between canopy gaps and surrounding vegetation. Moreover, the performance of the U-Net model in detecting canopy gaps was likely weakened at our study sites due to the complex and unevenly aged canopy structures. Sub-compartment 42B, with an elevation range of 490 m to 694 m, exhibits a variety of topographic characteristics that significantly influence the distribution of canopy species and the dynamics of canopy gaps. The forest structure in this area is dense and diverse, with a mix of young and mature trees. As shown in Table 2, the lower performance of the U-Net model, particularly with the RGB dataset in Sub-compartment 42B, can be attributed to the difficulties in distinguishing tree areas from shadowed regions and understory vegetation. The complex canopy structure and the presence of a dense understory likely caused confusion in the RGB imagery. Shadows cast by taller trees and varying lighting conditions further obscured the differences between actual canopy gaps and other vegetation features, making it challenging for the U-Net model, with its shallow network layers, to accurately identify gaps.
In contrast, Sub-compartment 16AB, extending from 460 m to 590 m, features a terrain that transitions from a gentle downward slope to a continuous upward slope, with a predominance of large conifers. While this diverse topography and species composition creates a highly heterogeneous environment that creates a significant challenge to the accurate identification of canopy gaps, the RGB imagery in Sub-compartment 16AB provided more distinct visual cues. This clarity allowed the U-Net model to perform better in this sub-compartment compared to Sub-compartment 42B. However, this improvement did not result in an overall superior performance, highlighting the complexity and variability within the dataset. In this context, deep learning models with many deep layers, such as ResNet101, are better suited to understanding and learning complex patterns and details in the dataset. Therefore, the ResU-Net model may outperform the U-Net model in this study.
Particularly, the ResU-Net_2 (the U-Net model with the pre-trained ResNet101backbone) showed the best performance in terms of all accuracy scores (Table 2 and Table 3). This is because the pre-trained model can improve the ability of a model to capture meaningful patterns and features in the specific segmentation task. Therefore, in this study, it is likely that the ResU-Net_2 with the RGB dataset was superior to the ResU-Net_1 model with the RGB dataset.
However, the fixed input layer of the pre-trained models (e.g., ResNet architectures are optimized for 3-channel RGB inputs) presents challenges when dealing with input data that deviate from the standard format. In fact, ResU-Net_1 achieved better results when using the fused RGB and CHM information from the UAV images than when using the RGB information alone, while the lowest accuracy was achieved using the CHM information in both cases of sub-compartments 42B and 16A (Table 2 and Table 3). It is assumed that the performance of the ResU-Net_2 model could be improved if the pre-trained models can accept multi-channel input data. Meanwhile, the observed discrepancy in CHM accuracy is probably due to the complex terrain variations and heterogeneous distribution of tree species of different ages as mentioned above in our study areas, which may have affected the accuracy of the CHM data (i.e., F1-scores of 0.53 in Sub-compartment 42B and 0.36 in Sub-compartment 16AB). In this study, as we used a fixed-height thresholding technique, a further study will consider using advanced thresholding techniques such as Otsu’s thresholding, adaptive thresholding (e.g., adaptive mean and adaptive Gaussian thresholding), and multi-level thresholding to better distinguish between canopy and canopy gap areas [48,49,50,51].
Our study’s findings using the ResU-Net_1 model are consistent with those of Chen et al. (2023) [9], who investigated canopy gaps using different methodologies in a species-rich subtropical forest in eastern China. They employed pixel-based supervised classification (PBSC), CHM thresholding classification (CHMC), and a method integrating height, spectral, and textural information (HSTAC) with UAV RGB imagery and achieved an OA score of 96% with HSTAC (fused UAV dataset), followed by PBSC methods (91–93%), and the lowest OA of 78% with CHMC. Similarly, in our study of uneven-aged mixed forests, we utilized a deep learning model using UAV RGB and CHM data for similar purposes. Table 2 and Table 3 show that the ResU-Net_1 model achieved the highest accuracy scores when trained on fused RGB and CHM data (OA of 0.96 in Sub-compartment 42B and 0.94 in Sub-compartment 16AB), while the lowest results were obtained with CHM alone (OA of 0.93 in Sub-compartment 42B and 0.90 in Sub-compartment 16AB).
The high OA scores achieved with fused data in both studies underscore the importance of integrating multiple data sources to improve canopy gap detection accuracy. However, the slightly lower or similar accuracy of our ResU-Net_1 models compared to the traditional classification methods used in Chen et al.’s study may be due to differences in study site size. While Chen et al.’s study was conducted on a 20 ha plot, our research covered larger areas, which likely introduced greater variability in environmental conditions, vegetation types, and canopy structures—factors that can influence model performance. Nevertheless, it is noteworthy that the ResU-Net_2 models obtained OA values of 0.97 and 0.96, demonstrating comparable or slightly improved performance relative to Chen et al.’s study.
In addition, our results are consistent with Li and Li (2023) [52], who used LiDAR-derived CHM and Sentinel-based canopy height inversion (HI) data with Deep Forest (DF) and Convolutional Neural Network (CNN) algorithms, achieving OA values from 0.80 to 0.91 in extracting forest canopy, forest gap, and non-forest areas across three distinct sites in the USA. Their study highlighted challenges in accurately distinguishing between canopy and fore-forest gaps due to spectral similarities and limitations of height inversion data. While Li and Li faced misclassification issues related to these data characteristics, our research overcomes these challenges by integrating high-resolution UAV imagery with advanced deep learning models.
Moreover, our results align with and exceed the performance of the previous study by Felix et al. (2021) [53], who used UAV RGB imagery and pixel- and object-based Random Forest (RF) and Support Vector Machine (SVM) models to map the canopy gaps in a forest remnant in Brazil and obtained the highest OA value of 0.93 with a pixel-based RF model. This comparison contributes novel insights into the use of low-cost UAV photogrammetric datasets combined with deep learning for accurate canopy gap detection.
Furthermore, our study demonstrates improvements in traditional machine learning methods. Jackson and Adam (2022) [4] utilized RF and SVM classifiers on WorldView-3 multispectral imagery in a submontane tropical forest, achieving OAs of 92.3% and 94.0%, respectively. However, their methods faced challenges such as biases in variable importance and spectral variability due to shadows and non-photosynthetic vegetation. Similarly, another study [11] used an object-oriented classification approach with multi-source data—spectral features, texture, and vegetation indices from UAV imagery—for canopy gap detection in conifer-dominated mountainous forests, achieving OAs from 0.91 to 0.99. Despite high accuracies, these methods encountered issues like misclassification due to vegetation shadows and spectral uncertainty from varying observation angles and solar altitudes.
In contrast, our research employed advanced deep learning models, specifically ResU-Net_2, combined with high-resolution UAV imagery to detect canopy gaps in complex, uneven-aged mixed conifer-broadleaf forests. Our models achieved OAs of 0.96 and 0.97, effectively mitigating issues related to shadows, spectral variability, and cloud cover. This demonstrates the robustness and adaptability of deep learning integrated with UAV data for accurate canopy gap detection across diverse forest types.
When our trained models were used as transfer models, it was found that the performance of the models after extended training exceeded that of the models before extended training (Table 4). In particular, the transfer model (resulting from the Sub-compartment 16AB dataset) using RGB UAV images collected before and after selection harvesting achieved the highest F1-score of 0.56 in canopy gap detection created by harvesting. While this moderate result appears to be related to the nature of deep learning architectures, which require large sample datasets to achieve good accuracy results [41,54,55], it also highlights the potential of our methodology. Despite the limited number of input images (72, representing 37 canopy gaps), our transfer models (after extended training) outperformed the ResU-Net model, suggesting that our approach is promising for detecting canopy gaps caused by harvesting.

5. Conclusions

In this study, canopy gaps were detected using UAV imagery of Sub-compartments 42B and 16AB through U-Net and ResU-Net (the U-Net model with ResNet101 backbone) models. Each of the models was trained using RGB, canopy height model (CHM), and fused RGB and CHM information from UAV imagery. In the case of the ResU-Net model with UAV RGB datasets, we trained the model twice without and with pre-trained weights; ResU-Net_1 and ResU-Net_2.
Our results indicate that the accuracy scores of the ResU-Net_2 model with RGB information were significantly higher than those of the U-Net and ResU-Net_1 models with all UAV datasets in both cases of the 42B and 16AB. Specifically, the U-Net model was the poorest in identifying canopy gaps in this study. In the case of the ResU-Net_1 model, the model combined with the fused RGB and CHM dataset, achieving the highest results in both Sub-compartments 42B and 16AB in terms of F1-scores and IoU values. This is useful information for forest managers to identify the canopy gaps within the forests accurately using an applicable technology. The accurate detection of canopy gaps helps forest managers target specific areas for attention, such as reforestation, pest control, and disease management, resulting in more efficient use of resources.
In summary, while our study employed advanced deep learning techniques with UAV imagery to detect canopy gaps in structurally complex mixed forests and demonstrated a high accuracy, it is important to acknowledge the potential limitations compared to other studies. Moreover, within our study, although the pre-trained ResU-Net_2 model achieved the most robust results, the fused RGB and CHM information yielded higher results in the case of ResU-Net_1. These findings suggest that integrating additional data sources could further enhance model performance. Therefore, it will be considered to use the U-Net model with the ResNet backbone, which can be pre-trained on large multi-channel datasets such as the SEN12MS dataset [56] and BigEarthNet dataset [57] in the future. In addition, a further research interest is to increase the size of the training data for canopy gap detection caused by selection harvesting using the transfer models, as it is expected that the models used in this study are promising for canopy gap detection, not only in this study area but also in other forests under the selection system.

Author Contributions

Conceptualization, N.M.H.; methodology, N.M.H.; software, T.O.; formal analysis, N.M.H.; resources, T.O.; data curation, N.M.H.; writing—original draft preparation, N.M.H.; writing—review and editing, T.O., S.T. and T.H.; visualization, N.M.H.; supervision, T.O. All authors have read and agreed to the published version of the manuscript.

Funding

This research received no external funding.

Data Availability Statement

The UAV datasets generated during the current study are not publicly available due to concerns related to the sensitivity of the specific sites and forest management practices involved. However, these datasets are available from the corresponding author upon reasonable request. Those interested will be required to provide appropriate justification for their request to ensure responsible and informed use of the data.

Acknowledgments

We extend our gratitude to the technical staff at the University of Tokyo Hokkaido Forest (UTHF)—Koichi Takahashi, Satoshi Chiino, Yuji Nakagawa, Takashi Inoue, Masaki Tokuni, and Shinya Inukai—for their efforts in collecting UAV imagery at the study sites and assisting with the visual annotation of the orthophotos. The LiDAR_DTM was derived from datasets supported by the Juro Kawachi Donation Fund, a collaborative grant between UTHF and Oji Forest Products Co., Ltd., and the Japan Society for the Promotion of Science (JSPS) KAKENHI No. 16H04946. Additionally, ChatGPT (OpenAI, San Francisco, CA, USA) was utilized to edit the English version of this manuscript.

Conflicts of Interest

The authors declare no conflicts of interest.

Appendix A

Figure A1. Visualization of the canopy gap distribution in Sub-compartment 42B predicted by the (a) U-Net model using the RGB dataset, (b) U-Net model using the CHM dataset, (c) U-Net model using the fused RGB and CHM dataset, (d) ResU-Net_1 model using the RGB dataset, (e) ResU-Net_1 model using the CHM dataset, and (f) ResU-Net_1 model using the fused RGB and CHM dataset.
Drones 08 00484 g0a1
Figure A2. Visualization of the canopy gap distribution in Sub-compartment 16AB predicted by the (a) U-Net model using the RGB dataset, (b) U-Net model using the CHM dataset, (c) U-Net model using the fused RGB and CHM dataset, (d) ResU-Net_1 model using the RGB dataset, (e) ResU-Net_1 model using the CHM dataset, and (f) ResU-Net_1 model using the fused RGB and CHM dataset.
Drones 08 00484 g0a2

References

  1. Yamamoto, S.-I. Forest Gap Dynamics and Tree Regeneration. J. For. Res. 2000, 5, 223–229. [Google Scholar] [CrossRef]
  2. Brokaw, A.N.V.L. Gap-Phase Regeneration of Three Pioneer Tree Species in a Tropical Forest. J. Ecol. 1987, 75, 9–19. [Google Scholar] [CrossRef]
  3. Watt, A.S. Pattern and Process in the Plant Community. J. Ecol. 1947, 35, 1–13. [Google Scholar] [CrossRef]
  4. Getzin, S.; Nuske, R.S.; Wiegand, K. Using Unmanned Aerial Vehicles (UAV) to Quantify Spatial Gap Patterns in Forests. Remote Sens. 2014, 6, 6988–7004. [Google Scholar] [CrossRef]
  5. Asner, G.P.; Kellner, J.R.; Kennedy-Bowdoin, T.; Knapp, D.E.; Anderson, C.; Martin, R.E. Forest Canopy Gap Distributions in the Southern Peruvian Amazon. PLoS ONE 2013, 8, e60875. [Google Scholar] [CrossRef]
  6. White, J.C.; Tompalski, P.; Coops, N.C.; Wulder, M.A. Comparison of Airborne Laser Scanning and Digital Stereo Imagery for Characterizing Forest Canopy Gaps in Coastal Temperate Rainforests. Remote Sens. Environ. 2018, 208, 1–14. [Google Scholar] [CrossRef]
  7. Pilaš, I.; Gašparović, M.; Novkinić, A.; Klobučar, D. Mapping of the Canopy Openings in Mixed Beech–Fir Forest at Sentinel-2 Subpixel Level Using Uav and Machine Learning Approach. Remote Sens. 2020, 12, 3925. [Google Scholar] [CrossRef]
  8. Chen, J.; Wang, L.; Jucker, T.; Da, H.; Zhang, Z.; Hu, J.; Yang, Q.; Wang, X.; Qin, Y.; Shen, G.; et al. Detecting Forest Canopy Gaps Using Unoccupied Aerial Vehicle RGB Imagery in a Species-Rich Subtropical Forest. Remote Sens. Ecol. Conserv. 2023, 9, 671–686. [Google Scholar] [CrossRef]
  9. Jackson, C.M.; Adam, E. A Machine Learning Approach to Mapping Canopy Gaps in an Indigenous Tropical Submontane Forest Using WorldView-3 Multispectral Satellite Imagery. Environ. Conserv. 2022, 49, 255–262. [Google Scholar] [CrossRef]
  10. Solano, F.; Praticò, S.; Piovesan, G.; Modica, G. Unmanned Aerial Vehicle (UAV) Derived Canopy Gaps in the Old-Growth Beech Forest of Mount Pollinello (Italy): Preliminary Results; Springer International Publishing: Cham, Switzerland, 2021; Volume 12955, pp. 126–138. [Google Scholar]
  11. Xia, J.; Wang, Y.; Dong, P.; He, S.; Zhao, F.; Luan, G. Object-Oriented Canopy Gap Extraction from UAV Images Based on Edge Enhancement. Remote Sens. 2022, 14, 4762. [Google Scholar] [CrossRef]
  12. Grybas, H.; Congalton, R.G. Evaluating the Capability of Unmanned Aerial System (Uas) Imagery to Detect and Measure the Effects of Edge Influence on Forest Canopy Cover in New England. Forests 2021, 12, 1252. [Google Scholar] [CrossRef]
  13. Grybas, H.; Congalton, R.G. A Comparison of Multi-Temporal Rgb and Multispectral Uas Imagery for Tree Species Classification in Heterogeneous New Hampshire Forests. Remote Sens. 2021, 13, 2631. [Google Scholar] [CrossRef]
  14. Onishi, M.; Watanabe, S.; Nakashima, T.; Ise, T. Practicality and Robustness of Tree Species Identification Using UAV RGB Image and Deep Learning in Temperate Forest in Japan. Remote Sens. 2022, 14, 1710. [Google Scholar] [CrossRef]
  15. Zhang, Y.; Yang, W.; Zhang, W.; Yu, J.; Zhang, J.; Yang, Y.; Lu, Y.; Tang, W. Two-Step ResUp&Down Generative Adversarial Network to Reconstruct Multispectral Image from Aerial RGB Image. Comput. Electron. Agric. 2022, 192, 106617. [Google Scholar] [CrossRef]
  16. Kachamba, D.J.; Ørka, H.O.; Gobakken, T.; Eid, T.; Mwase, W. Biomass Estimation Using 3D Data from Unmanned Aerial Vehicle Imagery in a Tropical Woodland. Remote Sens. 2016, 8, 968. [Google Scholar] [CrossRef]
  17. Yurtseven, H.; Akgul, M.; Coban, S.; Gulci, S. Determination and Accuracy Analysis of Individual Tree Crown Parameters Using UAV Based Imagery and OBIA Techniques. Measurement 2019, 145, 651–664. [Google Scholar] [CrossRef]
  18. Tang, L.; Shao, G. Drone Remote Sensing for Forestry Research and Practices. J. For. Res. 2015, 26, 791–797. [Google Scholar] [CrossRef]
  19. Tran, D.Q.; Park, M.; Jung, D.; Park, S. Damage-Map Estimation Using Uav Images and Deep Learning Algorithms for Disaster Management System. Remote Sens. 2020, 12, 4169. [Google Scholar] [CrossRef]
  20. Franklin, H.; Veras, P.; Pinheiro, M.; Paula, A.; Corte, D.; Roberto, C. Fusing Multi-Season UAS Images with Convolutional Neural Networks to Map Tree Species in Amazonian Forests. Ecol. Inform. 2022, 71, 101815. [Google Scholar] [CrossRef]
  21. Schiefer, F.; Kattenborn, T.; Frick, A.; Frey, J.; Schall, P.; Koch, B.; Schmidtlein, S. Mapping Forest Tree Species in High Resolution UAV-Based RGB-Imagery by Means of Convolutional Neural Networks. ISPRS J. Photogramm. Remote Sens. 2020, 170, 205–215. [Google Scholar] [CrossRef]
  22. Li, L.; Mu, X.; Chianucci, F.; Qi, J.; Jiang, J.; Zhou, J.; Chen, L.; Huang, H.; Yan, G.; Liu, S. Ultrahigh-Resolution Boreal Forest Canopy Mapping: Combining UAV Imagery and Photogrammetric Point Clouds in a Deep-Learning-Based Approach. Int. J. Appl. Earth Obs. Geoinf. 2022, 107, 102686. [Google Scholar] [CrossRef]
  23. Safonova, A.; Tabik, S.; Alcaraz-Segura, D.; Rubtsov, A.; Maglinets, Y.; Herrera, F. Detection of Fir Trees (Abies Sibirica) Damaged by the Bark Beetle in Unmanned Aerial Vehicle Images with Deep Learning. Remote Sens. 2019, 11, 643. [Google Scholar] [CrossRef]
  24. Elamin, A.; El-Rabbany, A. UAV-Based Multi-Sensor Data Fusion for Urban Land Cover Mapping Using a Deep Convolutional Neural Network. Remote Sens. 2022, 14, 4298. [Google Scholar] [CrossRef]
  25. Jayathunga, S.; Owari, T.; Tsuyuki, S.; Hirata, Y. Potential of UAV Photogrammetry for Characterization of Forest Canopy Structure in Uneven-Aged Mixed Conifer–Broadleaf Forests. Int. J. Remote Sens. 2020, 41, 53–73. [Google Scholar] [CrossRef]
  26. Jayathunga, S.; Owari, T.; Tsuyuki, S. Evaluating the Performance of Photogrammetric Products Using Fixed-Wing UAV Imagery over a Mixed Conifer-Broadleaf Forest: Comparison with Airborne Laser Scanning. Remote Sens. 2018, 10, 187. [Google Scholar] [CrossRef]
  27. Htun, N.M.; Owari, T.; Tsuyuki, S.; Hiroshima, T. Integration of Unmanned Aerial Vehicle Imagery and Machine Learning Technology to Map the Distribution of Conifer and Broadleaf Canopy Cover in Uneven-Aged Mixed Forests. Drones 2023, 7, 705. [Google Scholar] [CrossRef]
  28. Jayathunga, S.; Owari, T.; Tsuyuki, S. The Use of Fixed–Wing UAV Photogrammetry with LiDAR DTM to Estimate Merchantable Volume and Carbon Stock in Living Biomass over a Mixed Conifer–Broadleaf Forest. Int. J. Appl. Earth Obs. Geoinf. 2018, 73, 767–777. [Google Scholar] [CrossRef]
  29. Ronneberger, O.; Fischer, P.; Brox, T. INet: Convolutional Networks for Biomedical Image Segmentation. IEEE Access 2015, 9, 16591–16603. [Google Scholar] [CrossRef]
  30. Pei, H.; Owari, T.; Tsuyuki, S.; Zhong, Y. Application of a Novel Multiscale Global Graph Convolutional Neural Network to Improve the Accuracy of Forest Type Classification Using Aerial Photographs. Remote Sens. 2023, 15, 1001. [Google Scholar] [CrossRef]
  31. He, S.; Xu, G.; Yang, H. A Semantic Segmentation Method for Remote Sensing Images Based on Multiple Contextual Feature Extraction. Concurr. Comput. Pract. Exp. 2022, 10, 77432–77451. [Google Scholar] [CrossRef]
  32. Zhang, C.; Atkinson, P.M.; George, C.; Wen, Z.; Diazgranados, M.; Gerard, F. Identifying and Mapping Individual Plants in a Highly Diverse High-Elevation Ecosystem Using UAV Imagery and Deep Learning. ISPRS J. Photogramm. Remote Sens. 2020, 169, 280–291. [Google Scholar] [CrossRef]
  33. Pyo, J.C.; Han, K.J.; Cho, Y.; Kim, D.; Jin, D. Generalization of U-Net Semantic Segmentation for Forest Change Detection in South Korea Using Airborne Imagery. Forests 2022, 13, 2170. [Google Scholar] [CrossRef]
  34. Zhang, P.; Ban, Y.; Nascetti, A. Learning U-Net without Forgetting for near Real-Time Wildfire Monitoring by the Fusion of SAR and Optical Time Series. Remote Sens. Environ. 2021, 261, 112467. [Google Scholar] [CrossRef]
  35. Wagner, F.H.; Sanchez, A.; Tarabalka, Y.; Lotte, R.G.; Ferreira, M.P.; Aidar, M.P.M.; Gloor, E.; Phillips, O.L.; Aragão, L.E.O.C. Using the U-Net Convolutional Network to Map Forest Types and Disturbance in the Atlantic Rainforest with Very High Resolution Images. Remote Sens. Ecol. Conserv. 2019, 5, 360–375. [Google Scholar] [CrossRef]
  36. Cao, K.; Zhang, X. An Improved Res-UNet Model for Tree Species Classification Using Airborne High-Resolution Images. Remote Sens. 2020, 12, 1128. [Google Scholar] [CrossRef]
  37. Huang, S.; Huang, M.; Zhang, Y.; Chen, J.; Bhatti, U. Medical Image Segmentation Using Deep Learning with Feature Enhancement. IET Image Process. 2020, 14, 3324–3332. [Google Scholar] [CrossRef]
  38. He, K.; Zhang, X.; Ren, S.; Sun, J. Deep Residual Learning for Image Recognition. In Proceedings of the IEEE Computer Society Conference on Computer Vision and Pattern Recognition (CVPR), Las Vegas, NV, USA, 27–30 June 2016; pp. 770–778. [Google Scholar] [CrossRef]
  39. Yang, M.; Mou, Y.; Liu, S.; Meng, Y.; Liu, Z.; Li, P.; Xiang, W.; Zhou, X.; Peng, C. Detecting and Mapping Tree Crowns Based on Convolutional Neural Network and Google Earth Images. Int. J. Appl. Earth Obs. Geoinf. 2022, 108, 102764. [Google Scholar] [CrossRef]
  40. Liu, B.; Hao, Y.; Huang, H.; Chen, S.; Li, Z.; Chen, E.; Tian, X.; Ren, M. TSCMDL: Multimodal Deep Learning Framework for Classifying Tree Species Using Fusion of 2-D and 3-D Features. IEEE Trans. Geosci. Remote Sens. 2023, 61, 1–11. [Google Scholar] [CrossRef]
  41. Chen, C.; Jing, L.; Li, H.; Tang, Y. A New Individual Tree Species Classification Method Based on the Resu-Net Model. Forests 2021, 12, 1202. [Google Scholar] [CrossRef]
  42. Htun, N.M.; Owari, T.; Tsuyuki, S.; Hiroshima, T. Mapping the Distribution of High-Value Broadleaf Tree Crowns through Unmanned Aerial Vehicle Image Analysis Using Deep Learning. Algorithms 2024, 17, 84. [Google Scholar] [CrossRef]
  43. Bonnet, S.; Gaulton, R.; Lehaire, F.; Lejeune, P. Canopy Gap Mapping from Airborne Laser Scanning: An Assessment of the Positional and Geometrical Accuracy. Remote Sens. 2015, 7, 11267–11294. [Google Scholar] [CrossRef]
  44. Boyd, D.S.; Hill, R.A.; Hopkinson, C.; Baker, T.R. Landscape-Scale Forest Disturbance Regimes in Southern Peruvian Amazonia. Ecol. Appl. 2013, 23, 1588–1602. [Google Scholar] [CrossRef] [PubMed]
  45. Zhu, X.X.; Tuia, D.; Mou, L.; Xia, G.S.; Zhang, L.; Xu, F.; Fraundorfer, F. Deep Learning in Remote Sensing: A Comprehensive Review and List of Resources. IEEE Geosci. Remote Sens. Mag. 2017, 5, 8–36. [Google Scholar] [CrossRef]
  46. Buda, M.; Maki, A.; Mazurowski, M.A. A Systematic Study of the Class Imbalance Problem in Convolutional Neural Networks. Neural Netw. 2018, 106, 249–259. [Google Scholar] [CrossRef]
  47. Cabezas, M.; Kentsch, S.; Tomhave, L.; Gross, J.; Caceres, M.L.L.; Diez, Y. Detection of Invasive Species in Wetlands: Practical Dl with Heavily Imbalanced Data. Remote Sens. 2020, 12, 3431. [Google Scholar] [CrossRef]
  48. Safonova, A.; Hamad, Y.; Dmitriev, E.; Georgiev, G.; Trenkin, V.; Georgieva, M.; Dimitrov, S.; Iliev, M. Individual Tree Crown Delineation for the Species Classification and Assessment of Vital Status of Forest Stands from UAV Images. Drones 2021, 5, 77. [Google Scholar] [CrossRef]
  49. Pratiwi, N.M.D.; Widiartha, I.M. Mangrove Ecosystem Segmentation from Drone Images Using Otsu Method. JELIKU J. Elektron. Ilmu Komput. Udayana 2021, 9, 391. [Google Scholar] [CrossRef]
  50. Bradley, D.; Roth, G. Adaptive Thresholding Using the Integral Image. J. Graph. Tools 2007, 12, 13–21. [Google Scholar] [CrossRef]
  51. Sankur, B. Survey over Image Thresholding Techniques and Quantitative Performance Evaluation. J. Electron. Imaging 2004, 13, 146. [Google Scholar] [CrossRef]
  52. Li, M.; Li, M. Forest Gap Extraction Based on Convolutional Neural Networks and Sentinel-2 Images. Forests 2023, 14, 2146. [Google Scholar] [CrossRef]
  53. Felix, F.C.; Spalevic, V.; Curovic, M.; Mincato, R.L. Comparing Pixel-and Object-Based Forest Canopy Gaps Classification Using Low-Cost Unmanned Aerial Vehicle Imagery. Agric. For. 2021, 2021, 19–29. [Google Scholar] [CrossRef]
  54. Mäyrä, J.; Keski-Saari, S.; Kivinen, S.; Tanhuanpää, T.; Hurskainen, P.; Kullberg, P.; Poikolainen, L.; Viinikka, A.; Tuominen, S.; Kumpula, T.; et al. Tree Species Classification from Airborne Hyperspectral and LiDAR Data Using 3D Convolutional Neural Networks. Remote Sens. Environ. 2021, 256, 112322. [Google Scholar] [CrossRef]
  55. Sothe, C.; La Rosa, L.E.C.; De Almeida, C.M.; Gonsamo, A.; Schimalski, M.B.; Castro, J.D.B.; Feitosa, R.Q.; Dalponte, M.; Lima, C.L.; Liesenberg, V.; et al. Evaluating a Convolutional Neural Network for Feature Extraction and Tree Species Classification Using Uav-Hyperspectral Images. ISPRS Ann. Photogramm. Remote Sens. Spat. Inf. Sci. 2020, 5, 193–199. [Google Scholar] [CrossRef]
  56. Schmitt, M.; Hughes, L.H.; Qiu, C.; Zhu, X.X. SEN12MS—A curated dataset of georeferenced multi-spectral sentinel-1/2 imagery for deep learning and data fusion. ISPRS Ann. Photogramm. Remote Sens. Spat. Inf. Sci. 2019, 4, 153–160. [Google Scholar] [CrossRef]
  57. Sumbul, G.; Charfuelan, M.; Demir, B.; Markl, V. Bigearthnet: A Large-Scale Benchmark Archive for Remote Sensing Image Understanding. In Proceedings of the IGARSS 2019—2019 IEEE International Geoscience and Remote Sensing Symposium, Yokohama, Japan, 28 July–2 August 2019; pp. 5901–5904. [Google Scholar] [CrossRef]
Figure 1. (a) Location map of the University of Tokyo Hokkaido Forest (UTHF); (b) location map of the selected two Sub- compartments in the UTHF; Orthomosaics of Sub-compartment (c) 42B and (d) 16AB.
Drones 08 00484 g001
Figure 2. Canopy Height Model of sub-compartments: (a) 42B, (b) 16AB.
Drones 08 00484 g002
Figure 3. Aerial orthophotos of Sub-compartment 42B’s (a) pre-selection harvesting and (b) post-selection harvesting.
Drones 08 00484 g003
Figure 4. Workflow for detecting canopy gaps in uneven-aged mixed forests using UAV imagery and deep learning models.
Drones 08 00484 g004
Figure 5. ResU-Net (U-Net with ResNet101 backbone) classification algorithm.
Drones 08 00484 g005
Figure 6. Visualization of the canopy gap distribution in the Sub-compartment 42B predicted by the ResU-Net_2 model.
Drones 08 00484 g006
Figure 7. Visualization of the canopy gap distribution in Sub-compartment 16AB predicted by the ResU-Net_2 model.
Drones 08 00484 g007
Figure 8. Confusion matrix of canopy gap detection by selection harvesting by using transfer models: (a) by the transfer model using the Sub-compartment 42B dataset (before extended training); (b) by the transfer model using the Sub-compartment 16AB dataset (before extended training); (c) by the transfer model using the Sub-compartment 42B dataset (after extended training); (d) by the transfer model using the Sub-compartment 16AB dataset (after extended training); and (e) by the ResU-Net model.
Drones 08 00484 g008
Figure 9. Visualization of predicted canopy gaps by using transfer models. (a) Testing RGB image (post-selection harvesting); (b) labeled mask; (c,d) prediction results using the transfer model on the Sub-compartment 42B dataset (before extended training) and misclassified regions; (e,f) prediction results using the transfer model on the Sub-compartment 16AB dataset (before extended training) and misclassified regions; (g,h) prediction results using the transfer model on the Sub-compartment 42B dataset (after extended training) and misclassified regions; (i,j) prediction results using the transfer model on the Sub-compartment 16AB dataset (after extended training) and misclassified regions; (k,l) prediction results using the ResU-Net model and misclassified region.
Drones 08 00484 g009
Figure 10. Training and validation accuracies and losses of (a,b) the transfer model using the Sub-compartment 42B dataset (before extended training); (c,d) the transfer model using the Sub-compartment 16AB dataset (before extended training); (e,f) the transfer model using the Sub-compartment 42B dataset (after extended training); (g,h) the transfer model using the Sub-compartment 16AB dataset (after extended training); and (i,j) the ResU-Net model.
Drones 08 00484 g010
Table 1. Specifications of the LiDAR data.
ParameterDescription
Course overlap50%
Flying height600 m
Flying speed140.4 km/h
pulse rate100 kHz
scan angle±20°
beam divergence0.16 mrad
point density11.6 points/m2
Table 2. F1-score, precision, recall, OA, and IoU values of canopy gap detection using deep learning models and UAV remote sensing datasets of Sub-compartment 42B (the highest accuracy scores are in bold).
Deep Learning ModelsUAV DatasetsF1-ScorePrecisionRecallOAIoU
U-NetRGB0.000.010.000.930.00
CHM0.520.550.500.940.36
RGB_CHM0.480.690.370.940.31
ResU-Net_1RGB0.640.700.600.950.47
CHM0.530.520.550.930.36
RGB_CHM0.700.740.670.960.54
ResU-Net_2RGB0.770.790.740.970.62
Table 3. F1-score, precision, recall, OA, and IoU values of canopy gap detection using deep learning models and UAV remote sensing datasets of Sub-compartment 16AB (the highest accuracy scores are in bold).
Deep Learning ModelsUAV DatasetsF1-ScorePrecisionRecallOAIoU
U-NetRGB0.630.610.660.930.46
CHM0.010.310.000.900.01
RGB_CHM0.440.670.330.920.28
ResU-Net_1RGB0.700.690.710.940.54
CHM0.360.430.310.900.22
RGB_CHM0.720.680.770.940.56
ResU-Net_2RGB0.790.770.810.960.66
Table 4. Accuracy results for detection of canopy gap created by selection harvesting using the deep learning models and pre- and post-UAV imagery (the highest accuracy scores are in bold).
Transfer ModelF1-ScorePrecisionRecallOAIoU
Before extended training 42B0.370.570.280.820.23
16AB0.470.540.420.810.31
After extended training 42B0.540.600.490.830.37
16AB0.560.560.560.830.39
ResU-Net 0.450.610.350.830.29
Disclaimer/Publisher’s Note: The statements, opinions and data contained in all publications are solely those of the individual author(s) and contributor(s) and not of MDPI and/or the editor(s). MDPI and/or the editor(s) disclaim responsibility for any injury to people or property resulting from any ideas, methods, instructions or products referred to in the content.

