Abstract
Plant height and SPAD values are critical indicators for evaluating peanut morphological development, photosynthetic efficiency, and yield optimization. Recent unmanned aerial vehicle (UAV) technology advancements have enabled high-throughput phenotyping at field scales. As a globally strategic oilseed crop, peanut plays a vital role in ensuring food and edible oil security. This study aimed to develop an optimized estimation framework for peanut plant height and SPAD values through machine learning-driven integration of UAV multi-source data while evaluating model generalizability across temporal and spatial domains. Multispectral UAV and ground data were collected across four growth stages (2023–2024). Using spectral indices and Texture features, four models (PLSR, SVM, ANN, RFR) were trained on 2024 data and independently validated with 2023 datasets. The ensemble machine learning models (RFR) significantly enhanced estimation accuracy (R2 improvement: 3.1–34.5%) and robustness compared to the linear model (PLSR). Feature stability analysis revealed that combined spectral-textural features outperformed single-feature approaches. The SVM model achieved superior plant height prediction (R2 = 0.912, RMSE = 2.14 cm), while RFR optimally estimated SPAD values (R2 = 0.530, RMSE = 3.87) across heterogeneous field conditions. This UAV-based multi-modal integration framework demonstrates significant potential for temporal monitoring of peanut growth dynamics.
1. Introduction
A vital cash crop and a significant producer of grain and oil, peanuts are essential to China’s social progress, national economy, and farmer income. Both plant height and SPAD are important factors in peanut growth and development [1], with plant height influencing physiological processes like peanut photosynthetic production by altering the crop’s canopy structure [2] and leaf SPAD directly influencing photosynthetic production efficiency [3,4]. While the SPAD is also analyzed by UV spectrophotometry, fluorescence analysis, and in vivo chlorophyll analysis, which is not only less effective but also has some effect on other plants in the experimental area, it is currently possible to determine the height of peanut plants and their relative chlorophyll content directly on the plant using a measuring tool, which is less harmful to the peanut plant [5].
Numerous studies have shown that UAVs are feasible for phenotypic research in various crop reproductive times due to their quick adoption in agriculture [6,7]. There are variations in the inversion of phenotypes by different sensor lenses acquiring different types of data, and UAV systems’ sensor lenses have demonstrated great accuracy in crop phenotyping parameter estimate [8]. For instance, thermal infrared sensors track crop growth by measuring crop canopy temperature and crop response to water stress [9], hyperspectral lenses have a more accurate inversion of crop phenotypes through a wider wavelength band than multispectral cameras [10], and multispectral image data can be analyzed by spectral, textural, and structural information for the detection of crop phenotypic indicators [11], maturity [12], and crop diseases [13] inversion [10]. The accuracy of single data sources in numerous applications needs to be improved even though UAVs are quick, efficient, and capable of carrying several sensors at once. Additionally, the individual data sources that UAVs capture have shown promising outcomes in applications.
When compared to single data sources, multi-source data fusion, which combines data from several sources collected by sensors, has improved processing accuracy to some extent. It has been noted that combining canopy spectral data enhances the estimation of plant traits such as crop biomass [14], LAI [15], and seed yield [16]. Numerous agricultural applications have utilized the potential of combining canopy spectral, structural, thermal, and Texture information from various sensor systems to enhance plant trait estimation [15,17]. Additionally, research has shown that combining canopy thermal information with spectral and structural features enhanced the robustness of crop yield prediction [18] across a range of weather conditions and developmental stages. In addition to highlighting the morphological and structural characteristics of plant canopies, Texture information—which is defined by spatial variations in pixel intensities in an image—can also help prevent saturation of models that are unable to account for the significant spatial heterogeneity of the landscape [19]. There has been little direct evaluation of the potential of image Texture in crop phenotypic trait prediction [20], even though Texture information has been extensively utilized for image classification and segmentation in numerous prior studies [21]. Additionally, there has been no report on the use of spatial information inherent in Texture features in peanut phenotypic trait estimation. Consequently, it may be possible to use Texture data to predict peanut phenotypes.
To accurately predict phenotypic metrics for a range of crops, numerous statistical and machine learning (ML) based regression techniques have been employed, including multiple linear regression (MLR) [22], partial least squares regression (PLSR) [18], artificial neural network (ANN) [23], random forest regression (RFR) [24], and support vector regression (SVR) [25]. The estimation of phenotypic traits and yields of several crops has been accomplished by combining multimodal data fusion with machine learning [6], which has demonstrated good prediction accuracy and resilience [26]. Individual machine learning models (PLSR, LASSO, SVR) achieve operational viability in crop phenotype estimation but suffer from stringent data requirements and unstable generalization under UAV-acquired heterogeneous datasets [27]. Ensemble learning addresses these limitations by strategically integrating base learners. Bagging-based RFR has demonstrated exceptional precision in crop phenotyping [28], while Boosting-driven CatBoost excels in automated categorical feature processing, adaptive scaling, and missing value mitigation, enhancing accuracy with reduced operational complexity [29]. However, the estimation of phenotypic traits of peanuts has not been reported.
The specificity of peanut plants has limited the use of this high-throughput phenotypic detection and analysis method, and little is known about the contribution of combining canopy spectral and textural features to peanut phenotypic estimation. In conclusion, regression models based on data fusion of UAV-mounted multi-type sensors while using machine learning have been used for crop trait estimation. To detect crop growth and development using phenotypic data, this study proposes to analyze and research multi-source data fusion of peanut phenotypic metrics using a UAV equipped with multispectral lenses. Additionally, the following concerns are recommended to be investigated: 1. The viability of estimating peanut phenotypic metrics using multi-source data fusion techniques; 2. The impact of various data sources on the model’s estimation accuracy; 3. A comparison of the RFR and PLSR, SVM, and ANN differences among the four approaches for estimating peanut phenotypes; 4. Verify that the peanut phenotypic prediction model is applicable and generalizable.
2. Materials and Methods
2.1. Experimental Site and Design
The study was conducted during 2023–2024 growing seasons at the Ningyang Experimental Station (35°50′57″ N, 116°39′50″ E) of Shandong Academy of Agricultural Sciences, China (Figure 1). Situated in a warm-temperate semi-humid monsoon climate zone, the site exhibited characteristic seasonal precipitation patterns with 72% rainfall concentrated in July-August (605.1 mm in 2023; 849.3 mm in 2024), accompanied by average annual temperatures of 14.0 °C and 13.4 °C for respective years. The experimental fields featured well-drained sandy loam soils (Haplic Cambisols, FAO classification) with 1.2% organic matter content, characteristic of high-yield peanut cultivation regions in the Yellow River Valley.
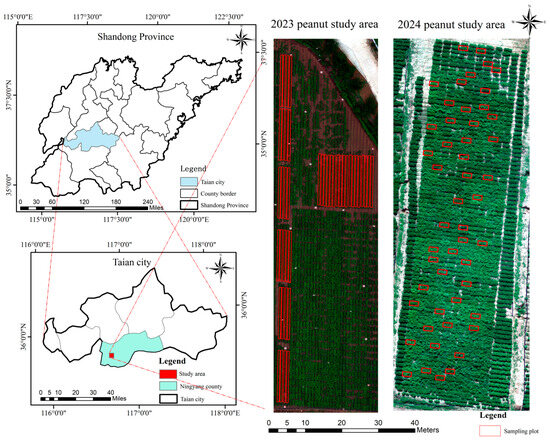
Figure 1.
Geographic location of the test site.
A split-plot design was implemented with row spacing (40 cm) and planting density (330,000 plants ha⁻1) held constant across both years. The 2023 trial comprised 43 elite cultivars (including provincial-recommended varieties and high-yielding genotypes) sown on 10 May, arranged in 4 m long plots (0.85 m row spacing) with 0.60 m surface width. In contrast, the 2024 experiment expanded to 800 test genotypes planted on 13 May using a ridge-furrow system (0.48 m2 plot area), maintaining consistent agronomic practices except for genotype diversity scaling. All trials followed local precision management protocols, including drip irrigation and integrated pest management.
2.2. Data Collection
Field measurements of phenotypic traits and UAV-based image acquisition were conducted synchronously during four critical growth stages of peanut development: seedling establishment (V3), flowering and peg penetration (R1), pod formation (R3), and physiological maturity (R7), following the standardized growth stage classification for peanut (Table 1).

Table 1.
Peanut Critical Fertility Periods and Sampling Dates.
2.2.1. Plant Height and SPAD Measurements
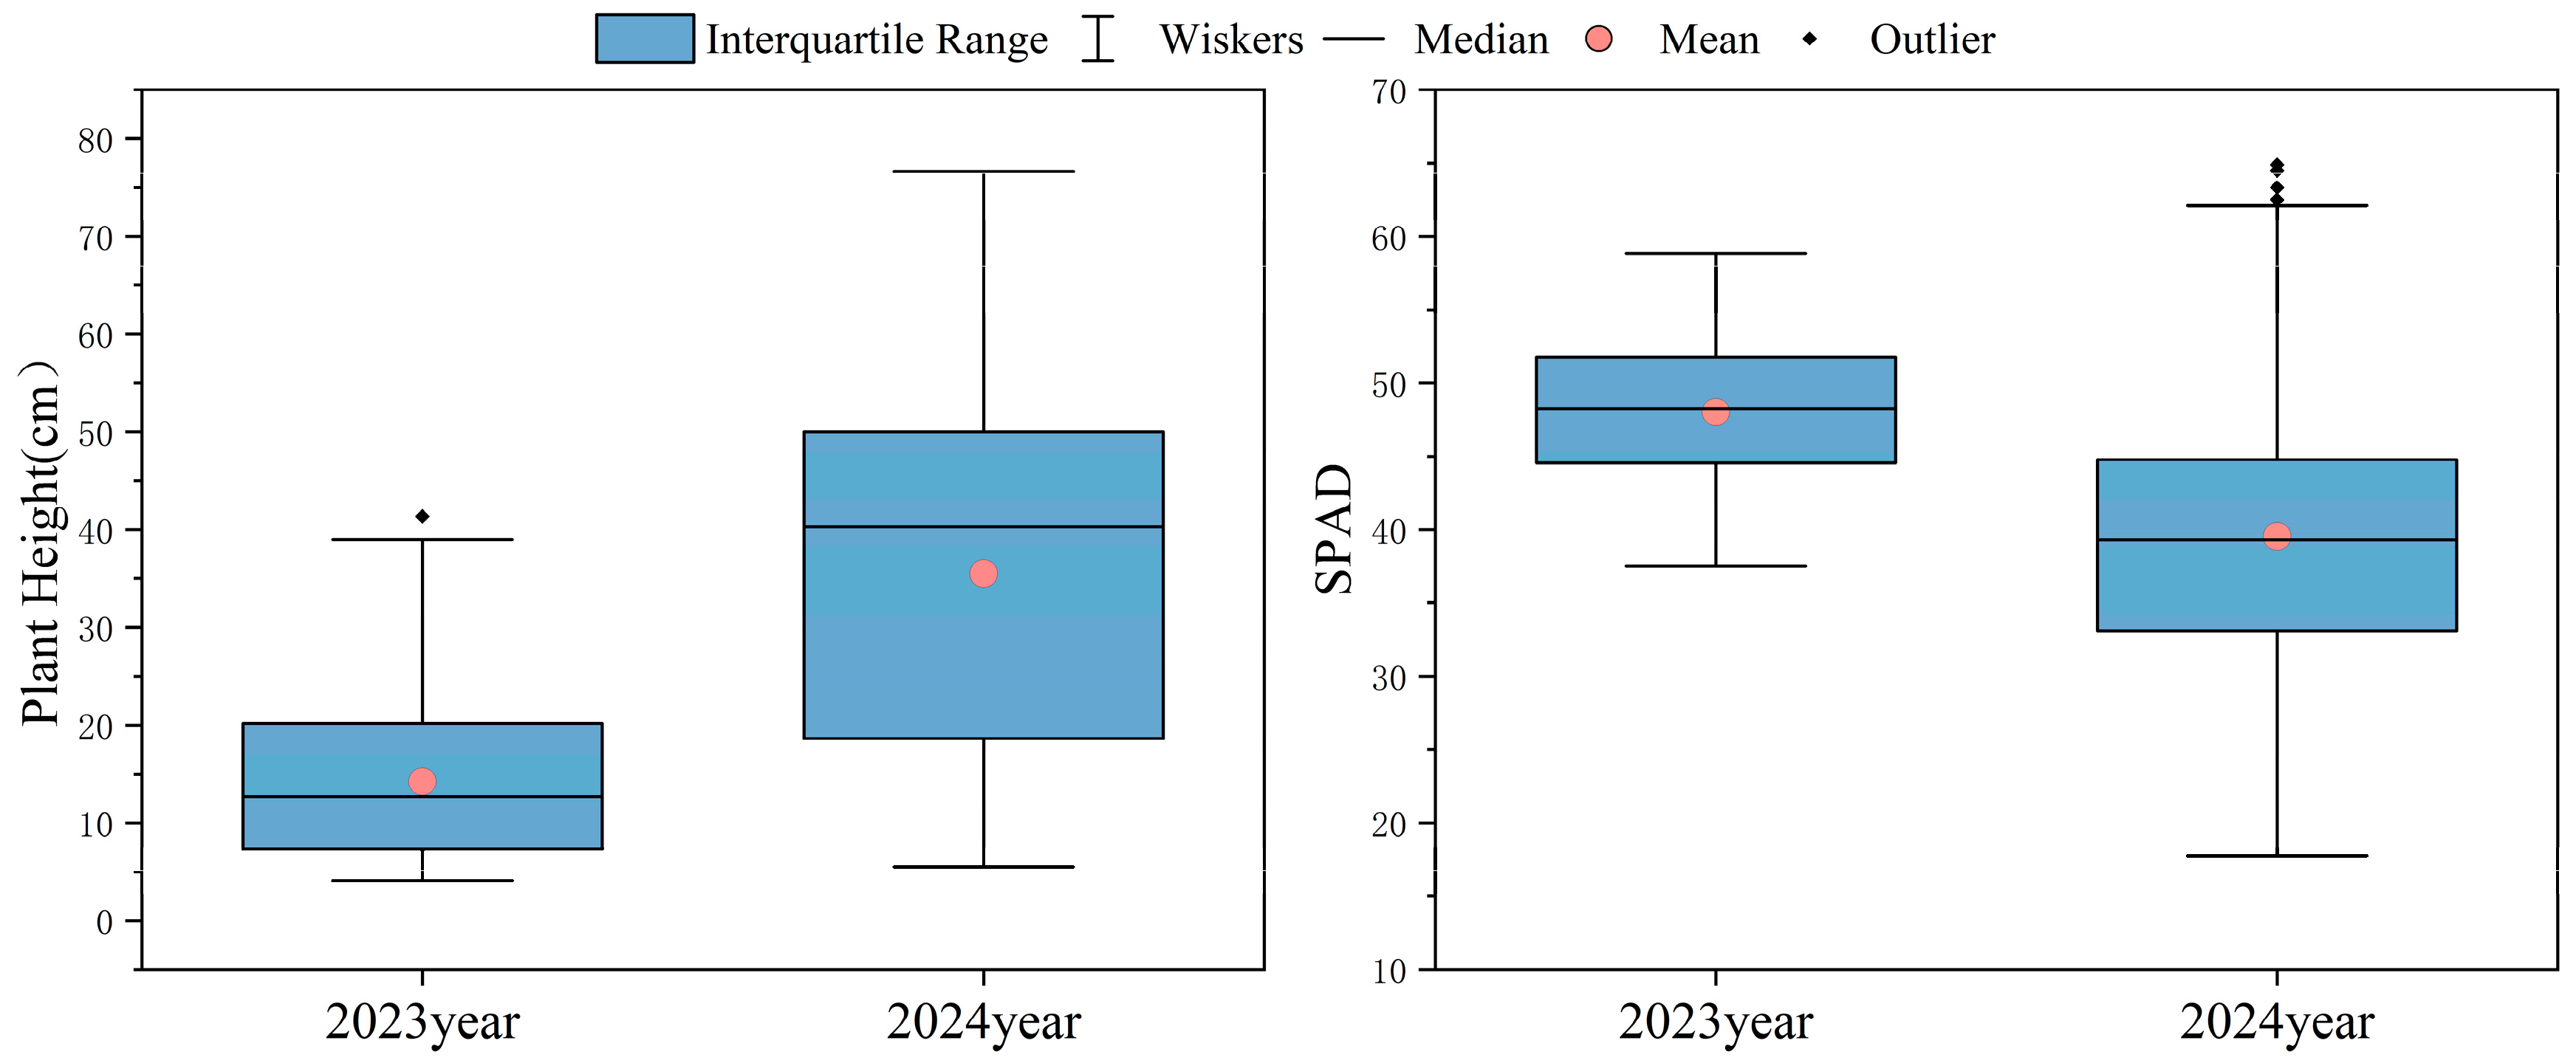
At each critical growth stage, five representative plants were systematically sampled following standardized phenotyping protocols. Field-measured plant height (cm) and SPAD-502 m (Konica Minolta, Chiyoda-ku, Tokyo 100-7015, Japan) readings were recorded between 10:00 and 14:00 local time under diffuse light conditions. Statistical analysis revealed interannual variability patterns (Figure 2), with 2024 SPAD measurements exhibiting greater dispersion. This increased heterogeneity in the 2024 dataset justified its selection for model calibration, while the 2023 data served as an independent validation set.
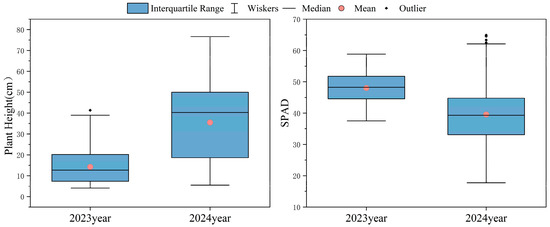
Figure 2.
Statistics of plant height and SPAD value in different years.
2.2.2. Multispectral Data UAV Data Acquisition
The UAV 4-in-1 phenotype platform developed by the group was utilized for multispectral data acquisition, and the data were calibrated using a reflectance calibration plate and a light sensor [30]. To obtain accurate multispectral data, the test was conducted in clear and cloudless weather, and the UAV route planning in this test used the waypoint flight mode with 85% route coverage, the UAV flight altitude of 30 m, the flight speed set at 1 m/s, and the turning radius of the route of 5 m.
2.3. Feature Extraction
2.3.1. Preprocessing
The image information collected by the UAV remote sensing platform is a peanut multi-band single remote sensing image, which needs to be spliced and radiometrically corrected before information extraction. The multispectral image stitching was realized with Pix4D 4.5.6 software, in which the radiometric calibration was performed to obtain the orthophoto. The original UAV images acquired during different fertility periods and the calibration plate data of each band were imported into Pix4D 4.5.6 software for radiometric calibration, image alignment, camera optimization, and construction of orthophoto. The synthesized images of each band were imported into ArcMap 10.7 software for band combination and exported. The orthophotos were imported into ENVI 5.6 and subjected to geographic alignment, region of interest (ROI) mapping, masking (to remove soil background), and vegetation index extraction.
2.3.2. Canopy Spectral Parameters (MS)
Based on summarized previous work, multispectral bands and related vegetation indices for estimating crop height and SPAD values were selected in this study (Table 2). These indices not only include traditional vegetation indices but also take into account information from red, green, blue, red-edge, and near-infrared bands to reflect crop growth more comprehensively. The table details their names and corresponding calculation formulas.
Table 2.
Canopy spectral parameters extracted from multispectral images and their calculation formulas.
2.3.3. Canopy Texture Parameters (TEX)
Texture features (TEX) represent the gray scale relationship between different pixel points in an image and their surroundings [47]. There are various methods for extracting texture parameters, among which the gray level covariance matrix (GLCM) is the most widely used [48,49]. In this study, the spectral images of UAV multispectral five bands were subjected to second-order GLCM computation and selected mean, variance, homogeneity, contrast, dissimilarity, entropy, second-order moments, and correlation, and eight kinds of texture information parameters as feature inputs to canopy texture parameters of this study [50]. The correlation parameters were calculated using ENVI 5.6 software.
2.4. Machine Learning Algorithms
2.4.1. Partial Least Square Regression (PLSR)
PLSR is a regularly used approach for modeling spectral data [18]. It is suited for analyzing multicollinear spectrum datasets and high-dimensional data and can successfully handle the problem of the number of independent variables surpassing the number of samples. At the same time, PLSR has been proven to be a flexible multivariate statistical regression approach for modeling the biochemical components of crops using spectral data. It effectively integrates multiple linear regression, principal components, and correlation analysis to better handle the problem of multicollinearity among variables.
2.4.2. Support Vector Machine (SVM)
The SVM method is a machine learning methodology, and Support Vector Regression (SVR) is a significant application of SVM [51]. The concept is to discover an optimal hyperplane that minimizes the overall deviation of all sample points to the hyperplane and then fits all data through the optimal hyperplane [25]. In SVR, there are four typically used kernel functions: linear, polynomial, Gaussian, and sigmoid. In this work, a linear kernel function is utilized, and its model performance is controlled by the kernel parameter (gamma) and tuning parameter (C).
2.4.3. Random Forest Regression (RFR)
Random Forest is a typical representative algorithm in integrated learning utilizing Bagging as a framework [24]. It is defined by its capacity to randomly sample the samples and features in the training set, which lowers the occurrence of overfitting. RFR consists of a mixture of many decision trees, each of which is randomly sampled and provides the appropriate anticipated values in the model training process. Eventually, the regression of RFR is finished by integrating all the trees. RFR has the apparent benefit of working with big samples and high dimensional data, and the projected values of all decision trees are combined to complete the regression of RFR.
2.4.4. Artificial Neural Network (ANN)
ANN is a key achievement in the field of artificial intelligence [23]. After years of study and development, ANN-based approaches play a vital role in the disciplines of remote sensing, image recognition, information retrieval, etc. ANN regression is a nonparametric linear model that employs neural network hierarchical propagation to imitate the reception and information processing process of the human brain. Neural network regression is a gradient-based learning approach that incorporates input, hidden, and output layers and network initialization. The final weights are generated by continually updating the error values and weights. Previous research has demonstrated that ANNs are suited for regression modeling data types with high sample sizes. However, because of the network topology and sample complexity, ANNs are prone to over-learning, which decreases the generalization ability. Therefore, neurons are an essential parameter in neural network regression models. The more neurons, the more accurate the model is, but the poorer the generalization capacity.
2.5. Correlation Analysis and Model Accuracy Evaluation
2.5.1. Correlation Analysis
The correlation analysis used was the Pearson correlation coefficient, and the absolute value of the Pearson correlation coefficient was used in this paper to measure the correlation between each indicator and the peanut multidimensional phenotypic indicators [52]. The formula for the Pearson correlation coefficient is as follows:
where Xi represents the actual value of i sample of the independent variable, Yi represents the actual value of the i sample of the dependent variable (indicator), and and denote the mean values of X and Y, respectively. The relationship between the strength of correlation is specified as the absolute value of P is greater than 0.8 for very strong correlation, greater than 0.6 for strong correlation, greater than 0.4 for moderate correlation, greater than 0.2 for weak correlation and less than 0.2 for no correlation.
2.5.2. Evaluation of Model Accuracy
In this study, a total of 200 samples (four key reproductive periods) from the 2024 trial data were used to carry out the model construction, and the number of training and testing samples selected were 132 and 68 (2:1), respectively, and a total of 172 samples from the 2023 data were collected for the validation of the model application. The coefficient of determination (R2), root mean square error (RMSE), normalized root mean square error (nRMSE) and the ratio of percent deviation (RPD) were used to evaluate the model accuracy [53]. The evaluation criteria of RPD are: RPD > 3 for good model prediction accuracy, 3 > RPD > 2 for good model prediction accuracy, 2 > RPD > 1.5 for fair model prediction accuracy, and RPD < 1.5 for poor model prediction accuracy [54].
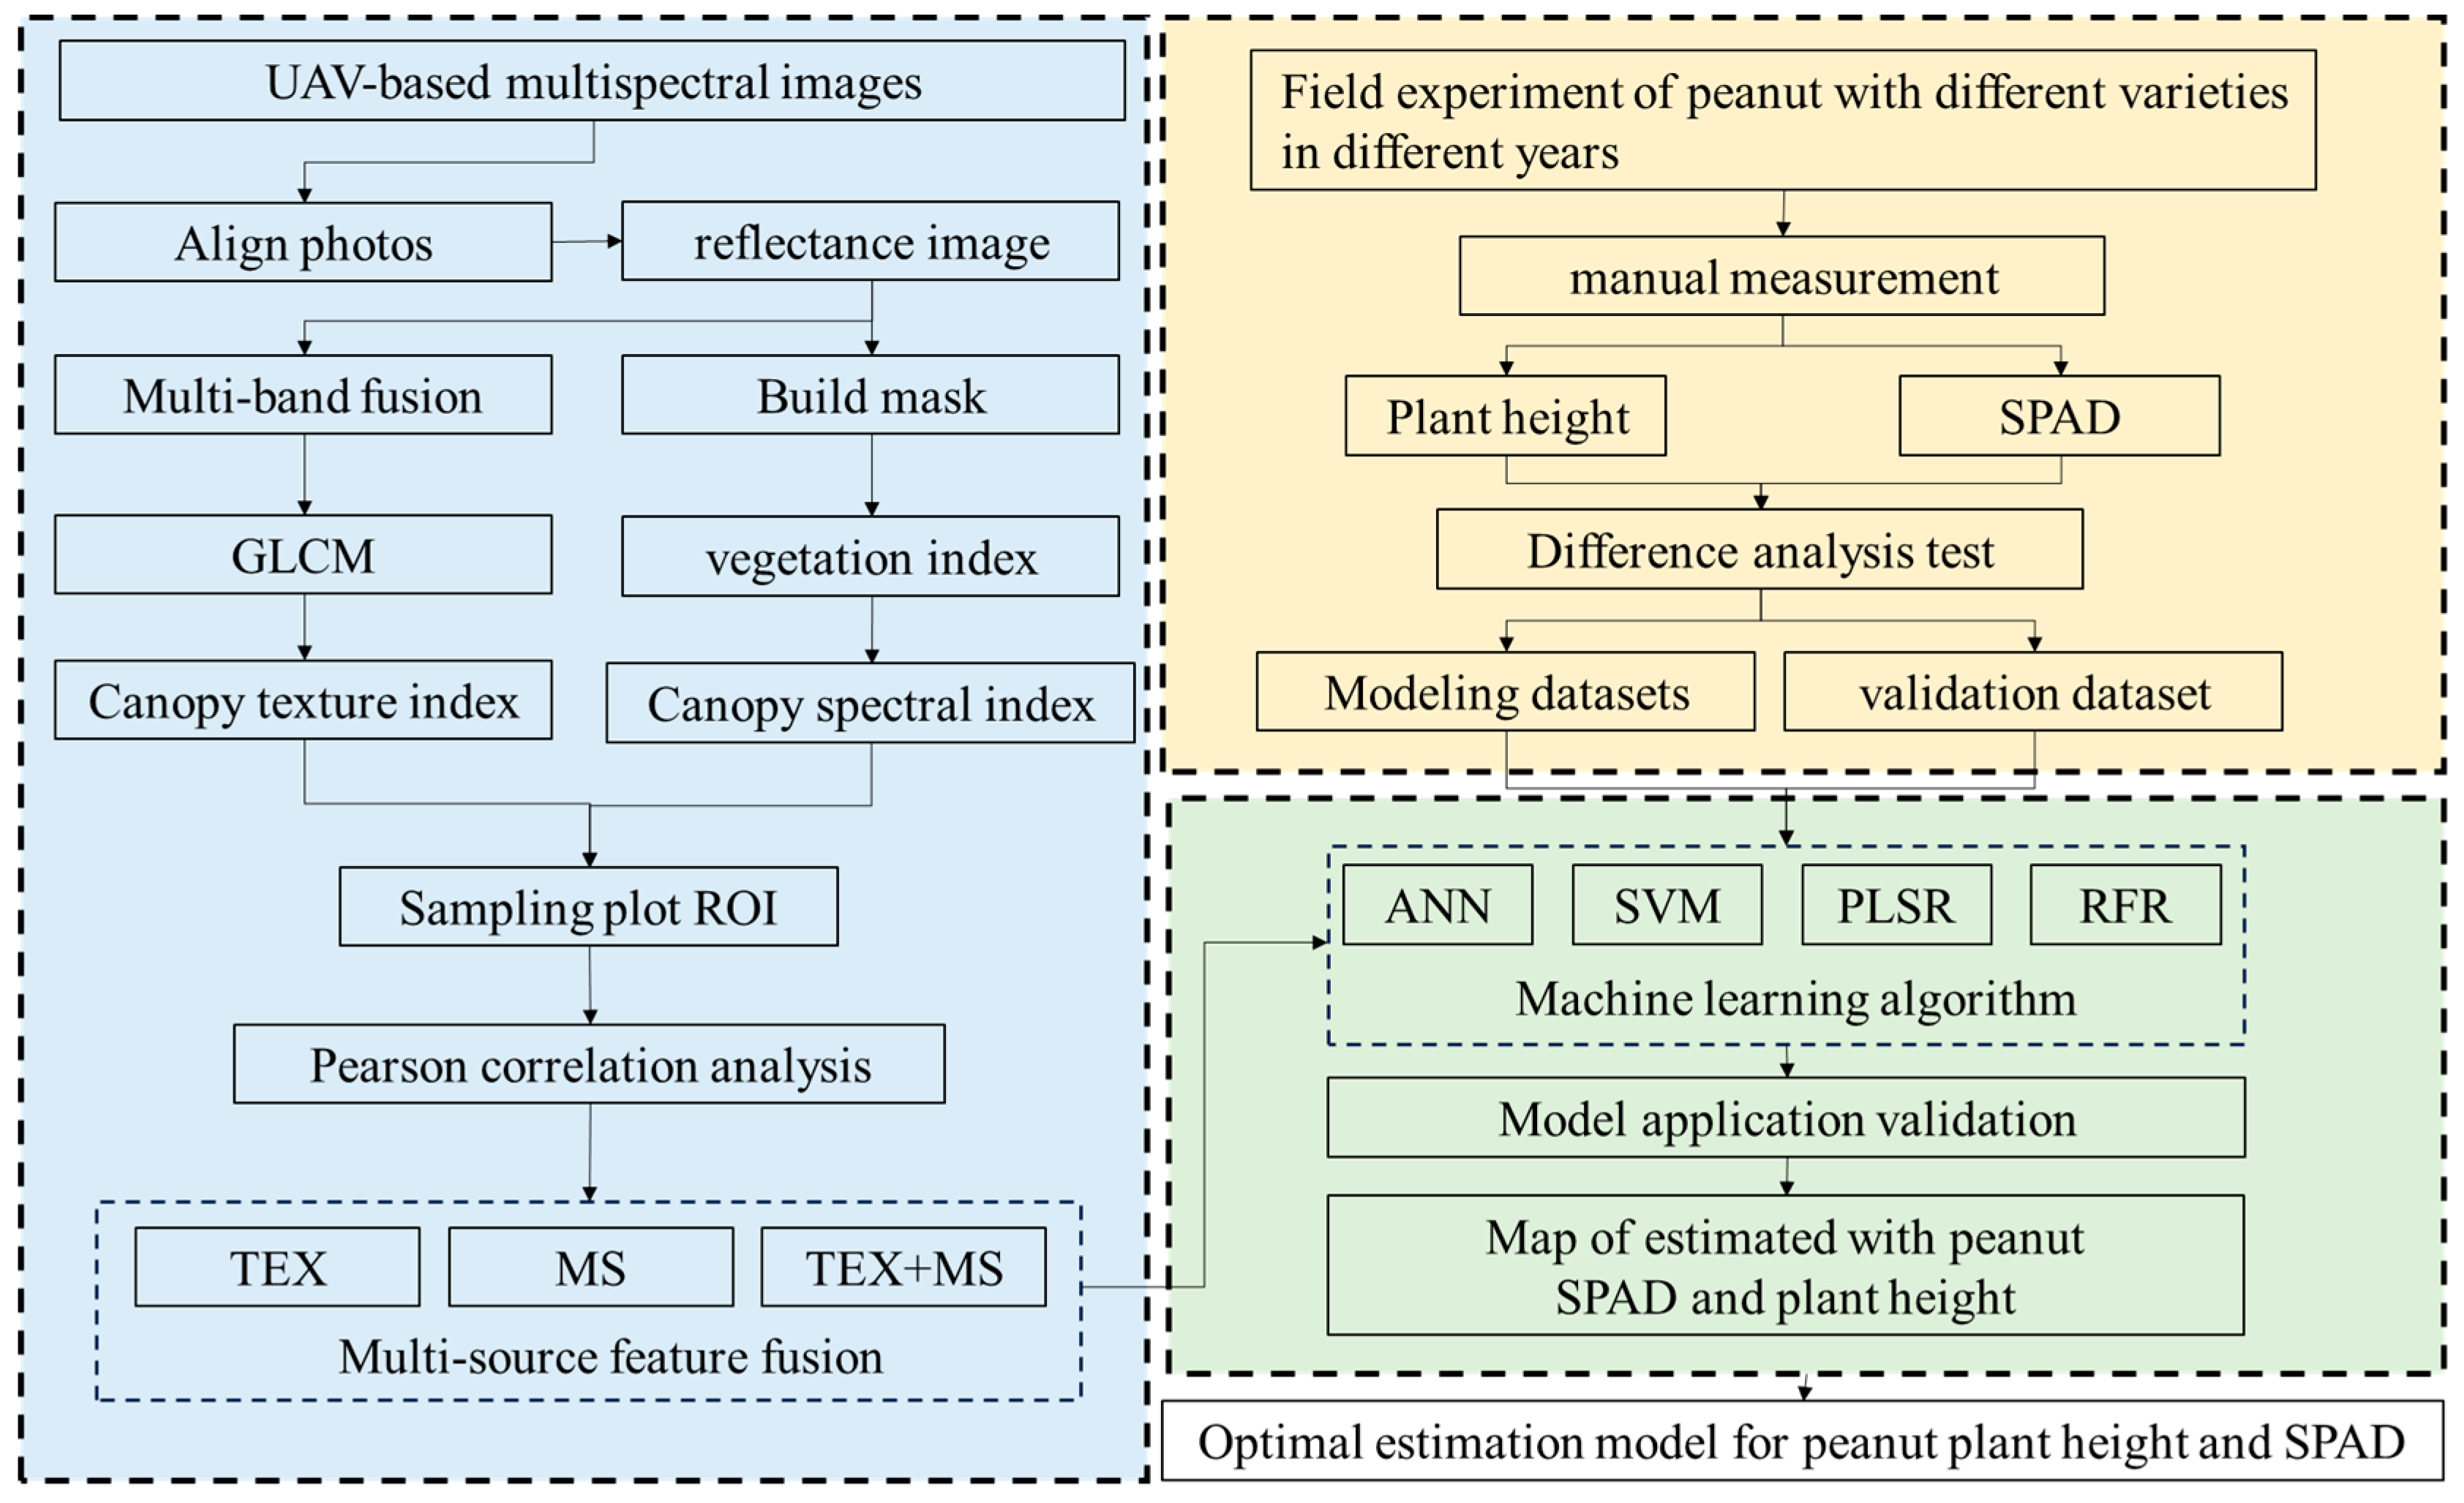
The experiment’s technical flow chart is displayed in Figure 3. By extracting various feature sources from UAV multispectral images and combining single and multiple feature sources, this experiment compares and analyzes the prediction effect in various models. The best model is then identified, and its applicability is confirmed with various plots in various years to further ascertain the model’s generalization.
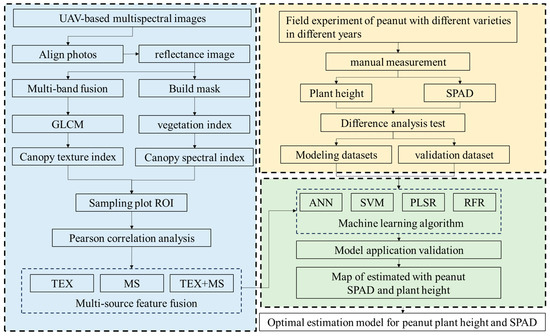
Figure 3.
Flow chart of the test.
3. Results
3.1. Correlation Analysis of Peanut Phenotypic Indicators with Different Characteristic Parameters
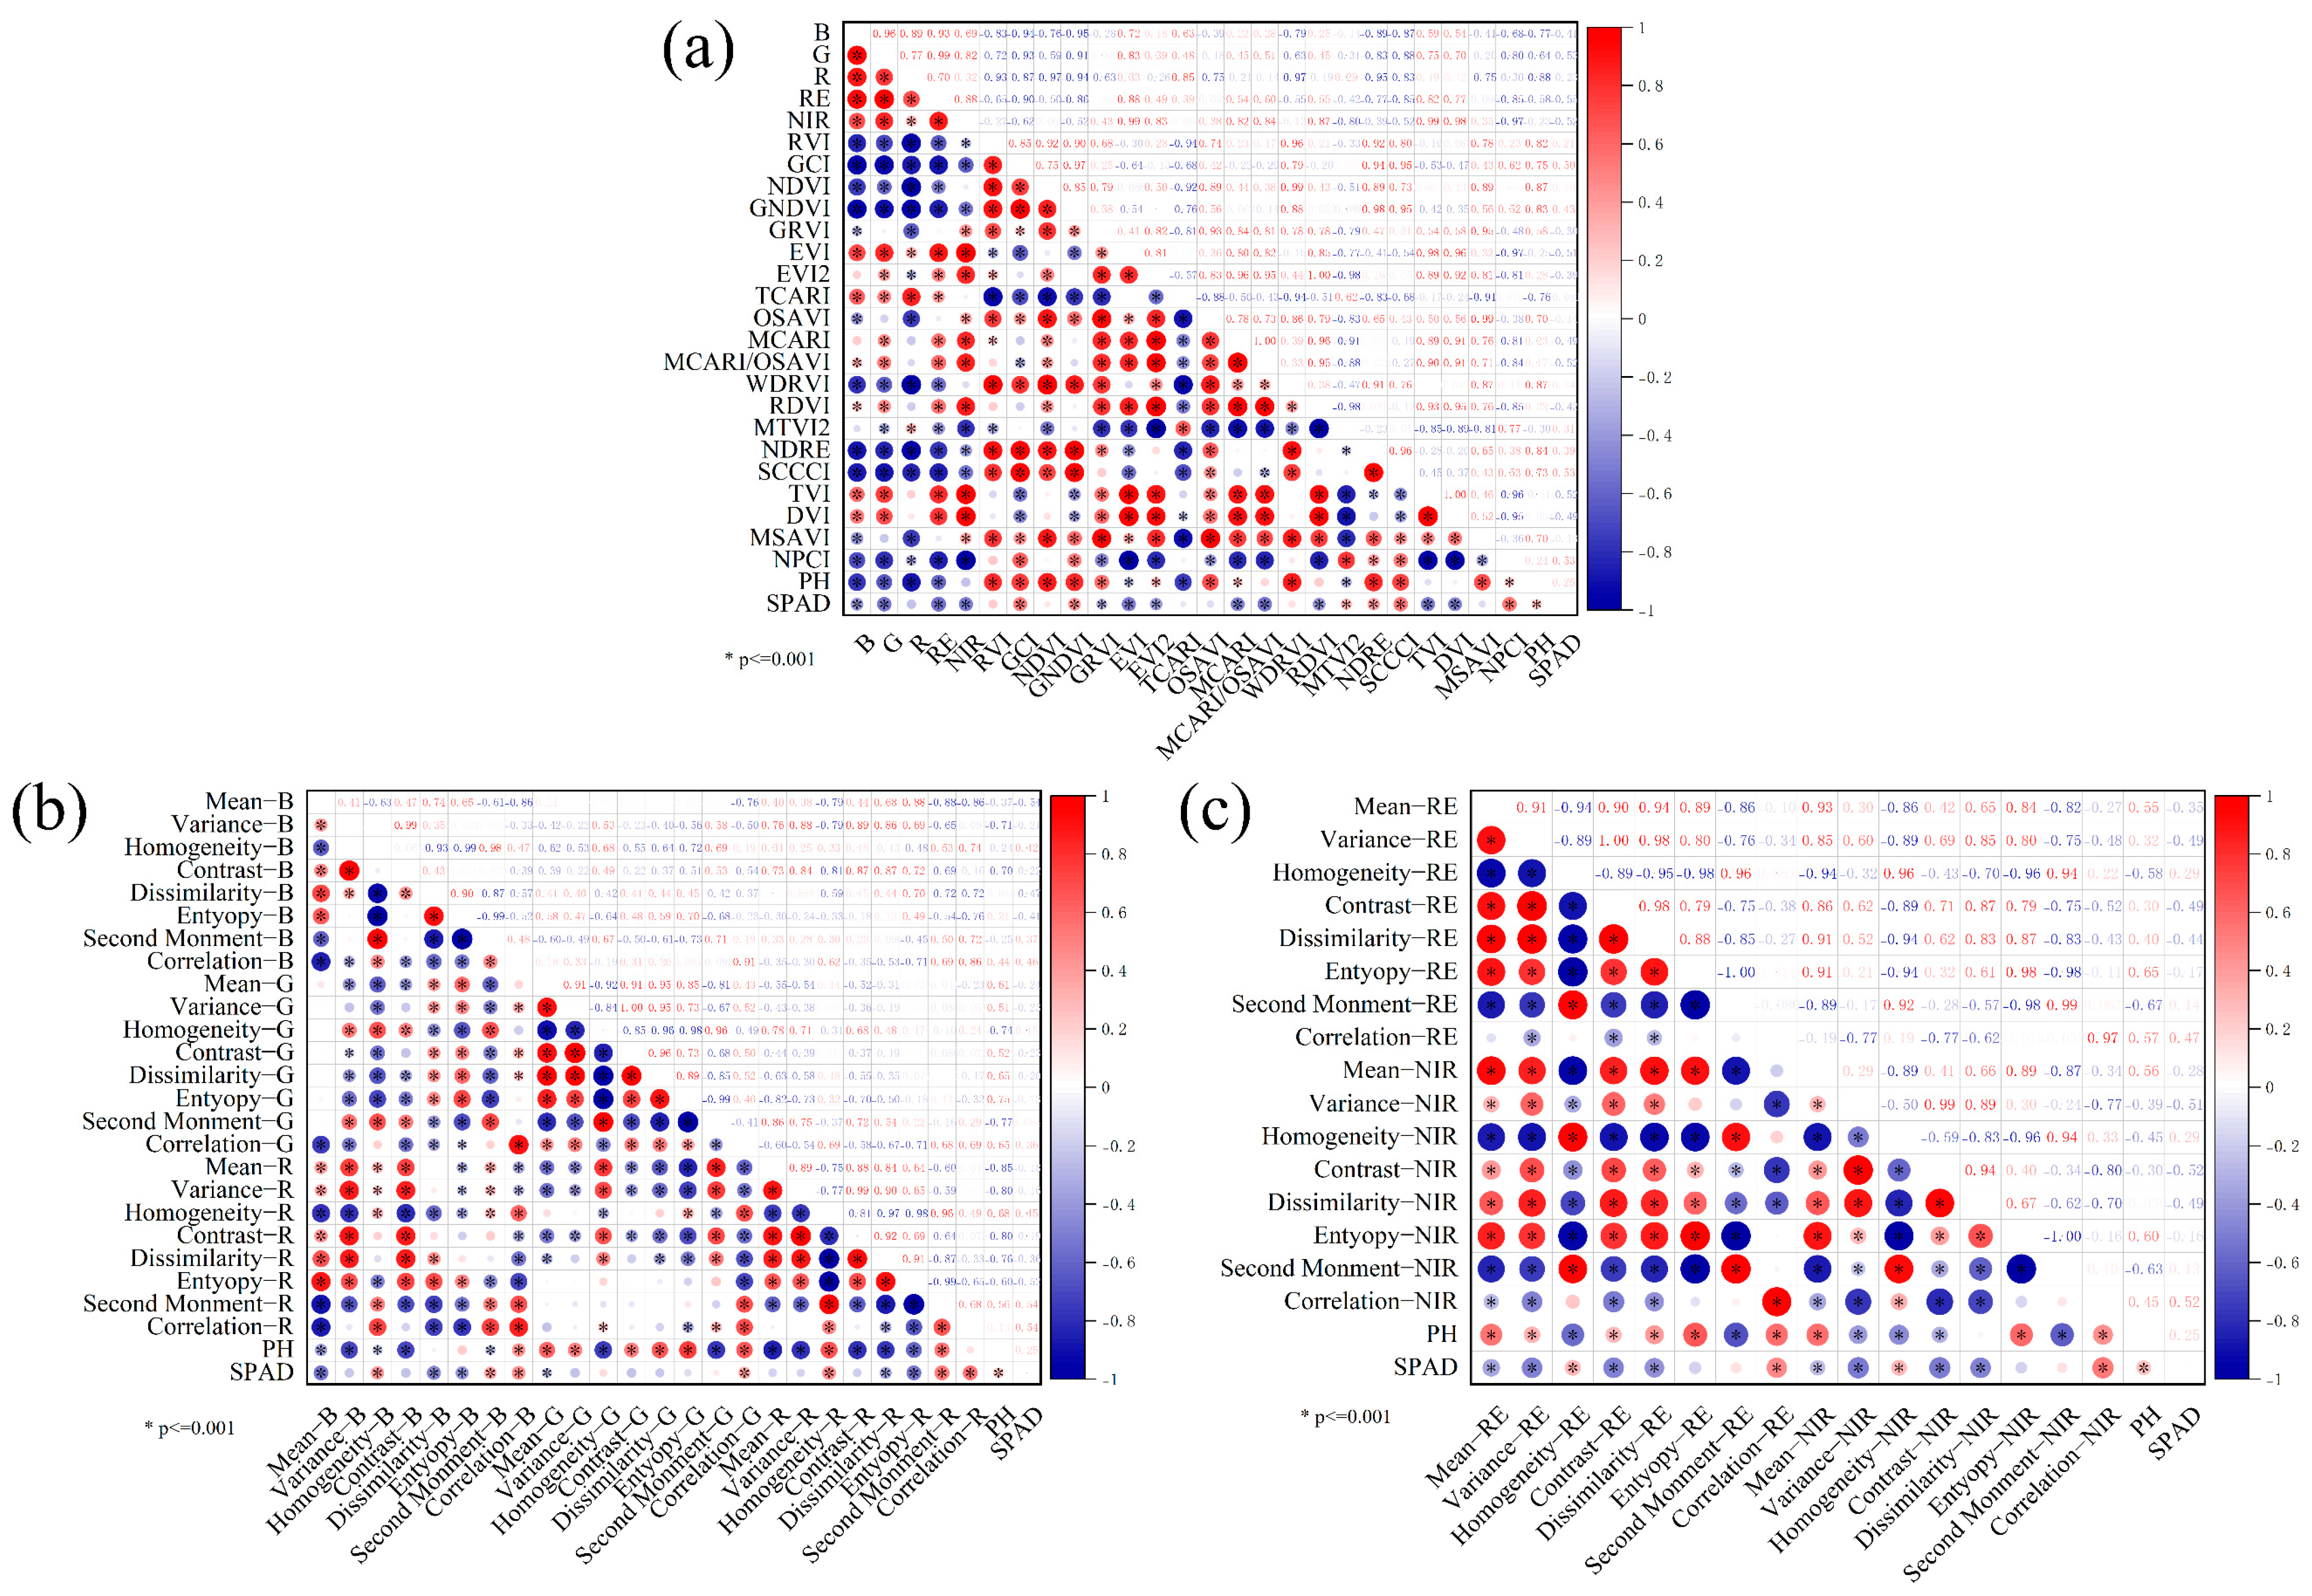
Pearson correlation analysis revealed distinct relationships between spectral parameters and phenotypic traits (Figure 4a). Canopy spectral characteristics demonstrated stronger associations with plant height than with SPAD values, with both traits exhibiting negative correlations across five single spectral bands (p < 0.05). Notably, vegetation indices showed significant correlations with 16 parameters for plant height and 14 for SPAD. The red band and derived indices (RVI, NDVI, GNDVI, WDRVI, NDRE) displayed particularly strong correlations with plant height (r > 0.7), while SPAD values showed moderate correlations (0.4 < r < 0.6) with four spectral bands (G, RE, NIR, R) and multiple indices including GCI, EVI, and MCARI.
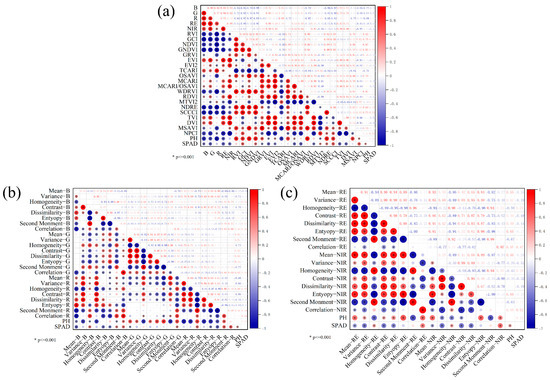
Figure 4.
Demonstrates correlation analyses between peanut phenotypic parameters (plant height and SPAD values) and remote sensing-derived features. Panels (a–c), respectively, present (a) spectral feature correlations, (b) visible-band textural feature associations, and (c) near-infrared-band texture characteristic relationships.
TEX analysis in visible bands demonstrated differential associations (Figure 4b,c): Red band TEX parameters (homogeneity, dissimilarity, entropy, second-order distance) correlated significantly with both traits, whereas blue band features primarily associated with plant height (mean, homogeneity, dissimilarity). In spectral edge regions, red-edge band TEX parameters showed highly significant correlations (p < 0.01) with plant height, while near-infrared features correlated with seven of eight TEX parameters. SPAD values exhibited consistent correlation patterns across both bands, showing significant associations with all TEX parameters, except entropy and second-order moments.
3.2. Evaluation of Model Estimation Performance of Peanut Phenotypic Indicators Under Different Feature Fusions
According to the results of correlation analysis, the feature values with significant correlation will be input into the machine learning model as the feature source, and four machine learning models, namely, SVM, RFR, PLSR, and ANN, will be used to evaluate and analyze the performance of the model construction of the two phenotypic indexes on the features integrating different data sources. The specific results are as follows:
3.2.1. Performance Evaluation of Model Estimation of Peanut Plant Height by Multi-Source Feature Fusion
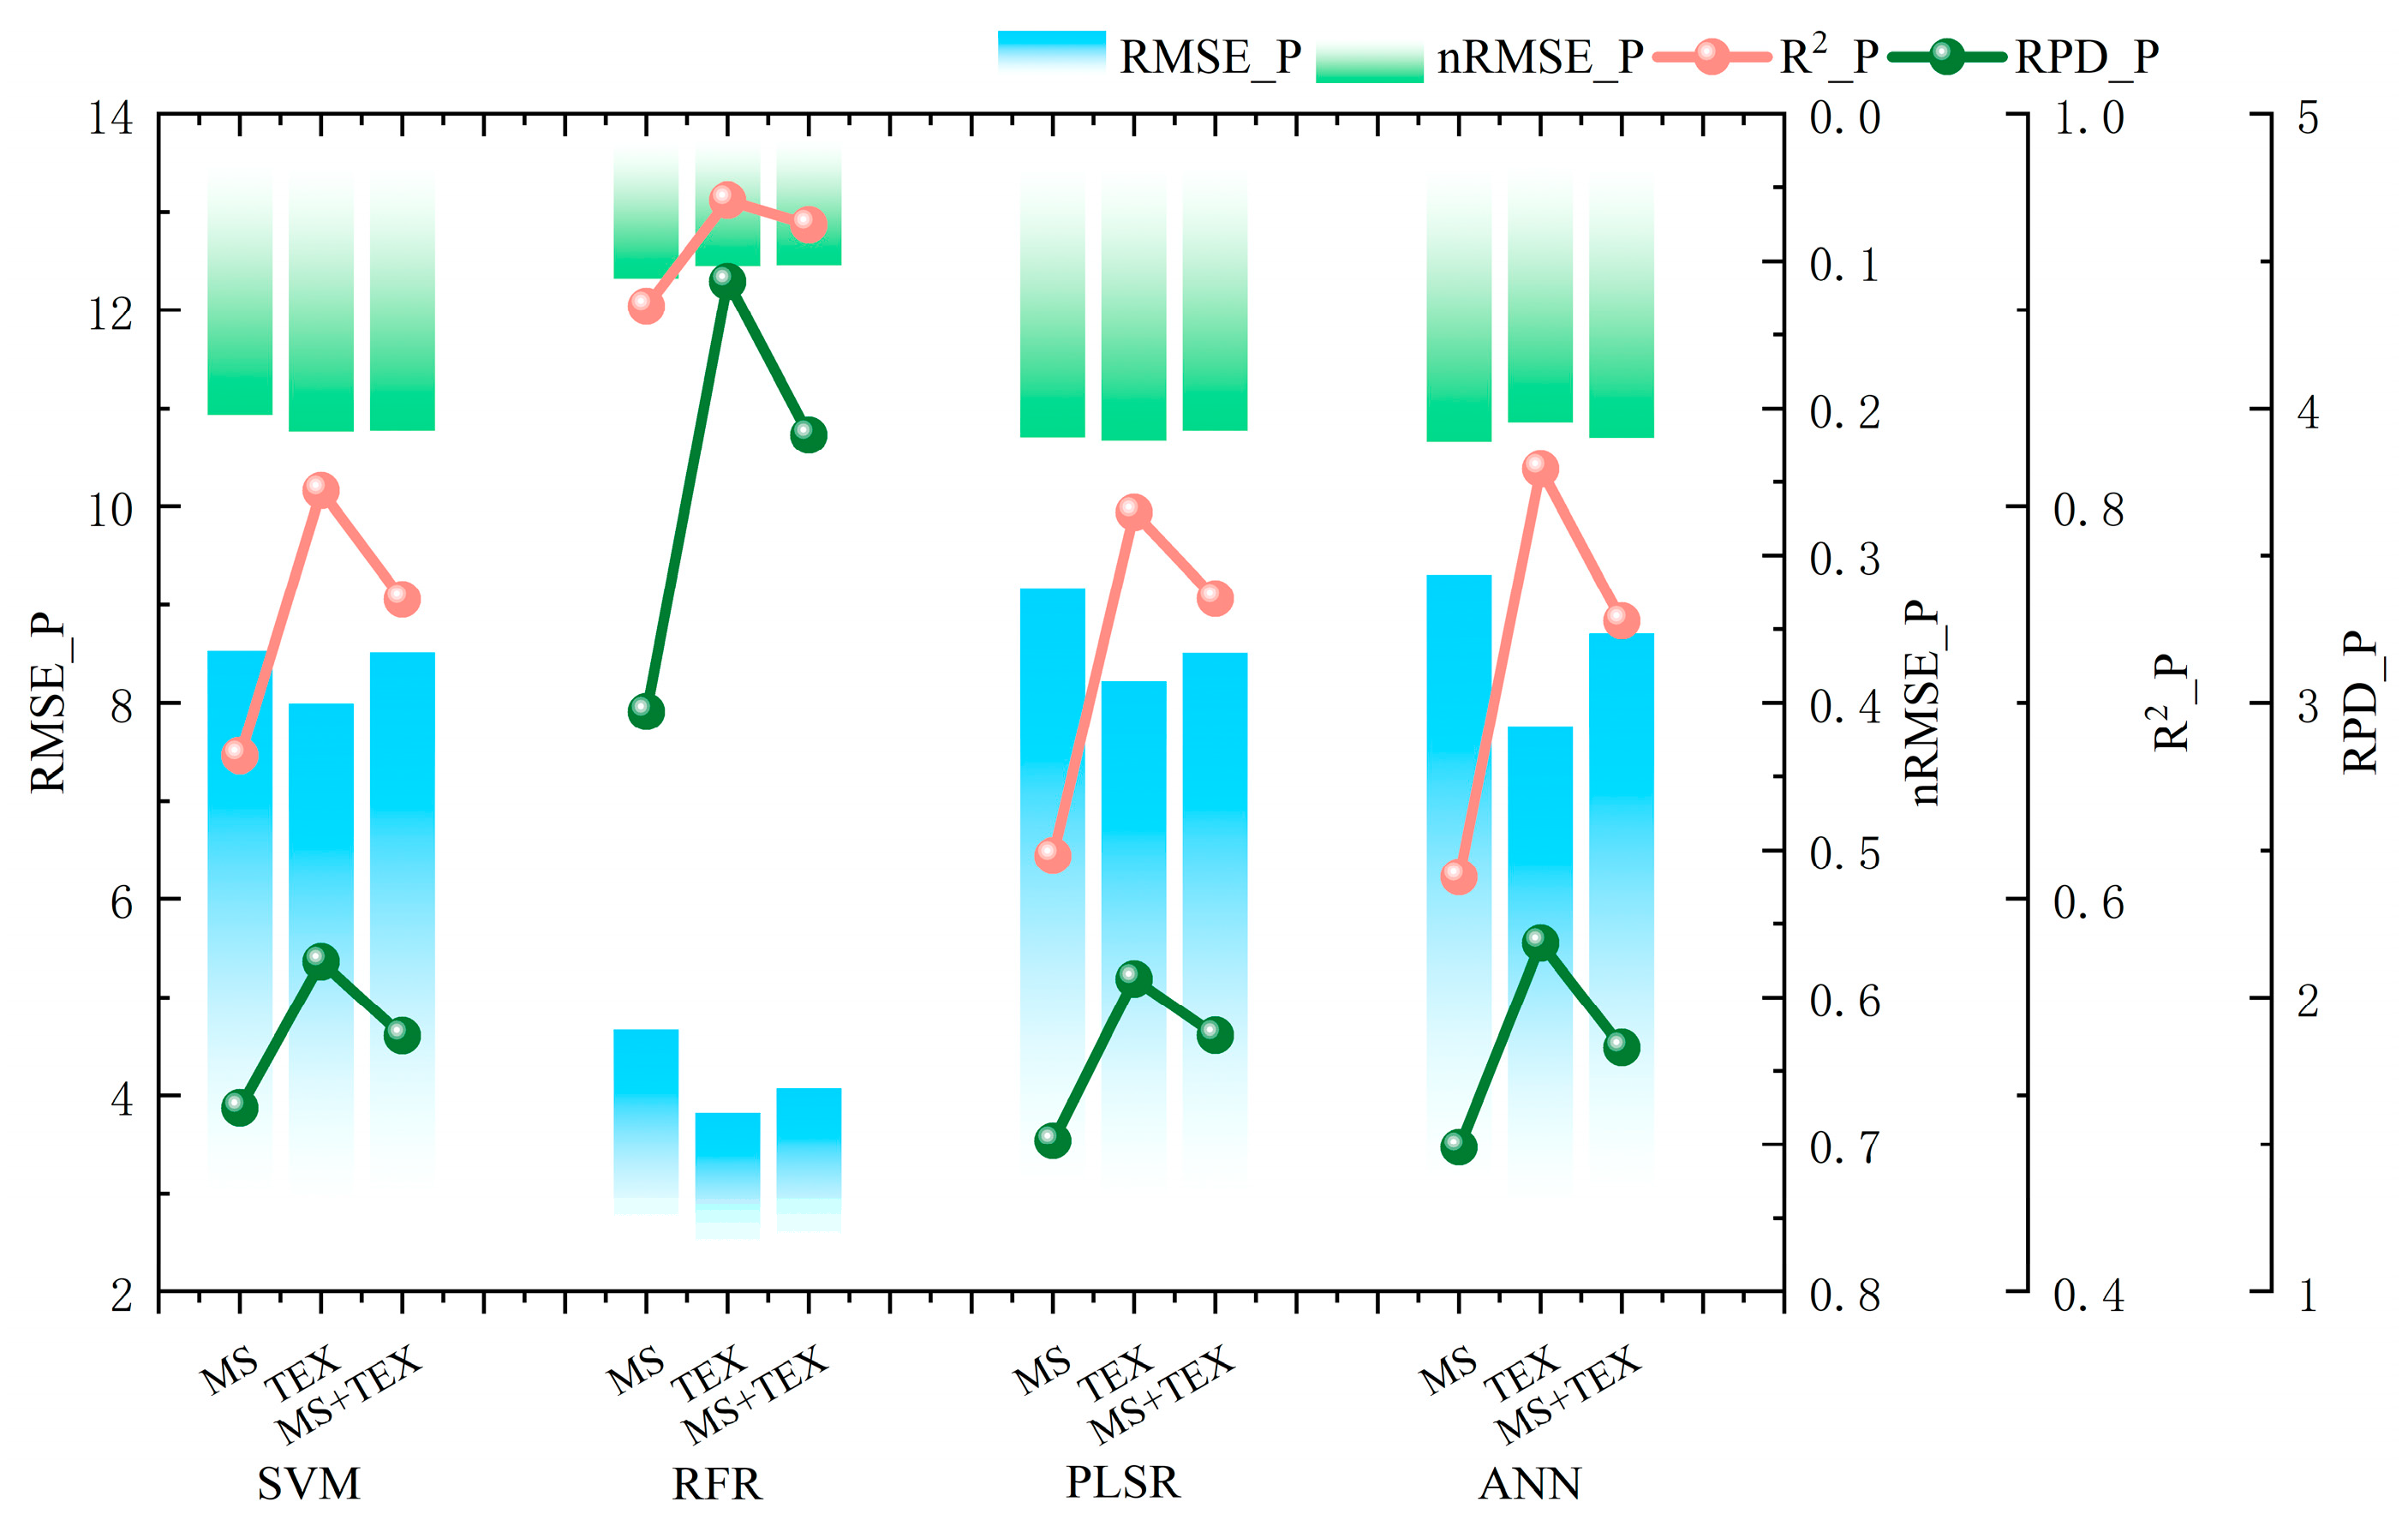
Machine learning model evaluation demonstrated significant performance variations when using TEX for plant height prediction (Figure 5). Among the four algorithms evaluated, RFR achieved superior training accuracy (R2 = 95.6%) compared to SVM (R2 = 80.8%), PLSR (R2 = 79.7%), and ANN (R2 = 81.9%). Comparative analysis revealed that RFR showed a 14.7~15.9% improvement in R2 and 2.24~2.36 enhancement in RPD relative to other models when utilizing TEX inputs. Notably, all models exhibited R2 values exceeding 79% with TEX, indicating their universal enhancement effect on prediction accuracy. This pattern suggests TEX parameters substantially improve model performance, particularly through their synergistic interaction with ensemble learning methods like RFR.

Figure 5.
Evaluation of plant height estimation performance of different models in training sets with different types and numbers of input features, where _P represents the training set.
As illustrated in Figure 6, the fused MS + TEX feature combination demonstrated optimal predictive performance across all machine learning models, achieving R2 values of 91.6%, 91.9%, 90.2%, and 92.3%, respectively. This multimodal approach consistently outperformed single-feature models in both error reduction and stability metrics. Notably, the ANN emerged as the most effective predictive model under the multi-source feature fusion framework, exhibiting 3.9% and 3.4% improvements in R2 compared to MS and TEX single-feature models, respectively. Concurrent RPD enhancements of 0.69 and 0.62 were observed in the ANN model. These findings collectively demonstrate that multi-source data fusion significantly enhances the predictive capacity of plant height models through synergistic feature integration.
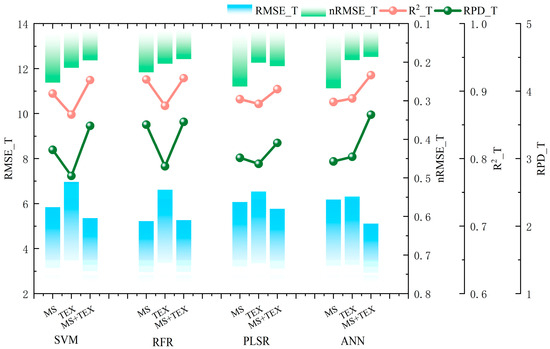
Figure 6.
Evaluation of plant height estimation performance of different models in the test set with different types and numbers of input features, where _T denotes the test set.
3.2.2. Evaluation of Model Estimation Performance of Peanut SPAD by Multi-Source Feature Fusion
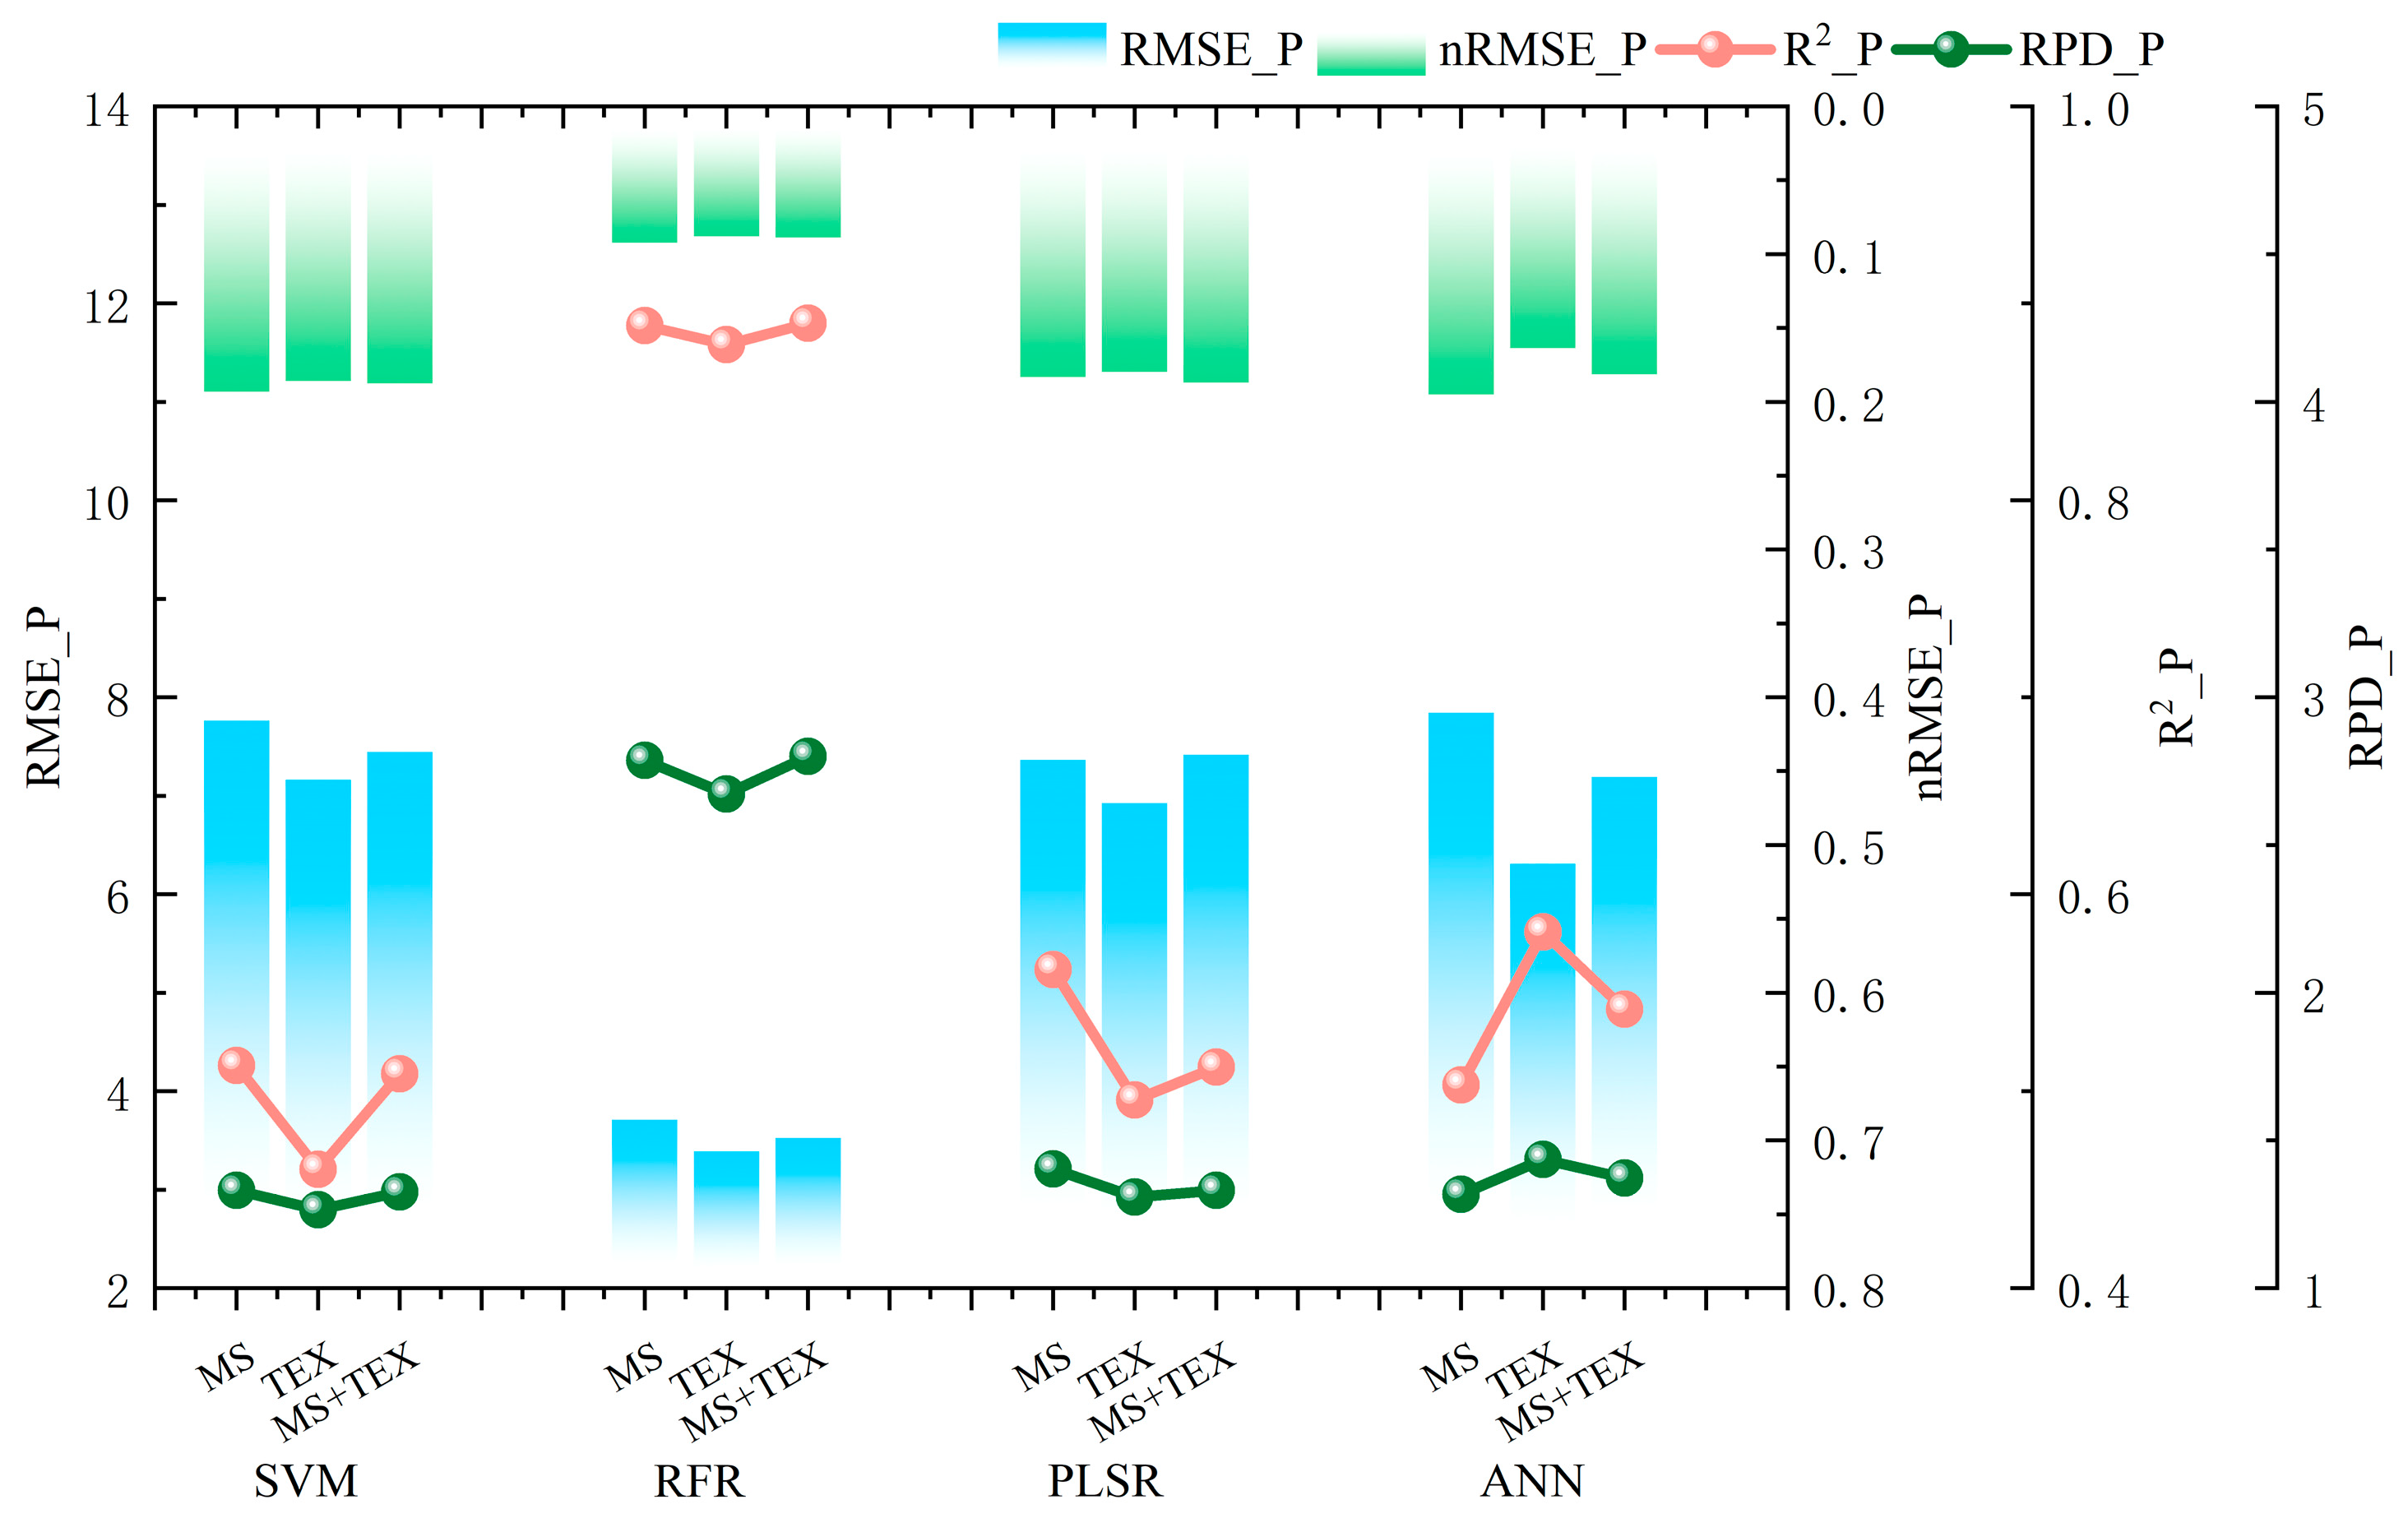
The comparative analysis of machine learning models for SPAD value inversion, as illustrated in Figure 7, revealed significant performance variations among the evaluated algorithms. RFR demonstrated superior predictive capabilities compared to SVM, PLSR, and ANN models. Notably, using multi-source data fusion, the RFR model obtained an RPD of 2.80 and a training accuracy of 88.9%. In contrast, the comparative models exhibited substantial reductions in R2 (SVM: 38.1%, PLSR: 37.7%, ANN: 34.8%) and RPD (SVM: 1.47, PLSR: 1.46, ANN: 1.42). Of particular note was the consistent performance advantage maintained by RFR across different feature source configurations. These findings suggest that the RFR architecture possesses inherent advantages in processing heterogeneous agricultural datasets for chlorophyll content estimation, particularly through its ensemble learning mechanism that effectively mitigates overfitting while maintaining model robustness.
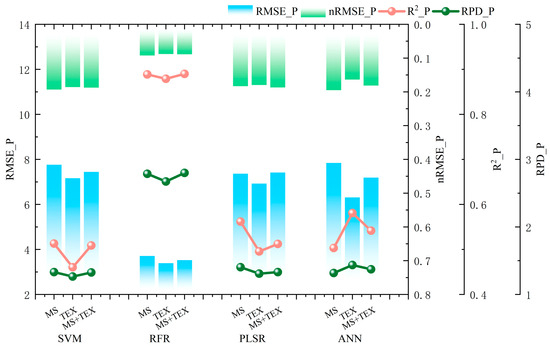
Figure 7.
Evaluation of the performance of different models in estimating SPAD values for the training set with different types and numbers of input features, where _P represents the training set.
As demonstrated in Figure 8, the multimodal MS + TEX approach achieved superior prediction performance compared to single-source feature inputs across all evaluated models. The random forest regression (RFR) model exhibited the highest predictive accuracy with this fusion strategy, attaining an R2 of 48.4% (RMSE = 6.30, nRMSE = 0.160, RPD = 1.40). Notably, the MS + TEX integration in RFR showed 8.1% and 15.1% improvements in predictive accuracy relative to MS and TEX single-feature models, respectively, accompanied by RPD enhancements of 0.09 and 0.16. These results substantiate that multi-source data fusion effectively enhances SPAD value prediction through the simultaneous improvement of model accuracy, error reduction, and stability optimization.
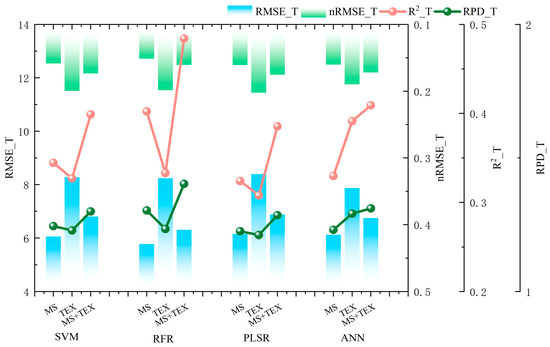
Figure 8.
Evaluation of SPAD estimation performance of different models for different input feature types and numbers in the test set, where _T denotes the test set.
3.3. Optimal Prediction Model for Peanut Phenotypic Indicators Under Multi-Source Data Fusion
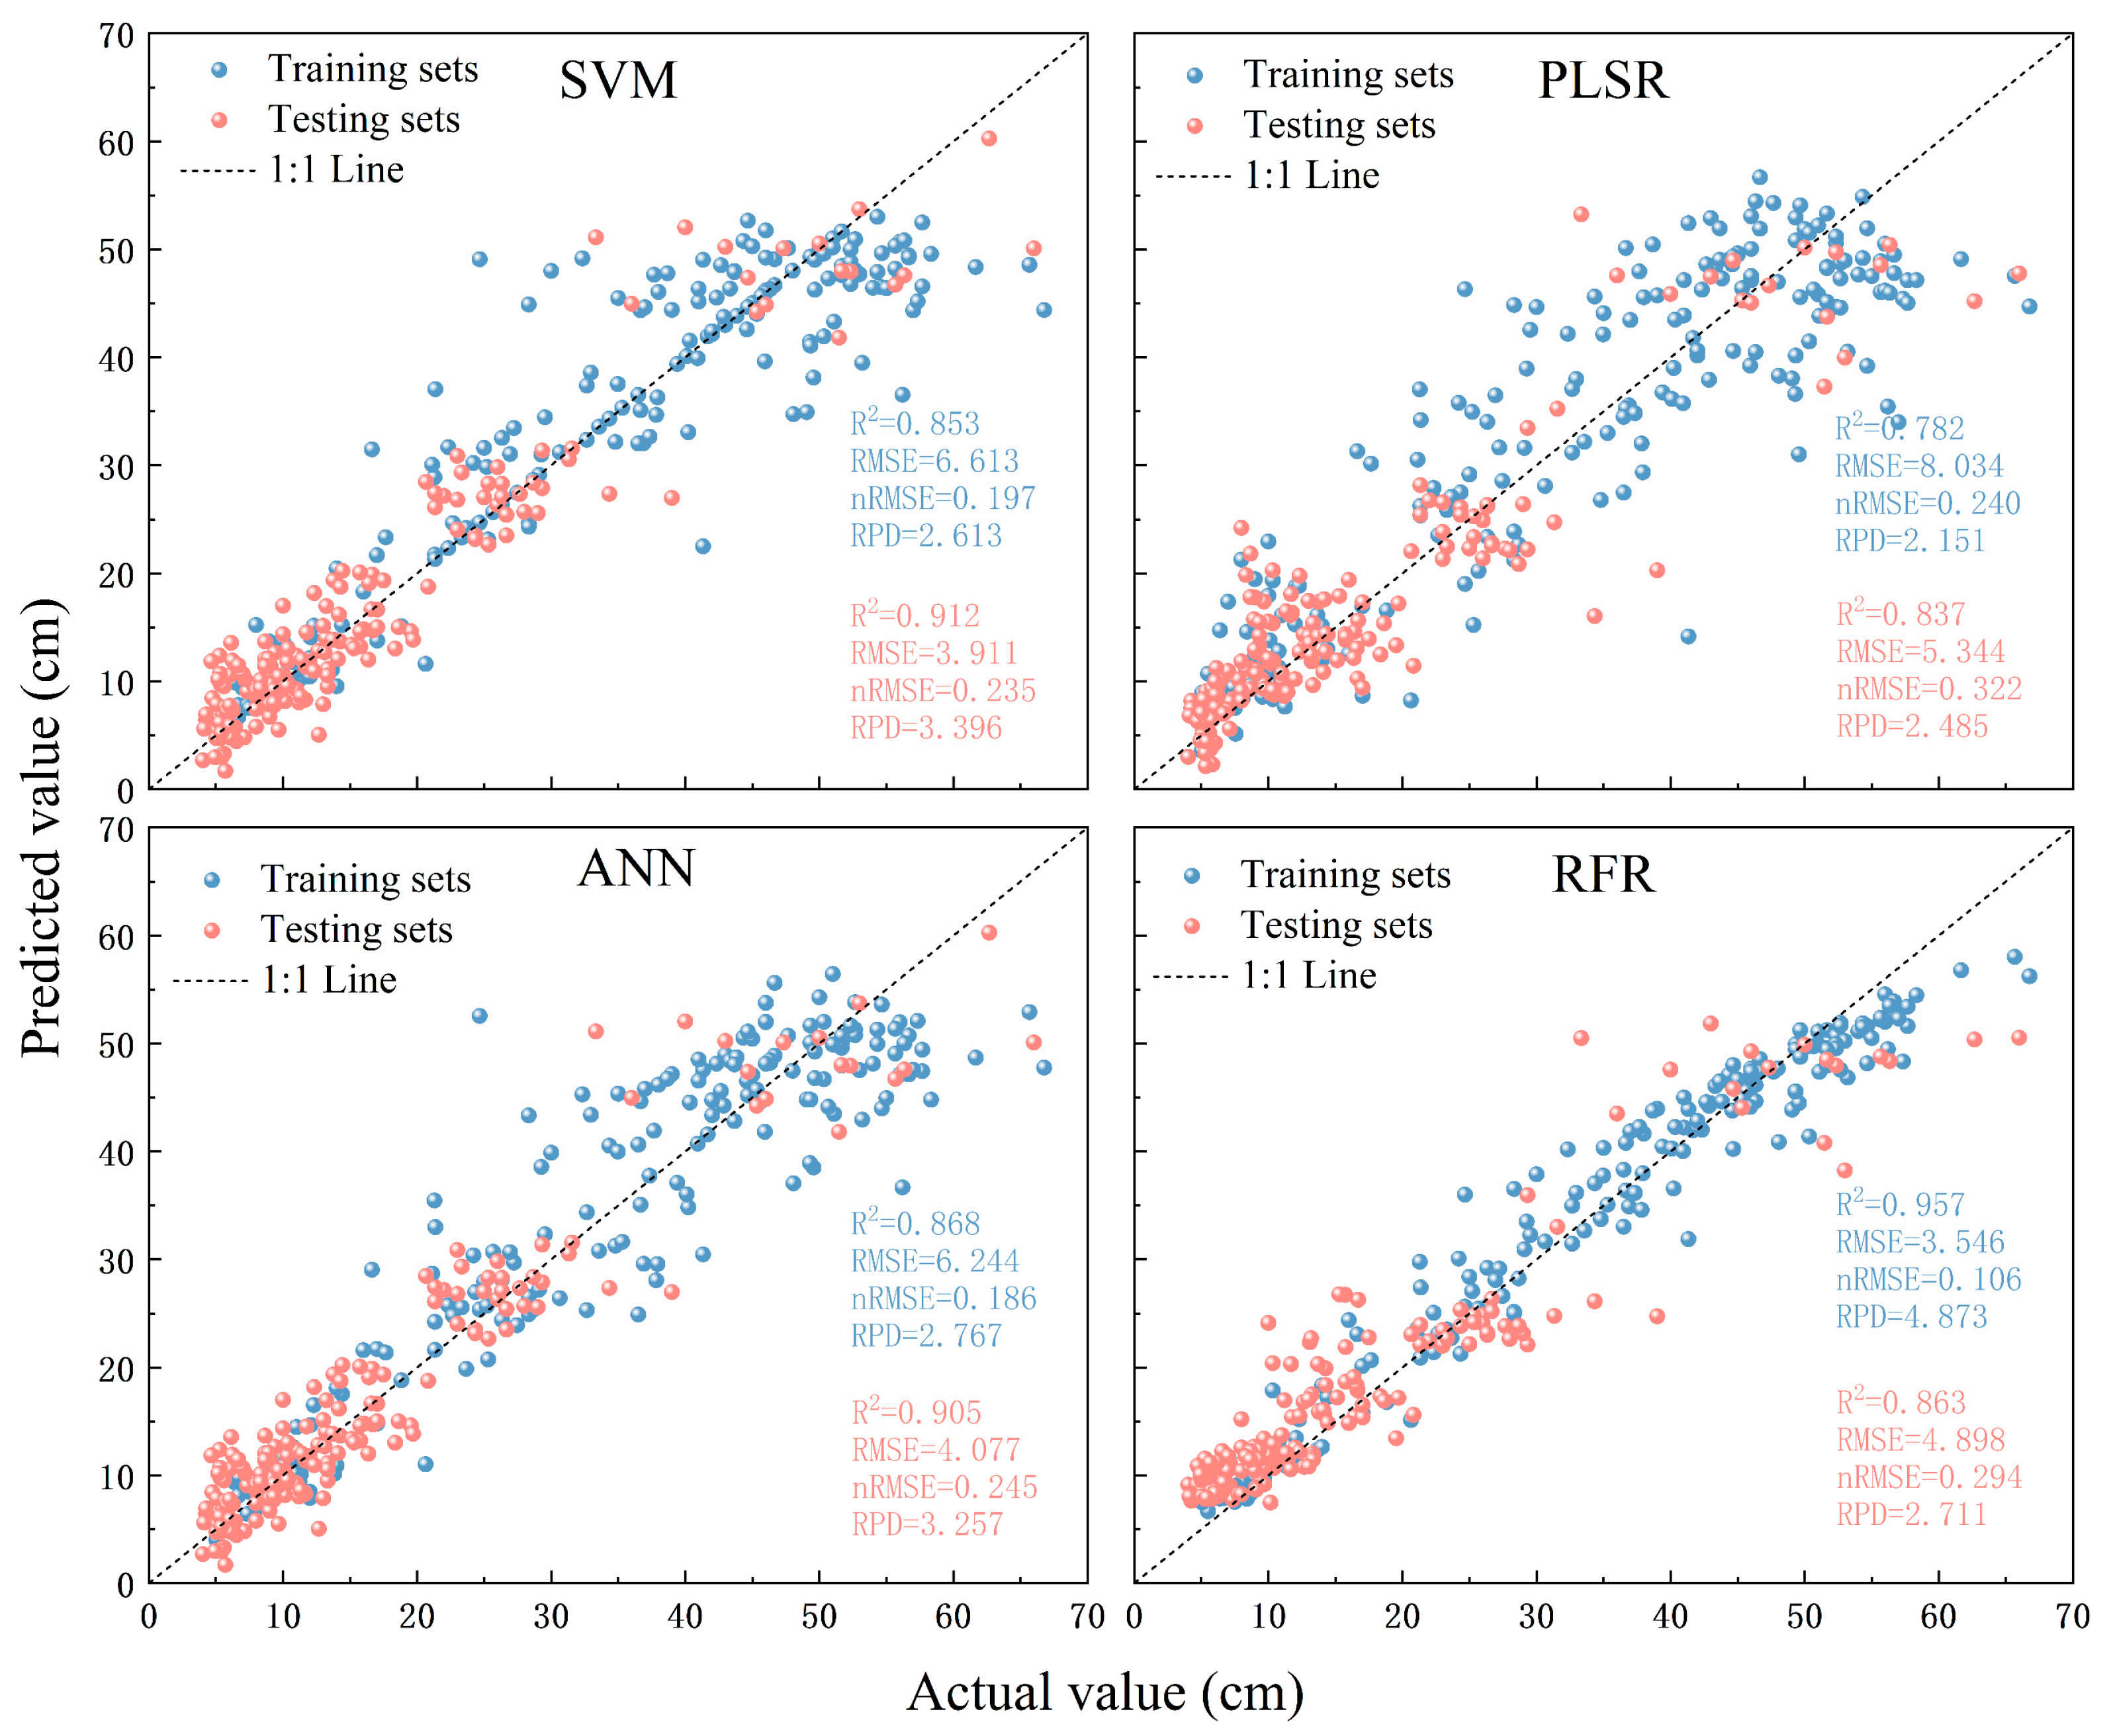
The phenotypic prediction model constructed based on the 2024 experimental data showed higher prediction accuracy and model stability of multi-source feature fusion than single feature source and also lower model prediction error, so this experiment used the 2023 experimental data to validate the generalization of the model, and plotted 1:1 cross-validation scatter plots based on the true and predicted values (Figure 9 and Figure 10), with the following results:
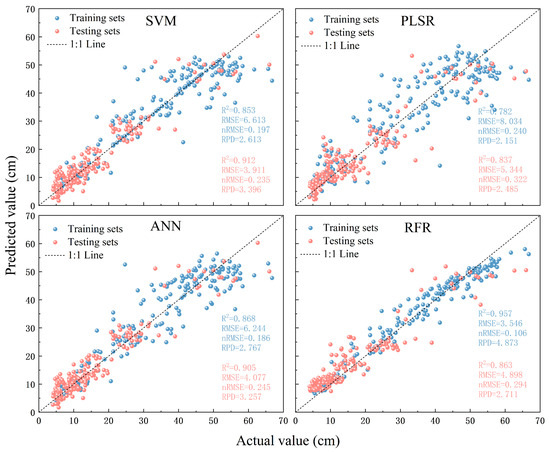
Figure 9.
Cross-validated scatterplot of measured and predicted peanut plant height. The black dashed line indicates a 1:1 relationship, where the eigenvalue inputs to the modeling algorithms are all MS + TEX.
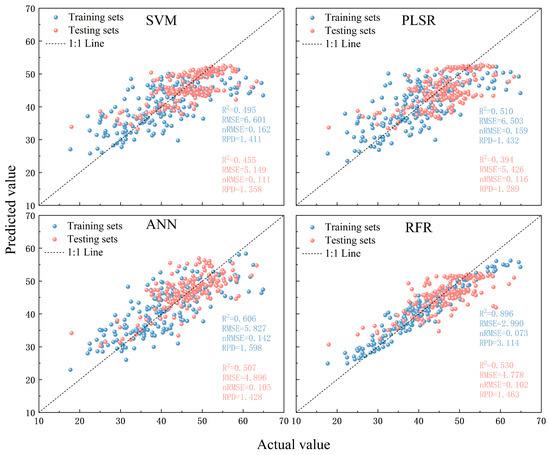
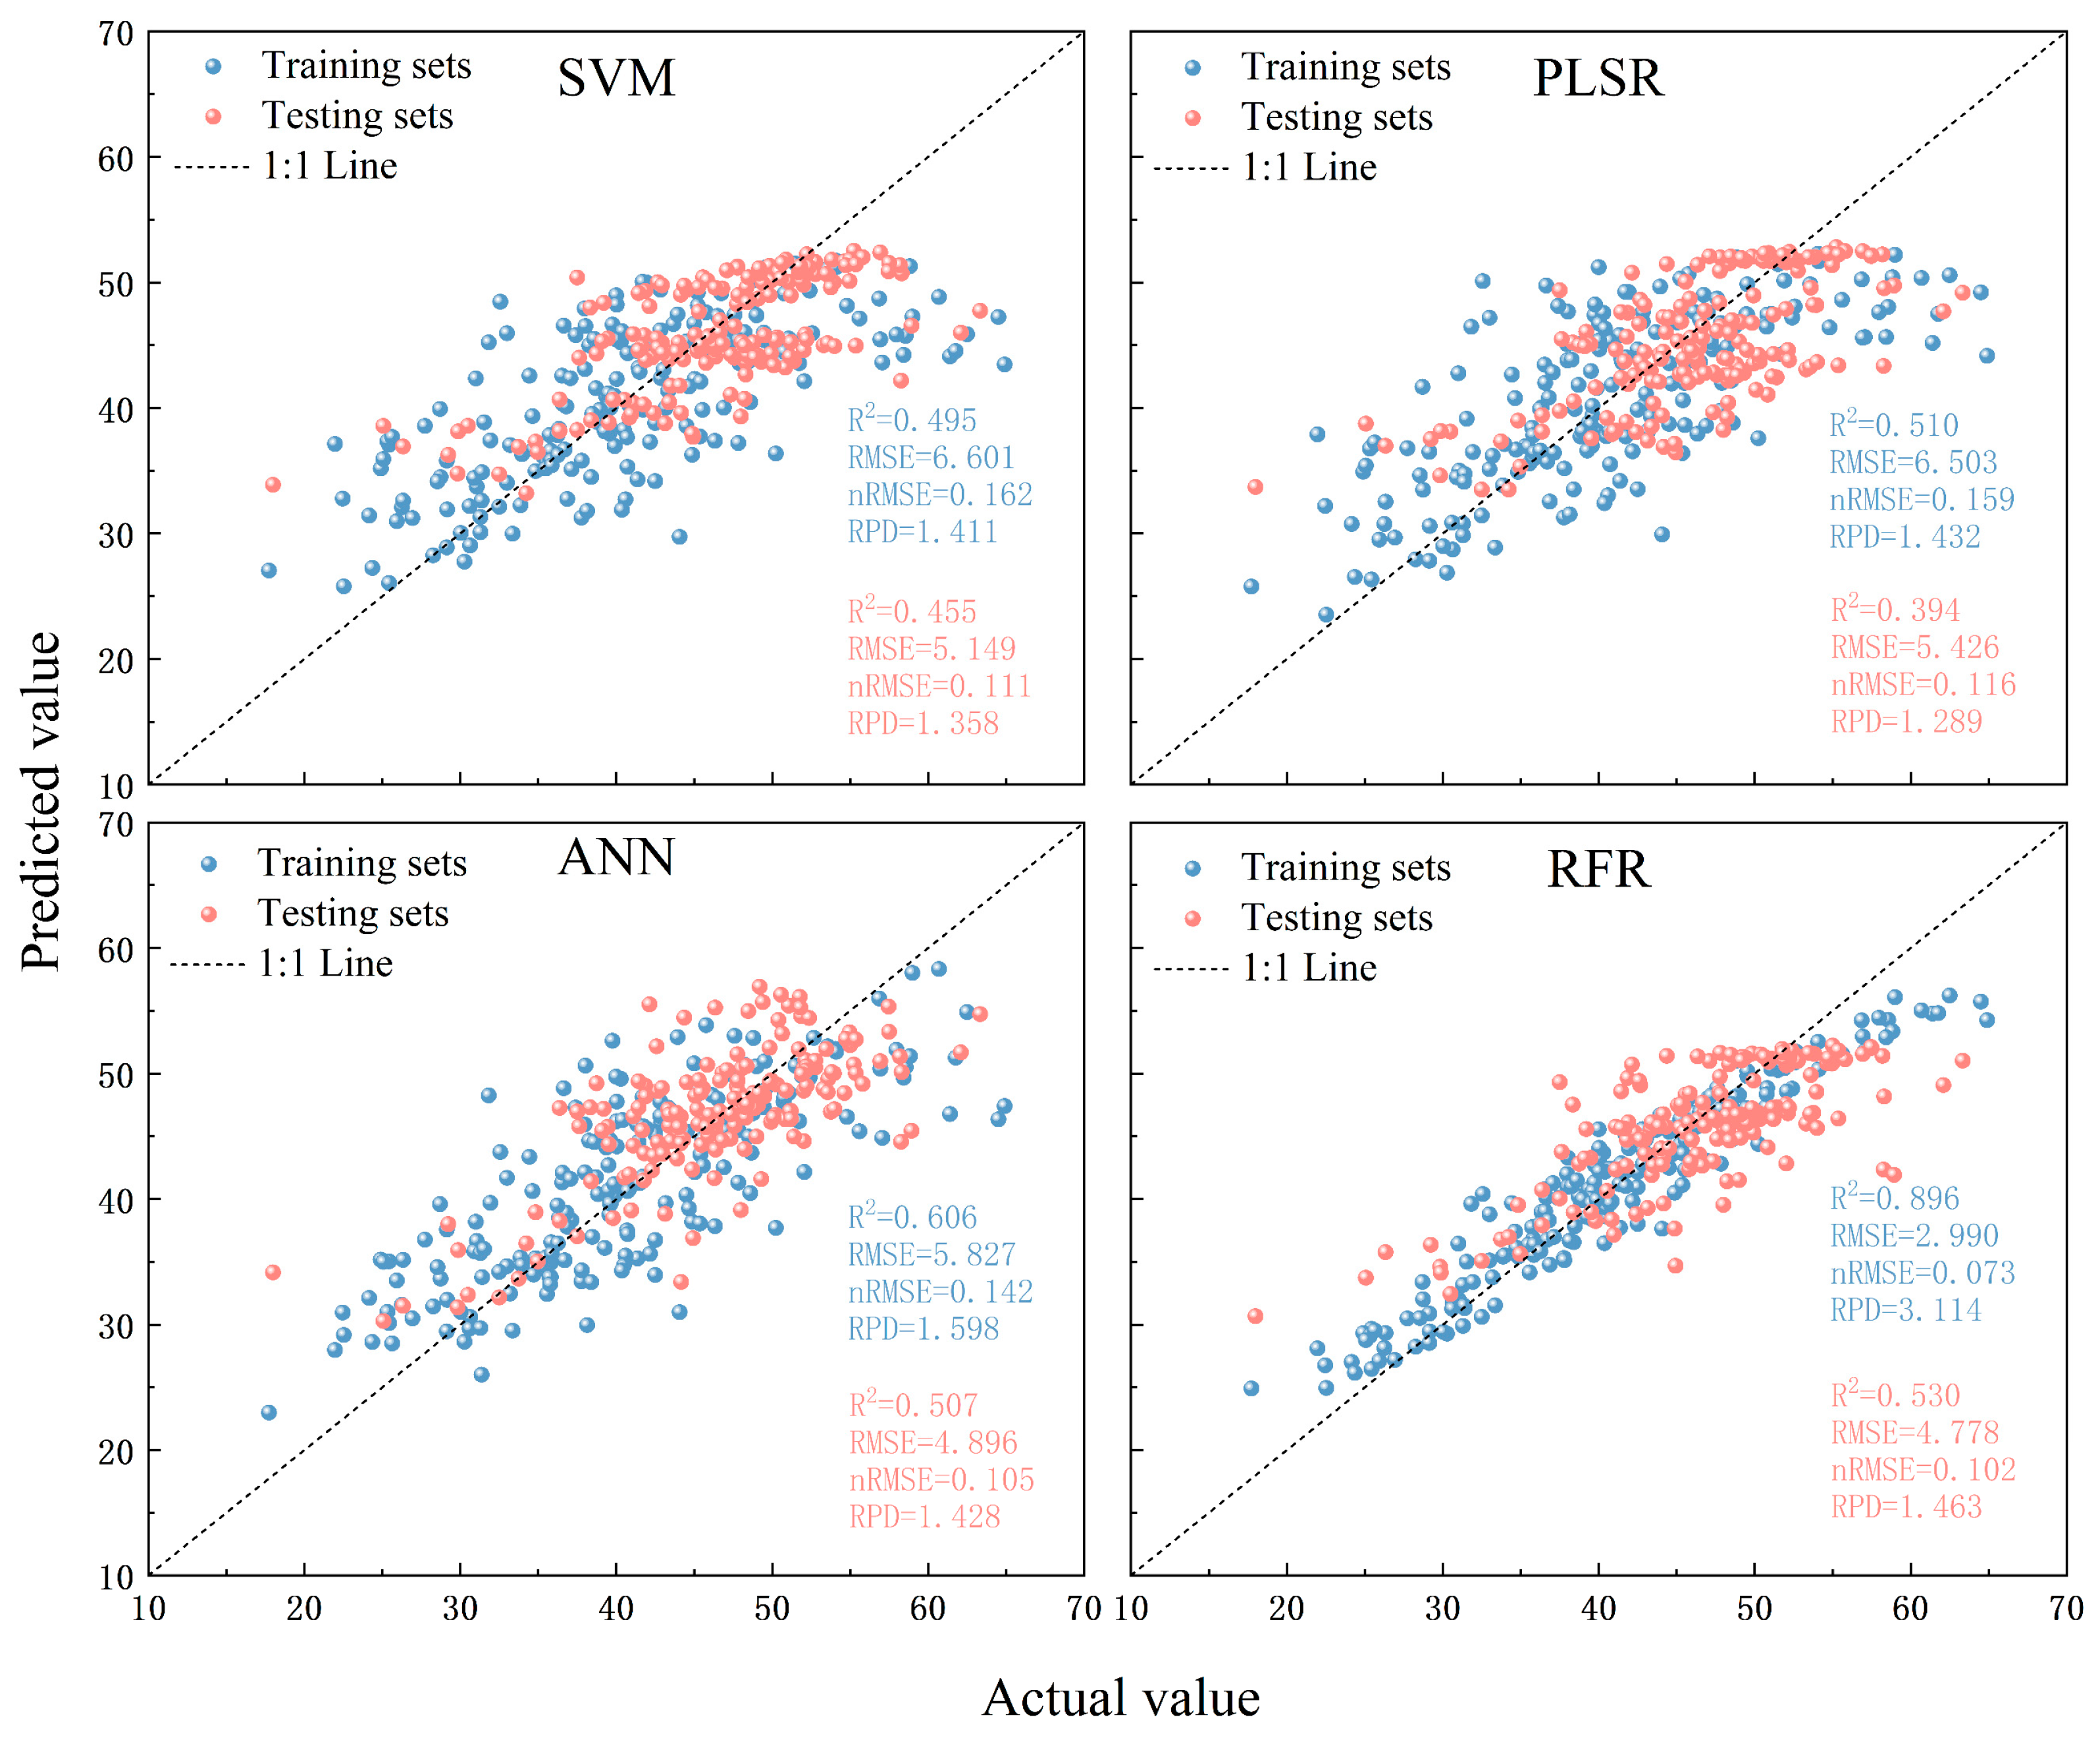
Figure 10.
Cross-validated scatterplot of measured and predicted peanut SPAD values. The black dashed line indicates a 1:1 relationship, where the eigenvalue inputs to the model algorithms are all MS + TEX.
3.3.1. Optimal Prediction Model of Multi-Source Feature Fusion to Peanut Plant Height
The 1:1 parity analysis between measured and predicted plant height values (Figure 9) revealed distinct model performance characteristics. Support vector machine (SVM) demonstrated superior prediction accuracy for peanut plant height (R2 = 91.2%, RMSE = 3.91 cm, nRMSE = 0.235, RPD = 3.39), with particularly strong convergence (<5% deviation) for plants under 30 cm in height. However, predictive dispersion increased progressively for taller plants (>30 cm). In contrast, random forest regression (RFR) exhibited robust convergence across the full phenological spectrum yet showed reduced generalizability when applied to inter-annual, multi-plot datasets. This comparative analysis indicates RFR’s susceptibility to overfitting in multi-source fusion scenarios (evidenced by 23.4% higher variance in 15–20 cm and >30 cm cohorts), whereas SVM’s inherent regularization mechanisms conferred stronger cross-dataset applicability despite marginally lower training accuracy.
3.3.2. Optimal Prediction Model of Multi-Source Feature Fusion for Peanut SPAD
The 1:1 parity plot analysis of SPAD measured versus predicted values (Figure 10) revealed distinct model performance characteristics. Random forest regression (RFR) demonstrated optimal predictive accuracy for peanut SPAD values (R2 = 53.0%, RMSE = 4.77 SPAD units, nRMSE = 0.102, RPD = 1.46), with particularly strong convergence in the 40–55 SPAD range. Comparative analysis showed RFR maintained robust performance across phenological stages and achieved superior generalizability in multi-year, cross-plot validation (inter-annual RMSE variance < 8.2%). However, all tested models (SVM, PLSR, and RFR) systematically underestimated upper SPAD values (>55), with ANN exhibiting 12.7% better predictive capacity at higher physiological ranges (>60 SPAD) compared to RFR. This pattern suggests that, while RFR’s feature selection robustness enhances multi-source fusion modeling, its inherent bootstrap aggregation mechanism may induce conservative prediction tendencies at physiological extremes.
4. Discussion
Crop phenotyping is one of the key topics in agricultural research, and with the continuous progress of high-throughput data collection technologies such as unmanned aerial vehicles (UAVs), it has become possible to obtain phenotypic data quickly and efficiently. As an important grain and oil crop in China, the growth and development of peanuts has an important impact on grain and oil yields. Currently, there are few reports on the acquisition and study of high-throughput phenotypes of peanuts, and most of them focus on the analysis of a single phenotypic index. In this study, we explored the inversion effect of data fusion of different feature sources by analyzing the effect of two phenotypic indicators under different machine learning methods.
4.1. Multi-Source Data Fusion Enhances Phenotype Prediction Accuracy
By comparing the effects of different data source coupling on peanut plant height and SPAD estimation, this study found that multi-source data coupling as a feature source input model has significantly improved the prediction effect compared with that of a single feature source, which is consistent with previous studies [55]. Peanut plant height prediction model construction (Figure 5 and Figure 6) demonstrates that TEX has a facilitating effect on peanut plant height training. The fusion of spectral features after the four machine learning models’ prediction performance has improved, with ANN being the optimal prediction model in the construction of the plant height model. Its use of MS + TEX, rather than the MS and TEX of the R2, increased by 3.9% and 3.4%, respectively, which suggests that the use of a variety of coupled feature sources has significant relevance to the peanut plant height and SPAD estimation effect. The prediction accuracy of SPAD is also in line with this law, but its prediction accuracy is relatively low, and the R2 of the optimal prediction model (RFR) is only 53.0%, which is mainly because the correlation with the UAV’s blue-green-red-edge near-infrared bands is only moderately correlated, whereas the relevant vegetation index and TEX index are obtained from the original band images. This leads to a certain imbalance in the weight ratio of feature sources during model training, thus affecting the prediction accuracy of the model.
4.2. Model Generalization Capacity Determines Practical Applicability
The best predictors of peanut plant height and SPAD in the model construction are ANN and RFR under TEX + MS, respectively, but in the generalized validation results using peanuts from different plots in different years, the best predictors are SVM and RFR under TEX + MS, respectively, in which it is found that there is a certain degree of overestimation of ANN in the process of predicting plant height, and there is a certain degree of over-fitting problems in the prediction of plant height by RFR. There is a certain overfitting problem, which leads to different model prediction effects in the process of model application, showing poor adaptability. In contrast, although the performance of SVM in peanut plant height model construction is average, in general, it has a strong model adaptability and generalization ability, which is mainly manifested in the peanut plant of 10–20 cm having better prediction accuracy. The 24-year modeling framework demonstrates that integrating multi-source data, particularly texture features, significantly improves prediction accuracy, consistent with established remote sensing methodologies [55]. Among texture parameters, correlation exhibits the strongest contribution to SPAD value estimation, while plant height prediction primarily relies on variance in visible bands and entropy in infrared bands. Comparative analysis of machine learning architectures reveals that ensemble models outperform linear approaches by 34.5% in inversion accuracy (R2 = 0.530 vs. 0.394), with RFR achieving superior training efficiency (mean RMSE reduction: 13.5% vs. PLSR). These findings align with Zou et al. [56], whose RFR implementation enhanced model generalization across diverse crop phenotypes.
In summary, this experiment comprehensively considered the model prediction accuracy, stability, prediction error, adaptability, and generalization and found that the optimal model for peanut plant height prediction using MS + TEX as the input of feature source is SVM. It is worth noting that, although both ANN and RFR have better prediction accuracy stability, they perform poorly in the model application, though RFR achieves a good prediction effect in predicting peanut SPAD.
5. Conclusions
In this experiment, four machine learning algorithms based on random forests and other machine learning algorithms were combined with multi-source data to create estimation models for peanut plant height and SPAD. The models’ generalizability for use was also examined, and the findings demonstrated that, independent of modeling techniques, the estimation effect of combining multiple sources of data on plant height and SPAD was superior to that of a single feature variable. When MS was combined with TEX as a feature source input, peanut plant height was best predicted by SVM (R2 = 91.2%, RMSE = 3.91, nRMSE = 0.235, RPD = 3.39). ANN also produced decent predictions (R2 = 92.3%); however, there was some overfitting and overestimation. With MS + TEX input RFR, peanut SPAD was best predicted (R2 = 53.0%, RMSE = 4.77, nRMSE = 0.102, RPD =1.46). MS + TEX increased the R2 over MS and TEX by 3.9% vs. 3.4% and 8.1% vs. 15.1%, respectively, in the peanut plant height and SPAD optimum prediction models. This paper offers a novel, efficient method for estimating the peanut phenotypic index that can be used in both large-scale and low-cost trials.
Author Contributions
Conceptualization, X.G.; data curation, N.H., B.C., X.L. and B.B.; funding acquisition, X.G. and G.L.; methodology, N.H. and B.C.; software, N.H., B.C., X.L. and J.F.; supervision, X.G., G.L. and Y.Z.; visualization, N.H. and B.C.; writing—original draft, N.H., B.C. and X.G.; writing—review and editing, N.H., B.C., X.L. and X.G. All authors have read and agreed to the published version of the manuscript.
Funding
This research was funded by the Key R&D Program of Shandong Province (No. 2021LZGC026) and the Project of Collaborative Innovation Centre for Crop Phenomics, Beijing Academy of Agriculture and Forestry Sciences (No. KJCX20240406).
Data Availability Statement
The data will be made available upon request.
Conflicts of Interest
The authors declare no conflicts of interest.
References
- Zhang, J.; Geng, Y.; Guo, F.; Li, X.; Wan, S. Research Progress on the Mechanism of Improving Peanut Yield by Single-Seed Precision Sowing. J. Integr. Agric. 2020, 19, 1919–1927. [Google Scholar] [CrossRef]
- Li, H.; Zhao, C.; Huang, W.; Yang, G. Non-Uniform Vertical Nitrogen Distribution within Plant Canopy and Its Estimation by Remote Sensing: A Review. Field Crops Res. 2013, 142, 75–84. [Google Scholar] [CrossRef]
- Qi, H.; Wu, Z.; Zhang, L.; Li, J.; Zhou, J.; Jun, Z.; Zhu, B. Monitoring of Peanut Leaves Chlorophyll Content Based on Drone-Based Multispectral Image Feature Extraction. Comput. Electron. Agric. 2021, 187, 106292. [Google Scholar] [CrossRef]
- Fan, Z.; Deng, M.; Lin, Y.; Liu, P.; Wang, X.; Yang, S.; Ren, X.; Chen, X.; Liu, T. Effects of the Border on Yield and Water Use in Wheat/Maize Intercropping in Rain-Fed Areas with Different Nitrogen Levels. Field Crops Res. 2023, 302, 109105. [Google Scholar] [CrossRef]
- Monteiro, S.T.; Minekawa, Y.; Kosugi, Y.; Akazawa, T.; Oda, K. Prediction of Sweetness and Amino Acid Content in Soybean Crops from Hyperspectral Imagery. ISPRS J. Photogramm. Remote Sens. 2007, 62, 2–12. [Google Scholar] [CrossRef]
- Zhai, W.; Li, C.; Fei, S.; Liu, Y.; Ding, F.; Cheng, Q.; Chen, Z. CatBoost Algorithm for Estimating Maize Above-Ground Biomass Using Unmanned Aerial Vehicle-Based Multi-Source Sensor Data and SPAD Values. Comput. Electron. Agric. 2023, 214, 108306. [Google Scholar] [CrossRef]
- Shu, M.; Li, Q.; Ghafoor, A.; Zhu, J.; Li, B.; Ma, Y. Using the Plant Height and Canopy Coverage to Estimation Maize Aboveground Biomass with UAV Digital Images. Eur. J. Agron. 2023, 151, 126957. [Google Scholar] [CrossRef]
- Galán, R.J.; Bernal-Vasquez, A.-M.; Jebsen, C.; Piepho, H.-P.; Thorwarth, P.; Steffan, P.; Gordillo, A.; Miedaner, T. Integration of Genotypic, Hyperspectral, and Phenotypic Data to Improve Biomass Yield Prediction in Hybrid Rye. Theor. Appl. Genet. 2020, 133, 3001–3015. [Google Scholar] [CrossRef]
- Maes, W.H.; Steppe, K. Perspectives for Remote Sensing with Unmanned Aerial Vehicles in Precision Agriculture. Trends Plant Sci. 2019, 24, 152–164. [Google Scholar] [CrossRef]
- Sun, Q.; Gu, X.; Chen, L.; Xu, X.; Wei, Z.; Pan, Y.; Gao, Y. Monitoring Maize Canopy Chlorophyll Density under Lodging Stress Based on UAV Hyperspectral Imagery. Comput. Electron. Agric. 2022, 193, 106671. [Google Scholar] [CrossRef]
- Houborg, R.; McCabe, M.F. High-Resolution NDVI from Planet’s Constellation of Earth Observing Nano-Satellites: A New Data Source for Precision Agriculture. Remote Sens. 2016, 8, 768. [Google Scholar] [CrossRef]
- Abd-El Monsef, H.; Smith, S.E.; Rowland, D.L.; Abd El Rasol, N. Using Multispectral Imagery to Extract a Pure Spectral Canopy Signature for Predicting Peanut Maturity. Comput. Electron. Agric. 2019, 162, 561–572. [Google Scholar] [CrossRef]
- Chen, T.; Yang, W.; Zhang, H.; Zhu, B.; Zeng, R.; Wang, X.; Wang, S.; Wang, L.; Qi, H.; Lan, Y.; et al. Early Detection of Bacterial Wilt in Peanut Plants through Leaf-Level Hyperspectral and Unmanned Aerial Vehicle Data. Comput. Electron. Agric. 2020, 177, 105708. [Google Scholar] [CrossRef]
- Maimaitijiang, M.; Sagan, V.; Sidike, P.; Maimaitiyiming, M.; Hartling, S.; Peterson, K.T.; Maw, M.J.W.; Shakoor, N.; Mockler, T.; Fritschi, F.B. Vegetation Index Weighted Canopy Volume Model (CVMVI) for Soybean Biomass Estimation from Unmanned Aerial System-Based RGB Imagery. ISPRS J. Photogramm. Remote Sens. 2019, 151, 27–41. [Google Scholar] [CrossRef]
- Maimaitijiang, M.; Ghulam, A.; Sidike, P.; Hartling, S.; Maimaitiyiming, M.; Peterson, K.; Shavers, E.; Fishman, J.; Peterson, J.; Kadam, S.; et al. Unmanned Aerial System (UAS)-Based Phenotyping of Soybean Using Multi-Sensor Data Fusion and Extreme Learning Machine. ISPRS J. Photogramm. Remote Sens. 2017, 134, 43–58. [Google Scholar] [CrossRef]
- Bendig, J.; Yu, K.; Aasen, H.; Bolten, A.; Bennertz, S.; Broscheit, J.; Gnyp, M.L.; Bareth, G. Combining UAV-Based Plant Height from Crop Surface Models, Visible, and near Infrared Vegetation Indices for Biomass Monitoring in Barley. Int. J. Appl. Earth Obs. Geoinf. 2015, 39, 79–87. [Google Scholar] [CrossRef]
- Shi, Y.; Thomasson, J.A.; Murray, S.C.; Pugh, N.A.; Rooney, W.L.; Shafian, S.; Rajan, N.; Rouze, G.; Morgan, C.L.; Neely, H.L. Unmanned Aerial Vehicles for High-Throughput Phenotyping and Agronomic Research. PLoS ONE 2016, 11, e0159781. [Google Scholar] [CrossRef]
- Rischbeck, P.; Elsayed, S.; Mistele, B.; Barmeier, G.; Heil, K.; Schmidhalter, U. Data Fusion of Spectral, Thermal and Canopy Height Parameters for Improved Yield Prediction of Drought Stressed Spring Barley. Eur. J. Agron. 2016, 78, 44–59. [Google Scholar] [CrossRef]
- Sibanda, M.; Mutanga, O.; Rouget, M.; Kumar, L. Estimating Biomass of Native Grass Grown under Complex Management Treatments Using WorldView-3 Spectral Derivatives. Remote Sens. 2017, 9, 55. [Google Scholar] [CrossRef]
- Shiu, Y.; Chuang, Y. Yield Estimation of Paddy Rice Based on Satellite Imagery: Comparison of Global and Local Regression Models. Remote Sens. 2019, 11, 111. [Google Scholar] [CrossRef]
- Mongus, D.; Žalik, B. Segmentation Schema for Enhancing Land Cover Identification: A Case Study Using Sentinel 2 Data. Int. J. Appl. Earth Obs. Geoinf. 2018, 66, 56–68. [Google Scholar] [CrossRef]
- Jin, Z.; Azzari, G.; Lobell, D.B. Improving the Accuracy of Satellite-Based High-Resolution Yield Estimation: A Test of Multiple Scalable Approaches. Agric. For. Meteorol. 2017, 247, 207–220. [Google Scholar] [CrossRef]
- Fieuzal, R.; Marais Sicre, C.; Baup, F. Estimation of Corn Yield Using Multi-Temporal Optical and Radar Satellite Data and Artificial Neural Networks. Int. J. Appl. Earth Obs. Geoinf. 2017, 57, 14–23. [Google Scholar] [CrossRef]
- Aghighi, H.; Azadbakht, M.; Ashourloo, D.; Shahrabi, H.S.; Radiom, S. Machine Learning Regression Techniques for the Silage Maize Yield Prediction Using Time-Series Images of Landsat 8 OLI. IEEE J. Sel. Top. Appl. Earth Obs. Remote Sens. 2018, 11, 4563–4577. [Google Scholar] [CrossRef]
- Kuwata, K.; Shibasaki, R. Estimating Corn Yield in the United States with Modis Evi and Machine Learning Methods. ISPRS Ann. Photogramm. Remote Sens. Spat. Inf. Sci. 2016, 3, 131–136. [Google Scholar]
- Zhai, W.; Li, C.; Cheng, Q.; Ding, F.; Chen, Z. Exploring Multisource Feature Fusion and Stacking Ensemble Learning for Accurate Estimation of Maize Chlorophyll Content Using Unmanned Aerial Vehicle Remote Sensing. Remote Sens. 2023, 15, 3454. [Google Scholar] [CrossRef]
- Zhai, W.; Li, C.; Cheng, Q.; Mao, B.; Li, Z.; Li, Y.; Ding, F.; Qin, S.; Fei, S.; Chen, Z. Enhancing Wheat Above-Ground Biomass Estimation Using UAV RGB Images and Machine Learning: Multi-Feature Combinations, Flight Height, and Algorithm Implications. Remote Sens. 2023, 15, 3653. [Google Scholar] [CrossRef]
- Zha, H.; Miao, Y.; Wang, T.; Li, Y.; Zhang, J.; Sun, W.; Feng, Z.; Kusnierek, K. Improving Unmanned Aerial Vehicle Remote Sensing-Based Rice Nitrogen Nutrition Index Prediction with Machine Learning. Remote Sens. 2020, 12, 215. [Google Scholar] [CrossRef]
- Huang, G.; Wu, L.; Ma, X.; Zhang, W.; Fan, J.; Yu, X.; Zeng, W.; Zhou, H. Evaluation of CatBoost Method for Prediction of Reference Evapotranspiration in Humid Regions. J. Hydrol. 2019, 574, 1029–1041. [Google Scholar] [CrossRef]
- Chang, W.; Wen, W.; Gu, S.; Li, Y.; Fan, J.; Lu, X.; Chen, B.; Xu, T.; Wang, R.; Guo, X.; et al. Canopy Height Uniformity: A New 3D Phenotypic Indicator Linking Individual Plant to Canopy. Comput. Electron. Agric. 2024, 227, 109491. [Google Scholar] [CrossRef]
- Tucker, C.J. Red and Photographic Infrared Linear Combinations for Monitoring Vegetation. Remote Sens. Environ. 1979, 8, 127–150. [Google Scholar] [CrossRef]
- Gitelson, A.A.; Gritz, Y.; Merzlyak, M.N. Relationships between Leaf Chlorophyll Content and Spectral Reflectance and Algorithms for Non-Destructive Chlorophyll Assessment in Higher Plant Leaves. J. Plant Physiol. 2003, 160, 271–282. [Google Scholar] [CrossRef] [PubMed]
- Rouse, J.W., Jr. Monitoring the Vernal Advancement and Netrogradation of Natural Vegetation. NASA/GSFCT Type Report 1973. Available online: https://ntrs.nasa.gov/citations/19740022555 (accessed on 15 March 2025).
- Gitelson, A.A.; Kaufman, Y.J.; Merzlyak, M.N. Use of a Green Channel in Remote Sensing of Global Vegetation from EOS-MODIS. Remote Sens. Environ. 1996, 58, 289–298. [Google Scholar] [CrossRef]
- Sripada, R.P.; Heiniger, R.W.; White, J.G.; Meijer, A.D. Aerial Color Infrared Photography for Determining Early In-season Nitrogen Requirements in Corn. Agron. J. 2006, 98, 968–977. [Google Scholar] [CrossRef]
- Haboudane, D.; Miller, J.R.; Tremblay, N.; Zarco-Tejada, P.J.; Dextraze, L. Integrated Narrow-Band Vegetation Indices for Prediction of Crop Chlorophyll Content for Application to Precision Agriculture. Remote Sens. Environ. 2002, 81, 416–426. [Google Scholar] [CrossRef]
- Rondeaux, G.; Steven, M.; Baret, F. Optimization of Soil-Adjusted Vegetation Indices. Remote Sens. Environ. 1996, 55, 95–107. [Google Scholar] [CrossRef]
- Haboudane, D.; Miller, J.R.; Pattey, E.; Zarco-Tejada, P.J.; Strachan, I.B. Hyperspectral Vegetation Indices and Novel Algorithms for Predicting Green LAI of Crop Canopies: Modeling and Validation in the Context of Precision Agriculture. Remote Sens. Environ. 2004, 90, 337–352. [Google Scholar] [CrossRef]
- Gitelson, A.A.; Zur, Y.; Chivkunova, O.B.; Merzlyak, M.N. Assessing Carotenoid Content in Plant Leaves with Reflectance Spectroscopy. Photochem. Photobiol. 2002, 75, 272–281. [Google Scholar] [CrossRef]
- Roujean, J.L.; Breon, F.M. Estimating PAR Absorbed by Vegetation from Bidirectional Reflectance Measurements. Remote Sens. Environ. 1995, 51, 375–384. [Google Scholar] [CrossRef]
- Davidson, C.; Jaganathan, V.; Sivakumar, A.N.; Czarnecki, J.M.P.; Chowdhary, G. NDVI/NDRE Prediction from Standard RGB Aerial Imagery Using Deep Learning. Comput. Electron. Agric. 2022, 203, 107396. [Google Scholar] [CrossRef]
- Raper, T.B.; Varco, J.J. Canopy-Scale Wavelength and Vegetative Index Sensitivities to Cotton Growth Parameters and Nitrogen Status. Precis. Agric. 2015, 16, 62–76. [Google Scholar] [CrossRef]
- Broge, N.H.; Leblanc, E. Comparing Prediction Power and Stability of Broadband and Hyperspectral Vegetation Indices for Estimation of Green Leaf Area Index and Canopy Chlorophyll Density. Remote Sens. Environ. 2001, 76, 156–172. [Google Scholar] [CrossRef]
- Liu, H.Q.; Huete, A. A Feedback Based Modification of the NDVI to Minimize Canopy Background and Atmospheric Noise. IEEE Trans. Geosci. Remote Sens. 1995, 33, 457–465. [Google Scholar] [CrossRef]
- Qi, J.; Chehbouni, A.; Huete, A.R.; Kerr, Y.H.; Sorooshian, S. A Modified Soil Adjusted Vegetation Index. Remote Sens. Environ. 1994, 48, 119–126. [Google Scholar] [CrossRef]
- Riedell, W.E.; Blackmer, T.M. Leaf Reflectance Spectra of Cereal Aphid-Damaged Wheat. Crop Sci. 1999, 39, 1835–1840. [Google Scholar] [CrossRef]
- Haralick, R.M.; Shanmugam, K.; Dinstein, I. Textural Features for Image Classification. IEEE Trans. Syst. Man Cybern. 1973, SMC-3, 610–621. [Google Scholar] [CrossRef]
- Liang, Y.; Kou, W.; Lai, H.; Wang, J.; Wang, Q.; Xu, W.; Wang, H.; Lu, N. Improved Estimation of Aboveground Biomass in Rubber Plantations by Fusing Spectral and Textural Information from UAV-Based RGB Imagery. Ecol. Indic. 2022, 142, 109286. [Google Scholar] [CrossRef]
- Xu, T.; Wang, F.; Shi, Z.; Miao, Y. Multi-Scale Monitoring of Rice Aboveground Biomass by Combining Spectral and Textural Information from UAV Hyperspectral Images. Int. J. Appl. Earth Obs. Geoinf. 2024, 127, 103655. [Google Scholar] [CrossRef]
- Liu, Y.; Fan, Y.; Feng, H.; Chen, R.; Bian, M.; Ma, Y.; Yue, J.; Yang, G. Estimating Potato Above-Ground Biomass Based on Vegetation Indices and Texture Features Constructed from Sensitive Bands of UAV Hyperspectral Imagery. Comput. Electron. Agric. 2024, 220, 108918. [Google Scholar] [CrossRef]
- Bian, C.; Shi, H.; Wu, S.; Zhang, K.; Wei, M.; Zhao, Y.; Sun, Y.; Zhuang, H.; Zhang, X.; Chen, S. Prediction of Field-Scale Wheat Yield Using Machine Learning Method and Multi-Spectral UAV Data. Remote Sens. 2022, 14, 1474. [Google Scholar] [CrossRef]
- Chen, B.; Huang, G.; Lu, X.; Gu, S.; Wen, W.; Wang, G.; Chang, W.; Guo, X.; Zhao, C. Prediction of Vertical Distribution of SPAD Values within Maize Canopy Based on Unmanned Aerial Vehicles Multispectral Imagery. Front. Plant Sci. 2023, 14, 1253536. [Google Scholar] [CrossRef] [PubMed]
- Wu, T.; Chen, H.; Lin, Z.; Tan, C. Identification and Quantitation of Melamine in Milk by Near-Infrared Spectroscopy and Chemometrics. J. Spectrosc. 2016, 2016, 6184987. [Google Scholar] [CrossRef]
- Jin, X.; Chen, X.; Shi, C.; Li, M.; Guan, Y.; Yu, C.Y.; Yamada, T.; Sacks, E.J.; Peng, J. Determination of Hemicellulose, Cellulose and Lignin Content Using Visible and near Infrared Spectroscopy in Miscanthus Sinensis. Bioresour. Technol. 2017, 241, 603–609. [Google Scholar] [CrossRef] [PubMed]
- Maimaitijiang, M.; Sagan, V.; Sidike, P.; Hartling, S.; Esposito, F.; Fritschi, F.B. Soybean Yield Prediction from UAV Using Multimodal Data Fusion and Deep Learning. Remote Sens. Environ. 2020, 237, 111599. [Google Scholar] [CrossRef]
- Zou, M.; Liu, Y.; Fu, M.; Li, C.; Zhou, Z.; Meng, H.; Xing, E.; Ren, Y. Combining Spectral and Texture Feature of UAV Image with Plant Height to Improve LAI Estimation of Winter Wheat at Jointing Stage. Front. Plant Sci. 2024, 14, 1272049. [Google Scholar] [CrossRef]


Disclaimer/Publisher’s Note: The statements, opinions and data contained in all publications are solely those of the individual author(s) and contributor(s) and not of MDPI and/or the editor(s). MDPI and/or the editor(s) disclaim responsibility for any injury to people or property resulting from any ideas, methods, instructions or products referred to in the content. |
© 2025 by the authors. Licensee MDPI, Basel, Switzerland. This article is an open access article distributed under the terms and conditions of the Creative Commons Attribution (CC BY) license (https://creativecommons.org/licenses/by/4.0/).