

Low-Altitude Sensing Model: Analysis Leveraging ISAC in Real-World Environments


Abstract
:1. Introduction
1.1. Background
1.2. Contributions
- This paper constructs a 3D sensing model for a single ISAC base station operating in a single base station responsible for both the transmission and reception nodes. It analyzes the influence on vertical FOV of base station antennas, and the differences in cell radius and beam characteristics between communication and sensing. Compared to previous studies, this model more precisely defines the sensing boundaries and range of a single base station, providing a more accurate theoretical basis for low-altitude network sensing capabilities. This achievement not only contributes to a deeper understanding of the basic characteristics of low-altitude ISAC networks, but also offers innovative ideas for designing the key parameters of ISAC fusion base stations, laying a theoretical foundation for the development of low-altitude ISAC networks.
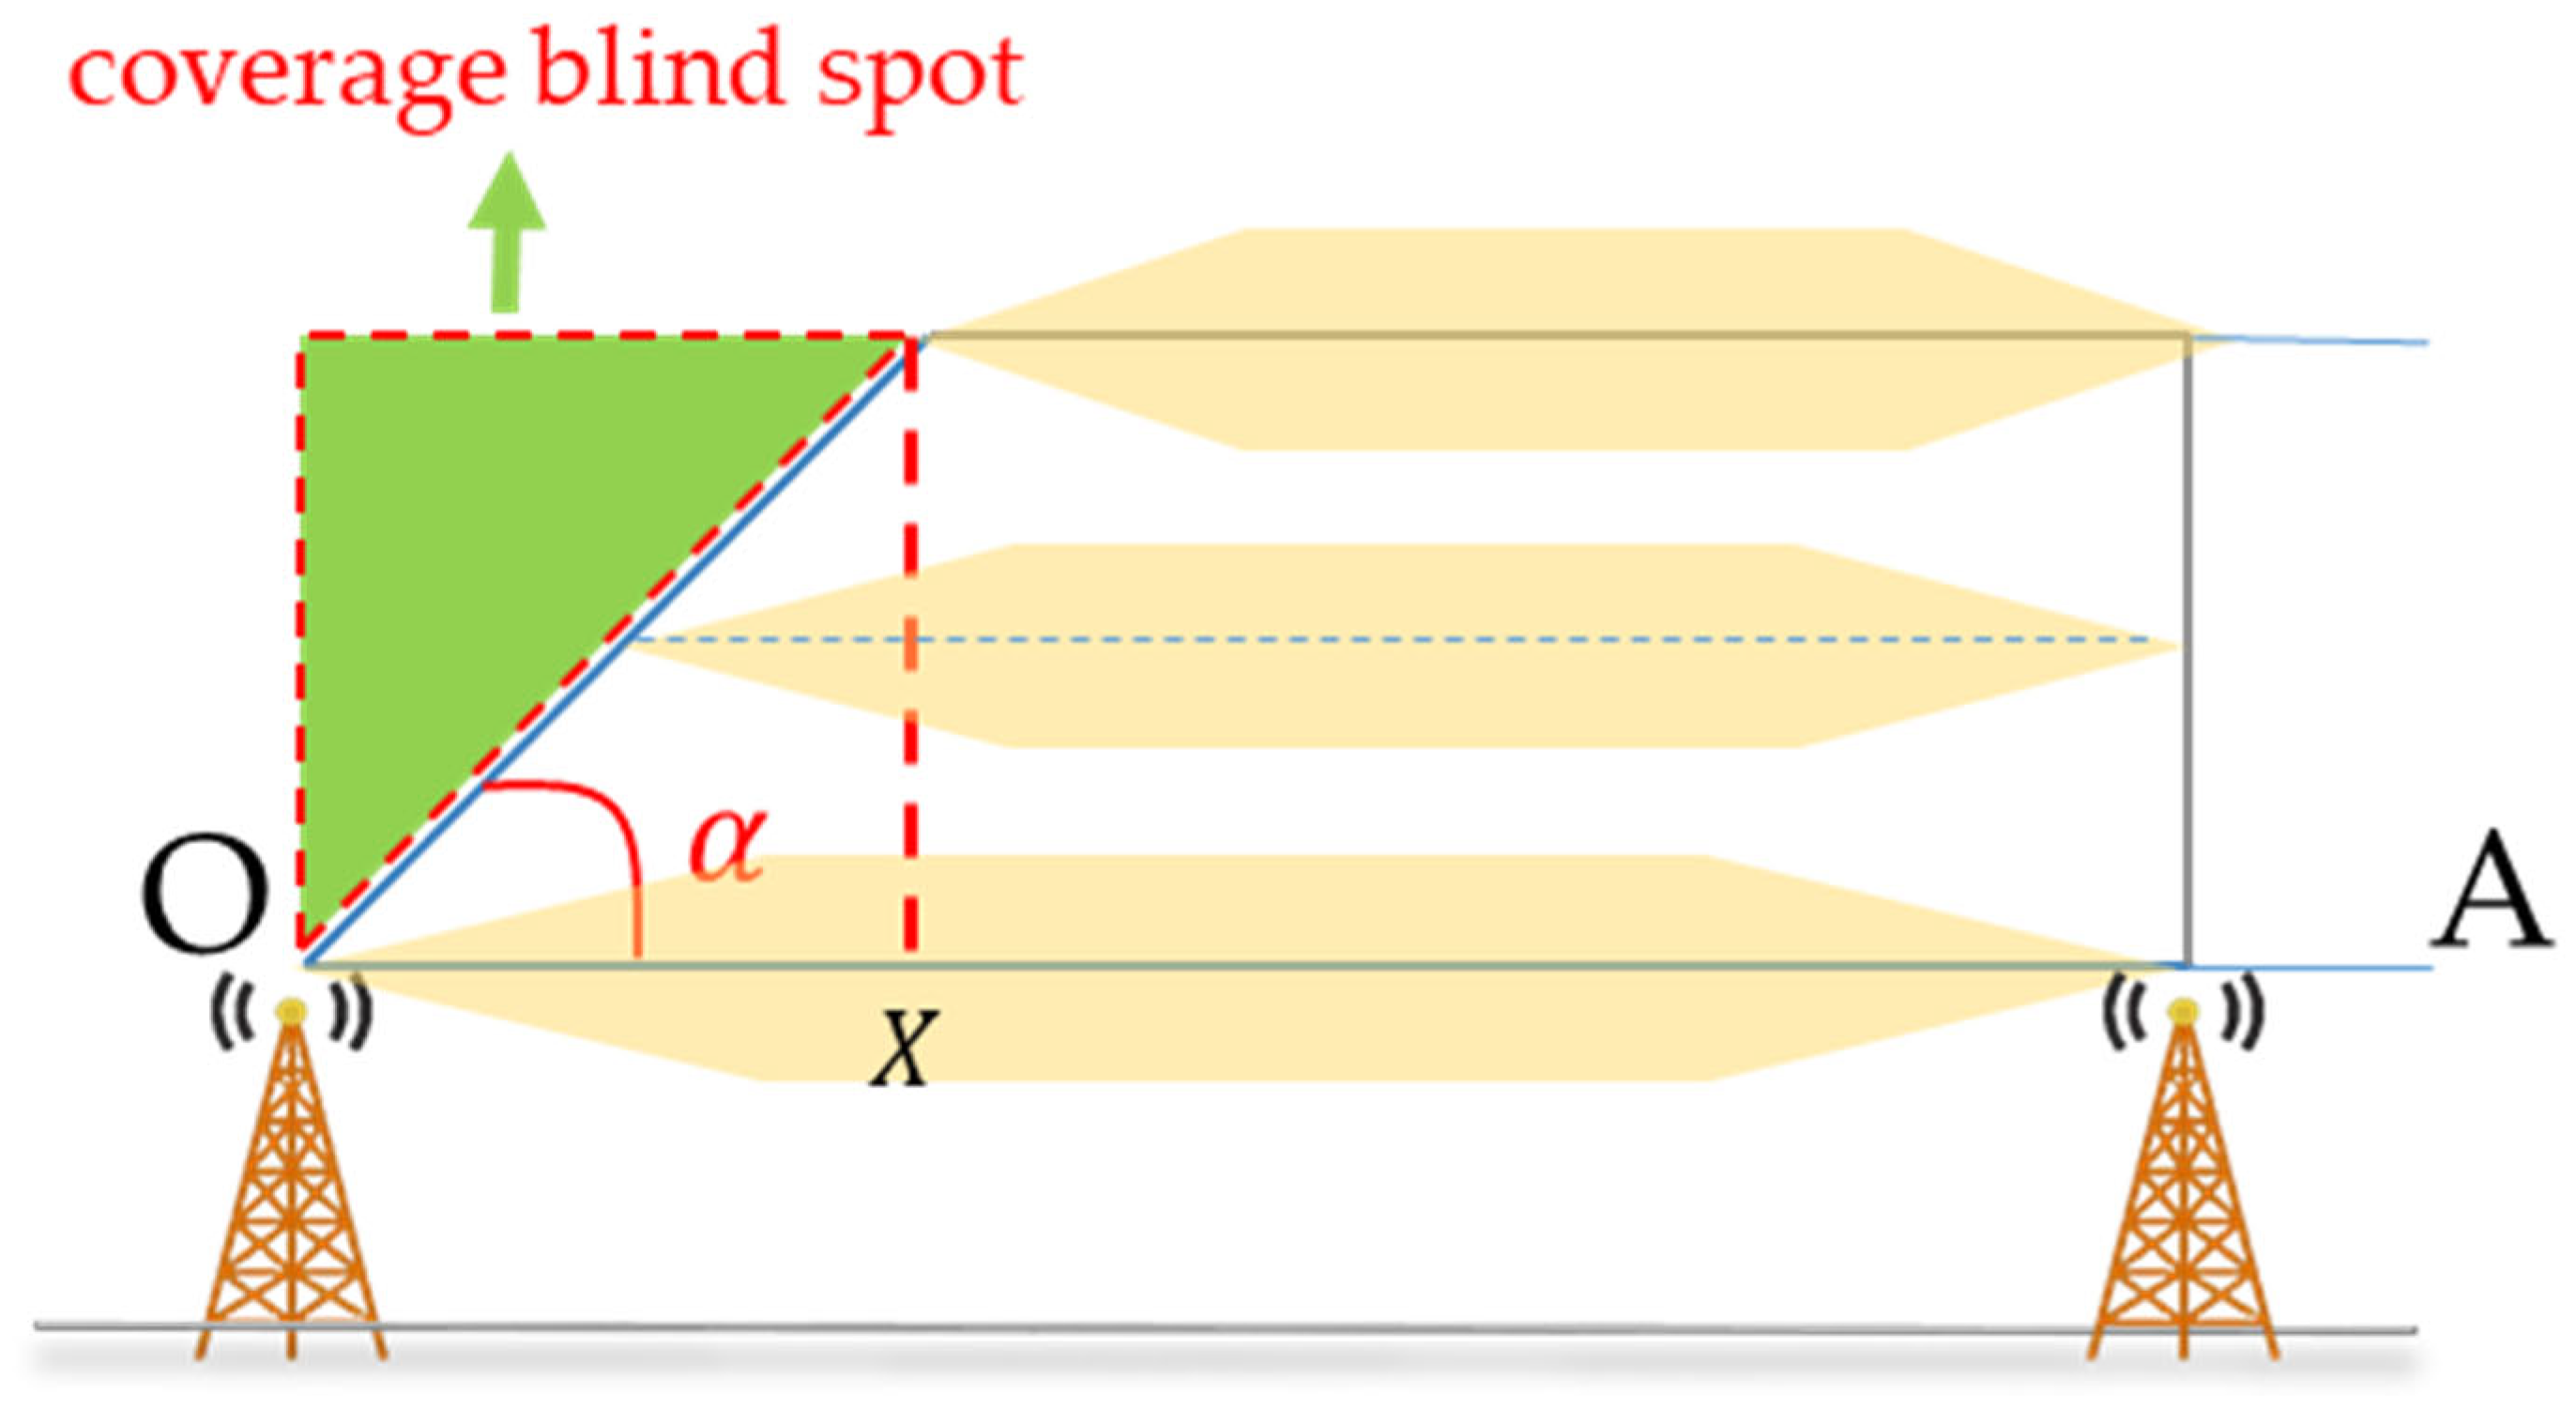
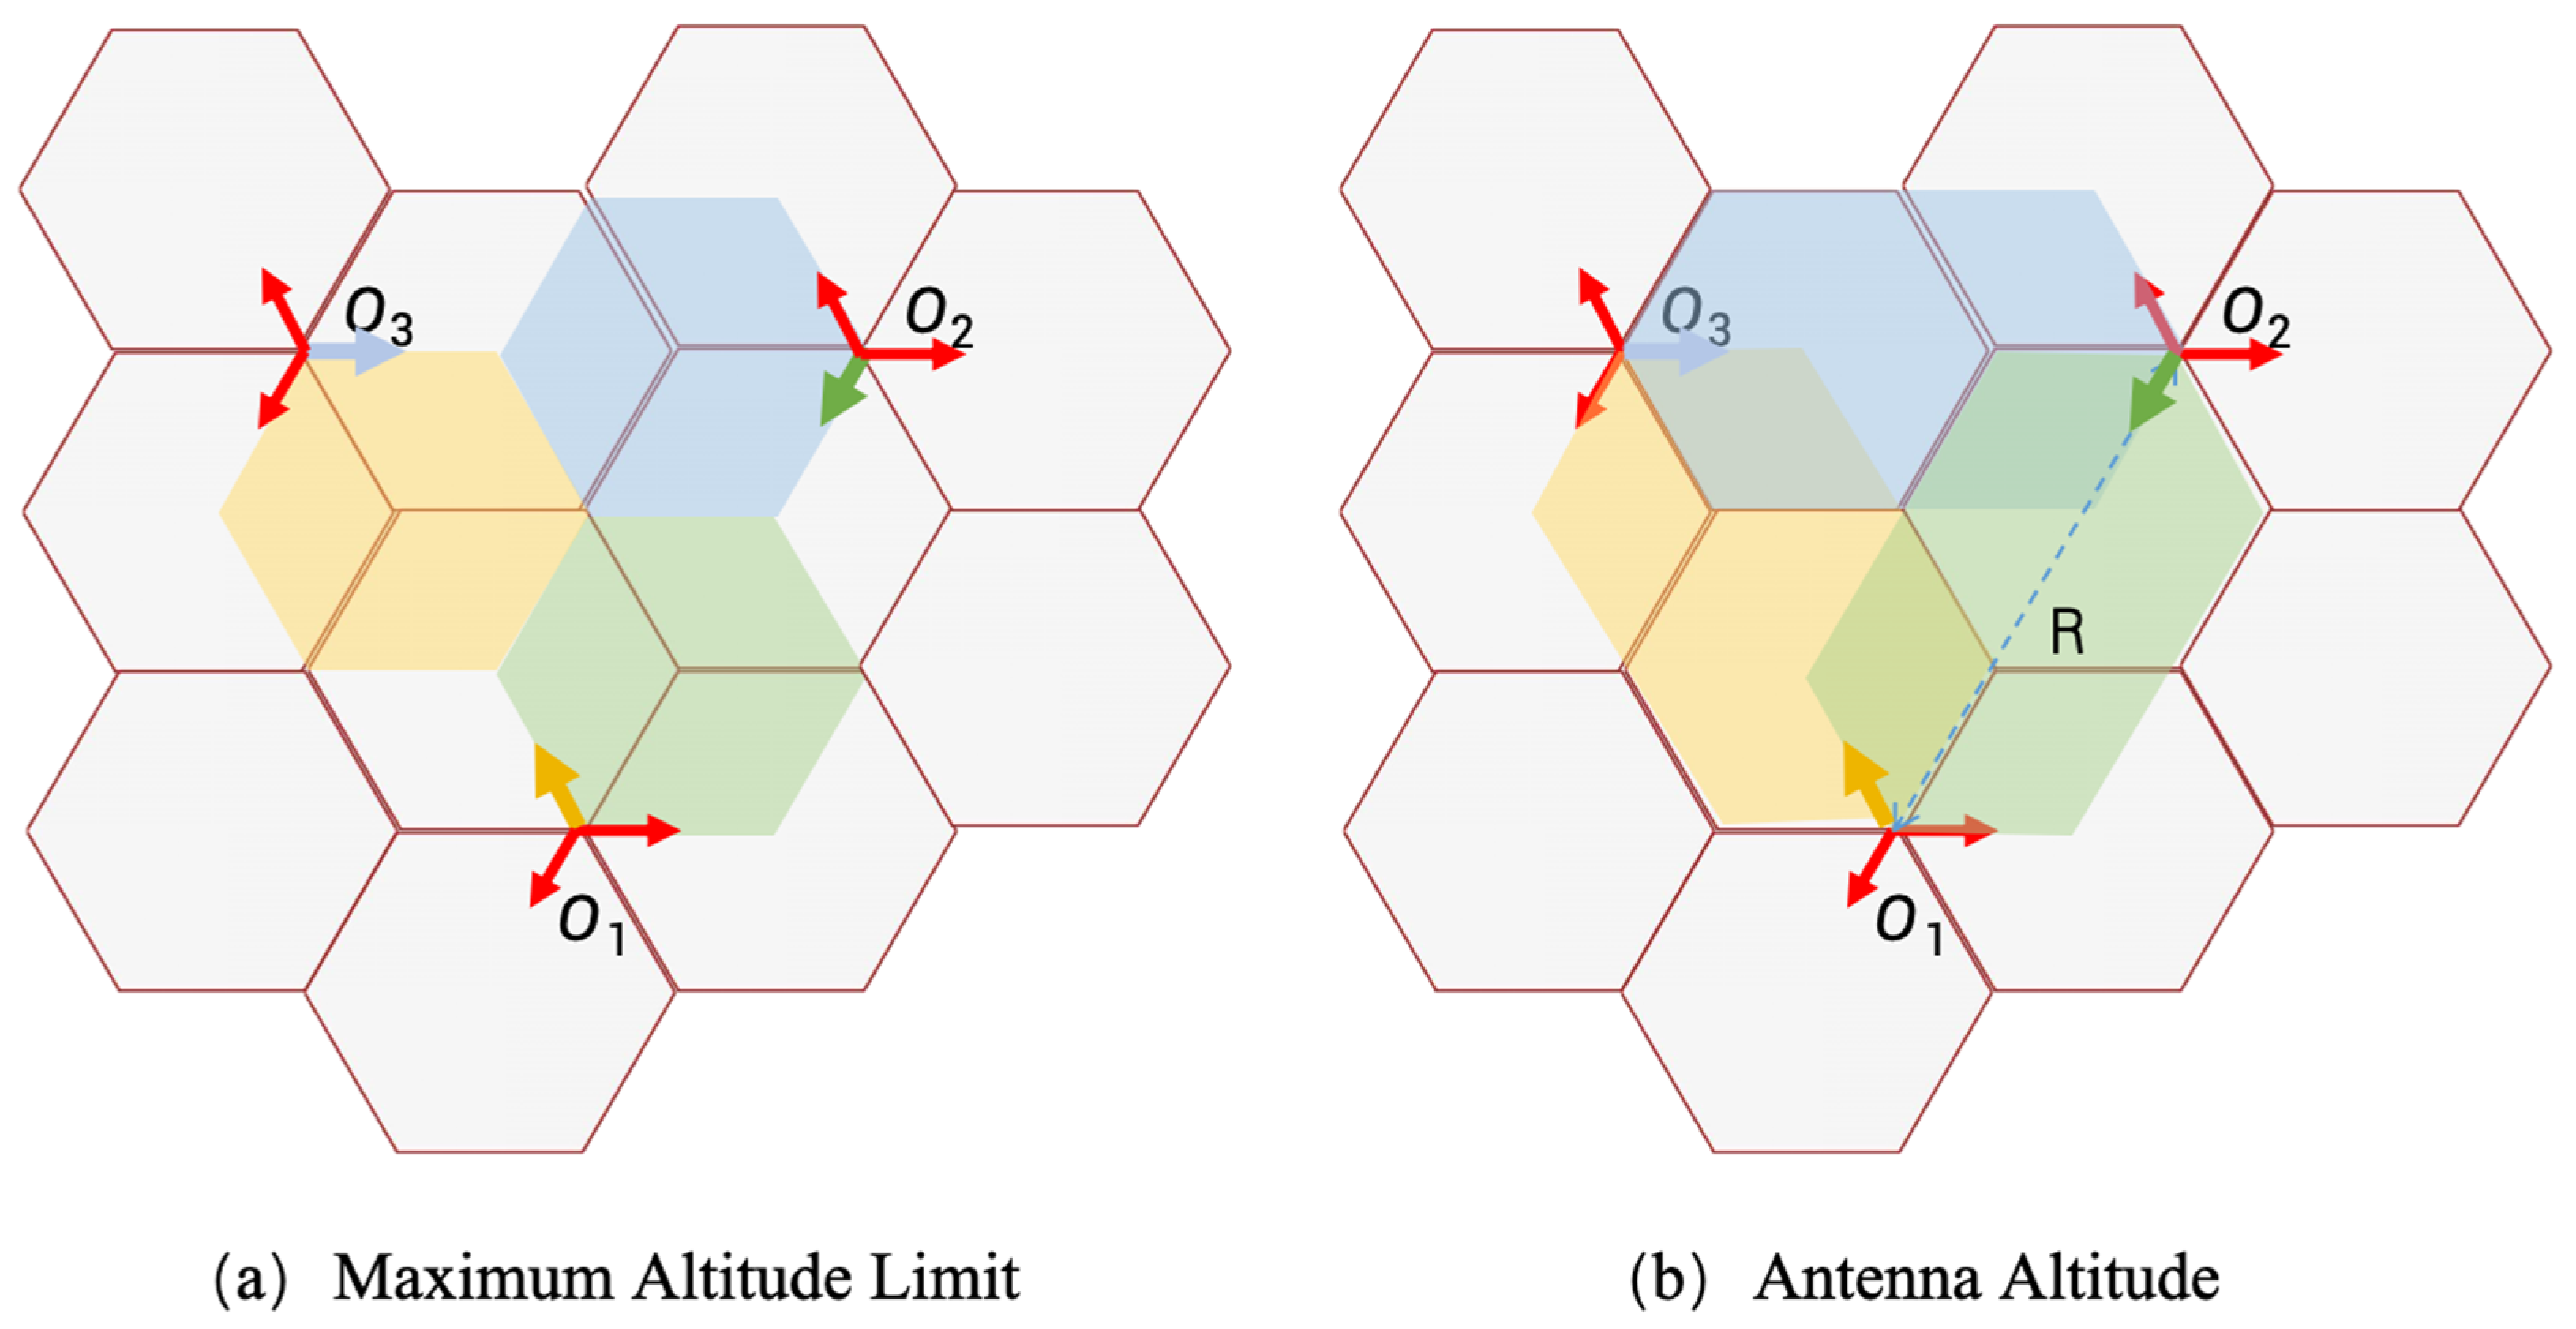
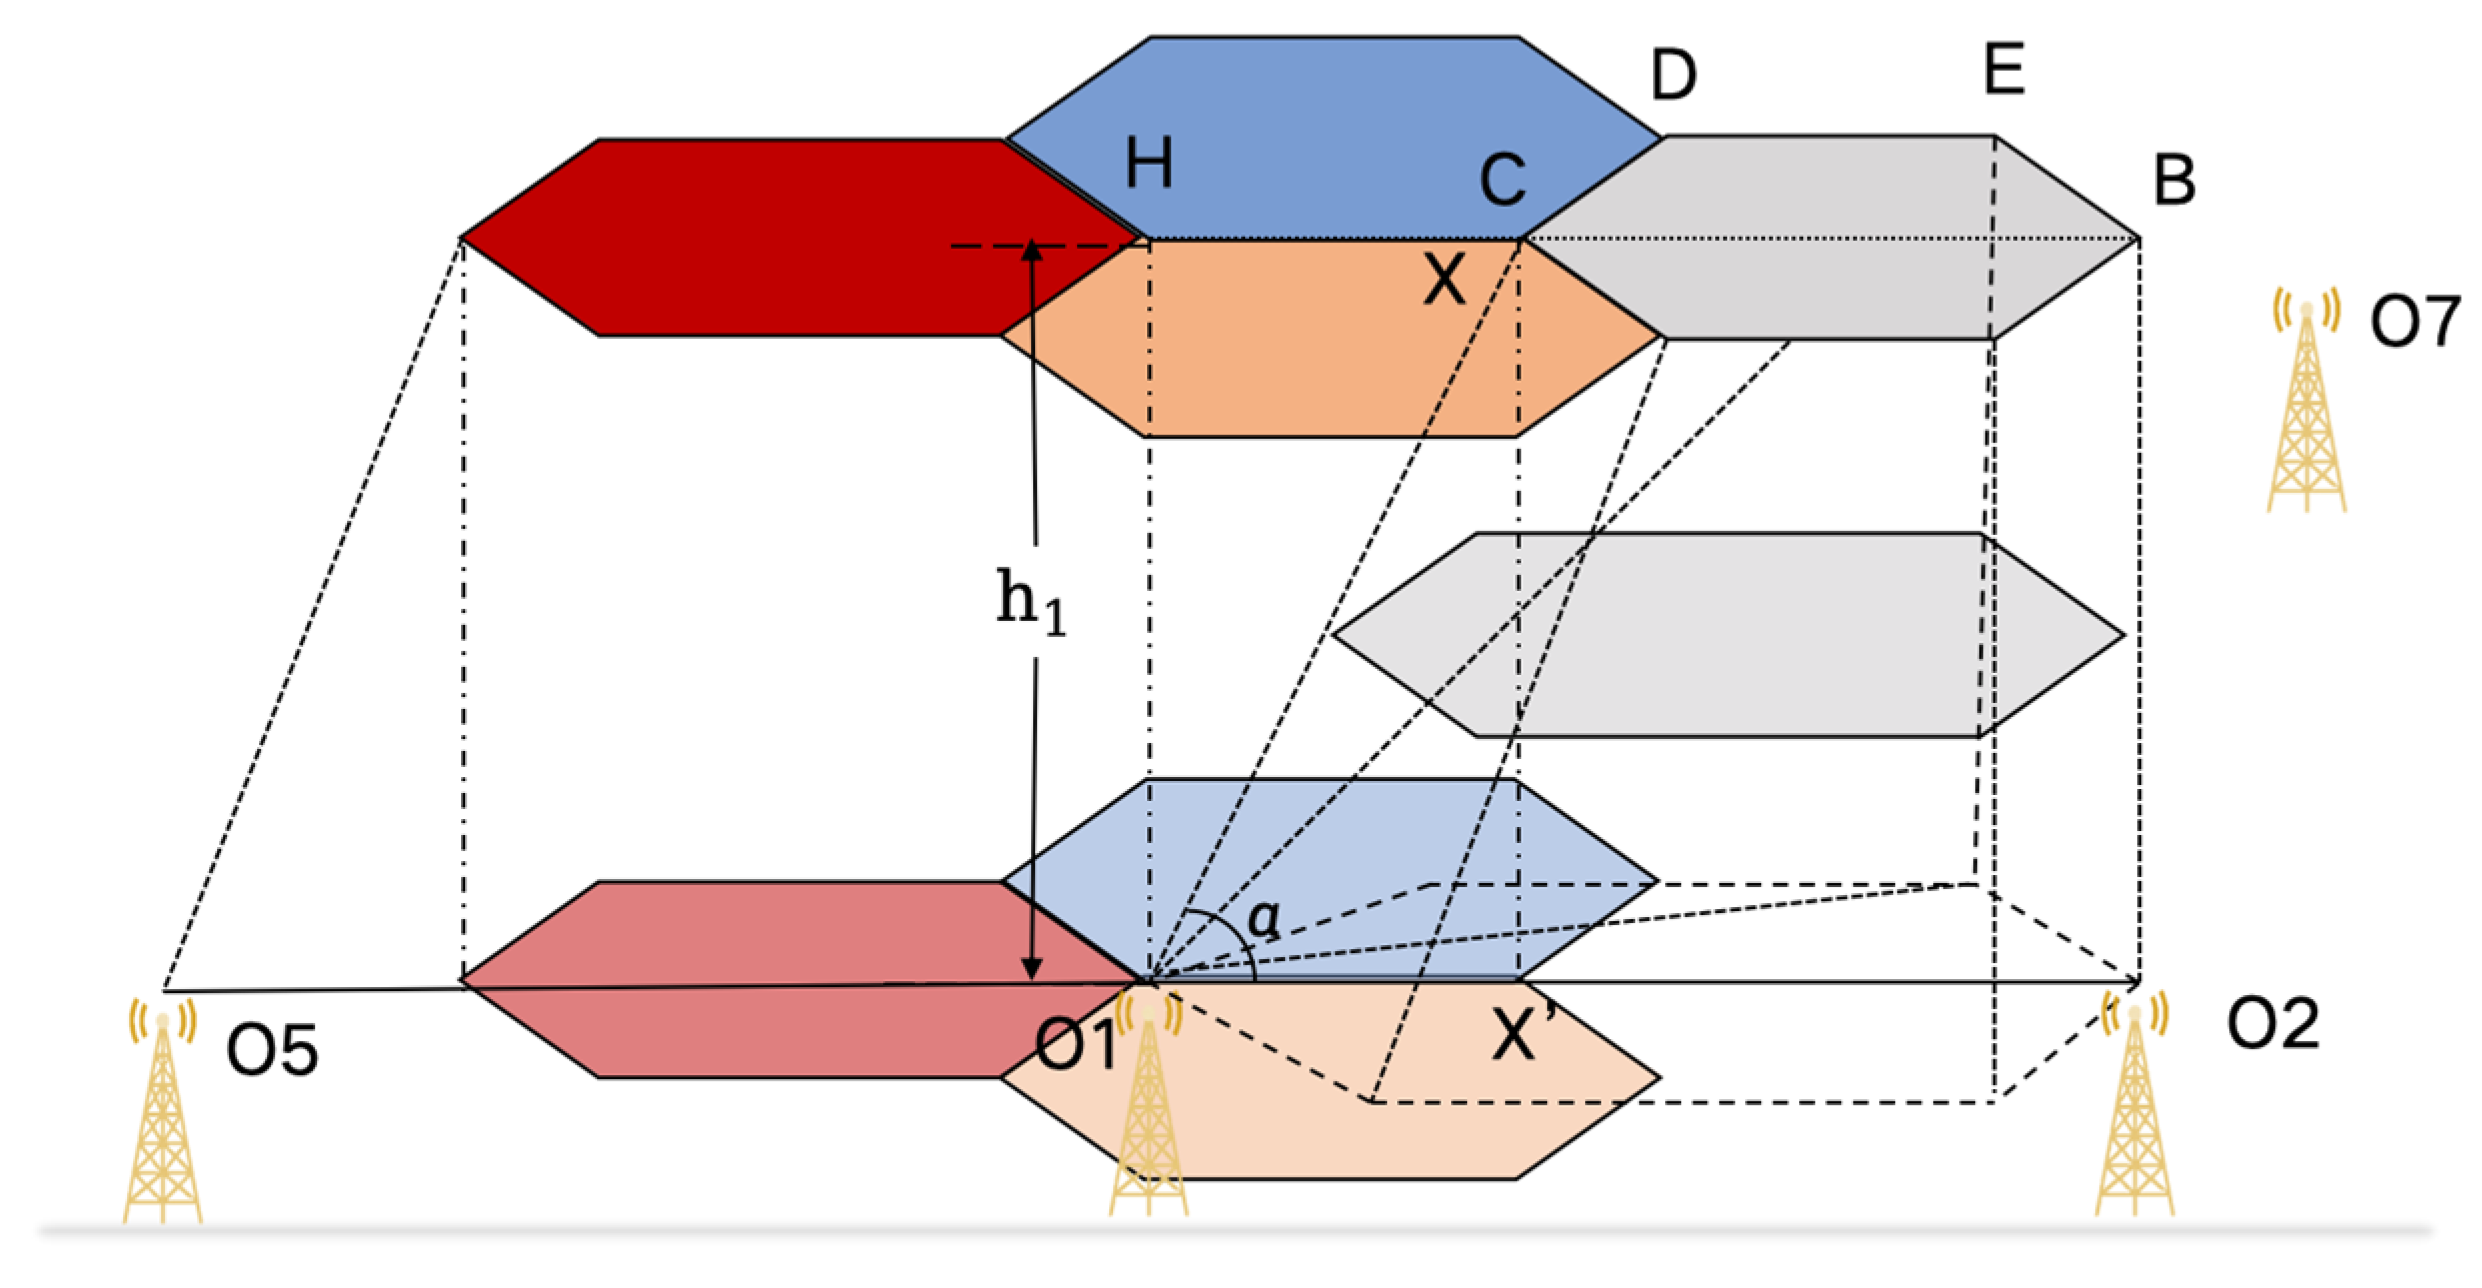
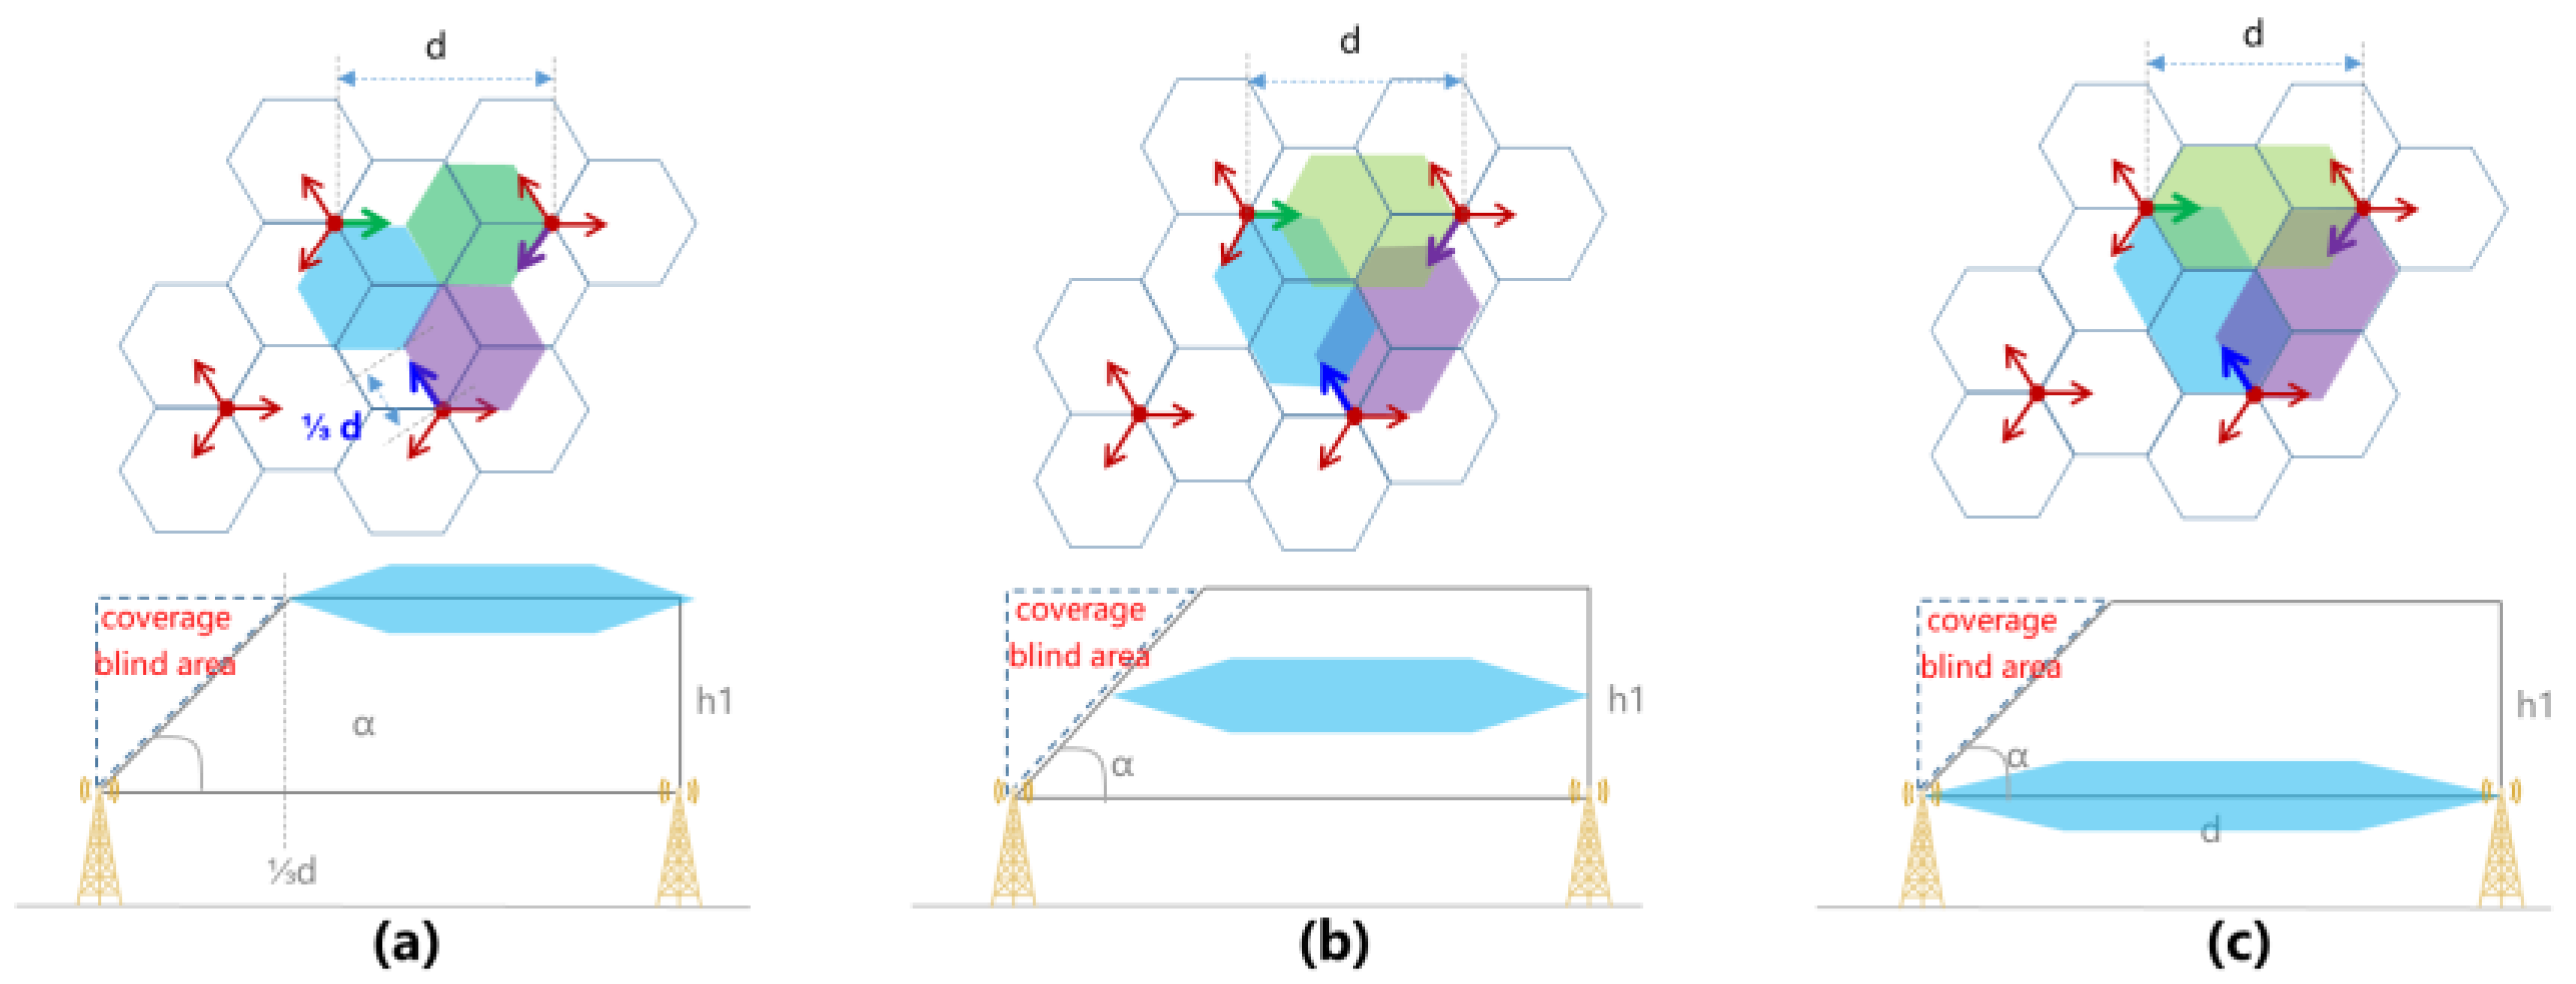
- To address the issue of base station tower top blind spots, this paper proposes a multi-BS complementary coverage method and designs a 3D sensing-based cellular-like topology for low-altitude multi-BS networking. Compared to traditional 2D network models, this topology overcomes the limitations in low-altitude 3D coverage. By optimizing base station layout and signal coverage, it achieves seamless 3D sensing in low-altitude environments, significantly improving the accuracy and reliability of wide-area low-altitude sensing. This innovative design provides a practical solution for the real-world application of low-altitude ISAC networks and lays the foundation for the widespread adoption of low-altitude sensing technology across various fields.
- To validate the feasibility of the single base station model under ideal conditions, this paper conducts the first laboratory tests on the sensing boundary of a single base station in an mmW frequency far-field OTA anechoic chamber. Additionally, based on the world’s first commercial mmW ISAC network, a real-world testing platform is set up in collaboration with leading equipment suppliers for outdoor field testing, successfully validating the effectiveness of the sensing network topology in actual scenarios. This combination of laboratory and real-world commercial network testing provides a comprehensive and reliable reference for the network deployment of low-altitude ISAC base stations, filling the gap in practical testing and verification in this field and providing crucial technical support and practical experience for future research and engineering practices.
2. The Model of Single Base Station 3D Sensing
2.1. Analysis of Single Base Station Sensing Capabilities
2.2. Differentiation Analysis
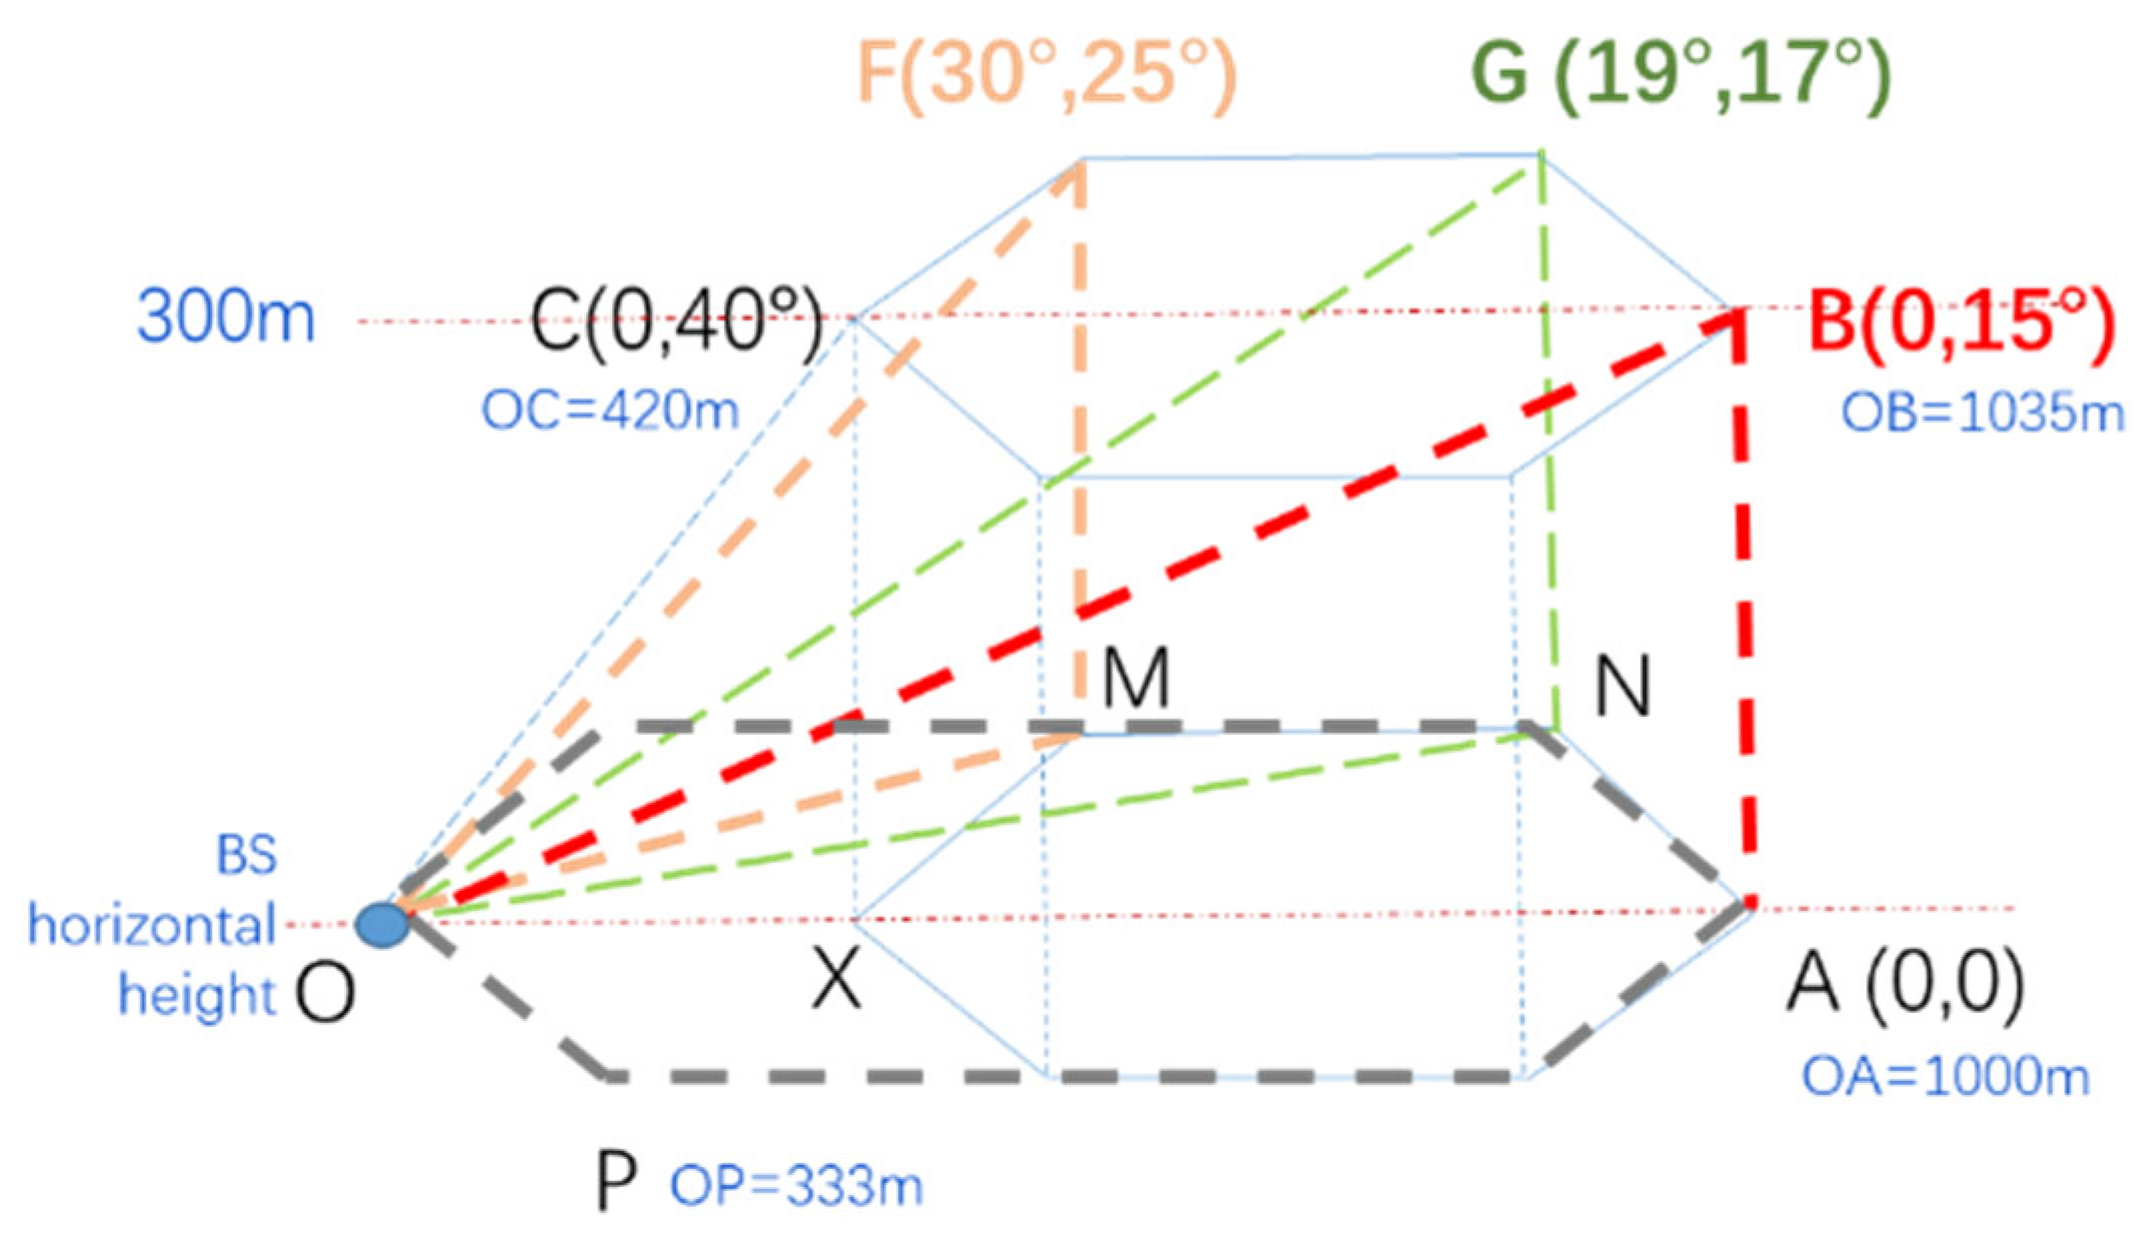
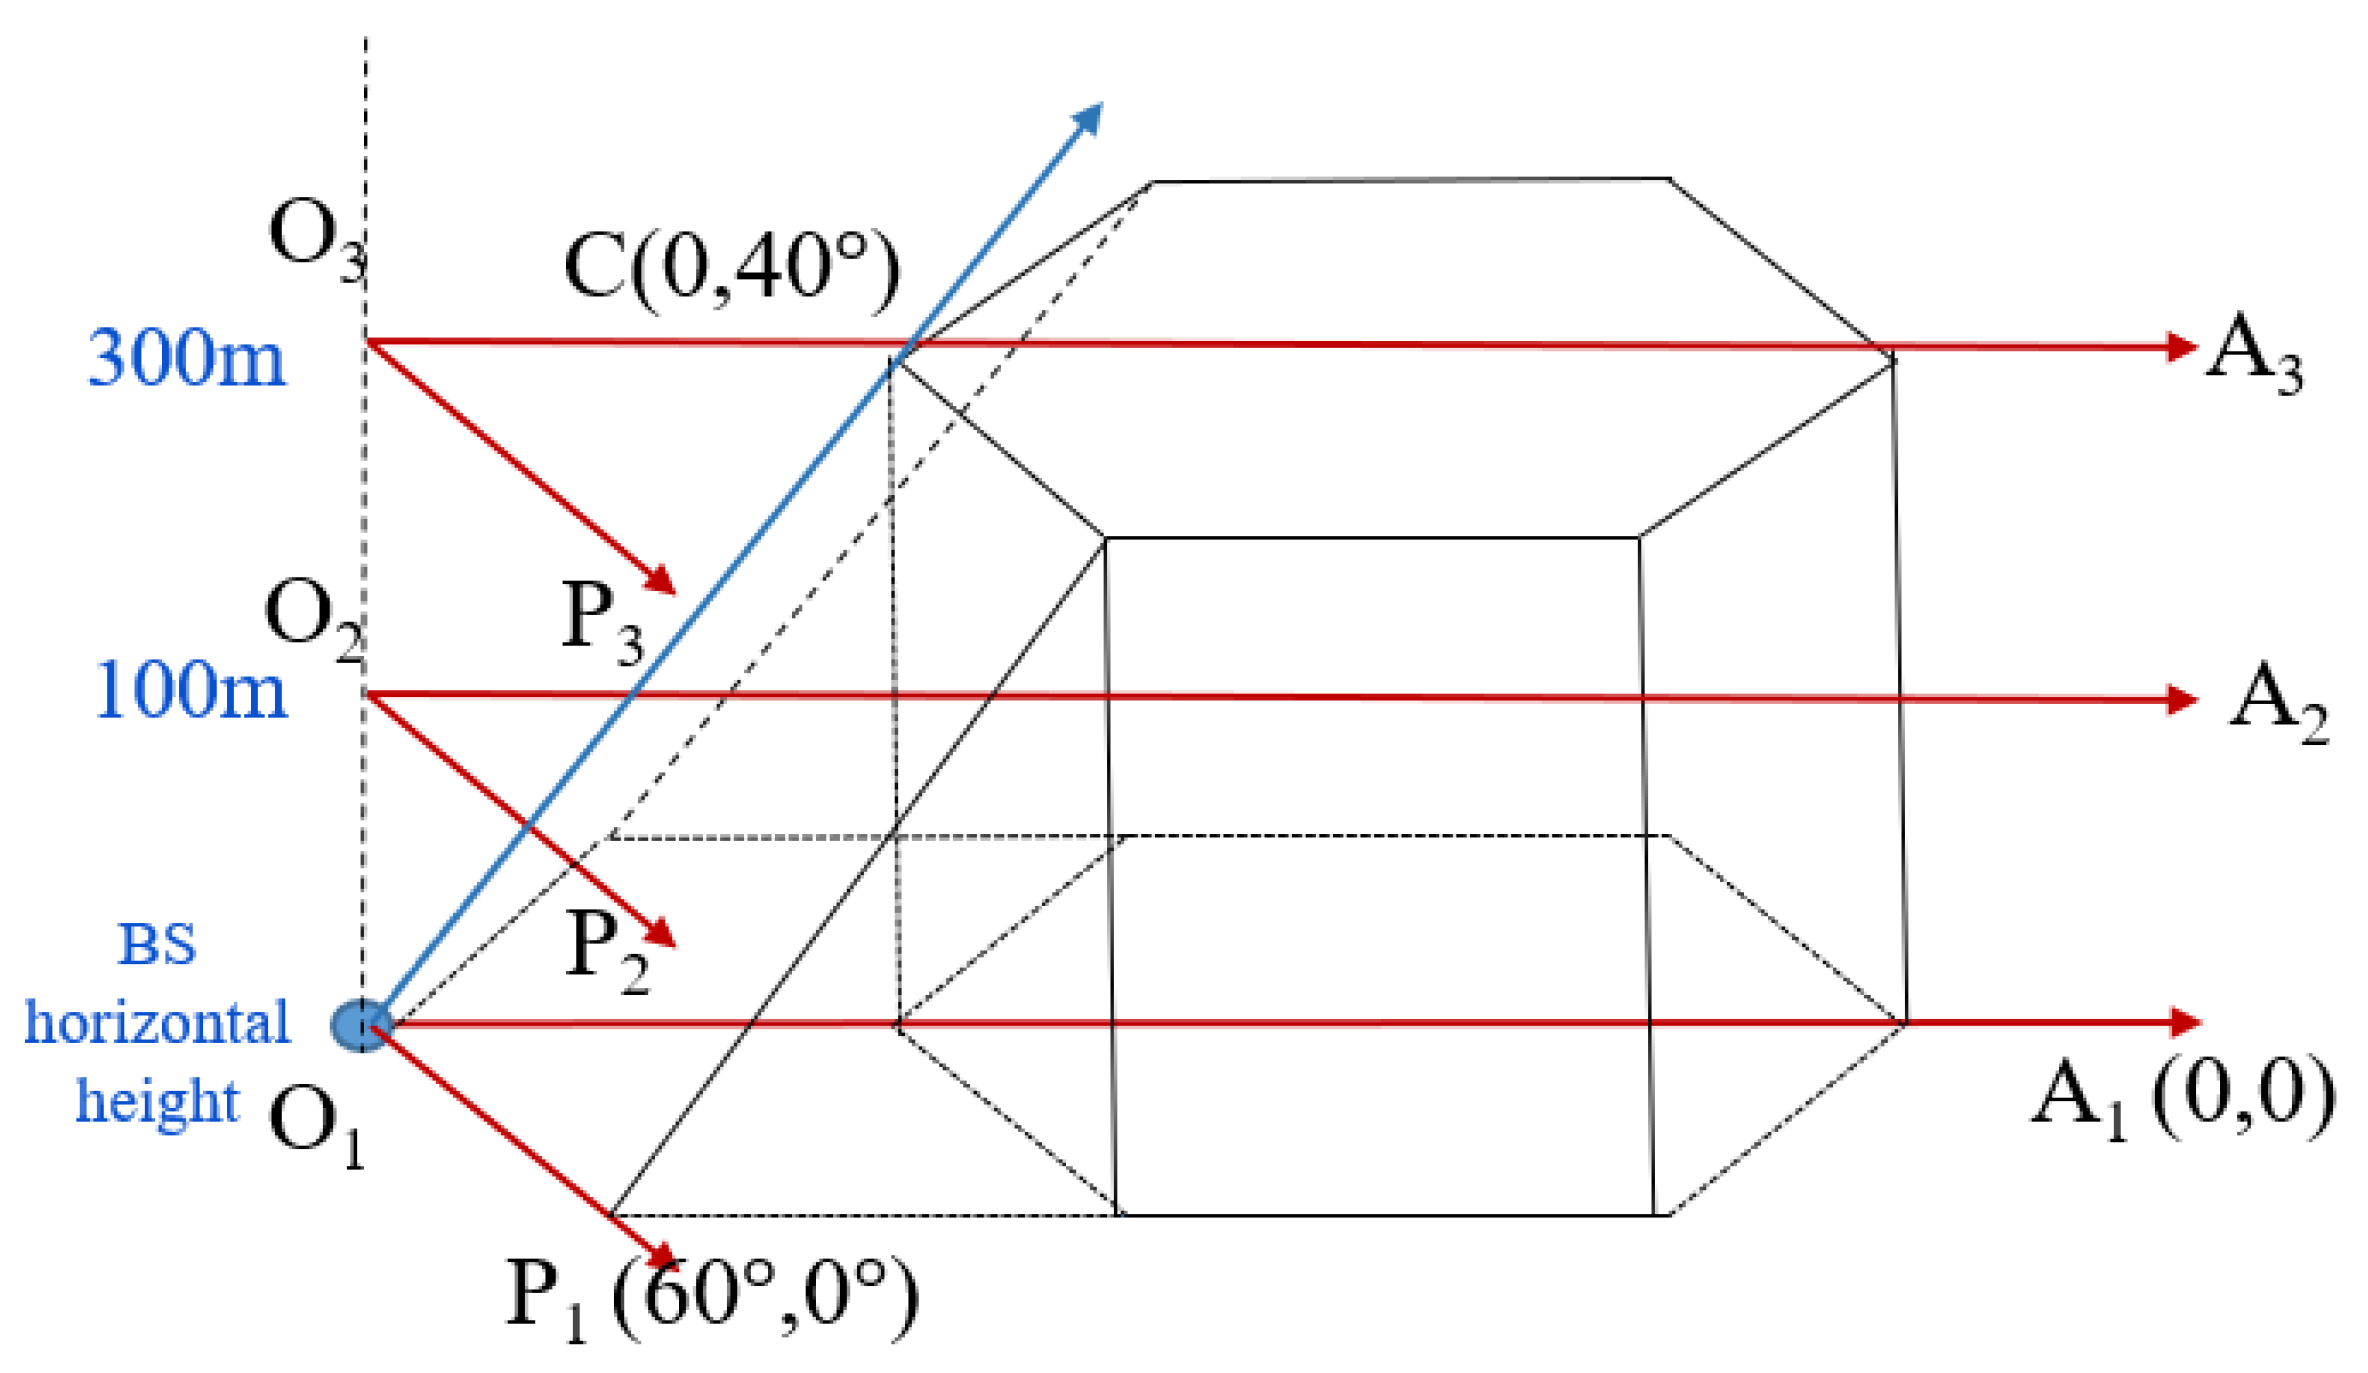
2.3. Model and Key Parameters Design
3. Multi-BS Networking with Cellular-like Topology
4. Performance Verification and Analysis
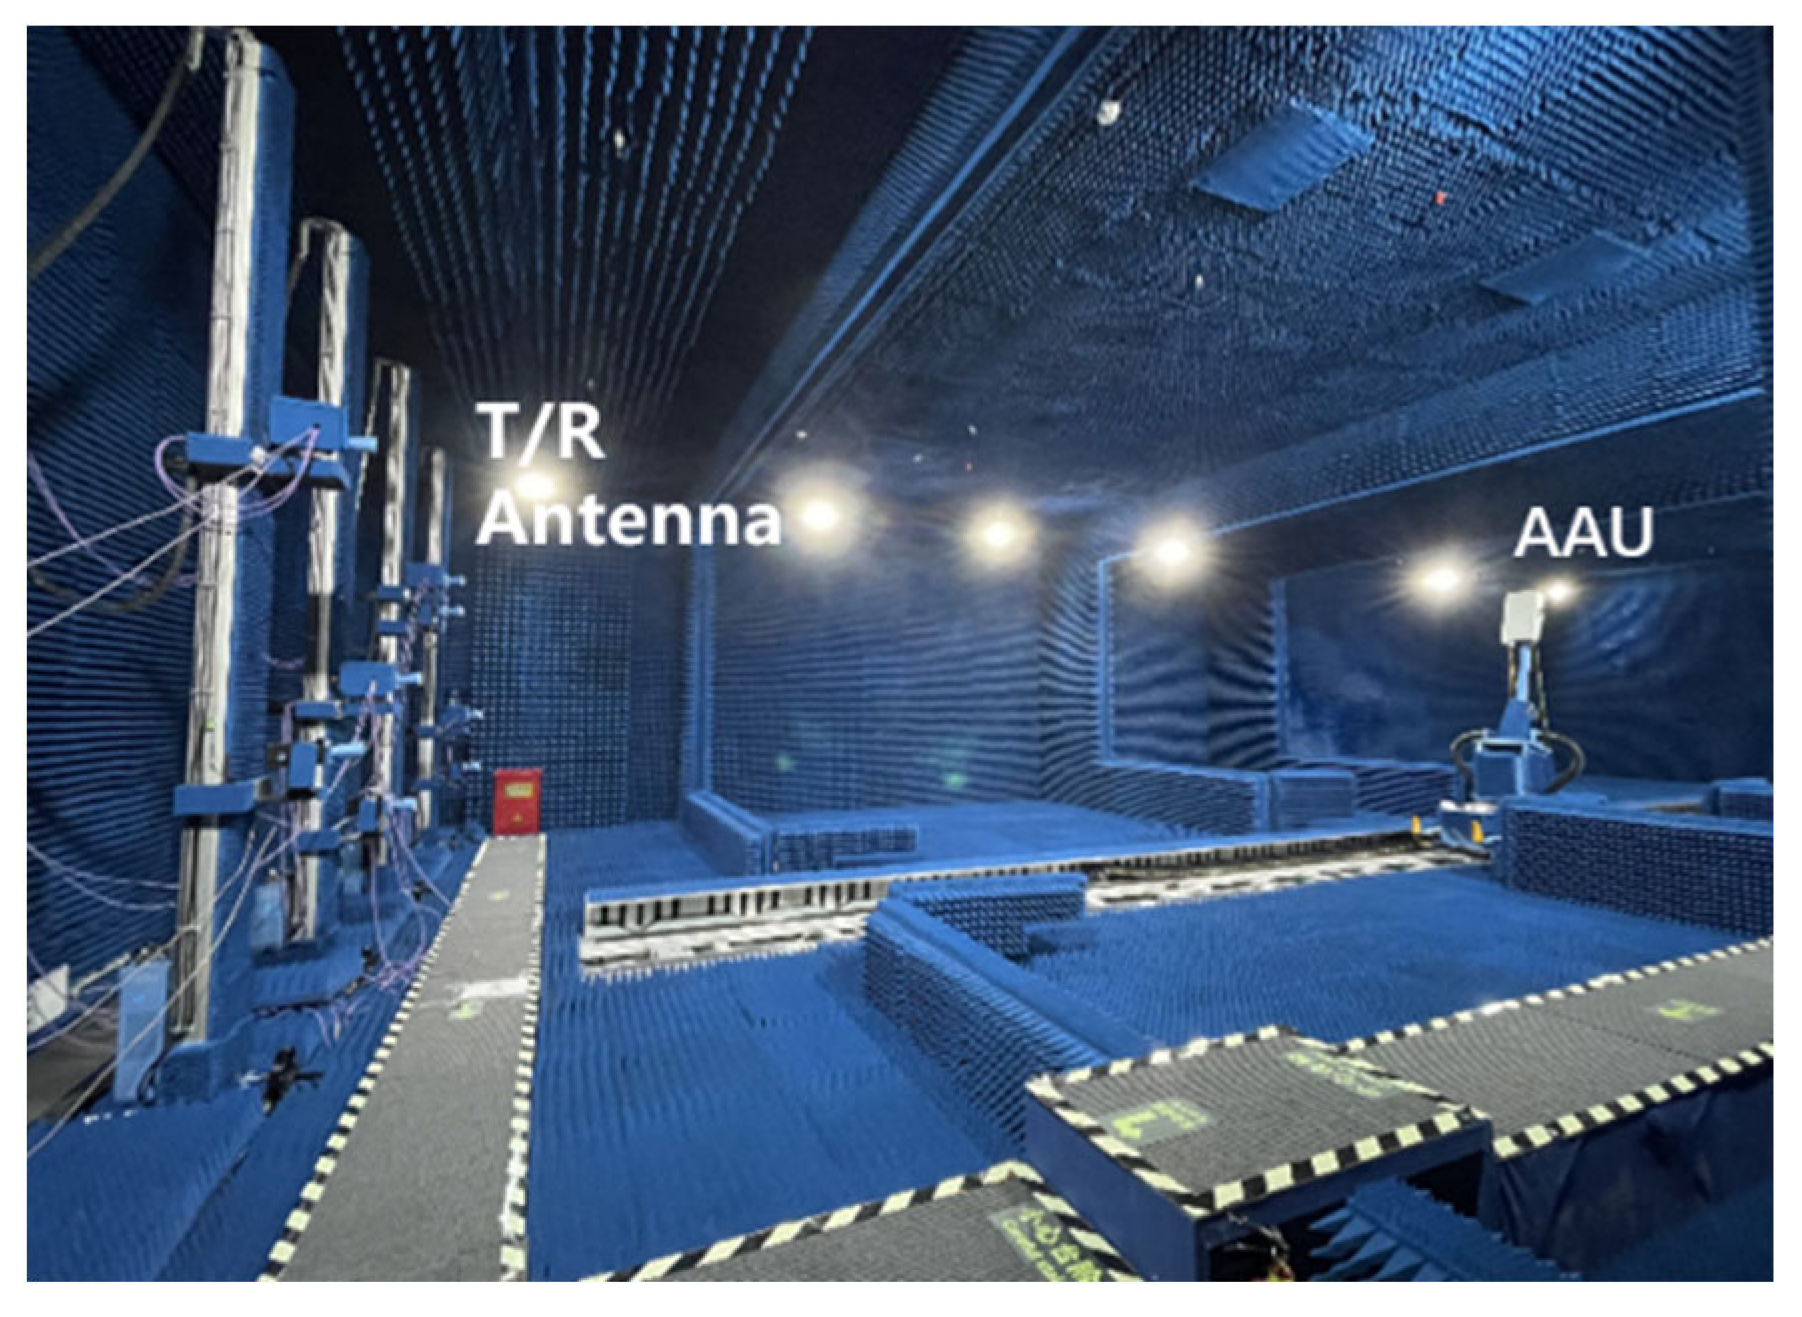
4.1. Ideal OTA Test Environment
4.2. Single Base Station OTA Test
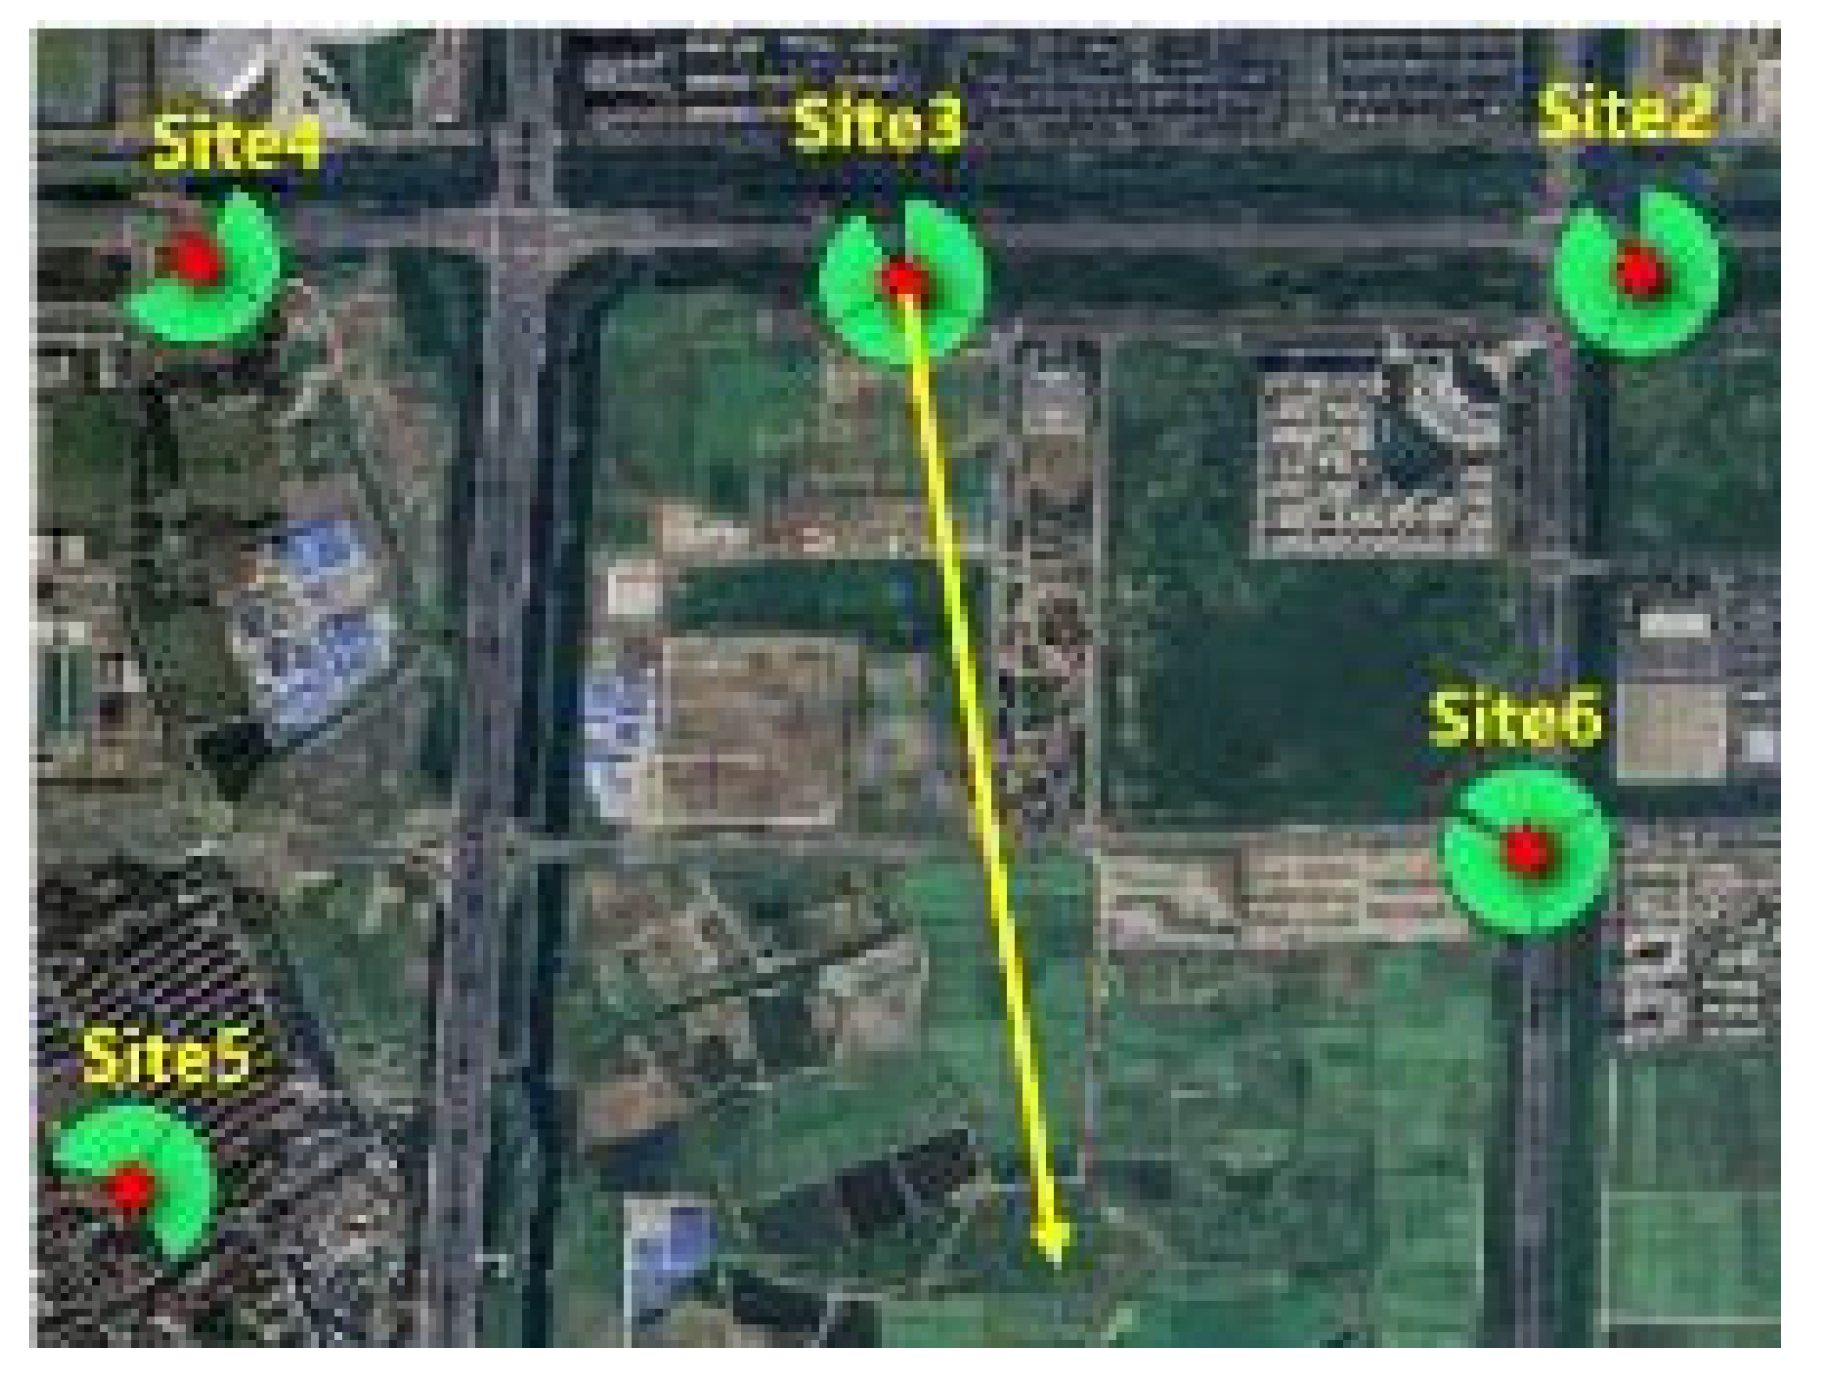
4.3. Real-World Scenario Test Environment
4.4. Single Base Station Sensing Validation
4.5. Networked Sensing Validation
5. Conclusions
Author Contributions
Funding
Data Availability Statement
Acknowledgments
Conflicts of Interest
Abbreviations
| 2D | Two-dimensional |
| 3D | Three-dimensional |
| AAU | Active antenna unit |
| BBU | Baseband unit |
| CoMP-JT | Coordinated multi-point joint transmission |
| FOV | Field of view |
| ISAC | Integrated sensing and communication |
| LOS | Line-of-sight |
| mmW | Millimeter wave |
| multi-BS | Multi-base station |
| NLOS | Non-line-of-sight |
| OTA | Over-the-air |
| RCS | Radar cross-section |
| RSRP | Reference signal receiving power |
| SCA | Successive convex approximation |
| SNR | Signal-to-noise ratio |
| UAV | Unmanned aerial vehicle |
References
- Nwaogu, J.M.; Yang, Y.; Chan, A.P.; Chi, H.L. Application of drones in the architecture, engineering, and construction (AEC) industry. Autom. Constr. 2023, 150, 104827. [Google Scholar] [CrossRef]
- Mei, X.; Miao, F.; Wang, W.; Wu, H.; Han, B.; Wu, Z.; Chen, X.; Xian, J.; Zhang, Y.; Zang, Y. Enhanced Target Localization in the Internet of Underwater Things through Quantum-Behaved Metaheuristic Optimization with Multi-Strategy Integration. J. Mar. Sci. Eng. 2024, 12, 1024. [Google Scholar] [CrossRef]
- Miao, F.; Li, H.; Yan, G.; Mei, X.; Wu, Z.; Zhao, W.; Liu, T.; Zhang, H. Optimizing UAV Path Planning in Maritime Emergency Transportation: A Novel Multi-Strategy White Shark Optimizer. J. Mar. Sci. Eng. 2024, 12, 1207. [Google Scholar] [CrossRef]
- Markets and Markets. Smart Cities Market Analysis, Industry Size and Forecast, High Tech, Enterprise & Consumer IT; Markets and Markets: Pune, India, 2022. [Google Scholar]
- China Telecom Corporation Limited. White Paper on Integrated Air-Ground 5G-Enhanced Low-Altitude Network. In Proceedings of the Global System for Mobile Communications Association (GSMA) Mobile World Congress (MWC), Barcelona, Spain, 24–29 February 2024.
- Li, R.; Xiao, Z.; Zeng, Y. Toward Seamless Sensing Coverage for Cellular Multi-Static Integrated Sensing and Communication. IEEE Trans. Wirel. Commun. 2024, 23, 5363–5376. [Google Scholar]
- Zuo, M.; Wu, Y.H.; Cheng, J. Research on Coverage Schemes and Deployment Strategies for Low-Altitude 5G Networks. Electron. Technol. Softw. Eng. 2022, 20, 32–35. [Google Scholar]
- Fan, C.X. Principles of Communications, 7th ed.; National Defense Industry Press: Beijing, China, 2013; p. 45. [Google Scholar]
- China Mobile Fujian Co., Ltd.; China Mobile Communications Group Co., Ltd.; Chengdu Industrial Research Institute Branch; HuaWei Technologies Co., Ltd. White Paper on 3D Coverage Network for Drones Based on 5G Communication Technology. In Proceedings of the Global System for Mobile Communications Association (GSMA) Mobile World Congress (MWC), Barcelona, Spain, 28 February–3 March 2022. [Google Scholar]
- Zhen, Z.G.; Ji, G.Q. Research on Private Networks for 5G Low-Altitude Coverage. In Proceedings of the 2018 5G Network Innovation Seminar, Beijing, China, 23 August 2018. [Google Scholar]
- IMT-2020 (5G) Promotion Group. 5G-Advanced Integrated Sensing and Communication Air Interface Technology Solution Research Report, 2nd ed.; IMT-2020 (5G) Promotion Group: Beijing, China, 2024. [Google Scholar]
- Qu, S.H.; Xu, L.F.; Cheng, S.W. Research on the Detection Performance of Low-Altitude UAVs Using 5G-A Integrated Communication and Sensing Technology. Telecom Eng. Tech. Stand. 2024, 37, 75–80. [Google Scholar]
- Li, R.; Xiao, Z.; Zeng, Y. Beamforming towards seamless sensing coverage for cellular integrated sensing and communication. In Proceedings of the 2022 IEEE International Conference on Communications Workshops (ICC Workshops), Seoul, Republic of Korea, 16–20 May 2022. [Google Scholar]
- Lei, Z.; Chen, X.; Tan, Y. A Coverage Model of FMCW Radar for Optimizing Sensor Network Deployment. IEEE/ASME Trans. Mechatron. 2024, 29, 2991–3000. [Google Scholar] [CrossRef]
- Wang, B.; Wang, Y.; Li, N.; Zhu, J.; She, X.; Chen, P. On Collaborative Sensing of Cellular Networks Under Mutual Signal Interference. IEEE Wirel. Commun. Lett. 2024, 13, 2531–2535. [Google Scholar] [CrossRef]
- Zhao, L.B.; Luo, H.L.; Gao, F.F. Integrated Sensing, Communication, and Computing for Low-Altitude UAV Networks: A Base Station-Centric Approach. Mob. Commun. 2024, 48, 57–63+70. [Google Scholar]
- Wang, X.; Han, Z.; Jin, J.; Xi, R.; Wang, Y.; Han, L.; Ma, L.; Lou, M.; Gui, X.; Wang, Q.; et al. Multistatic Integrated Sensing and Communication System Based on Macro–Micro Cooperation. Sensors 2024, 24, 2498. [Google Scholar] [CrossRef] [PubMed]
- Azari, M.M.; Rosas, F.; Chiumento, A.; Pollin, S. Coexistence of Terrestrial and Aerial Users in Cellular Networks. In Proceedings of the 2017 IEEE Globecom Workshops (GC Wkshps), Singapore, 4–8 December 2017. [Google Scholar]
- Goddemeier, N.; Daniel, K.; Wietfeld, C. Coverage evaluation of wireless networks for Unmanned Aerial Systems. In Proceedings of the 2010 IEEE Globecom Workshops, Miami, FL, USA, 6–10 December 2010. [Google Scholar]
- Lyu, J.; Zhang, R. Network-Connected UAV: 3-D System Modeling and Coverage Performance Analysis. IEEE Internet Things J. 2019, 6, 7048–7060. [Google Scholar] [CrossRef]
- Elnoubi, S.M. Three-dimensional cellular systems for air/ground personal communication. IEEE Trans. Veh. Technol. 2005, 54, 1923–1931. [Google Scholar] [CrossRef]
- Cho, H.; Chung, J.H.; Sung, D.K. Four-sector cross-shaped urban microcellular systems with intelligent switched-beam antennas. IEEE Trans. Veh. Technol. 2001, 50, 592–604. [Google Scholar]
- Wang, L.C.; Leung, K.K. A high-capacity wireless network by quad-sector cell and interleaved channel assignment. IEEE J. Sel. Areas Commun. 2000, 18, 472–480. [Google Scholar]
- Chen, S. Discussion on Establishing Wireless Three-dimensional Communication Network in Low Altitude Airspace. Commun. Technol. 2022, 55, 1456–1463. [Google Scholar]
- Zhao, J.X.; Ruan, X.B. Discussion on Low-Altitude Coverage Networking for UAV IoT Based on 5G Communication. Guangxi Commun. Technol. 2022, 4, 1–8. [Google Scholar]
- Fan, M.B.; Zhang, Y.; Li, R.F. Research on 5G-A Integrated Sensing and Communication Networking Strategies for Low-Altitude Applications. Commun. World 2024, 17, 32–36. [Google Scholar]
- Ding, L.F.; Geng, F.L.; Chen, J.C. Principles of Radar, 6th ed.; Publishing House of Electronics Industry: Beijing, China, 2020; p. 174. [Google Scholar]
- 3GPP. “Study on Channel Model for Frequencies from 0.5 to 100 GHz”, 3rd Generation Partnership Project (3GPP), Technical Report (TR) 38.901, 03 04 2022, Version 18.0.0. Available online: https://portal.3gpp.org/desktopmodules/Specifications/SpecificationDetails.aspx?specificationId=3173 (accessed on 6 February 2025).
- 3GPP. “Study on Integrated Sensing and Communication”, 3rd Generation Partnership Project (3GPP), Technical Report (TR) 22.837, 28 06 2024, Version 19.4.0. Available online: https://portal.3gpp.org/desktopmodules/Specifications/SpecificationDetails.aspx?specificationId=4044 (accessed on 6 February 2025).


| System | Frequency (GHz) | Bandwidth (MHz) | Band No. | Duplex Mode |
|---|---|---|---|---|
| 5G-A | 26 | 20 | n257 | TDD |
| Notation | Parameter | System Value |
|---|---|---|
| σ | RCS of the target | 0.01 m2 |
| Transmission power | 40 dB | |
| Reception antenna gains | 35 dB | |
| Transmission antenna gains | 35 dB | |
| Total cumulative number of signals | 64 | |
| τ | Total transmission duration of signals | 4 μs |
| L | RV processing loss | 4 dB |
| Number of neighboring stations | 0 |
| Test Data | Results (m) |
|---|---|
| 0.02 | |
| 1001.71 | |
| 0.08 | |
| 992.42 | |
| 0.01 | |
| 1005.56 | |
| 0.05 | |
| 1001.20 | |
| 0.04 | |
| 1000.22 |
| Test Data | Recorded Value (°) | Theoretical Value (°) |
|---|---|---|
| 59.95 | 60 | |
| 40.28 | 40 |
| Flight Path | Sensing Range | Sensing Accuracy at CDF 95% | |||||||||
|---|---|---|---|---|---|---|---|---|---|---|---|
| Flight Direction | Flight Height (m) | Nearest Radial Distance (m) | Nearest Horizontal Distance (m) | Farthest Radial Distance (m) | Farthest Horizontal Distance (m) | Nearest Theoretical Radial Distance (m) | Nearest Theoretical Horizontal Distance (m) | Farthest Theoretical Radial Distance (m) | Farthest Theoretical Horizontal Distance (m) | Horizontal Positioning Accuracy (m) | Vertical Positioning Accuracy (m) |
| Normal /O1A1 | 30 | 4.5 | 4.5 | 1051.4 | 1051.4 | 0.0 | 0.0 | 1000.0 | 1000.0 | 6.82 | 2.33 |
| Normal/O2A2 | 100 | 100.8 | 75.4 | 1052.7 | 1050.4 | 108.9 | 83.4 | 1002.4 | 1000.0 | 6.86 | 2.88 |
| Normal/O3A3 | 300 | 390.3 | 295.8 | 1068.7 | 1034.0 | 420.0 | 321.8 | 1035.8 | 1000.0 | 7.5 | 3.17 |
| 60°/O1P1 | 30 | 4.5 | 4.5 | 360.1 | 360.1 | 0.0 | 0.0 | 333.3 | 333.3 | 5.86 | 2.89 |
| 60°/O2P2 | 100 | N/A | Out of the sensing range | N/A | |||||||
| 60°/O3P3 | 300 | N/A | Out of the sensing range | N/A | |||||||
| Flight Path | Error Measurement of the Sensing Range | Sensing Accuracy at CDF 95% | |||||
|---|---|---|---|---|---|---|---|
| Flight Direction | Flight Height (m) | Nearest Radial Distance | Nearest Horizontal Distance | Farthest Radial Distance | Farthest Horizontal Distance | Horizontal Positioning Accuracy (m) | Vertical Positioning Accuracy (m) |
| Normal /O1A1 | 30 | 4.5m | 4.5m | 5.14% | 5.14% | 6.82 | 2.33 |
| Normal/O2A2 | 100 | 7.44% | 9.59% | 5.02% | 5.04% | 6.86 | 2.88 |
| Normal/O3A3 | 300 | 7.07% | 8.08% | 3.18% | 3.4% | 7.5 | 3.17 |
| 60°/O1P1 | 30 | 4.5m | 4.5m | 8.04% | 8.04% | 5.86 | 2.89 |
| Flight Direction | Sensing Range | Sensing Accuracy at CDF 95% | ||||||
|---|---|---|---|---|---|---|---|---|
| (0°, 40°)/O1C | Measured farthest radial distance (m) | Theoretical radial distance (m) | Error percentage (%) | Measured nearest radial distance (m) | Theoretical nearest sensing radial distance (m) | Error value (m) | Horizontal positioning accuracy (m) | Vertical positioning accuracy (m) |
| 420.7 | 420.0 | 0.17 | 2.2 | 0 | 2.2 | 2.31 | 2.14 | |
| Test Point (m) | Measured Minimum Height (m) | Theoretical Minimum Sensing Height (m) | Error Percentage (%) | Measured Maximum Height (m) | Theoretical Maximum Sensing Height (m) | Error Percentage (%) | Horizontal Positioning Accuracy at CDF 95% (m) | Vertical Positioning Accuracy at CDF 95% (m) |
|---|---|---|---|---|---|---|---|---|
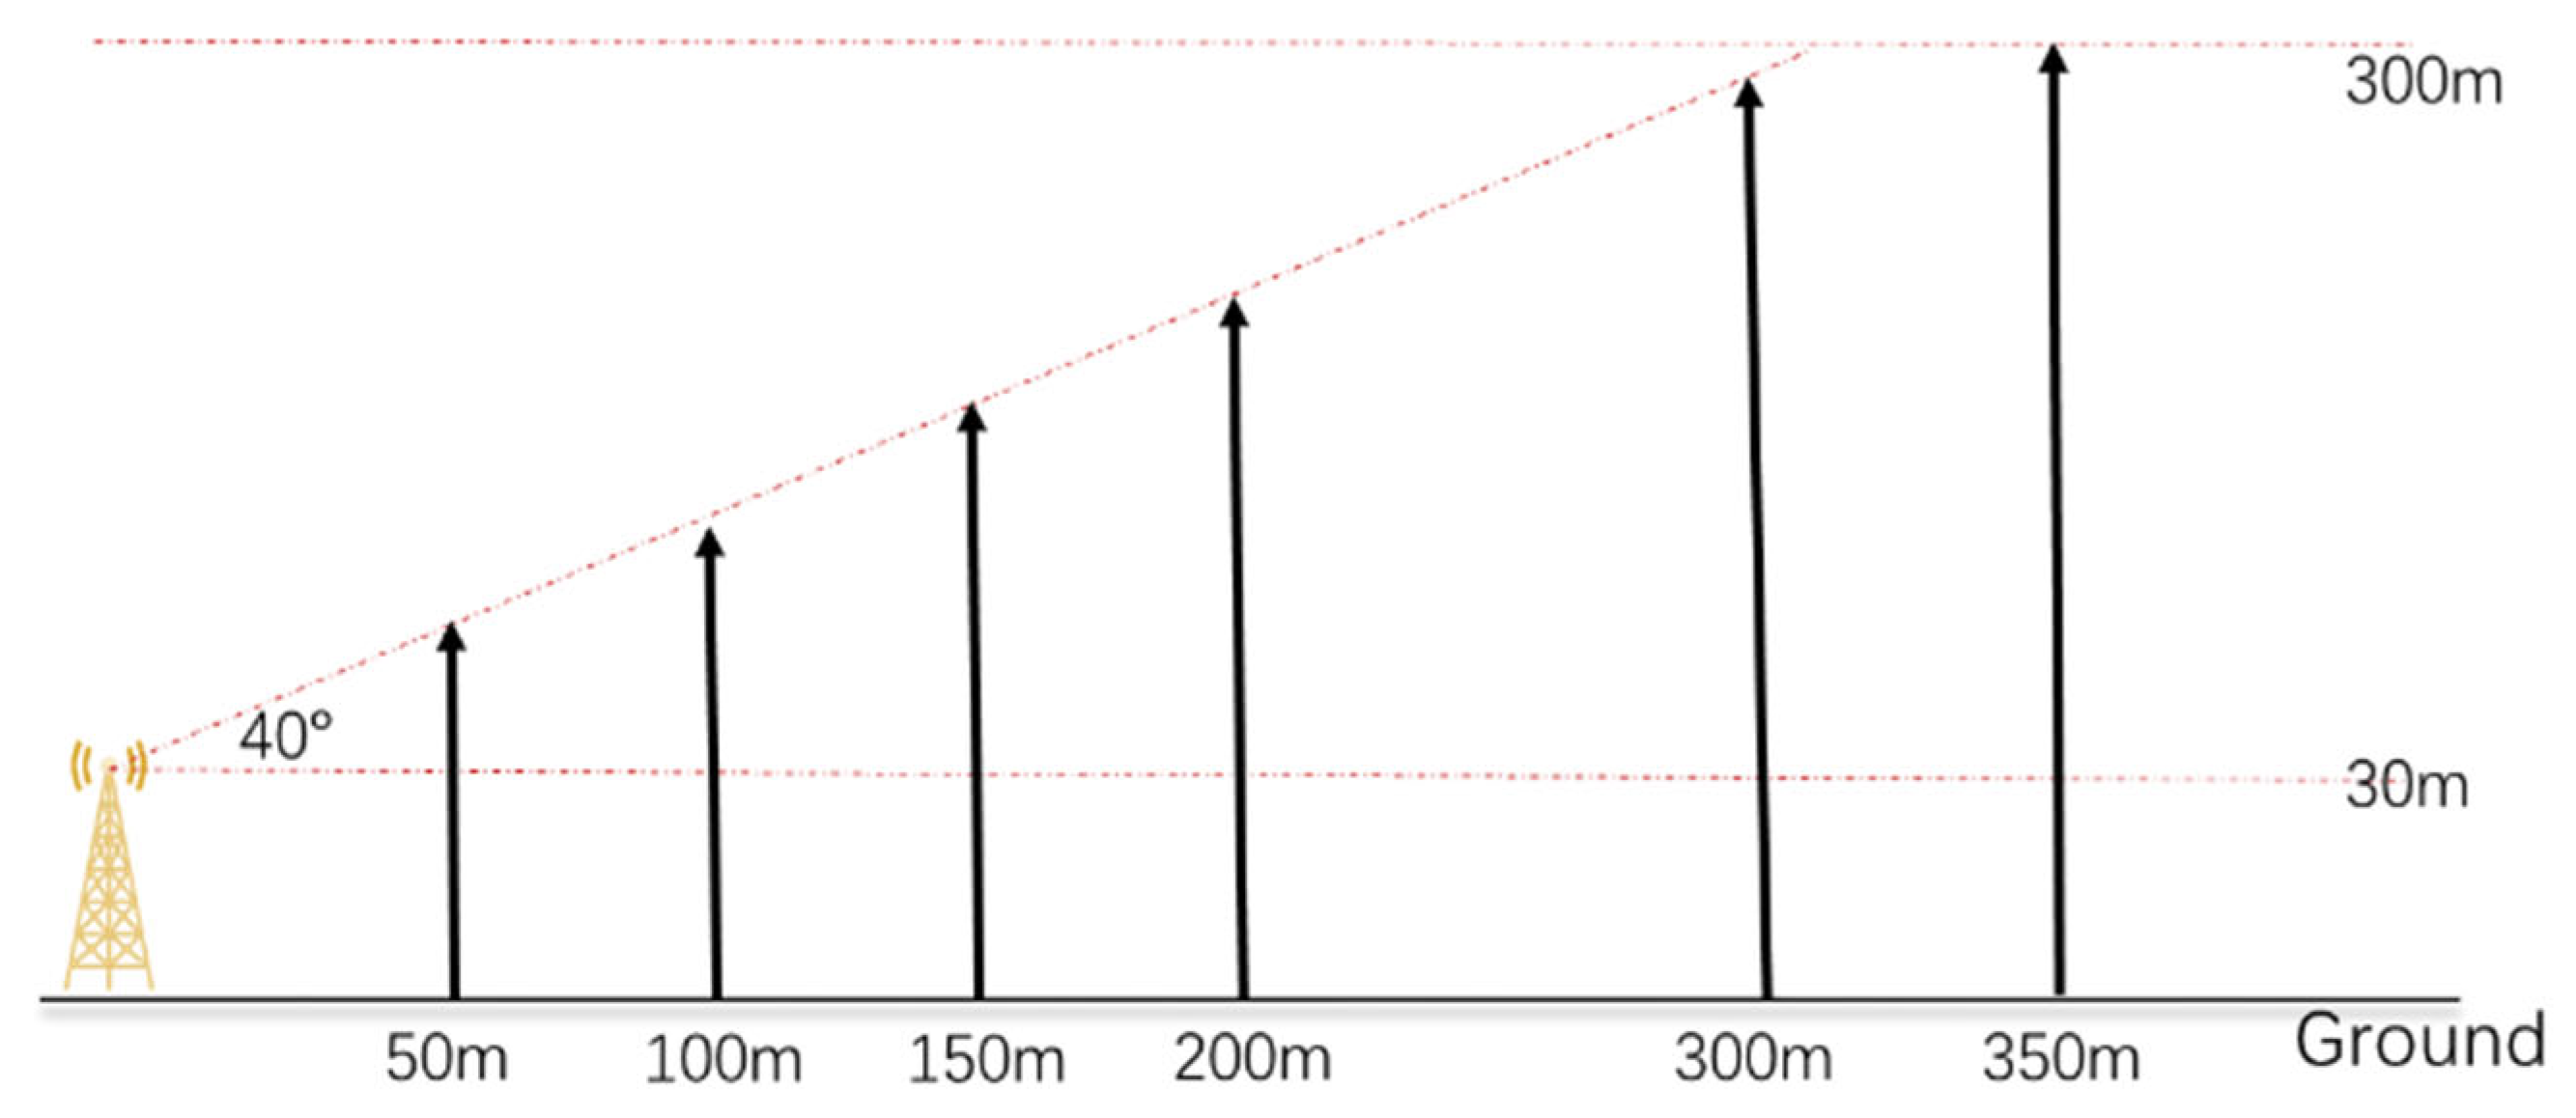
| 50 | 30.6 | 30 | 2 | 73.1 | 72.0 | 1.53 | 2.41 | 2.34 |
| 100 | 30.7 | 2.33 | 115.2 | 113.9 | 1.14 | 2.45 | 4.23 | |
| 150 | 30.5 | 1.67 | 156.6 | 155.9 | 0.45 | 2.58 | 4.98 | |
| 200 | 30.5 | 1.67 | 199.9 | 197.8 | 1.06 | 3.26 | 3.93 | |
| 300 | 31.1 | 3.67 | 281.8 | 281.7 | 0.04 | 3.11 | 2.94 | |
| 350 | 30.6 | 2 | 301.0 | 300 | 0.33 | 3.34 | 3.74 |
| Height (m) | Horizontal Positioning Accuracy at CDF 95% (m) | Vertical Positioning Accuracy at CDF 95% (m) |
|---|---|---|
| 100 m | 8.49 | 4.51 |
| 300 m | 8.72 | 4.78 |
Disclaimer/Publisher’s Note: The statements, opinions and data contained in all publications are solely those of the individual author(s) and contributor(s) and not of MDPI and/or the editor(s). MDPI and/or the editor(s) disclaim responsibility for any injury to people or property resulting from any ideas, methods, instructions or products referred to in the content. |
© 2025 by the authors. Licensee MDPI, Basel, Switzerland. This article is an open access article distributed under the terms and conditions of the Creative Commons Attribution (CC BY) license (https://creativecommons.org/licenses/by/4.0/).
Share and Cite
Li, X.; Ding, X.; Xie, W.; Wang, W.; Yu, J.; Dong, W.-Y. Low-Altitude Sensing Model: Analysis Leveraging ISAC in Real-World Environments. Drones 2025, 9, 283. https://doi.org/10.3390/drones9040283
Li X, Ding X, Xie W, Wang W, Yu J, Dong W-Y. Low-Altitude Sensing Model: Analysis Leveraging ISAC in Real-World Environments. Drones. 2025; 9(4):283. https://doi.org/10.3390/drones9040283
Chicago/Turabian StyleLi, Xiao, Xue Ding, Weiliang Xie, Wenbo Wang, Jinyang Yu, and Wen-Yu Dong. 2025. "Low-Altitude Sensing Model: Analysis Leveraging ISAC in Real-World Environments" Drones 9, no. 4: 283. https://doi.org/10.3390/drones9040283
APA StyleLi, X., Ding, X., Xie, W., Wang, W., Yu, J., & Dong, W.-Y. (2025). Low-Altitude Sensing Model: Analysis Leveraging ISAC in Real-World Environments. Drones, 9(4), 283. https://doi.org/10.3390/drones9040283