Abstract
Unmanned aerial vehicle (UAV) remote sensing has become an important tool for modern remote sensing technology with its low cost and high flexibility. Sun glitter (SG) remote sensing based on satellite platforms shows great potential in the fields of marine dynamic environment and marine oil spill, but the analysis and application of SG images based on UAV need to be further studied. In this study, we conduct a multi-angle water surface SG remote sensing experiment using multi-UAV and collect images under different observation parameters. Then, we analyze and discuss the SG signal in the multi-angle images, especially the distribution and intensity of SG. In addition, a model for extracting SG signals from images based on region-based dark pixel retrieval is proposed in this study. Since the current Cox-Munk model is only applicable to statistical SG, the extracted SG images are reduced in resolution by mean filtering. Based on the multi-angle SG remote sensing model, the water surface roughness and equivalent refractive index are estimated. The estimated results are compared with measured and literature data. Additionally, the influence of different observation angle combinations on the inversion results is also discussed. The results of the study show that multi-angle SG remote sensing of water surface based on UAVs provides a new idea for the analysis and application of image signals, which has an important role to play.
1. Introduction
With the rapid development of unmanned aerial vehicle (UAV) technology, UAV-based remote sensing has gained significant attention in water environmental monitoring applications, such as oil spill [1,2] and water quality [3,4]. UAVs provide key advantages over traditional satellite-based remote sensing, including higher temporal and spatial resolution, flexibility in flight paths and observation angles, and the ability to capture data from multiple viewpoints [5]. These features make UAVs particularly well-suited for studying dynamic surface phenomena, such as sun glitter (SG) on water surfaces.
SG, which results from the direct reflection of sunlight off the water surface, is highly sensitive to changes in surface roughness, observation angles, and environmental conditions (e.g., refractive index of water surface). Cox and Munk [6] conducted field experiments and introduced a model (the CM model) that established the mathematical connection between SG radiance and the roughness, which is associated with the wind-driven mean square of slope, using a symmetric slope probability density function. This model provided a foundational approach for utilizing SG images. Therefore, SG has become an important role in monitoring oceanic and limnological phenomena, such as internal waves [7,8,9], underwater topography [10,11], and oil spills [12,13,14]. However, traditional satellite-based remote sensing platforms typically capture SG from fixed observation angles, limiting their ability to adapt to changing environmental conditions. Wang et al. [14] used high-resolution multi-angle SG images of the Gulf of Mexico oil spill acquired by the Advanced Spaceborne Thermal Emission and Reflection Radiometer (ASTER) sensor to estimate sea surface roughness and refractive index. However, the lack of high temporal and spatial resolution images does not allow for quantitative analysis of oil spill dispersion and weathering processes. In contrast, UAVs offer the flexibility and continuity to capture SG from multiple angles, potentially improving the accuracy and resolution of SG signal retrieval.
This study aims to explore the potential of UAV-based multi-angle SG remote sensing. An optimal imaging geometry algorithm for multi-angle SG was developed by Wang et al. [15], and the observation parameters for different scenarios of UAV formations were designed through simulation. Based on this, we carry out a multi-angle water surface SG remote sensing experiment using multi-UAV and collect images under different observation parameters. Then, we analyse and discuss the signals in the multi-angle images, especially the distribution and intensity of SG. In addition, a model for extracting SG signal and non-SG signal from images based on region-based dark pixel retrieval is proposed in this study. Currently, the inverse model of water surface roughness (WSR) and equivalent refractive index (ERI) based on SG has been applied to satellite remote sensing images. Therefore, in order to verify the applicability of the model, we estimate the WSR and ERI using SG signals from UAV images, and compare and analyse the estimation results with the measured data and literature data.
2. Data and Processing
2.1. UAV-Based Multi-Angle Sun Glitter Imagery
UAV images are collected over Qiandao Lake in Zhejiang Province of China, 8 October 2020 (Figure 1a). To synchronize the acquisition of multi-angle images, three MAPIR Survey3N multispectral cameras are mounted on two DJI-M600pro UAVs. The specifications of the MAPIR Survey3N camera and DJI-M600PRO UAV are listed in Table 1. The Camera 1 with the nadir view is mounted on UAV 1; Camera 2 and Camera 3 of the forward view () and nadir view are mounted on UAV 2 (Figure 1b). During the experiment, the weather was clear with an almost cloudless. The water surface was calm, and dominated by wind-generated capillary waves.
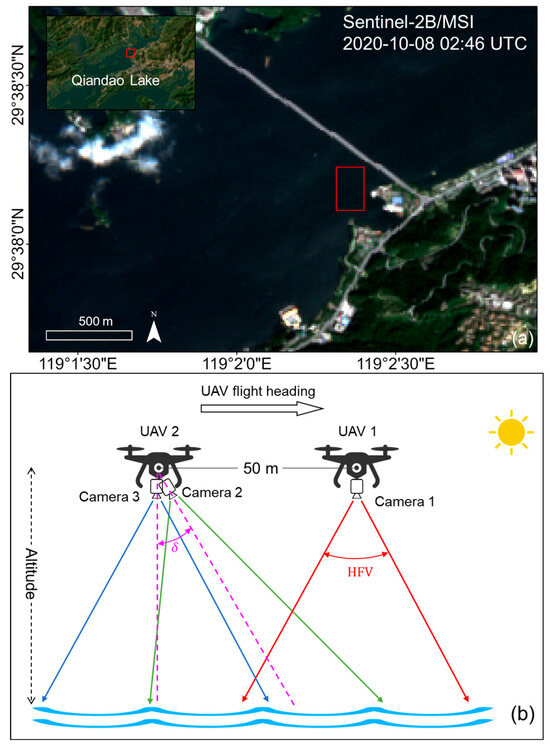
Figure 1.
(a) Location of the experimental site. The red frame indicates the experimental area. (b) Multi-angle view of UAVs flight diagram. The is the forward tilt angle of Camera 2. HFV is horizontal field of view.

Table 1.
Specifications of MAPIR Survey 3N Multispectral Camera and DJI-M600PRO UAV.
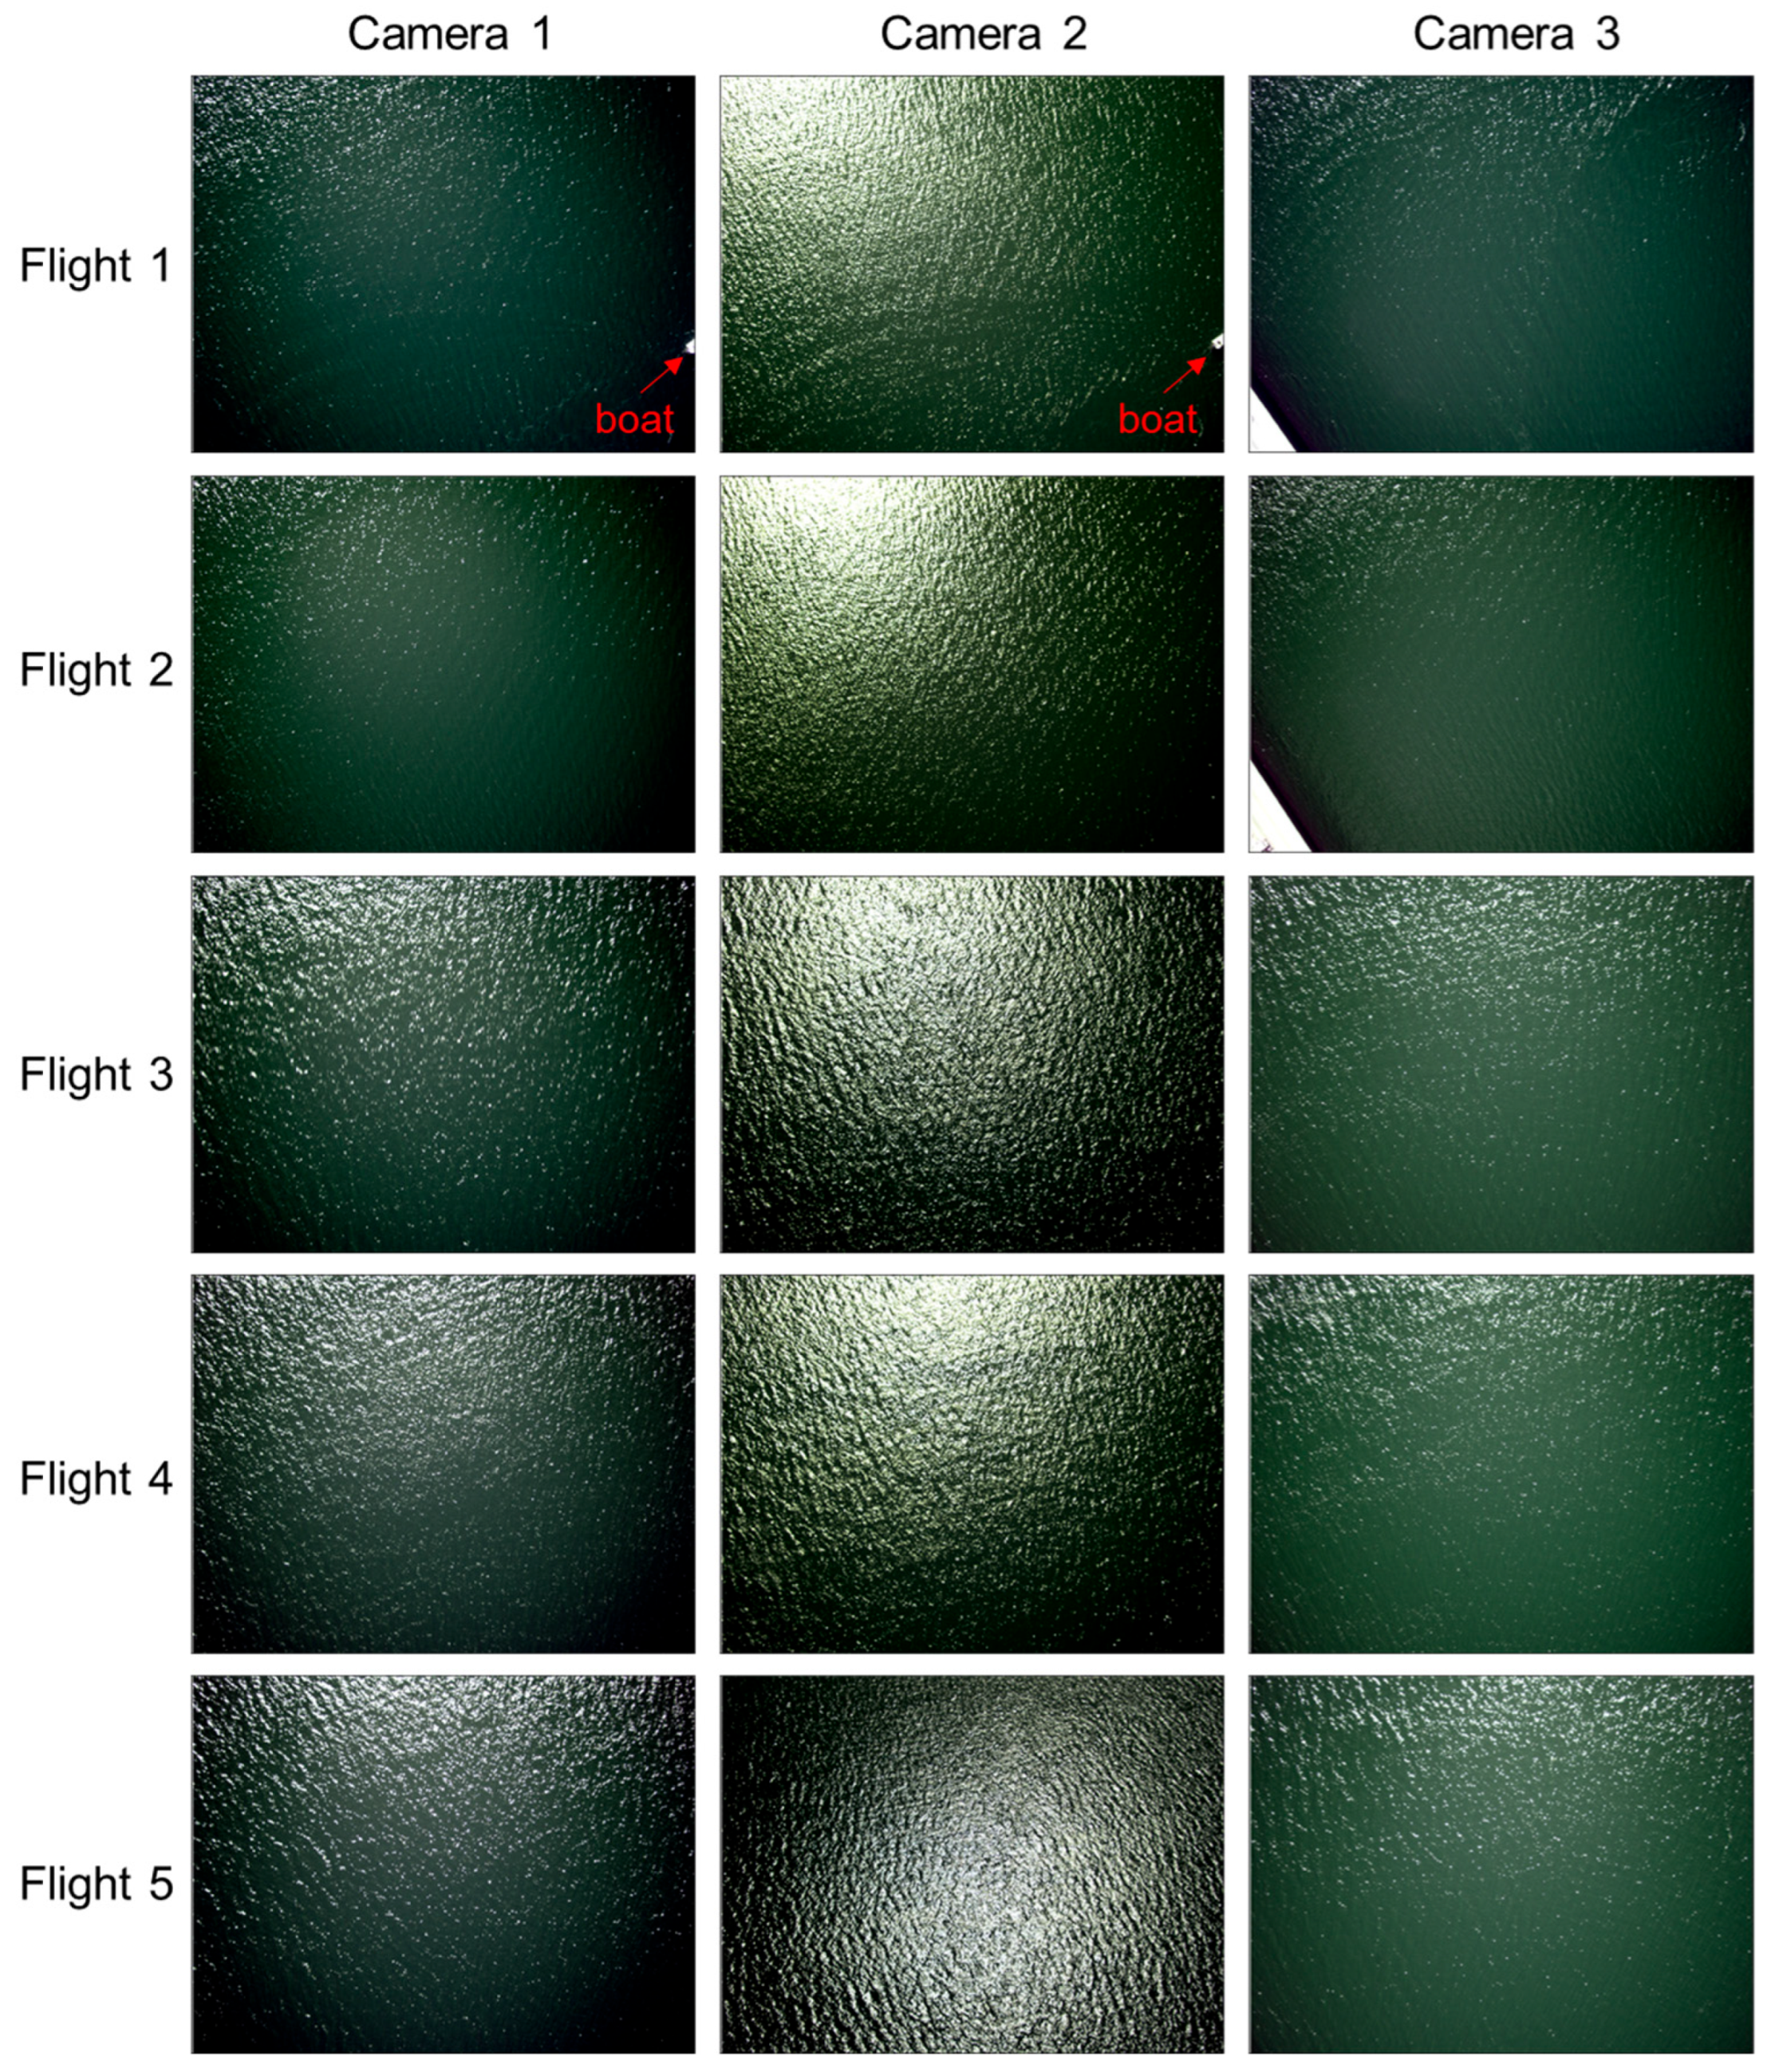
Based on the research of optimal imaging angles for multi-angle SG from Wang et al. [15], five combinations of different flight heights and tilt angles of view were designed (Table 2). The flight commands were set and transmitted to the UAVs. The drones were fully automated during the flight, including the route, flight speed, and camera timed to take pictures. The two UAVs are 50 m apart and conduct the experiment at the same speed and flight direction. The three Survey3N cameras are programmed to capture water surface images at 3-s intervals and collect both RAW data (12 bit per channel) and JPEG images (8 bit per channel). The Survey3N is equipped with a GPS receiver that generates geolocation tags for each image captured. Prior to image processing, Survey3N JPEG images are combined with GPS-tagged RAW images using the MAPIR Camera Control software (version 10162019) to create TIFF files. Survey3N TIFF images are then scaled to reflectance values based on images of the MAPIR Reflectance Reference Calibration Target collected before UAV flights. Figure 2 shows multispectral images (R: 850 nm, G: 660 nm, B: 550 nm) from three cameras for five flights. There is obvious SG signal in the images, but the SG distribution is significantly different for different flight parameters. Each camera of Flight 1–5 contains 32, 34, 35, 32, and 33 images, respectively, with a size of 3000 × 4000 pixels. Images in the near-infrared (NIR, 850 nm) band are used for this study.
Table 2.
UAV flights details for this study.

Figure 2.
False colour RGB composition images (R: 850 nm, G: 660 nm, B: 550 nm) of water surface from multiple cameras on different flights.
In this study, we use three Survey 3N cameras with a horizontal field of view (HFV) of 41°, and Camera 2 is used to acquire images in a tilted view. In order to accurately retrieve the overlapping areas of the multi-angle images, geometric correction and coordinate system unification of the UAV images are required.
The projection of the water surface on the image is offset to varying degrees depending on its imaging position. Figure 3a illustrates the spatial relationship for UAVs imaging. Figure 3b,c show schematic diagrams of the camera imaging at vertically downward and tilted angles, respectively. In this study, the images are corrected based on the physical structure inside the camera and combined with the geometric relationship of the camera shot [16,17]. After geometric correction of the image, the size of the distance between different pixels indicates the distance between two object points on the water surface, i.e., the relative geographic coordinates of the points on the water surface are obtained.
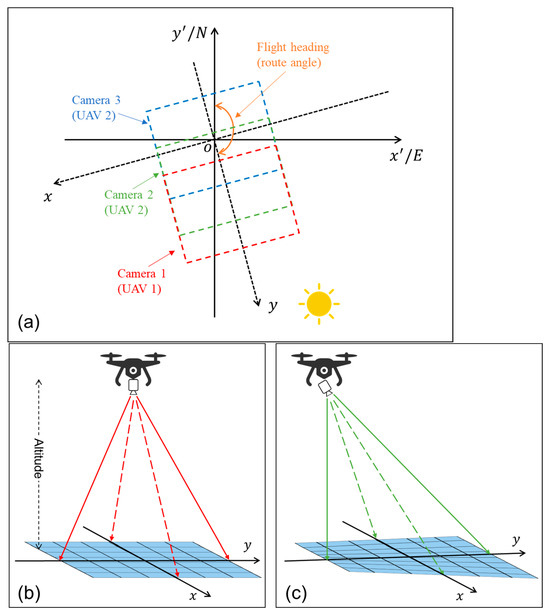
Figure 3.
(a) Spatial relationship for three cameras imaging. Schematic diagrams of vertical (b) and tilted (c) imaging by the camera.
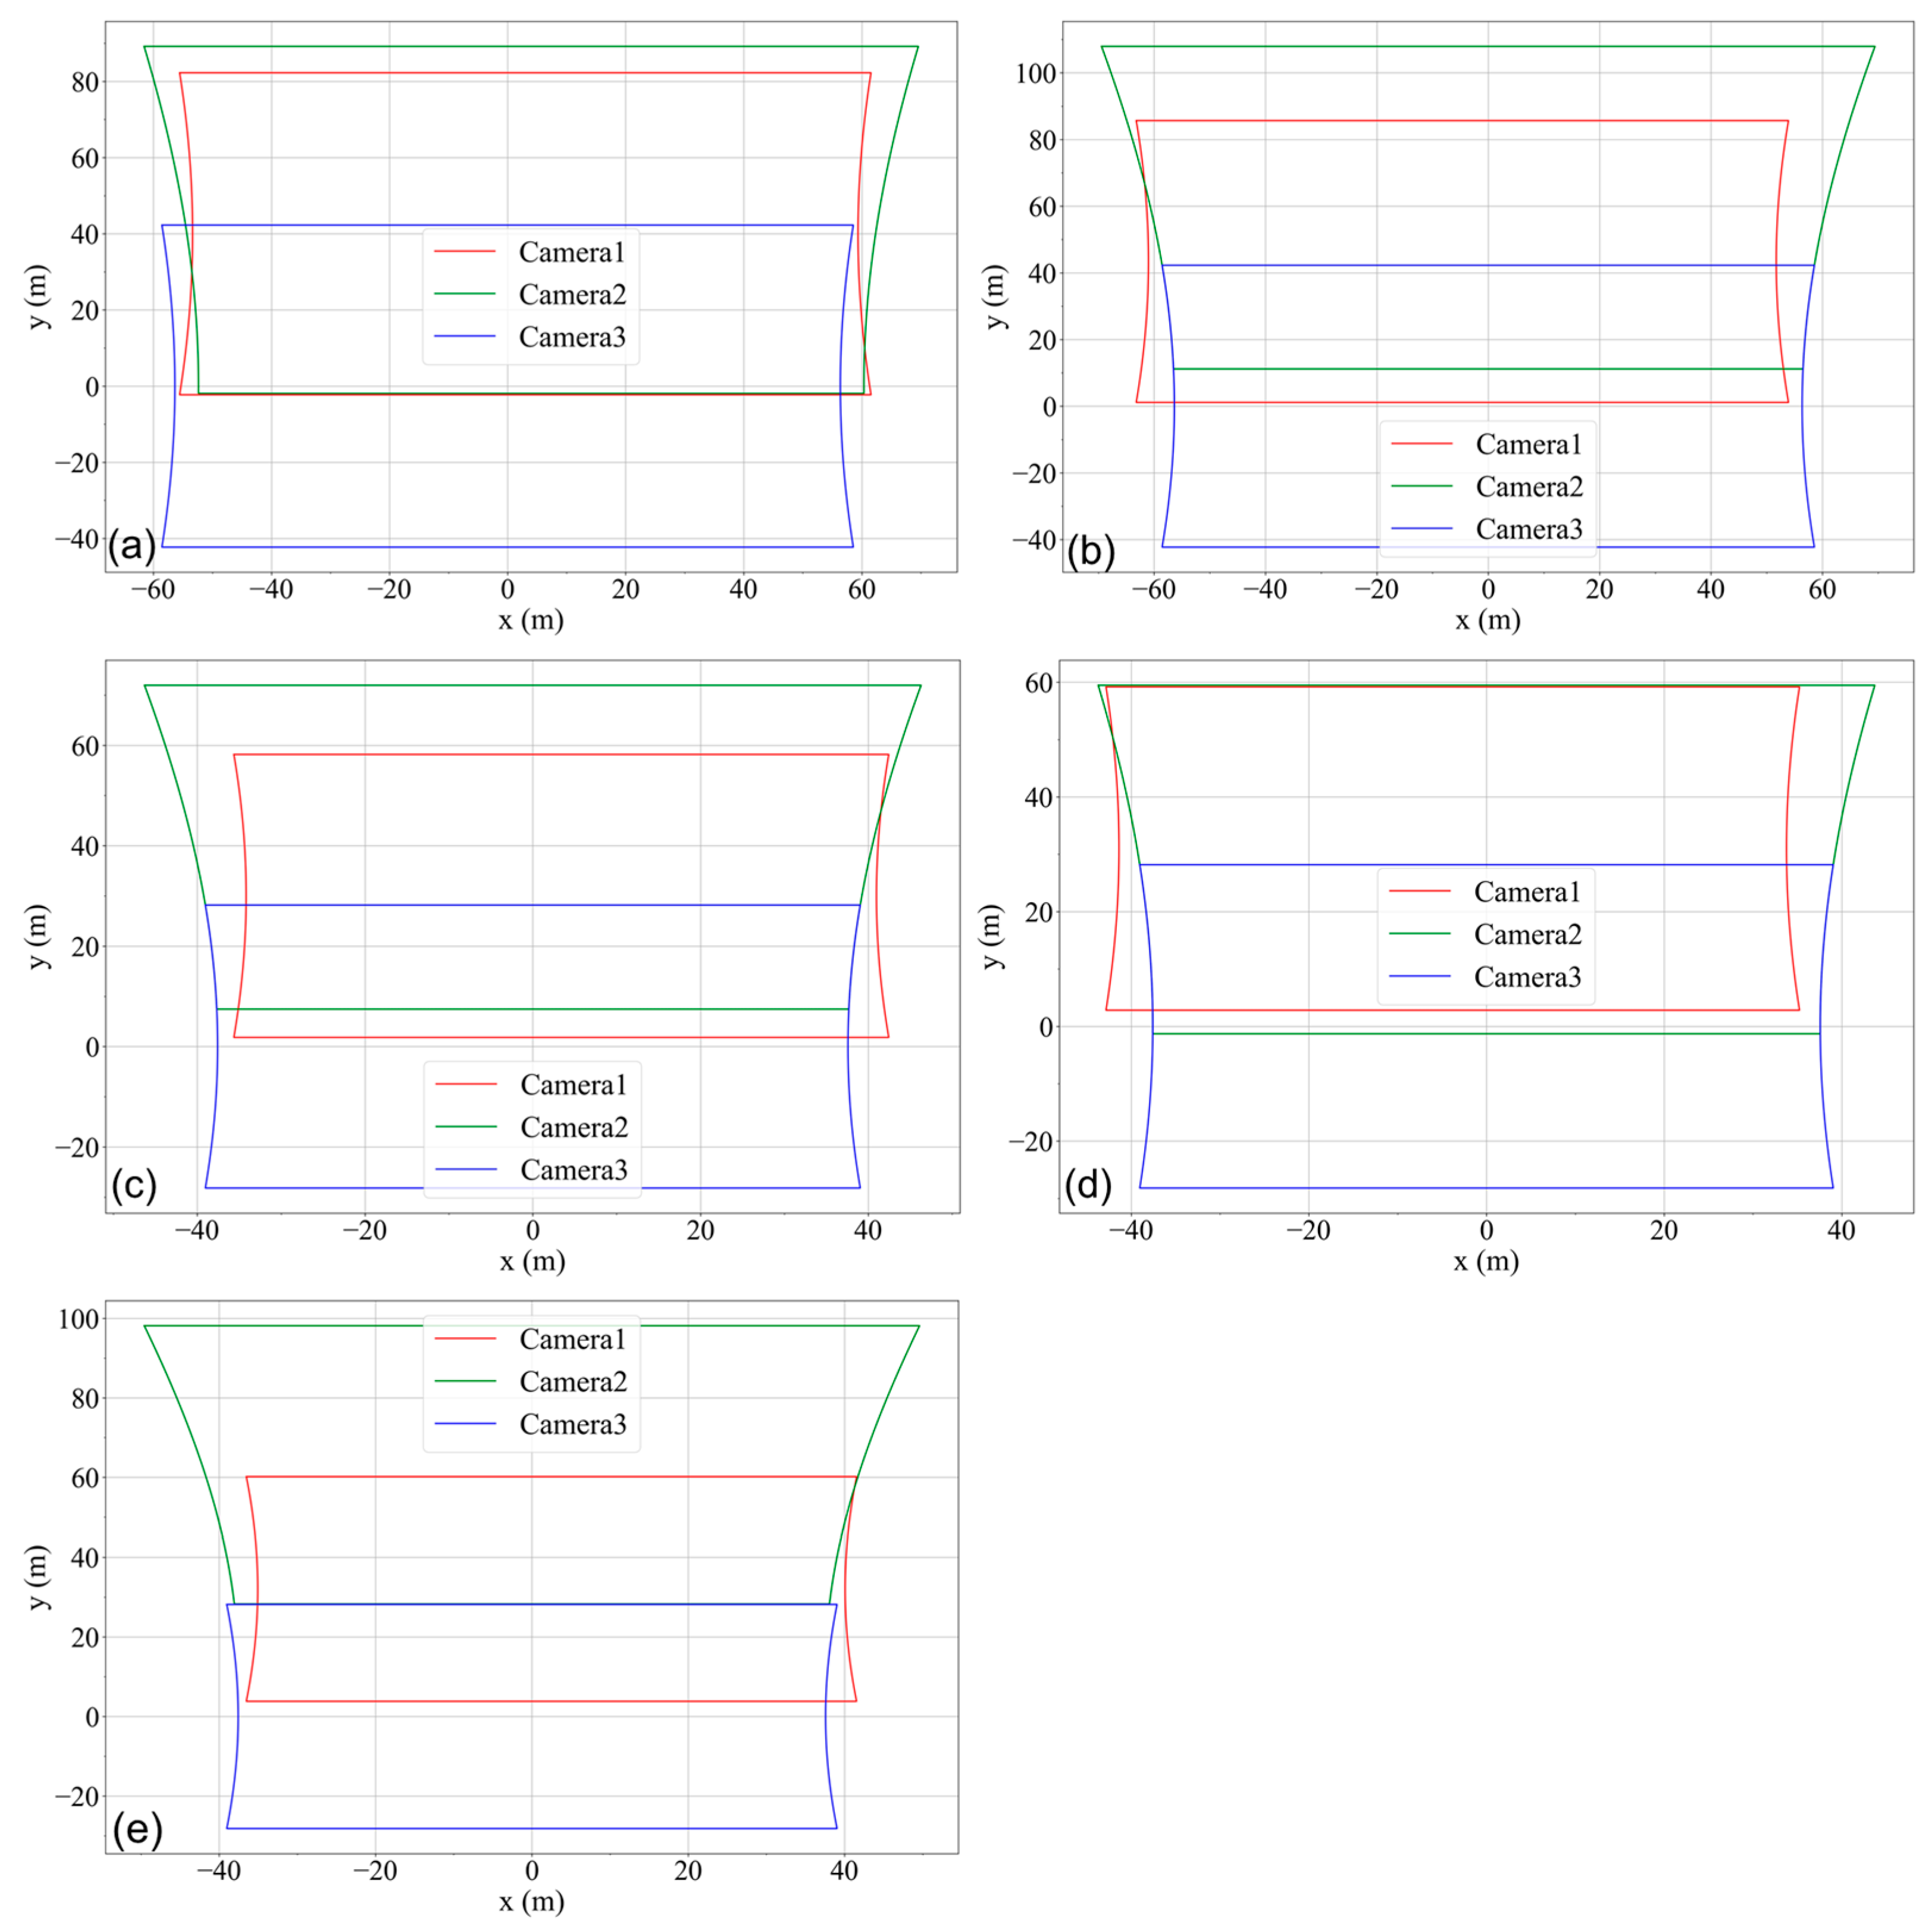
In this study, the angle between the flight direction of the UAV and the north direction is 165°, and the shooting direction of the camera is basically the same as the flight direction of the UAV (Figure 3a). Therefore, a custom heading coordinate system is established using the centre point of the first image captured by Camera 3 as the coordinate origin, the camera heading as the y-axis positive direction, and the vertical camera heading to the right as the x-axis positive direction. At the same time, the GPS receiver records the latitude and longitude of each image. Therefore, the coordinate positions of all images are obtained by converting the difference between the latitude and longitude of the image and the first image into the distance of the customized heading coordinate system using a rotation matrix. The Figure 4a–e illustrate the position of the image of the three cameras of Flight 1, Flight 2, Flight 3, Flight 4 and Flight 5, respectively.
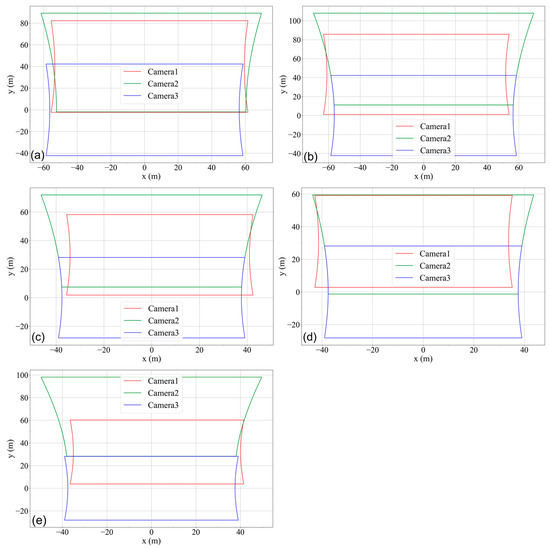
Figure 4.
Positions of the images from the three cameras of Flight 1 (a), Flight 2 (b), Flight 3 (c), Flight 4 (d) and Flight 5 (e) after geometric correction and coordinate transformation.
After geometric correction and coordinate transformation, pixel matching of overlapping regions of multi-angle images is realized.
2.2. Other Data
Sentinel-2B Multi-Spectral Instrument (MSI) acquired a satellite image of the study area on 8 October 2020, at 02:46 UTC. This is very close to the time of Flight 3. The image is then processed to SG reflectance () using the ACOLITE software (version 20190324.0). After atmospheric correction, reflectance images at wavelengths close to the 1600 nm band are used for glint extraction in the Sentinel other bands, since ACOLITE assumes that water-leaving radiance in this band is nearly zero (the method is detailed in [18]). The in the NIR band is used for this study.
During the experiments, we measured wind speed and surface spectra of the study area on a boat. The wind speed at a height of 2 m above the water is recorded synchronously using a Wind Cup Anemometer. Prior to validating the analysis, it is necessary to normalize the in-situ wind speeds to 10 m height. For this purpose, power-law wind profiles for near-neutral atmospheric stability conditions are used as proposed by Hsu et al. [19]. In addition, based on the criteria and steps of Mobley [20] and Tang et al. [21], a PSR-1100f portable spectroradiometer (with 320–1100 nm spectral range, 3 nm spectral resolution) is used for hyperspectral sampling of the water surface and sky. The angle between the instrument observation plane and the plane of solar incidence is 135°, and the angle between the instrument and the direction normal to the water surface is 40°, so that the measurement can be better avoided from direct sunlight reflections, but the swaying of the ship will have a certain effect, resulting in poorer uniformity of sky light [21].
3. Models
3.1. Water Surface Optical Radiation Transmission Model
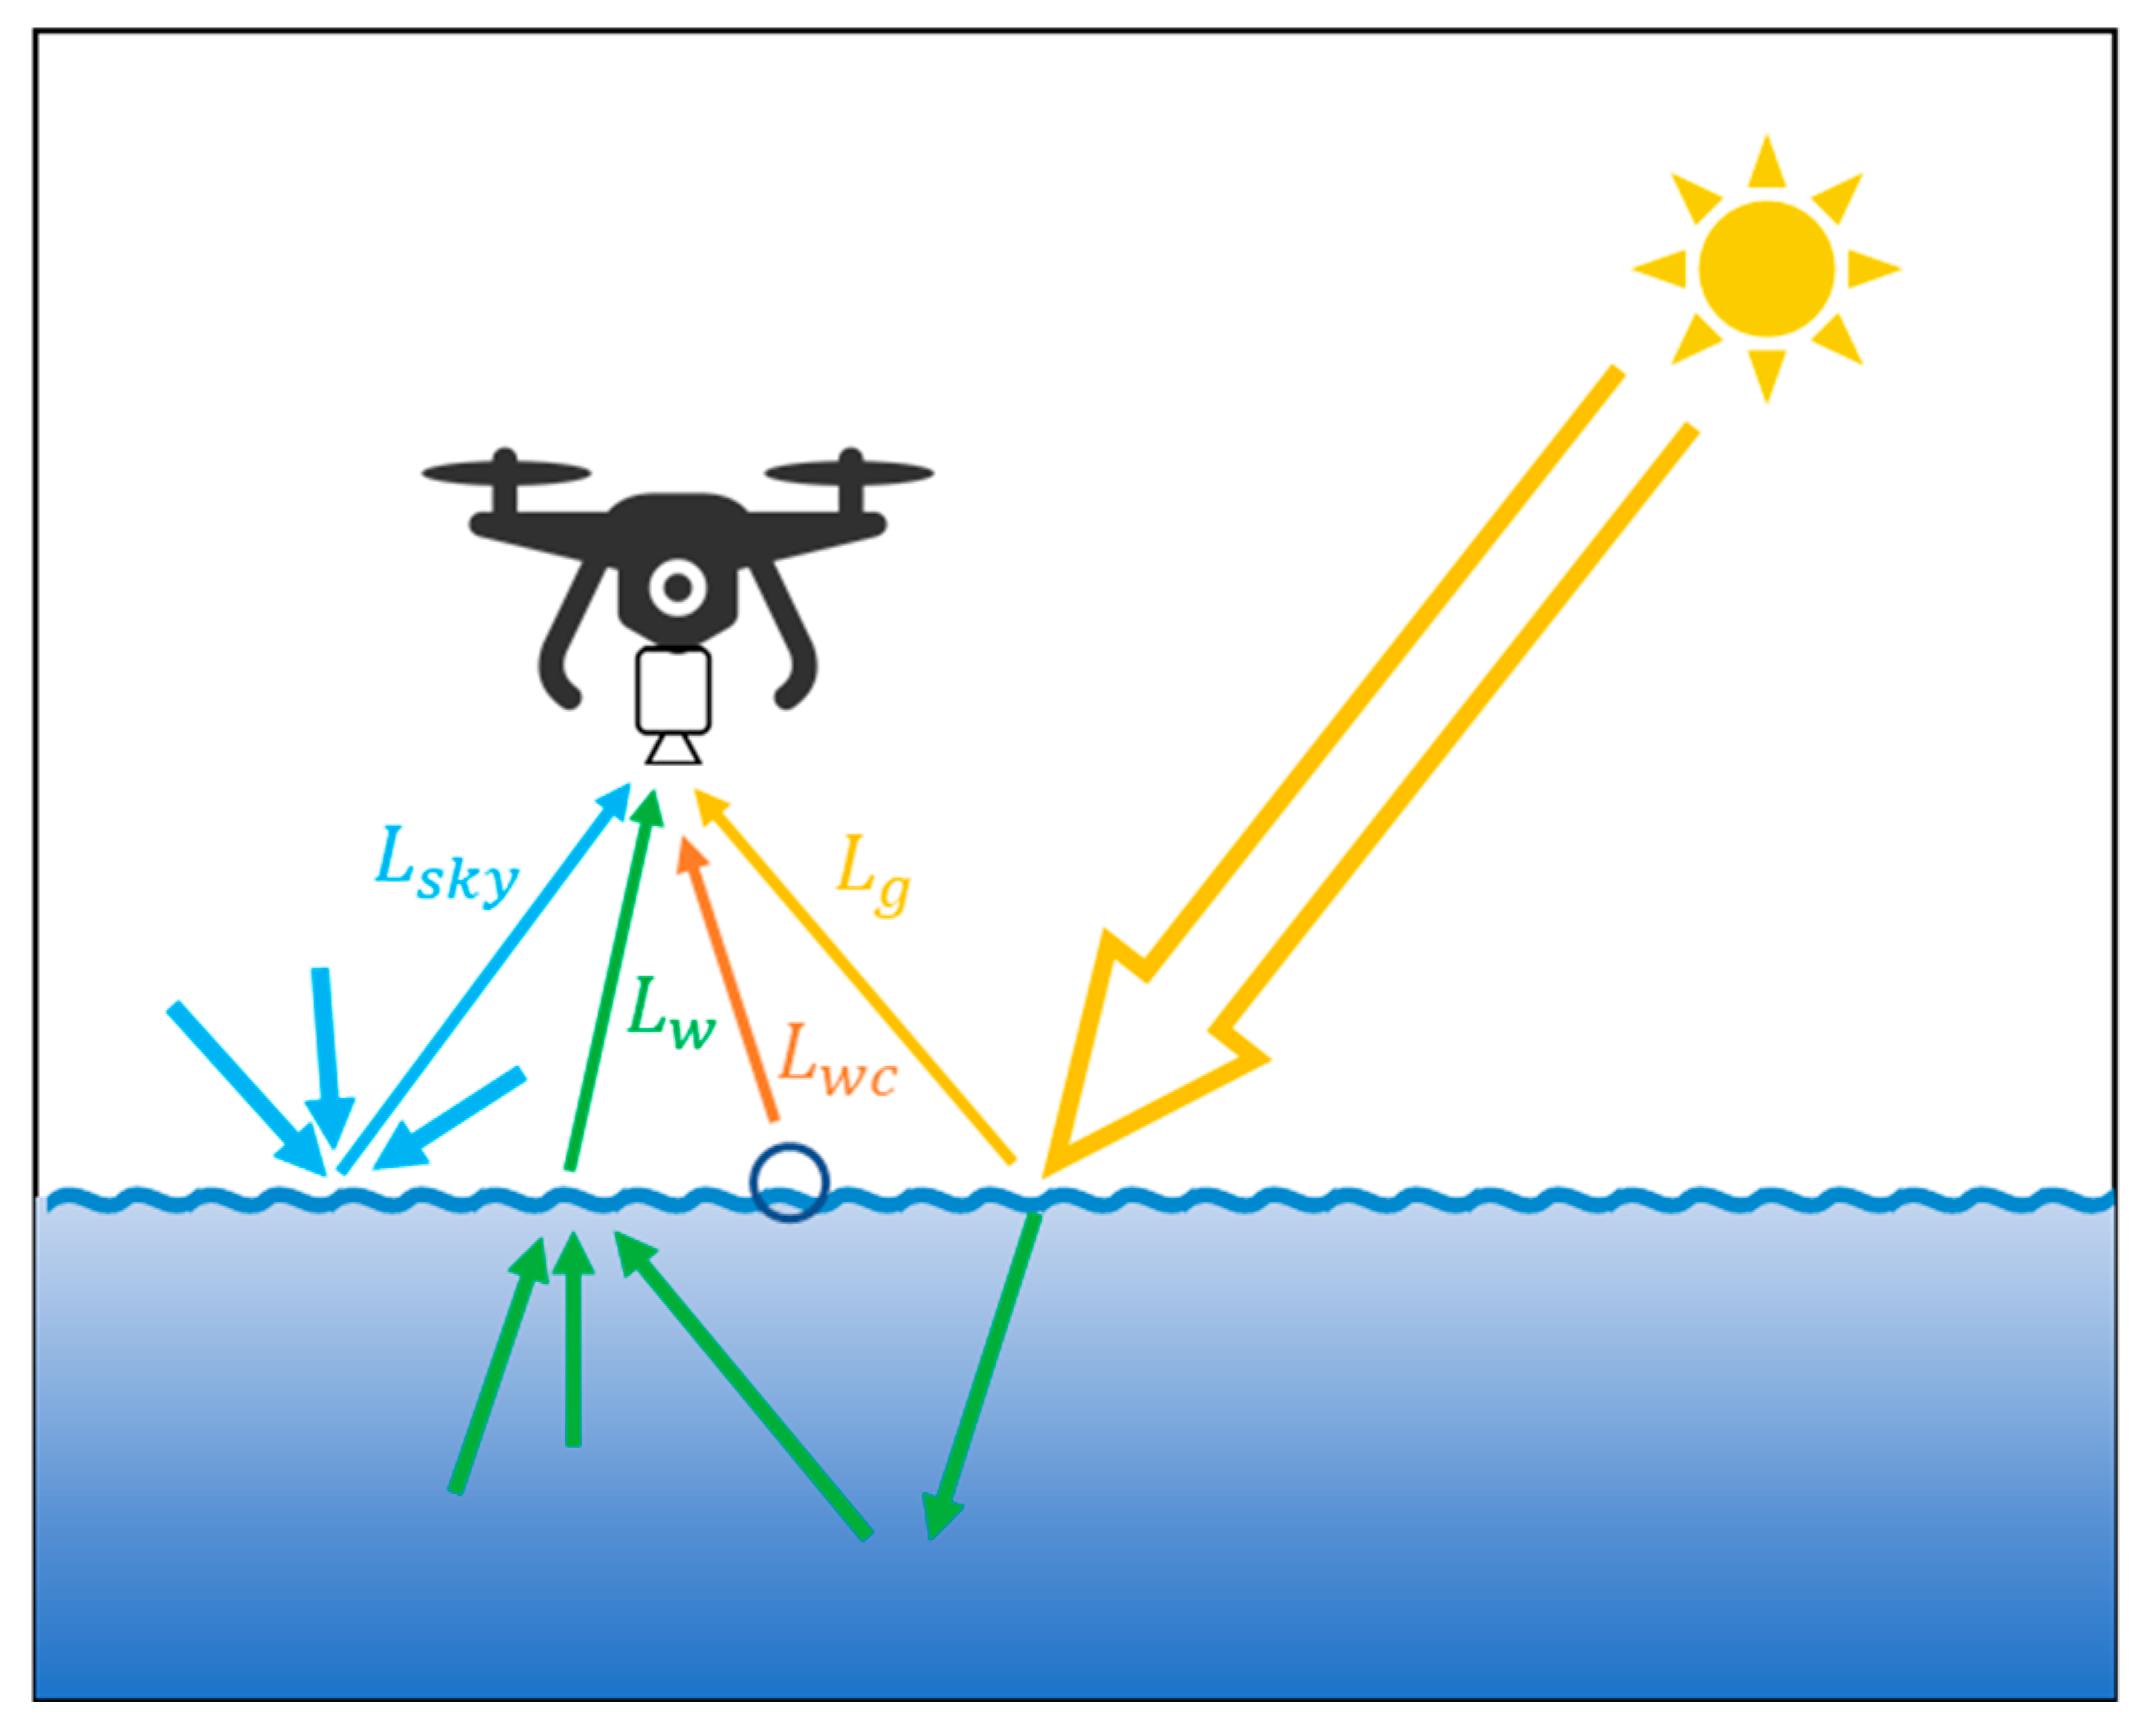
In this study, a sun-surface-UAV observation system was composed. To understand the water surface optical radiative transfer process of the UAV platform, it is necessary to decompose and describe the contribution of each signal in the image (Figure 5). According to the aerial experiments of Cox and Munk [6], the radiation measured by the camera (sensor) at close range can be expressed as:
where is the total radiance received by the sensor, the represent the contribution of sky light entering the sensor after reflection on the water surface, is the sun glitter radiance, is the water-leaving radiance, is the radiance of whitecaps on the water surface.
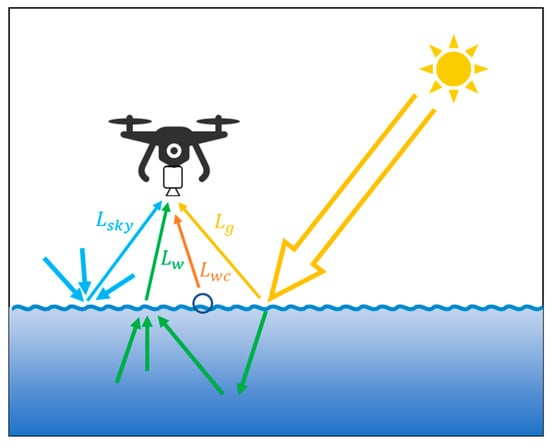
Figure 5.
Water surface optical radiative transfer process of UAV platform.
In Equation (1), the effect of the atmosphere is not considered because the sun-surface-UAV observation system is a close-range remote sensing [6,22,23]. Therefore, the effect of the atmosphere between the sensor and the water surface is neglected.
3.2. Sun Glitter Theory Based on the Cox–Munk Model
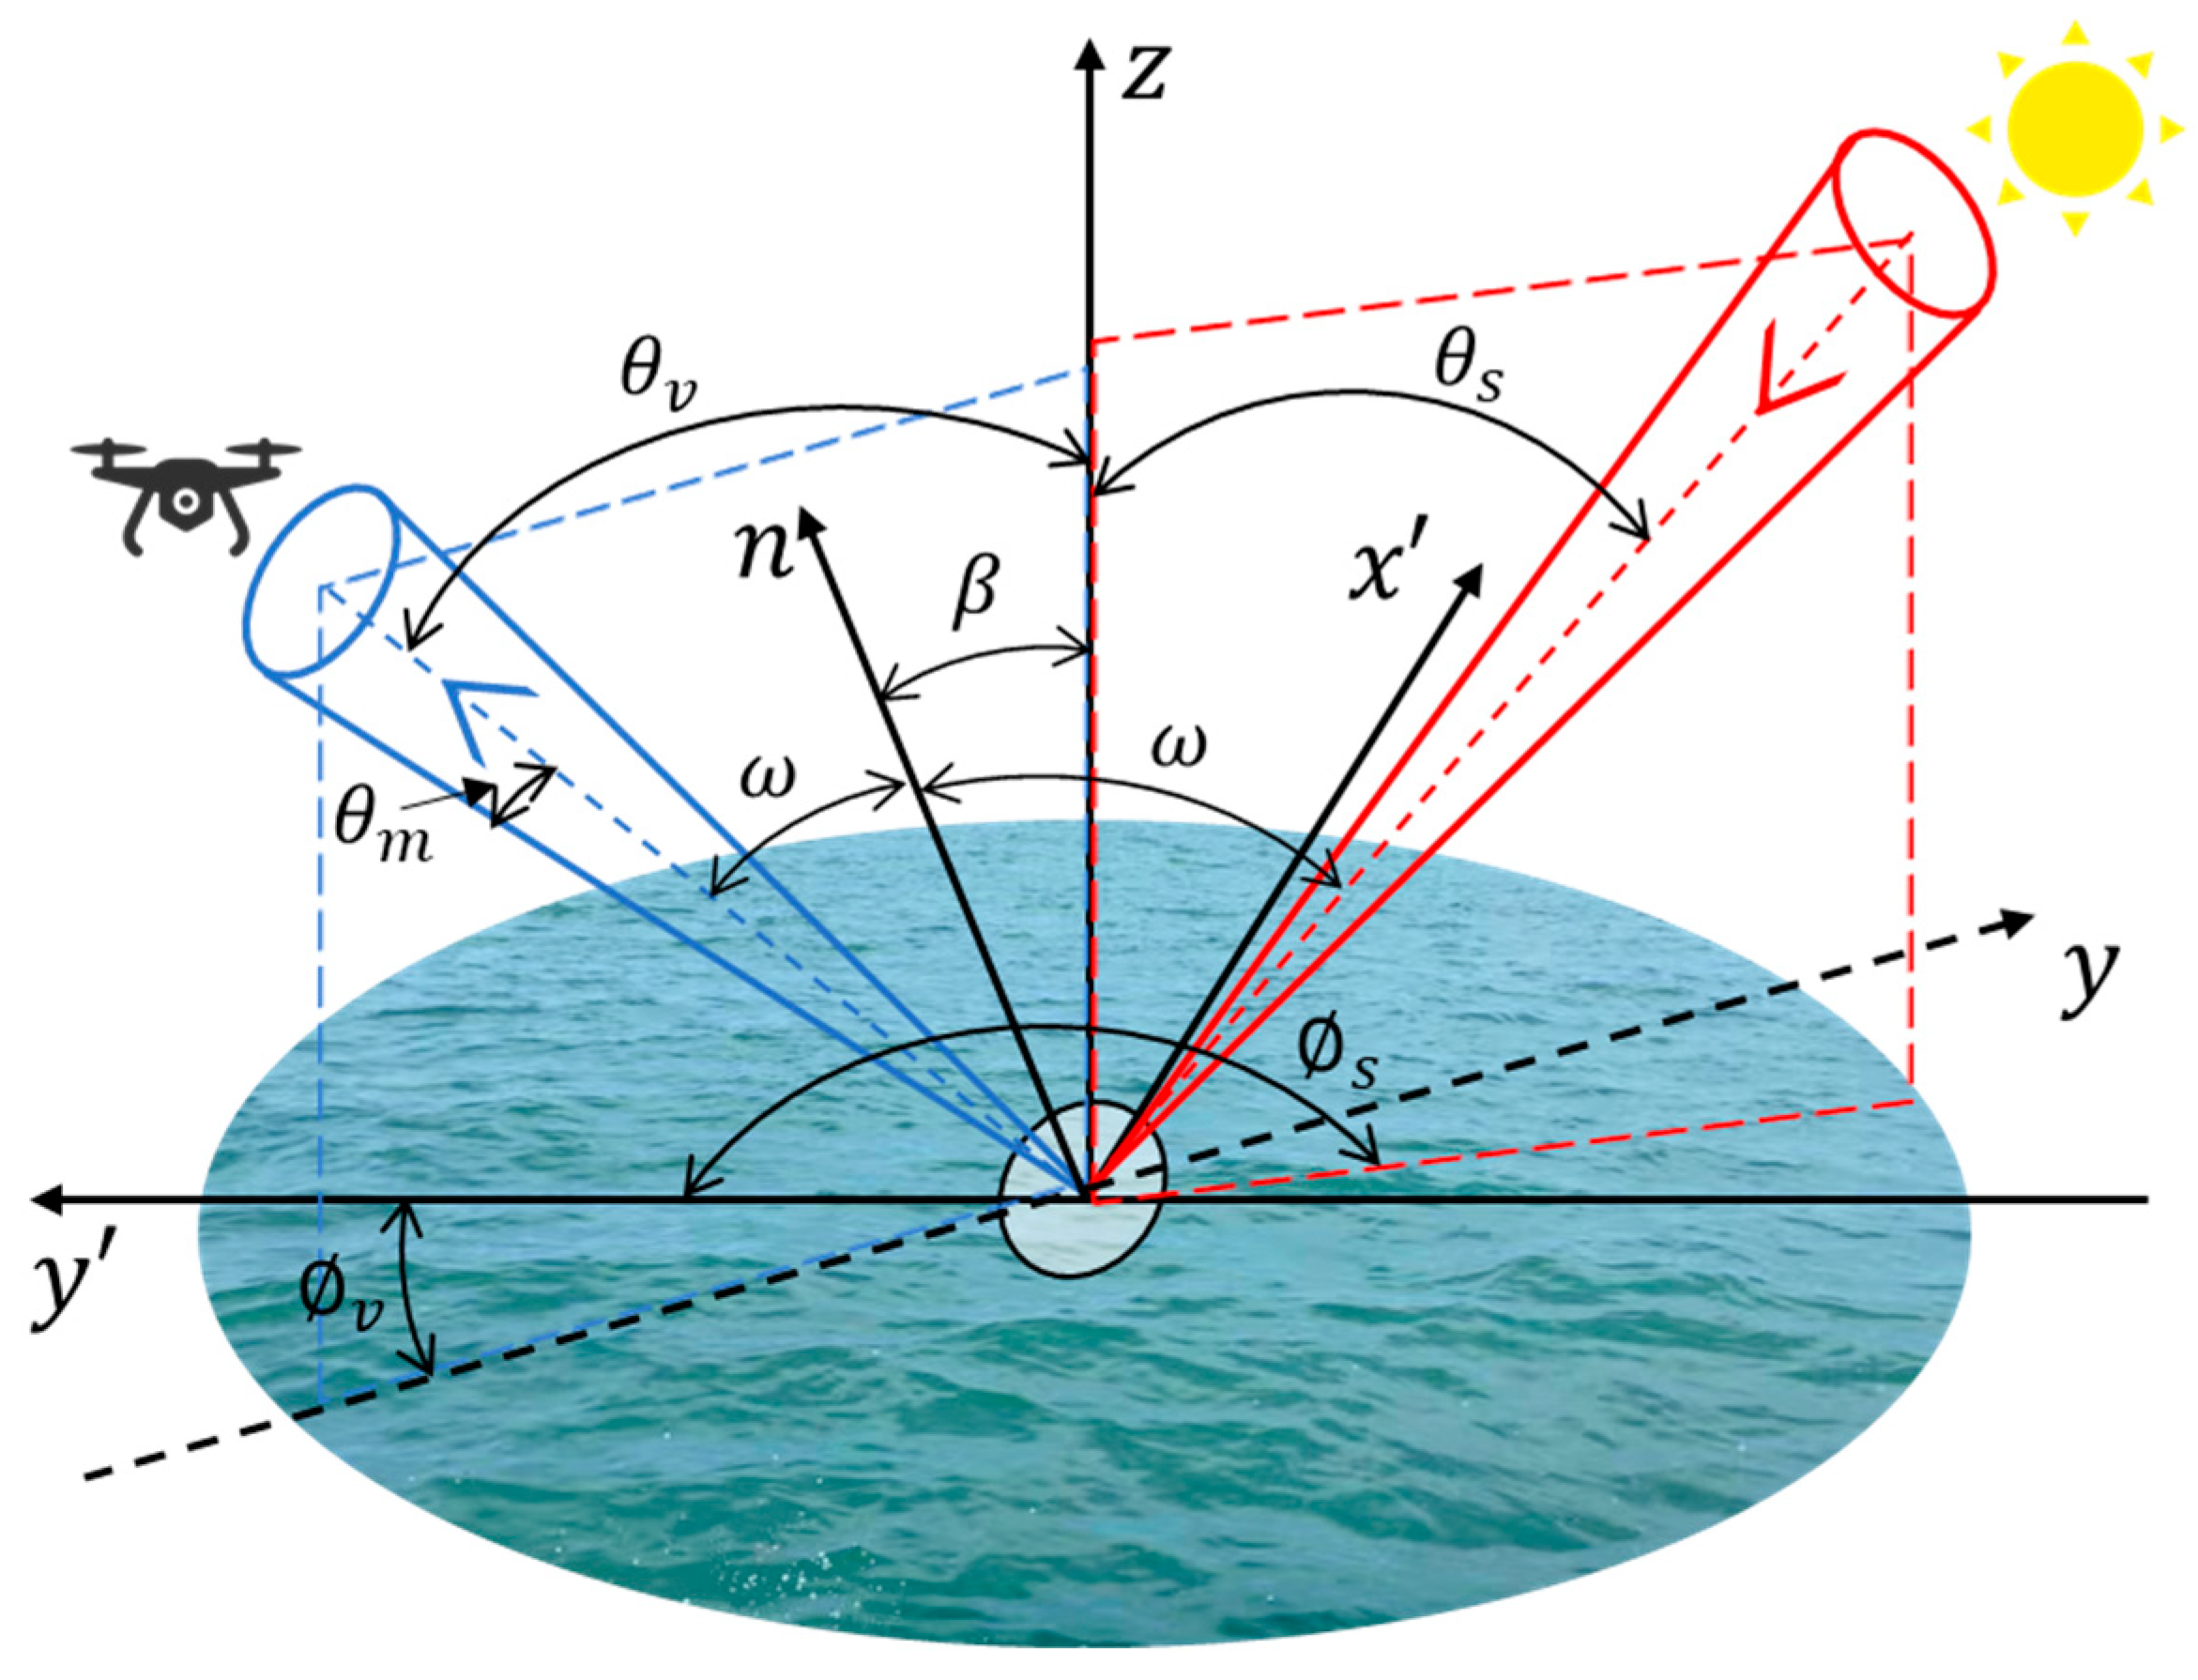
Figure 6 shows the geometric configurations of reflection of sunlight by a tilted surface facet. The normal of the tilted facet forms an angle with the z-axis.

Figure 6.
Geometric configuration of sun glitter radiation transport.
The SG radiance (, ) is calculated based on the studies of Cox and Munk [6], and Gordon [24]. The method for estimating followed the formulation detailed by Jackson and Alpers [25], and Zhang and Wang [26]. Briefly, the general formula for an isotropic probability distribution function without wind direction dependence is
where is the solar irradiance from extra-terrestrial, is the direct atmosphere transmittance in the sun-to-water direction, represents the view zenith angle of sensor, represents the Fresnel reflection coefficient, represents the water surface tilt angle, and represents surface roughness generated by wind. The and can be calculated using the , the solar zenith angle (), and the relative azimuth ().
The Fresnel reflection coefficient, , is determined by the reflection angle () and refraction angle (), and the expression is as follows:
For the air-water interface, the relationship between and can be expressed as:
and, where represents the refractive index of the medium at the water surface. According to Equations (2), (5) and (6), the geometry angles, surface roughness, and refractive index are the main parameters that affect the SG radiance.
Several empirical expressions of as a function of wind speed in popular SG models were evaluated by Zhang and Wang [26], and it was found that the CM model had the best performance. According to Cox and Munk [6], the relationship between surface roughness () and wind speed (W, m/s) at 41 ft (about 12.5 m) above water level is as follows:
In this study, UAV images and Sentinel-2 MSI image are processed to . Thus, the conversion of and is performed as follows:
3.3. Estimation Model for Water Surface Roughness and Refractive Index Based on Multi-Angle Sun Glitter Image
According to the multi-angle image matching in Section 2.1, it can be observed that there are overlapping regions between images acquired by different cameras at the same time. Zhang et al. [27] proposed a surface roughness estimation model based on multi-angle SG images. For example, for the overlapping area of Camera 1 and Camera 2, WSR is calculated as follows:
where subscripts 1 and 2 denote the parameters of Camera 1 and Camera 2, respectively.
According to Equations (5) and (6), the refractive index affects the SG through the Fresnel reflection coefficient. Wang et al. [14] investigated the relationship between the refractive index and the ratio of multi-angle Fresnel coefficients (i.e., ), found that the refractive index and sun angle have insignificant effects on the ratio (i.e., ). Therefore, the WSR estimation model with refractive index removed is as follows:
Thus, the WSR can be estimated with Equation (10) by inputting the SG radiances and imaging geometry angles of the multi-angle images. The WSR is then used in Equation (11) or Equation (12) to calculate the ERI. Affected by the characteristics of remote sensing observations, the ERI does not represent the refractive index of a single substance, but reveals the refractive index of a mixed pixel containing various substances such as seawater, whitecaps [14,28].
We vary the refractive index in increments of 0.001 (from 1.300 to 1.400) to determine the ERI of each pixel by matching the or derived from SG images and its modelled value. The ERI is then input into the single-angle Sentinel-2B image and the corresponding WSR is calculated by an iterative method for the validation of the UAV results. So far, we have completed the calculation of the WSR and ERI of the water surface.
3.4. Sun Glitter Extract Model
In this study, SG images in the NIR band are used to estimate WSR and ERI. Therefore, SG signals need to be extracted from UAV images. We merge the other items except to get , which means the part that needs to be eliminated,
Thus, the radiance of SG () is expressed as:
Cox and Munk [6,29] developed a statistical model of SG through field experiments. In relatively coarse-resolution satellite imagery, each water surface pixel can be viewed as a collection of many “facets”. In contrast, in high-resolution UAV imagery (especially sub-meter resolution), each “facet” is independent rather than a collection, making the reflection of light random and discrete. Therefore, before applying the CM model, the spatial resolution needs to be reduced to eliminate the scaling effect of solar reflections so that the SG in the image is converted to a statistical type [30]. Currently the CM model has been applied to 10 m resolution satellite images [18,31]. Therefore, the mean filter is used to reduce the image resolution to 10 m in this study.
In this study, we calculate by retrieving the darkest pixel in the region surrounding each pixel. The and are calculated in the following steps:
Step1: A 2D minimum filter is used to retrieve the minimum value corresponding to each pixel, yielding a minimum value matrix of the same size as the original image. The window size for minimum filtering is a multiple of the image resolution reduced to 10 m. (e.g., if the image resolution is 2.8 cm, the window size is 357).
Step2: The minimum value for a saturated pixel is set to the minimum value of the image. This is because pixel saturation is usually due to a strong SG signal. Therefore, the percentage of non-SG signals is very low.
Step3: The of each pixel is obtained by reducing the minimum value image (matrix) to 10 m resolution by mean filtering.
Step4: UAV images are reduced to 10 m resolution by mean filtering.
Step5: The is calculated by subtracting the from the original image at 10 m resolution.
Through SG extract, the of each pixel in the image is determined. Then, based on the method in Section 3.3, the image in the NIR band is used to estimate WSR and ERI. Note that this model is developed specifically to enable UAV images to be applied to the CM model. Therefore, the model differs significantly from existing SG removal methods.
4. Results and Discussion
4.1. Analysis of Multi-Angle Images from UAVs
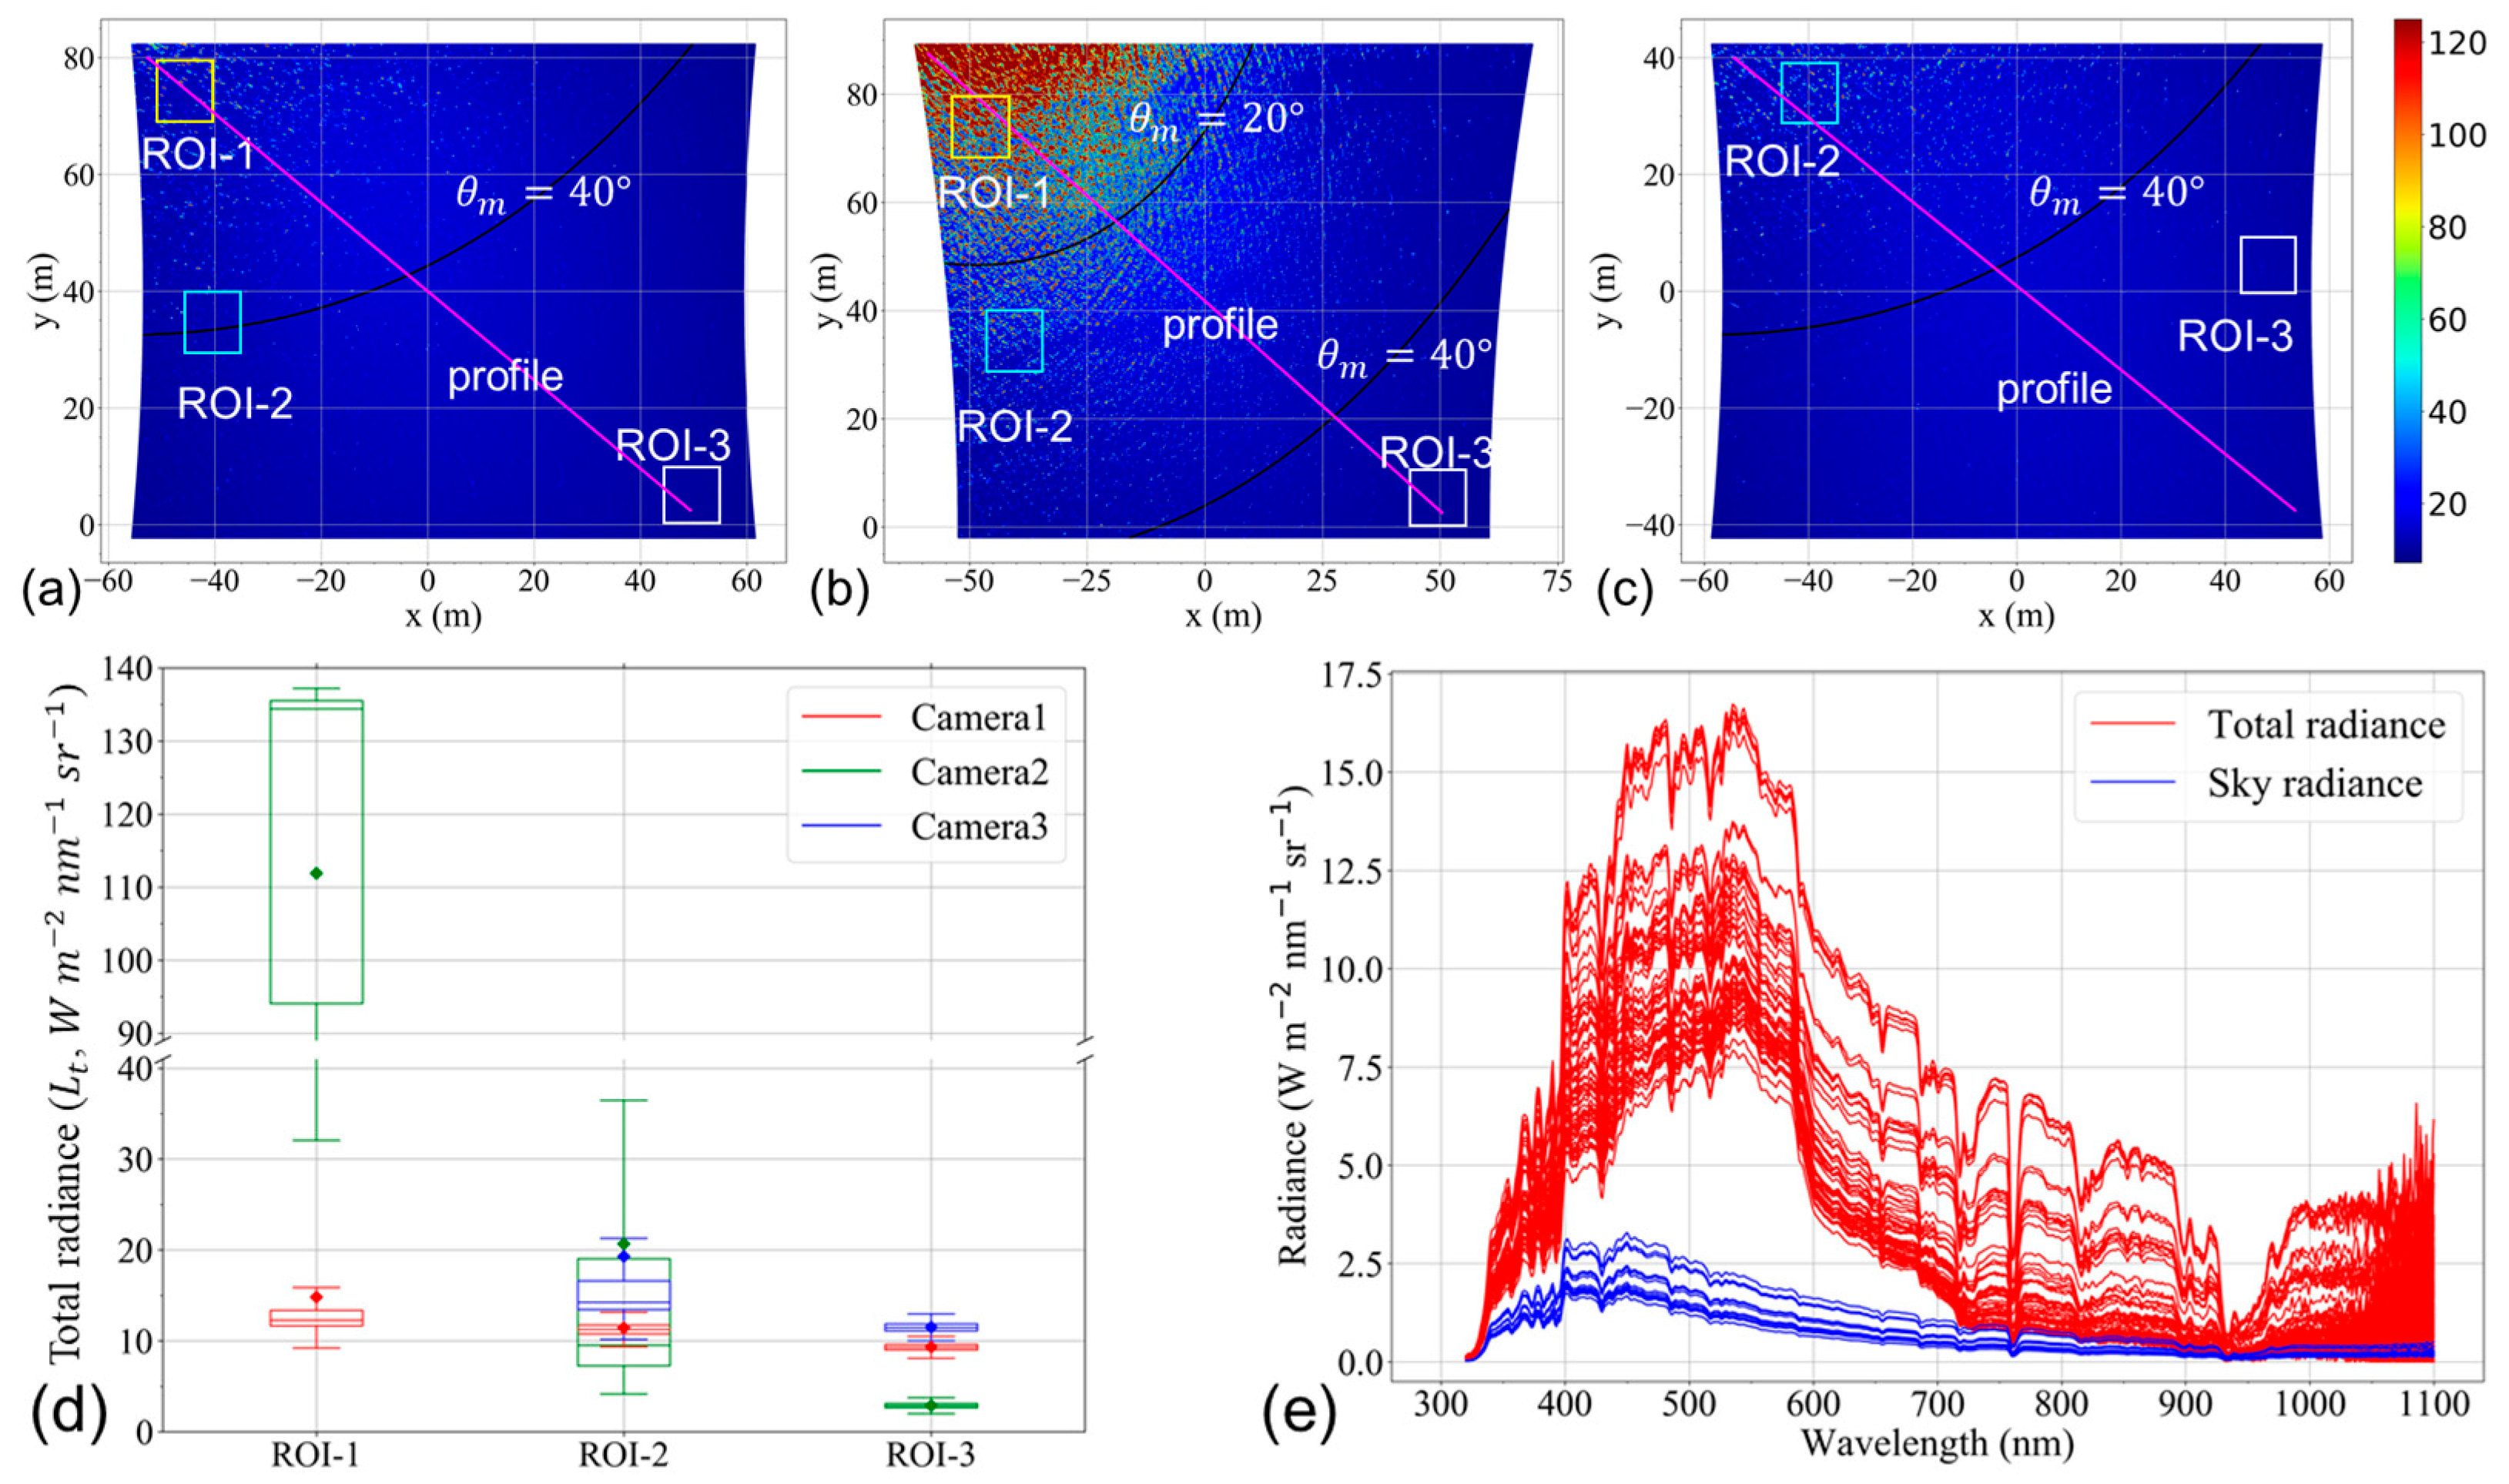
Figure 7 shows a set of NIR band images acquired simultaneously by three cameras of Flight 1, with positional relationships as in Figure 4a. The imaging time was 10:07:16 (UTC +8). is the angle between the angle of the solar specular reflection and the observation angle of the sensor, which is determined by the geometric angle between the sensor and the sun (, is the relative azimuth angle) [12]. can characterize the intensity of SG. The larger is, the weaker the SG is. Usually, if is less than 20°, it is a strong SG area, and greater than 40° is no SG area [13,28]. The contours of = 40° can be seen in Figure 7a–c, but the contour of = 20° can only be seen in Figure 7b. This indicates the presence of a strong SG region in Figure 7b.
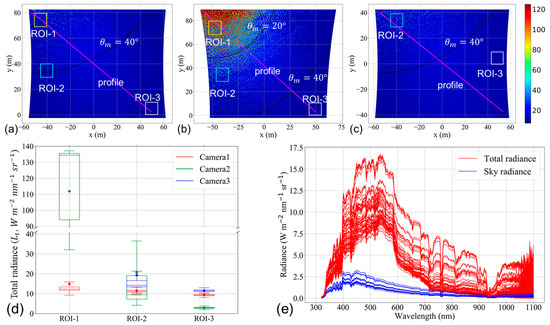
Figure 7.
NIR band radiance image from Camera 1 (a), Camera 2 (b), and Camera 3 (c) of Flight 1 at the same time. (d) Total radiance from three ROI labelled in (a–c). (e) water surface radiance and sky light radiance measured by the spectrometer.
Based on the distribution of SG and the location of pixels, we select three regions of interest (ROI-1, ROI-2, ROI-3). The results of the radiance for ROI are shown in Figure 7d, where ROI-3 is located in the SG-free region. In the study area, the water surface and sky light results measured using the spectrometer are shown in Figure 7e. The results of ROI-1 show that the discrete features are more pronounced in the strong-SG region, and its minimum value is larger than the maximum value in the weak-SG region. This indicates that the minima in the strong SG region are not directly representative of the background values because they are affected by the SG. At the same time, the presence of strong SG signals means adjacent pixels in the focal plane of the camera will be affected, i.e., the adjacency effect of pixels [22,32]. The results in the weak SG region (ROI-2) are all generally consistent. By comparing the data in the ROI-3 and 850 nm band of measurements, the radiance for the SG-free regions is greater than the spectrometer results, suggesting that the sensor is also affected by other factors (e.g., neglected atmosphere, or vignetting effects) [6,31,33]. In addition, Qiandao Lake is an inland lake, and the water-leaving radiance in the NIR band cannot be ignored and exhibits bi-direction feature in the high-resolution image [34]. This also proves that the method of removing the SG radiance in other bands based on the assumption that the water-leaving radiance in the NIR band is zero will produce some errors.
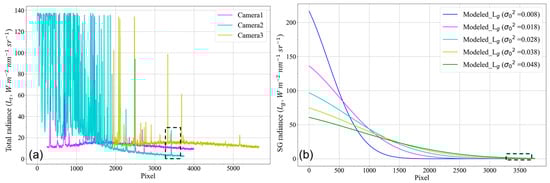
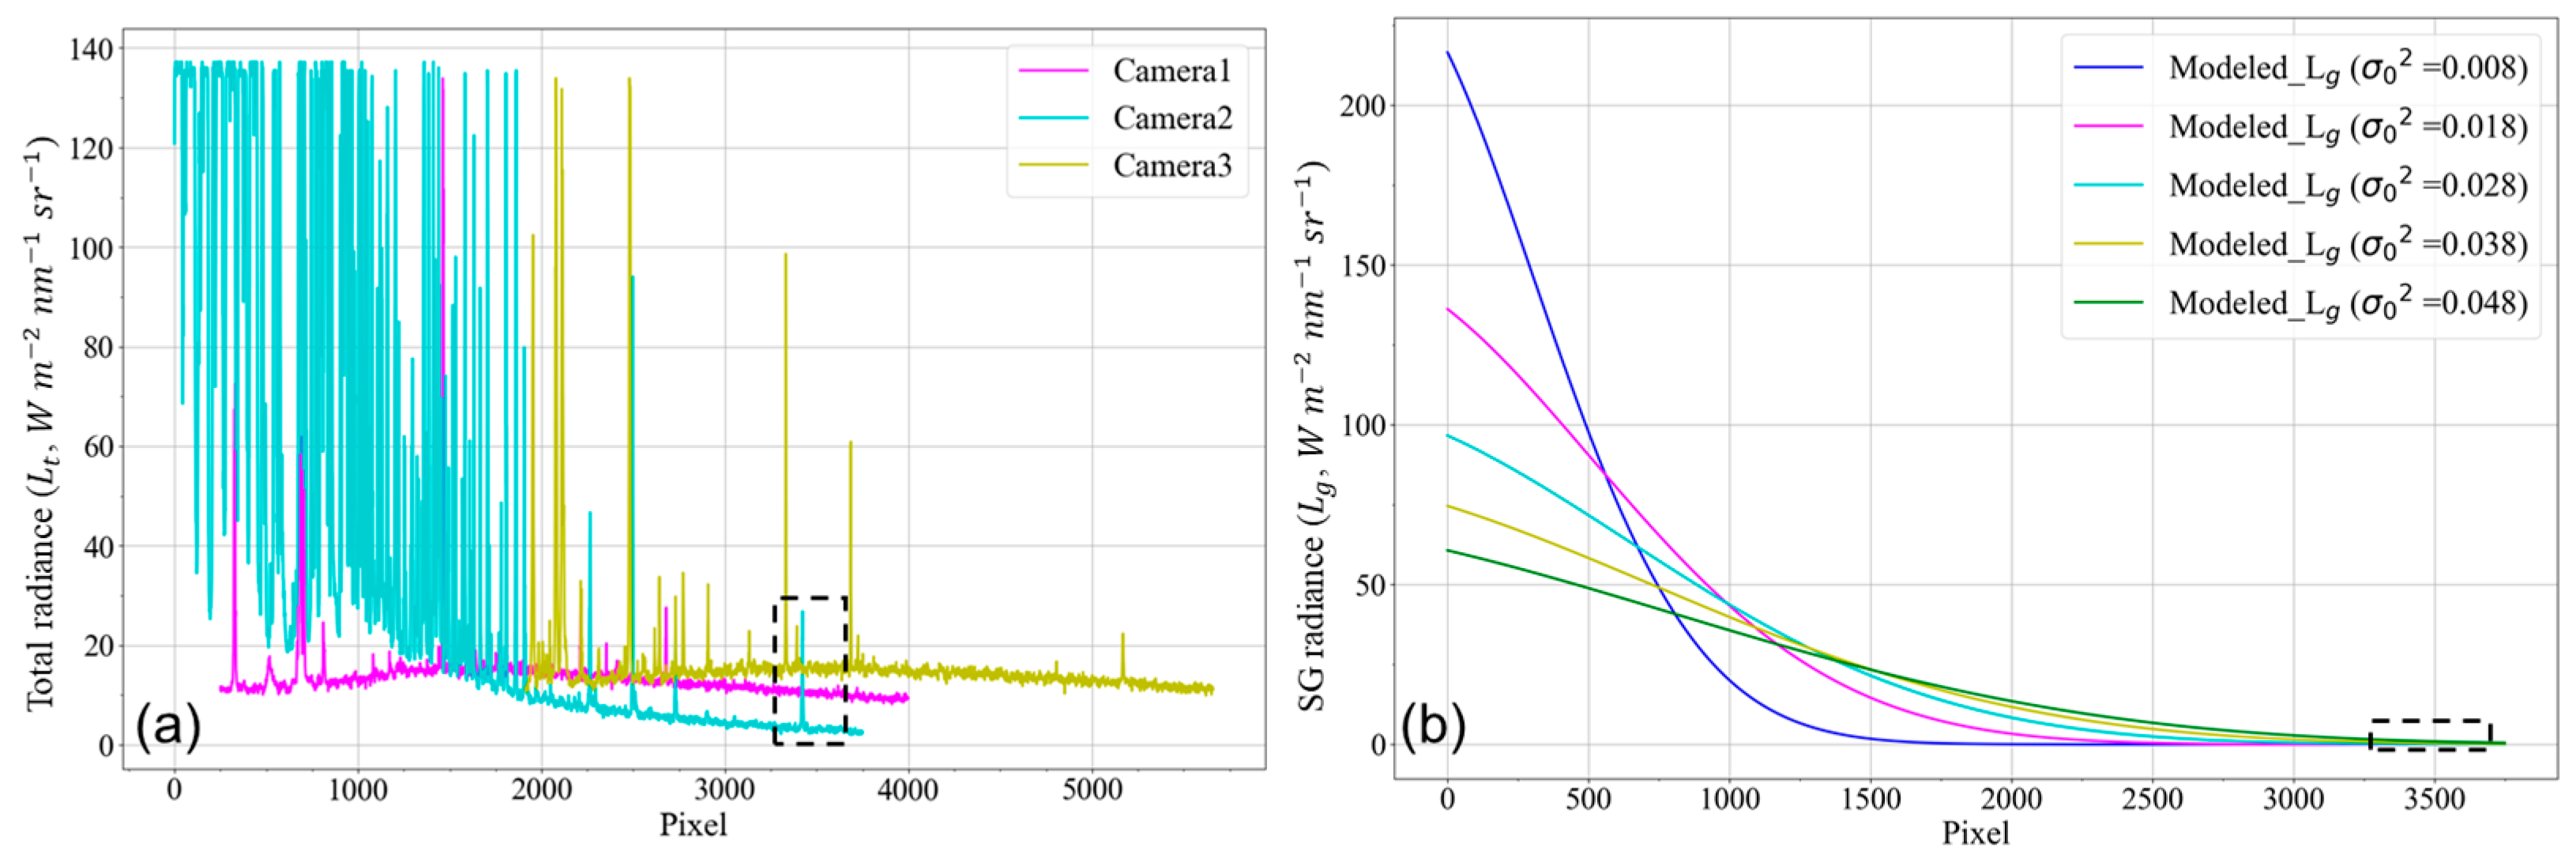
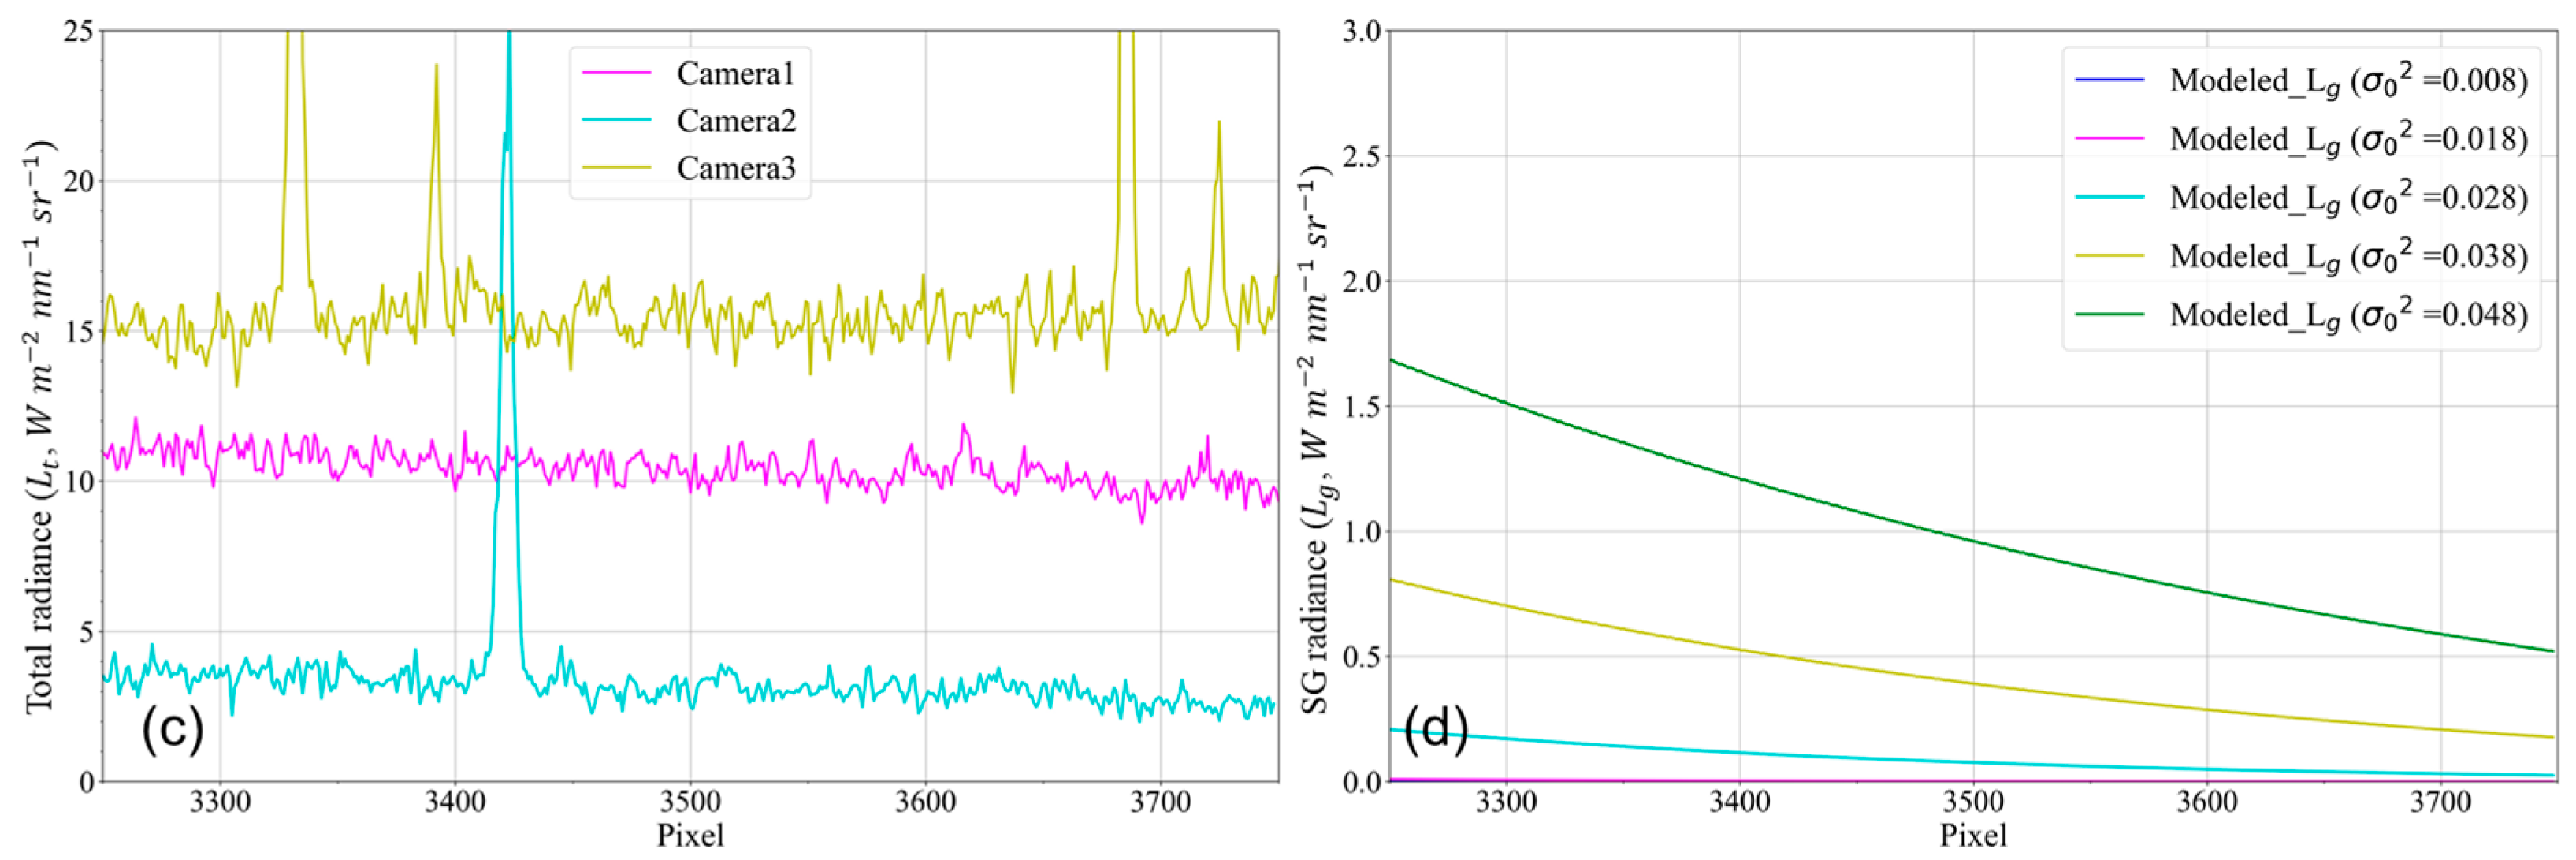
A continuous radiance profile is derived along the “Profile” line in Figure 7a–c, and these data are plotted in Figure 8a. Along the “Profile” in Figure 7b, we extract the geometric angle of each pixel. Then, we set five roughness values, i.e., = 0.008, 0.018, 0.028, 0.038, and 0.048. Using Equation (2), we simulate the SG radiance with different roughness values (Figure 8b). A portion of the image is enlarged to show the contrast between the radiance of the SG-free area image and the modelled SG radiance (Figure 8c,d). We can see that the radiance of the image in the SG-free region is about 3 to 5 () higher than the simulated one.

4.2. Results of Sun Glitter Extraction
Based on the method introduced in Section 3.4, we extract the SG from the UAV images (Figure 9). Figure 9(a1–a3) show total radiance images from Cameras 1, 2, and 3 with a resolution of 10 m, respectively. Figure 9(c1–c3) show background radiance images, respectively. The profiles of total radiance, SG radiance, and background radiance are derived along the “Profile” line, and these data are plotted in Figure 9(d1–d3). To facilitate image comparison, the colour bar for each image is adjusted. Except for the colour bars in Figure 9(a2,b2), which range from 0–120 , all other color bars range from 0–25 .
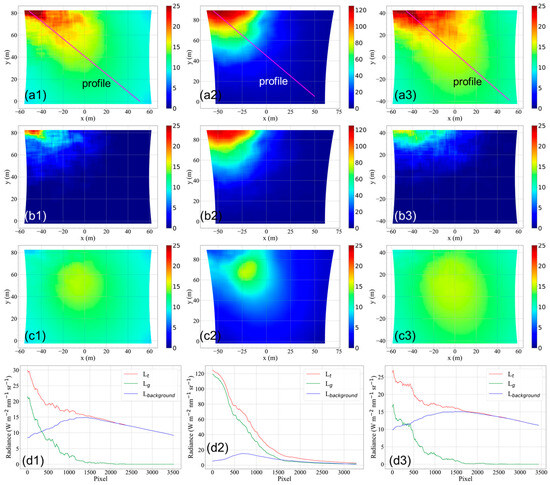
Figure 9.
Images from Cameras 1, 2, and 3 with a resolution of 10 m. (a1–a3) Total radiance; (b1–b3) SG radiance; (c1–c3) Background radiance. (d1–d3) Radiance profile along the purple line labelled ‘Profile’ in (a1–c3), which shows the variation in total radiance, SG radiance, and background radiance.
In the 10 m resolution image, we can clearly see the distribution features and intensity differences of the statistical SG. This is consistent with the SG intensity trend indicated by the angle. As can be seen in Figure 9(c1–c3), there is a clear vignetting phenomenon in which the centre of the image is bright and gradually darkens toward the corners. This is due to the optical properties of the lens; the ability of the centre of the lens to concentrate light is much greater than its edges, resulting in a greater intensity of light in the centre of the image than around it [6]. Camera 1 and Camera 3 are imaged using the nadir view, while Camera 2 uses the forward view, which receives more sunlight. As a result, the range affected by the vignetting effect is significantly smaller in Camera 2 than in Cameras 1 and 3, but the intensity of the background values is essentially the same in three cameras. As can be seen in Figure 9(d1–d3), the curve (green) is more consistent with the trend of the simulated SG in Figure 8b.
4.3. Validation of Water Surface Roughness and Refractive Index
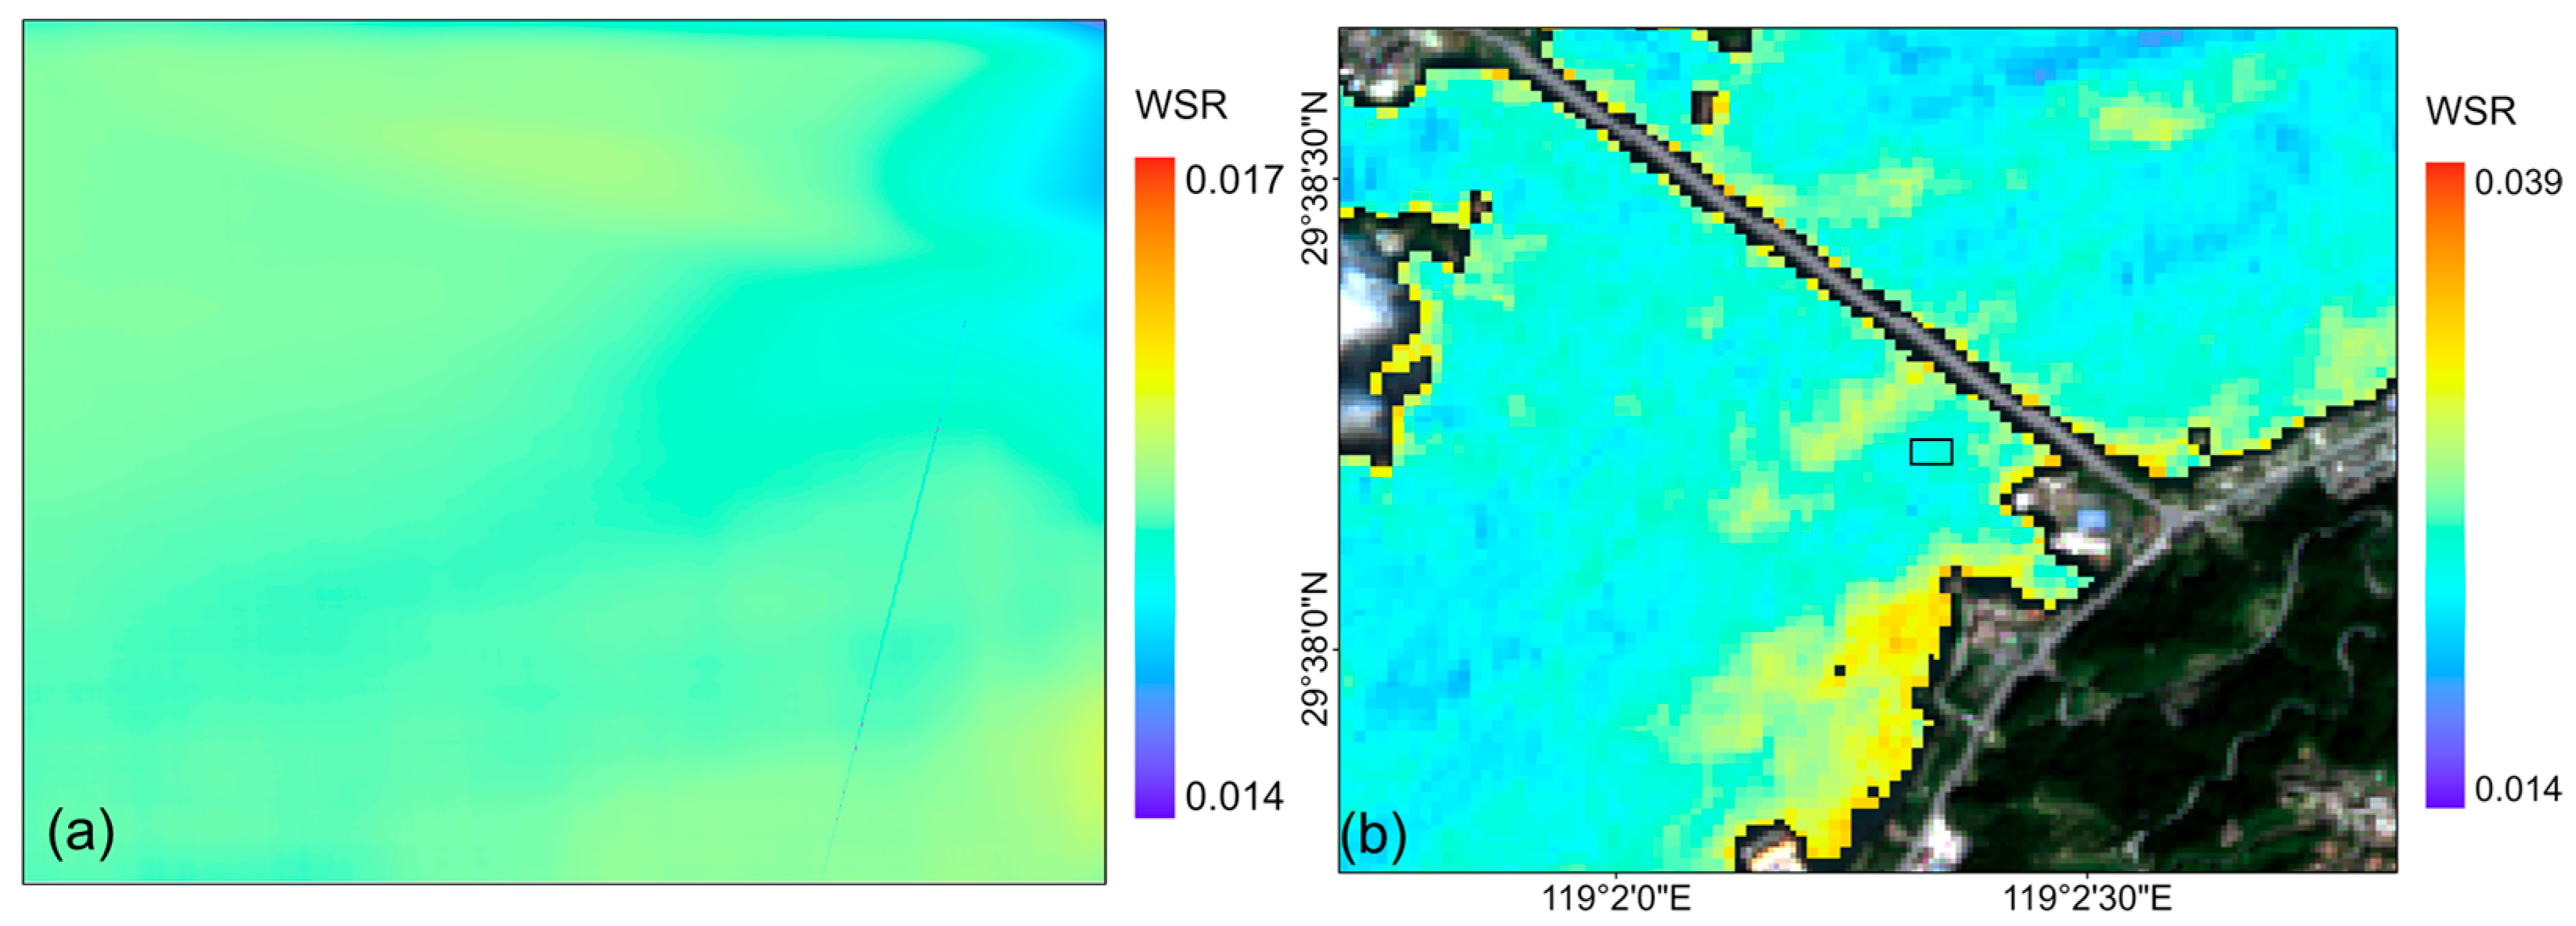
Based on the multi-angle image matching results, we can find that any two cameras at the same time for each flight had overlapping regions except for Flight 5. Thus, after SG extraction, the SG images of the overlapping region are used for WSR and ERI estimations. Figure 10a illustrates the estimated WSR based on the SG in the overlapping region of Camera 1 and Camera 2 of Flight 3. The images of Flight 3 and the Sentinel-2B satellite image are acquired at similar times. Based on the refractive index estimation method, the average value of ERI in the overlapping region is obtained as 1.332. The ERI is input into the SG image of Sentinel-2B and the WSR is calculated (Figure 10b). The black box in Figure 10b indicates the geographic location of Figure 10a. The average value of roughness in Figure 10a is 0.0158 (with a wind speed of 2.5 m/s), and the average value of Figure 10b for the corresponding region is 0.0204 (with a wind speed of 3.4 m/s). The comparison reveals that the WSR results calculated from the UAV images and the Sentinel-2B image are similar. Unlike UAV remote sensing, satellite remote sensing is affected by the atmosphere. Therefore, the effect of atmospheric corrections can affect the inversion results.
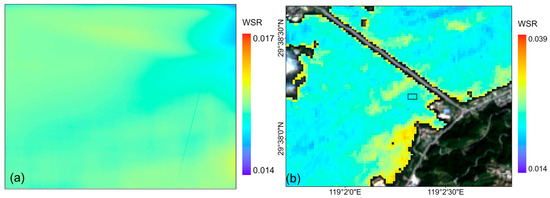
Figure 10.
(a) Estimated WSR image based on SG in the overlapping region of Camera 1 and Camera 2 of Flight 3. (b) Estimated WSR image using Sentinel-2B satellite imagery. The black frame indicates the location of the (a).
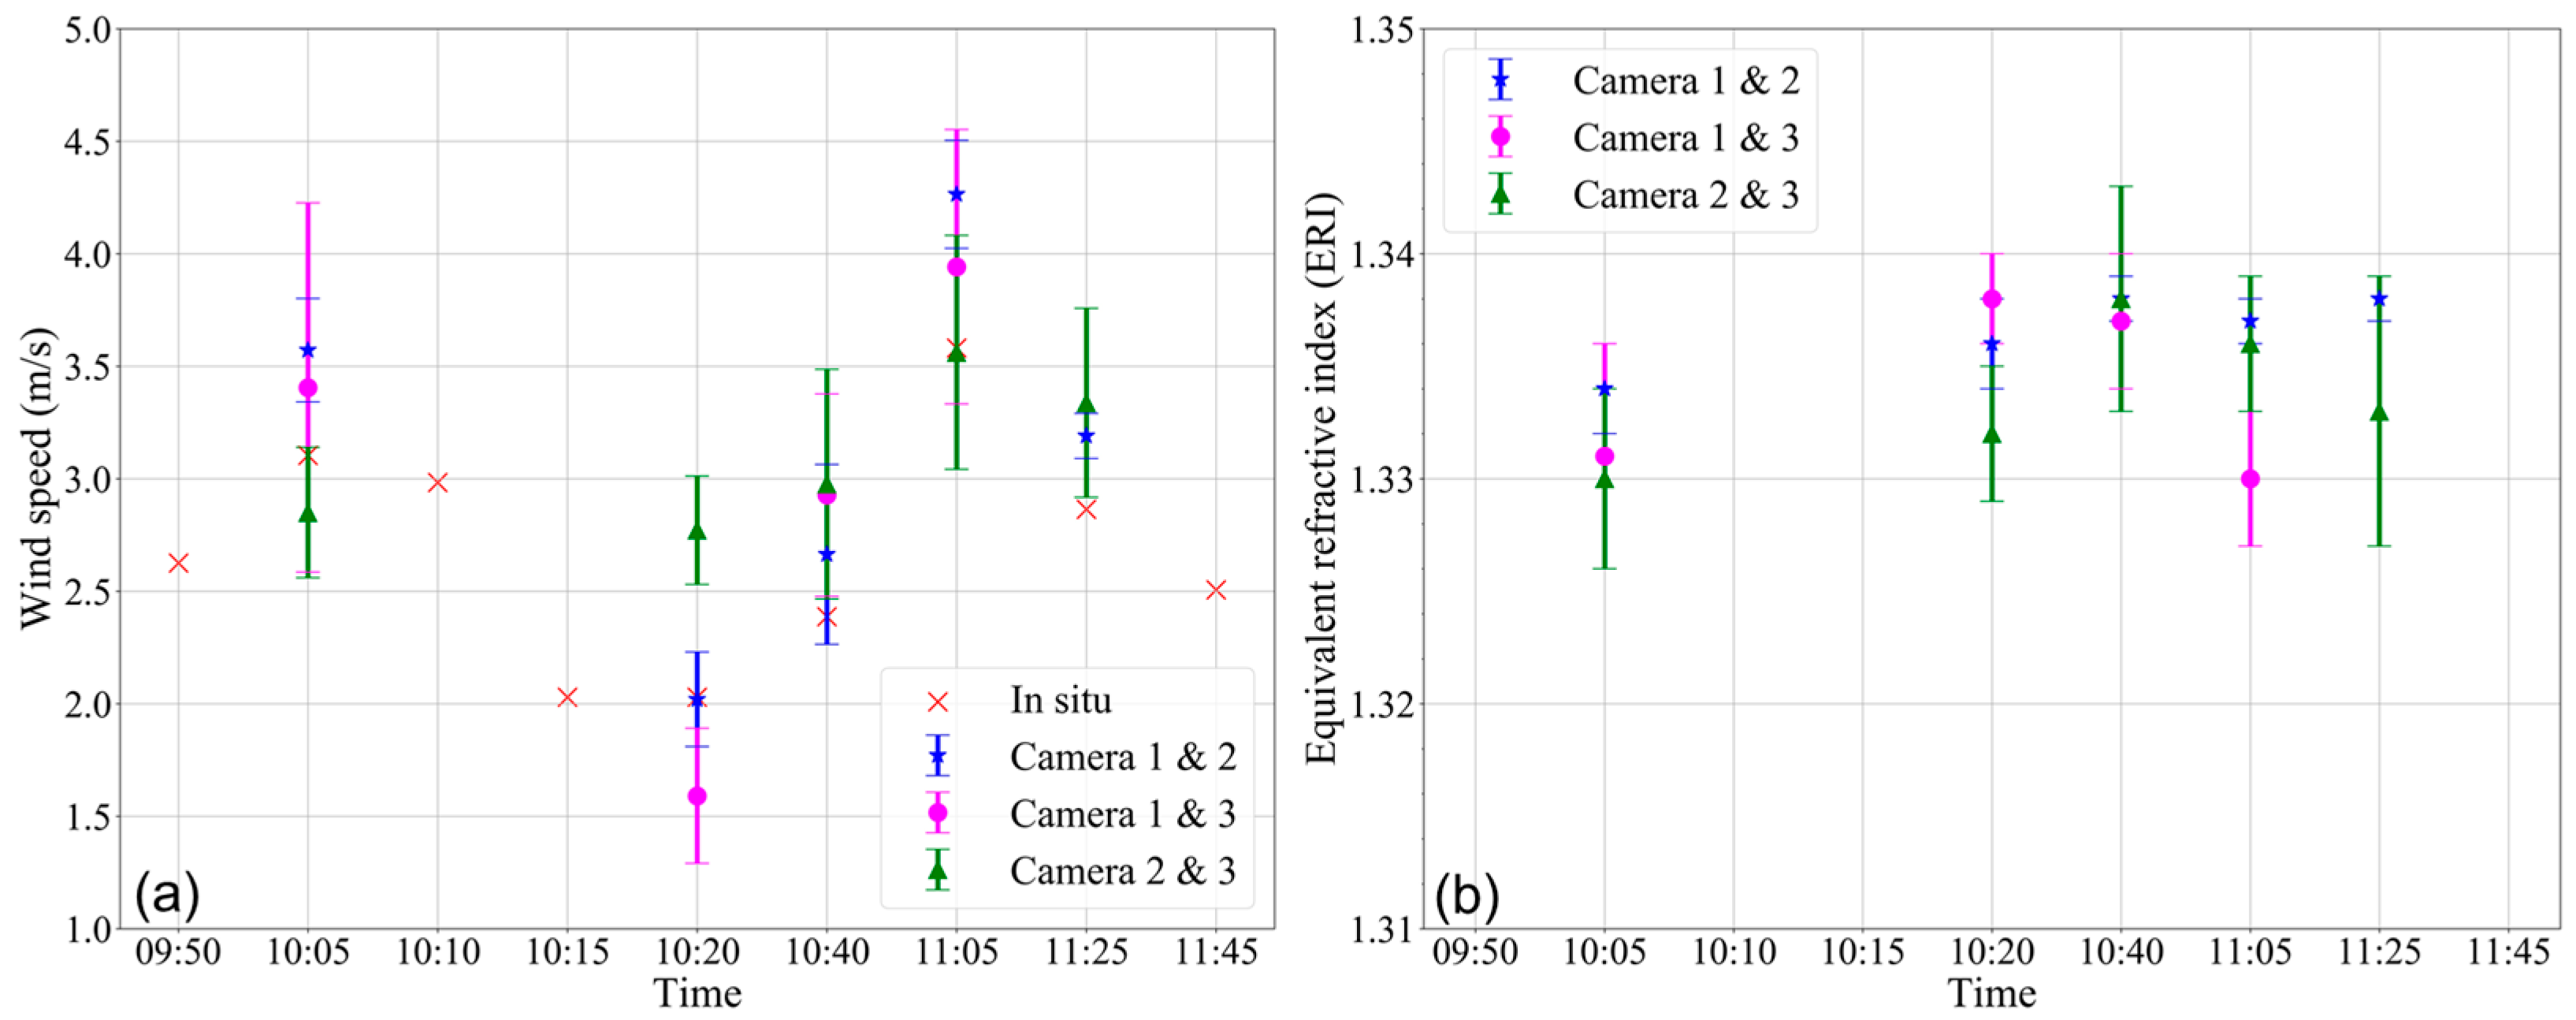
To evaluate the accuracy of the estimated WSR, a representative WSR value is converted into the wind speed at 41 ft (12.5 m) above the water surface by using Equation (7), and then, the wind speed is adjusted to 10 m by the power-law wind profile with an exponent of 0.11 according to Hsu et al. [19]. We calculate the estimated wind speeds for each flight and compare them with the wind speeds measured in the field (Figure 11a). The average deviation of the estimated wind speeds from the measured ones is less than 1 m/s. The results show that the estimated wind speeds are consistent with the measured ones.
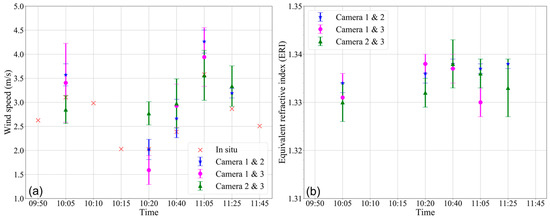
Figure 11.
Statistical analysis of estimated wind speed (a) and ERI (b) of different camera combinations from different flights. The x-axis represents the flight time.
In addition, we also download the reanalysis wind-speed data from the ERA-5 dataset provided by the European Centre for Medium-Range Weather Forecasting (ECMWF). This dataset offers windspeed measurements at a height of 10 m above the water surface, with a spatial resolution of 0.125° × 0.125° and a temporal resolution of 1 h. The reanalysed wind speed during the experiment is 3.2–3.7 m/s, which is obtained by interpolation. Due to its low resolution and the complex topography around the study area, it can only be used as a reference, but is still similar to the inversion results.
In this experiment, two flight altitudes (100 m and 150 m) and three tilt angles (Camera 2, 15°, 20°, and 25°) are set for the UAVs (Table 2). As shown in Figure 11a, the combination of Camera 1 and Camera 2 (blue) yields the most optimal results in each flight session. This is because the overlapping region of Camera 1 and Camera 2 contain strong SG signals. The combination of Camera 1 and Camera 2 in Flight 2 produce the best results among all combinations. This combination involves a flight altitude of 150 m and a tilt angle of 20° for Camera 2. This is in good agreement with the optimal multi-angle SG observation combination simulated by Wang et al. [15] using an error propagation model. The combination of Camera 1 and Camera 3 shows relatively larger errors, likely due to the absence of strong SG signals in both cameras and the significant impact of the vignetting effect.
Additionally, we plotted the results of the ERI (Figure 11b). As shown in Figure 11b, the ERI results for different flight combinations are relatively stable. The refractive indices estimated in this study range from 1.33 to 1.34, which are in general agreement with the refractive indices of freshwater in the related literature [35,36,37].
To compare the impact of different flight parameters on inversion results, we compile the wind speed estimates for the combination of Camera 1 and Camera 2 (Table 3). The results show that the height of the UAV flight has little effect on the results, but rather the effect of angle difference of the two-camera combination is more pronounced. The best results are obtained when the angle is 20°, followed by 25° and finally 15°.
Table 3.
Estimated wind speed for Camera 1 and Camera 2 combination.
5. Conclusions
In this study, we conduct the analysis and validation of UAV multi-angle SG images and summarize the results as follows.
(1) We design five imaging combinations using two UAVs and three cameras, which successfully acquired images containing SG signal. However, there are significant differences in the distribution and intensity of SG under different observation parameters. In addition, UAV-based close observation makes the images susceptible to vignetting and adjacency effects.
(2) We propose a region-based retrieval model of dark pixels to extract the SG signal and non-SG signal in images. The model is developed specifically to enable UAV images to be applied to the CM model. Therefore, the model differs significantly from existing SG removal methods, and requires further exploration and discussion.
(3) Based on the proposed model, 10-m resolution multi-angle SG images are used to estimate WSR and ERI, which are validated by measured and literature data. The results show that multi-angle SG images based on UAV platform can be applied to WSR and ERI estimations. Additionally, the effect of the combination of observation angles on the inversion results was analysed and found to be consistent with the literature description.
The success of this experiment lays the foundation for the team to carry out the next step. In the future, we will try to apply UAV multi-angle SG to typical scenarios such as oil spills, sewage, water plume and exhaust emission, including high temporal and spatial resolution quantitative analyses of oil spill dispersion and weathering processes.
Author Contributions
Conceptualization, H.Z.; Data curation, C.W., H.Z. and J.W.; Investigation, G.L.; Methodology, C.W., H.Z. and G.L.; Project administration, D.L.; Software, C.W. and G.L.; Supervision, H.Z.; Validation, J.W. and D.L.; Visualization, W.C.; Writing—original draft, C.W.; Writing—review & editing, H.Z., W.C., J.W. and X.L. All authors have read and agreed to the published version of the manuscript.
Funding
This research was funded by the National Key Research and Development Program of China [grant number 2024YFF1400900], the Fundamental Research Funds for the Central Universities [grant number B230205029] and the National Natural Science Foundation of China [grant number 41876208].
Data Availability Statement
The data that support the findings of this study are available from the corresponding author upon reasonable request.
Acknowledgments
The authors thank the European Space Agency/Copernicus for providing Sentinel-2 image. They would like to thank Yan Li from Xiamen University for his comments on this article.
Conflicts of Interest
The authors declare no conflicts of interest.
Abbreviations
The following abbreviations are used in this manuscript:
| UAV | Unmanned aerial vehicle |
| SG | Sun glitter |
| WSR | Water surface roughness |
| ERI | Equivalent refractive index |
| CM | Cox-Munk |
| NIR | Near-infrared |
| ROI | Region of interest |
References
- Bukin, O.A.; Proschenko, D.Y.; Chekhlenok, A.A.; Korovetskiy, D.A. Methods for Optical Monitoring of Oil Pollution of Sea Water Basins Using Unmanned Aerial Vehicles. Atmos. Ocean. Opt. 2019, 32, 459–463. [Google Scholar] [CrossRef]
- Jiao, Z.; Jia, G.; Cai, Y. A New Approach to Oil Spill Detection That Combines Deep Learning with Unmanned Aerial Vehicles. Comput. Ind. Eng. 2019, 135, 1300–1311. [Google Scholar] [CrossRef]
- Koparan, C.; Koc, A.B.; Privette, C.V.; Sawyer, C.B. In Situ Water Quality Measurements Using an Unmanned Aerial Vehicle (UAV) System. Water 2018, 10, 264. [Google Scholar] [CrossRef]
- Fernandez-Figueroa, E.G.; Wilson, A.E.; Rogers, S.R. Commercially Available Unoccupied Aerial Systems for Monitoring Harmful Algal Blooms: A Comparative Study. Limnol. Oceanogr. Methods 2022, 20, 146–158. [Google Scholar] [CrossRef]
- Yang, Z.; Yu, X.; Dedman, S.; Rosso, M.; Zhu, J.; Yang, J.; Xia, Y.; Tian, Y.; Zhang, G.; Wang, J. UAV Remote Sensing Applications in Marine Monitoring: Knowledge Visualization and Review. Sci. Total Environ. 2022, 838, 155939. [Google Scholar] [CrossRef]
- Cox, C.; Munk, W. Measurement of the Roughness of the Sea Surface from Photographs of the Sun’s Glitter. J. Opt. Soc. Am. 1954, 44, 838–850. [Google Scholar] [CrossRef]
- Apel, J.R.; Byrne, H.M.; Proni, J.R.; Charnell, R.L. Observations of Oceanic Internal and Surface Waves from the Earth Resources Technology Satellite. J. Geophys. Res. 1975, 80, 865–881. [Google Scholar] [CrossRef]
- Jackson, C. Internal Wave Detection Using the Moderate Resolution Imaging Spectroradiometer (MODIS). J. Geophys. Res. Oceans 2007, 112, C11012. [Google Scholar] [CrossRef]
- Matthews, J.P.; Awaji, T. Synoptic Mapping of Internal-Wave Motions and Surface Currents near the Lombok Strait Using the Along-Track Stereo Sun Glitter Technique. Remote Sens. Environ. 2010, 114, 1765–1776. [Google Scholar] [CrossRef]
- Hennings, I.; Doerffer, R.; Germany, E.R. Comparison of Submarine Relief Features on a Radar Satellite Image and on a Skylab Satellite Photograph. Int. J. Remote Sens. 1988, 9, 45–67. [Google Scholar] [CrossRef]
- Shao, H.; Li, Y.; Li, L. Sun Glitter Imaging of Submarine Sand Waves on the Taiwan Banks: Determination of the Relaxation Rate of Short Waves. J. Geophys. Res. Oceans 2011, 116, C06024. [Google Scholar] [CrossRef]
- Hu, C.; Li, X.; Pichel, W.G.; Muller-Karger, F.E. Detection of Natural Oil Slicks in the NW Gulf of Mexico Using MODIS Imagery. Geophys. Res. Lett. 2009, 36, L01604. [Google Scholar] [CrossRef]
- Lu, Y.; Sun, S.; Zhang, M.; Murch, B.; Hu, C. Refinement of the Critical Angle Calculation for the Contrast Reversal of Oil Slicks under Sunglint. J. Geophys. Res. Oceans 2016, 121, 148–161. [Google Scholar] [CrossRef]
- Wang, C.; Zhang, H.; Xu, Q.; Cao, W.; Wang, J.; Li, D.; Lou, X. Inversion of the Refractive Index of Marine Spilled Oil Using Multi-Angle Sun Glitter Images Acquired by the ASTER Sensor. Remote Sens. Environ. 2022, 275, 113019. [Google Scholar] [CrossRef]
- Wang, D.; Zhao, L.; Zhang, H.; Wang, J.; Lou, X.; Chen, P.; Fan, K.; Shi, A.; Li, D. On Optimal Imaging Angles in Multi-Angle Ocean Sun Glitter Remote-Sensing Platforms to Observe Sea Surface Roughness. Sensors 2019, 19, 2268. [Google Scholar] [CrossRef]
- Wierzbicki, D. Multi-Camera Imaging System for UAV Photogrammetry. Sensors 2018, 18, 2433. [Google Scholar] [CrossRef]
- Cramer, M.; Przybilla, H.J.; Zurhorst, A. UAV Cameras: Overview and Geometric Calibration Benchmark. Int. Arch. Photogramm. Remote Sens. Spat. Inf. Sci. ISPRS Arch. 2017, 42, 85–92. [Google Scholar] [CrossRef]
- Vanhellemont, Q. Adaptation of the Dark Spectrum Fitting Atmospheric Correction for Aquatic Applications of the Landsat and Sentinel-2 Archives. Remote Sens. Environ. 2019, 225, 175–192. [Google Scholar] [CrossRef]
- Hsu, S.A.; Meindl, E.A.; Gilhousen, D.B. Determining the Power-Law Wind-Profile Exponent under near-Neutral Stability Conditions at Sea. J. Appl. Meteorol. 1994, 33, 757–765. [Google Scholar] [CrossRef]
- Mobley, C. Light and Water: Radiative Transfer in Natural Waters Light and Waters; Academic Press: Cambridge, MA, USA, 1994; 592p. [Google Scholar]
- Tang, J.; Tian, G.; Wang, X.; Wang, X.; Song, Q. The Methods of Water Spectra Measurement and Analysis I: Above-Water Method. J. Remote Sens. 2004, 8, 37–44. [Google Scholar] [CrossRef]
- Castro, C.C.; Gómez, J.A.D.; Martín, J.D.; Sánchez, B.A.H.; Arango, J.L.C.; Tuya, F.A.C.; Díaz-Varela, R. An UAV and Satellite Multispectral Data Approach to Monitor Water Quality in Small Reservoirs. Remote Sens. 2020, 12, 1514. [Google Scholar] [CrossRef]
- Wang, M.; Hu, Q.; Zhu, X.; Lu, Y.; Jiao, J.; Zhou, J.; Ju, W.; Chen, Z.; Li, C.; Huang, Y.; et al. Correction of Multi-Scale Sunglint Reflections from the Water Surface in Airborne High-Spatial Resolution Optical Images. Opt. Express 2022, 30, 45910–45917. [Google Scholar] [CrossRef] [PubMed]
- Gordon, H.R. Atmospheric Correction of Ocean Color Imagery in the Earth Observing System Era. J. Geophys. Res. Atmos. 1997, 102, 17081–17106. [Google Scholar] [CrossRef]
- Jackson, C.R.; Alpers, W. The Role of the Critical Angle in Brightness Reversals on Sunglint Images of the Sea Surface. J. Geophys. Res. Oceans 2010, 115, C09019. [Google Scholar] [CrossRef]
- Zhang, H.; Wang, M. Evaluation of Sun Glint Models Using MODIS Measurements. J. Quant. Spectrosc. Radiat. Transf. 2010, 111, 492–506. [Google Scholar] [CrossRef]
- Zhang, H.; Yang, K.; Lou, X.; Li, Y.; Zheng, G.; Wang, J.; Wang, X.; Ren, L.; Li, D.; Shi, A. Observation of Sea Surface Roughness at a Pixel Scale Using Multi-Angle Sun Glitter Images Acquired by the ASTER Sensor. Remote Sens. Environ. 2018, 208, 97–108. [Google Scholar] [CrossRef]
- Zhou, Y.; Lu, Y.; Shen, Y.; Ding, J.; Zhang, M.; Mao, Z. Polarized Remote Inversion of the Refractive Index of Marine Spilled Oil from PARASOL Images under Sunglint. IEEE Trans. Geosci. Remote Sens. 2020, 58, 2710–2719. [Google Scholar] [CrossRef]
- Munk, W. An Inconvenient Sea Truth: Spread, Steepness, and Skewness of Surface Slopes. Ann. Rev. Mar. Sci. 2009, 1, 377–415. [Google Scholar] [CrossRef]
- Wu, X.; Lu, Y.; Jiao, J.; Ding, J.; Fu, W.; Qian, W. Using Sea Wave Simulations to Interpret the Sunglint Reflection Variation with Different Spatial Resolutions. IEEE Geosci. Remote Sens. Lett. 2020, 19, 1–4. [Google Scholar] [CrossRef]
- Yurovskaya, M.; Rascle, N.; Kudryavtsev, V.; Chapron, B.; Marié, L.; Molemaker, J. Wave Spectrum Retrieval from Airborne Sunglitter Images. Remote Sens. Environ. 2018, 217, 61–71. [Google Scholar] [CrossRef]
- Santer, R.; Schmechtig, C. Adjacency Effects on Water Surfaces: Primary Scattering Approximation and Sensitivity Study. Appl. Opt. 2000, 39, 361–375. [Google Scholar] [CrossRef] [PubMed]
- Muslim, A.M.; Chong, W.S.; Safuan, C.D.M.; Khalil, I.; Hossain, M.S. Coral Reef Mapping of UAV: A Comparison of Sun Glint Correction Methods. Remote Sens. 2019, 11, 2422. [Google Scholar] [CrossRef]
- Zeng, C.; Richardson, M.; King, D.J. The Impacts of Environmental Variables on Water Reflectance Measured Using a Lightweight Unmanned Aerial Vehicle (UAV)-Based Spectrometer System. ISPRS J. Photogramm. Remote Sens. 2017, 130, 217–230. [Google Scholar] [CrossRef]
- Carnesecchi, F.; Byfield, V.; Cipollini, P.; Corsini, G.; Diani, M. An Optical Model for the Interpretation of Remotely Sensed Multispectral Images of Oil Spill. Remote Sens. Ocean Sea Ice Large Water Reg. 2008 2008, 7105, 11–22. [Google Scholar] [CrossRef]
- Chen, J.; Guo, W.; Xia, M.; Li, W.; Yang, K. In Situ Measurement of Seawater Salinity with an Optical Refractometer Based on Total Internal Reflection Method. Opt. Express 2018, 26, 25510–25523. [Google Scholar] [CrossRef]
- Huibers, P.D.T. Models for the Wavelength Dependence of the Index of Refraction of Water. Appl. Opt. 1997, 36, 3785–3787. [Google Scholar] [CrossRef]


Disclaimer/Publisher’s Note: The statements, opinions and data contained in all publications are solely those of the individual author(s) and contributor(s) and not of MDPI and/or the editor(s). MDPI and/or the editor(s) disclaim responsibility for any injury to people or property resulting from any ideas, methods, instructions or products referred to in the content. |
© 2025 by the authors. Licensee MDPI, Basel, Switzerland. This article is an open access article distributed under the terms and conditions of the Creative Commons Attribution (CC BY) license (https://creativecommons.org/licenses/by/4.0/).