Article

Effect of Deformation Path on the Microstructure and Mechanical Behavior of TWIP980 Steel

by
António B. Pereira
*,
Fábio A.O. Fernandes
and
Bruno Filipe
TEMA-Centre for Mechanical Technology and Automation, Department of Mechanical Engineering, University of Aveiro, Campus de Santiago, 3810-193 Aveiro, Portugal
*
Author to whom correspondence should be addressed.
J. Manuf. Mater. Process. 2019, 3(1), 12; https://doi.org/10.3390/jmmp3010012
Submission received: 27 December 2018 / Revised: 16 January 2019 / Accepted: 17 January 2019 / Published: 21 January 2019

Abstract

:
Recent technological advances have made it possible to manufacture steels with both high strength and high ductility. This is the case for Twinning-Induced Plasticity (TWIP) steels which are characterized by a twinning deformation mechanism, which is responsible for its excellent properties. In this work, TWIP980 steel was tested under tensile loading along the rolling direction until pre-deformations of 10%, 20%, and 30% were reached. In order to assess the effect of the deformation path, the pre-deformed samples were reloaded in directions of 0°, 45° and 90° against the rolling direction. Microstructural analysis was performed by means of optical microscopy, scanning electron microscopy (SEM), and transmission electron microscopy (TEM). The yield stress increased with the imposed deformation for all the tested directions. As the strain path changed from 0° to 90°, the yield stress for reload decreased, and the Bauschinger effect and permanent softening was observed. The yield plateau was observed as being directly influenced by deformation path without influence by strain rate and temperature.

1. Introduction

Twinning-Induced Plasticity (TWIP) steels are characterized by a high Mn content, which is responsible for their austenite stability at room temperature. Due to their austenitic microstructure, TWIP steels are highly ductile at room temperature and for any plastic strain. These steels can reach strains of 80%, since its mechanism of plastic deformation is twinning instead of slip (typical of the majority of steels) or even phase transformation (typical of Transformation Induced Plasticity [TRIP) steels) [1]. A detailed description of deformation twinning can be found in [2].
TWIP steels are characterized by both high strength and superior formability [3,4]. According to Bouaziz and Guelton [5], deformation twinning results in an increased strain hardening rate by the creation of twin boundaries which act as effective obstacles to dislocation glide by a dynamic Hall–Petch effect. Several authors have been trying to characterize the deformation mechanisms by twinning in TWIP steels [6,7,8,9,10,11]. Basically, this deformation mechanism results in steels with high strength and ductility, making TWIP steels highly attractive for several industries such as the automotive industry [12]. Idrissi et al. [8] observed a high density of dislocations within the twins at early stages of deformation, which can affect the growth and the stability of the twins as well as their strength and interactions with the gliding dislocations. More recently, Kim et al. [11] observed the formation of thin twins by Shockley partial dislocations generated in grain boundaries, which indicates nucleation of deformation twins at defect sites on the grain boundary. In addition, Kim et al. [11] reported a high density of Frank partial dislocations inside deformations twins, which affects the growth of deformation twins. Further details on TWIP steel can be found in [13].
Considering the material’s formability, it can be subjected to several loading conditions that might change the strain path. Therefore, this material will have different creep stages. This is an important characteristic in terms of formability, thus it is necessary to investigate the influence of strain path change on mechanical behavior. In recent decades, many authors have been investigating the mechanical behavior dependency of several materials on the strain path change including aluminum [14], magnesium [15], copper [16], and steel [17,18]. Concerning TWIP steel, a few studies were recently carried out [19,20]. Wen et al. [19] investigated the hardening behavior and texture evolution of TWIP steel during strain path change. More recently, Lapovok et al. [20] studied the preferable deformation modes on strain path for TWIP steel.
In this work, the sensitivity of TWIP980 steel (Fe–18Mn–1.5Al–0.6C) to strain path change is studied. The adopted methodology is based on the work carried out by Liao et al. [18] for dual-phase steels. Uniaxial tensile tests were performed on pre-loaded samples in the directions of 0°, 45°, and 90° relatively to the previous load. Additionally, the microstructure of all samples was analyzed via optical microscopy, transmission electron microscopy (TEM), and scanning electron microscopy (SEM).

2. Materials and Methods

2.1. Two-Step Tensile Testing

2.1.1. First Step

A 1.8 mm laminated sheet of TWIP980 steel (Fe–18Mn–1.5Al–0.6C) from POSCO Ltd. (Pohang, Korea) was used. Three samples were machined, as illustrated in Figure 1, to obtain a geometry in accordance with ISO 6892-1:2009 [21]. The length direction of these standard samples is the rolling direction.
The pre-loading was carried out in a Shimadzu UH-1000 kN X universal testing machine. Each sample was subjected to a pre-strain (true strain) of 10%, 20%, and 30%, respectively. These tensile tests were performed at a strain rate of 1 ms−1. In order to measure both longitudinal and transverse strains, a Messphysik ME46NG video extensometer apparatus was used. The data recorded with the video extensometer were interpolated with the force data recorded with the universal testing machine.

2.1.2. Second Step

A total of 15 samples were cut from each pre-loaded sample (5 samples per direction), resulting in a total of 45 pre-loaded samples. These were cut in a Guifil guillotine in three different directions: 0°, 45°, and 90° relative to the rolling direction. Figure 2 shows the cutting of a pre-loaded sample into small samples illustrated in Figure 3.
The tensile tests were performed in a Shimadzu AG-X plus 100 kN universal testing machine. Both pre-loaded and not-loaded samples were tested. From this point, not-loaded and 10%, 20%, and 30% pre-loaded samples are designated as m, p, q, and t, respectively.
All samples were tested at room temperature and with a strain rate of 1 ms−1 until maximum force was reached. In this case, all the data was recorded by the universal testing machine, even transverse and longitudinal strains, since it has a built-in video extensometer. During testing, temperature was monitored using a thermocouple coupled with a universal temperature indicator Numecor I300 (Gefran, Provaglio d’Iseo, Italy).

2.2. Microstructural Analysis

In order to assess the influence of strain path change on strain hardening, all samples were analyzed using optical microscopy, transmission electron microscopy (TEM), and scanning electron microscopy (SEM). The optical microscope used was the Nikon Eclipse LV150 (Nikon, Tokyo, Japan). Preparation for the optical analysis involved the following procedure: Cutting; polishing with SiC papers of 220, 500, and 2000 grit and with diamond paste of 15, 6, and 3 μm; and chemical etching using a Nital solution (98% ethanol (C2H5OH) and 2% nitric acid (HNO3)).
The samples for TEM analysis were cut by punching into 3 mm discs with thicknesses lower than 100 nm. The TEM analysis was carried out in a Hitachi H9000 UHR transmission electron microscope.
The SEM analysis was carried in a Hitachi SU-70 scanning electron microscope, with detection of secondary electrons. The sample preparation for SEM analysis involved the following procedure: Cutting in a Guifil guillotine; polishing with SiC papers of 220 and 500 grit; ultrasonic cleaning with an acetone solvent; 12 V electropolishing for 12 s with a Struers A2 solution in a LetroPol-5 equipment (Struers, FL, USA); and final ultrasonic cleaning with an isopropyl alcohol-based solvent.

3. Results

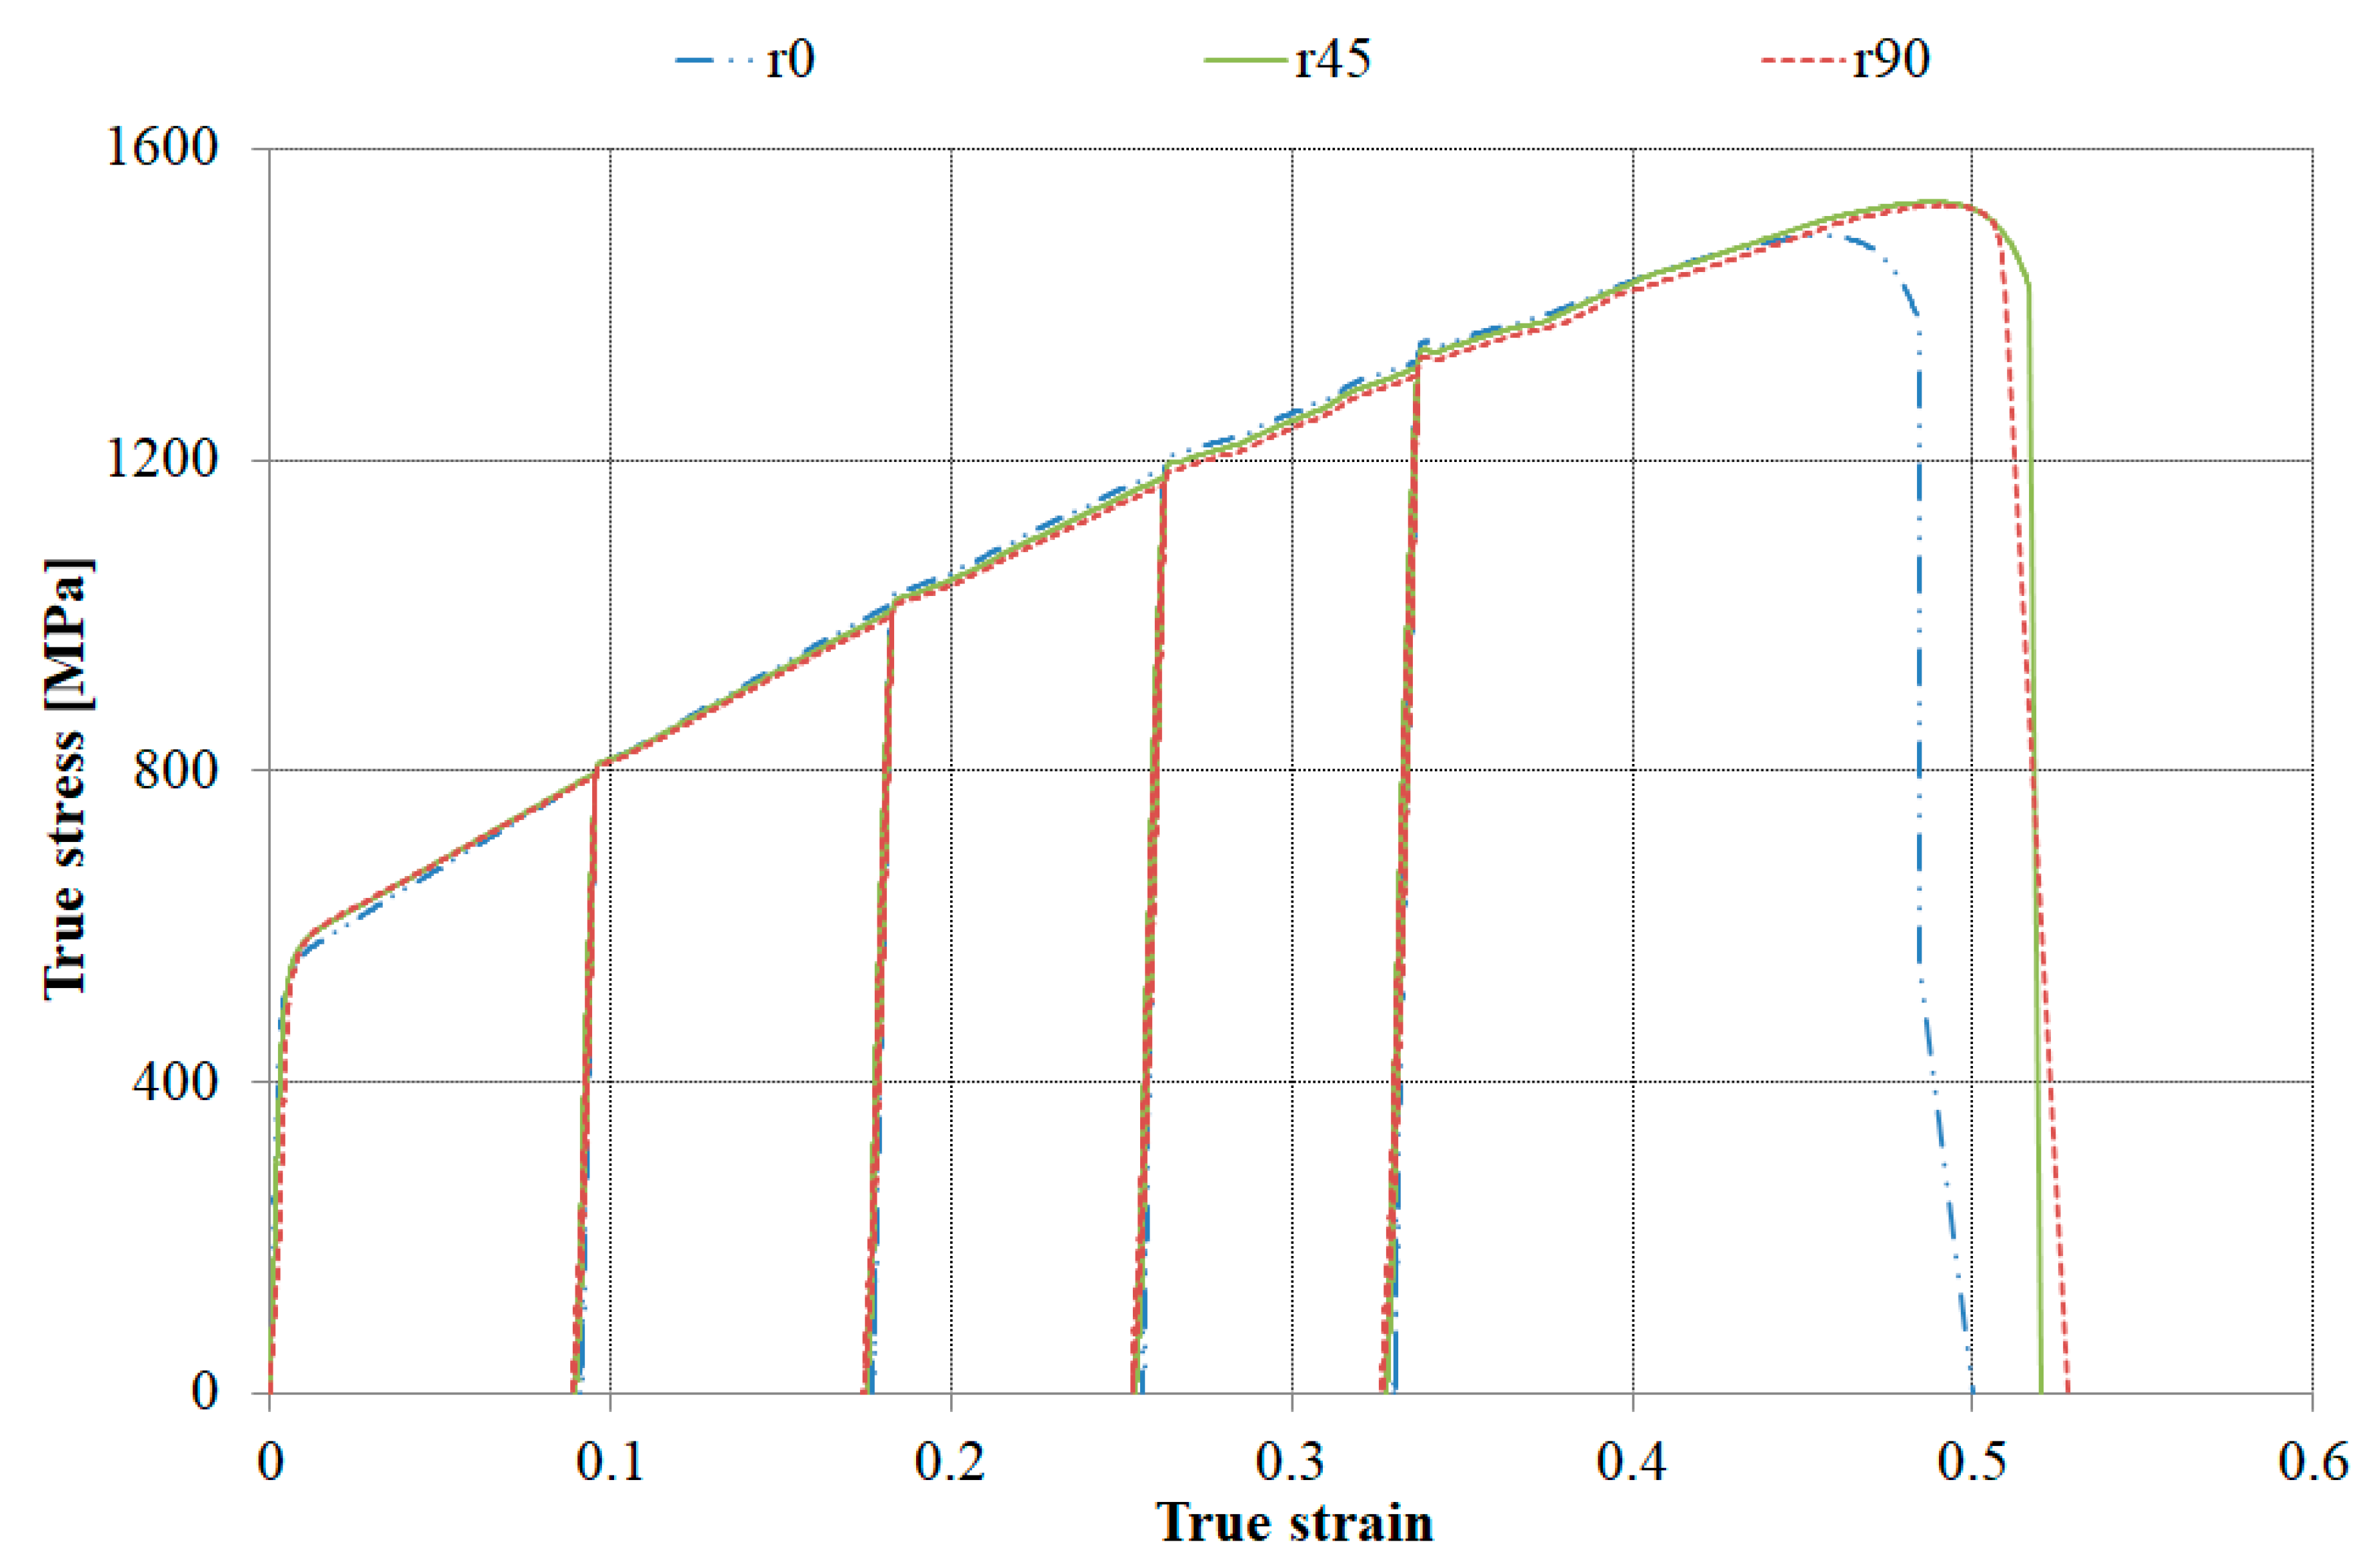
3.1. Tensile Testing

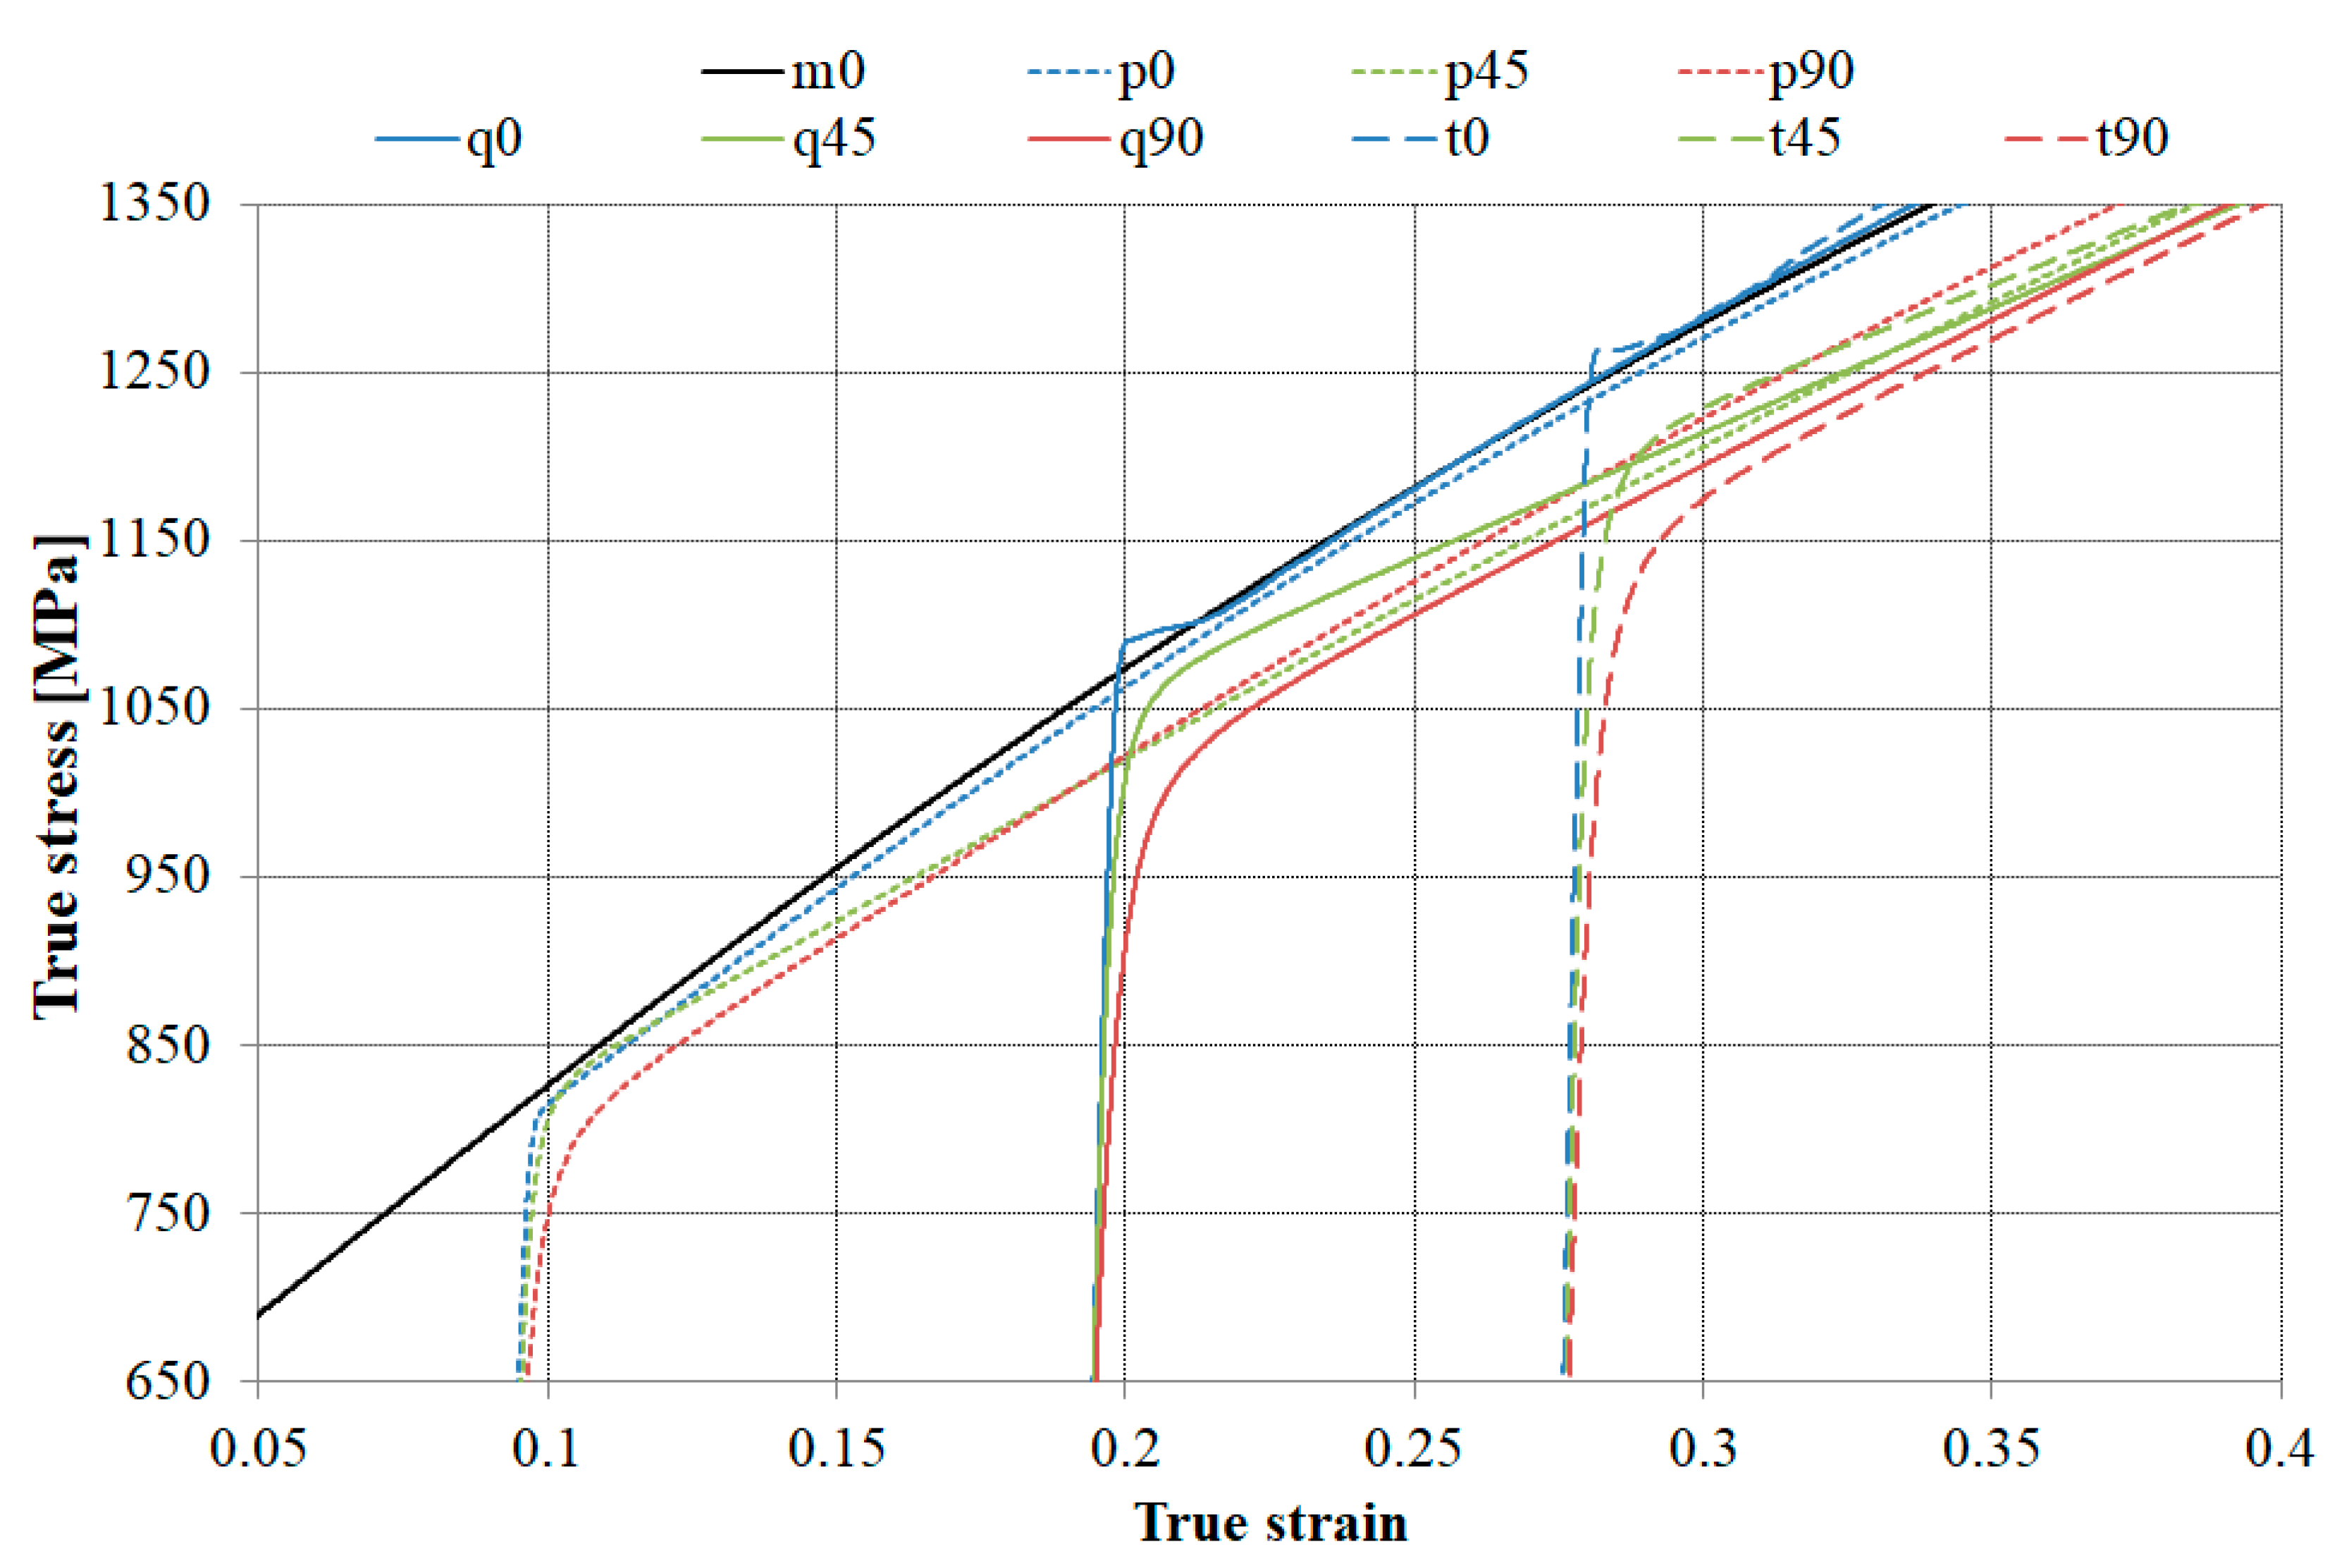
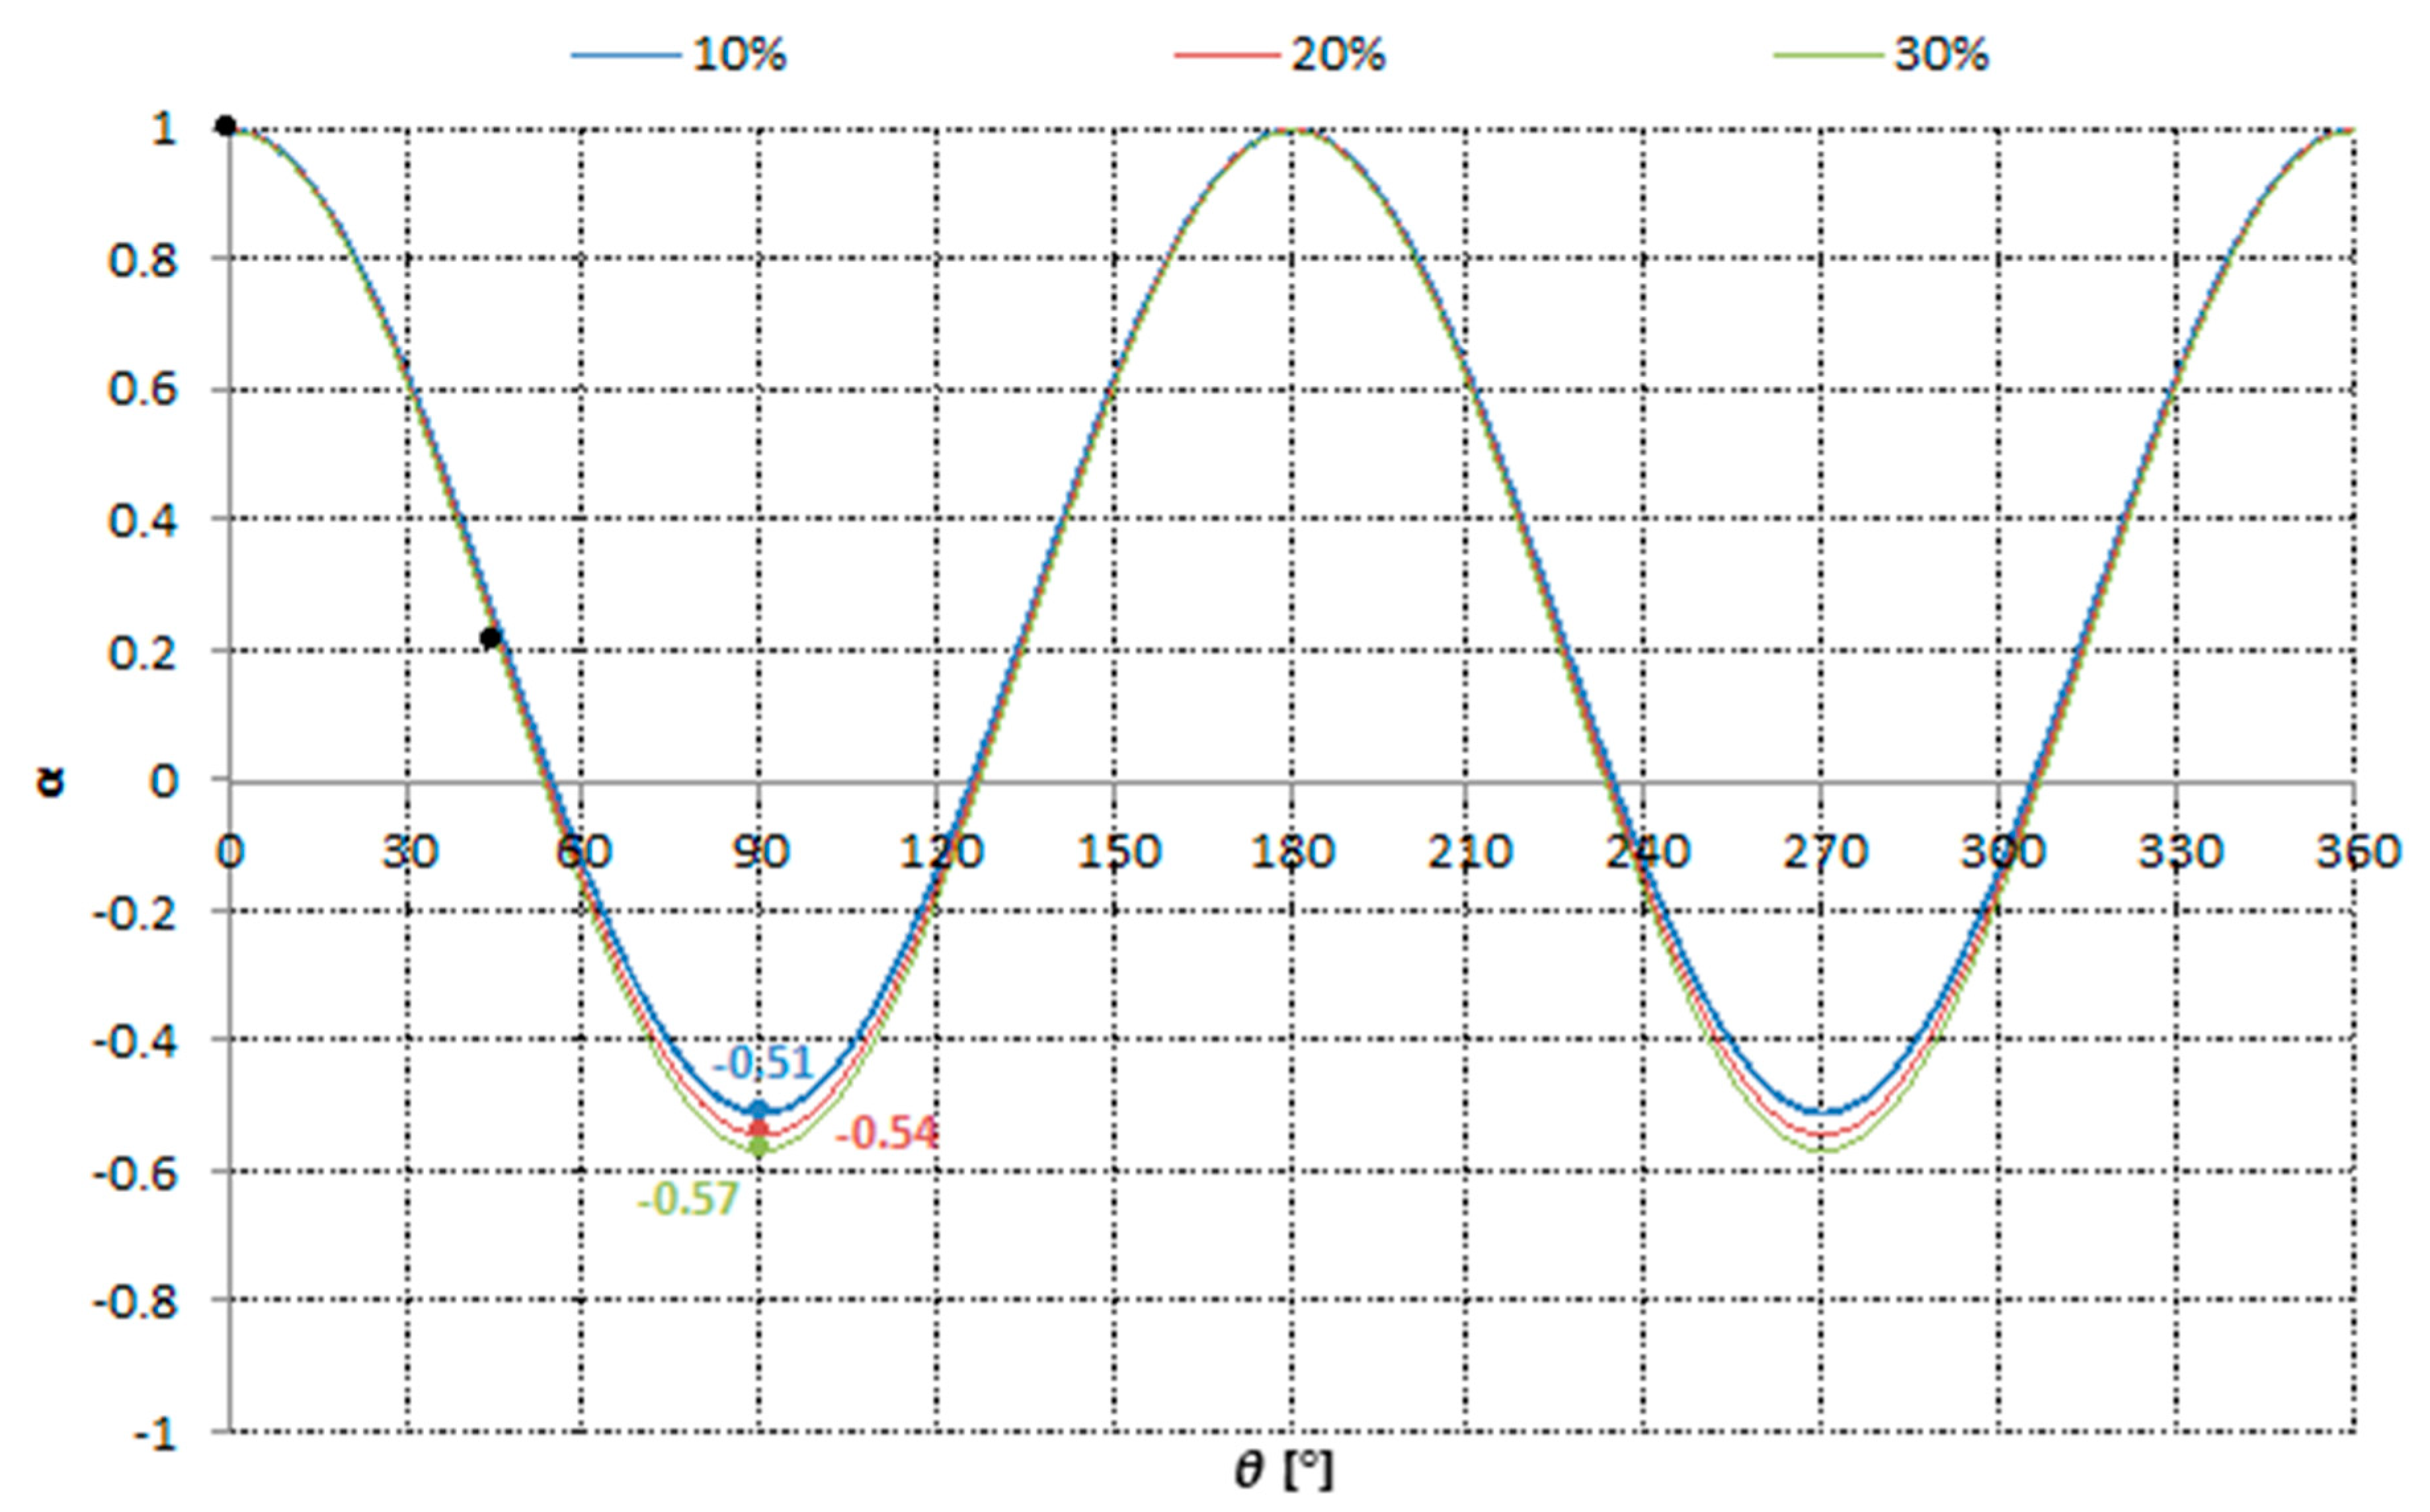
3.1.1. Pre-Deformations and Strain Path Change

Figure 4 shows the mean true stress–strain curves obtained in the tensile tests for the not-loaded sample m0° and pre-loaded samples p (10%), q (20%), and t (30%) for each direction. By analyzing the reloading curves, it can be seen that maximum deformation was obtained in the 90° case, followed by the 45°, and finally 0°. This material presents high strain values due to a high strain hardening rate, which results from the formation of mechanical twins during plastic deformation [22]. The fact that maximum strain is obtained for an angle of 90° might be related to effects of the crystallographic texture.
As expected, the yield strength σy increased with the imposed pre-deformation for any direction. This is justified by the high dislocation density, where the grain walls offer resistance to dislocation [1,23]. The fact that higher yield strengths were obtained for pre-deformations of 30% means there were a higher number of grains with high dislocation density. This was further analyzed in the Section 3.2. Additionally, the material’s ductility is reduced with the increase of pre-deformation. Figure 5 presents a zoomed-in version of the Figure 4 where it is possible to verify that the limit of yield strength for reloading in the 0° direction is very close to the stress curve measured for a not pre-loaded sample (curve m0). The reloading curves for the 0° direction (p0, q0, and t0) follow the monotonic curve m0, except in the region of the yield plateau. The yield strength was lower for the 45° direction and even lower for the 90° case.
In order to further understand the effects of strain path change, the parameter α proposed by Schmitt et al. [24] for a change of strain path was used:
α = ( E p : E ) ( E p : E p ) 1 / 2 ( E : E ) 1 / 2 ,
where Ep is the tensor corresponding to the plastic pre-strain and E is the tensor representing the plastic part of the subsequent deformation. The parameter α (a tensor invariant) is the cosine of the angle between the two vectors, which represent the pre-strain and the subsequent strain in the deformation space [24]. The value of α is related to the activity of slip systems with strain path change and varies between −1 (loading in the reverse direction; reactivating the slip systems but in the opposite direction) and 1 (a very small change of strain path or no change at all; reactivating the same slip systems, and only a slight increase of the stress is expected).
Figure 6 presents the evolution of α relative to the load angle θ for pre-strains of 10%, 20%, and 30%. For θ = 0°, α has a value of 1, independent of the pre-deformation. Therefore, for pre-loading and reloading in the same direction, the same slip systems were activated, which explains why all reload curves for θ = 0° (p0, q0, and t0) follow the monotonic curve m0.
For θ = 45°, α was practically the same for all the pre-deformations. A value of approximately 0.22 was obtained. For θ = 90°, negative α values were obtained: −0.51, −0.54 and −0.57 for pre-deformations of 10%, 20% and 30%, respectively. Therefore, by correlating results from Figure 5 and Figure 6, it is possible to conclude that for θ = 0°, σy decreases with α and diverging from the yield strength for pre-deformation. This difference between yield strengths can be justified by the presence of internal stresses known as back stress, which contributes to the activation of irreversible displacements created during pre-deformation [25]. Therefore, the stress required to reach the critical resolved shear stress (CRSS) in order to activate the reversible displacements in the slip systems during reloading is lower.
The greater the strain path change, the lower the value for α, meaning the probable reversible displacement of defects in slip systems previously activated, which makes the material easier to deform, and thus lowering its σy. For θ = 90°, α is around −0.5, which is close to the reverse loading (α = −1), thus increasing back stress and resulting in the Bauschinger effect and consequently softening the material [25]. The same effects were observed by Wen et al. [15] for AZ31 magnesium alloy.
In Figure 7, it is possible to observe the yield plateau for a θ = 0° for 20% and 30% pre-loaded samples. For samples without pre-loading or pre-loading for θ = 0°, there is no yield plateau, as shown in Figure 4. The same is verified for all samples tested for θ = 45° and 90° independently of the pre-deformation level. Therefore, the yield plateau increases with the pre-deformation, occurring only when reloaded in the same direction (θ = 0°).

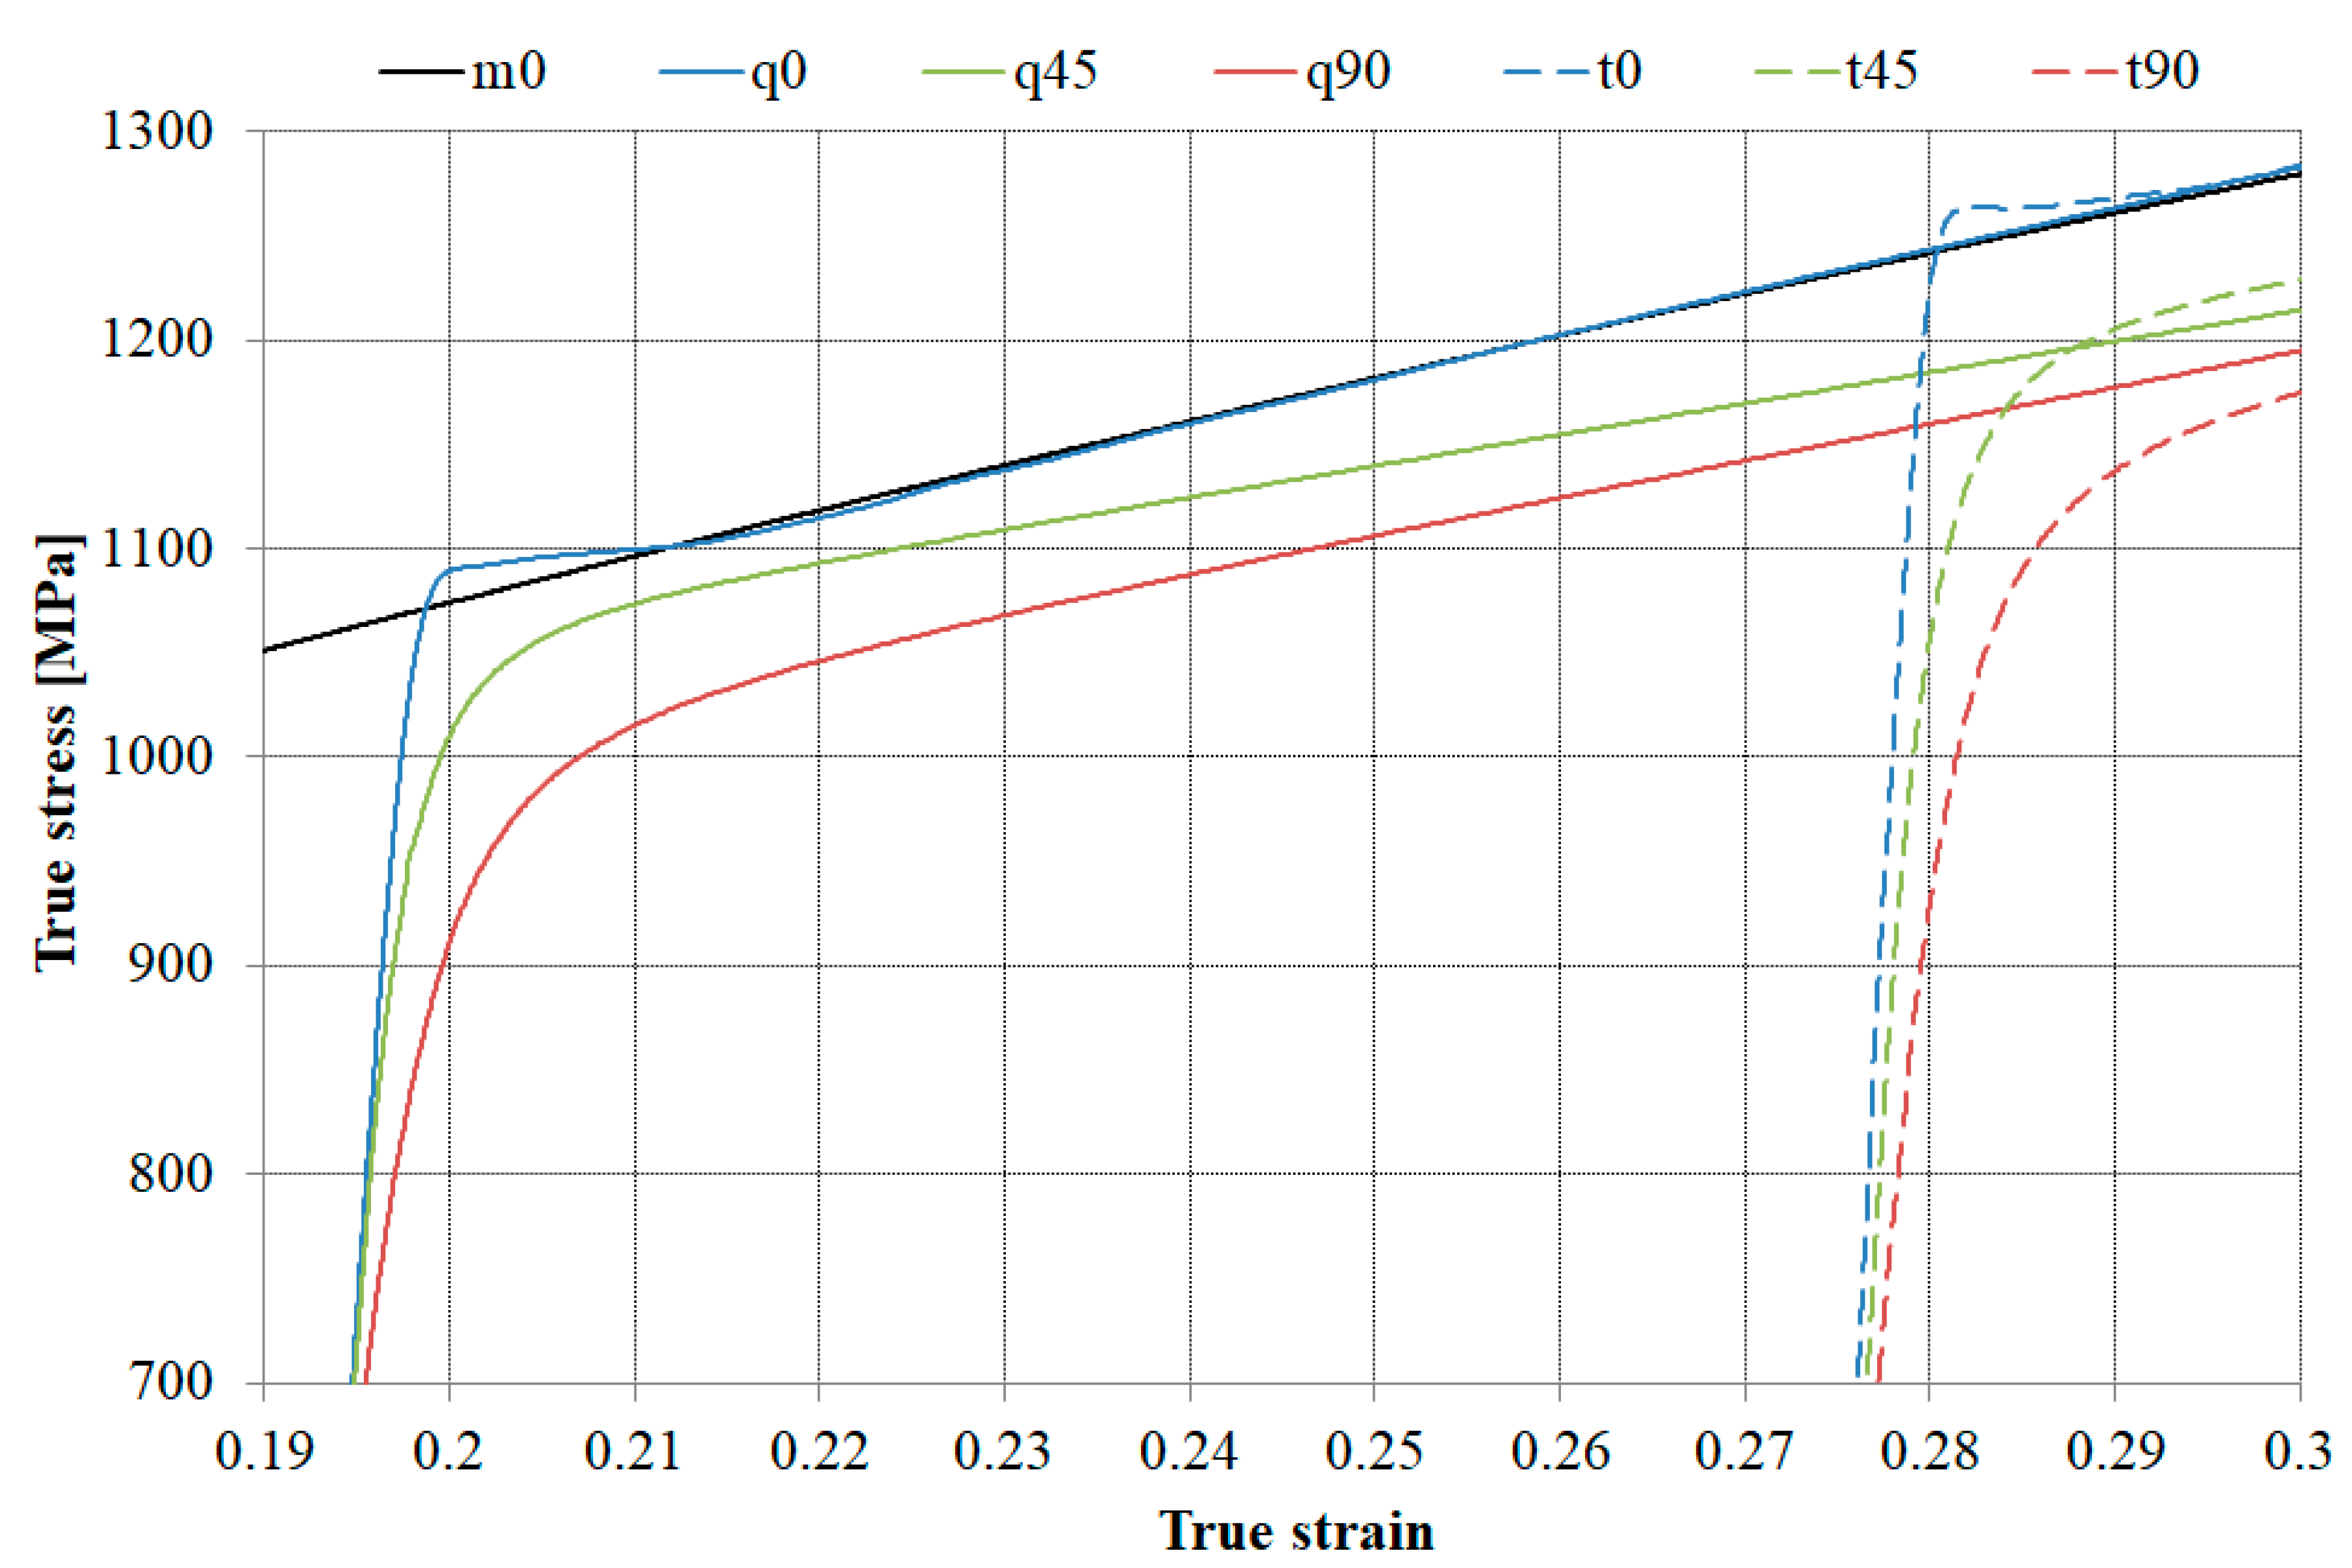
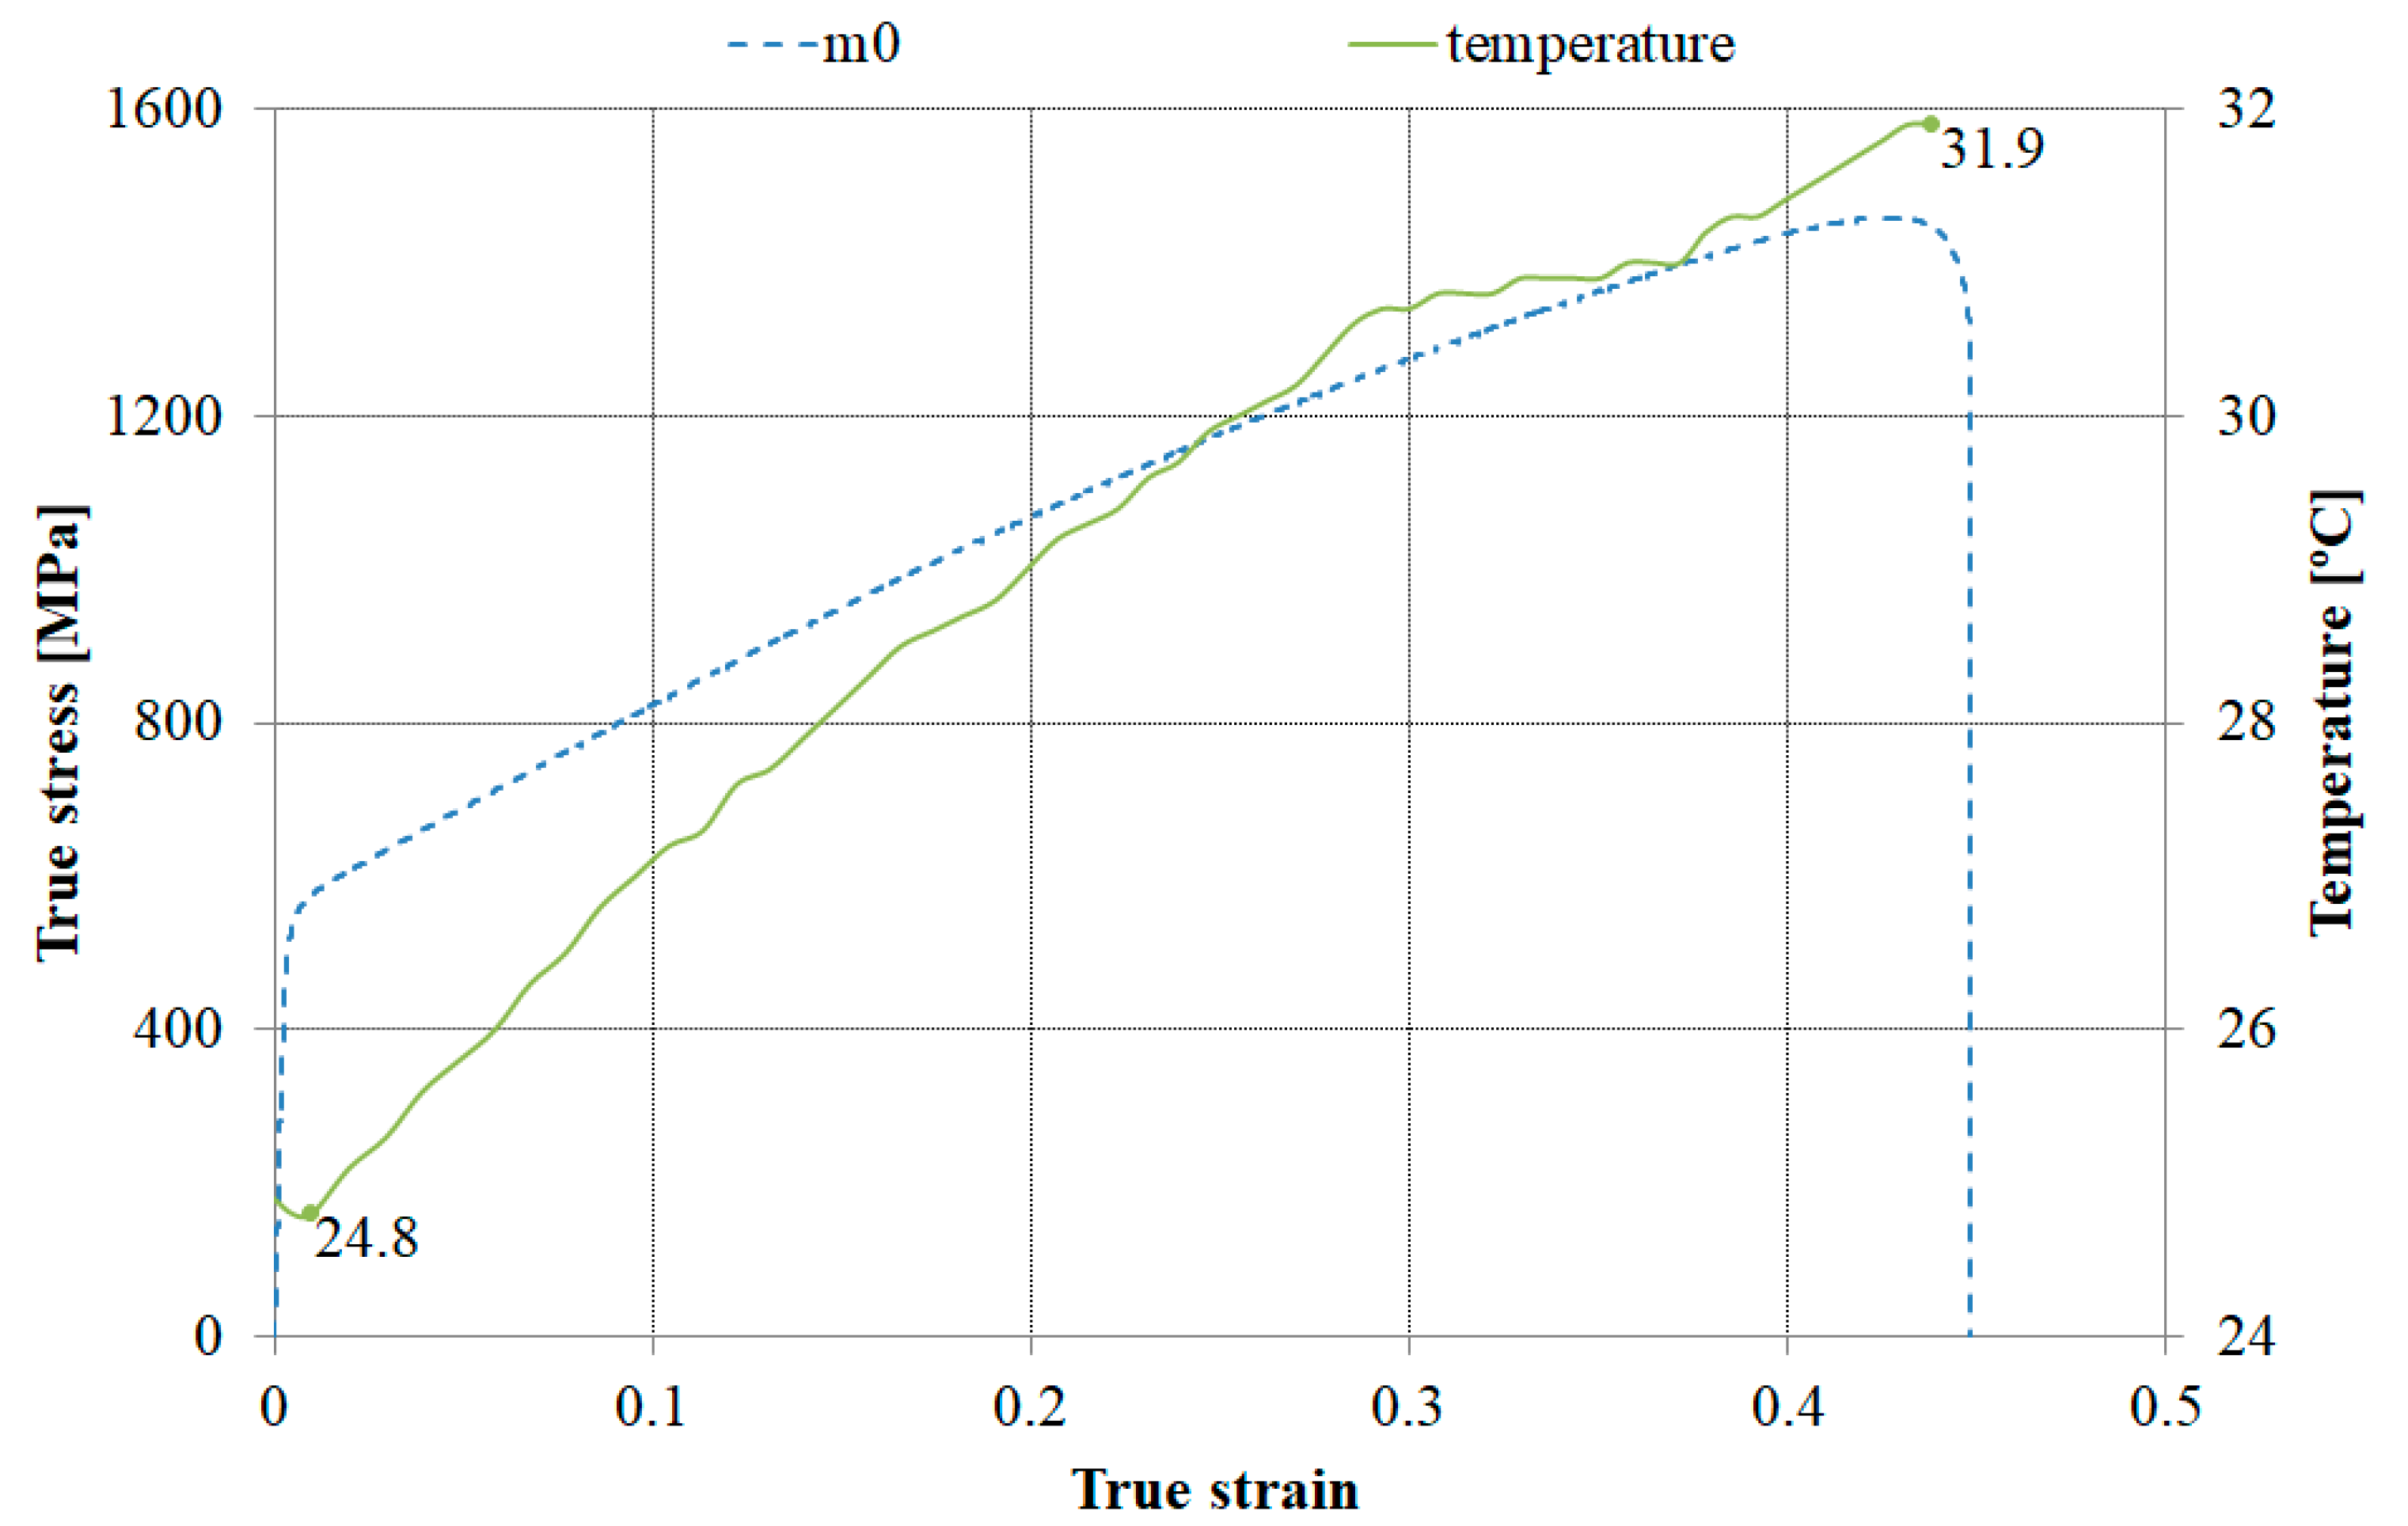
3.1.2. Influence of Deformation Path, Strain Rate, and Sample Temperature on the Yield Plateau

In order to verify and further investigate the yield plateau dependency on reload direction, uniaxial tensile loading-unloading cycles were performed on undeformed samples (m) in all three directions (0°, 45°, and 90°). Figure 8 presents the results of these tests, where it is clear yield plateau exists for reloads in any direction. Therefore, yield plateau always occurs when the material is reloaded in the same direction, which means for α = 1, it occurs independently of the direction. Figure 9 highlights the yield plateaus presented in Figure 8.
Additional parameters were evaluated in order to assess their influence on the yield plateau: The machine’s loading velocity in the elastic–plastic transition and the sample temperature during tensile testing. Regarding the machine’s velocity, TWIP steels are known to exhibit an often negative strain rate sensitivity [26,27]. Thus, a possible change of the machine’s loading velocity during testing might result in the yield plateau observed in Figure 7 for samples q and t with θ = 0°.
It is important to guarantee the same loading speed v during the entire test. It can be computed by considering the machine’s crosshead displacement δ for a defined loading frequency f as follows:
v = f ( δ t i + 1 δ t i ) ,
where δti and δti+1 are the displacement of the crosshead for two consecutive increments. Figure 10 presents the true stress–strain curve for a 20% pre-deformed sample and θ = 0°. Additionally, the values computed for v during the entire test are also presented. Although it is possible to observe a yield plateau, v was constant during the entire test. Therefore, the yield stress plateau was not caused by strain rate variations.
Temperature variation due to dissipated energy during deformation and its influence on the materials’ strain hardening or softening was also assessed in order to determine its effects on the yield plateau. Figure 11 presents the temperature variation for a sample during the entire tensile test. Although there is an increase of 7.1 °C on the sample’s surface during the entire test, this low increase of temperature was not significant enough to affect the material’s mechanical properties.

3.1.3. Mechanical Properties

Table 1 presents the mean values of mechanical properties computed for all cases. The analyzed properties were: Yield stress σy, maximum stress σmax, yield stress-to-maximum stress ratio σy/σmax, uniform elongation e, strain hardening exponent n, and strength coefficient K. All the calculated values were based on true stress and true strain.
The loading direction with lower σy/σmax was θ = 90° and resulted in a higher ductility and hardening capacity. Thus, the properties obtained for θ = 90° make the material a better option for forming processes. e was higher for θ = 90° and lower for θ = 0° as expected, since σy was lower for θ = 90° and higher for θ = 0°. The greatest value of n was obtained for θ = 90°, independent of the pre-strain. As already explained, this is justified by its low σy, resulting in a high hardening capacity.

3.2. Microstructure

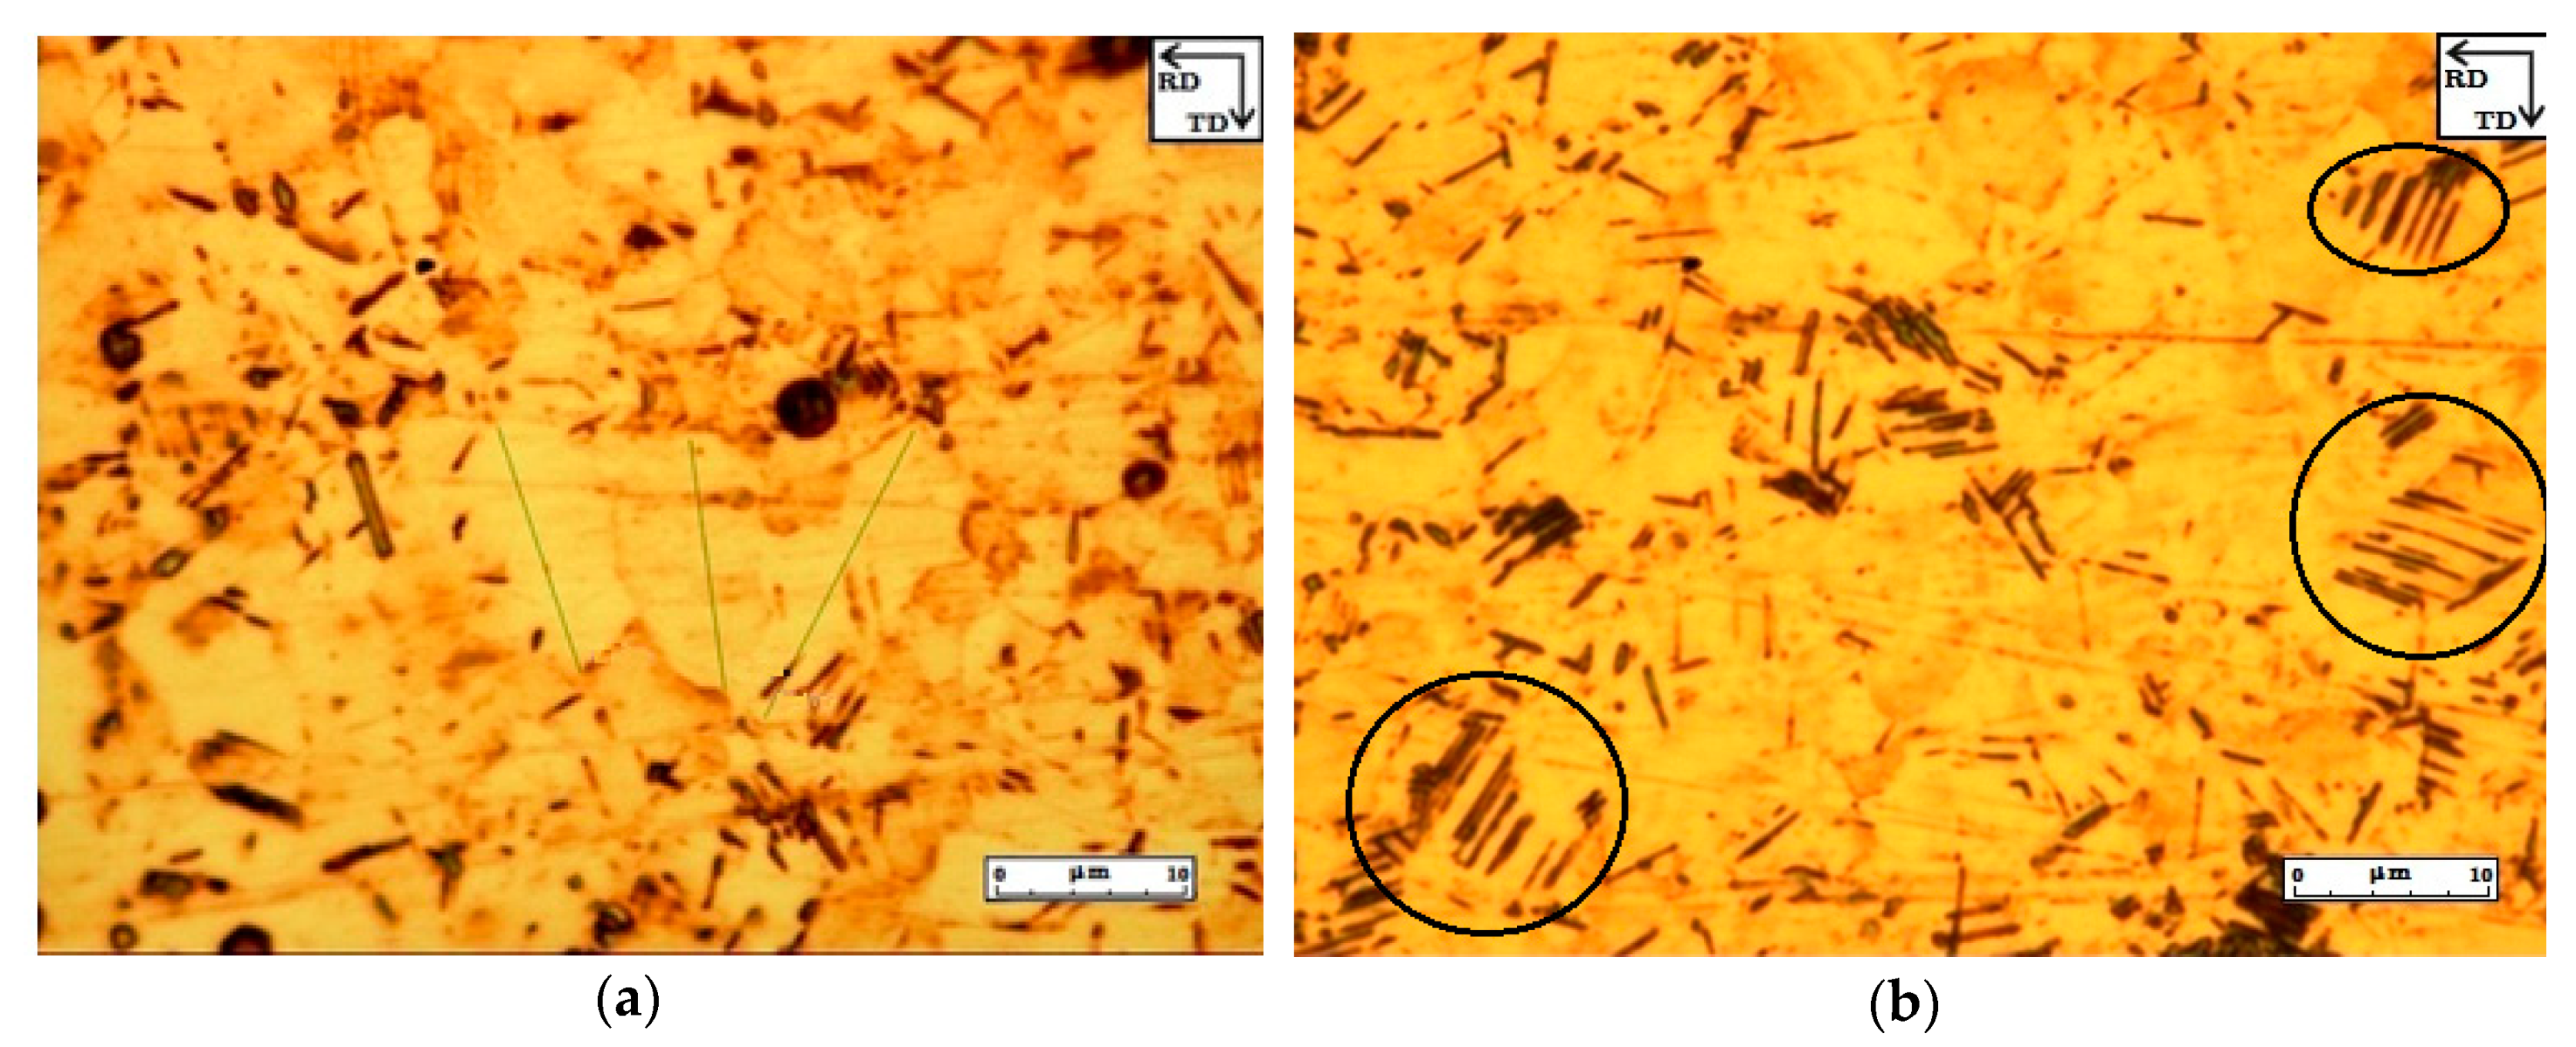
3.2.1. Optical Microscopy

Figure 12 presents images obtained in the optical microscope for all cases: Undeformed; preloaded until 10%, 20%, and 30% of strain; and an additional case of a sample deformed until maximum force was reached. In Figure 12a, it is possible to observe an overall disorganized crystal structure that is not aligned with the rolling direction. For deformed samples (Figure 12b–e), it is possible to spot the formation of mechanical twins triggered by the deformation. For a 30% strain (Figure 12d), microstructural changes are clear, with the grains aligned with the rolling direction. In the maximum force case, the entire microstructure is oriented according with the loading direction, with a great number of mechanical twins.
The increase on the number of twins with the level of deformation makes it harder for slip mechanisms. The mechanical twins, in a similar way to grain boundaries, are barriers to the displacements, refining its microstructure and increasing the material’s hardening capacity. This is the mechanism responsible for the high ductility and high strength of TWIP steels.

3.2.2. Transmission Electron Microscopy

Figure 13a depicts an image obtained by TEM for an undeformed sample. Its microstructure presents a full recrystallization of the grains, with some twins present. Obviously, these are not caused by deformation but rather by a heat treatment or even by its lamination, thus forming annealing twins. The Automated Crystal Orientation Mapping on TEM–ACOM/TEM software was used to investigate the grains and twins orientation. In the studied region, the twin orientation makes a 60° angle with the grain orientation and has a size of 220 nm.
Figure 13b shows the microstructure of a 10% deformed sample. The majority of the grains present a high dislocation density with a small number of deformation twins. By using the ACOM/TEM software, the same orientation for twins formed during heat treatments was observed (60° relative to the grain orientation). Nevertheless, its mean size is 30 nm. In Figure 13c, the same was observed for 20% deformed samples, i.e., same orientation and size. Figure 13d depicts the microstructure of a sample deformed until maximum force was reached (40% true strain). It is clear that there is a high density of dislocations and deformation twins. The analyzed region is the black line in Figure 13e.
Figure 14a highlights the high density of dislocations found in the higher deformation level, confirming the dislocation density dependency on the level of deformation. It is also worth pointing out the high twinning rate and its uniformity, as shown in Figure 14b.
Overall, the majority of the grains seem to be free of deformation twinning until 10% of deformation, which indicates that deformation occurs mainly by slipping between crystallographic planes. By increasing the level of deformation, the twinning density increases, resulting in barriers for displacements, and thus increasing the material strength and ductility.
Figure 15 plots the density of dislocations for each level of deformation, which was determined by using the ACOM/TEM software to analyze the TEM micrographs. These values clearly confirm that the number of dislocations increases with deformation, especially when the maximum force is reached.

3.2.3. Scanning Electron Microscopy

Figure 16 presents the images obtained with SEM where it is possible to clearly distinguish the deformation twins. Figure 16a shows the twins arising due to heat treatments or rolling process. The number of twinned grains was visually determined and used to establish a relation between the increase of twinned grains and the level of deformation (Figure 17). The average grain size determined with SEM was 8 μm, without taking into account the original ones from Figure 16a.
By analyzing Figure 16, it is possible to conclude that deformation twinning is higher for the 30% strain (Figure 16d). Until the 20% strain, the slip mechanism was predominant, but for a 30% strain, twinning was predominant. From Figure 16a–d, it is possible to observe the increase of deformation twins that create new crystallographic orientations and act as barriers to dislocations, resulting in high ductility and strength. This is clearly shown by the increasing number of grains with deformation as plotted in Figure 17.

4. Discussions and Conclusions

In this work, the mechanical characterization of TWIP980 steel for different strain paths was performed. It was observed that:
  • The yield stress increased with the level of deformation, independent of the loading direction;
  • The highest yield stress was obtained for a θ = 0°, followed by 45°, and lastly by 90°, mainly due to back stress;
  • Yield plateaus occur for cases of reloading in the same direction (α = 1).
The microstructural characterization confirmed the behaviors found in the mechanical characterization. It was clear that the increase of barriers in grains (dislocations and twins) with the level of deformation increased the material hardening, and thus increasing its yield stress.
The plateau is generally associated with a rapid formation and action of dislocations from specific locations that become insignificant. To eliminate this plateau, Kim [28] suggests the uniformization of the density of dislocations, i.e., their alignment with the loading direction.
Figure 18 shows how the yield plateau increases by reducing the loading rate (and thus the strain rate). By increasing the unloading time, there is a higher re-organization of the microstructure, and thus there is a higher density of dislocations that return to their preferred orientations. Therefore, when reloading and aiming to align the dislocations with the loading direction, the elimination of dislocations that are not aligned with the loading direction occurs in the yield plateau. With the increase in the density of dislocations that return to preferred orientations, the yield plateau increases with the unloading duration (lower unloading speed) and deformation.

Author Contributions

Conceptualization, A.B.P.; Methodology, A.B.P.; Software, B.F.; Formal Analysis, A.B.P. and B.F.; Investigation, A.B.P., F.A.O.F. and B.F.; Resources, A.B.P.; Data Curation, B.F. and F.A.O.F.; Writing-Original Draft Preparation, F.A.O.F.; Writing-Review & Editing, F.A.O.F. and A.B.P.; Visualization, F.A.O.F.; Supervision, A.B.P.; Project Administration, A.B.P.; Funding Acquisition, A.B.P. and F.A.O.F.

Funding

This research was funded by FCT: UID/EMS/00481/2013-FCT and CENTRO-01-0145-FEDER-022083.

Acknowledgments

Fundação para a Ciência e a Tecnologia (FCT): CEECIND/01192/2017.

Conflicts of Interest

The authors declare no conflict of interest.

References

  1. Gutierrez-Urrutia, I.; Raabe, D. Dislocation and twin substructure evolution during strain hardening of an Fe–22 wt.% Mn–0.6 wt.% C TWIP steel observed by electron channeling contrast imaging. Acta Mater. 2011, 59, 6449–6462. [Google Scholar] [CrossRef]
  2. Christian, J.W.; Mahajan, S. Deformation twinning. Prog. Mater. Sci. 1995, 39, 1–157. [Google Scholar] [CrossRef]
  3. Bouaziz, O.; Allain, S.; Scott, C.P.; Cugy, P.; Barbier, D. High manganese austenitic twinning induced plasticity steels: A review of the microstructure properties relationships. Curr. Opin. Solid State Mater. Sci. 2011, 15, 141–168. [Google Scholar] [CrossRef]
  4. De Cooman, B.C.; Chin, K.; Kim, J. High Mn TWIP Steels for Automotive Applications. New Trends Dev. Automot. Syst. Eng. 2011. [Google Scholar] [CrossRef] [Green Version]
  5. Bouaziz, O.; Guelton, N. Modelling of TWIP effect on work-hardening. Mater. Sci. Eng. A 2001, 319–321, 246–249. [Google Scholar] [CrossRef]
  6. Karaman, I.; Sehitoglu, H.; Gall, K.; Chumlyakov, Y.; Maier, H. Deformation of single crystal Hadfield steel by twinning and slip. Acta Mater. 2000, 48, 1345–1359. [Google Scholar] [CrossRef]
  7. Bracke, L.; Kestens, L.; Penning, J. Direct observation of the twinning mechanism in an austenitic Fe-Mn-C steel. Scr. Mater. 2009, 61, 220–222. [Google Scholar] [CrossRef]
  8. Idrissi, H.; Renard, K.; Ryelandt, L.; Schryvers, D.; Jacques, P.J. On the mechanism of twin formation in Fe–Mn-C TWIP steels. Acta Mater. 2010, 58, 2464–2476. [Google Scholar] [CrossRef]
  9. Liu, J.B.; Liu, X.H.; Liu, W.; Zeng, Y.W.; Shu, K.Y. Transmission electron microscopy observation of a deformation twin in TWIP steel by an ex situ tensile test. Philos. Mag. 2011, 91, 4033–4044. [Google Scholar] [CrossRef]
  10. Mahato, B.; Shee, S.K.; Sahu, T.; Ghosh Chowdhury, S.; Sahu, P.; Porter, D.A.; Karjalainen, L.P. An effective stacking fault energy viewpoint on the formation of extended defects and their contribution to strain hardening in a Fe-Mn-Si-Al twinning-induced plasticity steel. Acta Mater. 2015, 86, 69–79. [Google Scholar] [CrossRef]
  11. Kim, J.-K.; Kwon, M.-H.; De Cooman, B.C. On the deformation twinning mechanisms in twinning-induced plasticity steel. Acta Mater 2017, 141, 444–455. [Google Scholar] [CrossRef]
  12. Fernandes, F.A.O.; Oliveira, D.F.; Pereira, A.B. Optimal parameters for laser welding of advanced high-strength steels used in the automotive industry. Procedia Manuf. 2017, 13. [Google Scholar] [CrossRef]
  13. De Cooman, B.C.; Kwon, O.; Chin, K.-G. State-of-the-knowledge on TWIP steel. Mater. Sci. Technol. 2012, 28, 513–527. [Google Scholar] [CrossRef]
  14. Li, F.; Bate, P.S. Strain path change effects in cube textured aluminium sheet. Acta Metall. Mater. 1991, 39, 2639–2650. [Google Scholar] [CrossRef]
  15. Wen, W.; Borodachenkova, M.; Tomé, C.N.; Vincze, G.; Rauch, E.F.; Barlat, F.; Grácio, J.J. Mechanical behavior of Mg subjected to strain path changes: Experiments and modeling. Int. J. Plast. 2015, 73, 171–183. [Google Scholar] [CrossRef] [Green Version]
  16. Beyerlein, I.J.; Tomé, C.N. Modeling transients in the mechanical response of copper due to strain path changes. Int. J. Plast. 2007, 23, 640–664. [Google Scholar] [CrossRef]
  17. Nesterova, E.; Bacroix, B.; Teodosiu, C. Experimental observation of microstructure evolution under strain-path changes in low-carbon IF steel. Mater. Sci. Eng. A 2001, 309–310, 495–499. [Google Scholar] [CrossRef]
  18. Liao, J.; Sousa, J.A.; Lopes, A.B.; Xue, X.; Pereira, A.B. Mechanical, microstructural behaviour and modelling of dual phase steels under complex deformation paths. Int. J. Plast. 2017, 93, 269–290. [Google Scholar] [CrossRef]
  19. Wen, W.; Borodachenkova, M.; Pereira, A.; Barlat, F.; Gracio, J. Hardening behavior and texture evolution of TWIP steel during strain path change. IOP Conf. Ser. Mater. Sci. Eng. 2015, 82, 012089. [Google Scholar] [CrossRef] [Green Version]
  20. Lapovok, R.; Timokhina, I.; Mester, A.-K.; Weiss, M.; Shekhter, A. Influence of the Strain History on TWIP Steel Deformation Mechanisms in the Deep-Drawing Process. Metall. Mater. Trans. A 2018, 49, 2069–2083. [Google Scholar] [CrossRef] [Green Version]
  21. Metallic Materials—Tensile Testing—Part 1: Method of Test at Room Temperature (ISO 6892-1:2009). Available online: https://infostore.saiglobal.com/preview/is/en/2009/i.s.eniso6892-1-2009.pdf?sku=1141079 (accessed on 17 January 2019).
  22. Bilby, B.; Entwisle, A. The formation of mechanical twins. Acta Metall. 1954, 2, 15–19. [Google Scholar] [CrossRef]
  23. He, B.B.; Hu, B.; Yen, H.W.; Cheng, G.J.; Wang, Z.K.; Luo, H.W.; Huang, M.X. High dislocation density-induced large ductility in deformed and partitioned steels. Science 2017, 357, 1029–1032. [Google Scholar] [CrossRef] [PubMed]
  24. Schmitt, J.H.; Shen, E.L.; Raphanel, J.L. A parameter for measuring the magnitude of a change of strain path: Validation and comparison with experiments on low carbon steel. Int. J. Plast. 1994, 10, 535–551. [Google Scholar] [CrossRef]
  25. Dieter, G. Mechanical Metallurgy; McGraw-hill: New York, NY, USA, 1961; pp. 370–371. [Google Scholar]
  26. Bintu, A.; Vincze, G.; Picu, C.R.; Lopes, A.B.; Grácio, J.J.; Barlat, F. Strain hardening rate sensitivity and strain rate sensitivity in TWIP steels. Mater. Sci. Eng. A 2015, 629, 54–59. [Google Scholar] [CrossRef]
  27. Liang, Z.Y.; Wang, X.; Huang, W.; Huang, M.X. Strain rate sensitivity and evolution of dislocations and twins in a twinning-induced plasticity steel. Acta Mater. 2015, 88, 170–179. [Google Scholar] [CrossRef]
  28. Kim, J. Dislocation Density-Based Constitutive Modeling of the Tensile Behavior of TWIP Steels; Pohang University of Science and Technology: Pohang, South Korea, 2012. [Google Scholar]
Figure 1. Standard sample in accordance with ISO 6892-1:2009 [mm].
Jmmp 03 00012 g001
Figure 2. Pre-loaded sample ready for cutting into small samples (RD—rolling direction; TD—transverse direction).
Jmmp 03 00012 g002
Figure 3. (a) Illustration of the small pre-loaded samples, axially cut in angles of 0°, 45°, and 90° relative to the rolling direction [mm]; (b) loading and cutting orientations relative to the rolling direction.
Jmmp 03 00012 g003
Figure 4. True stress-strain (longitudinal) curve for the not loaded sample m0° and pre-loaded samples p (10%), q (20%), and t (30%) for each studied direction (0°, 45°, and 90°).
Jmmp 03 00012 g004
Figure 5. Zoomed version of Figure 4 where it is possible to compare the yield strengths for reloading cases with the curve obtained for a not pre-loaded sample (monotonic load).
Jmmp 03 00012 g005
Figure 6. Evolution of α for sequential uniaxial tensile loading as function of θ [°].
Jmmp 03 00012 g006
Figure 7. True stress–strain curves, showing, in detail, the yield plateau for a θ = 0° for 20% and 30% pre-loaded samples.
Jmmp 03 00012 g007
Figure 8. True stress–strain curves obtained in the tensile loading–unloading cycles, for undeformed samples and θ of 0°, 45°, and 90°.
Jmmp 03 00012 g008
Figure 9. Highlight of the yield plateaus presented in Figure 8.
Jmmp 03 00012 g009
Figure 10. True stress–strain curve for a 20% pre-deformed sample at θ = 0°, and the crosshead velocity recorded during the tensile test.
Jmmp 03 00012 g010
Figure 11. Temperature on the surface of a m-sample subjected to tensile loading with θ = 0° and its corresponding true stress-strain curve.
Jmmp 03 00012 g011
Figure 12. Optical microscopy. (a) Undeformed; (b) 10% of deformation; (c) 20% of deformation; (d) 30% of deformation; (e) deformed until maximum force was reached.
Jmmp 03 00012 g012aJmmp 03 00012 g012b
Figure 13. Transmission electron microscopy (TEM) images of (a) an undeformed sample; (b) a 10% deformed sample; (c) a 20% deformed sample; (d) a deformed sample until maximum force was reached (true strain of 40%); (e) grains orientation and texture of an undeformed sample.
Jmmp 03 00012 g013
Figure 14. TEM images of a sample deformed until the point of maximum force, highlighting (a) the high density of dislocations and (b) the deformation twins.
Jmmp 03 00012 g014
Figure 15. Evolution of the density of dislocations with strain.
Jmmp 03 00012 g015
Figure 16. Scanning electron microscopy (SEM) images of: (a) an undeformed sample; (b) a 10% deformed sample; (c) a 20% deformed sample; (d) a 30% deformed sample (e) a deformed sample until maximum force was reached.
Jmmp 03 00012 g016
Figure 17. Percentage of twinned grains for different deformation levels.
Jmmp 03 00012 g017
Figure 18. Influence of the unloading duration relatively to the yield plateau for deformations from 10 to 40% for loading speeds from 0.1 to 50 mm/min.
Jmmp 03 00012 g018
Table 1. Mechanical properties obtained in each test scenario.
mpqt
45°90°45°90°45°90°45°90°
σy [MPa]52048040071563554096084064012321100820
σmax [MPa]145614481495144514331467148914061494153114221562
σy/σmax0.380.330.270.490.430.370.650.600.430.800.770.52
e0.390.400.430.310.340.350.210.230.280.200.240.25
n0.340.330.350.220.210.230.140.110.150.110.080.12
K [MPa]199319351995187017721881181516511803187416211829

