Article

Investigation of Deposition Parameters for Near-Beta Alloy Ti-55511 Fabricated by Directed Energy Deposition

1
Net Shape Manufacturing Group, Department of Mechanical Engineering, Dalhousie University, Halifax, NS B3H 4R2, Canada
2
Defence Research and Development Canada, Dartmouth, NS B3A 3C5, Canada
3
AP&C Advanced Powders and Coatings, Saint-Eustache, QC J7R 0L5, Canada
*
Author to whom correspondence should be addressed.
J. Manuf. Mater. Process. 2024, 8(2), 72; https://doi.org/10.3390/jmmp8020072
Submission received: 6 March 2024 / Revised: 5 April 2024 / Accepted: 9 April 2024 / Published: 10 April 2024
(This article belongs to the Special Issue High-Performance Metal Additive Manufacturing)

Abstract

:
The directed energy deposition (DED) parameters were determined for near-β alloy Ti-55511 by employing statistical design of experiments (DOEs) methods. Parameters resulting in fully dense freeform deposits were identified using two sequential DOEs. Single laser tracks were printed with several laser power, traverse rate, and powder feed rate settings in an initial DOE to identify promising build parameters. The capture efficiency and effective deposition rate were used to characterize and rank the single track deposits. The best parameters were then used to print a solid cube with various X–Y and Z overlaps (different hatch spacing, HS, and layer thickness, ZS) in a second DOE. Suitable deposition parameters were selected based on the cube density and microstructure and were used to fabricate larger tensile samples for mechanical testing. Multiple parameter sets were found to provide dense Ti-55511 deposits with acceptable mechanical properties and the parametric models showed statistical significance.

1. Introduction

Directed energy deposition (DED) is a form of additive manufacturing (AM) that can print complex net shape parts from a wide range of metal alloys. It offers fast prototyping, high build rates, dense materials, and the ability to tailor build parameters to obtain microstructurally and compositionally graded components [1,2,3]. As an AM technique, it can be leveraged for geometrical design, lightweighting, and part consolidation opportunities [3]. DED can also be used to deposit material on damaged or worn parts, effectively weld-repairing parts to extend the service life [2,3,4]. As a result, the DED of titanium alloys has the potential to reduce the lead time and buy-to-fly ratio of titanium aerospace components compared to wrought-based manufacturing processes [5,6]. Most research on the DED of Ti alloys has been directed toward alpha and α+ β alloys, such as Ti-6Al-4V [5,6,7,8,9,10,11,12]. While the AM of these materials has been largely successful, near-beta alloys such as Ti-5553 and Ti-55511 exhibit superior fracture toughness, are readily heat treatable, and are gaining popularity in the aerospace sector [13,14]. Accordingly, open literature on the development of AM techniques for near-beta Ti alloys is starting to emerge [5,6,15,16,17].
In DED, metal power feedstock is blown in the path of a focused laser, which melts both the substrate and powder to form a consolidated deposit. The melt pool rapidly solidifies as the laser passes across the workpiece, leaving behind a dense bead of deposited material. The tool path of the laser can be designed to clad surfaces or build freeform deposits of custom geometry, although these deposits are generally net-shaped and need to be machined to tolerance. The large laser spot sizes found in DED also enable high deposition rates at the expense of print resolution and part complexity. The laser spot size, laser power, traverse rate, powder feed rate, hatch spacing, and layer thickness are all significant variables that impact the deposition process and can interact with one another. One of the major challenges in DED is understanding the effect of each variable and their interactions on the deposition process. Controlling the deposition nozzle and baseplate motion (the toolpath), in addition to the thermal energy source and beam-material interactions, adds another layer of complexity to the DED process compared to other AM techniques such as laser powder bed fusion (LPBF) [3]. For example, the physical motion of the powder delivery and laser nozzle results in traverse rates an order of magnitude lower than what can be achieved in LPBF systems. This creates unique toolpath challenges such as overbuilding at the corners where the traverse rate reaches zero while the powder feed rate and laser power remain constant. Another major concern in powder-fed DED is the catchment efficiency. Given the high cost of metal powder feedstocks, it is necessary to minimize the amount of powder wasted by tailoring the process parameters to capture as much powder in the melt pool as possible.
Generally, achieving full density is critical for materials manufactured using metal powder as the feedstock. The internal porosity of the final material can act as a stress riser and aid crack propagation under a load, lowering the mechanical strength of the material. No significant correlation has been observed to relate the final density of DED-printed materials to the starting porosity of the powder feedstock. However, the formation of defects in DED (inter-layer and intra-layer) is known to be a product of poor processing conditions [1,2,3]. The density of a given DED material is then related to the complex deposition parameters and their interaction effects. For example, Sweet et al. showed that slower traverse rates could be used to achieve high densities in a DED dual-phase steel when the hatch spacing was large, while the traverse rate needed to be increased to achieve dense deposits when the hatch spacing was decreased [18]. Although multiple combinations of deposition parameters can lead to dense deposits, optimizing the global process parameters to avoid defect formation and maximize density remains challenging.
When a response of interest in a process, such as the density, is known to be influenced by multiple factors, design of experiments (DOEs) methods are commonly employed to optimize that process response [19]. The central composite, Box–Behnken, and Taguchi method approaches have all been employed to optimize AM processes such as laser powder bed fusion and DED for a variety of responses (i.e., density or tensile strength) [20,21,22,23,24,25]. In this work, a statistical central composite design response surface method was selected to determine the main influence and interactions of the DED process parameters and identify the best combination of parameters that produce a high-density material. Utilizing this approach allows for a wide variety of deposition parameters to be examined while keeping the required number of test specimens low [18,19,22,25,26].
During deposition, residual stresses build up in the material due to the cyclic heating inherent to the DED process [2,3]. Since the volume of material being melted by the laser spot is very small compared to the substrate, the cooling and solidification rates are very high [2,3]. This results in a fine microstructure that increases the tensile strength but generally reduces the ductility [27]. Therefore, the deposition parameters applied not only influence the material density but the microstructure and residual stresses in the deposit as well. Additionally, anisotropy of the as-built part is reported across the literature regardless of the alloy system used. This anisotropy affects the tensile properties and is closely related to the cyclic heating profile and build orientation during deposition [11,12,28,29,30,31,32]. As a result, heat treatment of DED materials is required to address the residual stresses, microstructure, and mechanical properties.
Titanium has a hexagonal closed-packed (HCP) structure, referred to as the alpha phase, α, at room temperature. At the beta transus temperature (~885 °C), titanium undergoes an allotropic transformation to the body-centered cubic (BCC) beta phase, β [13]. The addition of β-stabilizing elements such as Mo, V, Fe, and Cr tends to lower the beta transus temperature, allowing the metastable β-phase to be retained below the β transus temperature [13,14,33]. In contrast, α-stabilizing elements, such as Al, increase the β transus temperature and promote the formation of α. α + β Ti alloys contain a mixture of α and β phase stabilizers and are heat treatable. Their properties are typically controlled through a solution heat treatment followed by aging between 480 °C and 650 °C to form fine α and β in a matrix of the retained β [13]. This bi-modal microstructure combines the strength from the α phase and ductility from the β phase [34]. In contrast, near-β Ti alloys contain larger amounts of BCC-β phase stabilizers and respond more favorably to heat treatment [13]. Similar solutionizing and aging treatments can be applied to retain the β phase while precipitating a fine dispersion of α particles, which strengthen the alloy.
Studies on the DED of near-β alloys are limited in the literature. Liu et al. investigated the mechanical properties and beta heat treatment of DED Ti-55511 in two studies [5,6]. Fine primary and secondary α phases were observed within the β grains of the as-deposited material and as a continuous α phase along the grain boundaries. This microstructure increased the as-printed material’s tensile strength but decreased the ductility as crack nucleation and propagation were localized in the grain boundary α-phase [5]. Liu et al. highlighted that in wrought forms of near-β alloys, forging treatments can easily remove or transform the detrimental grain boundary α phase [6]. However, AM is a net-shaped process, making heat treatment the only option to address detrimental microstructural features. Heat treating the alloy above the β transus temperature (~880 °C in AM Ti-55511 [6]) for a short time will transform the undesired grain boundary α while limiting the β grain growth, resulting in improved ductility while retaining a high strength [6]. Deng et al. studied the mechanical properties of DED Ti-55531 in the as-built and heat-treated conditions [35]. In their work, the former exhibited low tensile strength and high elongation. β-heat treatment at 880 °C increased the tensile strength but resulted in a brittle fracture mode. In contrast, when the heat treatment at 880 °C was followed by a secondary α/β-heat treatment at 790 °C, a bimodal microstructure of primary and secondary α phases formed and resulted in a ductile fracture mode. Gosse also reported improvements to the tensile strength of DED Ti Beta 21S and Ti-6242 when their respective heat treatments were applied [26]. In their work, solution treatment of Ti Beta 21S at 843 °C followed by aging at 679 °C caused a decrease in the yield strength but a significant increase in the ductility due to the formation of intergranular acicular α, which restricted the dislocation movement.
It is evident from the existing literature on the DED of Ti-55511 and similar alloys that the as-deposited microstructure is commonly sub-optimal and must be remedied through a β-heat treatment at a minimum. The objective of the present study is to evaluate the freeform fabrication of near-beta alloy Ti-55511 and identify promising deposition parameters using DED. This work began with a statistical design of experiments (DOEs) approach to rapidly infer build parameters that could fabricate dense deposits, followed by metallurgical and mechanical evaluation of the as-printed and heat-treated specimens.

2. Materials and Methods

The powder used for DED in this study was a plasma-atomized Ti-55511 (Ti-5Al-5Mo-5V-1Cr-1Fe) powder produced by AP&C, Saint-Eustache, Quebec, Canada. The particle size distribution (PSD) of the powder was measured by laser light scattering (Malvern Mastersizer 3000, Malvern, Worcestershire, United Kingdom) and is presented in Figure 1a. The powder exhibited a D50 of 81 µm and had a size distribution that lay within the −150 μm/+50 μm range, as is commonly specified for DED applications [2,3]. A representative SEM micrograph of the powder is presented in Figure 1b, which confirms its highly spherical morphology and the limited presence of satellite features. The powder chemistry (Table 1) was tested using inductively coupled plasma–optical emission spectroscopy (ICP–OES) analysis and was confirmed to be compliant with the compositional ranges reported for Ti-55511 from GOST 19807:1991 [36].
The DED Ti-55511 specimens were produced using an Optomec MTS 500 system (Albuquerque, New Mexico, USA) equipped with a 1 kW Ytterbium-doped fiber laser (IPG Photonics, Oxford, Massachusetts, USA; λ = 1070 nm) with a spot size of 600 µm and a nozzle standoff distance of 6.12 mm. All the build cycles were executed under a fully enclosed argon atmosphere with a measured oxygen content <20 ppm (EOS-1 zirconia oxygen sensor, Inert Corp, Amesbury, Massachusetts, USA). Each layer consisted of an in-fill using a 90-degree alternating hatch approach. No boundary layers were deposited. Mastercam Mill version 21.0.18440.0 software coupled with a proprietary DED add-on was utilized to slice the 3D models and generate the required toolpaths. All the builds were fabricated on Ti-6Al-4V (Ti-64) substrate plates. Each build plate was solvent degreased and abrasive grit blasted with 300 µm zirconia shot prior to use.
Two central composite designs (CCDs) were used to infer the DED build parameters that could provide dense, defect-free deposits of Ti-55511. Minitab 19 statistic software was utilized to create DED parameter sets for both CCDs and perform statistical analysis of the results. In the first CCD, the DED parameters of the laser power, powder feed rate and traverse rate were evaluated for 20 single-track deposits. A wide operating range was selected for each parameter based on previous experience with the DED system. The parameters tested are outlined in Table 2 and were evaluated at 5 discrete levels, where level 3 represented the center point of the design (the condition to which the significance of changes was tested). The center point of the CCD was repeated 6 times. Laser confocal microscopy and optical microscopy were employed to analyze the resulting bead geometry and quality, respectively. The capture efficiency and effective deposition rates were determined based on the measured bead geometries and the sum of their respective rankings was used to determine an overall rank for each of the DED parameter sets considered.
A second CCD was used to evaluate the influence of the hatch spacing, HS, (X–Y step size) and layer thickness, ZS, (Z-step size) on solid cube specimens built utilizing the best three defect-free parameter sets identified in the first CCD. A percentage overlap was used to calculate the HS and ZS for each cube based on the respective single-track bead width and height from condition 4, 5, or 9. These new parameter sets, outlined in Table 3, were applied to each of the top 3 ranked parameter sets from the first CCD. A total of 39 cubes were built, 13 for each condition (4, 5, or 9), testing different X–Y and Z overlaps. Each of the DED parameter sets evaluated in the CCDs were investigated at five discrete levels, where level 3 represented the center point of the design. The center point of each CCD was repeated 5 times.
A vertical band saw was used to remove the cube specimens from the Ti-64 build substrate. The density of each cube was then measured according to MPIF standard 42 [37]. Following the density measurement, the cubes were sectioned vertically in half using a cut-off saw. The coolant used during cutting was removed from the cube specimens by immersing them in petroleum ether for a minimum of 1 h. One half of the cube specimens was mounted in conductive Bakelite such that the viewing direction was perpendicular to the X–Z plane. A Struers Tegramin 20 auto polisher (Struers Limited, Mississauga, Ontario, Canada) was used to prepare the samples for metallography using progressively finer SiC foils, a 9 µm diamond suspension, and finally, a 10:1 mixture of colloidal silica and hydrogen peroxide. The polished Ti-55511 specimens were immediately etched with Kroll’s reagent to reveal the beta phase. The microstructures of the etched specimens were examined using a Keyence VK-X1000 laser confocal microscope (Keyence, Osaka, Japan).
Rectangular blanks of Ti-55511 with the dimensions of 10 mm × 10 mm × 85 mm were built using two of the DED parameter sets identified. Each blank was machined into a cylindrical-gauge tensile specimen compliant with MPIF standard 10 [38]. A 1 MN Instron load frame (model 5594-200HVL, Instron, Norwood, Massachusetts, USA) equipped with a 50 kN load cell was used to perform the tensile tests. The strain was measured using an Epsilon 3542 extensometer (Epsilon Technology Corp., Jackson, Wyoming, USA), which remained attached to the specimen through the point of fracture. All the bars were stress relieved at 960 °C for 1 h under a high vacuum in a Materials Research Furnaces Inc. (MRF, Allenstown, New Hampshire, USA) furnace prior to machining and tensile testing. The oxygen and nitrogen (ON) content of the tensile samples were measured using an Eltra Elementrac ONH-p2 analyzer (Eltra GmbH, Haan, Germany).

3. Results and Discussion

3.1. Single Tracks

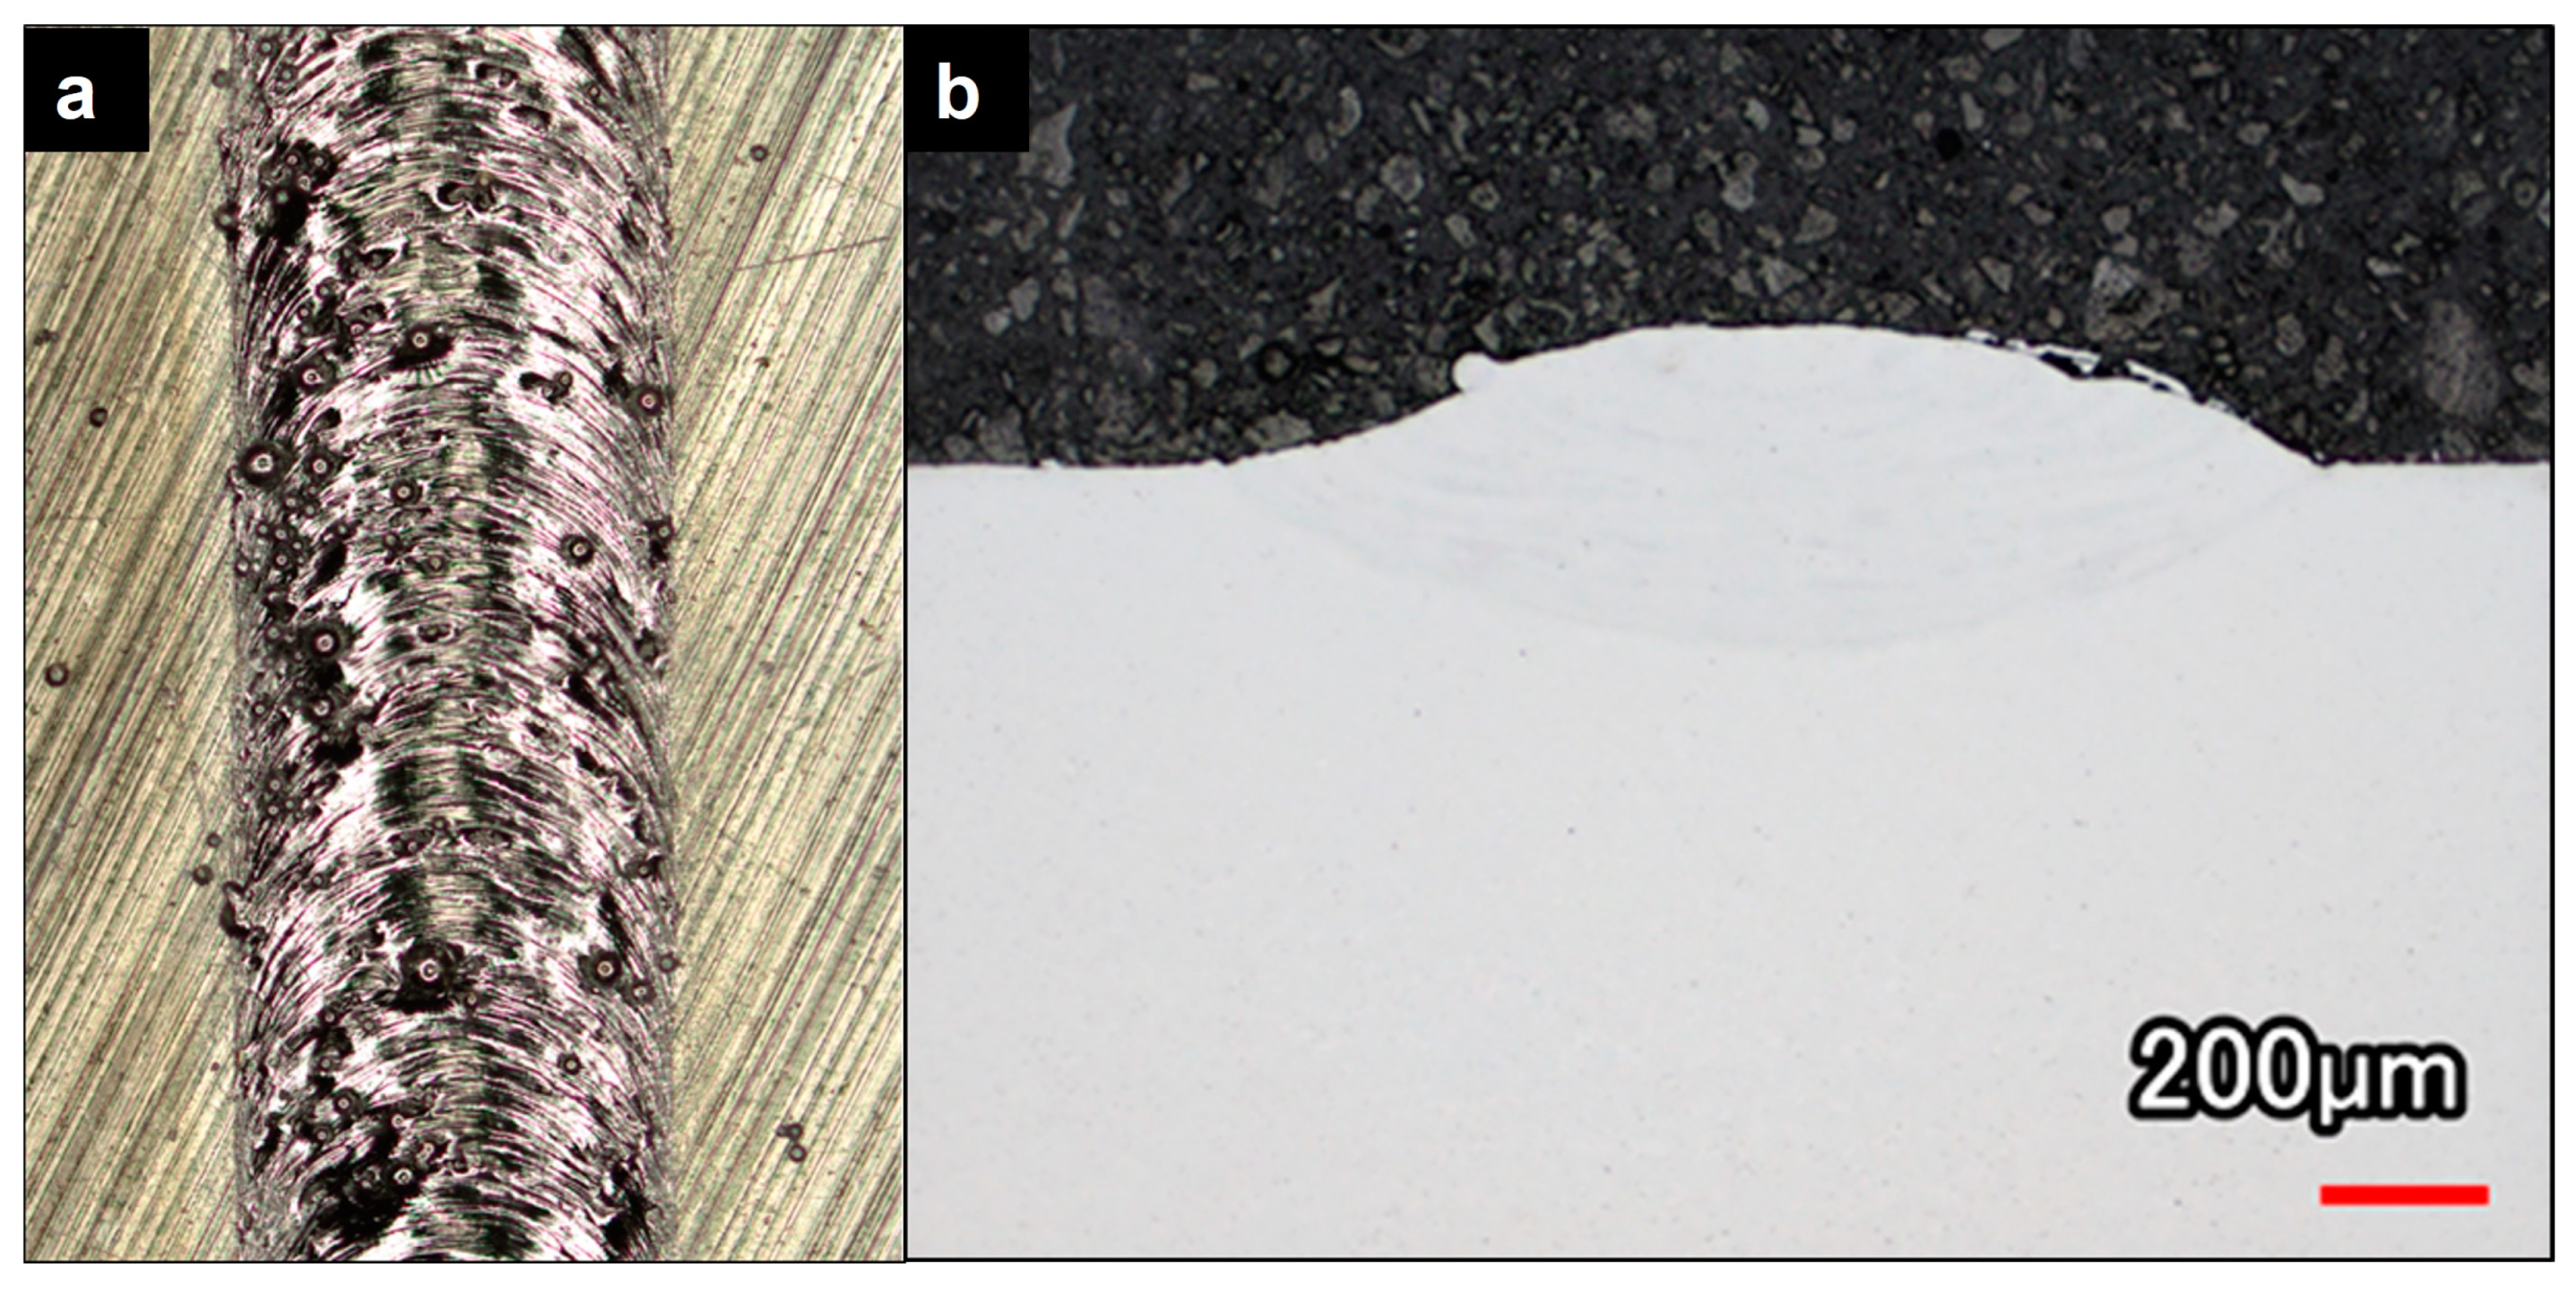
The top view and a polished cross-section of a representative single track from the first CCD are presented in Figure 2a,b, respectively. Polished cross-sections of the single tracks were analyzed using optical microscopy to identify any visible deposition defects (i.e., pores, lack of fusion, cracks, etc.) and characterize the amount of dilution. track 20, shown in Figure 2, contained no internal defects and had approximately 50% dilution (where dilution is the ratio of the depth of penetration to the depth of penetration plus the bead height [3]). The topography of each track was analyzed using laser confocal microscopy to determine the bead geometry and cross-sectional area. For the track presented in Figure 2, the bead width and height were found to be 1360 µm and 181 µm, respectively, while the cross-sectional area was 147,000 µm2.
The cross-sectional area was used to calculate the capture efficiency and effective deposition rate for each single track deposit via Equations (1) and (2). Note that a 100% capture efficiency refers to all the blown powder being captured in the deposited bead.
C a p t u r e   E f f i c i e n c y ( % ) = P o w d e r   C a p t u r e d P o w d e r   U s e d = C . S . A r e a   ( m m 2 ) × ρ T i 55511 ( g m m 3 ) P o w d e r   f e e d   g m i n ÷ T r a v e r s e R a t e   m m s × 60 s m i n
E f f e c t i v e   D e p o s i t i o n   R a t e   g m i n = C a p t u r e   E f f i c i e n c y   % × P o w d e r   f e e d   ( g m i n )
The capture efficiency and effective deposition rates were determined for each track and used to rank the associated parameter sets, as shown in Table 4. Single tracks that contained defects were not selected for further evaluation. Notable track parameter sets are bolded in Table 4. Both tracks 4 and 14 achieved the highest ranking, followed by track 9. These tracks had capture efficiencies above 34% and deposition rates above 0.5 g/min. Track 5 was identified as the best low-power candidate, having a similarly high capture efficiency to tracks 4, 14, and 9 but a slower deposition rate. Despite tracks 4 and 14 both being ranked highest, only track 4 was selected for further testing due to its significantly higher deposition rate and lower power. Based on this ranking, the parameter sets for tracks 4, 5, and 9 were selected for testing in a second CCD of cube deposits.
The effects and interaction effects of the single-track parameters (laser power, traverse rate, powder feed rate) on the capture efficiency and deposition rate were modeled using Minitab and analyzed by ANOVA. A stepwise approach was employed and a level of significance of 0.05 was used to test the individual terms, their squares, and their interactions. Low p-values (p < 0.001) and insignificant lack-of-fit tests (
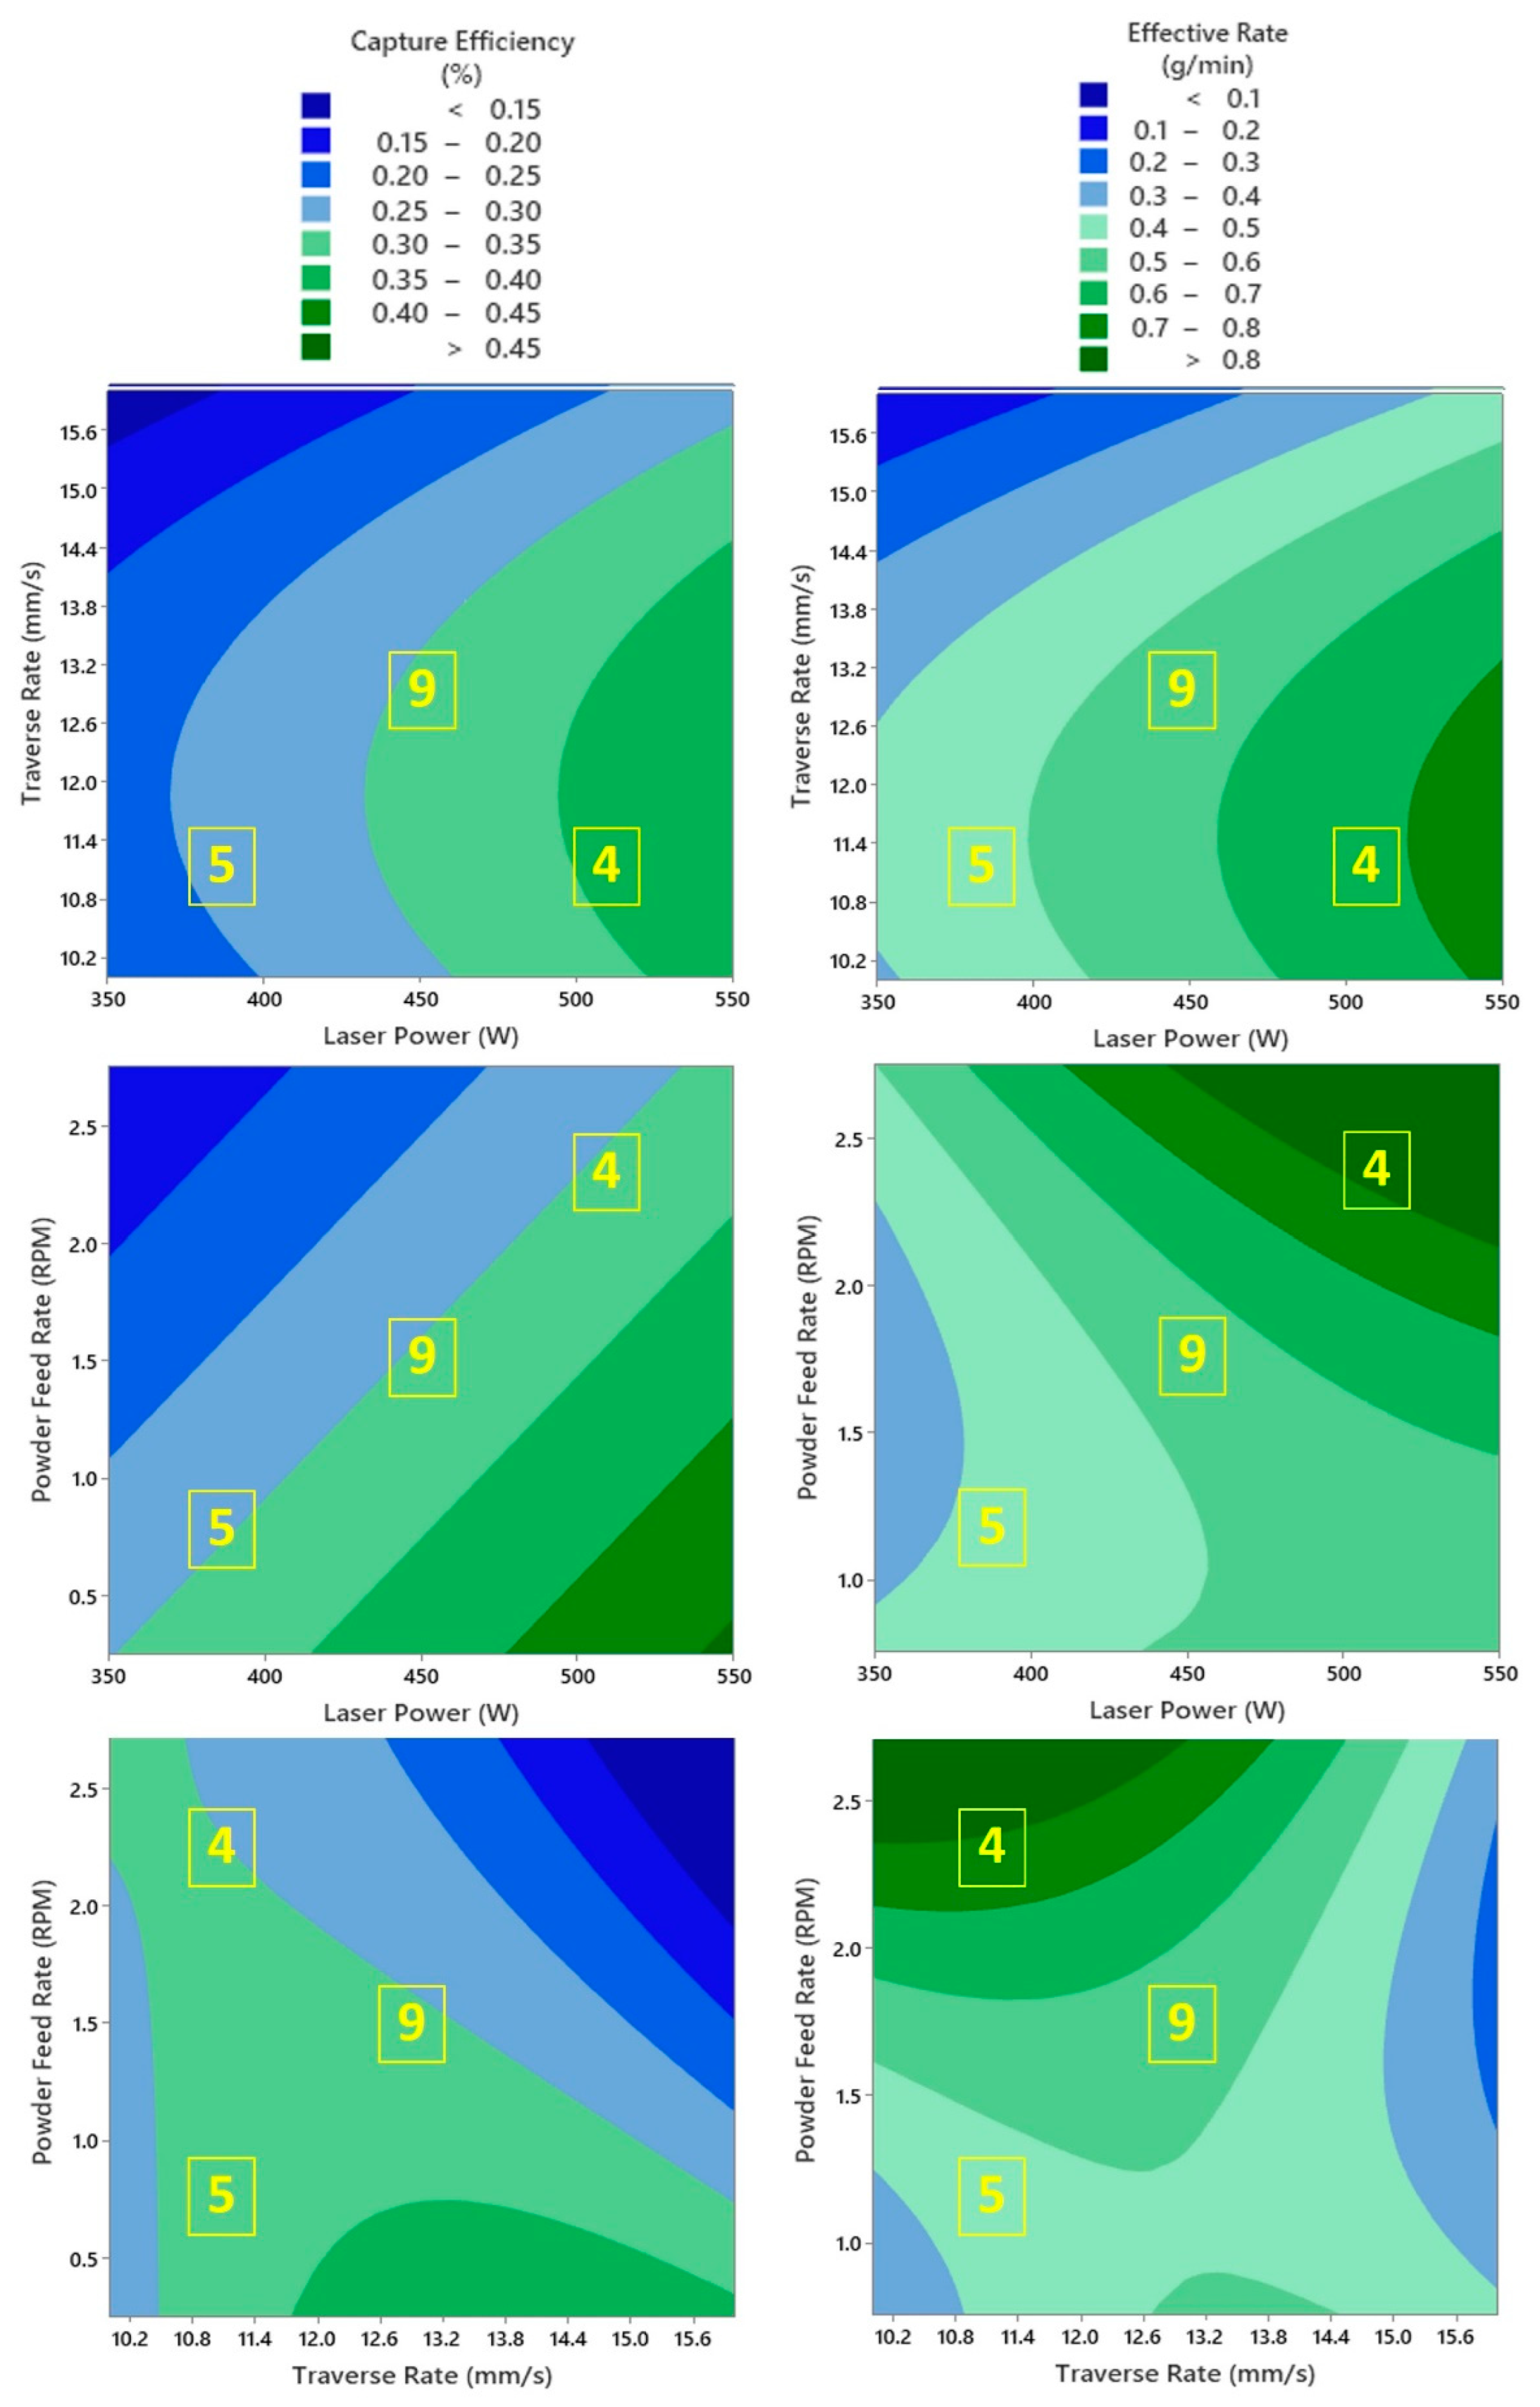
p > 0.05) in both cases suggested the models were statistically suitable to predict the deposition response for single tracks. The adjusted R-sq values were 68.0% and 78.2% for the capture efficiency and deposition rate models, respectively. Contour plots of the modeled single-track deposition behavior are presented in Figure 3. The capture efficiency plots (left column, Figure 3) indicated that higher laser powers and lower powder feed rates led to higher capture efficiencies. Mid-range traverse rates also appeared to provide higher capture efficiency at low laser powers and high powder feed rates, but the traverse rate became less important as the laser power was increased. The deposition rate exhibited similar behavior to the capture efficiency; however, the deposition rate increased as the powder feed was increased. The selected tracks (4, 5, 9) had predicted deposition rates between 0.4 and 0.8 g/min, while the capture efficiency predictions were confined to a mid-range of 25–35%. Note that these contour plots do not provide any information about how the tested machine parameters influence the density of the deposited beads.

3.2. Solid Cube Characterization

Solid cubes with different X–Y and Z overlaps were built in a second CCD according to Table 3 using the selected machine parameters from the single-track CCD (conditions 4, 5, and 9). The density and microstructure of the cube specimens were analyzed and compared against a full theoretical density of 4.642 g/cm
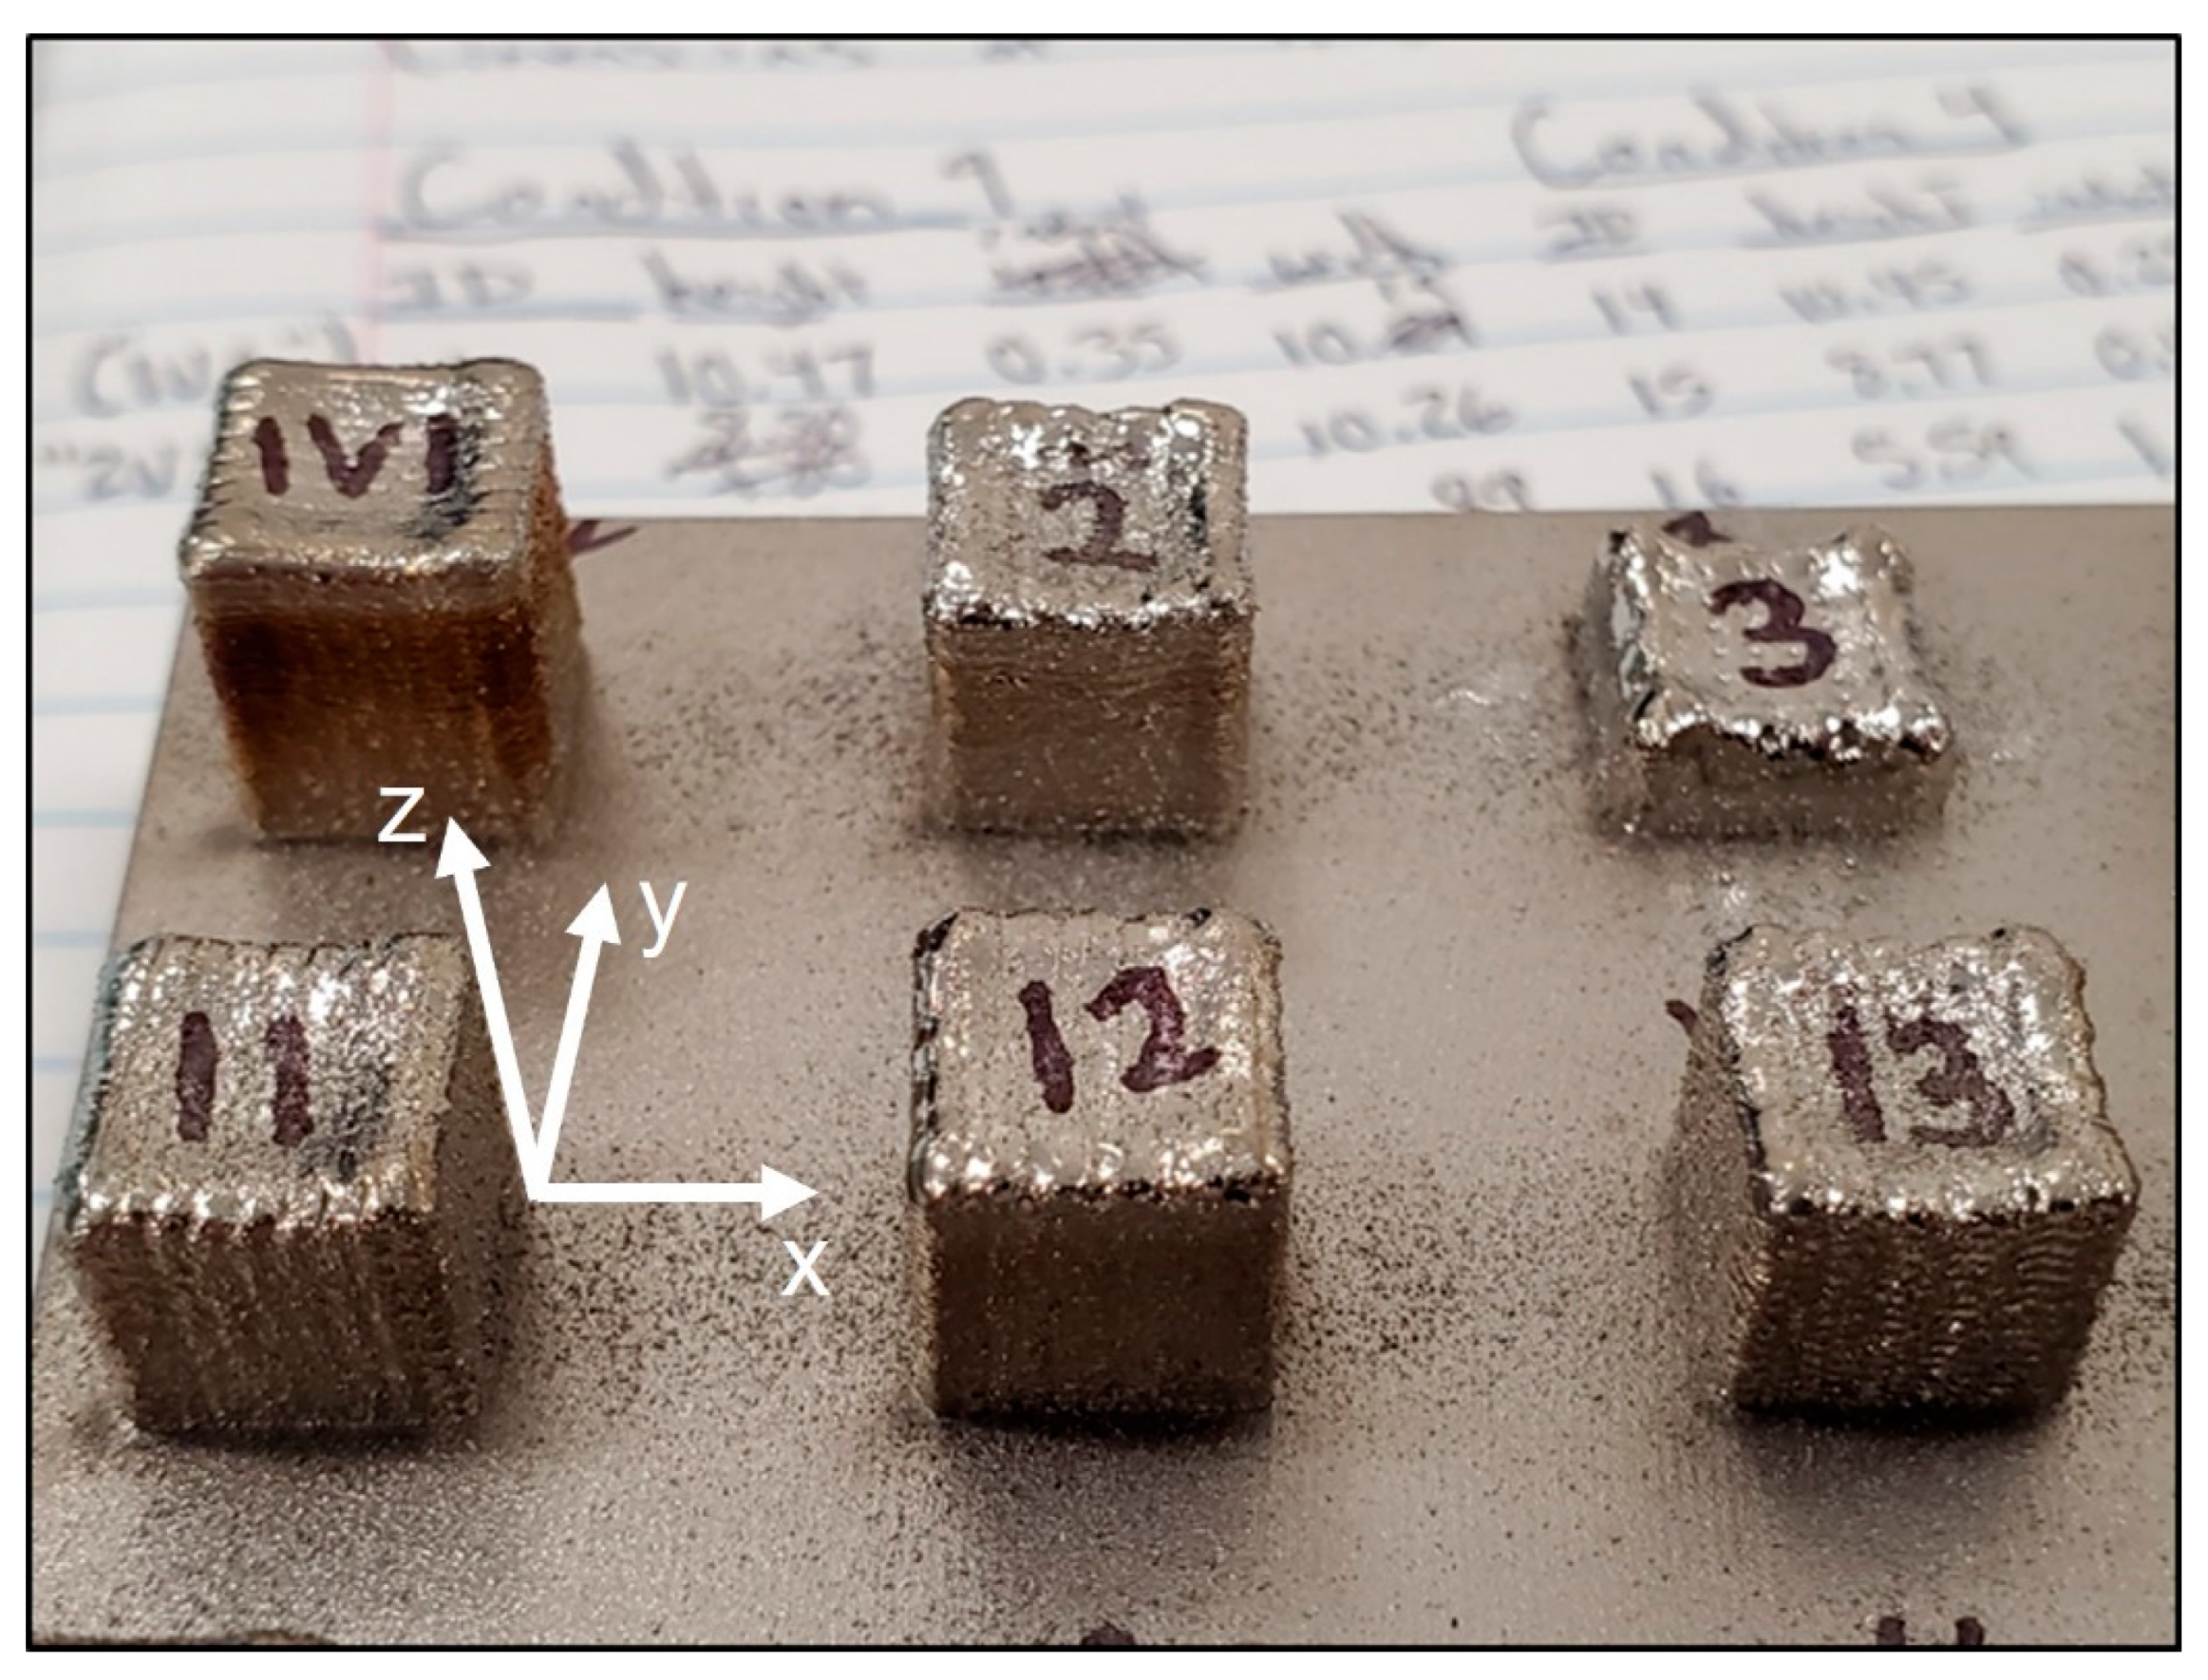
3 for Ti-55511. As-deposited cubes of Ti-55511 are shown in Figure 4.
AM parameters are commonly simplified into a singular energy input parameter such as the linear heat input [1]. However, this approach only considers the ratio of the laser power to the scan speed and does not capture the hatch spacing or layer thickness. Instead, the DED machine parameters were simplified using a volumetric energy density, which can be calculated according to Equation (3) [39]:
E D J m m 3 = L P T R H S Z S
where ED is the energy density, LP is the laser power, TR is the traverse rate, HS is the spacing of adjacent laser passes (xy-step size), and ZS is the layer thickness (z-step size). Note that the powder feed rate (PF), an important parameter in DED, is not accounted for in this ED calculation. Within the solid cube CCDs, the ED varied from 93 J/mm3 to 1204 J/mm3.
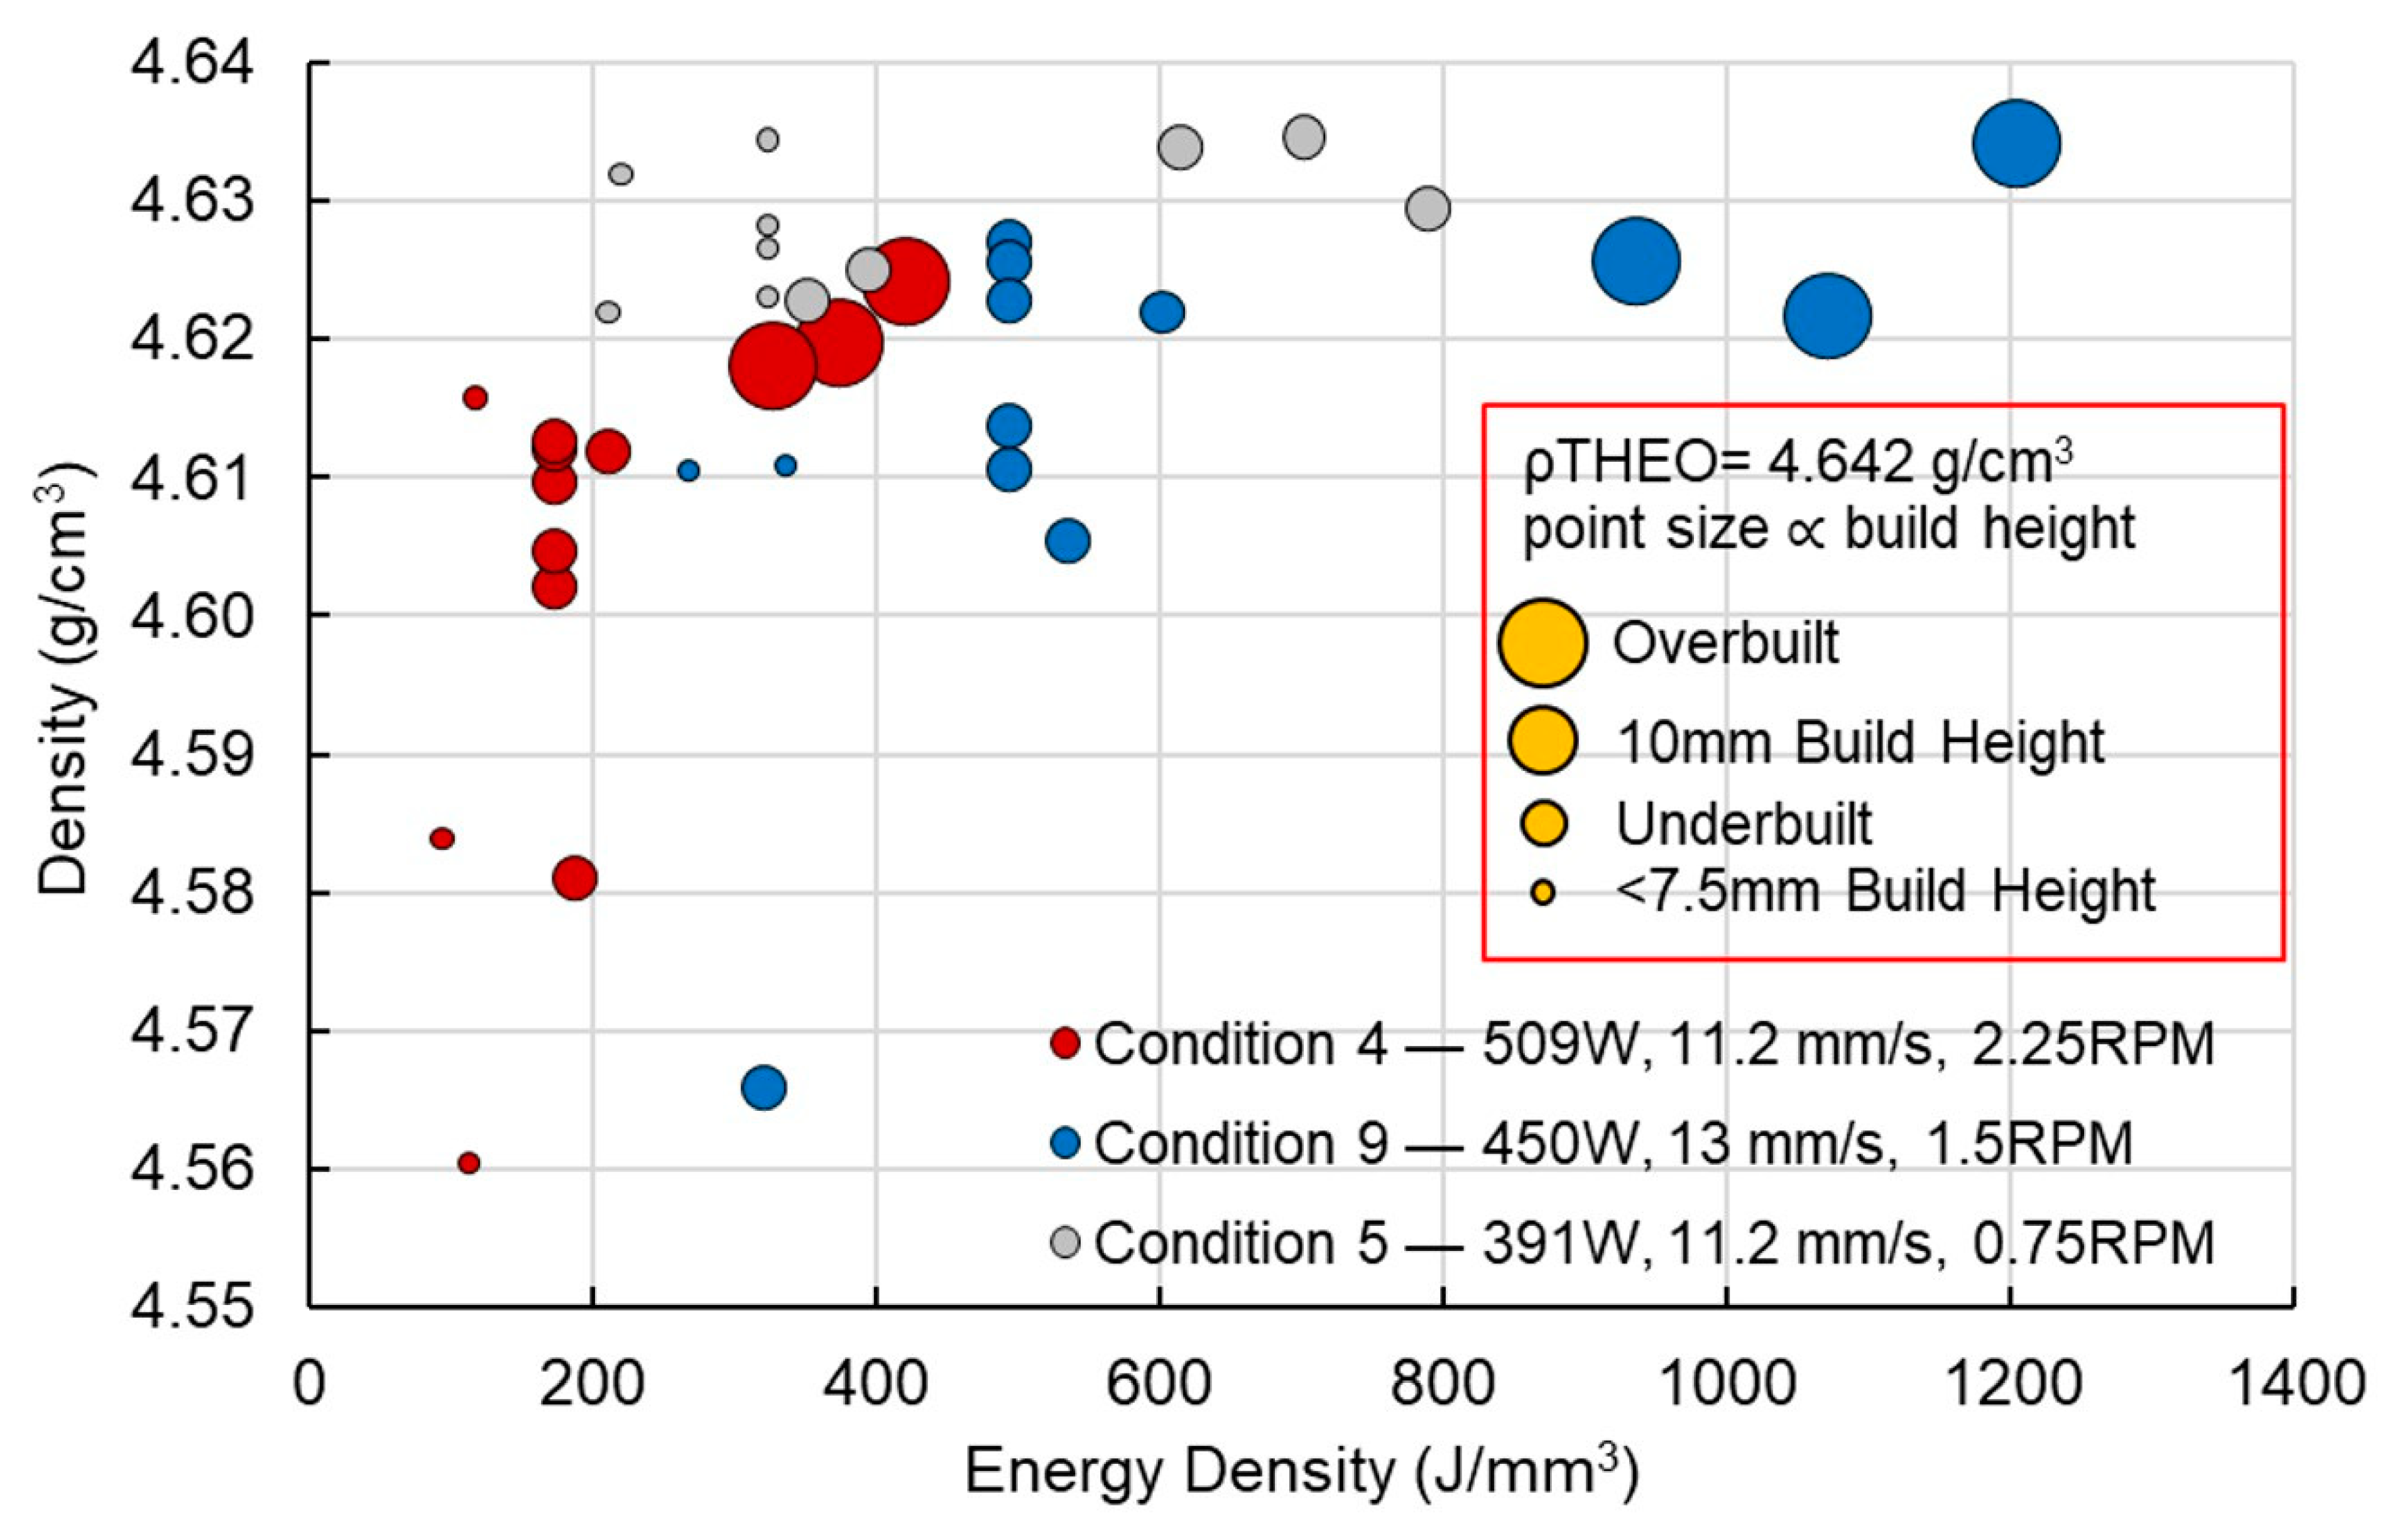
The effect of the ED on the specimen density is presented in Figure 5, where it is apparent that this trait improved with increasing EDs between 100 and 450 J/mm3. Above 500 J/mm3, there was minimal improvement in density and the data exhibited an asymptotic trend. Due to the formation of keyhole porosity, decreases in specimen density are commonly observed following a peak in density with the ED [1]. This was not the case for Ti-55511, as high densities were achieved for specimens between 300 and 1200 J/mm3.
The point sizes in Figure 5 are proportional to the build height of the cubes (i.e., small points represent under-building, while large points represent over-building of the programmed height). The distribution of the point sizes shows the general amount of under-building and over-building, with the majority of the cube building being successful and only select samples failing to build at all (i.e., cube # 3 shown in Figure 4.).
Figure 5 also demonstrates that all the cube specimens exhibited relative densities of above 98% (4.55 g/cm3). Energy densities above 300 J/mm3 were required to achieve densities above 99.5% (4.62 g/cm3). A maximum density of 99.8% (4.633 g/cm3) was achieved in conditions 5 and 9, while condition 4 exhibited a maximum density of 99.6% (4.624 g/cm3). An energy density above 330 J/mm3 was required to avoid significant under-building, though some lower energy density specimens in condition 4 exhibited no under-building. Dense specimens (>99.5% density) with no under-building were deposited under each of the selected DED conditions, implying that Ti-55511 has a relatively wide DED processing window.
Although the specimen density appeared to trend with the ED, the variances in the density data were not entirely explained by the singular ED parameter. For example, cube 10 (ED = 321 J/mm3 and ρ = 98.4%) and cube 33 (ED = 324 J/mm3 and ρ = 99.8%) were deposited using similar EDs but employed unique LP, PF, and overlap parameters. Despite the comparable ED, the lower laser power, powder feed rate and X–Y overlap resulted in a higher density. This inferred that certain machine parameters, including the PF (which is not included in the ED model), may interact with one another and influence the Ti-55511 density.
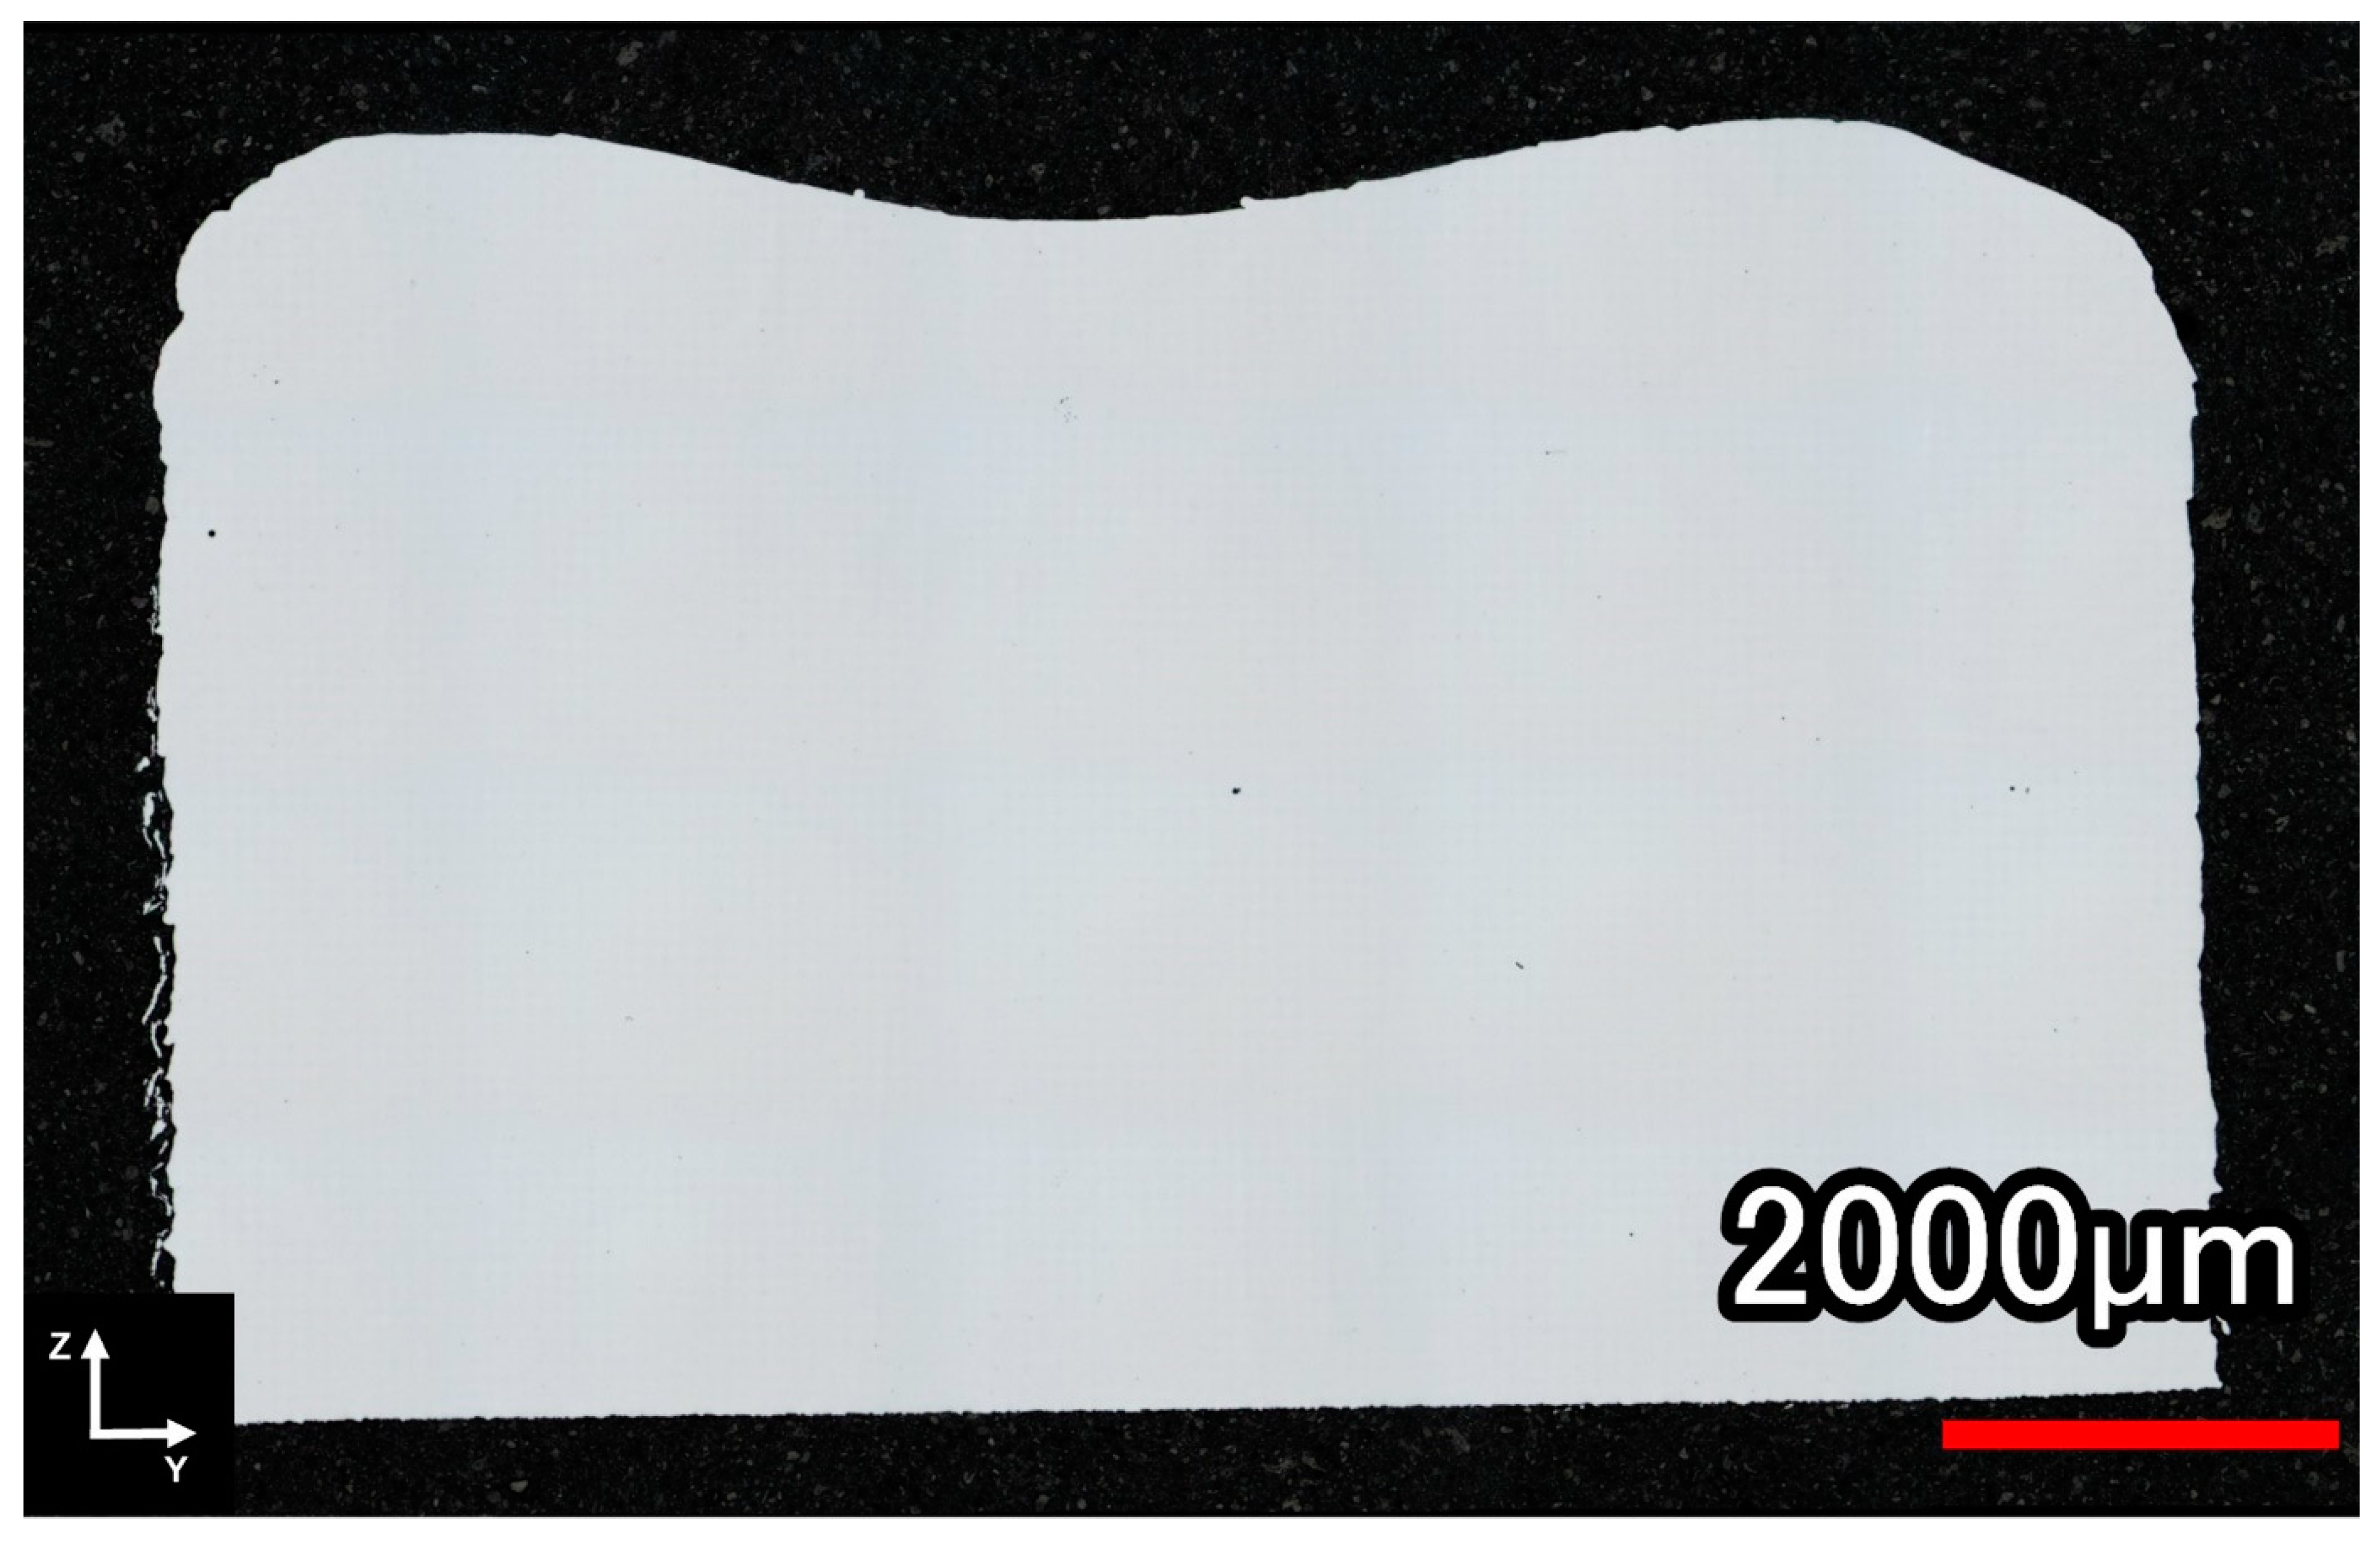
The polished cross-section of condition 5 (391 W, 11.2 mm/s, 1.0 g/min) printed with an X–Y overlap of 35% and Z overlap of 10% (the CCD center point parameters) is shown in Figure 6. Few pores were visible in the cross-section, which supported the high measured density of 99.84% (4.634 g/cm3).
Each print condition was modeled individually to analyze the effects of the X–Y and Z overlaps on the density of the Ti-55511 deposits. An outlier printed with an X–Y overlap of 10% and Z overlap of −20% was removed from condition 5 (391 W, 11.2 mm/s, 1.0 g/min) due to significant under-building and a 100% density measurement. A stepwise approach and a level of significance of 0.05 were used to test the individual terms, their squares, and their interactions. The low p-values (p < 0.001) and insignificant lack-of-fit tests (p > 0.05) in conditions 4 and 9 suggested the models were statistically suitable to predict the density of the cube deposits. The adjusted R-sq values were 93.0% and 64.0% for conditions 4 and 9, respectively. The ANOVA for condition 5 returned high p-values, indicating that the variation in density was not attributable to the controlled parameters. This result makes sense because condition 5 had very little variation in density for different overlaps compared to the other two conditions (see Figure 5).
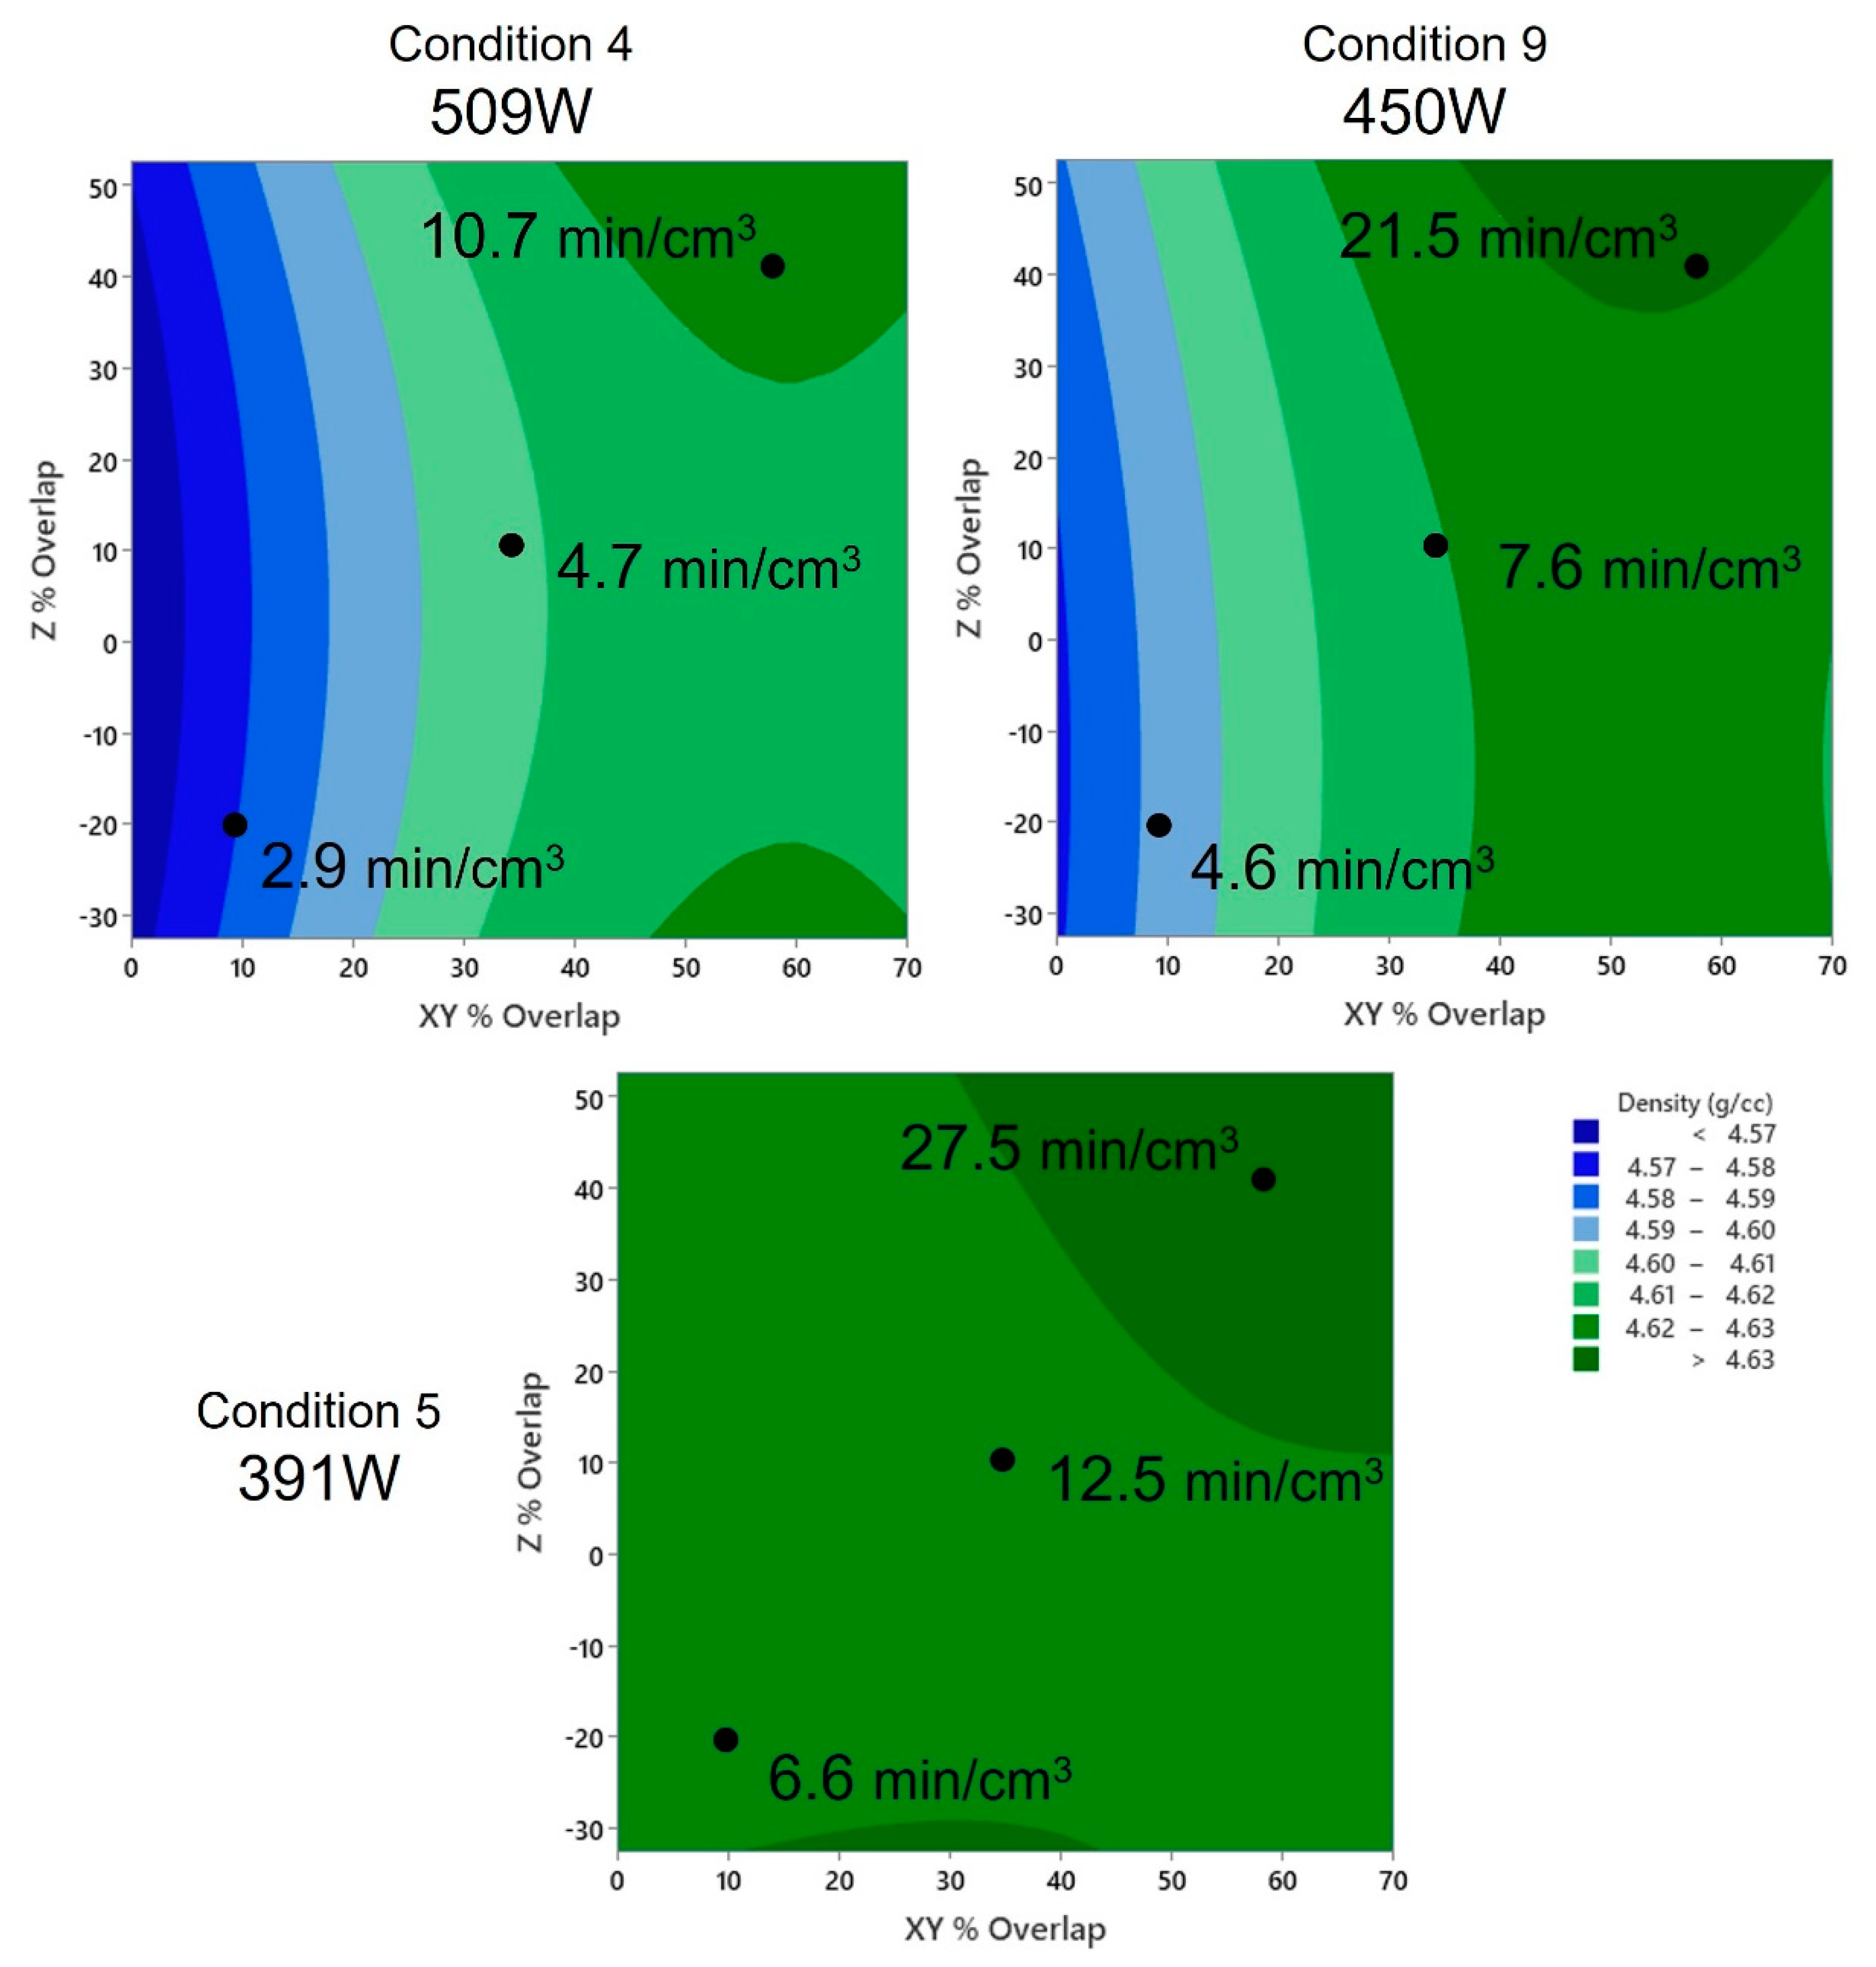
Statistical contour plots for the three build conditions with respect to the effective build rate are presented in Figure 7. The contour plots demonstrate that the specimen density was proportional to the effective build rate across all three tested conditions. The specimen density increased with the lower build rates, while small X–Y overlaps, which have lower EDs, resulted in lower densities. The specimen density was also more sensitive to the X–Y and Z overlaps at the higher laser powers, with condition 4 (509 W) exhibiting the largest range in densities (<4.57–4.63 g/cm3). Larger X–Y overlaps have higher EDs, increasing the dilution and the ability to correct the porosity in previously deposited layers. Condition 5 offered the lowest density variation over the range of effective build rates, implying that lower powers can produce highly dense deposits with relatively low build times.
All the cube density data were combined, and a statistical model was fitted to evaluate the effect of all the tested factors (laser power, traverse rate, powder feed rate, hatch spacing, and layer thickness). There were 13 individual data points for the hatch spacing and layer thickness (including repeat center points) for each condition. In contrast, there were only three tested levels for the laser power, traverse rate, and powder feed rate, limiting the accuracy of their modeled effects due to the small sample size. Regardless, these parameters were included in the model as they could potentially provide useful information about the general behavior of Ti-55511 deposition.
A backwards elimination stepwise approach was employed on all the terms, their squares, and their interactions. The model had an adjusted R-sq value of 84%. The low p-values (<0.005) and insignificant lack-of-fit test (>0.05) showed that the model was statistically suitable. The hatch spacing and its square term were the only statistically significant terms in the resulting model (p-values of 0.002 and 0.000, respectively). The ZS was the next most significant term, with a p-value = 0.013, followed by the interaction between the HS and ZS. Parameters LP and TR, as well as the interaction terms LP*HS, and HS*ZS, remained in the model but had p-values >0.005. The powder feed rate and remaining interactions either could not be estimated and were removed or eliminated from the model having an alpha value >0.1. Given the limited test points for the LP, TR, and PF, it is not surprising that the most significant parameters in the model were those with the most data, HS and ZS. As expected, the LP, TR, and PF, and their interactions could not be attributed to variations in the Ti-55511 density due to their limited sample size.
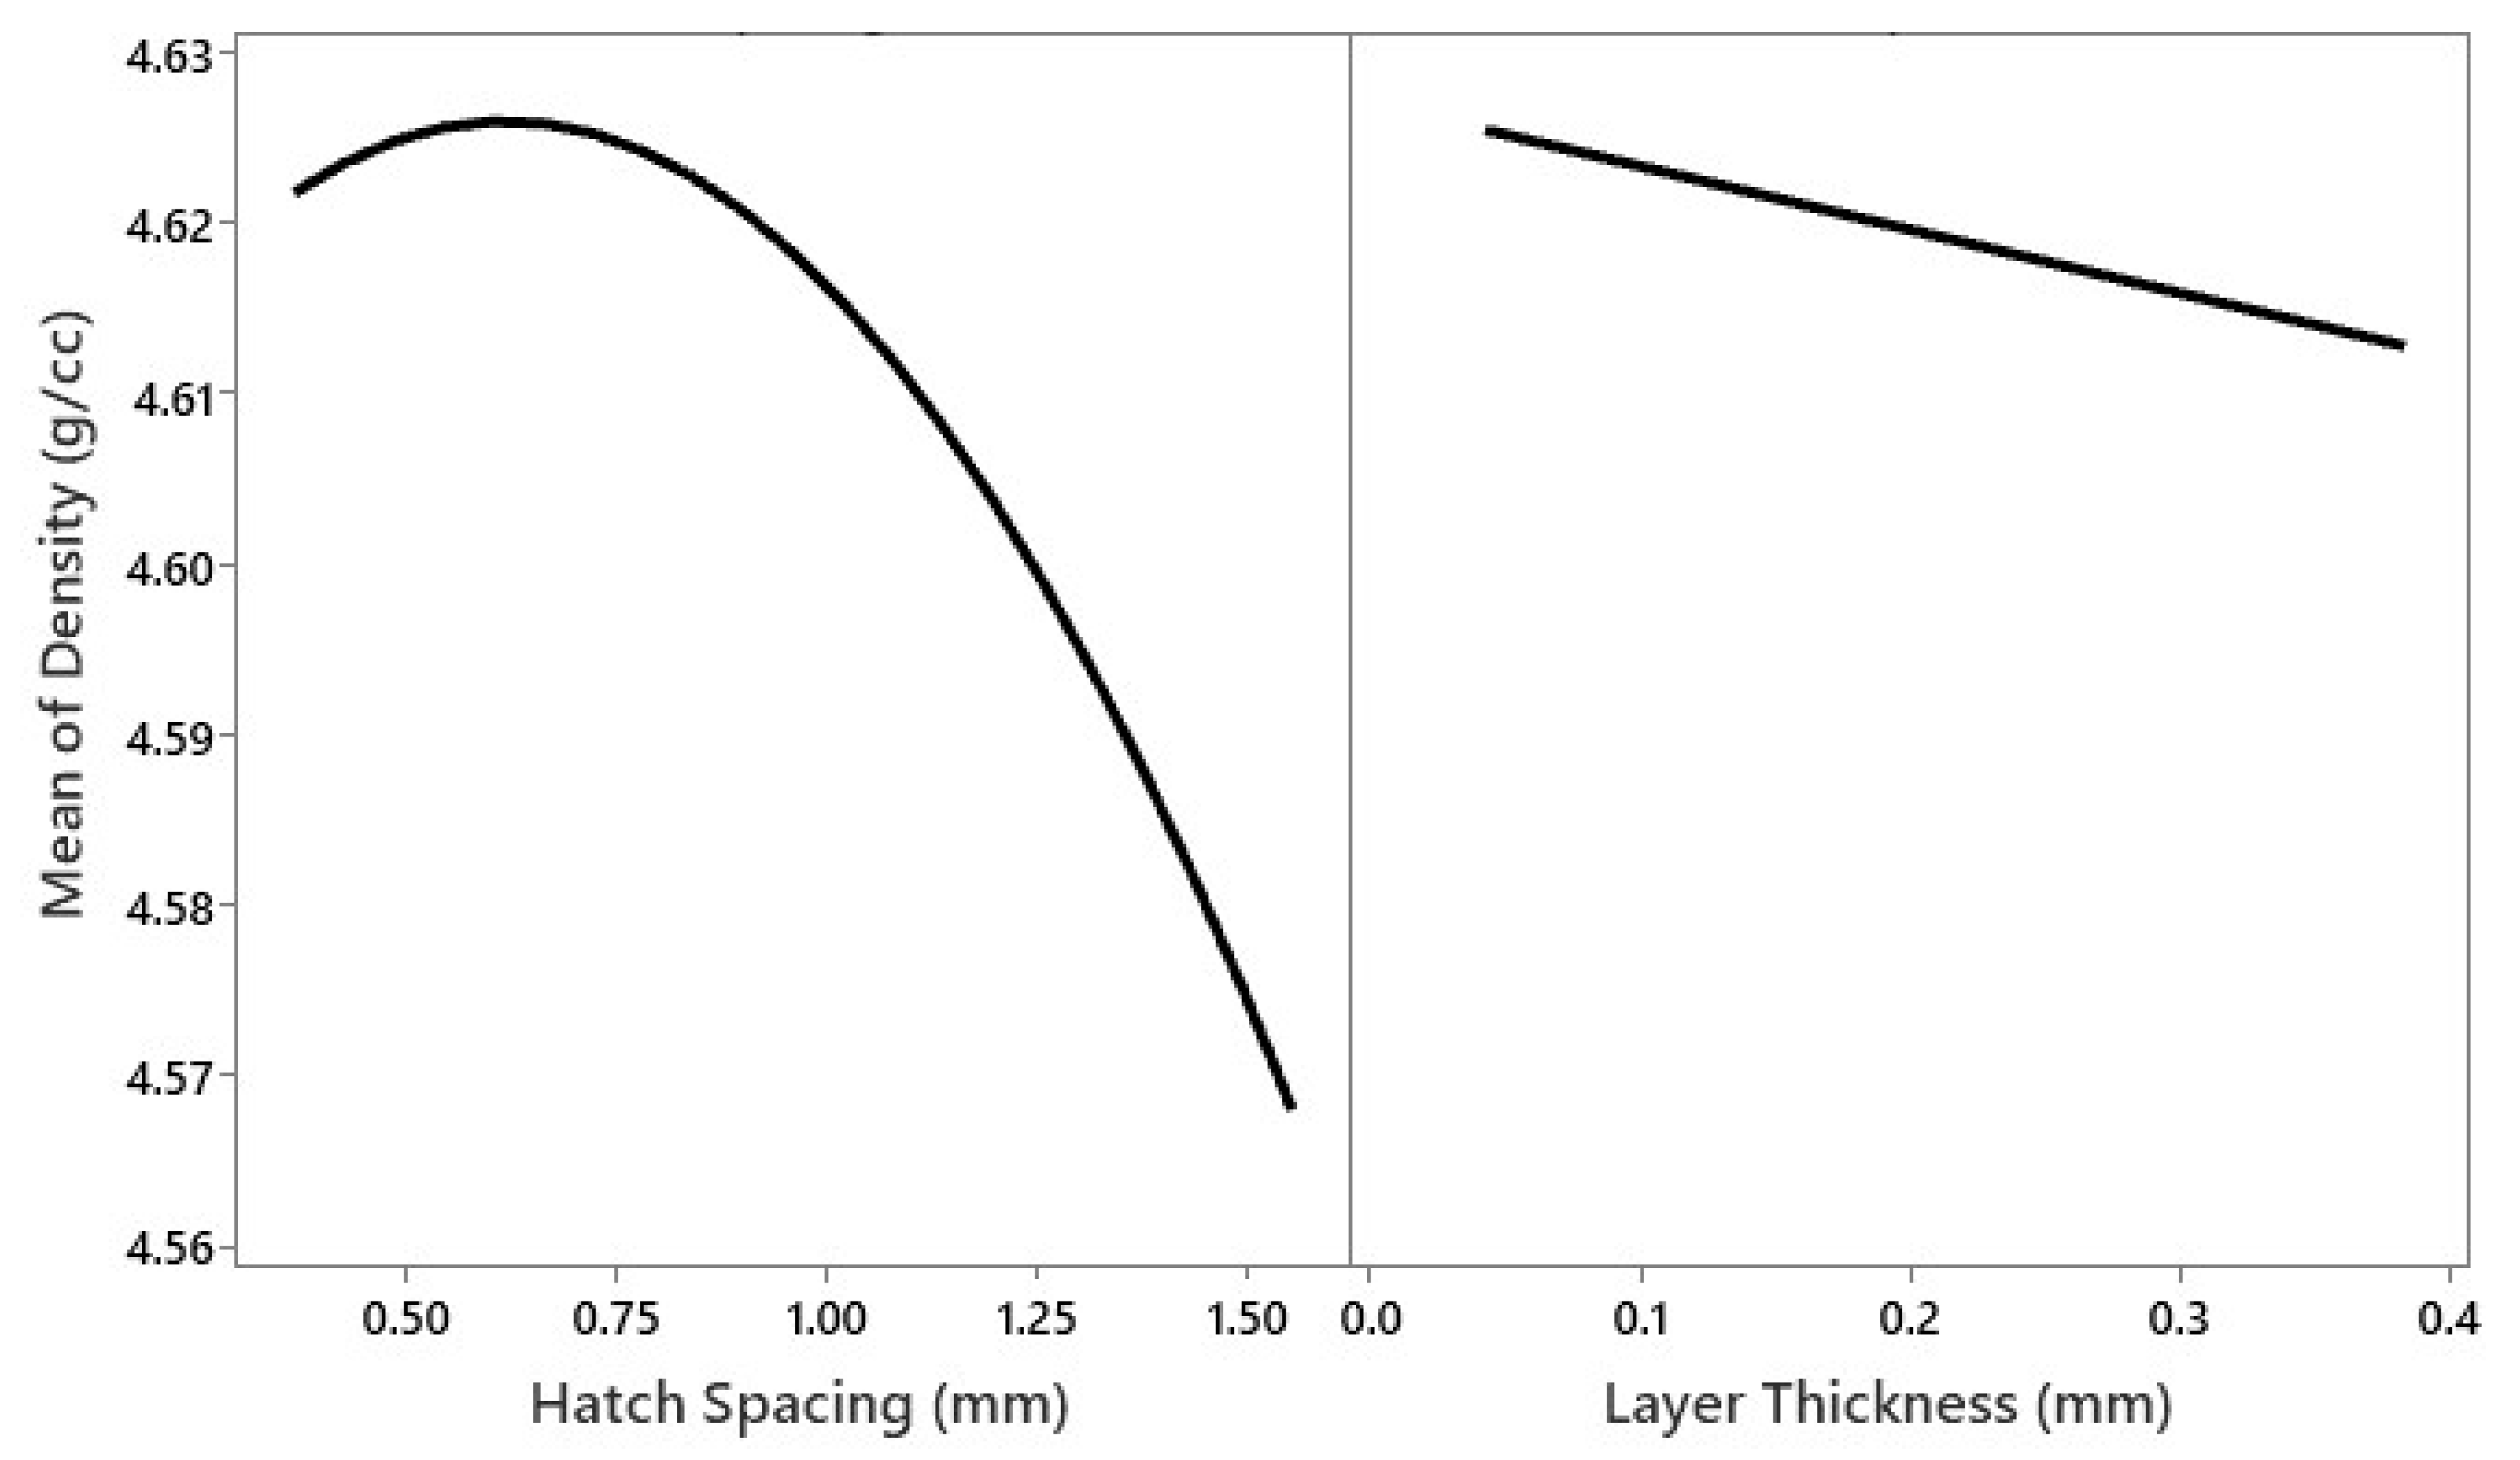
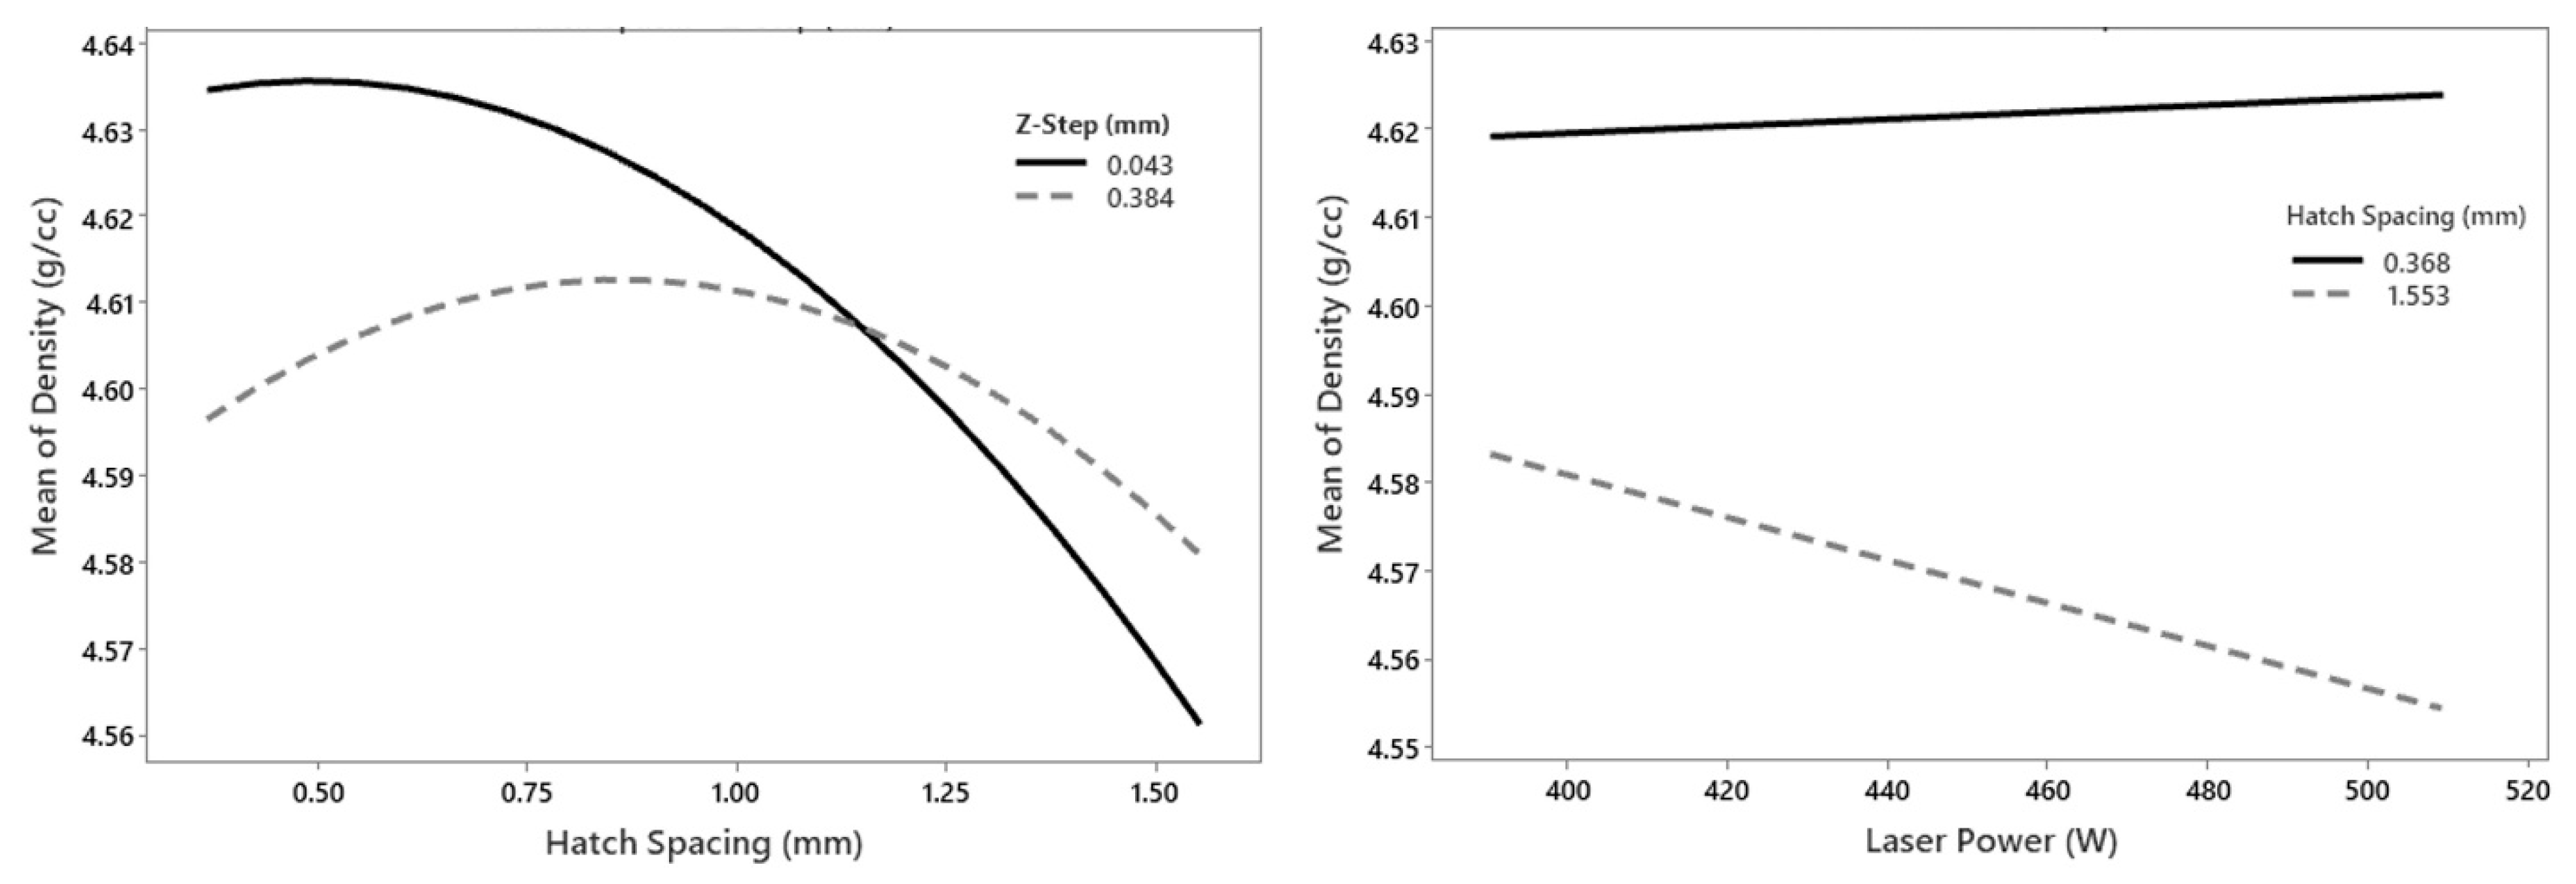
The modeled effects of the hatch spacing and layer thickness on the Ti-55511 specimen density are presented in Figure 8. The LP, TR, and ZS had minimal effects on the density (F-values of 1.23, 4.94, and 7.04, respectively), while the hatch spacing proved to have the largest effect (F-value = 26.23).
The model suggested that the hatch spacing was attributable to variations in the density. The hatch spacing had a parabolic relationship with the density, which exhibited a maximum between 0.5 and 0.75 mm. The specimen density quickly deteriorated to a minimum of 4.560 g/cm3 (98.24%) as the hatch spacing was increased beyond 1 mm. This result agrees with the measured density data, where all the densities above 4.633 g/cm3 (>99.80%) were achieved using low hatch spacings between 0.37 mm and 0.80 mm (corresponding to X–Y overlaps of 35–70%). Similarly, all the densities above 4.633 g/cm3 (>99.80%) were achieved with layer thicknesses below 0.2 mm, which agrees with the predicted effect of the layer thickness shown in Figure 8. The main effects of these parameters are aligned with the previously observed trends in the energy density data (see Figure 5). The small hatch spacings and layer thicknesses (high X–Y and Z overlaps) increased the energy density, which generally resulted in higher densities. In contrast, the low laser powers decreased the energy density, which resulted in lower densities except for the lowest power CCD (condition 5; 391 W). Condition 5 had the highest densities, least variance, and was not explained by a statistical model. However, the model also suggested that the hatch spacing interacted with both the laser power and layer thickness to influence the specimen density. The interaction effects of the hatch spacing with both the layer thickness and hatch spacing are presented in Figure 9.
There was a clear interaction effect between the hatch spacing and layer thickness. The hatch spacing had a more dramatic effect on the specimen density when a small layer thickness was employed, reaching high densities at low HS values and rapidly deteriorating as the HS was increased. In contrast, the HS had less influence on the density at larger layer thicknesses. The laser power also interacted with the hatch spacing, exhibiting more sensitivity to the laser power at larger hatch spacings, with high laser powers resulting in lower densities. At low hatch spacings (high X–Y overlap), high densities could be achieved across the tested laser power range. The interaction between these parameters demonstrates that low HS and ZS can interact to achieve high densities, while laser power is less critical at a small HS.
The powder feed rate is an important parameter not accounted for in the ED calculation (Equation (3)). All the specimens deposited when the powder feed rate was 1.0 g/min had >99.5% density, suggesting that low powder feed rates generally help promote high densities in Ti-55511. Higher powder feed rates, which were employed at both higher laser power levels, were associated with lower densities. In a similar study on the DED of dual-phase steel, Sweet et al. also noted a decreased density with increased mass inputs (powder feed rates) [18]. This effect was attributed to an increase in the energy lost by the powder stream by either reflection, evaporation, or heating of unfused powder [18,40]. In DED, the presence of powder in the laser path can also intercept the energy input and shadow the substrate, contributing to the energy lost by the powder stream [40]. Similar to Sweet et al.’s work, the fraction of powder input to the system that absorbed energy but did not fuse to the substrate was increased at high powder feed rates, effectively reducing the energy input to the substrate and deposited powder. This theory is supported by the single-track results shown in Table 3, where all the powder feed rates ≤1.0 g/min exhibited >30% capture efficiency, while higher powder feed rates generally exhibited <30% capture efficiency. This likely resulted in the reduced densities observed at both higher powder feed rate settings.

3.3. Microstructural Evaluation

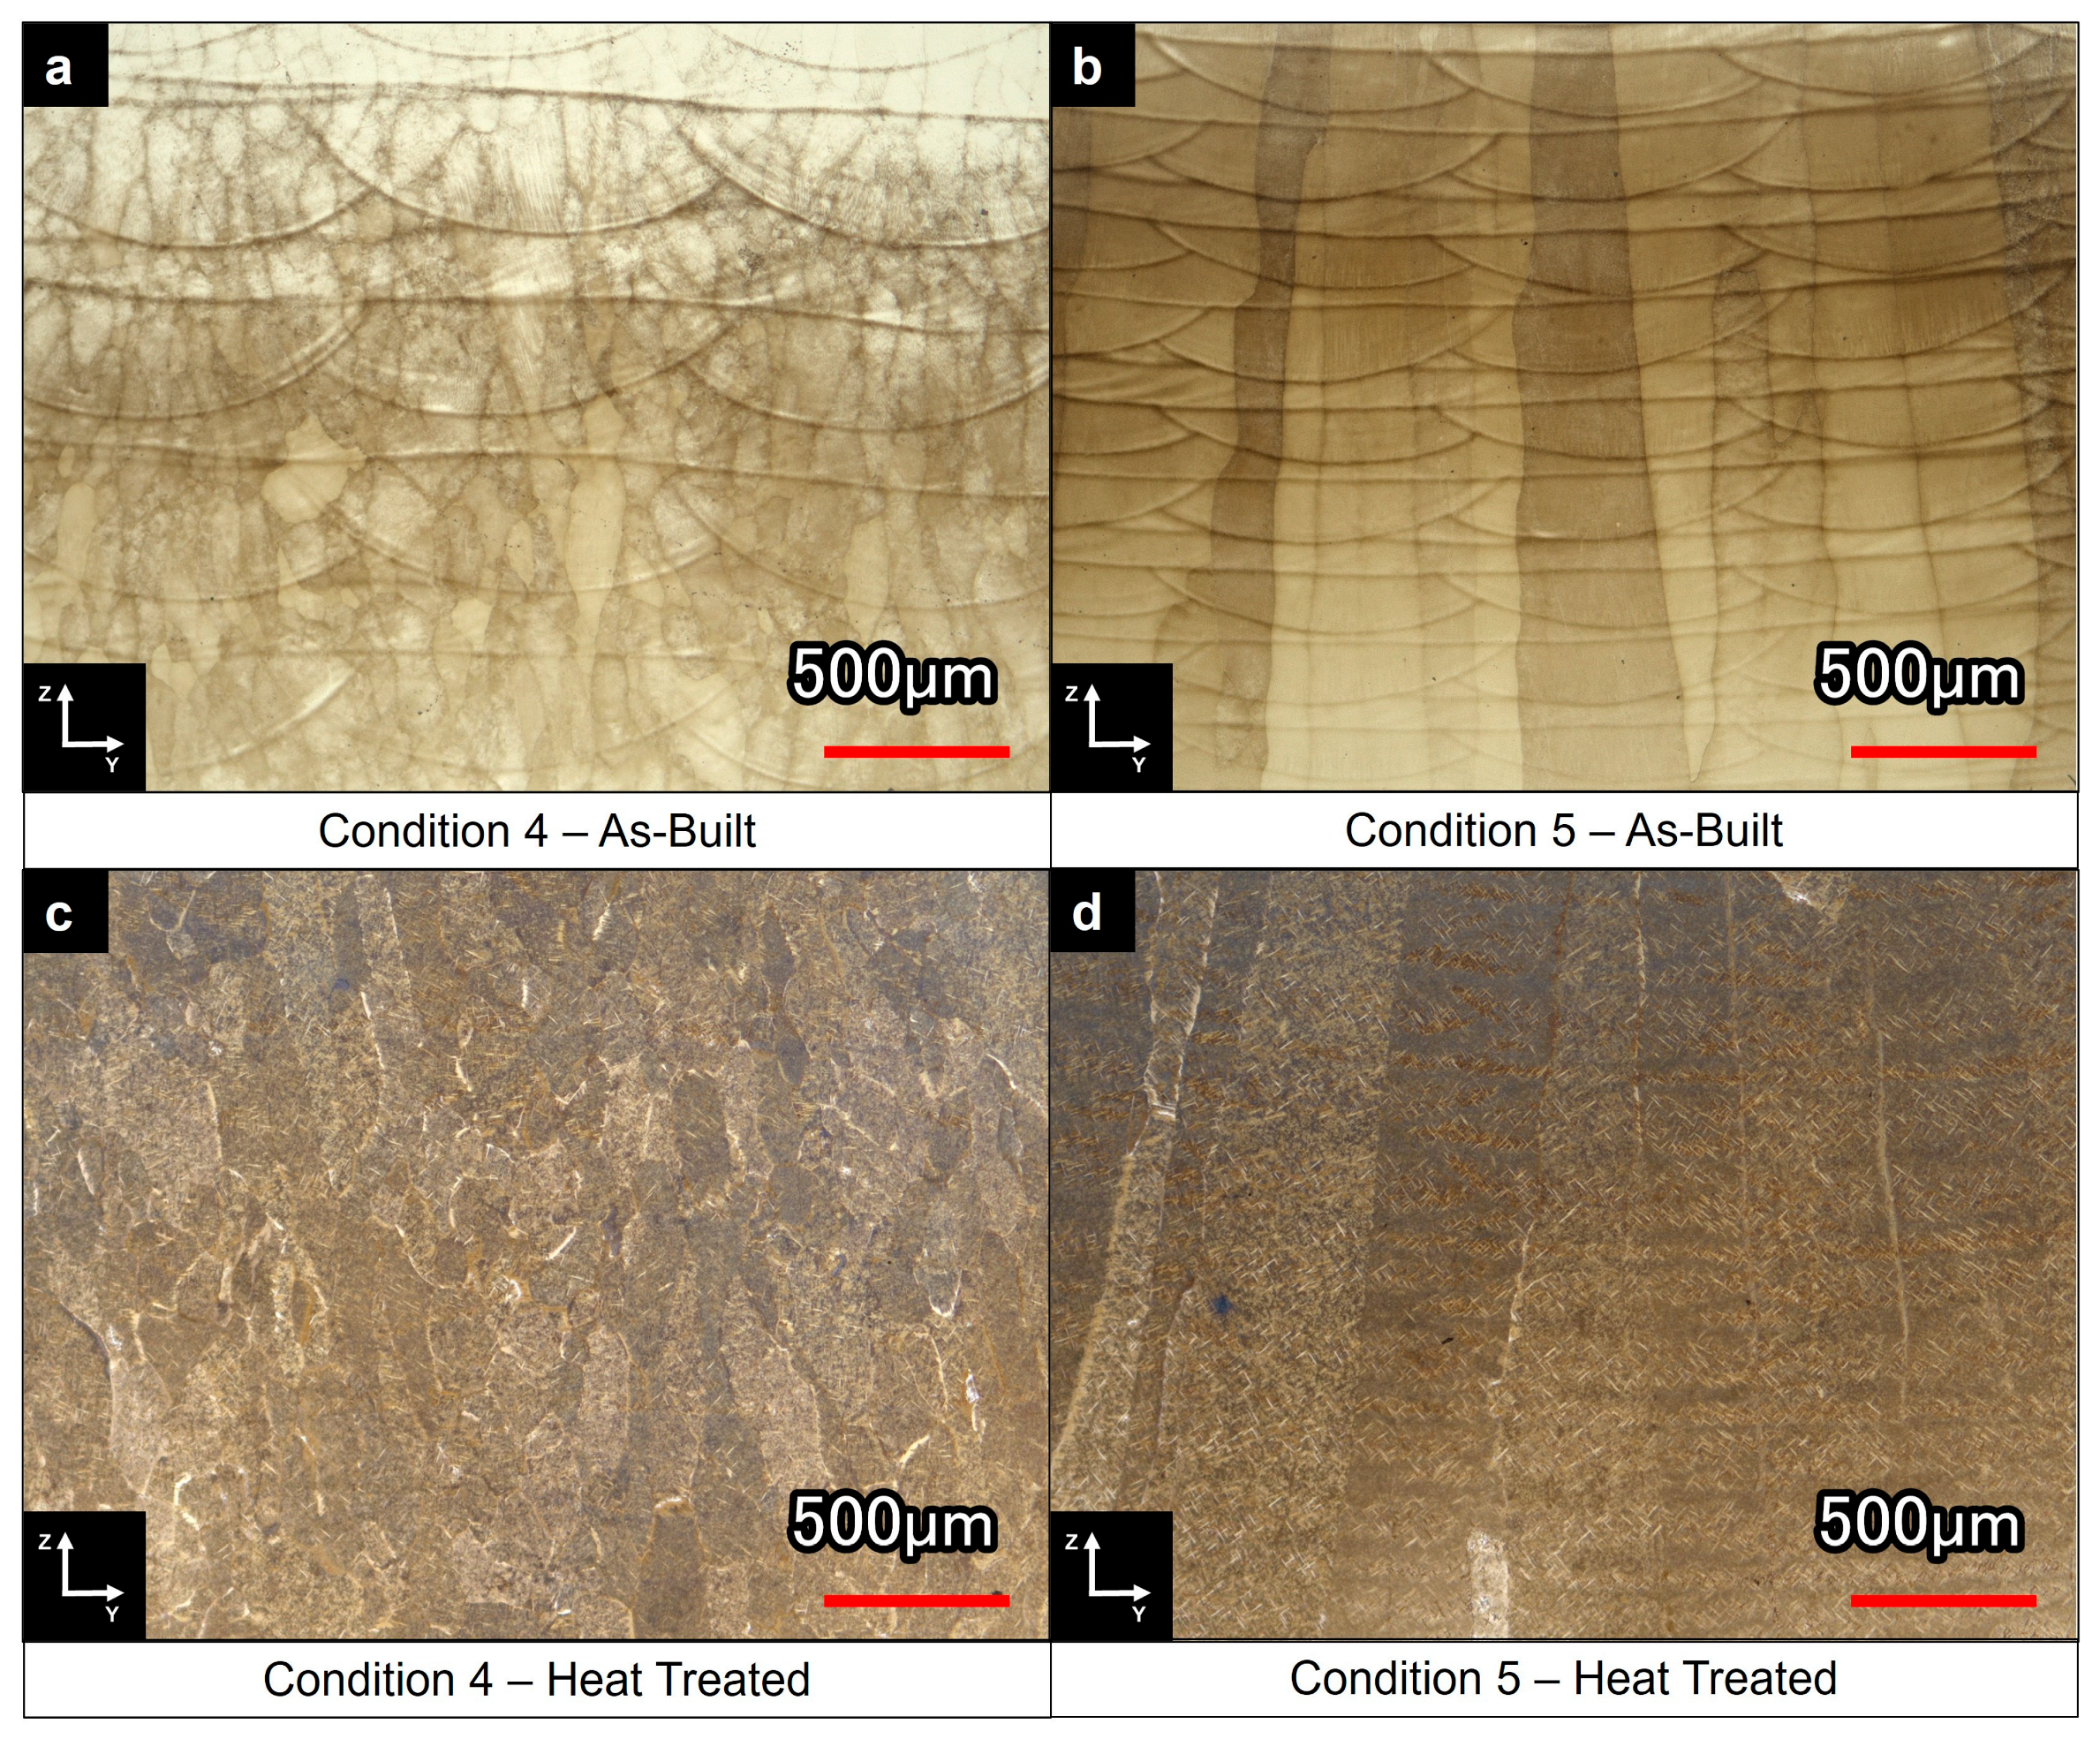
Cube specimens printed under build conditions 4 and 5 were mounted and polished for metallurgical examination. Cross-sections of as-built and stress-relieved specimens printed under identical parameters are presented in Figure 10 for samples representing the center point of the CCDs (the condition to which the significance of changes was tested). The resulting as-built grain structures (Figure 10a,b) were quite different. Condition 4 (ED = 173 J/mm3, 509 W, 11.2 mm/s, 2.4 g/min, HS = 1.010 mm, ZS = 0.261 mm) exhibited a nominally equiaxed grain structure, while condition 5 (ED = 324 J/mm3, 391 W, 11.2 mm/s, 1.0 g/min, HS = 0.796 mm, ZS = 0.135 mm) manifested a highly columnar grain structure that extended through numerous build layers. Etching of the samples (Kroll’s reagent) revealed the grain boundaries and melt-track details. The bead size and layer thickness were notably larger in the higher power condition (509 W, condition 4), which is consistent with the single-track bead height and width measurements. The samples stress relieved at 960 °C for 1 h under a high vacuum (Figure 10c,d) did not exhibit any obvious recrystallization or grain growth.
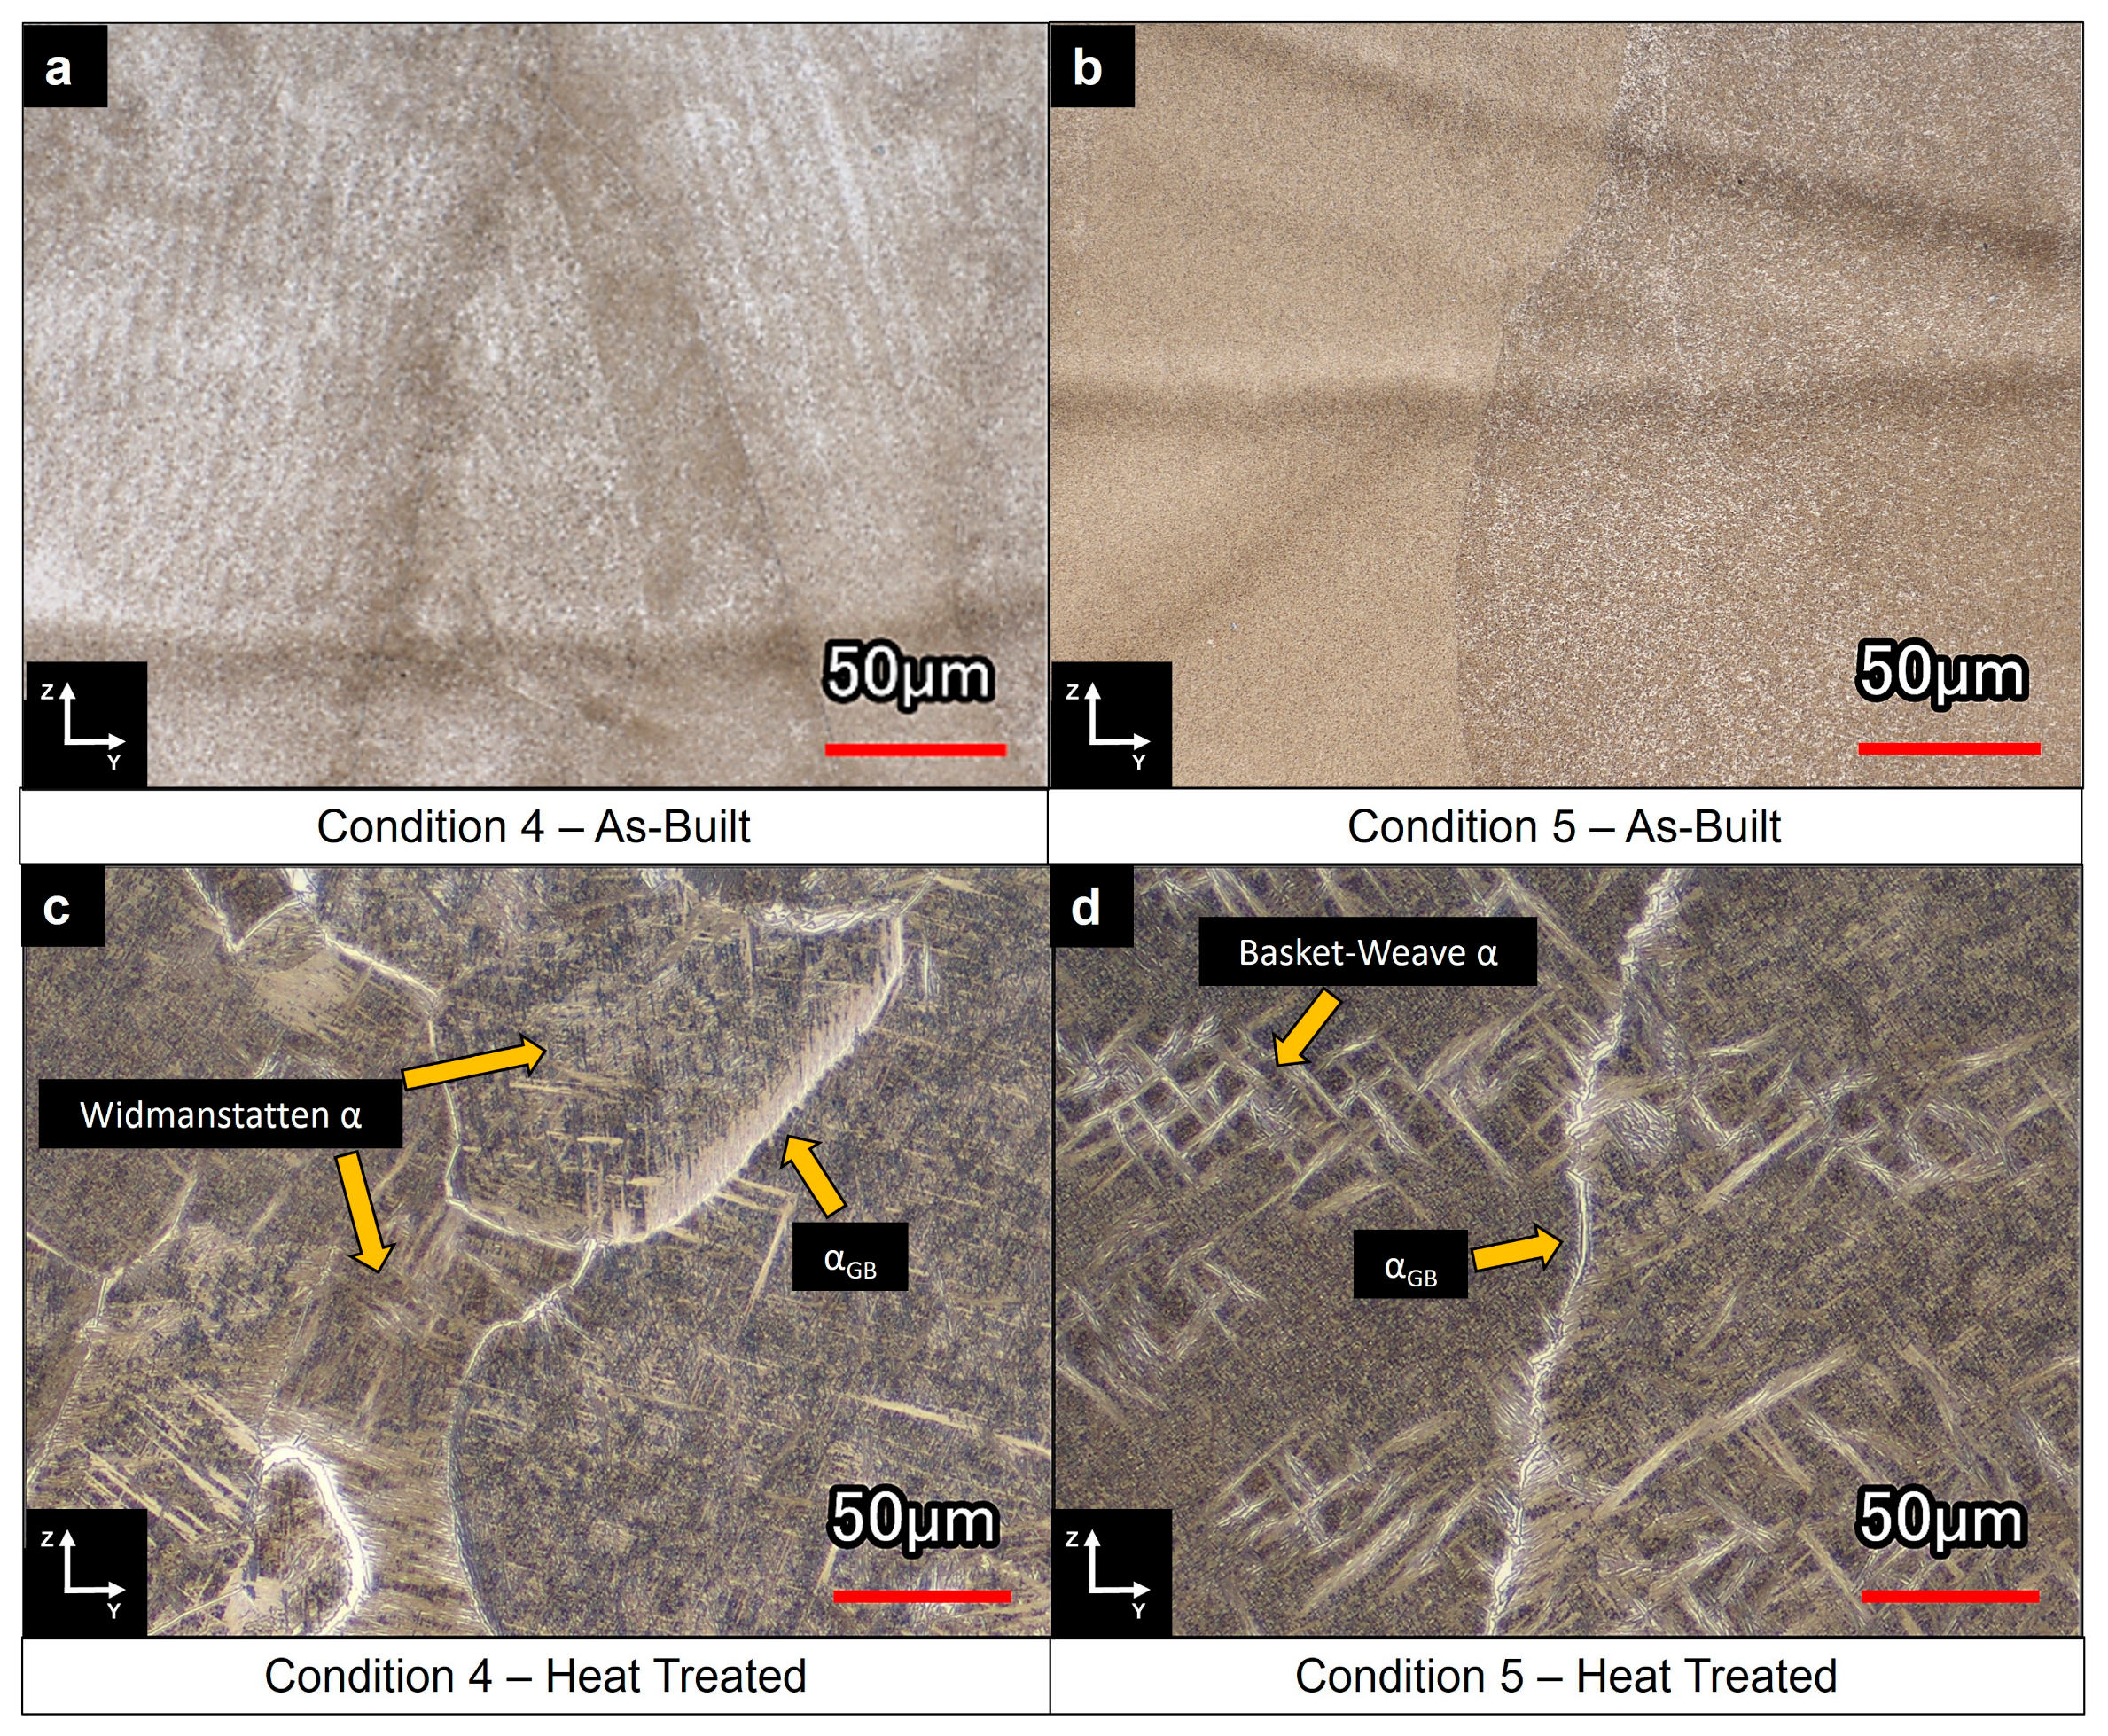
Higher-magnification images of the as-built and stress-relieved microstructures are presented in Figure 11. Areas of the Widmanstatten- and basket-weave-type alpha phase are present under both conditions post-stress relieving, though condition 5 appeared to experience a higher degree of alpha-phase coarsening and contained bands of basket-weave alpha. The grain boundary alpha was also observed in the stress-relieved microstructures.
A. Dass et al. described how the DED process parameters influence the deposited microstructure [1]. Increases in the TR and PF and decreases in the LP lead to lower thermal gradients, G (K/cm), between the melt pool and the solidified material. Lower thermal gradients give rise to higher solidification front velocities, R (cm/s), which result in higher degrees of nucleation and equiaxed microstructures [1]. The contrary promotes columnar growth due to less nucleation and a lower cooling rate, while a mixed region exists between both regimes, which contains a combination of equiaxed and columnar growth. The clear difference in the grain structure between conditions 4 and 5 points to these deposition processes operating within two different grain structure regimes.
C. Liu et al. observed a mixed-mode grain structure in laser-melting deposition (LMD)-processed Ti-55511 [6]. In their work, epitaxial growth occurred at the bottom of the melt pool due to heterogeneous nucleation promoted by the previously deposited layer. Equiaxed growth occurred at the top of the melt pool due to the higher nucleation from the powder feed and the columnar to equiaxed transition (CET) caused by constitutional supercooling from solute segregation. As a result, each layer consisted of columnar grains at the bottom and equiaxed grains at the top in a bamboo-like morphology. Figure 10a,b exhibit entirely equiaxed and columnar structures, respectively. Although there was some localized evidence of epitaxial growth between successive layers in condition 4 (Figure 10a), the bulk of the deposited material had an equiaxed grain structure. Condition 5 (Figure 10b) was entirely columnar and showed no evidence of a CET.
Conditions 4 and 5 employed different LP, PF, HS, and ZS. Condition 4 used a high LP and PF, which produced an equiaxed structure, suggesting that the high PF promoted high nucleation and equiaxed growth despite a high laser energy input. Condition 4 also used relatively large HS and ZS (low X–Y and Z overlaps), decreasing the ED, which manifested in a lower thermal gradient and equiaxed structure. In contrast, condition 5 used a low LP and PF, which produced a columnar structure, despite the use of a relatively low laser energy input. Condition 5 also employed a small HS and ZS (large X–Y and Z overlaps), increasing the ED, which led to a higher thermal gradient and enhanced propensity for the observed columnar structure. Put simply, condition 5 exhibited epitaxial grain growth due to the higher energy density and associated higher G/R ratio, while condition 4 exhibited an equiaxed grain structure due to the lower energy density and associated lower G/R ratio [1]. Apparently, there is a change in the deposited structure over a small ED range (173–324 J/mm3). This is consistent with the interaction effects of the HS and ZS on the deposition process (see Figure 9), where small HS and ZS (higher ED) caused a different density response than large HS and ZS (lower ED). It is also important to highlight that the columnar structure was produced using a higher energy density (324 J/mm3) than the equiaxed structure (173 J/mm3).
In condition 4, the higher LP was required to compensate for the additional powder mass flow and lower overlaps (higher HS and ZS). As a result, the overall ED is lower compared to condition 5, which used a lower laser power to account for the low powder mass flow and high heat accumulation in the deposited layer due to the higher overlaps. In either case, the PF evidently influences the deposited structure and, likely, specimen density in a similar manner to the LP.
The post-heat treatment microstructures of deposition conditions 4 and 5 are shown in Figure 12. Grain boundary alpha (αGB) was present throughout both specimens and exhibited continuous and discontinuous features. Colonies of Widmanstatten grain boundary alpha (αWGB) were found throughout both deposition conditions. A basket-weave microstructure of primary (αP) and secondary (αS) alpha was prominent within the beta grains. A thin precipitate free zone (PFZ) was also observed between the αGBWGB and the αPS regions.
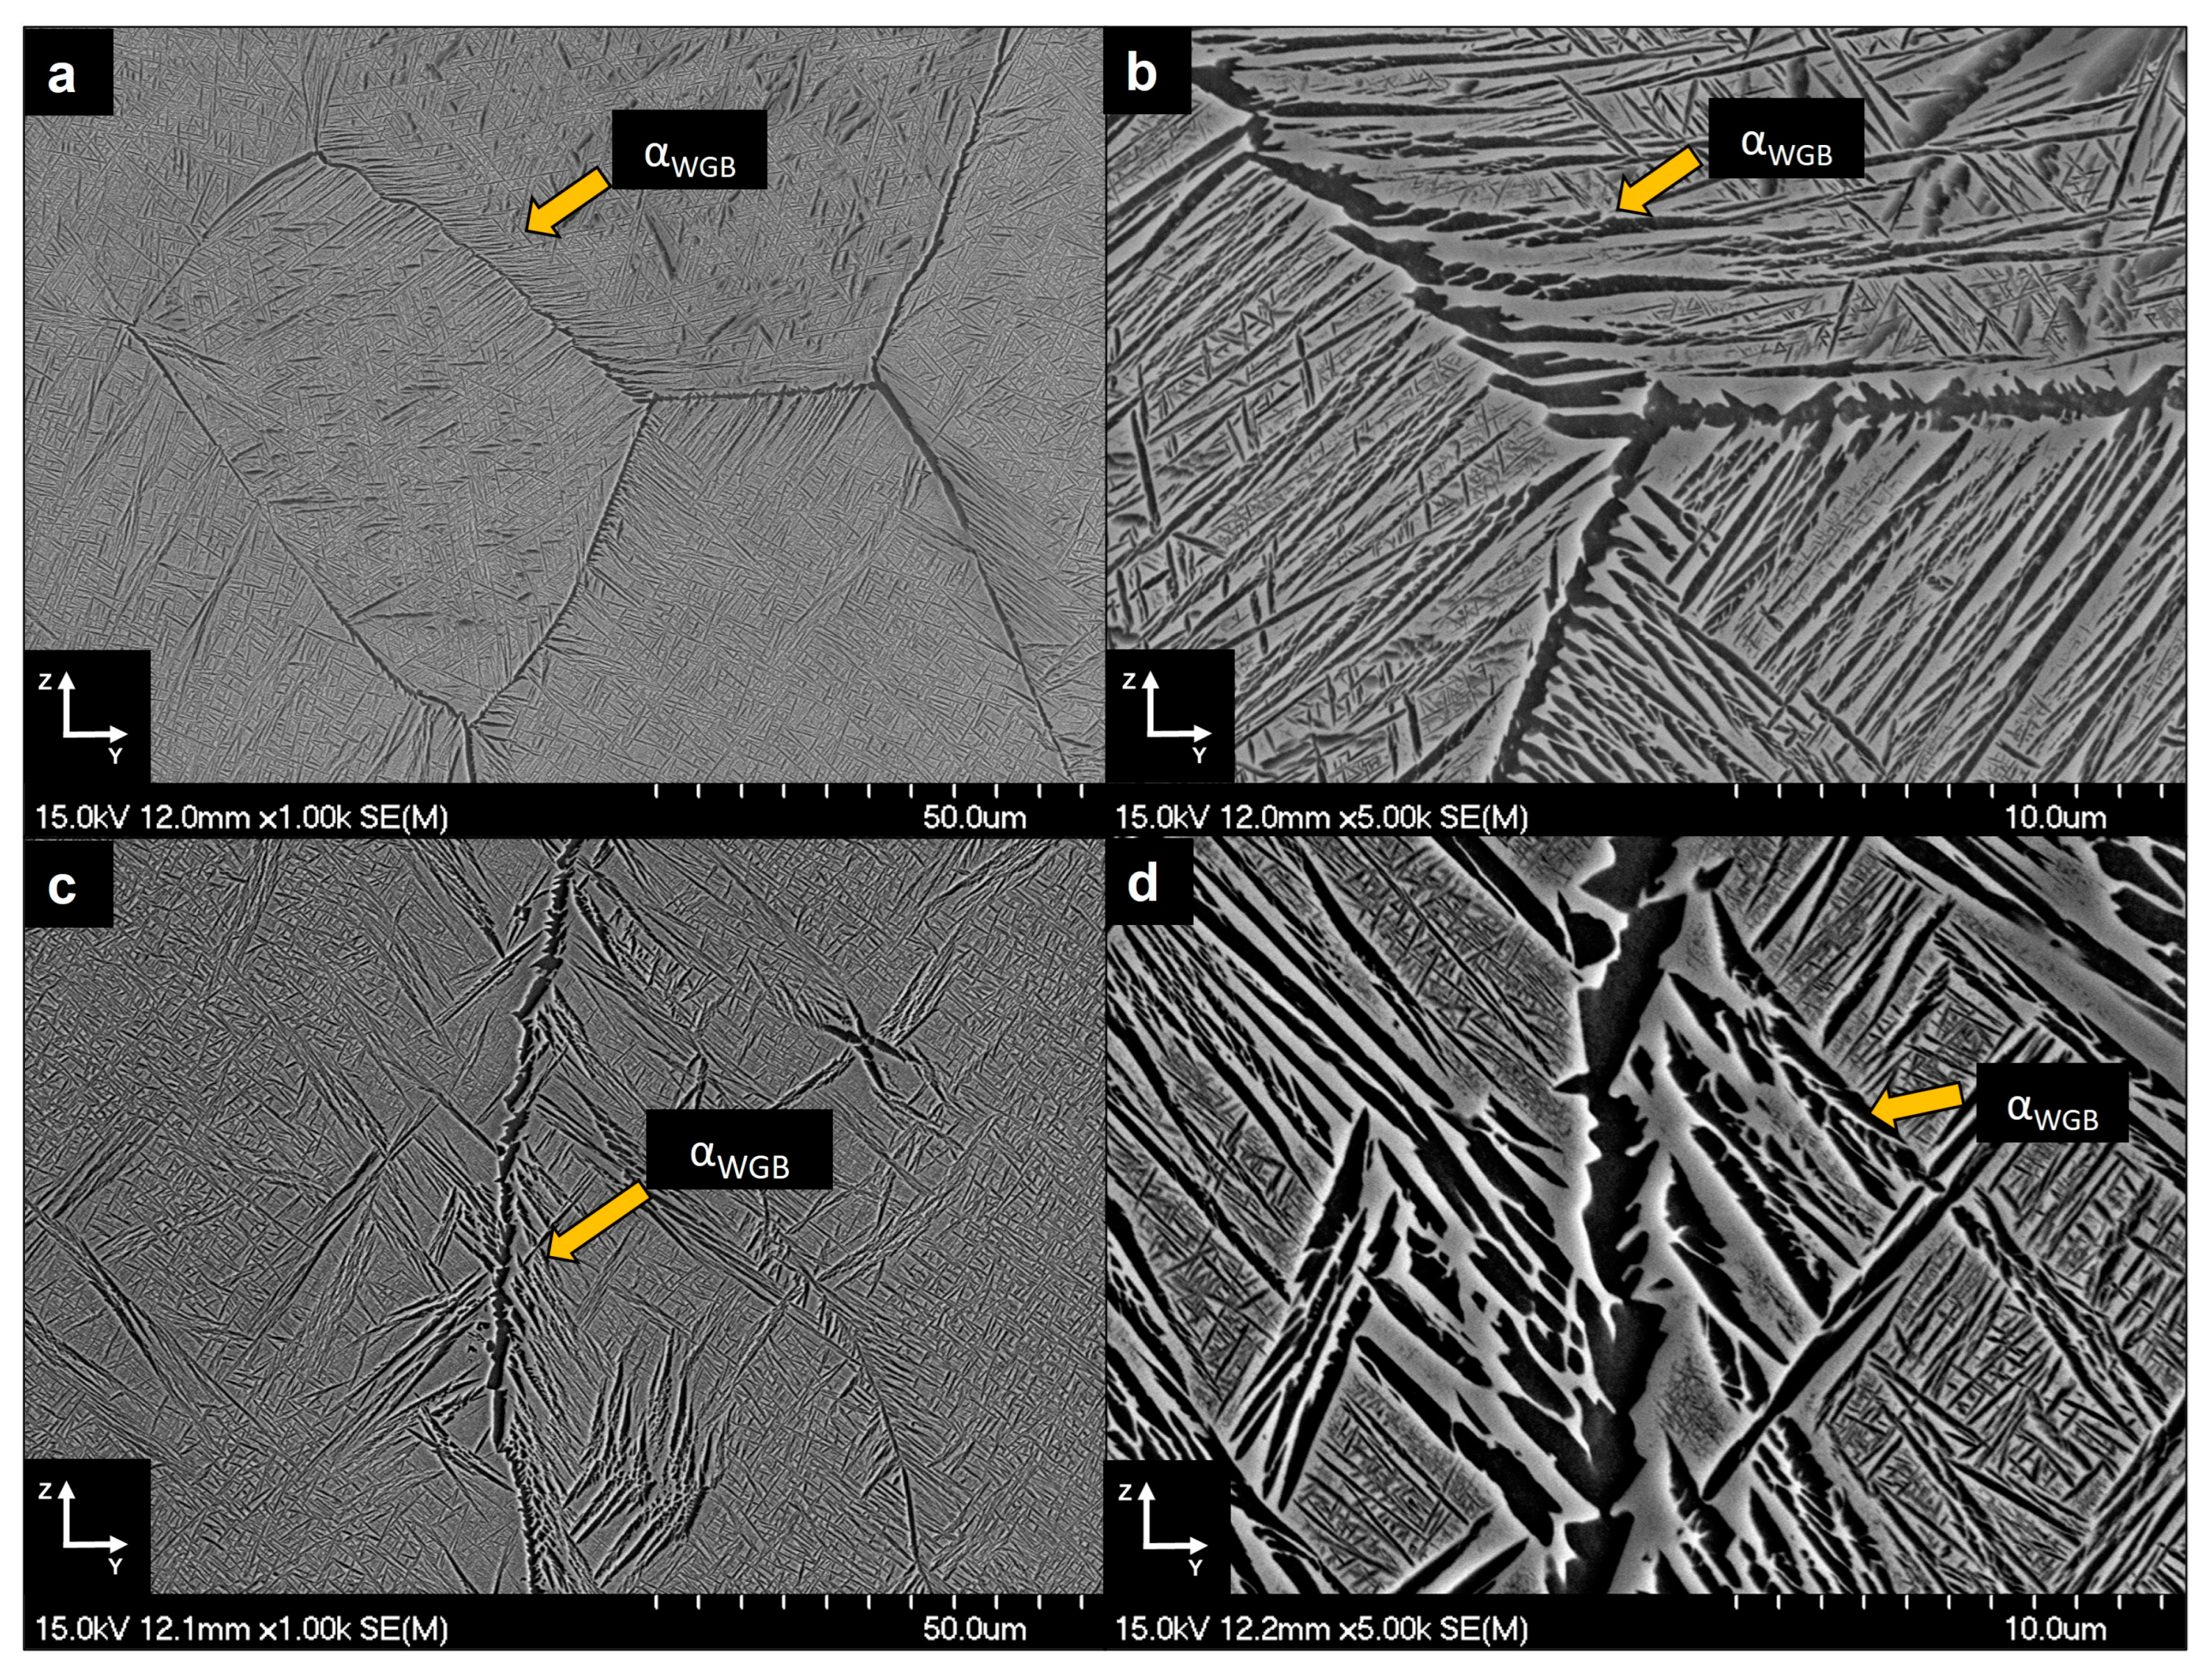
The microstructures observed are consistent with the work of Liu et al., who studied the beta heat treatment of LMD Ti-55511 [5]. Their work demonstrated that as-printed Ti-55511 specimens contained linear grain boundary alpha (αLGB) because of the complex thermal cycling during deposition. The presence of continuous films of αLGB in the as-printed Ti-55511 allowed intergranular crack propagation through the PFZs and resulted in low ductility (<5%). In contrast, the formation of herringbone and Widmanstatten alpha-phase morphologies, αWGB, which form upon cooling from the β-phase field, breaks up the PFZs and limits crack propagation, increasing the ductility. Therefore, a β heat treatment (above the β transus temperature, Tβ = 880 °C, for Ti-55511 [5]) is required to transform the retained αLGB to αWGB and improve the ductility of the material. The microstructures in Figure 12 were heat treated above the β transus (THT = 960 °C) and exhibit the discontinuous grain boundary morphologies reported by Liu et al., which can lead to superior ductility.

3.4. Mechanical Properties

The tensile properties of the specimens printed under conditions 4 and 5 are presented in Table 5 These two deposition conditions were selected for tensile testing due to their differing grain structures (see Figure 11). The presented data are an average of two or more individual tests and all the specimens were tested in the stress-relieved condition (960 °C for 1 h under a high vacuum). Each deposition condition was printed utilizing both recycled argon (Recycled Ar) and a direct purge of argon (Direct Ar) to shield the melt pool. In the direct purge (Direct Ar) set-up, high-purity Ar gas (99.999% Ar) was drawn directly from the compressed gas bank to supply the shield gas and powder feeder carrier gas. This approach ensures that high-purity Ar gas is being used to shield the melt pool during the printing process to minimize contamination. However, it is more economical to recycle the Ar shield gas using an argon recirculation system. By printing tensile blanks under both Recycled Ar and Direct Ar shield gas conditions, the resulting mechanical properties for either shield gas type could be directly compared
The specimens printed while continually recycling argon through the chamber, process shield gas, and powder feed exhibited acceptable ultimate tensile strength (UTS) and yield strength (YS) but poor ductility when compared with the literature values [5,
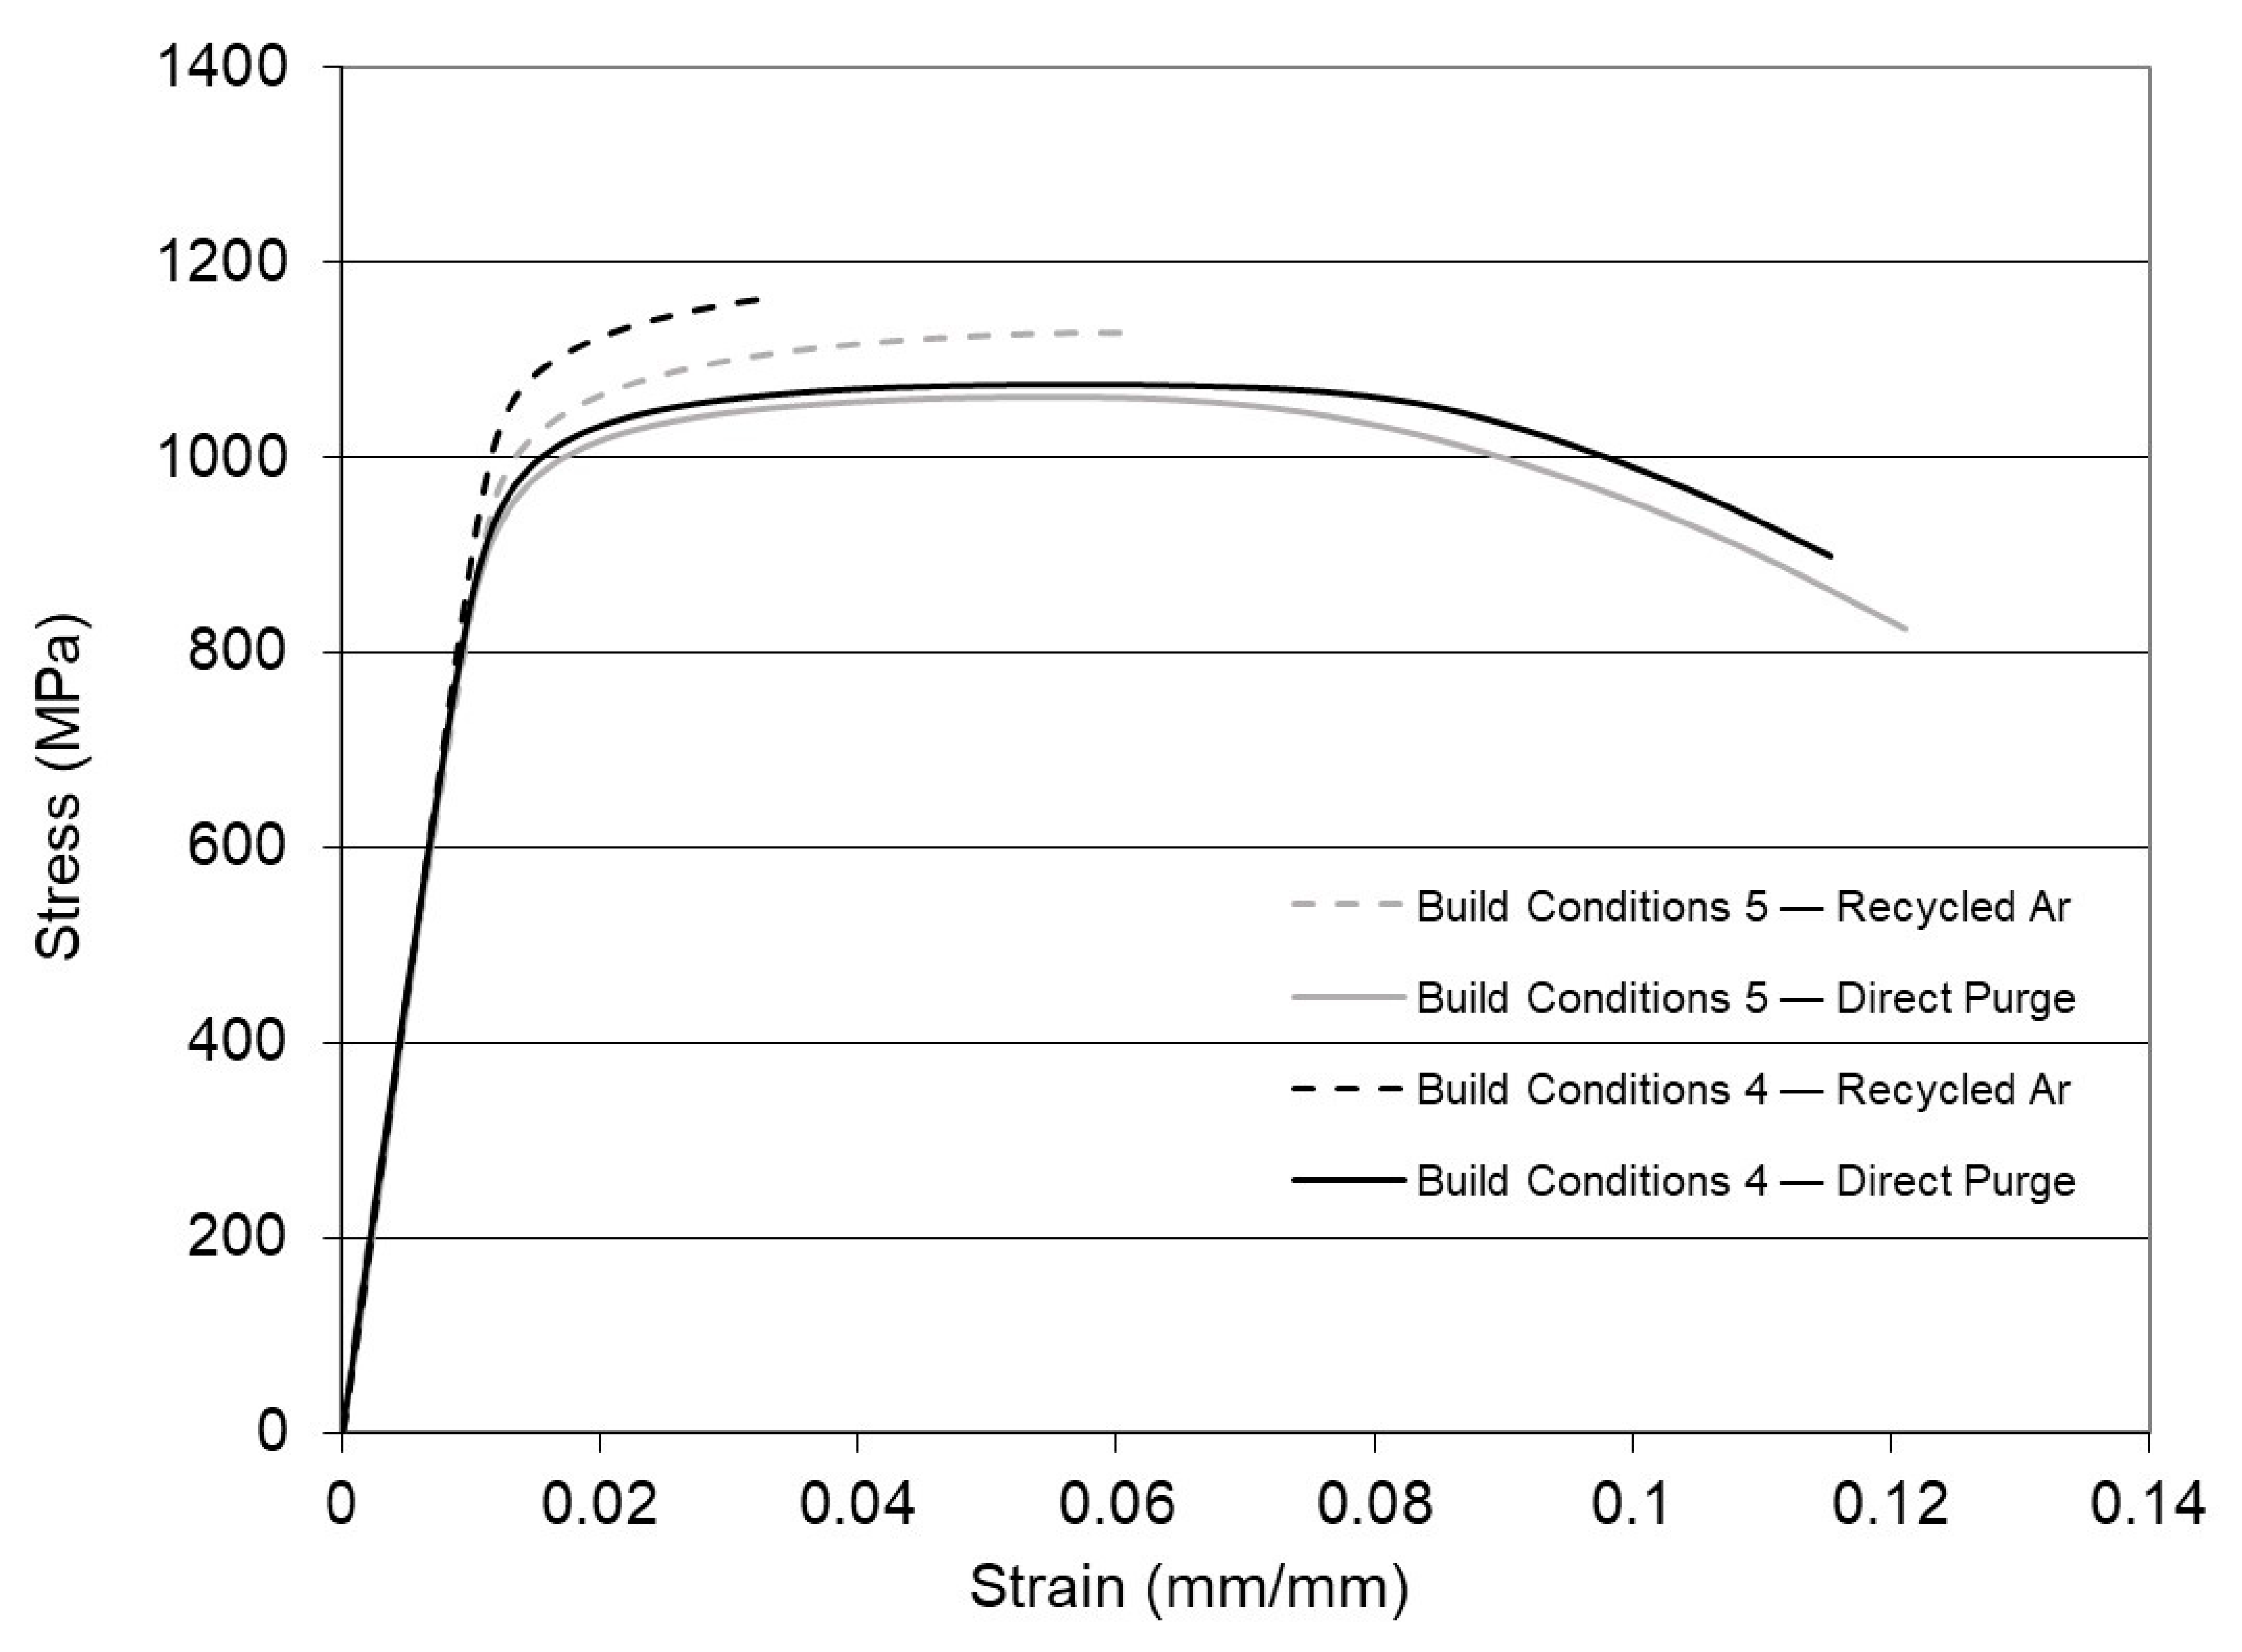
6]. The percent elongation for condition 4 was 2.7%, while condition 5 had a higher ductility at 6.2%. The inferior ductility exhibited by condition 4 could be caused by a slightly lower density. Under the Direct Ar condition, the specimens had lower UTS and YS but were substantially more ductile and exceeded the elongation requirement in the literature [5,6]. The difference in elongation between the Recycled Ar and Direct Ar processing conditions is evident in the stress–strain curves presented in Figure 13. In general, the specimens printed using Recycled Ar had inferior ductility to those printed under direct purge conditions regardless of the print parameter set employed.
Titanium has a high affinity to oxygen, nitrogen, and carbon. These elements diffuse interstitially through the microstructure and can negatively impact the ductility [34,41]. Rousseau et al. highlighted that by increasing the oxygen content in Ti-6Al-4V up to a limit of 2000 ppm O2, the tensile strength could be improved without negatively impacting the ductility [42]. However, controlling the impurity content during printing is critical because the interstitial content can cause embrittlement [13]. Generally, when high ductility and toughness are required, as is the case in most Ti alloy aerospace applications, the interstitial content must be kept to acceptably low levels to prevent embrittlement [13].
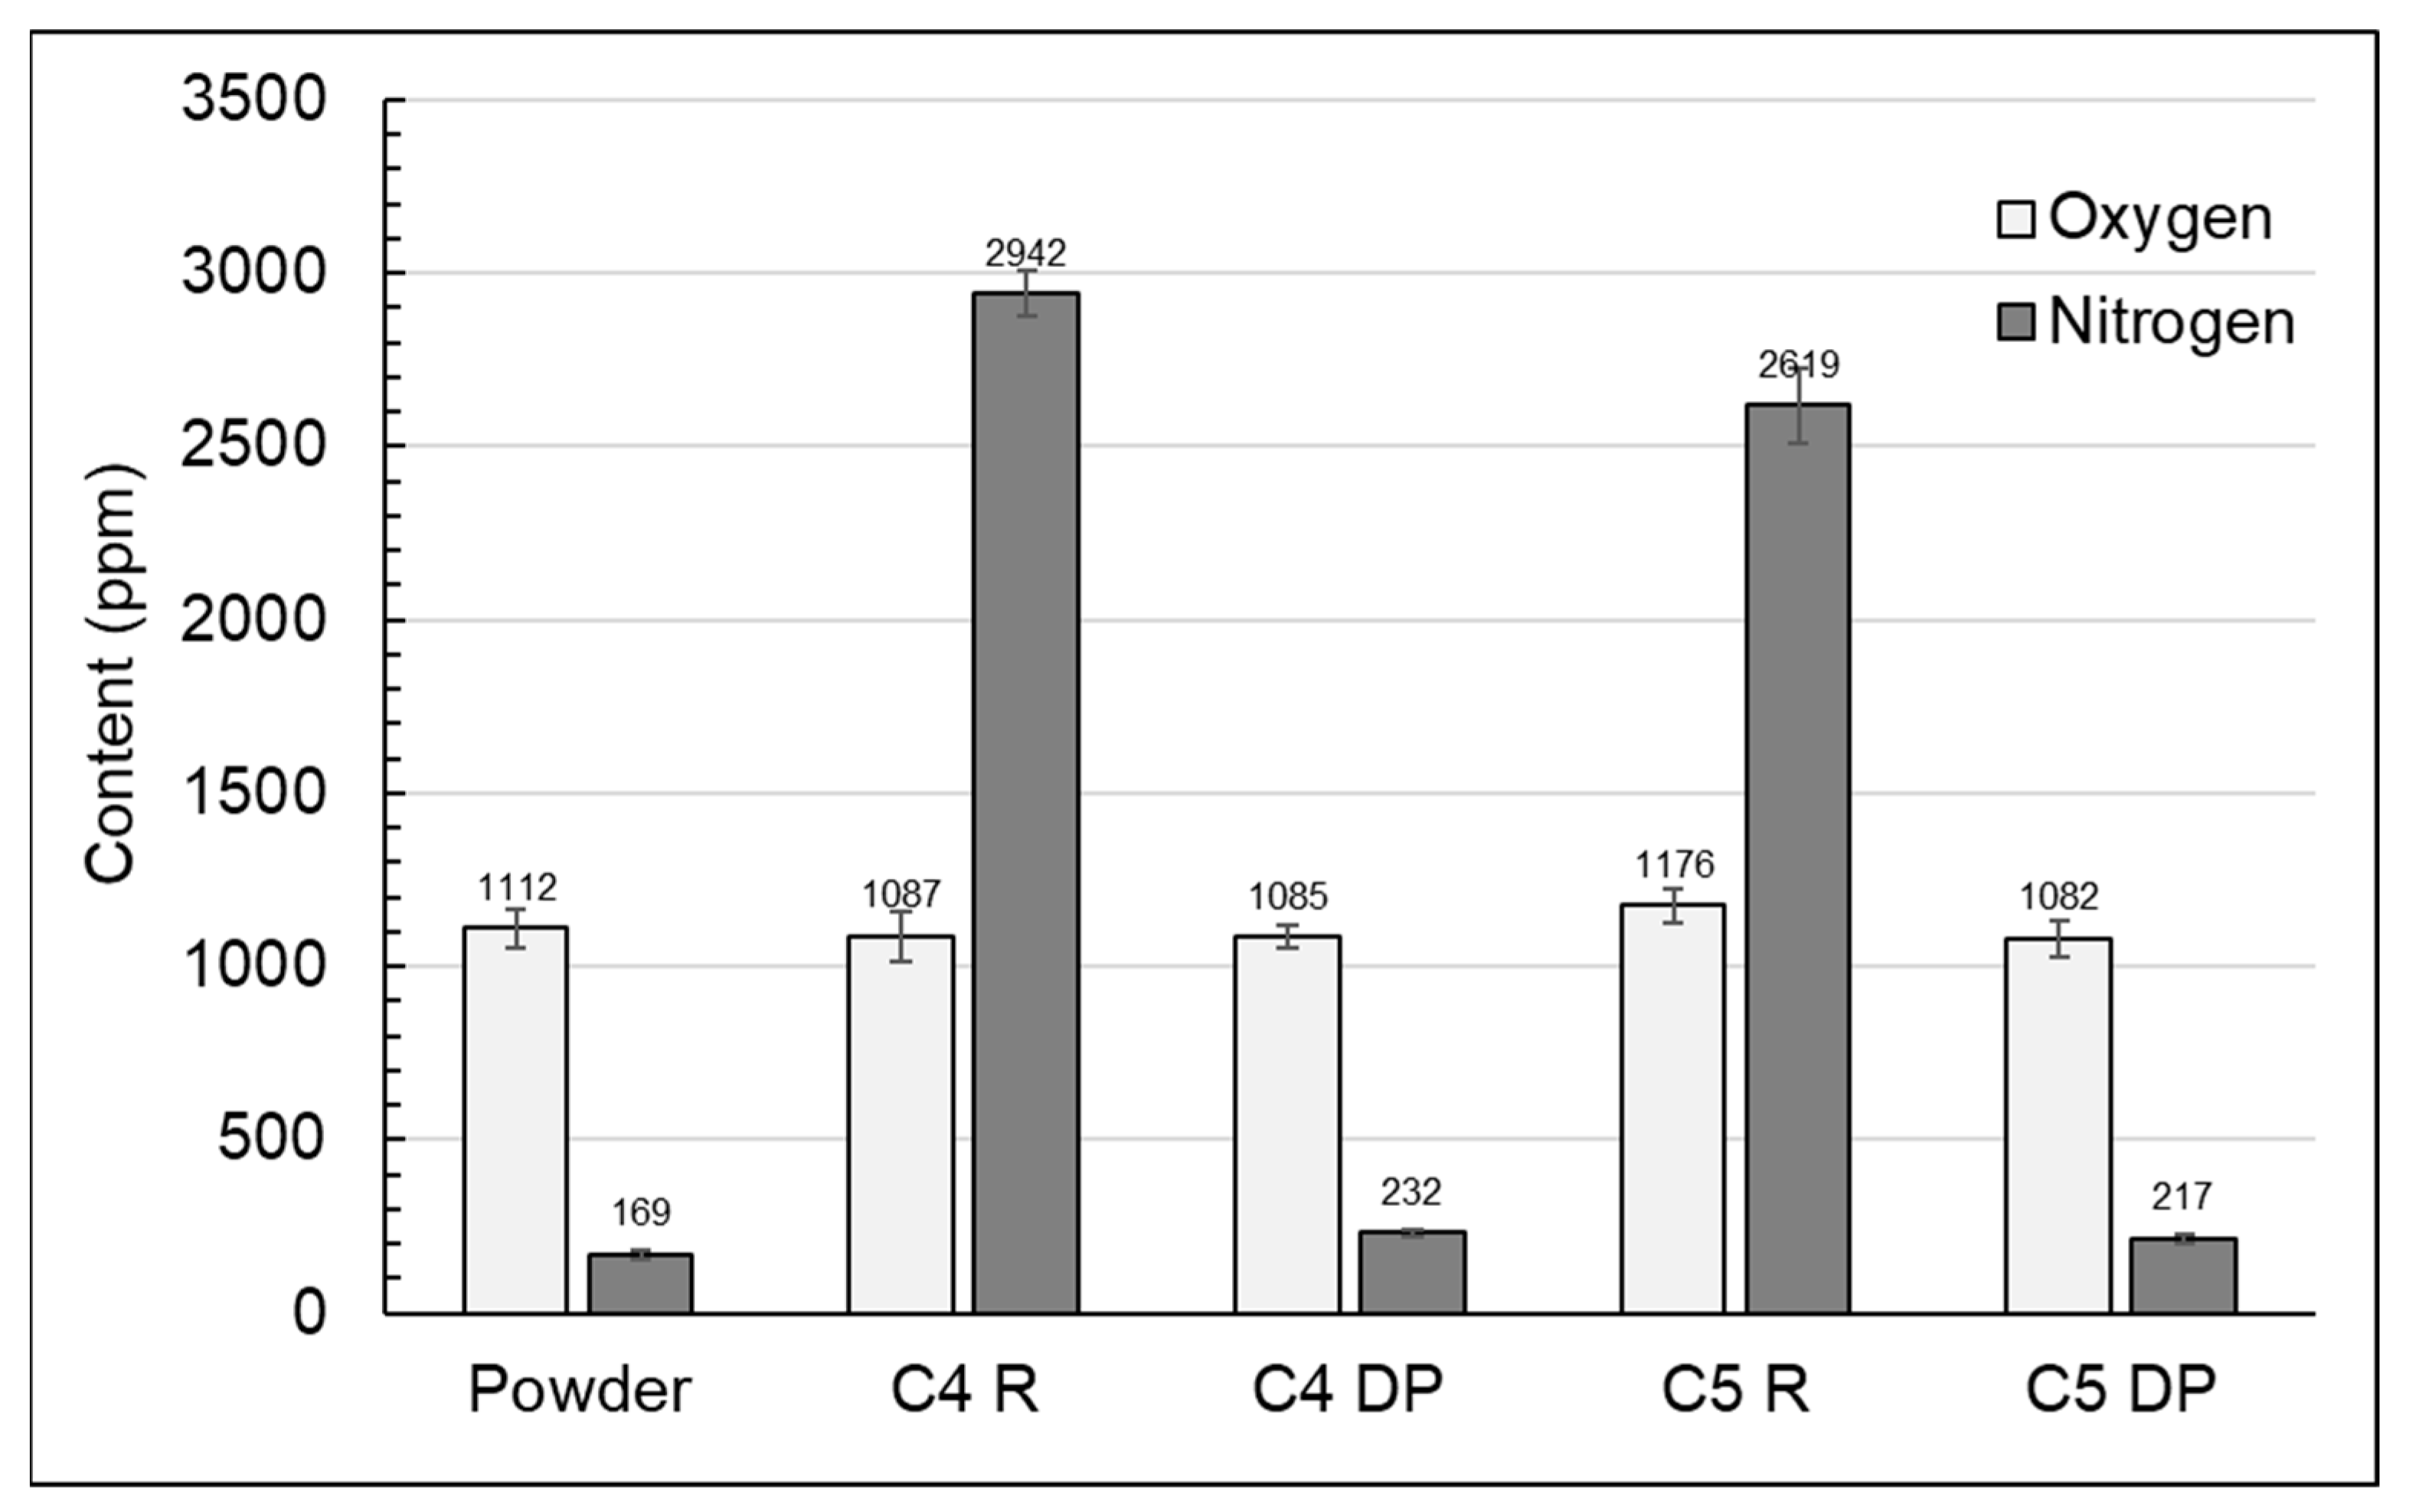
The oxygen and nitrogen (ON) contents of the tensile specimens were measured to quantify and compare the impurity level imparted by the Recycled and Direct Ar process conditions. The results, presented in Figure 14, demonstrate that there was a significant amount of nitrogen pick-up during the deposition process when the argon purge gas was continually recycled. The Ti-55511 powder feedstock had 169 ppm N2, but processing using the Recycled Ar gas caused an increase to over 2500 ppm N2. In contrast, the oxygen content was consistently 1100 ppm O2 for the powder feedstock and all the deposition conditions. The ductility achieved under the Direct Ar purge condition is aligned with the results reported by Rousseau et al., where the ductility could be maintained in Ti-6Al-4V with oxygen levels below 2000 ppm O2 [42]. In the Recycled Ar case, the accumulation of N2 in the deposited Ti-55511 clearly caused embrittlement. Although this result may not be surprising, it highlights the importance of monitoring the O and N impurity levels in the DED process environment for Ti alloys.
The tensile specimens printed using Recycled Ar exhibited elevated N2 contents, but their O2 contents were consistent with the level measured for the as-received Ti-55511 powder. The tensile specimens printed with the Direct Ar showed no significant change in the O or N content from the as-received powder. This result implies that the source of the N2 contamination was in the Ar recirculation system. However, an air leak in the Ar recirculation system would have imparted both O2 and N2 to the material. Therefore, an alternate source of N2 in the Ar recirculation system must have existed. To further investigate the source of the N
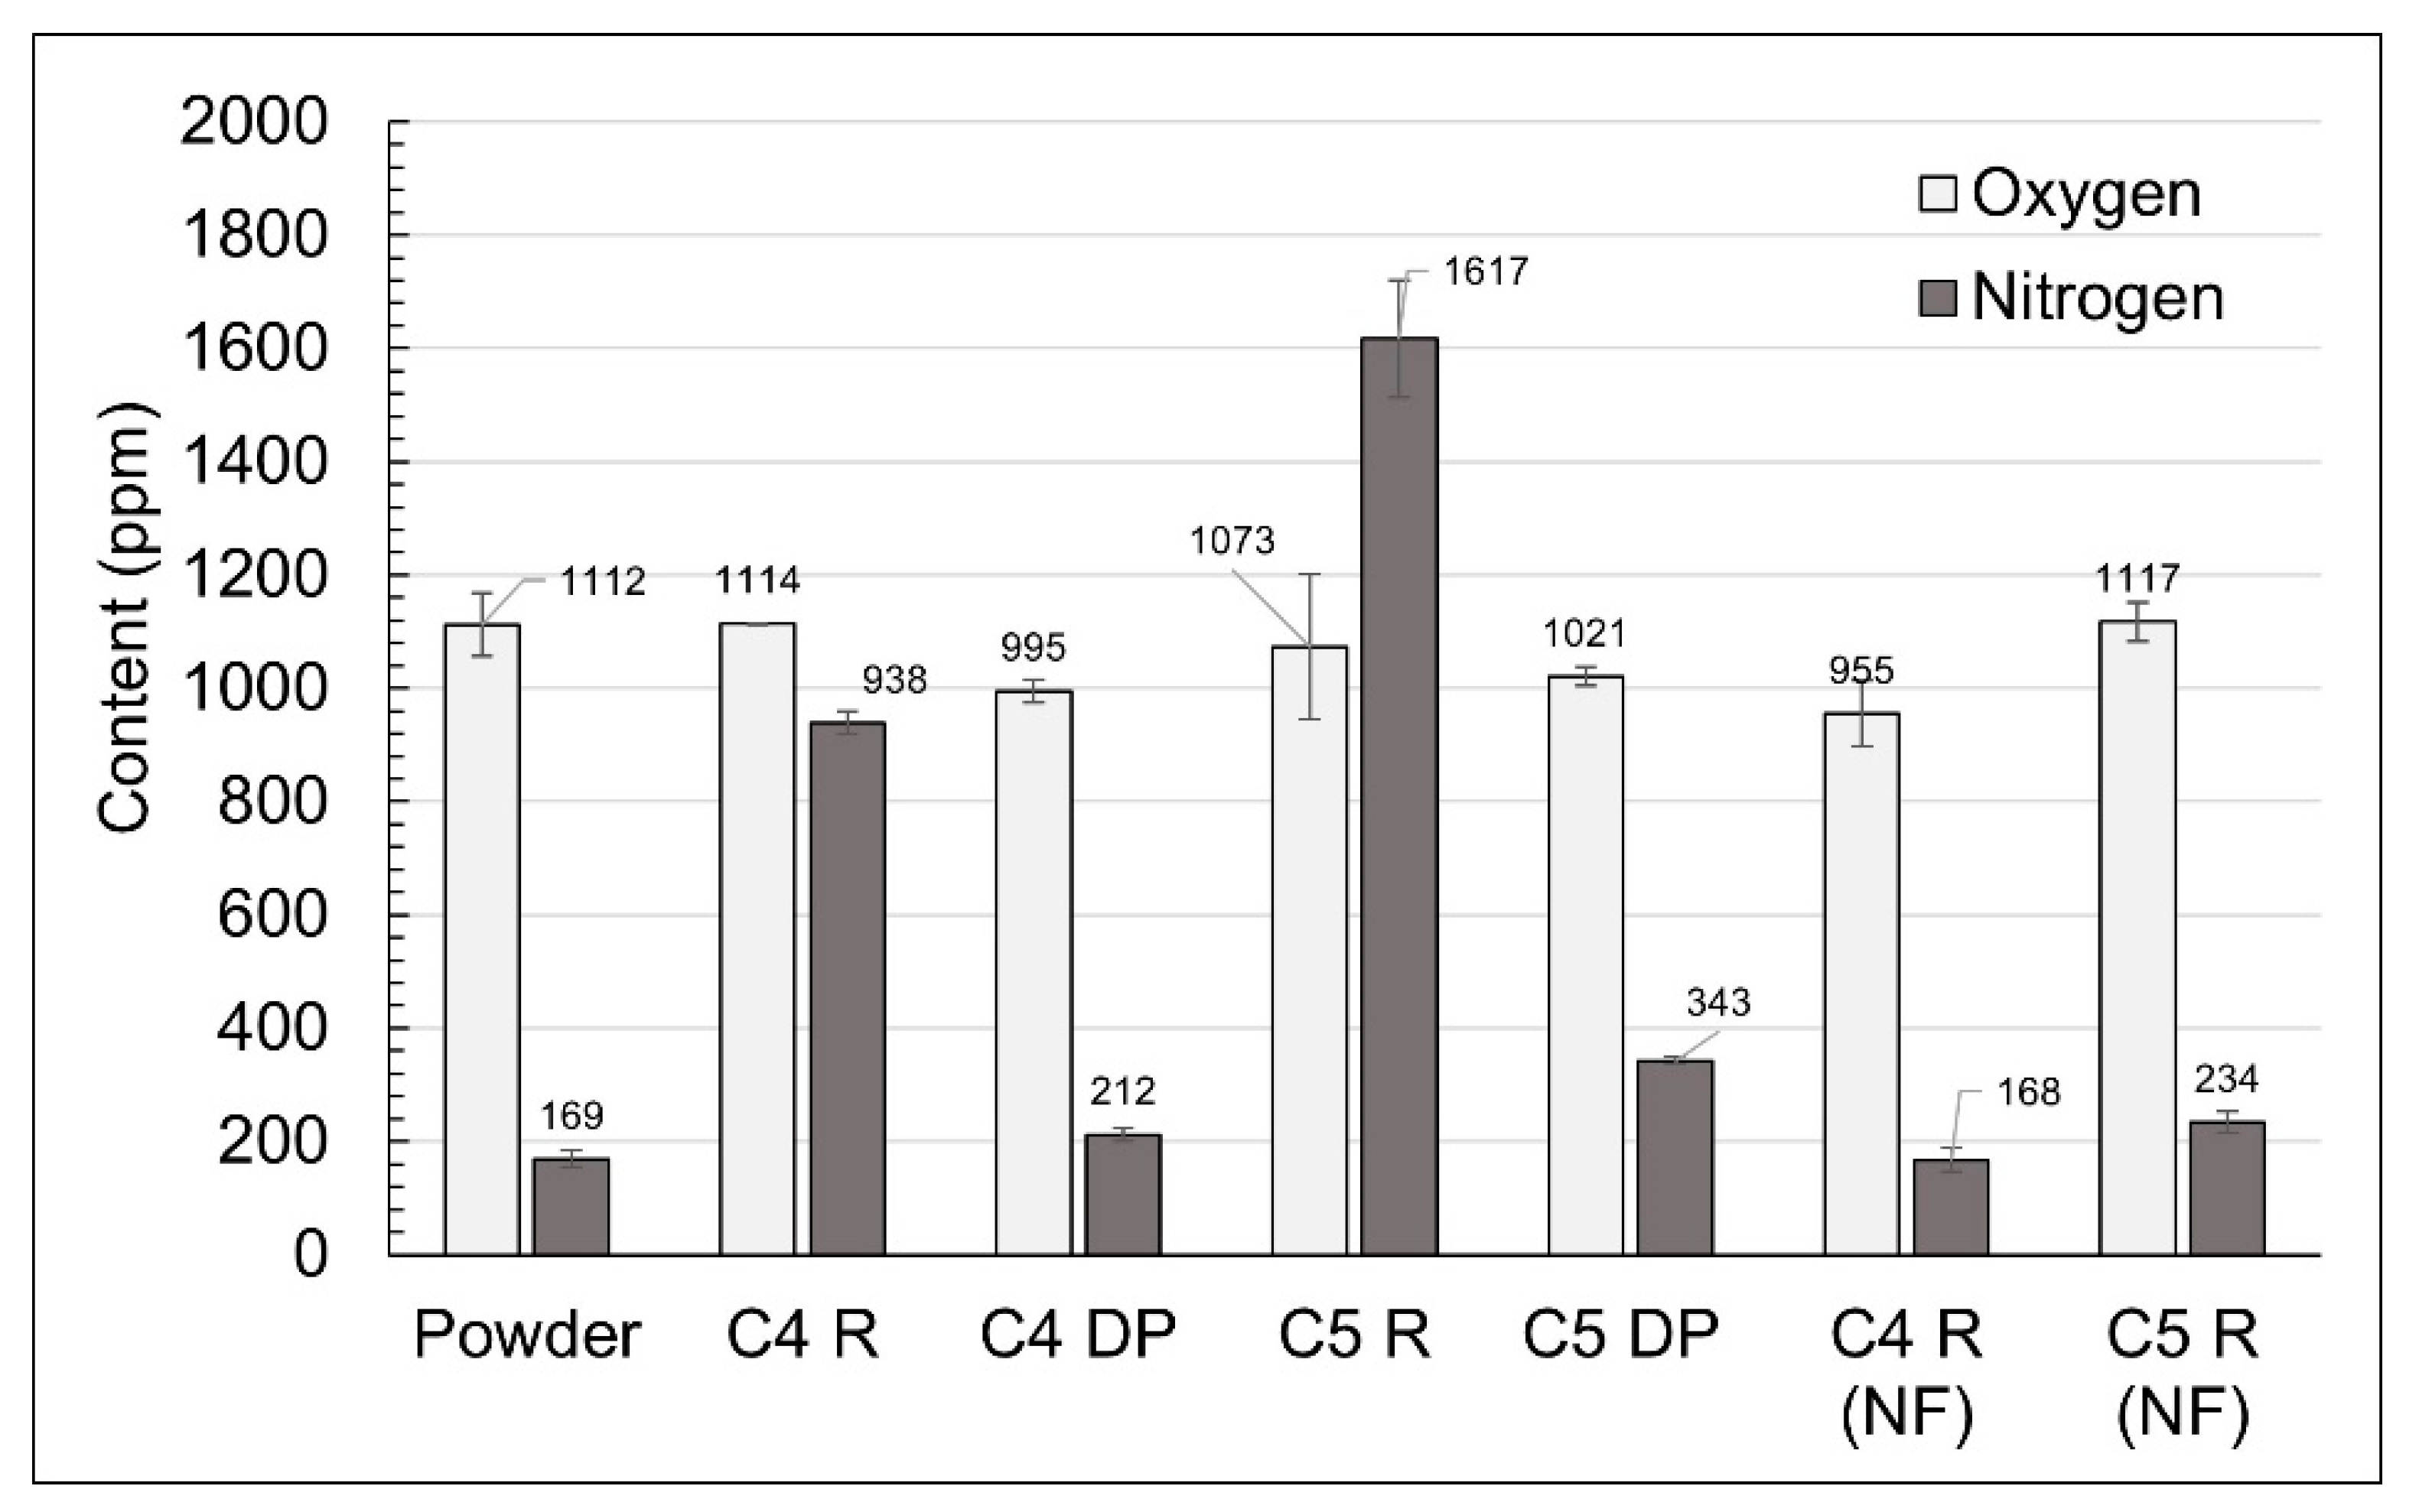
2 contamination, additional ON test pins were printed using deposition conditions 4 and 5 with both the recycled and direct purge Ar. Following these additional prints, the particulate filter in the Ar recirculation system was replaced and an additional set of ON test pins were printed using deposition conditions 4 and 5 with the Recycled Ar. The ON results for these test pins are compared in Figure 15.
The ON results from the Ti-55511 test pins demonstrated that the N2 pick-up observed in the tensile specimens (Figure 14) was repeatable and that the same trend was present in the ON test pins (Figure 15). The Ti-55511 pins printed using Recycled Ar showed an increased N2 content, while the specimens printed with Direct Ar showed no significant ON pick-up. When the particulate filter in the Ar recirculation system was replaced prior to printing, the test pins printed with the recycled Ar no longer exhibited significant ON pick-up. Evidently, the observed N2 pick-up was effectively mitigated by employing a new filter in the Ar recirculation system. The filter in the Ar recirculation system captures metal particulates formed during printing operations. It is postulated that the accumulated metal particulates in the filter off-gassed N2 into the recirculating Ar purge gas, causing the shield gas for the melt pool to contain elevated levels of N2, which then contaminated the Ti-55511 during printing.
The chemical compositions of the samples printed under DED conditions 4 and 5 are presented in Table 6. The compositions were nearly identical under both processing conditions and were within the acceptable compositional range. The composition of the printed material was also very similar to the as-received powder composition, exhibiting no major loss of alloying additions during the DED process or subsequent heat treatment.
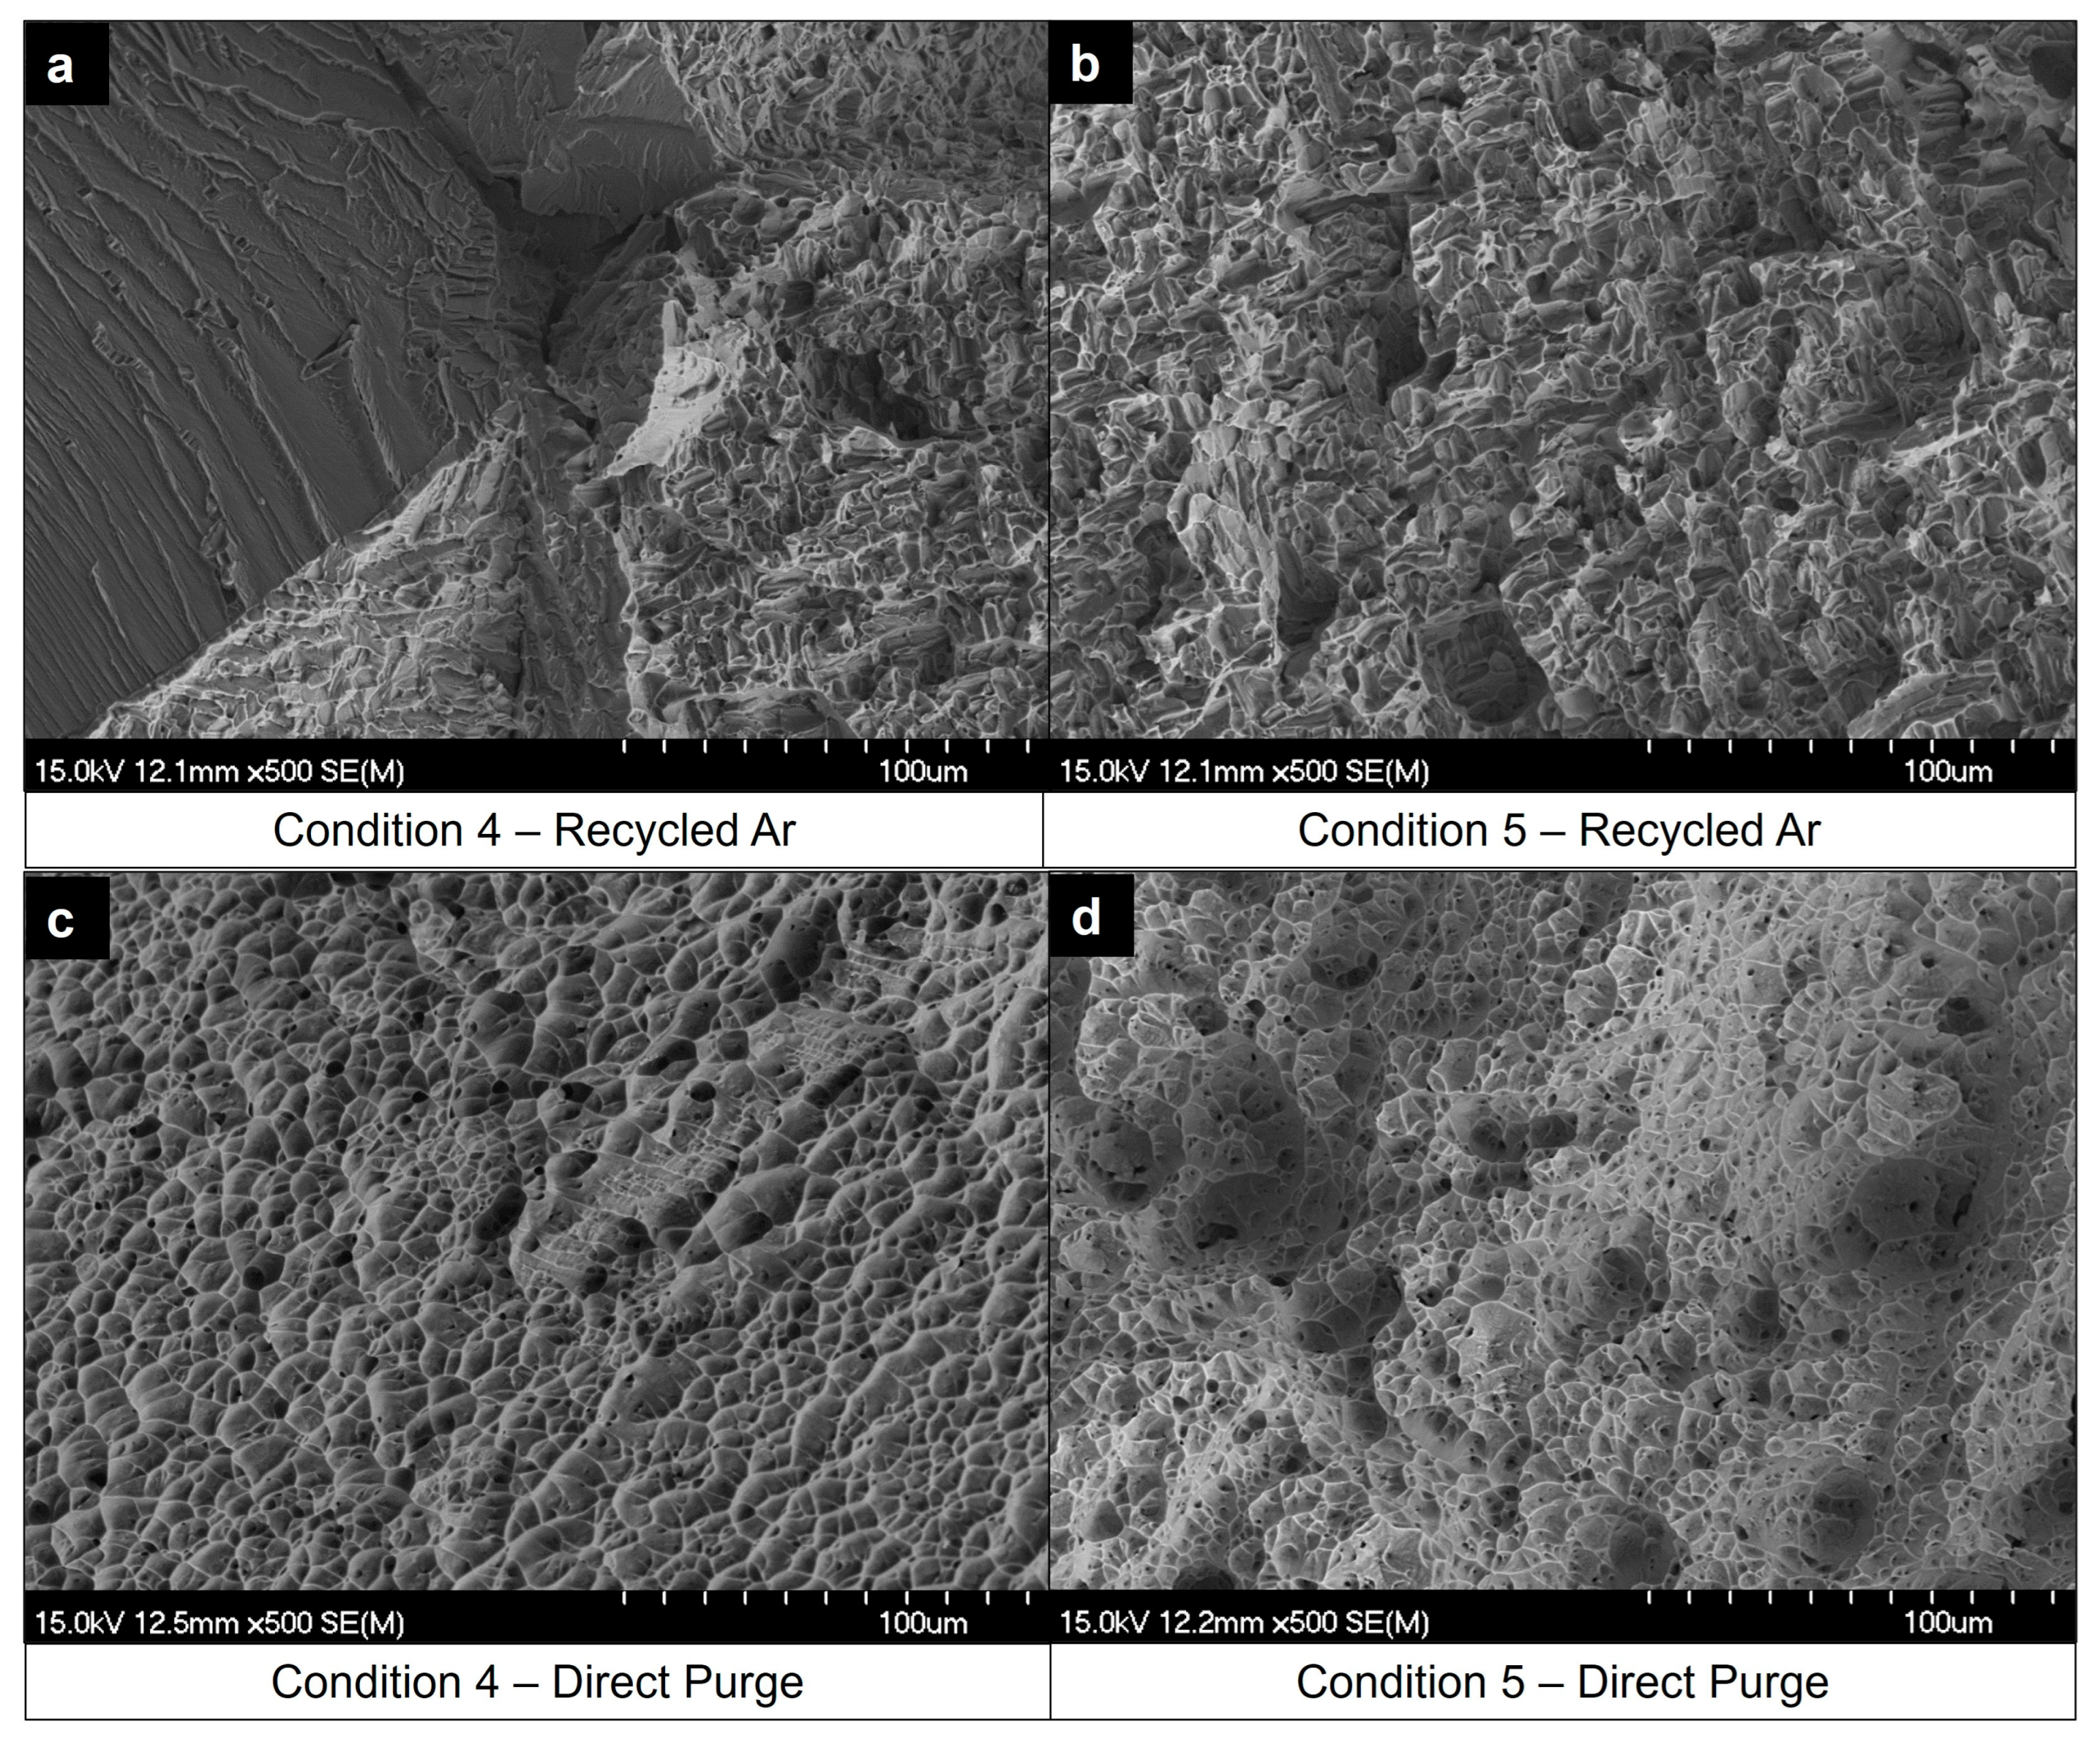
The fracture surfaces of the four different tensile specimens are presented in Figure 16. The specimens printed using the Recycled Ar process gas (Figure 16a,b) exhibited brittle, intergranular fractures, while the Direct Ar (Figure 16c,d) displayed a ductile, trans-granular fracture mode. The fracture surfaces for condition 4 and 5 were very similar under each processing gas set-up.
The tensile specimens in this work were stress relieved above the beta transus temperature (β heat treatment). The specimens that were processed under the Direct Ar process gas formed the beneficial αWGB phase in the grain boundaries (see Figure 12) and displayed high ductility (see Table 5 and Figure 13). Liu et al. concluded that DED Ti-55511 required an intermediate heat treatment following the initial stress-relieving/β heat treatment to coarsen the αWGB phase and avoid an intergranular mode of fracture, which would decrease the ductility [5]. By applying additional heat treatments, Liu et al. achieved 11% elongation in DED Ti-55511, which exceeded the requirements outlined in the literature [5]. In the present study, so long as the interstitial content was minimized, elongations between 10 and 12% were achieved after a single β heat treatment step above the β transus temperature. However, the UTS and YS were lower than those reported for DED Ti-55511 with additional heat treatment steps beyond the initial β heat treatment step. Additional aging steps at 750 °C and 600 °C promote the development of beneficially αP and αS, which increase the strength by resisting dislocation motion and limiting crack propagation. Therefore, the development of αP and αS through subsequent aging treatments increases the strength but is not detrimental to the ductility.

4. Conclusions

Multiple DED parameter sets were found to provide dense, defect-free Ti-55511 deposits. The two-phase DOE approach involving single-track deposits and subsequent cube deposits was shown to be a valuable tool for rapidly inferring the build parameters for DED. The density/quality of the Ti-55511 builds were found to be proportional to the build rate. Two parameter sets were identified that produced high-density Ti-55511. Condition 4 (ED = 173 J/mm3, LP = 509 W, TR = 11.2 mm/s, PF = 2.4 g/min, HS = 1.010 mm, ZS = 0.261 mm) used a high power, a lower energy density, and produced an equiaxed grain structure. Condition 5 (ED = 324 J/mm3, LP = 391 W, TR = 11.2 mm/s, PF = 1.0 g/min, HS = 0.796 mm, ZS = 0.135 mm) used a low power, a higher energy density, and produced a columnar grain structure. The tensile properties of the DED Ti-55511 produced using these two optimal parameter sets agree with the existing DED literature. Application of a single heat treatment (960 °C for 1 h under a high vacuum) above the beta transus temperature transformed the retained linear grain boundary alpha phase, αLGB, to a serrated Widmanstatten grain boundary morphology, αWGB, improving the ductility of the material to acceptable elongations. The specimens processed using recycled argon gas had elevated nitrogen contents (>2000 ppm), higher yield strength (1000–1100 MPa), but poor ductility (≤6%). Employing a new, clean gas filter in the argon recycling system effectively mitigated the N2 pick-up, maintaining N2 levels comparable to the as-received Ti-55511 powder. The specimens processed using a direct argon gas purge exhibited little nitrogen pick-up, slightly lower yield strength (950–960 MPa), and acceptable ductility (≥8%). The interstitial impurity contents were found to be effectively alleviated with a direct purge of high-purity Ar or by ensuring a new filter is employed when using recycled Ar. A case study on producing a more complex Ti-55511 DED part for evaluation in a specific industrial application would be beneficial to clearly demonstrate the advantages and challenges of DED as compared to traditionally manufactured components. In addition, increasing the capture efficiency of the DED process remains one of the primary goals of future work to help reduce costs and further the adoption of DED in industry.

Author Contributions

Conceptualization, A.J.R., G.A.W.S., M.H.-K. and P.B.; formal analysis, A.J.R., G.A.W.S. and O.C.; investigation, A.J.R., G.A.W.S. and O.C.; methodology, A.J.R., G.A.W.S., O.C. and P.B.; validation, A.J.R., G.A.W.S. and O.C.; writing—original draft, A.J.R.; writing—review and editing, A.J.R., O.C., M.H.-K. and P.B.; resources, M.H.-K. and P.B.; supervision, M.H.-K. and P.B.; project administration, M.H.-K. and P.B.; funding acquisition, M.H.-K. and P.B. All authors have read and agreed to the published version of the manuscript.

Funding

This research was funded by the Canadian Foundation for Innovation and Research Nova Scotia (grant #36245) as well as the Natural Sciences and Engineering Research Council of Canada via the Network for Holistic Innovation in Additive Manufacturing (grant #NETGP 494158-16).

Data Availability Statement

Data are available upon request from the corresponding authors.

Acknowledgments

The authors would like to graciously acknowledge the financial support provided by the Canadian Foundation for Innovation and Research Nova Scotia and the Natural Sciences and Engineering Research Council of Canada through the Network for Holistic Innovation in Additive Manufacturing. The authors would also like to thank GE for the useful technical discussions.

Conflicts of Interest

The authors declare administrative support, equipment, drugs or supplies, and writing assistance were provided by GE Additive. The authors declare financial support was provided by the Natural Sciences and Engineering Research Council of Canada. The authors declare financial support was provided by the Canadian Foundation for Innovation and Research Nova Scotia.

References

  1. Dass, A.; Moridi, A. State of the art in directed energy deposition: From additive manufacturing to materials design. Coatings 2019, 9, 418. [Google Scholar] [CrossRef]
  2. Gibson, I.; Rosen, D.; Stucker, B. Additive Manufacturing Technologies, 2nd ed.; Springer: New York, NY, USA, 2015. [Google Scholar] [CrossRef]
  3. Toyserkani, E.; Sarker, D.; Ibhadode, O.O.; Liravi, F.; Russo, P.; Taherkhani, K. Metal Additive Manufacturing; John Wiley and Sons: Hoboken, NJ, USA, 2022. [Google Scholar]
  4. Kim, M.J.; Saldana, C. Thin wall deposition of IN625 using directed energy deposition. J. Manuf. Process. 2020, 56, 1366–1373. [Google Scholar] [CrossRef]
  5. Liu, C.; Yu, L.; Zhang, A.; Tian, X.; Liu, D.; Ma, S. Beta heat treatment of laser melting deposited high strength near β titanium alloy. Mater. Sci. Eng. A 2016, 673, 185–192. [Google Scholar] [CrossRef]
  6. Liu, C.M.; Wang, H.M.; Tian, X.J.; Tang, H.B.; Liu, D. Microstructure and tensile properties of laser melting deposited Ti-5Al-5Mo-5V-1Cr-1Fe near β titanium alloy. Mater. Sci. Eng. A 2013, 586, 323–329. [Google Scholar] [CrossRef]
  7. Ahsan, M.N.; Pinkerton, A.J.; Moat, R.J.; Shackleton, J. A comparative study of laser direct metal deposition characteristics using gas and plasma-atomized Ti-6Al-4V powders. Mater. Sci. Eng. A 2011, 528, 7648–7657. [Google Scholar] [CrossRef]
  8. Qiu, C.; Ravi, G.A.; Dance, C.; Ranson, A.; Dilworth, S.; Attallah, M.M. Fabrication of large Ti-6Al-4V structures by direct laser deposition. J. Alloys Compd. 2015, 629, 351–361. [Google Scholar] [CrossRef]
  9. Yu, J.; Rombouts, M.; Maes, G.; Motmans, F. Material properties of Ti6Al4V parts produced by laser metal deposition. Phys. Procedia 2012, 39, 416–424. [Google Scholar] [CrossRef]
  10. Zhai, Y.; Lados, D.A.; Brown, E.J.; Vigilante, G.N. Fatigue crack growth behavior and microstructural mechanisms in Ti-6Al-4V manufactured by laser engineered net shaping. Int. J. Fatigue 2016, 93, 51–63. [Google Scholar] [CrossRef]
  11. Carroll, B.E.; Palmer, T.A.; Beese, A.M. Anisotropic tensile behavior of Ti-6Al-4V components fabricated with directed energy deposition additive manufacturing. Acta Mater. 2015, 87, 309–320. [Google Scholar] [CrossRef]
  12. Keist, J.S.; Palmer, T.A. Role of geometry on properties of additively manufactured Ti-6Al-4V structures fabricated using laser based directed energy deposition. Mater. Des. 2016, 106, 482–494. [Google Scholar] [CrossRef]
  13. ASM Metals Handbook Volume 2: Properties and Selection: Nonferrous Alloys and Special-Purpose Materials, 2nd ed.; ASM International: Materials Park, OH, USA, 1990.
  14. Bania, P.J. Beta titanium alloys and their role in the titanium industry. JOM 1994, 46, 16–19. [Google Scholar] [CrossRef]
  15. Maimaitiyili, T.; Mosur, K.; Kurzynowski, T.; Casati, N.; Van Swygenhoven, H. Phase studies of additively manufactured near beta titanium alloy-Ti55511. Materials 2020, 13, 1723. [Google Scholar] [CrossRef] [PubMed]
  16. Kurzynowski, T.; Madeja, M.; Dziedzic, R.; Kobiela, K. The effect of EBM process parameters on porosity and microstructure of Ti-5Al-5Mo-5V-1Cr-1Fe alloy. Scanning 2019, 2019, 2903920. [Google Scholar] [CrossRef] [PubMed]
  17. Li, D.; Huang, H.; Chen, C.; Liu, S.; Liu, X.; Zhang, X.; Zhou, K. Additive manufacturing of high strength near β titanium alloy Ti-55511 by engineering nanoscale secondary α laths via in-situ heat treatment. Mater. Sci. Eng. A 2021, 814, 141245. [Google Scholar] [CrossRef]
  18. Sweet, G.A.W.; Donaldson, I.W.; Schade, C.T.; Amegadzie, M.Y.; Bishop, D.P. Laser free-form fabrication of dual phase DP600 steel using water atomized feedstock powder. Addit. Manuf. 2021, 47, 102357. [Google Scholar] [CrossRef]
  19. Montgomery, D.C. Design and Analysis of Experiments, 8th ed.; John Wiley & Sons: Hoboken, NJ, USA, 2013. [Google Scholar]
  20. Wang, G.; Huang, L.; Liu, Z.; Qin, Z.; He, W.; Liu, F.; Chen, C.; Nie, Y. Process optimization and mechanical properties of oxide dispersion strengthened nickel-based superalloy by selective laser melting. Mater. Des. 2020, 188, 108418. [Google Scholar] [CrossRef]
  21. Vilanova, M.; Escribano-Garcia, R.; Guraya, T.; Sebastian, M.S. Optimizing Laser Powder Bed Fusion Parameters for IN-738LC by Response Surface Method. Materials 2020, 13, 4879. [Google Scholar] [CrossRef] [PubMed]
  22. Sweet, G.A.W.; Donaldson, I.W.; Schade, C.T.; Bishop, D.P. Laser-Based Directed Energy Deposition (L-DED) Processing of Water Atomized 42CrMo4 Powder. Lasers Manuf. Mater. Process. 2023, 10, 32–63. [Google Scholar] [CrossRef]
  23. Cao, X.; Wanjara, P.; Gholipour, J.; Wang, Y. Laser-Additive Repair of Cast Ni–Al–Bronze Components. In TMS 2019 148th Annual Meeting & Exhibition Supplemental Proceedings; The Minerals, Metals & Materials Series; Springer: Cham, Switzerland, 2019. [Google Scholar] [CrossRef]
  24. Pfaff, A.; Jacklein, M.; Schlager, M.; Harwick, W.; Hoschke, K.; Balle, F. An Empirical Approach for the Development of Process Parameters for Laser Powder Bed Fusion. Materials 2020, 13, 5400. [Google Scholar] [CrossRef]
  25. Fotovvati, B.; Balasubramanian, M.; Asadi, E. Modeling and Optimization Approaches of Laser-Based Powder-Bed Fusion Process for Ti-6Al-4V Alloy. Coatings 2020, 10, 1104. [Google Scholar] [CrossRef]
  26. Gosse, N. Directed Energy Deposition Processing of Alpha-Beta, Near-Alpha, and Beta Titanium Alloys. Master’s Thesis, Dalhousie University, Halifax, UK, 2022. [Google Scholar]
  27. Callister, W.D., Jr.; Rethwisch, D.G. Materials Science and Engineering—An Introduction, 10th ed.; John Wiley and Sons: Hoboken, NJ, USA, 2018. [Google Scholar]
  28. Wolff, S.; Lee, T.; Faierson, E.; Ehmann, K.; Cao, J. Anisotropic properties of directed energy deposition (DED)-processed Ti–6Al–4V. J. Manuf. Process. 2016, 24, 397–405. [Google Scholar] [CrossRef]
  29. Zhang, Q.; Chen, J.; Tan, H.; Lin, X.; Huang, W. Microstructure evolution and mechanical properties of laser additive manufactured Ti–5Al–2Sn–2Zr–4Mo–4Cr alloy. Trans. Nonferrous Met. Soc. China 2016, 26, 2058–2066. [Google Scholar] [CrossRef]
  30. Zhu, Y.; Tian, X.; Li, J.; Wang, H. The anisotropy of laser melting deposition additive manufacturing Ti-6.5Al-3.5Mo-1.5Zr-0.3Si titanium alloy. Mater. Des. 2015, 67, 538–542. [Google Scholar] [CrossRef]
  31. Zhou, X.; Xu, D.; Geng, S.; Fan, Y.; Liu, M.; Wang, Q.; Wang, F. Mechanical properties, corrosion behavior and cytotoxicity of Ti-6Al-4V alloy fabricated by laser metal deposition. Mater. Charact. 2021, 179, 111302. [Google Scholar] [CrossRef]
  32. Zhang, Q.; Chen, J.; Zhao, Z.; Tan, H.; Lin, X.; Huang, W. Microstructure and anisotropic tensile behavior of laser additive manufactured TC21 titanium alloy. Mater. Sci. Eng. A 2016, 673, 204–212. [Google Scholar] [CrossRef]
  33. Cotton, J.D.; Briggs, R.D.; Boyer, R.R.; Tamirisakandala, S.; Russo, P.; Shchetnikov, N.; Fanning, J.C. State of the art in beta titanium alloys for airframe applications. JOM 2015, 67, 1281–1303. [Google Scholar] [CrossRef]
  34. Gerd Lütjering, J.C. Williams, Titanium, 2nd ed.; Springer: Berlin/Heidelberg, Germany, 2007. [Google Scholar] [CrossRef]
  35. Deng, H.; Chen, L.; Qiu, W.; Zheng, Z.; Tang, Y.; Hu, Z.; Wei, Y.; Xia, Z.; Le, G.; Tang, J.; et al. Microstructure and mechanical properties of as-deposited and heat treated Ti–5Al–5Mo–5V–3Cr–1Zr (Ti-55531) alloy fabricated by laser melting deposition. J. Alloy Compd. 2019, 810, 151792. [Google Scholar] [CrossRef]
  36. GOST 19807; Wrought Titanium and Titanium Alloys. Grades. GOST: London, UK, 1991.
  37. MPIF Standard 42; Method for Determination of Density of Compacted or Sintered Powder Metallurgy (PM) Products. MPIF: Princeton, NJ, USA, 2008.
  38. MPIF Standard 10; Method for Determination of Tensile Properties of Powder Metallurgy (PM) Materials. MPIF: Princeton, NJ, USA, 2016.
  39. Gu, D.; Shen, Y. Effects of processing parameters on consolidation and microstructure of W–Cu components by DMLS. J. Alloys Compd. 2009, 473, 107–115. [Google Scholar] [CrossRef]
  40. Lia, F.; Park, J.; Tressler, J.; Martukanitz, R. Partitioning of laser energy during directed energy deposition. Addit. Manuf. 2017, 18, 31–39. [Google Scholar] [CrossRef]
  41. Ogden, H.R.; Jaffee, R.I. The Effects of Carbon, Oxygen and Nitrogen on the Mechanical Properties of Titanium and Titanium Alloys; Battelle Memorial Inst. Titanium Metallurgical Lab: Columbus, OH, USA, 1955. [Google Scholar] [CrossRef]
  42. Rousseau, J.N.; Bois-brochu, A.; Blais, C. Effect of oxygen content in new and reused powder on microstructural and mechanical properties of Ti6Al4V parts produced by directed energy deposition. Addit. Manuf. 2018, 23, 197–205. [Google Scholar] [CrossRef]
Figure 1. (a) Particle size distribution of the plasma-atomized Ti-55511 powder utilized and (b) SEM micrograph of the powder.
Jmmp 08 00072 g001
Figure 2. DED single track of Ti-55511 (track 20: 450 W;1.7 g/min;13 mm/s): (a) as-deposited top view and (b) polished cross-section.
Jmmp 08 00072 g002
Figure 3. Contour plots of the capture efficiency (left column) and effective deposition rate (right column) for the machine parameters used to deposit single tracks of Ti-55511. The parameters for tracks 4, 5, and 9 are highlighted.
Jmmp 08 00072 g003
Figure 4. Examples of the DED cube specimens of Ti-55511 deposited as part of the second CCD. The cubes are approximately 10 mm × 10 mm in the X–Y plane and exhibit different build heights.
Jmmp 08 00072 g004
Figure 5. Density of the DED Ti-55511 cube specimens versus the energy density. The point sizes are proportional to the build height, where smaller points represent under-building and larger points represent over-building relative to the programmed height.
Jmmp 08 00072 g005
Figure 6. Polished cross-section of condition 5 (391 W, 11.2 mm/s, 1.0 g/min) printed with an X–Y overlap of 35% and Z overlap of 10%.
Jmmp 08 00072 g006
Figure 7. Density sensitivity with X–Y and Z overlaps with respect to the effective build rate using condition 4, 5, and 9.
Jmmp 08 00072 g007
Figure 8. Effects of the hatch spacing and layer thickness on the Ti-55511 specimen density for conditions 4, 5, and 9.
Jmmp 08 00072 g008
Figure 9. Interaction effect between the hatch spacing and layer thickness (left), as well as laser power and hatch spacing (right), on the Ti-55511 specimen density for conditions 4, 5, and 9.
Jmmp 08 00072 g009
Figure 10. Microstructures of the DED Ti-55511 cubes for print conditions 4 and 5 in the (a,b) as-printed condition and (c,d) heat-treated condition (960 °C for 1 h under a high vacuum), respectively.
Jmmp 08 00072 g010
Figure 11. High-magnification images of print conditions 4 and 5 in the (a,b) as-printed and (c,d) heat-treated conditions, respectively.
Jmmp 08 00072 g011
Figure 12. SEM micrographs of the heat-treated DED Ti-55511 cubes for print conditions 4 (a,b) and 5 (c,d).
Jmmp 08 00072 g012
Figure 13. Stress–strain curves of the Ti-55511 tensile specimens fabricated using conditions 4 and 5 under both the recycled argon atmosphere and the direct purge atmosphere. All the specimens were stress-relieved at 960 °C for 1 h under a high vacuum.
Jmmp 08 00072 g013
Figure 14. Oxygen and nitrogen contents of the as-received powder compared to the tensile specimens printed under recycled argon (R) and direct purge argon (DP) for conditions 4 (C4) and 5 (C5).
Jmmp 08 00072 g014
Figure 15. Oxygen and nitrogen contents of the as-received powder compared to the Ti-55511 pins printed under recycled argon (R) and direct purge argon (DP) for conditions 4 (C4) and 5 (C5). Specimens printed using a new argon recirculation system filter are denoted by “NF”.
Jmmp 08 00072 g015
Figure 16. Fracture surfaces of the DED Ti-55511 deposited under conditions 4 and 5 with Recycled Ar (a,b) and Direct Ar (c,d) process gasses, respectively.
Jmmp 08 00072 g016
Table 1. Composition of the gas-atomized Ti-55511 powder compared to the wrought alloy composition from GOST 19807:1991 [36].
Composition (wt%)
MaterialAlCrFeMoTiV
GOST 19807:19914.4–5.70.5–1.50.5–1.54.0–5.5Bal.4.0–5.5
Measured5.381.051.074.9582.405.14
Table 2. Machine parameters and levels used in the CCD for single-track depositions.
ParameterLevels
12345
Laser Power (W)350391450509550
Traverse Rate (mm/s)10.011.213.014.816.0
Powder Feed (g/min)0.51.01.72.42.9
Table 3. Machine parameters and levels used in the second CCD for cube specimen deposition.
ParameterLevels
12345
X–Y Overlap (%)010356070
Z Overlap (%)−32.5−20104052.5
Table 4. Single-track CCD results and overall ranking based on the capture efficiency, effective deposition rate, and presence of defects. Notable track parameter sets appear in bold text.
TrackLaser
Power (W)
Traverse
Rate (mm/s)
Powder
Feed (g/min)
Capture Efficiency
(%) (Rank)
Effective Deposition Rate
(g/min) (Rank)
SumOverall
Rank
145013.01.721%160.36143017
239111.22.422%150.5462110
339114.81.030%100.30192916
450911.22.437%40.90151
539111.21.034%80.33172512
650914.82.420%170.49102715
745013.01.729%110.508199
845013.02.929%120.852146
945013.01.734%60.594103
1045013.01.734%70.595124
1139114.82.414%200.35153519
1245013.01.729%130.4992211
1345013.00.536%50.17202512
1455013.01.738%20.65351
1550914.81.043%10.4212135
1645016.01.719%190.32183720
1750911.21.037%30.3613167
1845010.01.727%140.46112512
1935013.01.720%180.34163418
2045013.01.731%90.537167
Table 5. Tensile properties of the stress-relieved specimens printed under conditions 4 (509 W) and 5 (391 W) using different shield gas sources as compared to properties in the literature [5,6].
ConditionPurge Gas TypeE (GPa)Yield (MPa)UTS (MPa)EL (%)
4Recycled Ar92109211672.7 ± 0.9
4Direct Ar8896010629.7 ± 1.8
5Recycled Ar84102211386.2 ± 1.0
5Direct Ar86952105612.2 ± 0.0
[5,6]N/A-≥10101080–1280≥8
Table 6. Composition of the tensile specimens printed under DED conditions 4 and 5 compared to the wrought alloy composition from GOST 19807:1991 [36].
Composition (wt%)
MaterialAlCrFeMoTiV
GOST 19807:19914.4–5.70.5–1.50.5–1.54.0–5.5Bal.4.0–5.5
Condition 45.111.061.114.5583.364.82
Condition 55.151.061.124.5783.284.81
Disclaimer/Publisher’s Note: The statements, opinions and data contained in all publications are solely those of the individual author(s) and contributor(s) and not of MDPI and/or the editor(s). MDPI and/or the editor(s) disclaim responsibility for any injury to people or property resulting from any ideas, methods, instructions or products referred to in the content.

