Article

Optimization of the FDM Processing Parameters on the Compressive Properties of ABS Objects for the Production of High-Heeled Shoes

1
Faculty of Textile Technology, University of Zagreb, Prilaz baruna Filipovića 28, 10000 Zagreb, Croatia
2
Faculty of Mechanical Engineering and Naval Architecture, University of Zagreb, Ivana Lucica 5, 10000 Zagreb, Croatia
*
Author to whom correspondence should be addressed.
J. Manuf. Mater. Process. 2024, 8(3), 106; https://doi.org/10.3390/jmmp8030106
Submission received: 23 April 2024 / Revised: 15 May 2024 / Accepted: 18 May 2024 / Published: 22 May 2024

Abstract

:
The influence of 3D printing parameters on compressive properties is an important factor in the application of additive manufacturing processes for products subjected to compressive loads in use. In this study, the compressive strength and compressive modulus of acrylonitrile/butadiene/styrene (ABS) test specimens fabricated using the fused deposition modeling (FDM) process were investigated with the aim of producing products of high-heeled shoes for women. The experimental part of the study includes a central composite experimental design to optimize the main 3D printing parameters (layer thickness, infill density, and extrusion temperature) and the infill geometry (honeycomb and linear at a 45° angle—L45) to achieve maximum printing properties of the 3D-printed products. The results show that the infill density has the greatest influence on the printing properties, followed by the layer thickness and, finally, the extrusion temperature as the least influential factor. The linear infill at a 45° angle resulted in higher compressive strength and lower compressive modulus values compared to the honeycomb infill. By optimizing the results, the maximum compressive strength (that of L45 is 41 N/mm2 and that of honeycomb 35 N/mm2) and modulus (that of L45 is 918 N/mm2 and that of honeycomb is 868 N/mm2) for both types of infill is obtained at a layer thickness of 0.1 mm and infill density of 40%, while the temperature for L45 can be in the range of 209 °C to 254 °C, but for the honeycomb infill, the processing temperature is 255 °C. Additionally, the study highlights the potential for sustainable manufacturing practices and the integration of advanced 3D printing technologies to enhance the efficiency and eco-friendliness of the production process.

1. Introduction

One of the additive manufacturing (AM) techniques that enables the production of complicated geometry in a short time or low-volume production without additional tooling is material extrusion with filaments (MEX) [1,2].
Products made with the FDM process must withstand mechanical stresses and environmental conditions encountered during use and production. Therefore, much attention is currently focused on understanding the desired and/or necessary mechanical properties of 3D-printed products [3]. The broader scientific community is conducting numerous studies and extensive research on the impact of mechanical properties on new product development or in terms of intended end use [4]. The predicted growth of the global additive manufacturing (AM) market has an impact not only on the economic aspect but also on the increasing research into the sustainability aspect of the production process and the environmental and social impact of AM [5]. Its effectiveness is demonstrated by its ability to reduce or avoid excess material and unnecessary waste, which has a positive impact on the environment. AM also enables the use of generative design, which is key in optimizing resources and reducing the need for traditional manufacturing methods. In addition, 3D printing enables lower material consumption, ease of production, less human intervention, very low post-processing, energy efficiency, and the manufacture of products on demand, which reduces production volumes and, thus, the need for transportation or storage, which, in turn, reduces the negative environmental impact [6,7].
Although FDM has made extraordinary and significant progress in the development of devices, materials, and applications in the last decade, the determination of mechanical properties and the influence of printing parameters on products depending on the application are still in the research and testing phase [8]. The FDM 3D printing process allows a wide range of parameters to be set, which makes it difficult to compare the test results, as the authors observed the influence of various adjustable 3D printing parameters on the different properties of the printed test specimens in their study.
In the scientific papers [9,10,11,12], the authors singled out the printing parameters of desktop 3D printers, which are considered to be the most influential in achieving suitable mechanical properties of 3D-printed products. These are the layer thickness, infill density, infill geometry, number of outer contours, extrusion temperature, raster angle, print orientation, and more.
Based on the literature reviewed [13,14,15,16], it was found that the scientific studies conducted in the last two decades have provided a large amount of data on the mechanical properties of FDM-printed products, with significant differences in the reported data, especially regarding the influence of certain parameters such as the extrusion temperature and layer thickness [4]. There are many recent studies on the influences of individual parameters on the flexural and/or tensile strength of 3D-printed products, including the extrusion temperature [4,13,17], layer thickness [18,19,20,21], product orientation [4,14], and infill density [4,8,18,22,23], with the results often not overlapping or even directly contradicting each other [13]. A review of the available literature shows that there are still few studies on the influence of 3D printing parameters on compressive strength, which is of great importance, since the variety of applicable products produced with the FDM process lead precisely to compressive loading [4], which is the aim of the research in this paper.
Wu et al. [24] investigated the influence of the layer thickness and raster angle on the mechanical properties of FDM-printed ABS and PEEK parts and determined the compressive strength of ABS test specimens, after which the material only deforms without an increase in stress. Oudah et al. [25] investigated the influence of the infill pattern, infill density, and layer thickness of ABS on the compressive properties, and Dominguez-Rodriguez et al. [26] studied the printing orientation, infill density, and infill pattern and determined a positive influence of increasing the infill density on the compressive properties. Uddin et al. [27] investigated the influence of the layer thickness, printing plane, and printing orientation of ABS, and Sood et al. [28] considered the layer thickness, orientation, raster angle, raster width, and air gap and found that increasing the print layer thickness has a negative influence on the compressive properties. Vidakis et al. [29] compared the influence of the print layer thickness on the compressive strength values of ABS and ABS-plus parts and found that ABS parts produced with a greater layer thickness had a lower compressive strength. Ali et al. [30] investigated the influence of three criteria (infill density, layer thickness, and infill pattern) on the tensile and compressive behavior of ABS and determined the positive influence of an increase in infill density and the negative influence of an increase in layer thickness on the observed properties. Morocho et al. [31] investigated the behavior of ABS polymer under compression, considering two different infill patterns—rectangular and hexagonal. Their study showed that the rectangular sample achieved higher compressive strength values. Petousis et al. [32] investigated the effects of seven ABS 3D printing parameters (orientation angle, raster deposition angle, infill density, layer thickness, extrusion temperature, printing speed, and platform temperature) on compressive properties and energy consumption. The results of their study show that for compressive strength, the most important parameters are the infill density and orientation angle, while the printing speed and extrusion temperature have the least impact [32]. Banjanin et al. [33] carried out tensile and compression tests on 3D-printed PLA and ABS specimens. Equbal et al. [34] investigated the effects of FDM process parameters of ABS materials—the raster angle, air gap, and raster width—on three responses: the compressive stress, percentage deformation, and breaking stress of parts made of ABS.
The FDM process has a wide range of applications, primarily due to the large number of materials available for production, from polysulfones to standard materials such as acrylonitrile/butadiene/styrene (ABS), polycarbonates (PCs), ABS/PC blends, polylactide (PLA), poly(methyl methacrylate) (PMMA), polyamide (PA), polyetherimide (PEI), and so on [8,35]. Although there are many different materials for the FDM process, acrylonitrile/butadiene/styrene (ABS) is one of the most used materials for the production of products for various applications due to its dimensional stability and low glass transition temperature [36,37,38]. ABS is a thermoplastic amorphous polymer prepared by the polymerization of styrene, acrylonitrile, and polybutadiene. Each of these monomers contributes to the properties of ABS: acrylonitrile provides chemical and thermal stability, butadiene increases toughness and impact strength, and styrene gives the plastic a beautiful and glossy appearance [39].
In recent years, 3D printing technologies have become very important in the fashion world due to the wide range of design possibilities, lower prices, and faster results, and they are used in various applications, including shoe production [40,41,42,43].
The application of additive processes focused on the development of new shoe models enables the production of three-dimensional prototypes, personalized products, and smaller series of manufactured models [44]. AM processes can be used to produce functional footwear parts with very complex geometries, good dimensional tolerances, and smooth surfaces of the manufactured parts. A significant advantage of these processes is the ability to produce models in color or to color them subsequently if needed [45]. The applicability of 3D printing technology in the production of shoe models and prototypes includes tests that allow a detailed analysis of the aesthetic aspect and the association of design elements with anthropometric features and foot geometry, as well as the targeted mechanical properties in the early stages of development [46,47,48,49].
The application of AM to footwear can be divided into three categories: 3D printing of individual shoe parts, such as soles, heels, and decorative or functional details [45,48,50,51,52]; 3D printing of shoes with simple or complex geometries [49,53,54]; 3D printing of built-in parts, such as insoles [55,56].
In a report published in April 2019, market research firm SmarTech found that the footwear industry is leading the way in 3D-printed consumer products, with two main trends, manufacturing and customization, being the main development drivers [57]. In addition, SmarTech notes that 3D-printed footwear is the only segment today where mass production through AM processes has proven to be a viable and cost-effective solution and predicts that this trend will continue to grow as material costs decrease and AM speed and productivity increase [57].
This work investigated the influences of key parameters of 3D printing in accordance with the previous research described above—layer thickness, infill density, extrusion temperature, and infill geometry—on the printing properties of ABS products with the aim of applying them to the final product, the prototype of the heel of women’s shoes. An analysis of the influence of three adjustable processing parameters of 3D printing and two geometric parameters (linear infill (L45) and honeycomb infill) on the mechanical properties, compressive strength, and compressive modulus was carried out using the central composite design. This work is part of research carried out as part of the author’s PhD thesis [58]. Although there are several examples of 3D printing applications in the footwear sector using AM processes with different materials, the application of ABS in this sector is relatively under-researched. Realized prototypes of ABS heels were assembled into a functional prototype of a women’s shoe using classic industrial production methods. This gives a scientific contribution to the application of advanced technologies in the development and production of small series of 3D prototypes of shoe parts or personalized shoe models in the context of industrial shoe production. Also, other research is mostly oriented toward examining the influences of different processing parameters on tensile and flexural properties. There is little research that connects processing parameters with compressive properties with a design experiment, especially since the emphasis is on specific production, such as that in the footwear industry.

2. Materials and Methods

2.1. Fabrication Process

The polymer used for 3D printing is a filament made of acrylonitrile/butadiene/styrene (ABS) from MakerBot Industries, New York, NY, USA. The filament has the shape of a wire with a diameter of 1.75 mm, is unpigmented, and is declared to have a natural color. There are no defined standards for FDM printing technology, and most authors use the ASTM D695-15 standard or its equivalent ISO 604 to test compressive properties [4,33]. The compressive properties were determined according to the Plastics—Determination of Compressive Properties (ISO 604:2002; EN ISO 604:2003) standard [59]. The standard defines equations for calculating the compressive strength and modulus and recommends dimensions of the test specimen in the form of a square prism.
The specimens were made from ABS using the FDM process on a MakerBot Replicator 2X desktop printer (MakerBot Industries, USA). Since one of the parameters observed is the density of the infill and the influence of the lattice structure, the dimensions of the test specimens were increased to the proportion of infill. The dimensions of the test specimens increased from the recommended 10 × 10 × 4 mm to 10 × 15 × 10 mm for testing the compressive strength and from 50 × 10 × 4 mm to 50 × 15 × 10 mm for the compressive modulus in order to make the lattice structure more visible. The constant production parameters were the following: material: ABS (acrylonitrile/butadiene/styrene), number of shells (outer contour): 3, platform temperature: 110 °C, infill speed: 90 mm/s, speed of shells: 40 mm/s, and geometrical parameters: honeycomb infill (H) and linear at an angle of +45°/−45° (L45).
According to the research objective and the application to the end product, prototypes of 3D-printed parts of the shoe sole and the load forces acting when wearing and using high-heeled shoes (Figure 1a), and, with regard to the method for testing the printing properties, the orientations of the layers of the 3D-printed test specimens were determined (Figure 1b) [60].
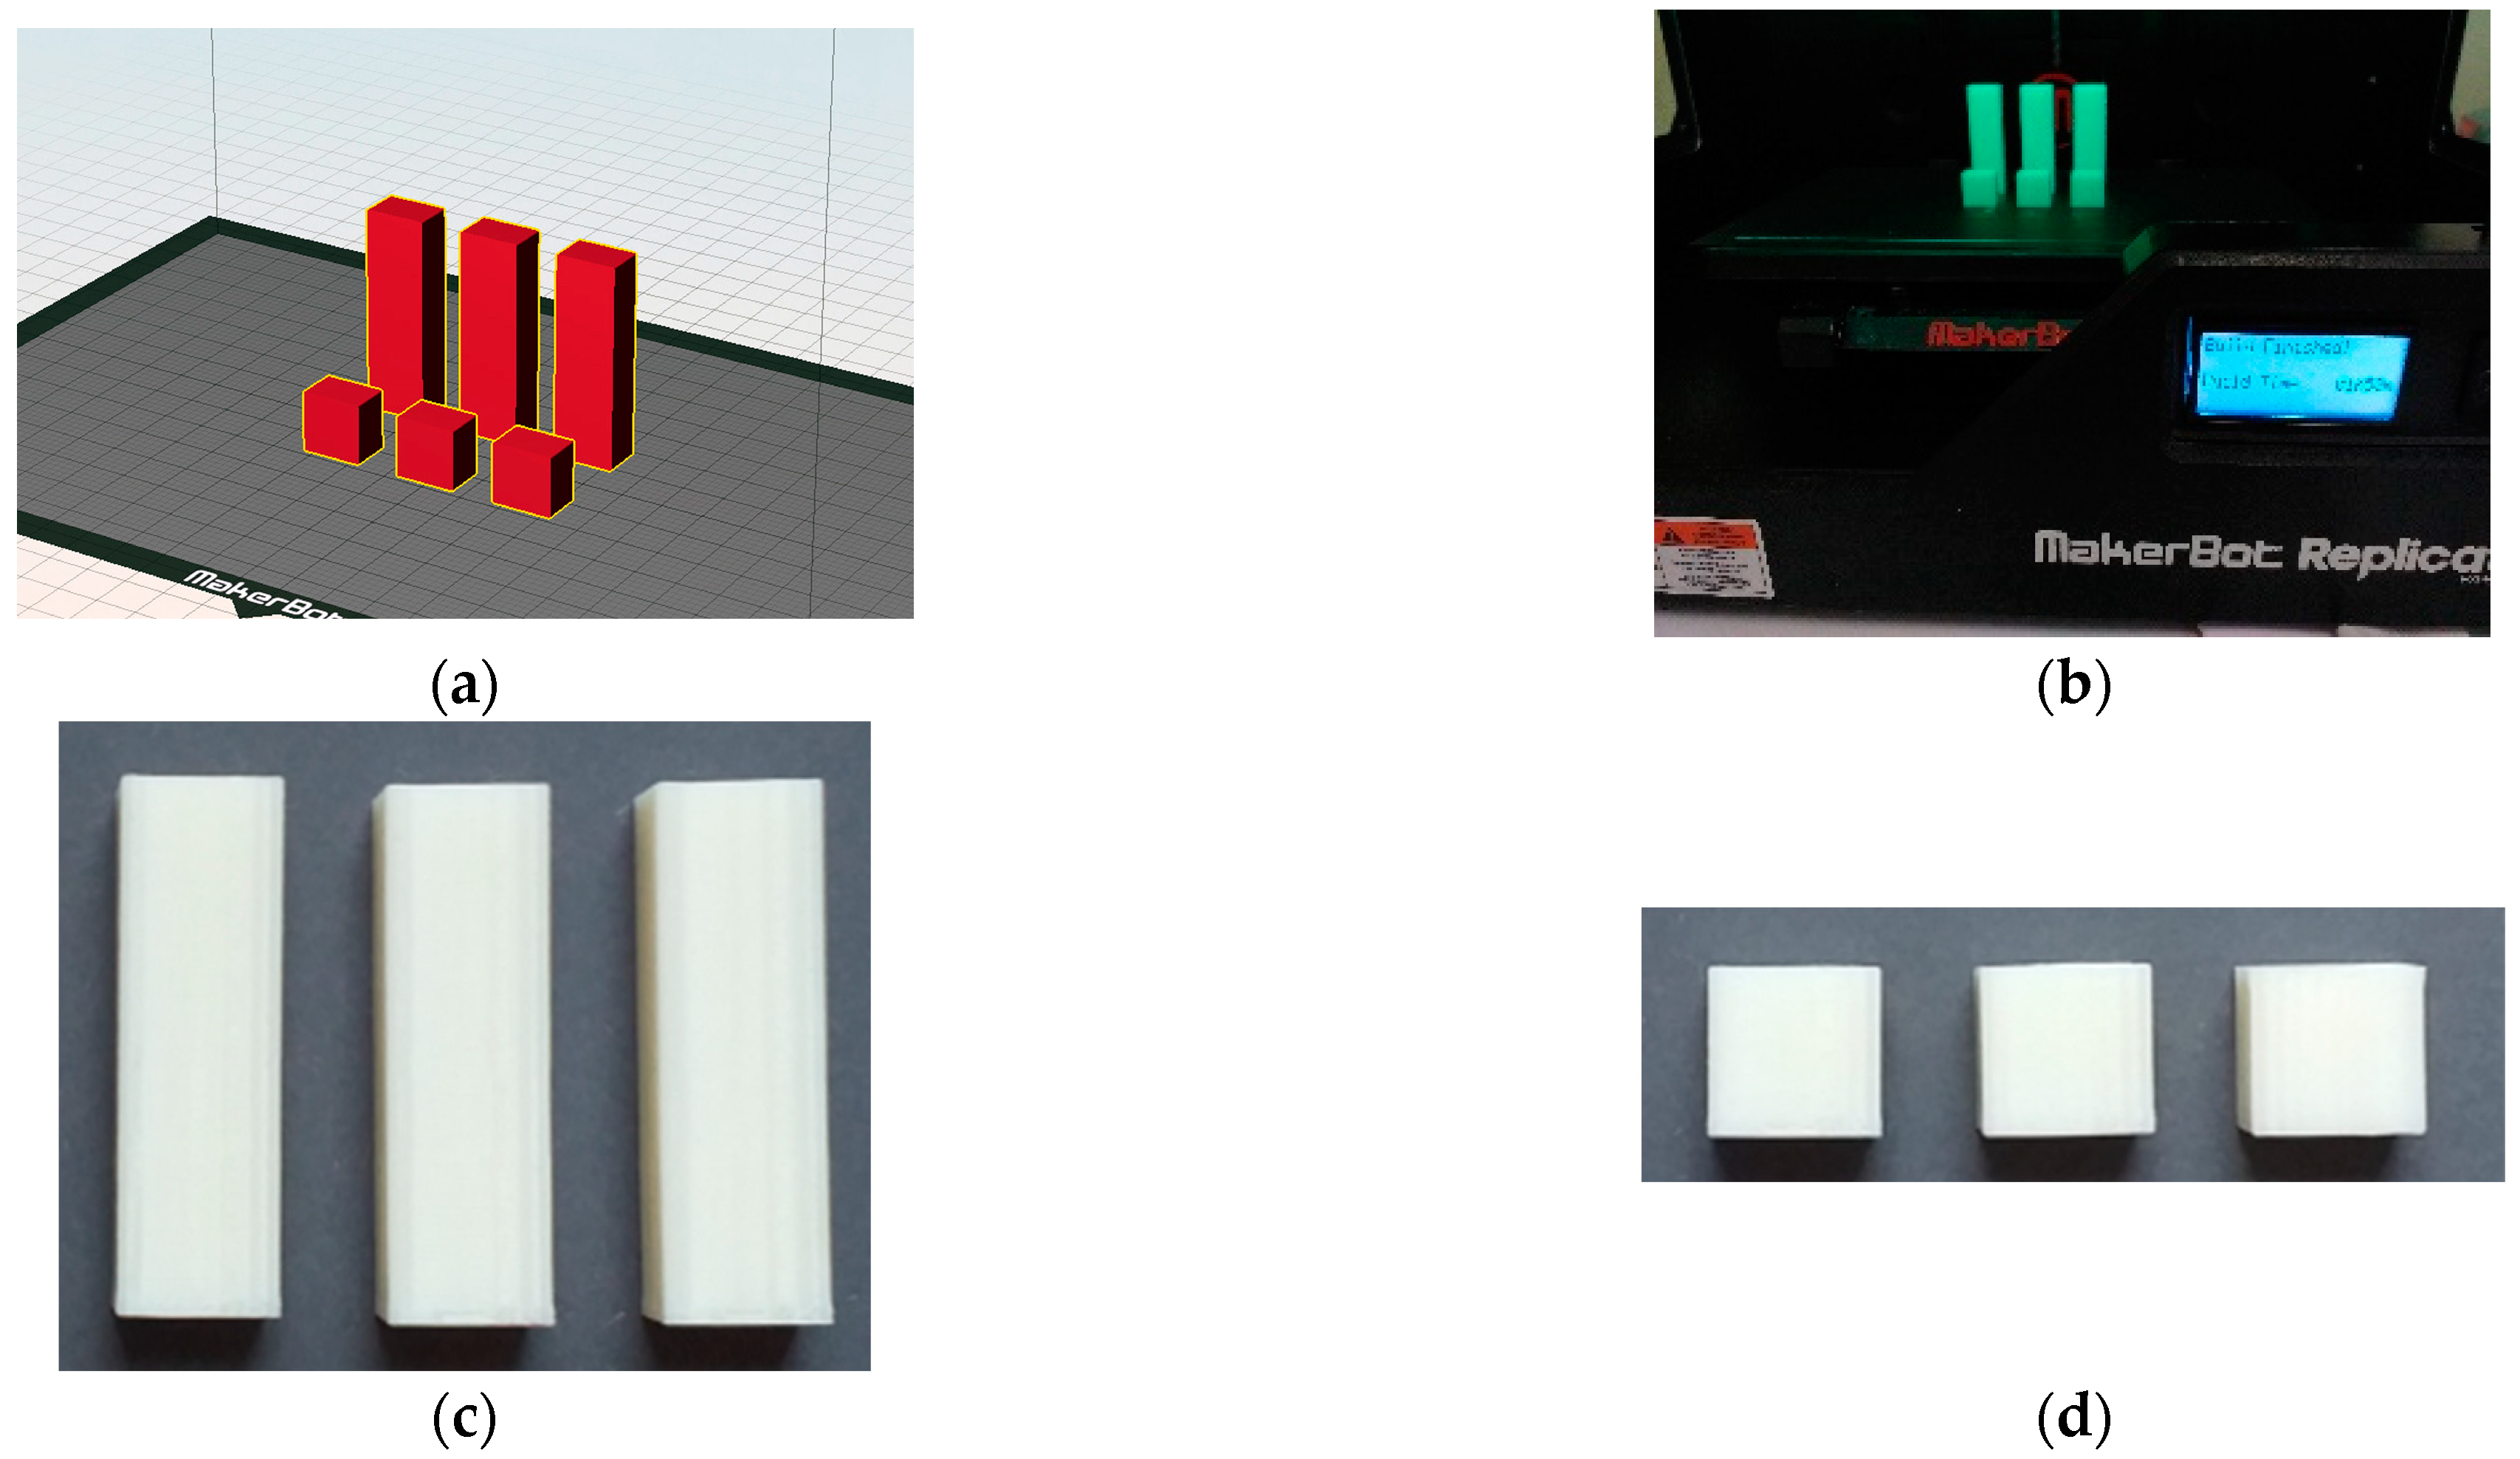
The 3D printing of the test specimens using the FDM process on the desktop MakerBot Replicator 2X 3D printer is shown in Figure 2.

2.2. Experimental Setup

According to the central composite design with three adjustable parameters, specimens for 19 test conditions must be prepared for each test property (compressive strength and compressive modulus) for the linear infill (L45) and honeycomb infill (H).
Before conducting the tests, a preliminary test was carried out to determine the lower and upper limits of the processing parameters [58]:
  • A—layer thickness, LT = 0.10 to 0.30 mm;
  • B—infill density, ID = 10 to 40%;
  • C—extrusion temperature, ϑ = 205 to 255 °C.
The central composite design belongs to a group of higher-order experimental designs, the so-called response surface methodology. The response surface method includes a set of statistical and mathematical methods that are applied for the development, improvement, and optimization of processes. A measurable quantity of product or process quality is called responsiveness.
The purpose of the experimental design is to generate a mathematical model, that is, an equation (polynomial of the second degree) that describes the process. If the studied factors in the experiment are indeed those that influence the process and the data obtained in the experiment are of acceptable accuracy and precision, then it is possible to develop a model that credibly describes the process.
The central composite design is a first-order model (2k) extended by additional points (experimental states) in the center and points on the edges to allow the estimation of the parameters of the second-order model. The central composite design consists of 2k states in the vertices (factor states), 2k states in the edges, and states in the center (k—number of factors). The central composite design is an alternative to the 3k model when constructing the experimental model of order II. because the number of runs is reduced compared to the full factorial model of the experiment. Additional states in the center of the experiment are used to be able to compare the measurement values of the dependent variable in the center of the experiment with the arithmetic mean for the rest of the experiment. If the arithmetic mean of the center of the experiment is significantly different from the total arithmetic mean of all other states of the experiment, then it can be concluded that the relationship between the experimental factor and the dependent variable is not linear.
If the experiment is at least partially repeated, then the error of the experiment can be estimated from the variability of the repeated states. Since these conditions are performed under identical conditions, that is, identical factor levels, the estimation of the experimental error from these data is independent of whether the experimental model is linear or nonlinear and whether it contains higher-order interactions.
Table 1 shows the parameter levels determined according to the test condition matrix for the three-part central composite design. The layer thickness, infill density, and extrusion temperature were varied according to the central composite design, as shown in Table 2 (five repetitions in the center).
At the same time, three specimens were produced for each set of 3D printing conditions. A total of 114 specimens were produced: 57 for the testing of the compressive strength and 57 for the compressive modulus.
In the statistical data processing (analysis of variance), the models of the highest-degree polynomial functions that could still significantly describe the observed influence of the studied 3D printing factors were used to describe the effects of the observed parameters (factors) of 3D printing. The Design Expert 13 software with the ANOVA module was used.
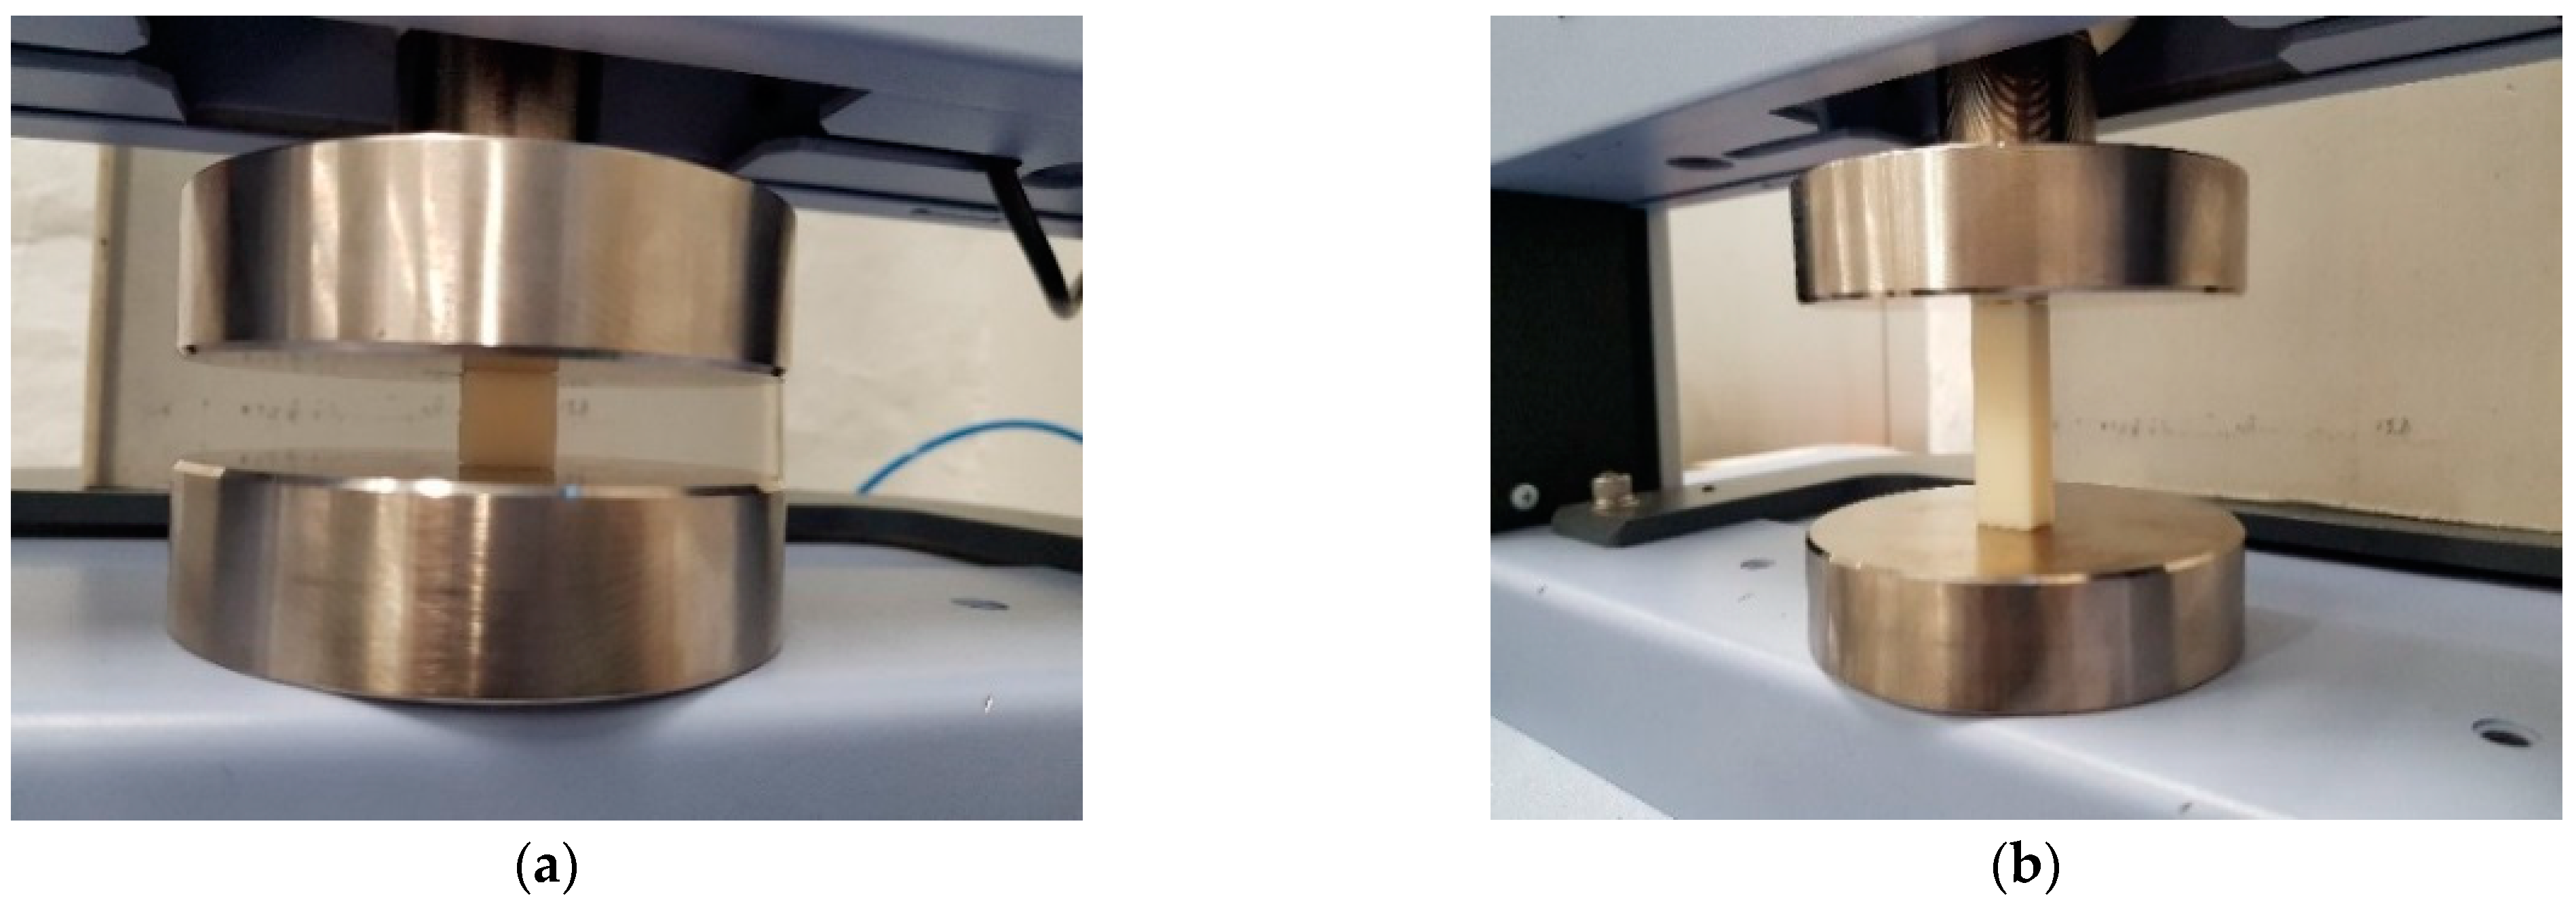
The determination of the compressive properties was performed on a universal testing machine (Shimadzu AGS-X 10 kN (Shimadzu Corporation, Kyoto, Japan)). The specimen was compressed between two flat, parallel plates (Figure 3) and loaded with a force F at a crosshead speed of v = 5 mm/min at room temperature according to the HRN EN ISO 604: Determination of Compressive Properties (ISO 604:2002; EN ISO 604:2003) standard [59]. The parameters applied to characterize the compressive properties of the specimens were the compressive strength (N/mm2) and the compressive modulus (N/mm2), and the mass of the specimens was also measured to relate it to the obtained mechanical properties of the tested specimens. The results of the compressive tests are shown in Table 3.

3. Results

The results of the compressive tests are shown in Table 3. The table shows the test results for the compressive strength and compressive modulus for the linear infill (L45) and honeycomb infill test specimens. The mean values (of three test specimens) and standard deviations are given for 19 test conditions. The results show that the highest values of compressive strength (38.99 ± 0.40 N/mm2) are achieved at LT = 0.20 mm—ID = 40%—ϑ = 230 °C for specimens with the linear infill, while the highest values of compressive strength (33.81 ± 1.43 N/mm2) are achieved at LT = 0.15 mm—ID = 35%—ϑ = 245 °C for specimens with the honeycomb infill. For the compressive modulus, the highest values are achieved at LT = 0.15 mm—ID = 35%—ϑ = 245 °C for test specimens with both infill types. Higher compressive modulus values were achieved with the linear infill (836.89 ± 8.36 N/mm2) than with the honeycomb infill (804.53 ± 18.81 N/mm2). The lowest values for compressive strength (23.54 ± 0.41 N/mm2) and compressive modulus (497.94 ± 7.68 N/mm2) were obtained for test condition 13 (LT = 0.30 mm—ID = 25%—ϑ = 230 °C) for the specimens with the linear infill, but for the honeycomb infill, the lowest values for the compressive strength (24.61 ± 0.87 N/mm2) and compressive modulus (603.46 ± 11.16 N/mm2) were determined for test condition 14 (LT = 0.25 mm—ID = 15%—ϑ = 215 °C).
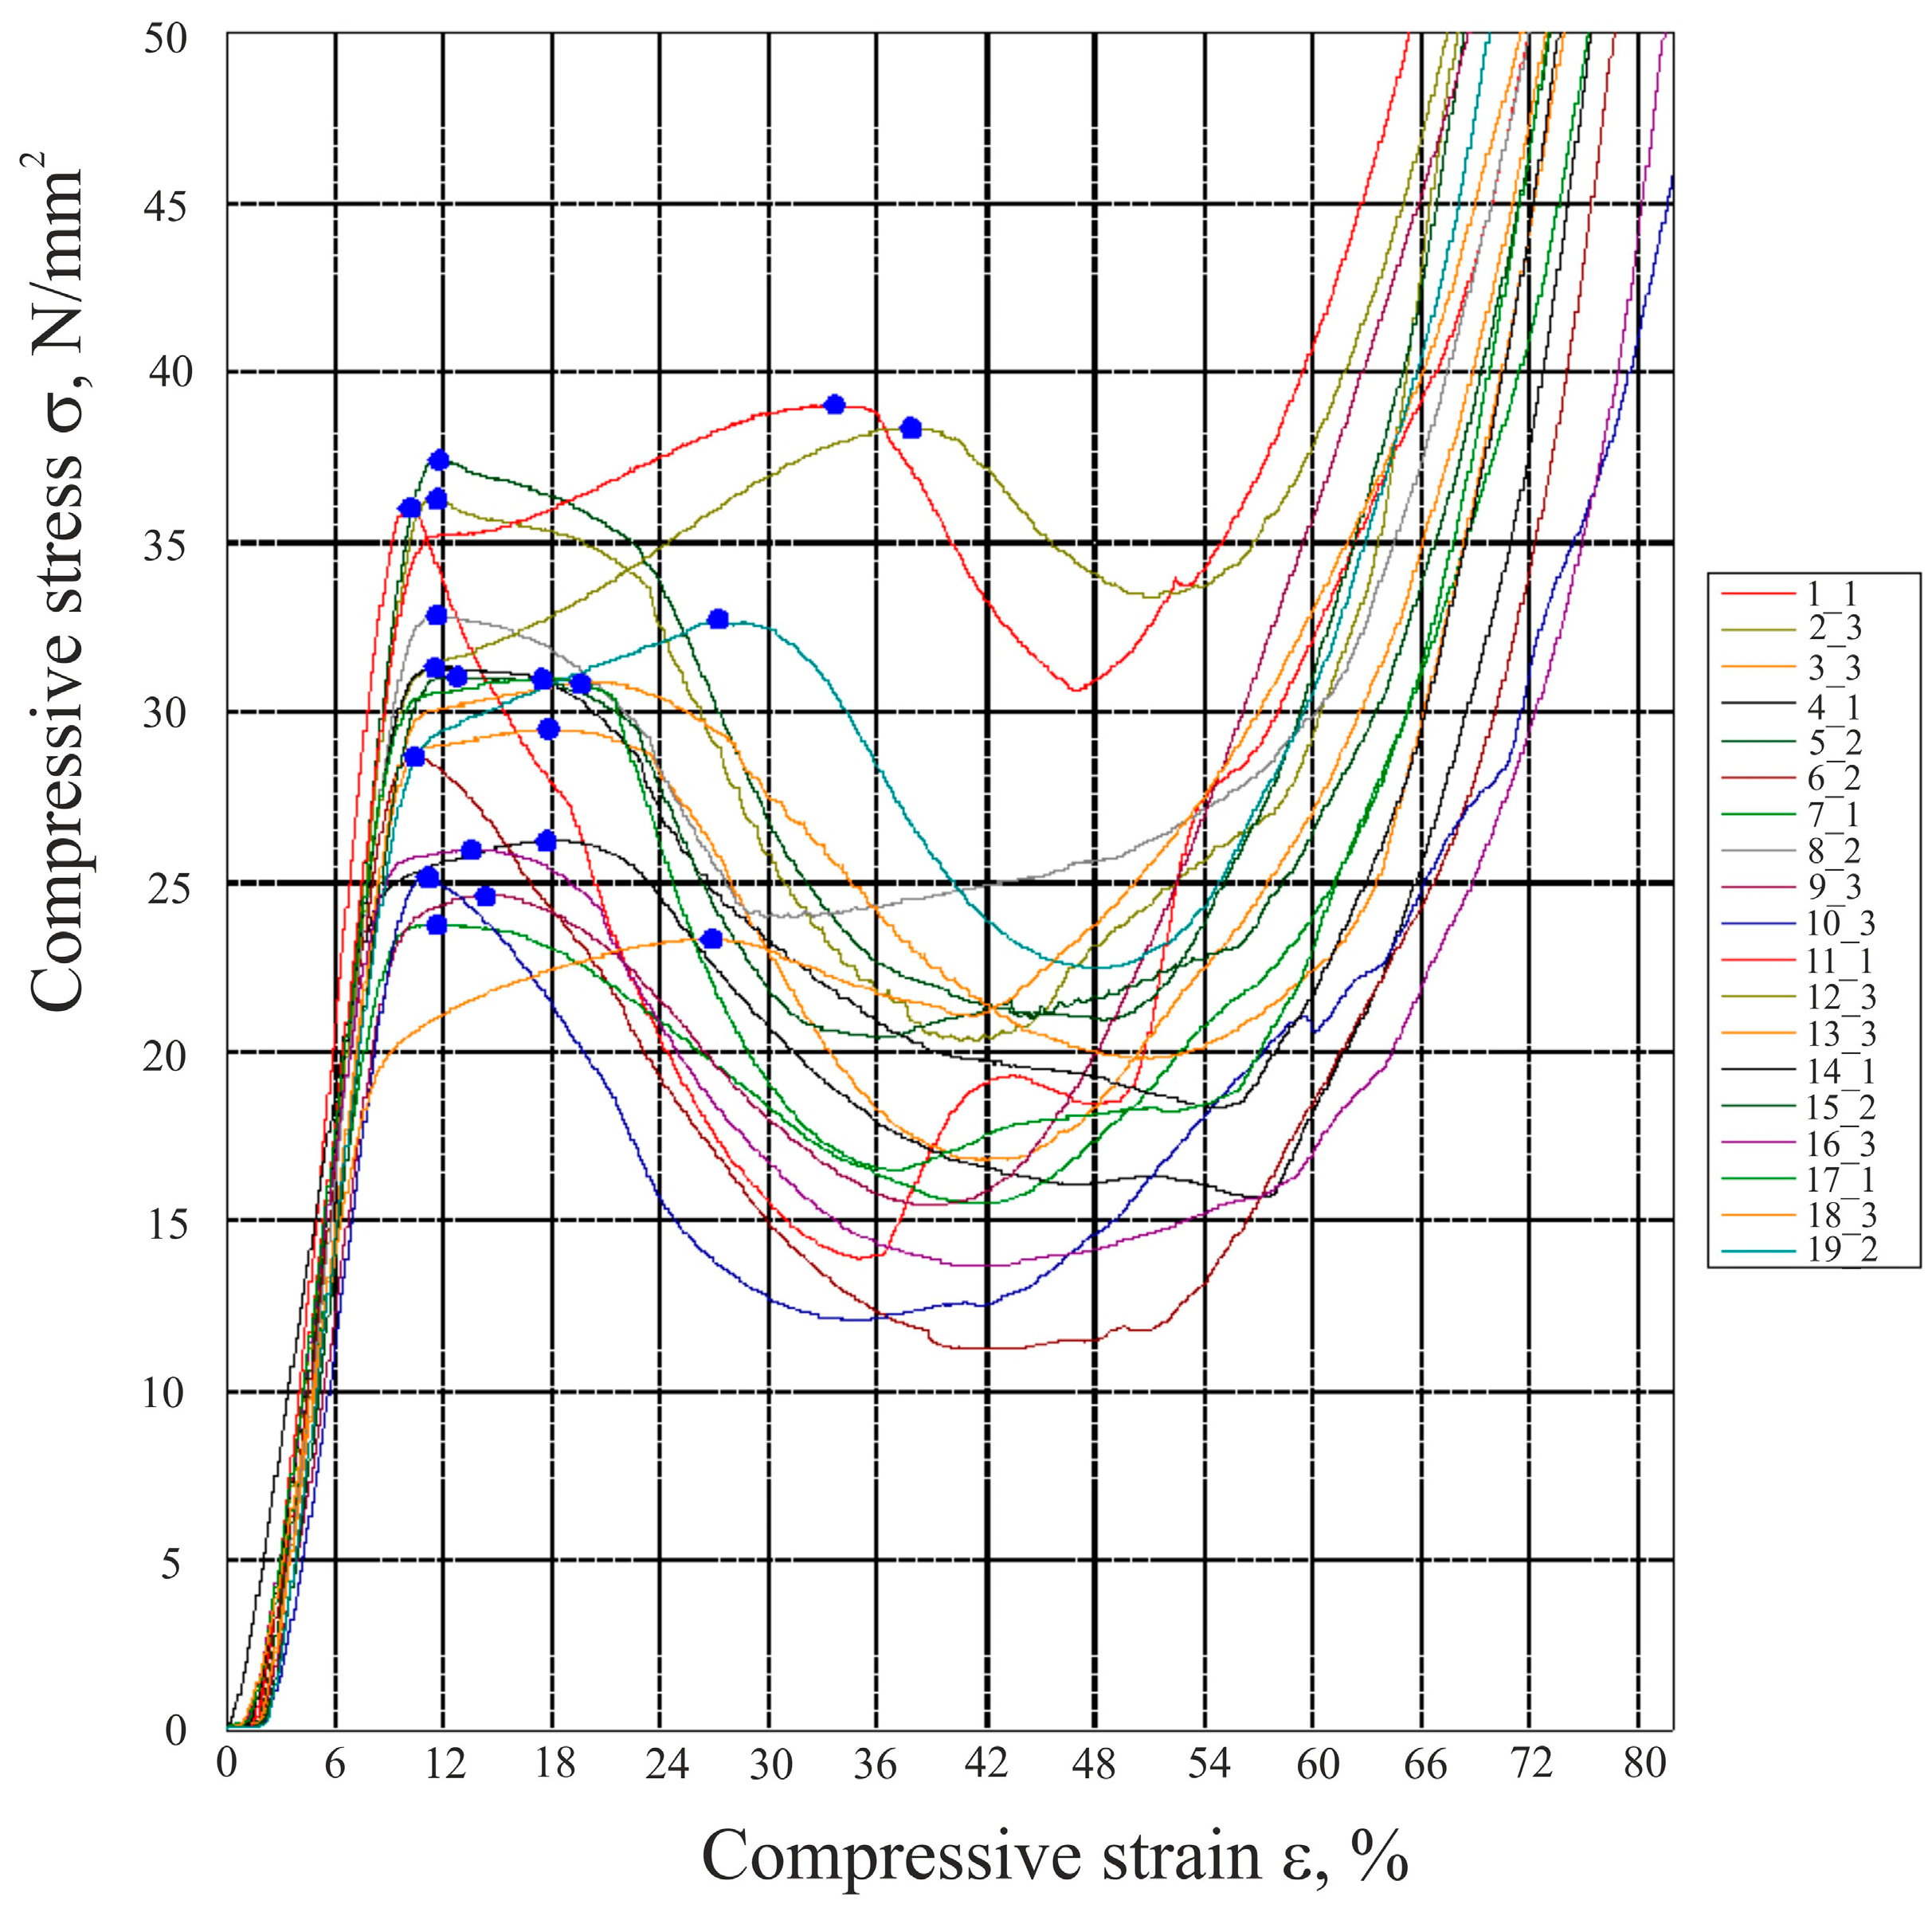
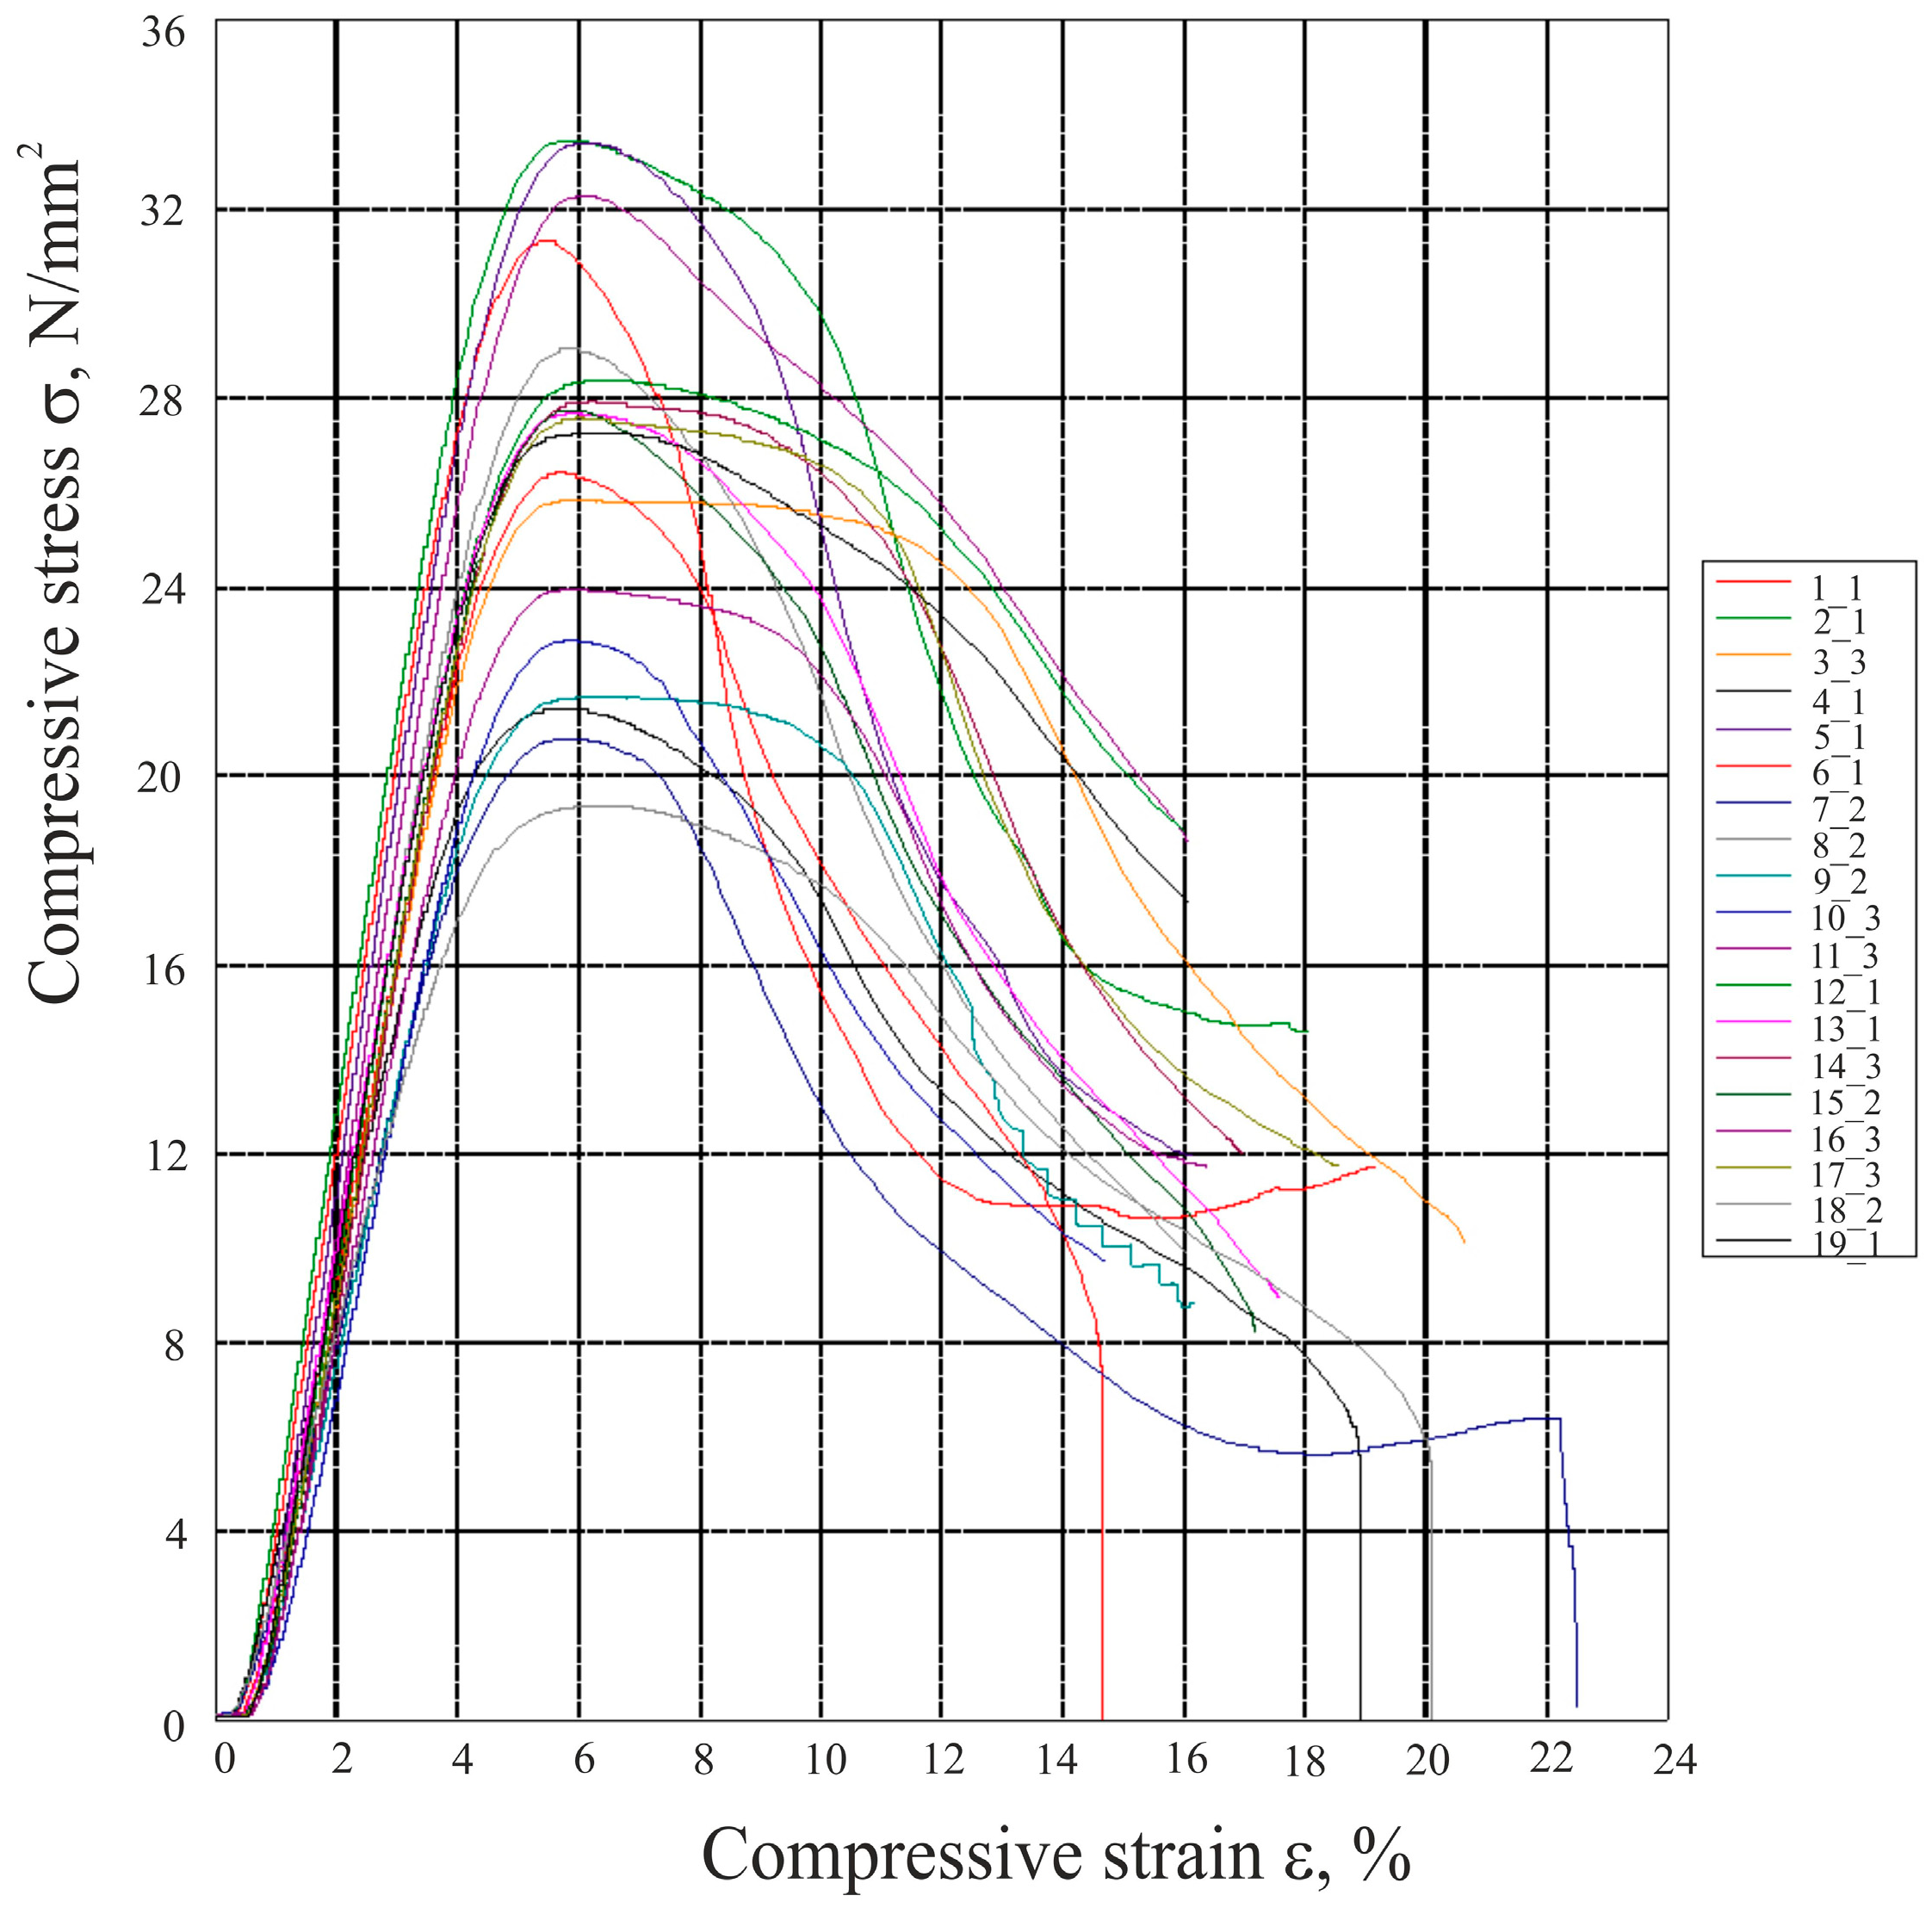
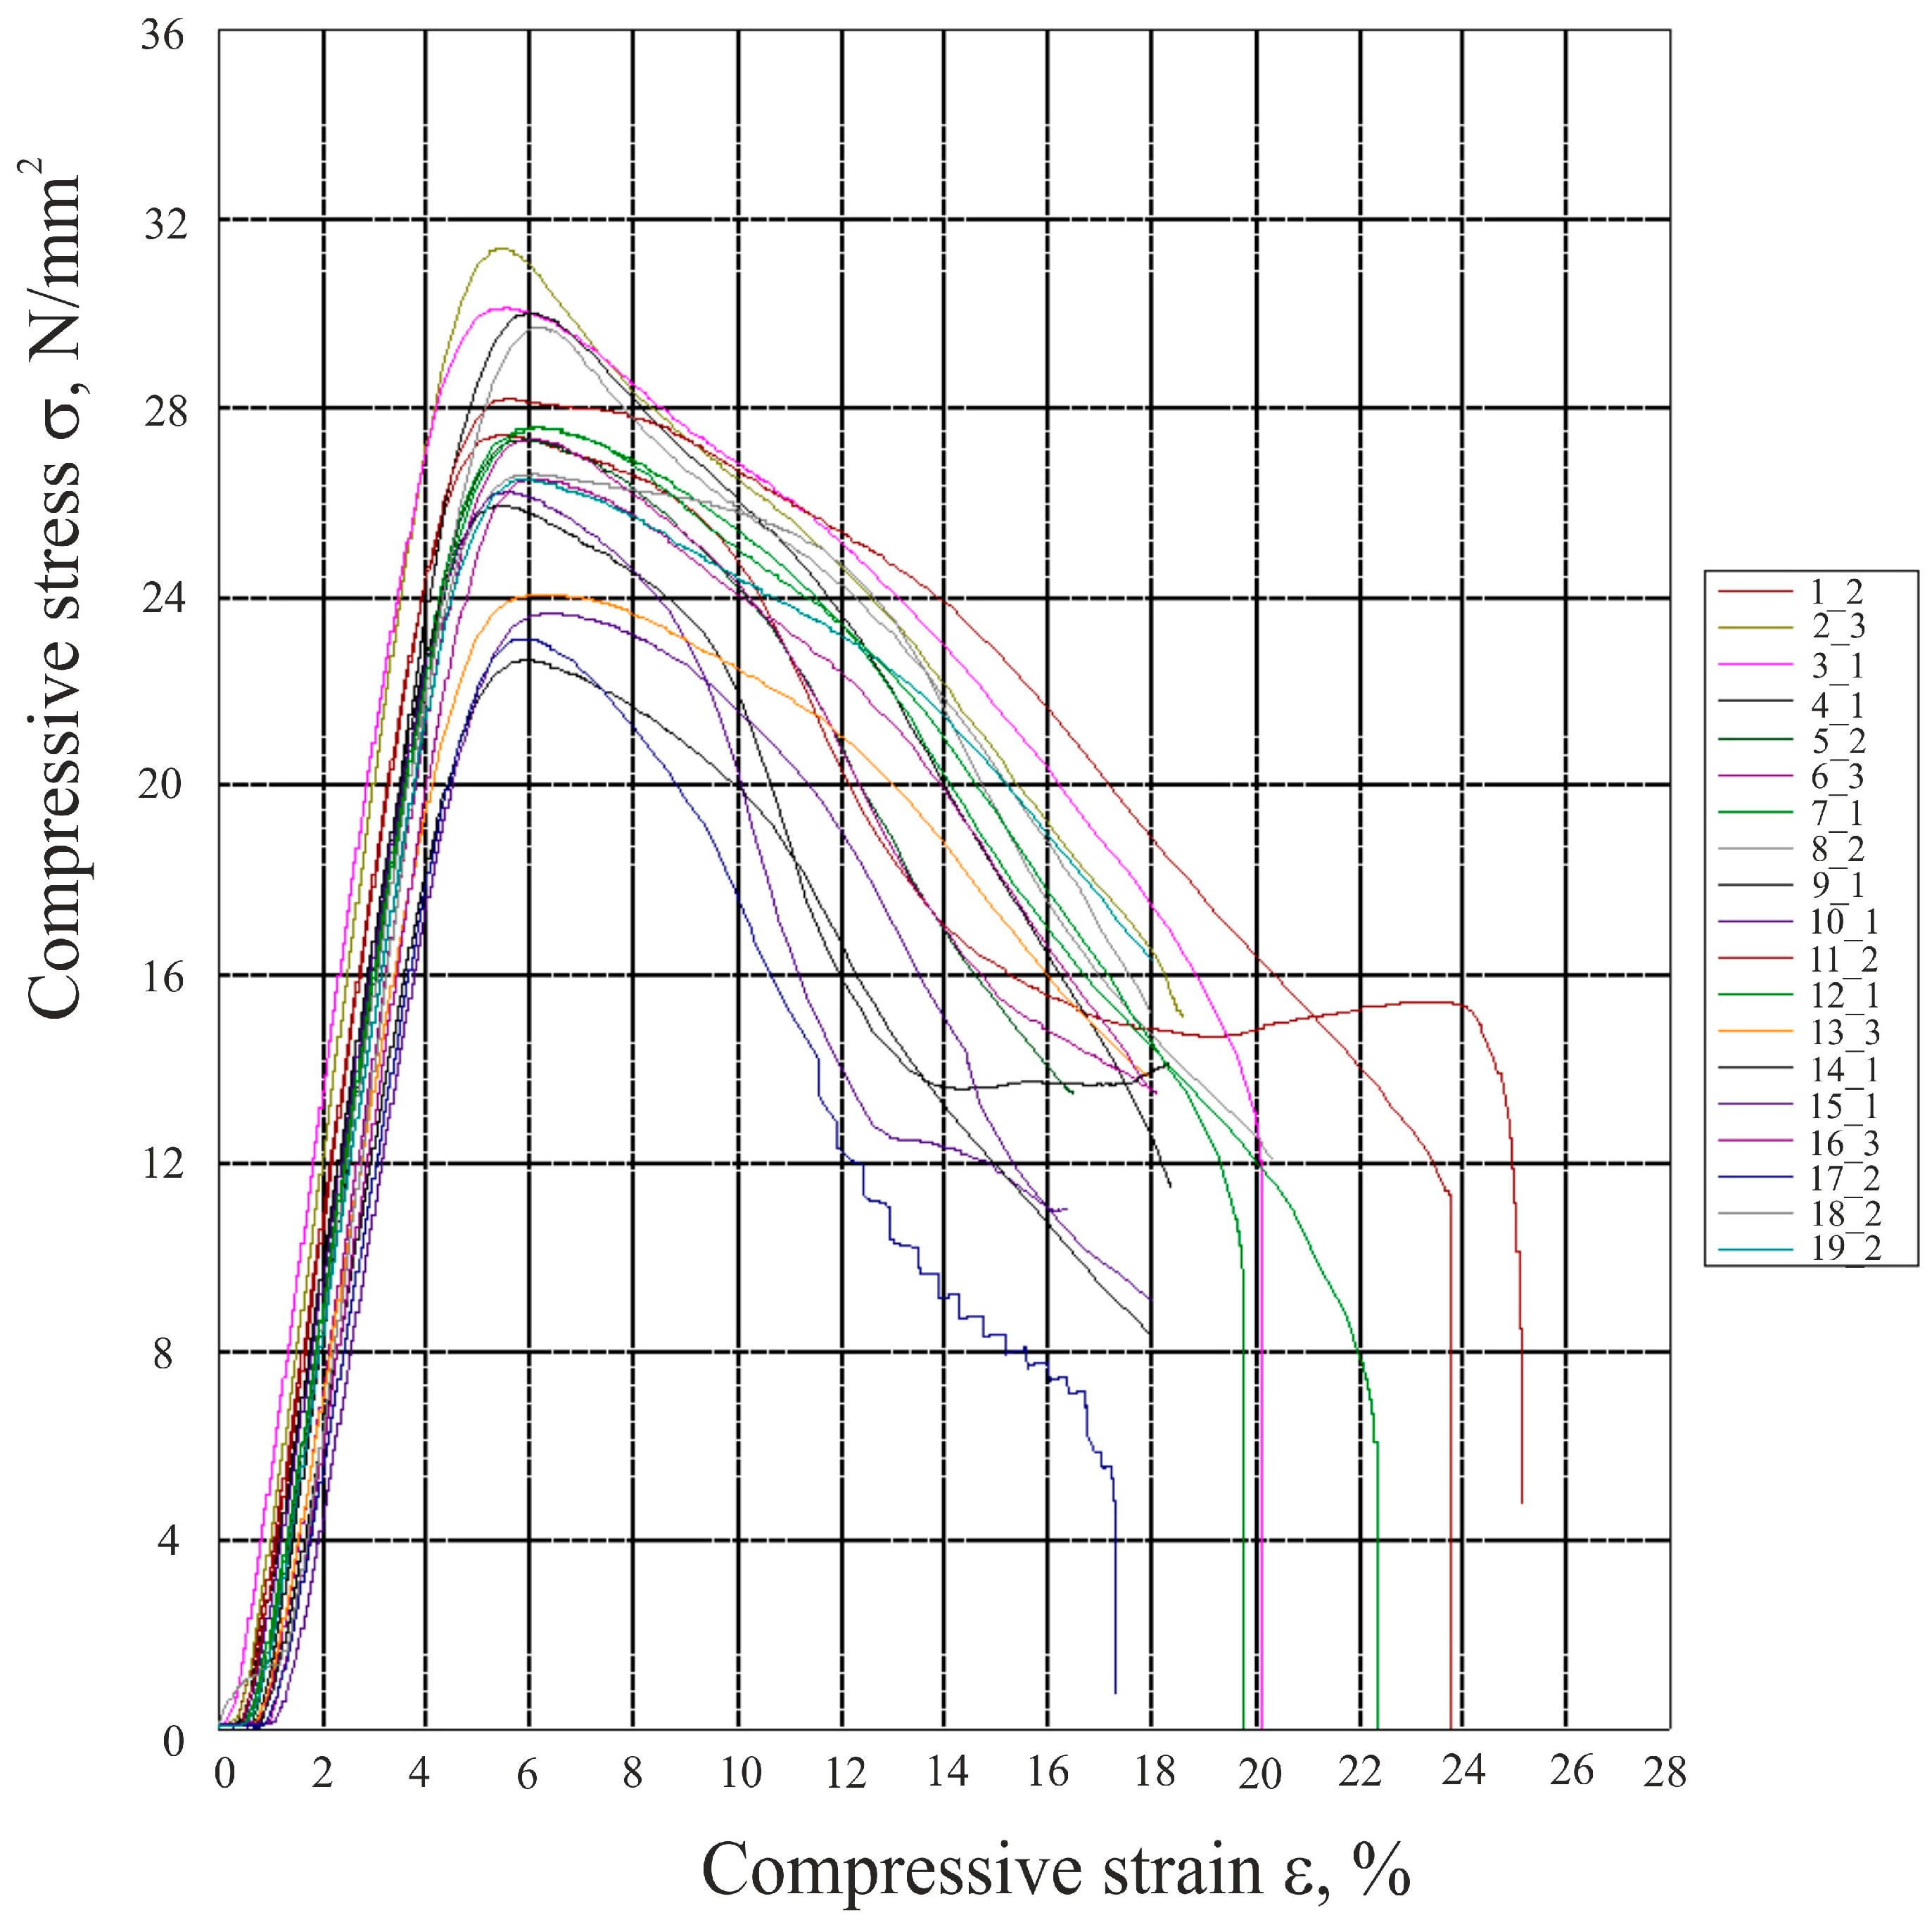
Figure 4, Figure 5, Figure 6 and Figure 7 show compressive stress–strain diagrams (σ, ε) for testing the compressive properties of the linear (L45) and honeycomb fillers. For clarity, only one specimen per test condition is shown, which is approximately the mean value. The labels on the right side of each graph represent the sample designations, where the first number indicates the test condition, and the second number is the number of the sample in that test condition.

3.1. Statistical Analysis of Compressive Strength

The Design Expert 13 software program (Stat-Ease Inc., Minneapolis, MN, USA) was used for the statistical analysis of the compressive properties (compressive strength and compressive modulus). As part of the response surface methodology, central composite design is a statistical method that is useful for process development, improvement, and optimization. The Design Expert computer program allows the optimization of adjustable processing parameters based on the so-called desirability function. The optimization considers the desired values of the observed properties (responses), which can be a minimum, maximum, target, or within certain limits. Using analysis of variance (ANOVA) and response surface models, it is possible to determine the importance of the observed parameters of 3D printing and their interactions with the observed compressive properties. In addition, statistical analysis was used to determine a mathematical function that can be used to predict future outcomes of the observed compressive properties. Highest-degree polynomial function models were used in the statistical data processing (analysis of variance) to describe the effects of the observed parameters (factors) of 3D printing that are still significant in describing the observed effects.

3.1.1. Statistical Analysis of Compressive Strength—Linear Infill (L45)

The results of ANOVA for testing the compressive strength of specimens with linear infill (L45) are shown in Table 4.
The mathematical model of the response surface (reduced linear model) for the compressive strength (σx) can be presented in the form of Equation (1), with all factors listed in coded form in Table 4. The coded equation is useful for determining the relative influence of the factors by comparing the factor coefficients, which allows process optimization and the improvement of production performance. In Table 4, p-values less than 0.05 indicate that model terms are significant. In this case, the thickness of the layer (A) and the density of the infill (B) are significant parameters. The lack of fit (F-value) is not significant relative to the pure error. A non-significant lack of fit is good because it represents that the model fits and there are no significant errors. Table 5 shows the basic statistical data of the model for the compressive strength of the linear infill (L45). The coefficient of determination r2 is a measure of the deviation from the arithmetic mean that is explained by the model. The closer r2 is to 1, the better the model follows the data, that is, the phenomenon is better explained.
The process (response function) is described by an equation.
σc = 30.67 − 3.46 × A + 7.46 × B,
In Equation (1), σc denotes compressive strength in N/mm2.
The influence of the layer thickness and infill density on the compressive strength of the manufactured parts of the linear infill can be presented in the form of two-dimensional (2D) graphs (Figure 8 and Figure 9). Figure 8 shows that increasing the layer thickness of the 3D print leads to a decrease in compressive strength, while Figure 9 shows that increasing the density of the infill has a positive effect on increasing the value of compressive strength. With a higher density of the infill (B), the maximum values of compressive strength are achieved, which is the expected result.
Figure 10 shows the dependence of the compressive strength of the specimens of the linear infill (L45) on the density of the fill and the thickness of the layer. The result of the statistical analysis shows that the density of the infill is a more influential parameter than the thickness of the layer, which can be seen in Figure 10. An increase in the percentage of the infill leads to a significant increase in the value of the compressive strength, while an increase in the thickness of the layer causes a slight decrease in the value of the compressive strength.

3.1.2. Statistical Analysis of Compressive Strength—Honeycomb Infill (H)

The influence of the adjustable parameters of 3D printing on the compressive strength of the honeycomb infill was analyzed using a reduced quadratic function. Table 6 shows the results of the statistical analysis of the compressive strength of the honeycomb infill specimens. From the table, it can be seen that in this case, the layer thickness (A), infill density (B), extrusion temperature (C), and squared value of infill density (B2) are significant parameters. The mathematical model of the response surface (reduced quadratic model) of the compressive strength (σx) can be represented by Equation (2), with all factors listed in coded form in Table 6. Table 7 shows the basic statistical data of the model for the compressive strength of the honeycomb infill.
σc = 29.98 − 2.31 × A + 3.71 × B + 0.78 × C − 1.08 × B2,
In Equation (2), σc denotes compressive strength in N/mm2.
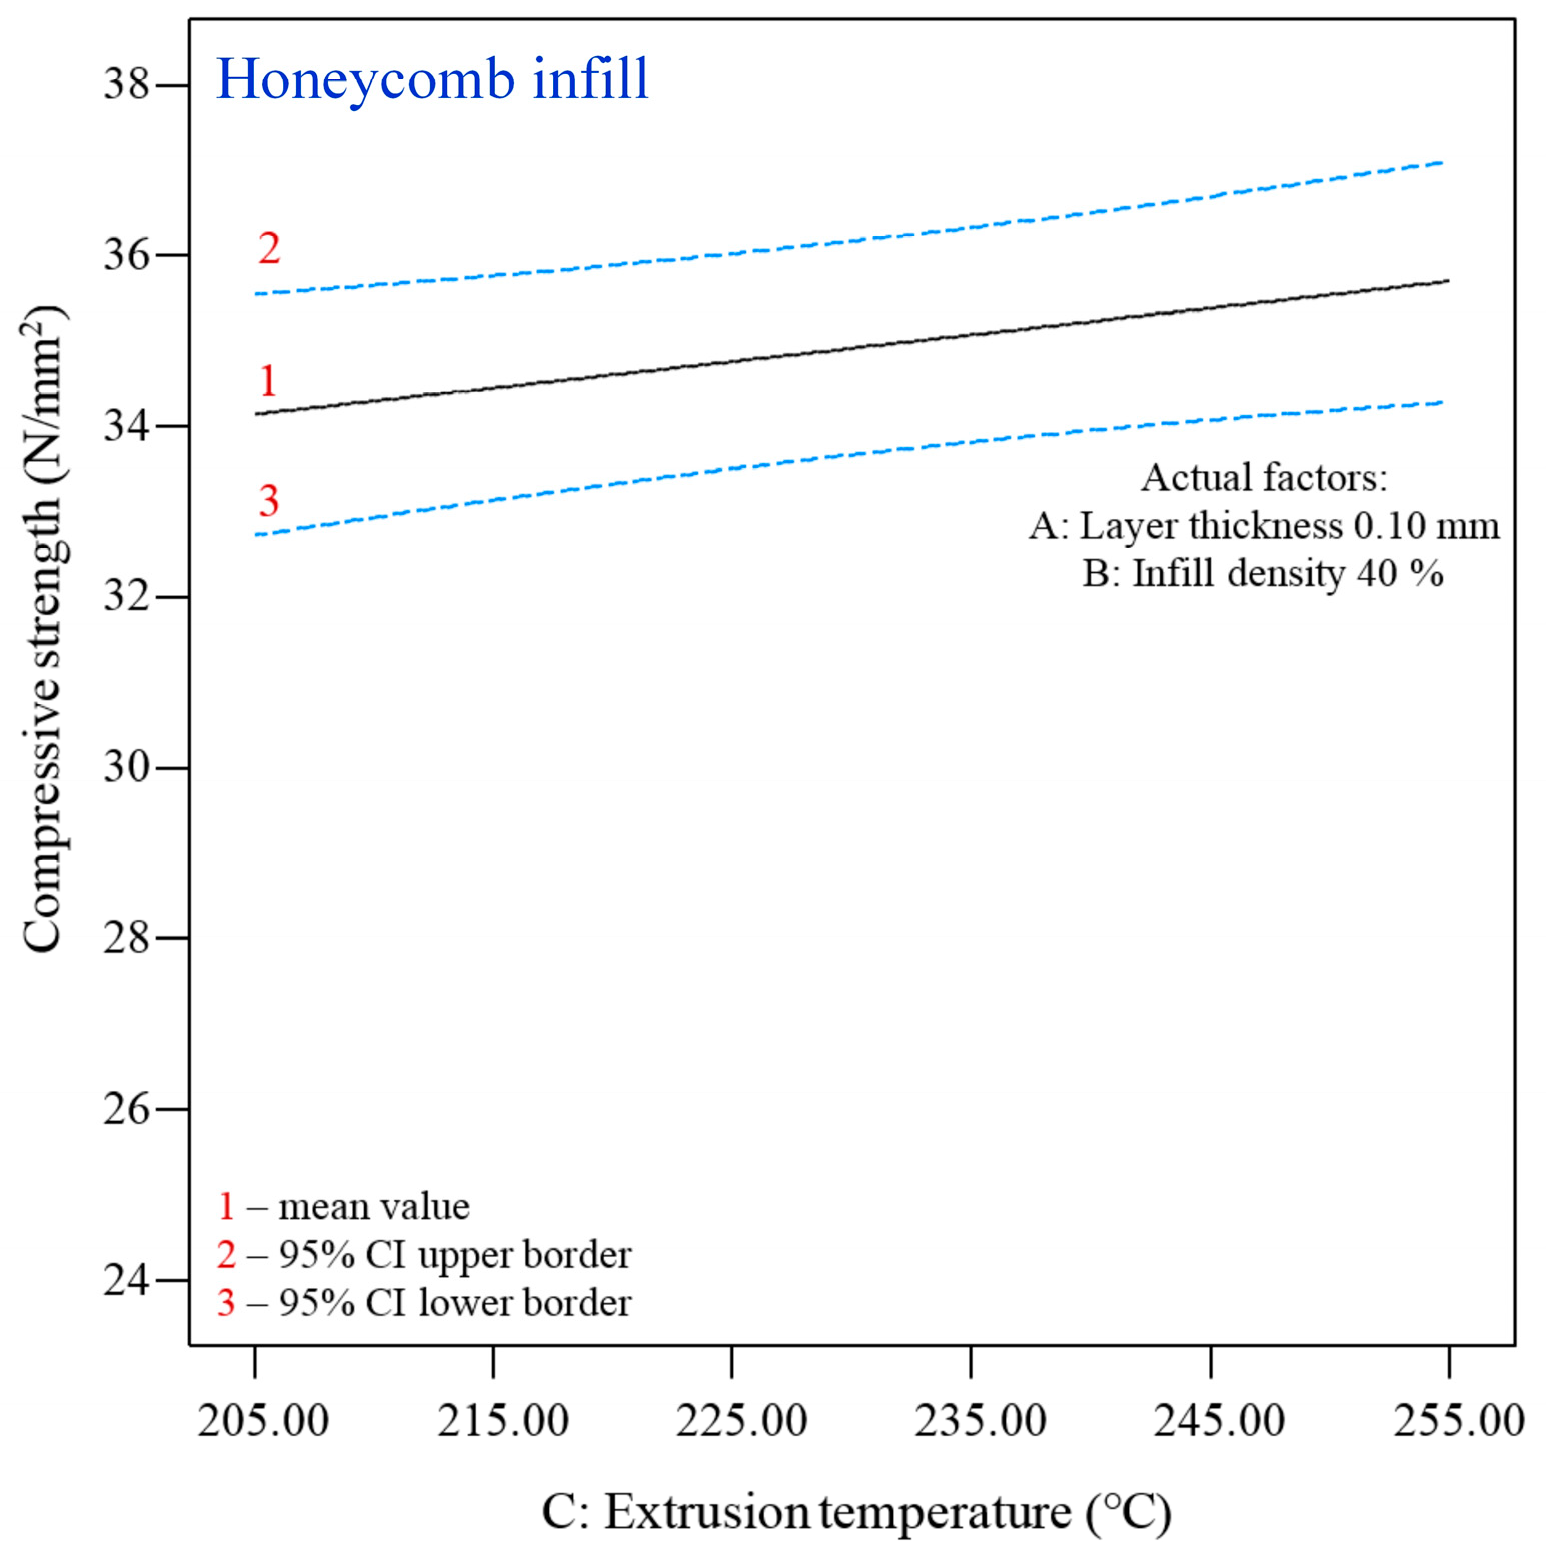
Figure 11, Figure 12 and Figure 13 show the influence of the individual parameters of 3D printing of the test specimens with the honeycomb infill on the compressive strength. Figure 11 shows that increasing the layer thickness has a negative effect on the compressive strength, while the density of the infill shows the opposite trend (Figure 12), as in the case of the compressive strength of the specimens with the linear infill (L45). Figure 13 shows that an increase in temperature leads to a slight increase in the compressive strength value.
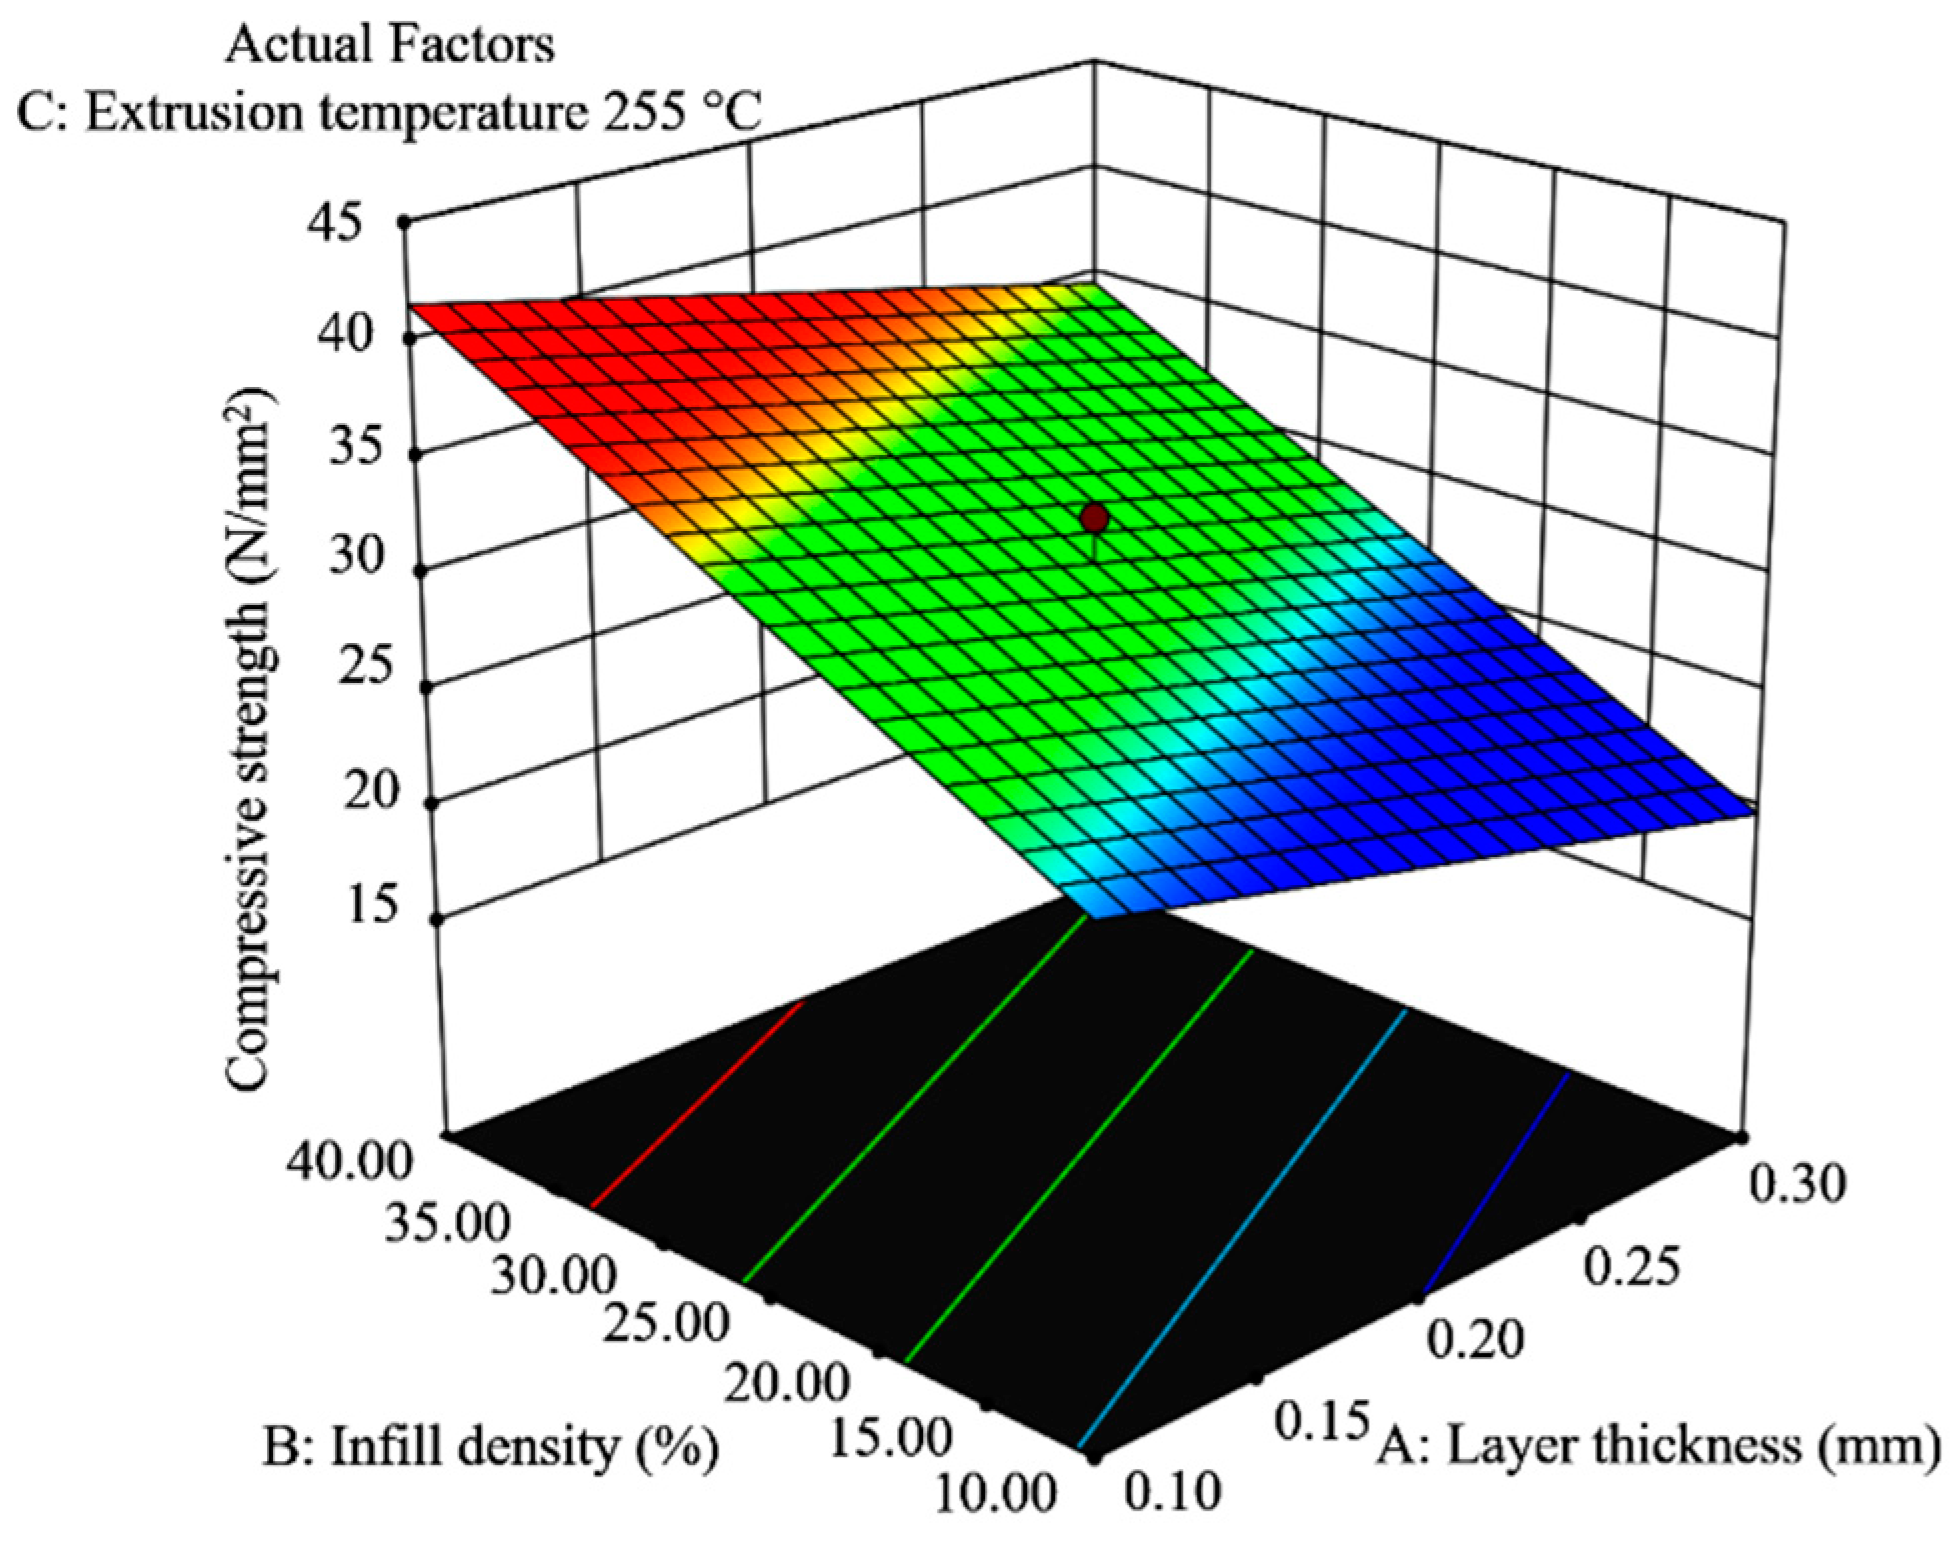
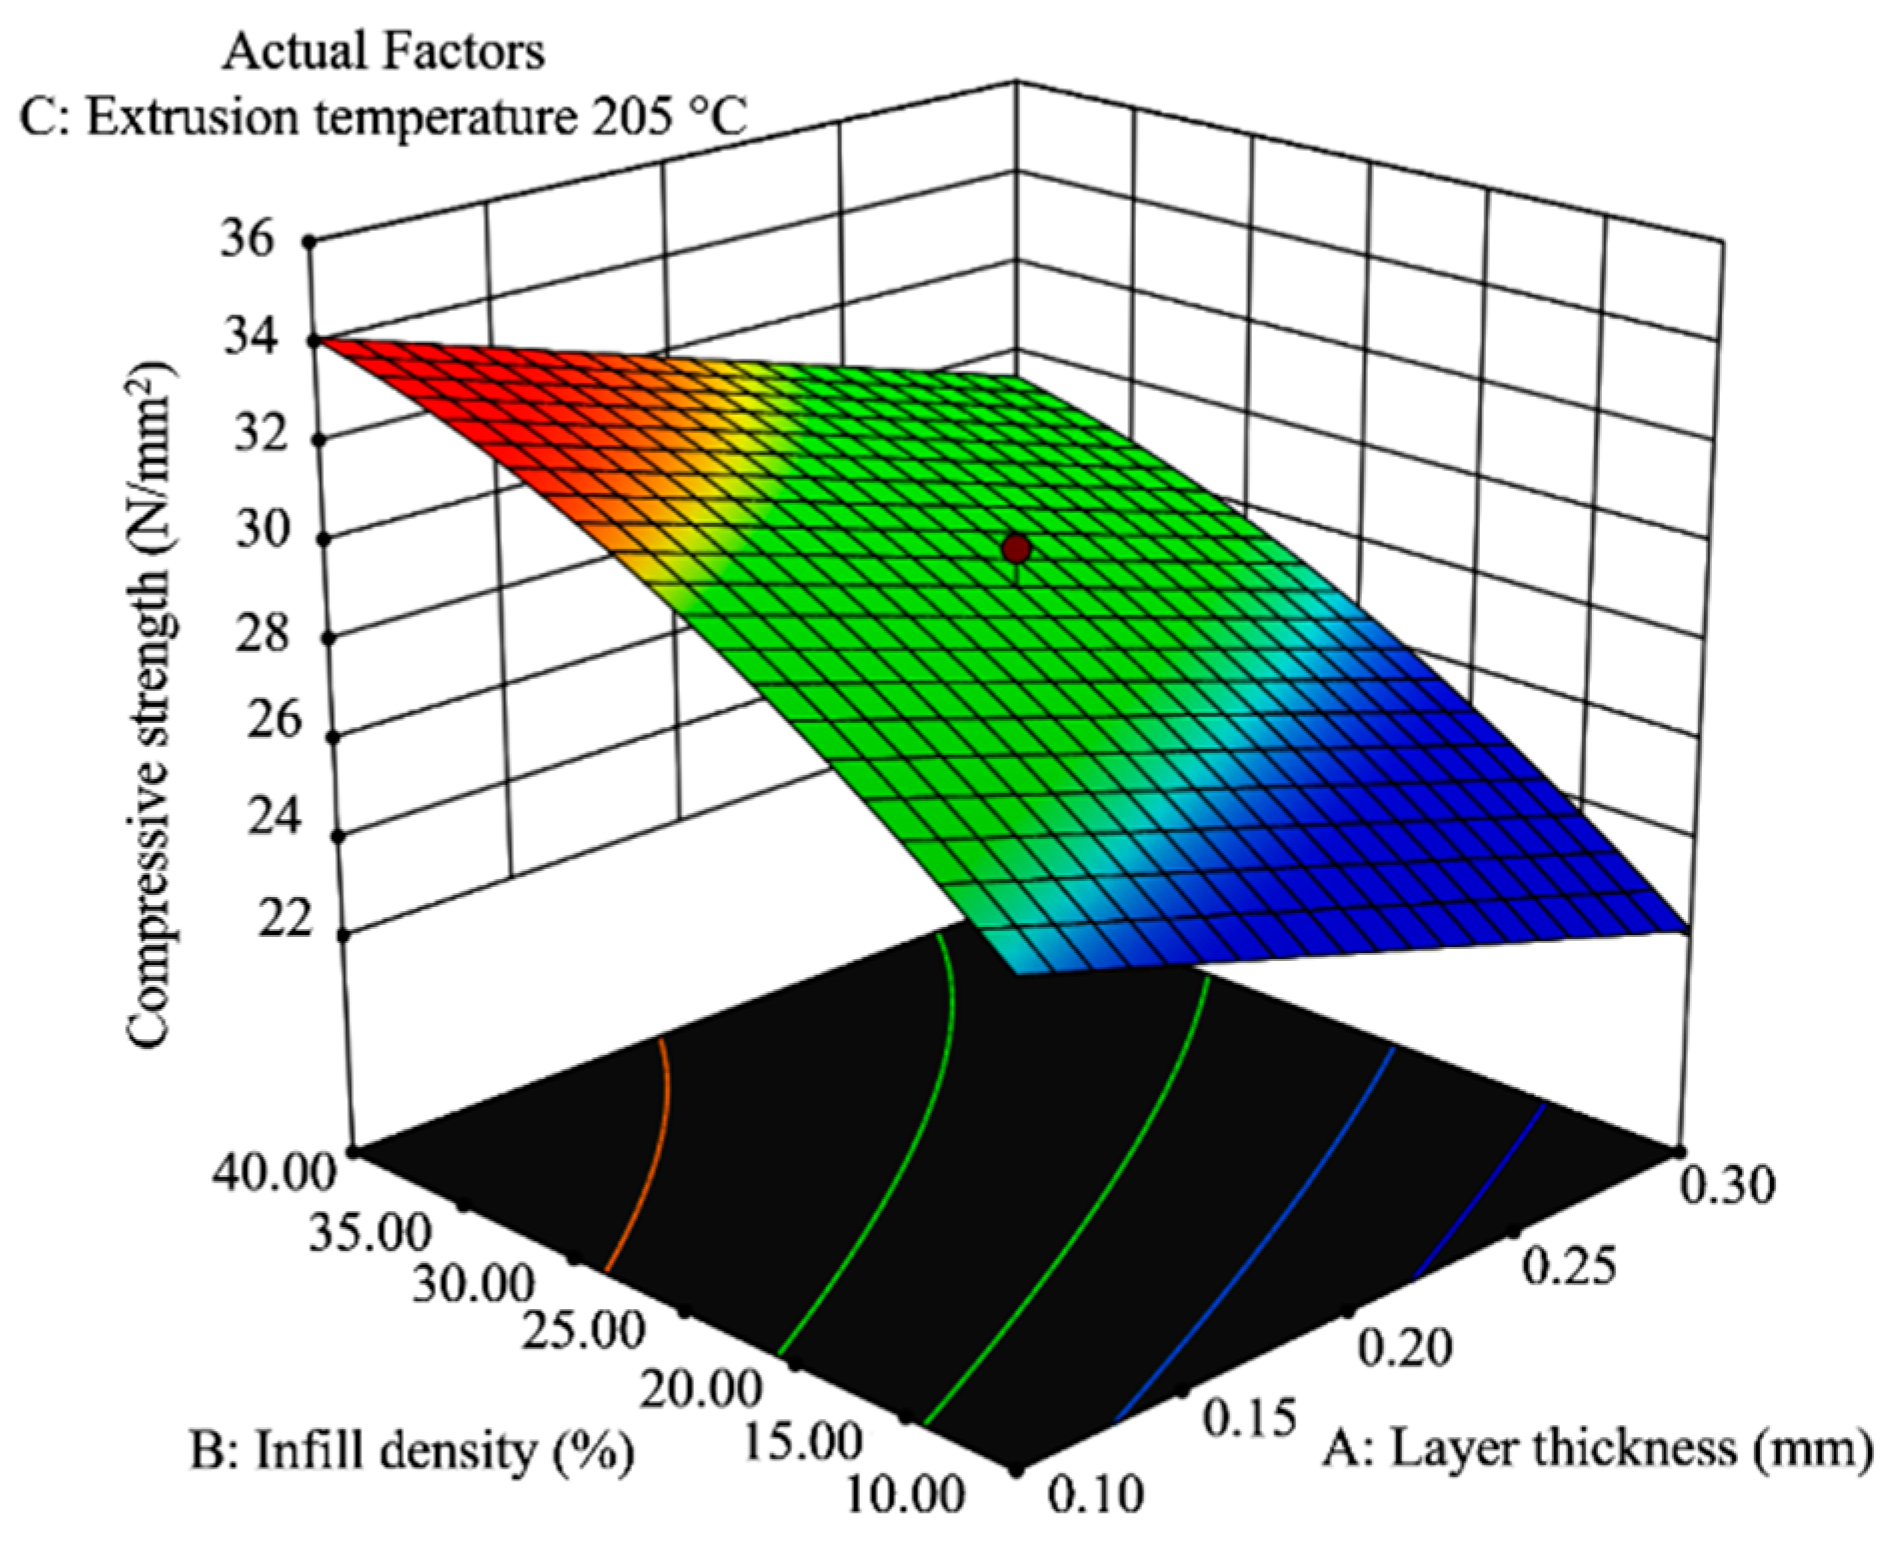
Figure 14 and Figure 15 show the effects of the infill density and layer thickness on the compressive strength of the honeycomb infill at the minimum and maximum temperatures. It can be seen that in both cases, the increase in the infill density has a positive effect on the increase in the compressive strength, while the layer thickness shows the opposite tendency, i.e., a slight decrease in the value of the compressive strength when the layer thickness is increased from 0.10 to 0.30 mm. It can be observed that in this case, the temperature increases from 205 °C (Figure 14) to 255 °C (Figure 15), which also leads to an increase in the maximum compressive strength from 34 to 35.8 N/mm2, although the response surfaces are almost identically shaped.

3.2. Statistical Analysis of the Compressive Modulus

3.2.1. Statistical Analysis of the Compressive Modulus—Linear Infill (L45)

A reduced linear model was chosen for the analysis of the effects of the adjustable parameters on the pressure modulus of the linear infill (L45). Table 8 shows the results of the statistical analysis for the compressive modulus of the specimens of the linear infill. It can be seen from the table that in this case, the layer thickness (A) and the infill density (B) are the most important parameters, with the infill density having a greater influence, as in all previous cases. The mathematical model of the response surface (reduced linear model) of the compressive modulus (Ec) can be presented in the form of Equation (3), with all factors in coded form, as given in Table 8. Table 9 shows the basic statistical data of the model for the compressive modulus of the linear infill (L45).
Ec = 694.91 − 103.51 × A + 120.3 × B,
In Equation (3), Ec denotes compressive modulus in N/mm2.
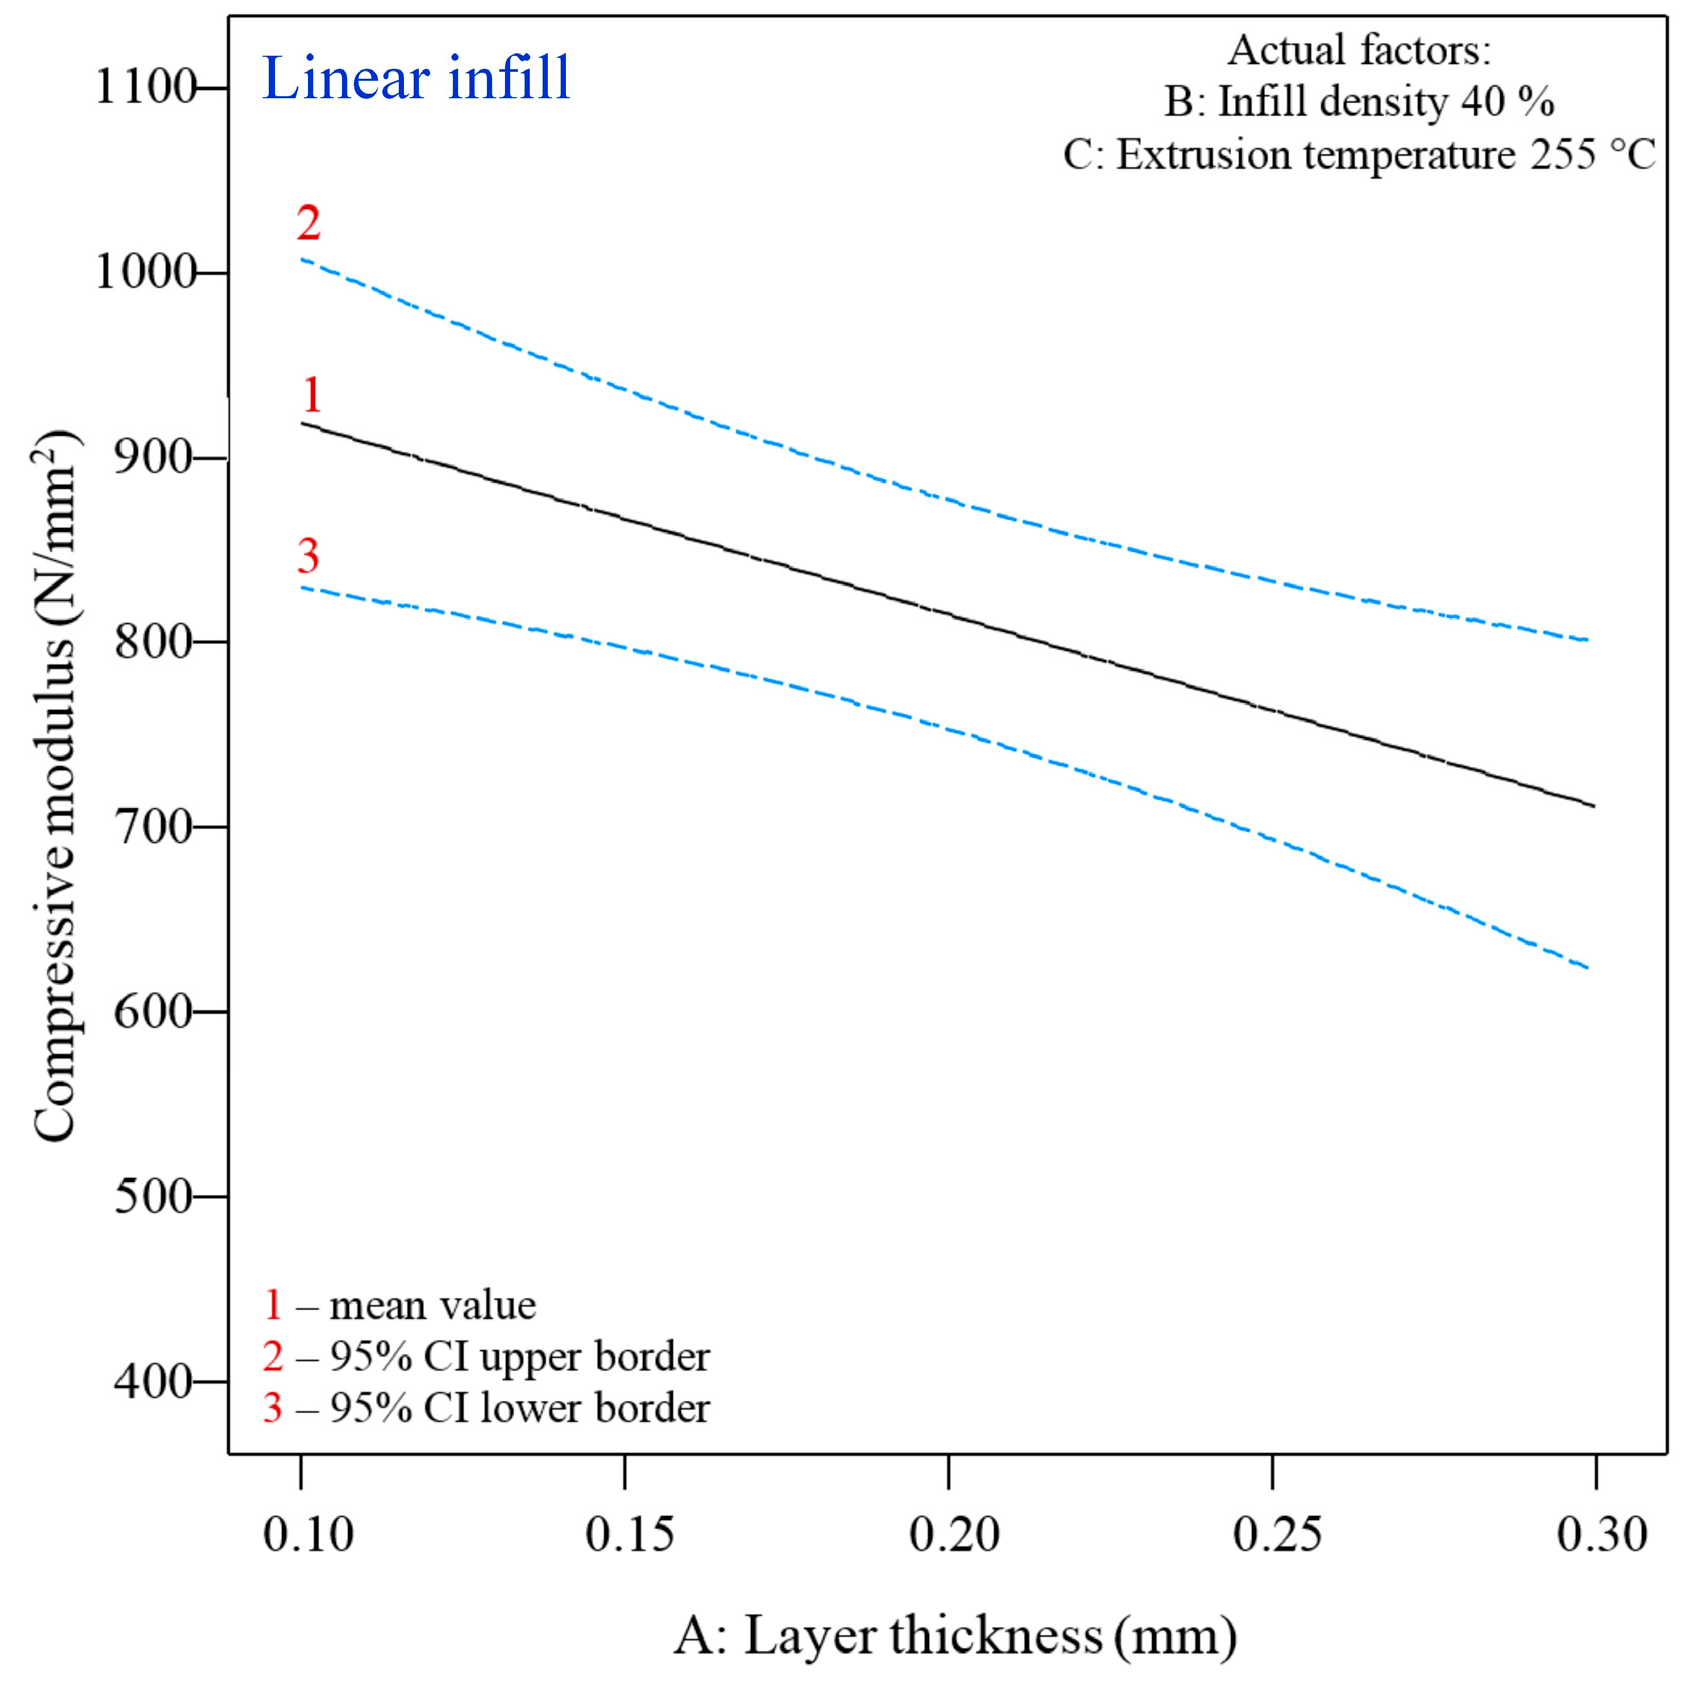
Figure 16 shows the influence of the individual parameters—layer thickness and density of the infill—on the compressive modulus of the specimens of the linear infill (L45). It can be seen from Figure 16 that an increase in the layer thickness leads to lower values of the compressive modulus of about 200 N/mm2. At a layer thickness of 0.10 mm, the maximum value of the compressive modulus is 920 N/mm2, while at a layer thickness of 0.30 mm, it is 720 N/mm2. It can be seen in Figure 17 that the increase in the infill density has an influence on the increase in the compressive modulus. Starting from the minimum infill density of 10% and the maximum infill density of 40%, the values of the compressive modulus increase by about 240 N/mm2, from 680 N/mm2 to 920 N/mm2.
The statistical analysis shows that the infill density is still the most significant parameter for determining the compressive modulus of the specimens with the linear infill, as can be seen in Figure 18. An increase in the percentage of the infill density leads to a significant increase in the compressive modulus, while the thickness of the layer has the opposite, i.e., negative, influence on the compressive modulus, and its increase leads to a slight decrease in the value of the observed property.

3.2.2. Statistical Analysis of the Compressive Modulus—Honeycomb Infill (H)

The influence of the adjustable parameters of 3D printing on the printing modulus of the honeycomb infill was analyzed with a linear function. Table 10 shows the processing results for the compressive modulus of the honeycomb infill test specimens. From the table, it can be seen that all parameters are significant in this case: layer thickness (A), infill density (B), and extrusion temperature (C), as in the case of the compressive strength of the honeycomb infill. The mathematical model of the reaction surface (linear model) of the compressive modulus (Ec) can be presented in the form of Equation (4), with all factors in the coded form given in Table 10. Table 11 shows the basic statistical data of the model for the compressive modulus of the honeycomb infill.
Ec = 706.60 − 68.36 × A + 68.50 × B + 24.87 × C
In Equation (4), Ec denotes compressive modulus in N/mm2.
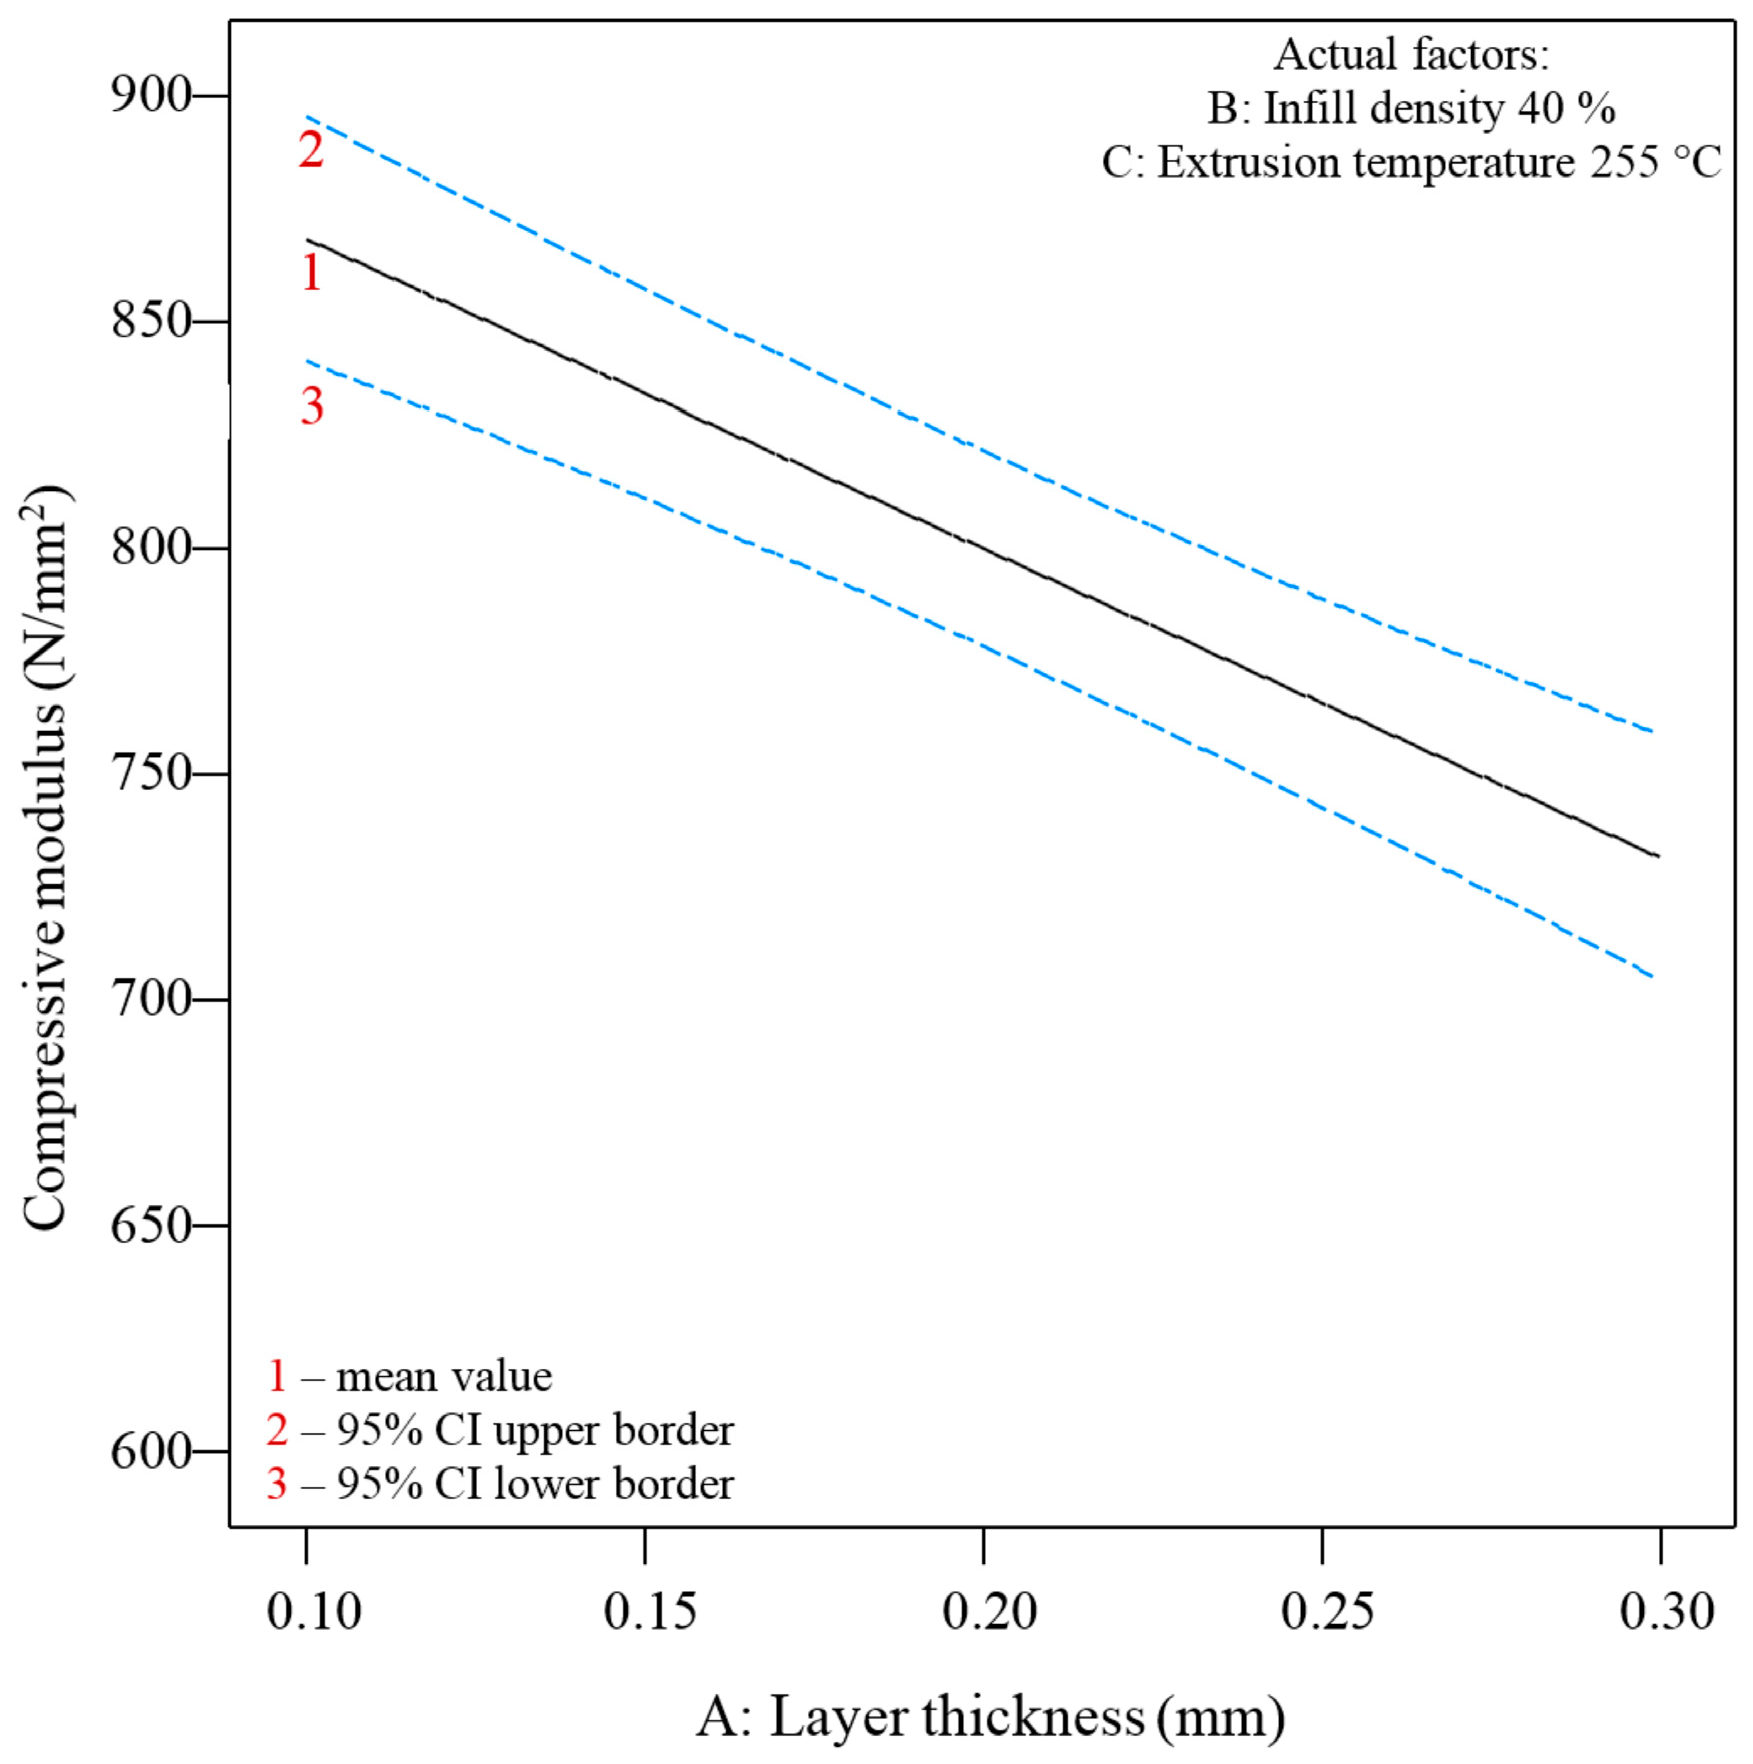
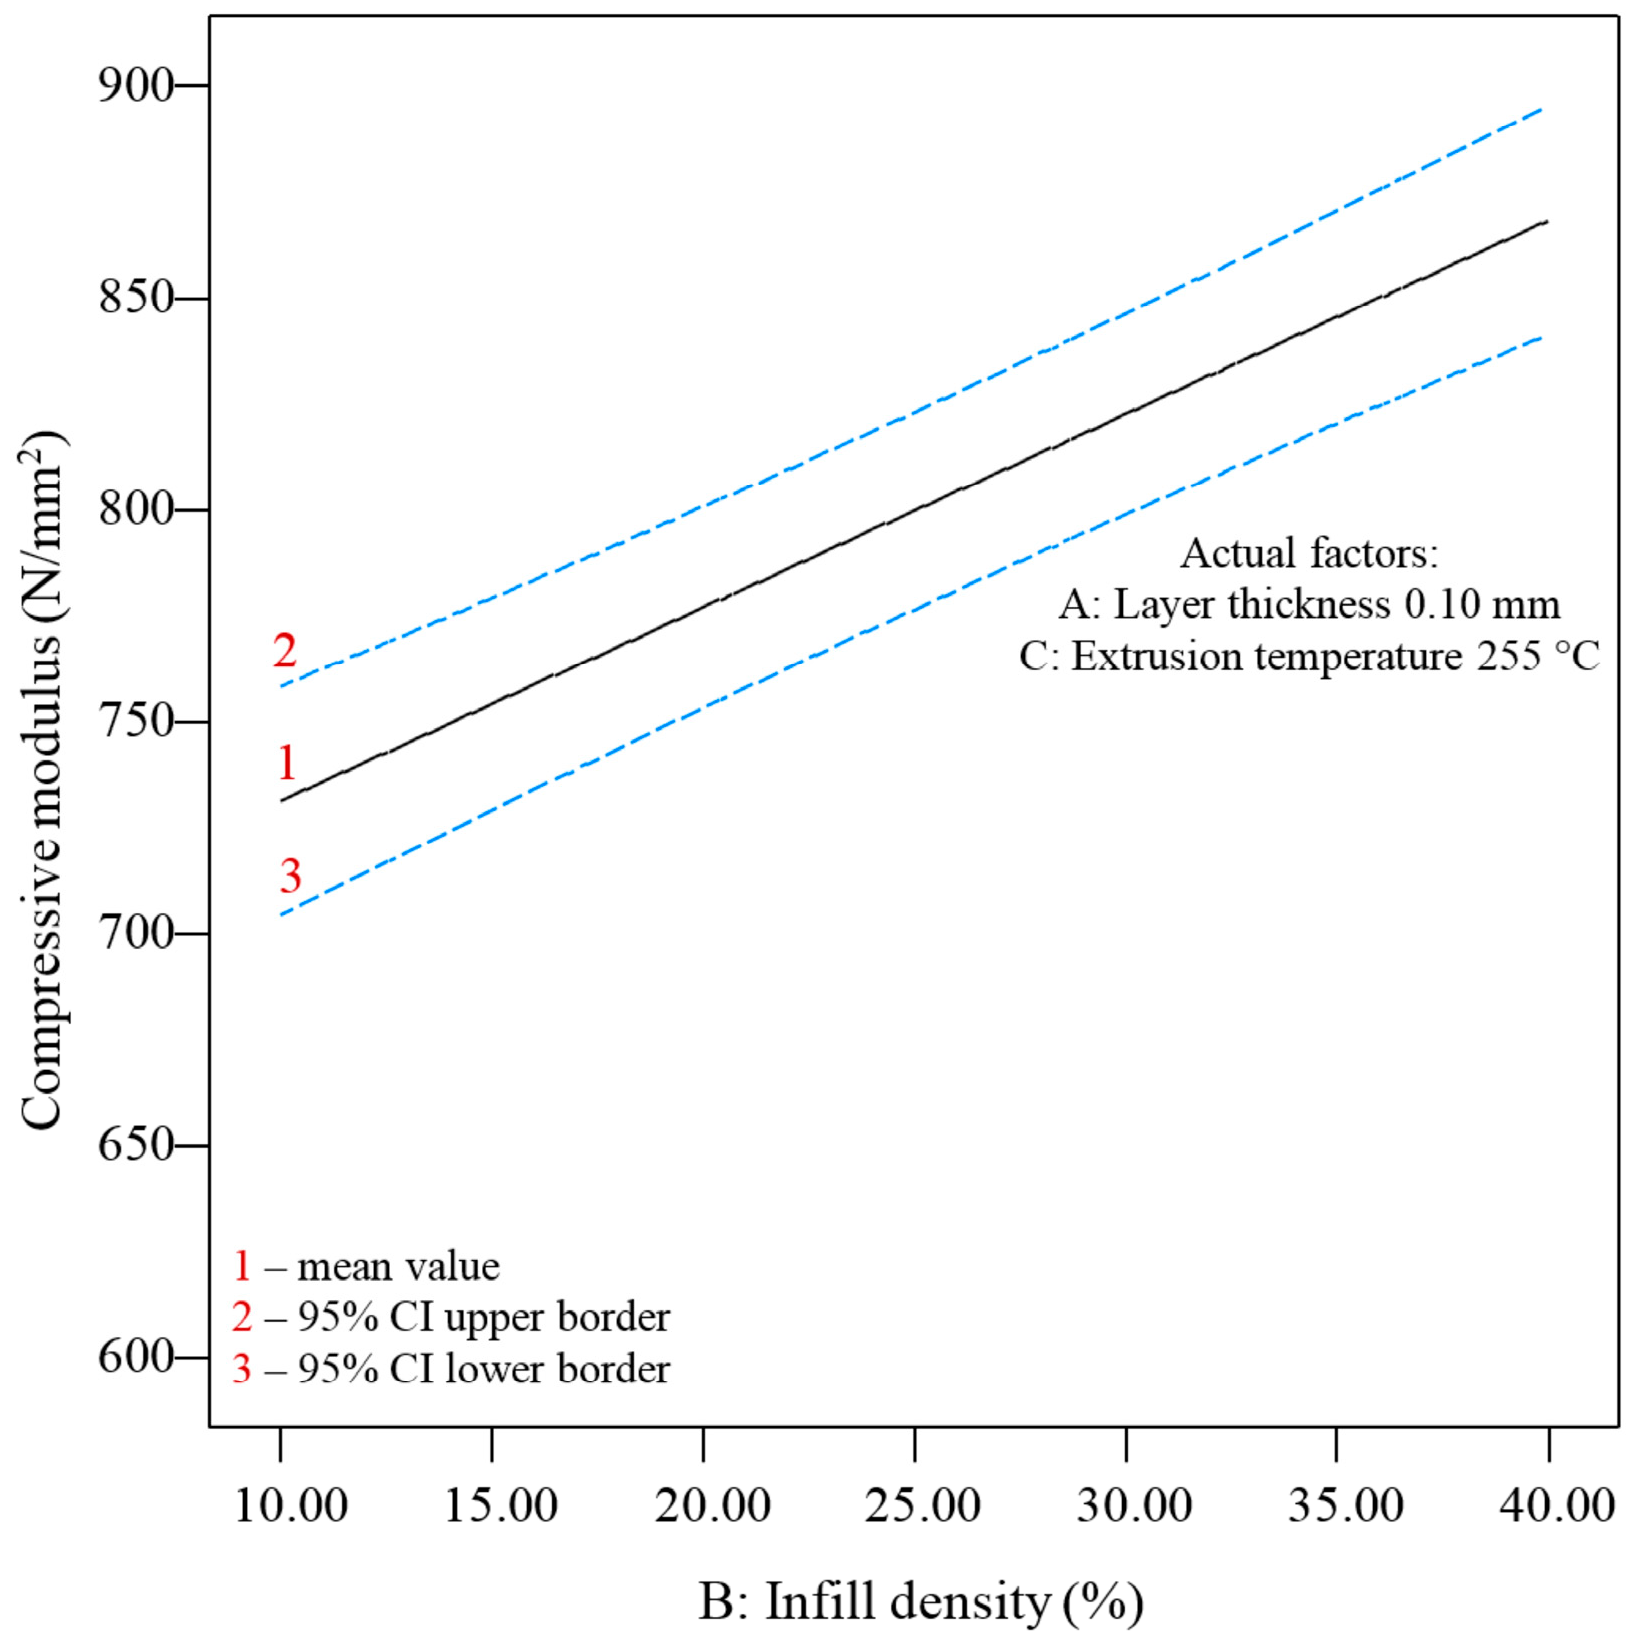
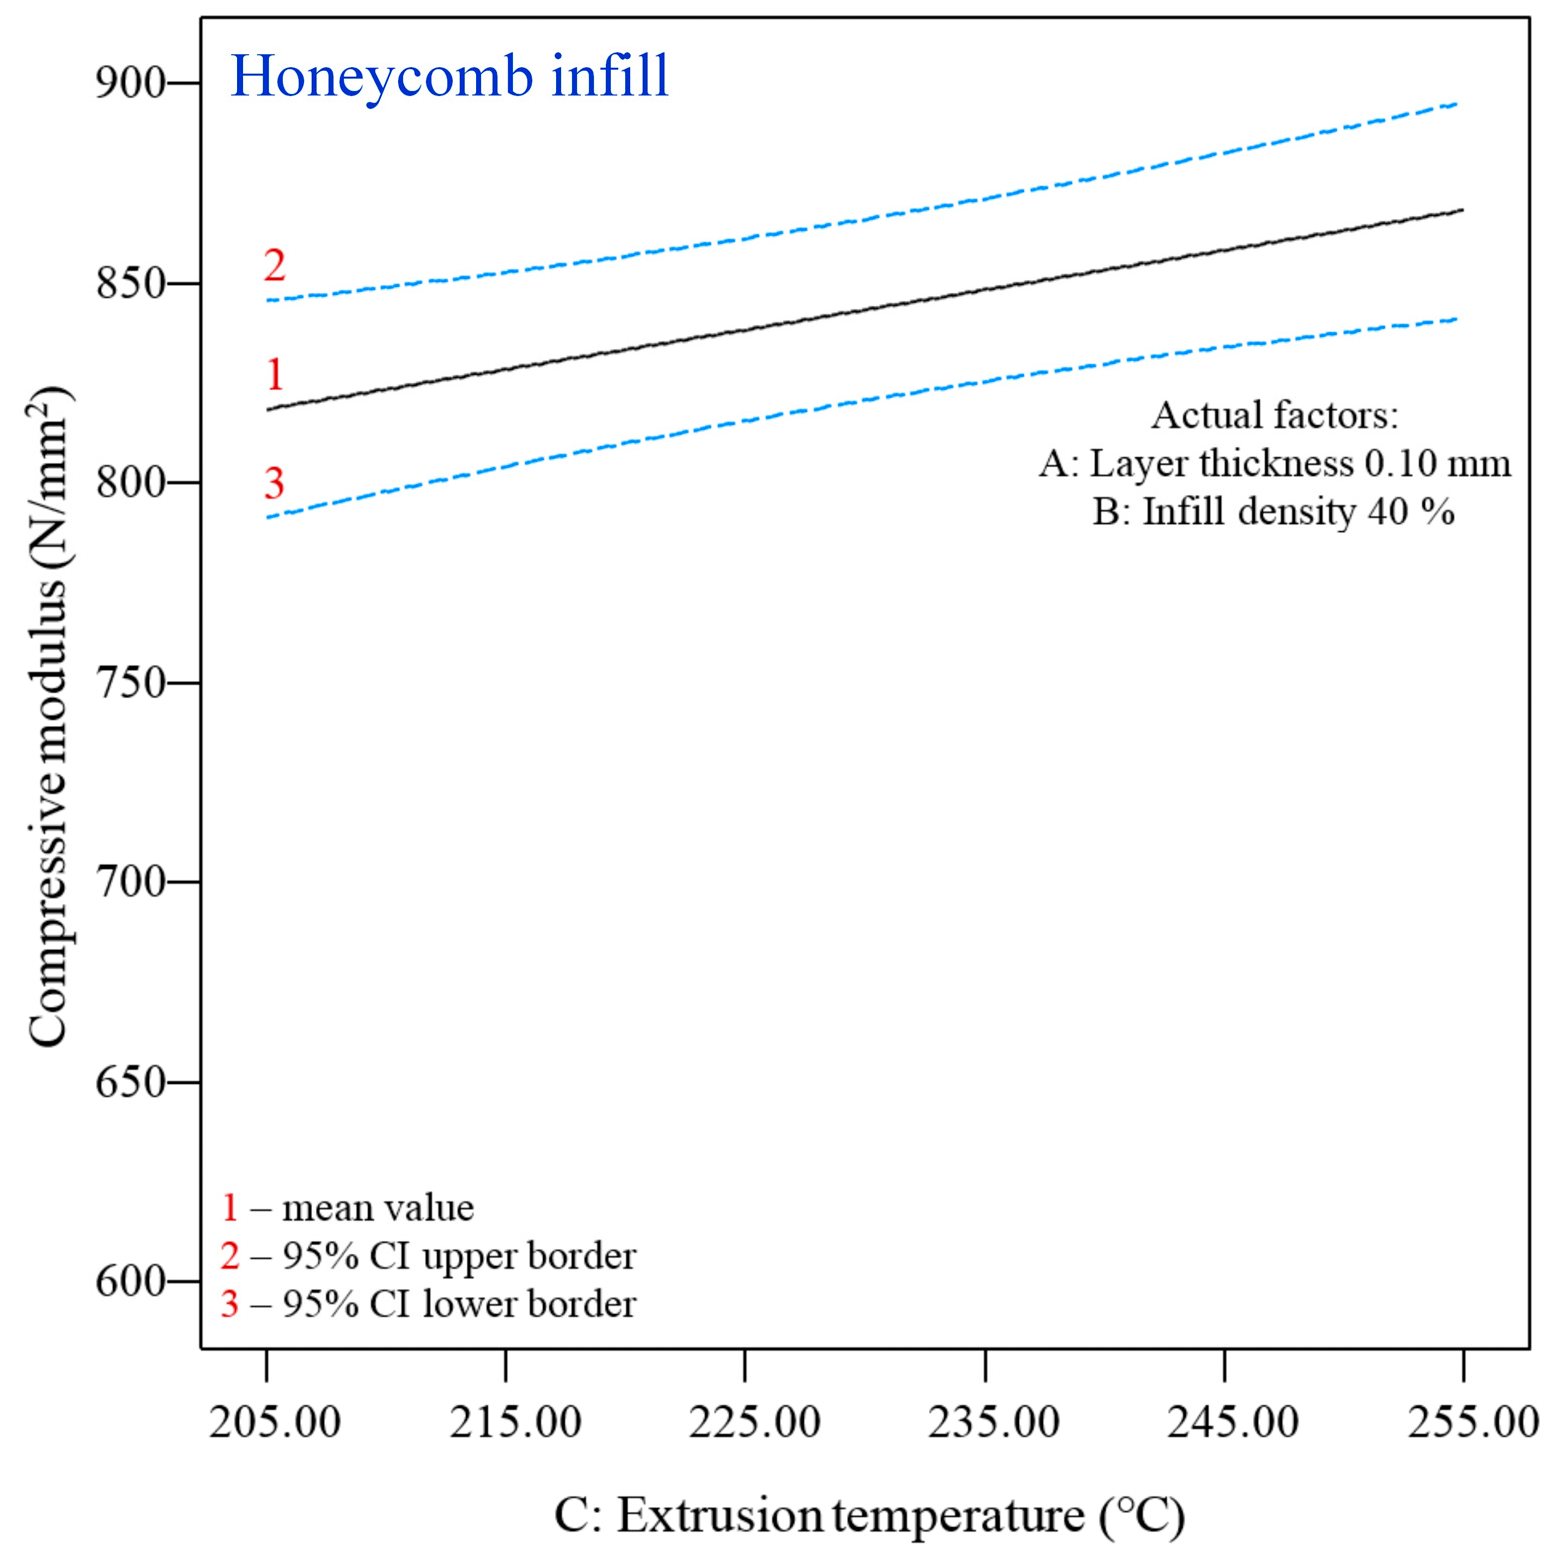
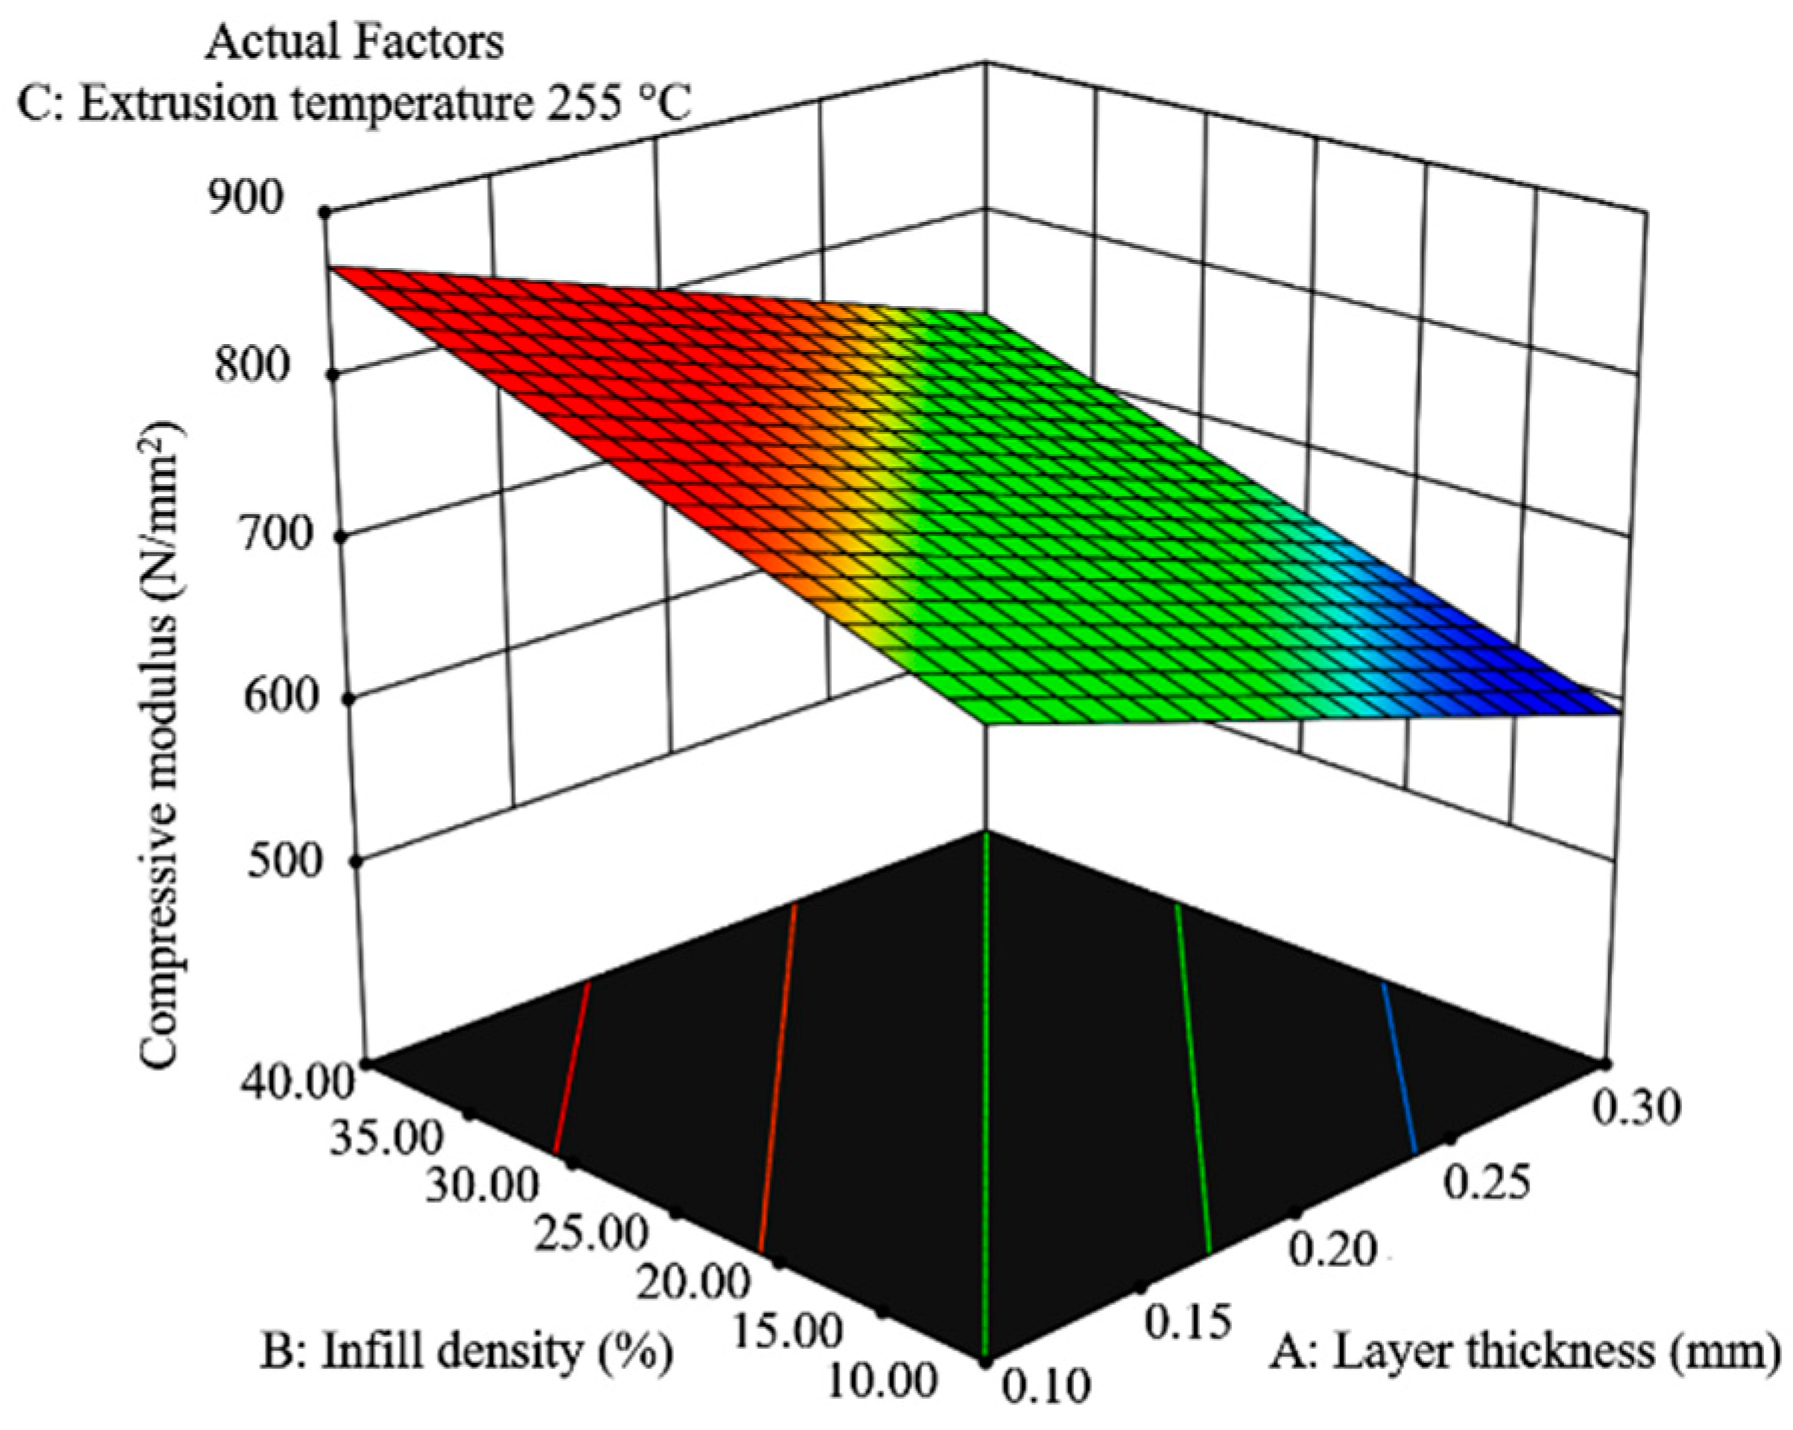
Figure 19, Figure 20 and Figure 21 show the influence of significant individual parameters of 3D printing on the compressive modulus for the honeycomb infill specimens. Figure 19 shows a decrease in the compressive modulus with increasing layer thickness, from 860 N/mm2 at a layer thickness of 0.10 mm to about 750 N/mm2 at a layer thickness of 0.30 mm (at the maximum infill density and extrusion temperature). The influence of the infill density (Figure 20) shows the opposite trend and reaches almost the same values of the compressive modulus (at an infill density of 10%, the compressive modulus is 750 N/mm2, and at an infill density of 40%, the compressive modulus is about 860 N/mm2 at the minimum layer thickness and maximum extrusion temperature). The influence of the extrusion temperature is somewhat lower (Figure 21), so its change from minimum to maximum causes a slight increase in the compressive modulus (from about 810 N/mm2 to about 860 N/mm2 at the minimum layer thickness and maximum infill density).
Figure 22 and Figure 23 show the effects of the infill density and layer thickness on the compressive modulus of the honeycomb infill at the minimum (205 °C) and maximum (255 °C) temperatures. In both cases, the infill density influences the increase in the compressive strength. The influence of the layer thickness shows the opposite trend, i.e., a slight decrease in the compressive strength value when the layer thickness is increased from 0.10 to 0.30 mm. It can be seen that in this case, although the response surfaces are almost identical, the temperature increase from 205 °C (Figure 22) to 255 °C (Figure 23) also leads to increased values of the compressive modulus, from 810 to 860 N/mm2. The same applies to the compressive strength of the honeycomb infill specimens.

3.3. Statistical Model for Optimization

In order to define the FDM parameters for the production of test specimens with optimal properties, it is necessary to determine the optimization criteria. In this case, a complex optimization was performed using data that include defined ranges of adjustable processing parameters (listed in Section 2), requirements for target values of specimen properties, and criteria for reaching the maximum values, as well as the importance of individual properties. Table 12 shows the limits of the expected compressive properties that were defined based on the results of the ANOVA that was performed previously, as described in Section 3.1 and Section 3.2.
The complex optimization in the case of test specimens with the linear infill (L45) led to 27 solutions for which the desirability function is 0.95, and three characteristic solutions are listed in Table 13.
The complex optimization in the case of test specimens with the honeycomb infill resulted in 25 solutions for which the desirability function is between 0.76 and 0.36, and three characteristic solutions are listed in Table 14.
From the solutions of the complex optimization of the test specimens of the linear infill (L45) and honeycomb infill (Table 13 and Table 14), it can be seen that the optimal printing properties are achieved at a layer thickness of 0.10 mm and an infill density of 40% for both infill types and an extrusion temperature of 255 °C for the honeycomb infill, while for the linear infill (L45), the extrusion temperature varies between 210 °C and 255 °C. However, a comparison of the values of the individual properties (Table 13 and Table 14) shows that with almost identical 3D printing parameters, the values for the monitored properties of the compressive strength and compressive modulus of the test specimens of the linear infill (L45) are higher than those of the honeycomb infill.

3.4. Practical Application

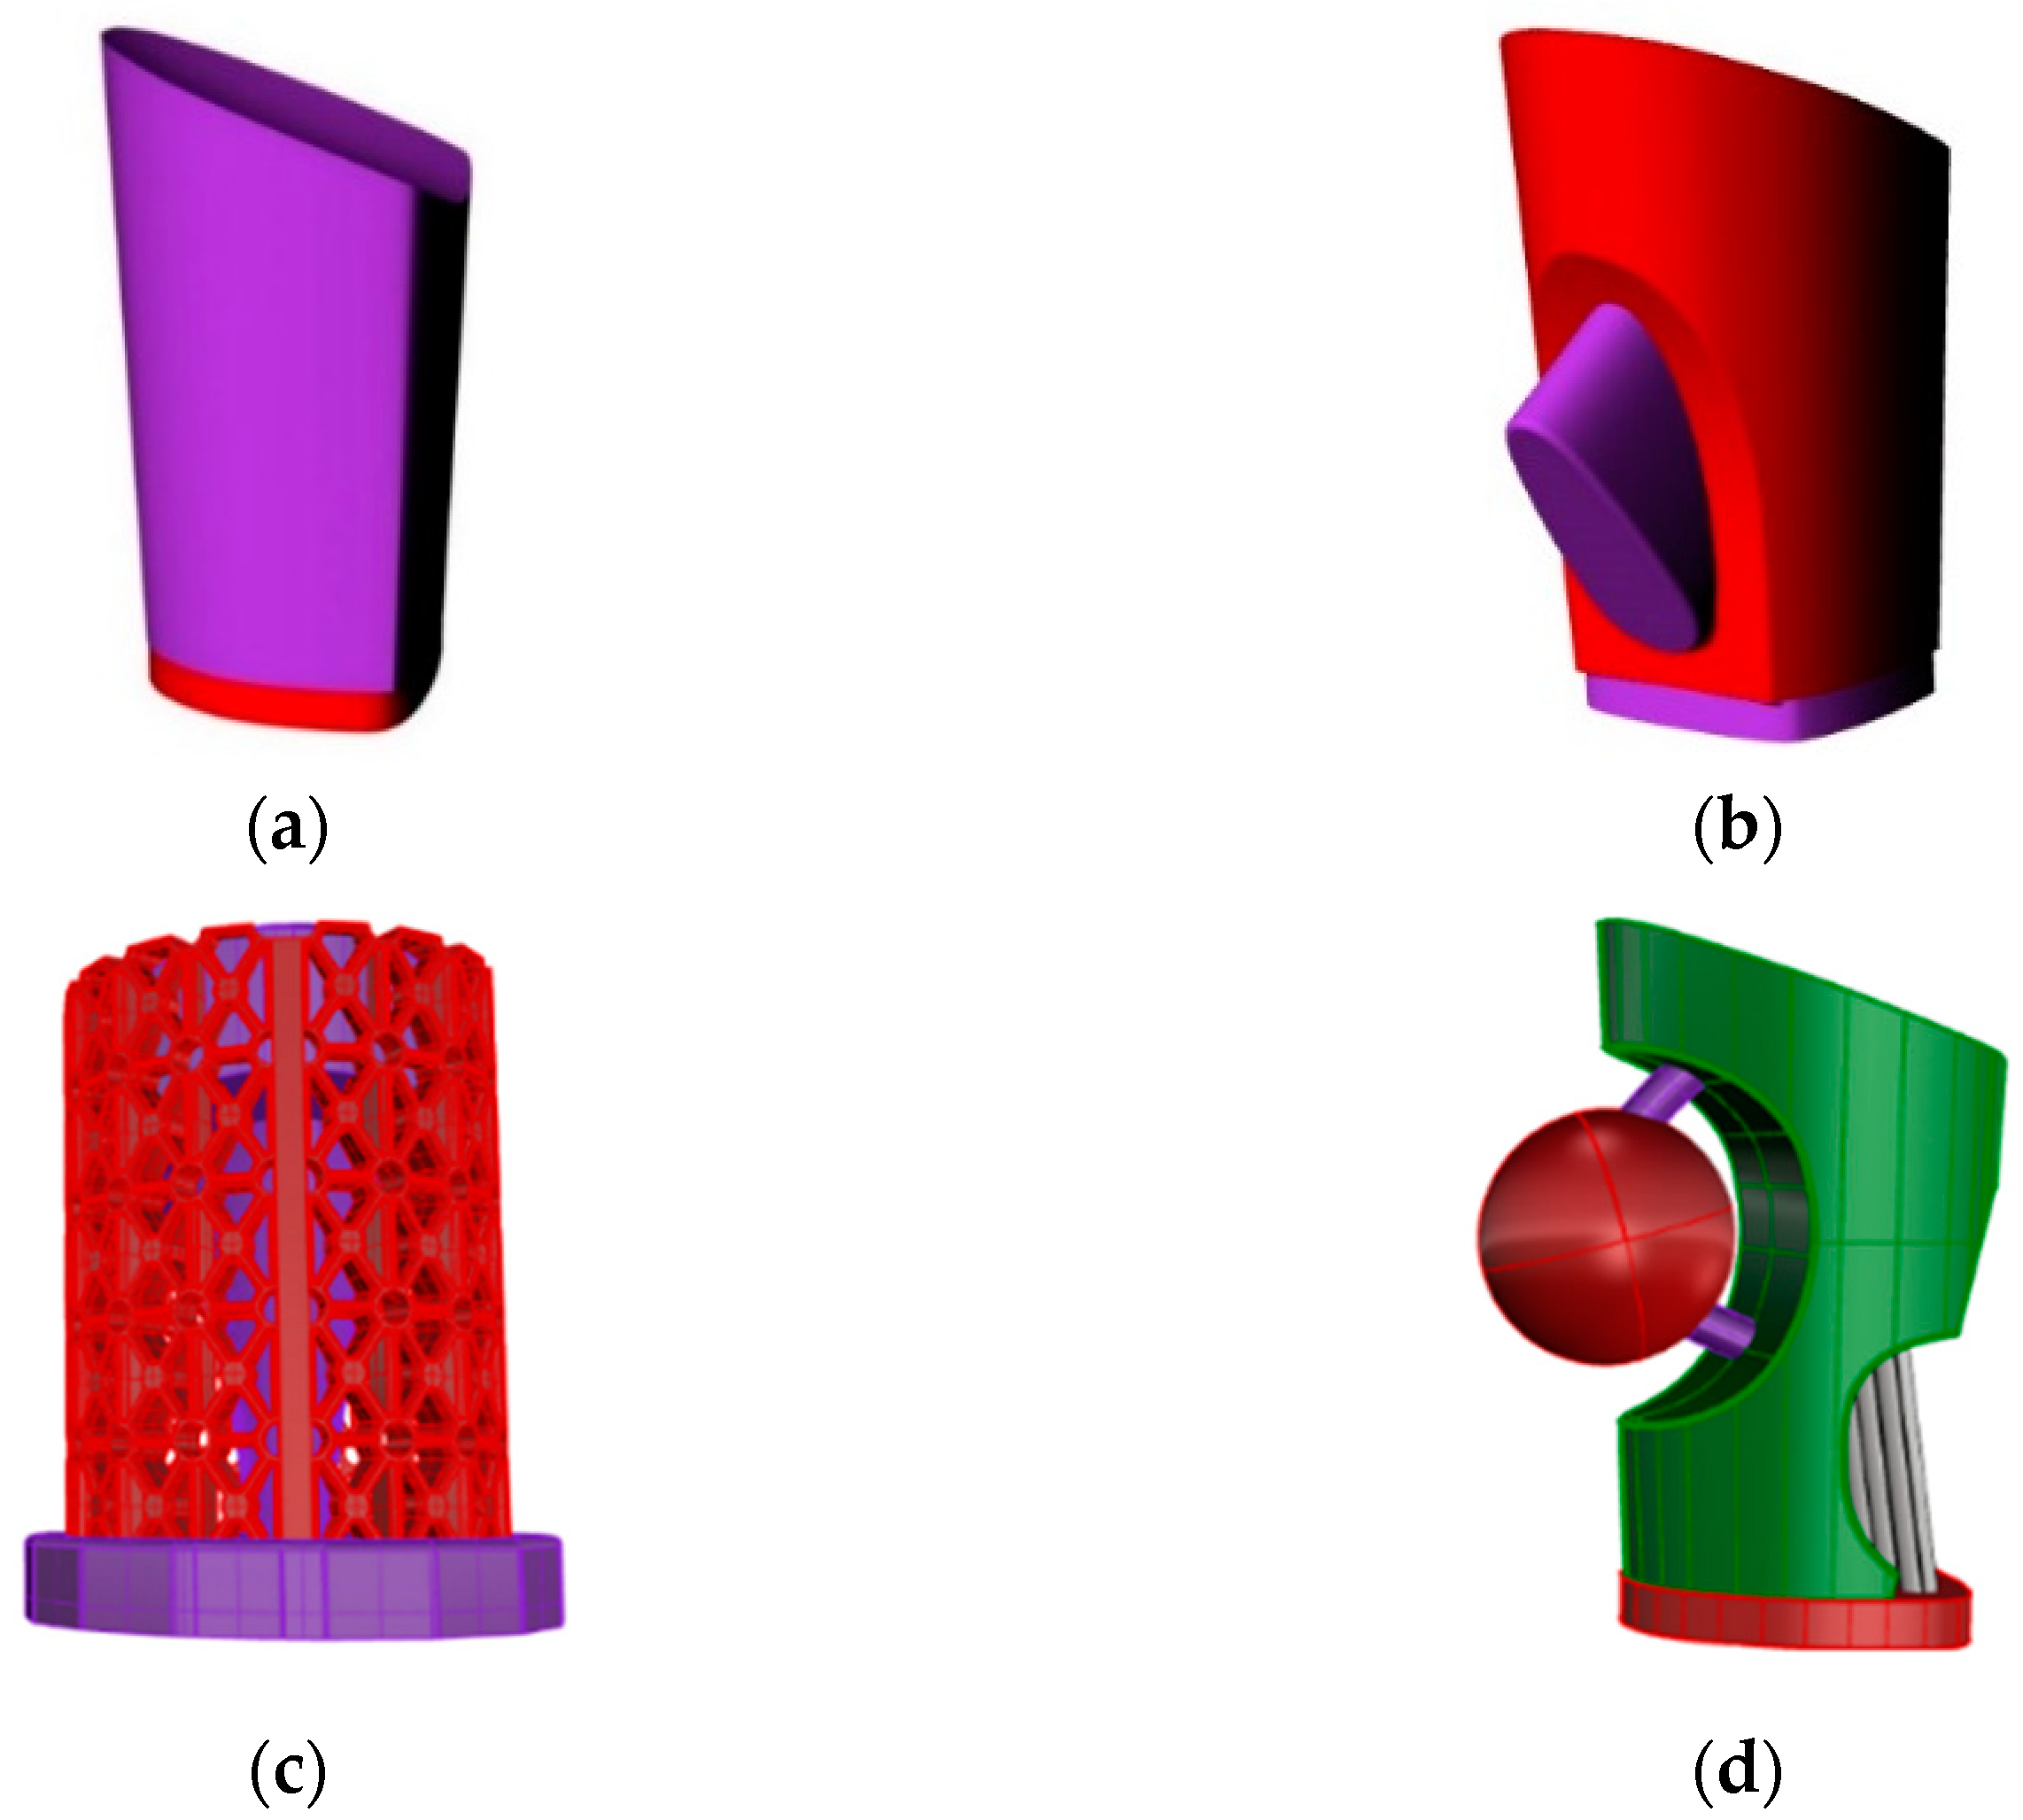
The industrial implementation of this scientific research was carried out in cooperation with the Croatian shoe factory Ivančica d.d. The integration of the prototype of 3D-printed ABS heels into a functional model of women’s shoes is combined with classic shoe production in the context of industrial shoe production. The aim of this combination is to create personalized models of wearable shoes or smaller limited series. For the construction of the CAD model of the heel prototype, the computer program Rhinoceros 5 was used, which is based on a scanned CAD model of a women’s shoe with a height of 75 mm (number 37) (Figure 24).
Based on the previously performed verification of the optimal parameters and an insight into the results of the complex optimization of the test specimens of the linear infill (L45) and honeycomb infill according to the criteria and target values (Table 12) set in accordance with the objective of the final application, the parameters of the 3D printing of the heel prototype were determined. After solving the complex optimization (Table 13 and Table 14), a layer thickness of the linear infill (L45) of 0.10 mm, an infill density of 40%, and an extrusion temperature of 210 °C were selected for the production of the heel prototypes.
Table 15 shows the printing parameters of the CAD models of the heel prototypes, which were determined based on the analysis of the tests performed.
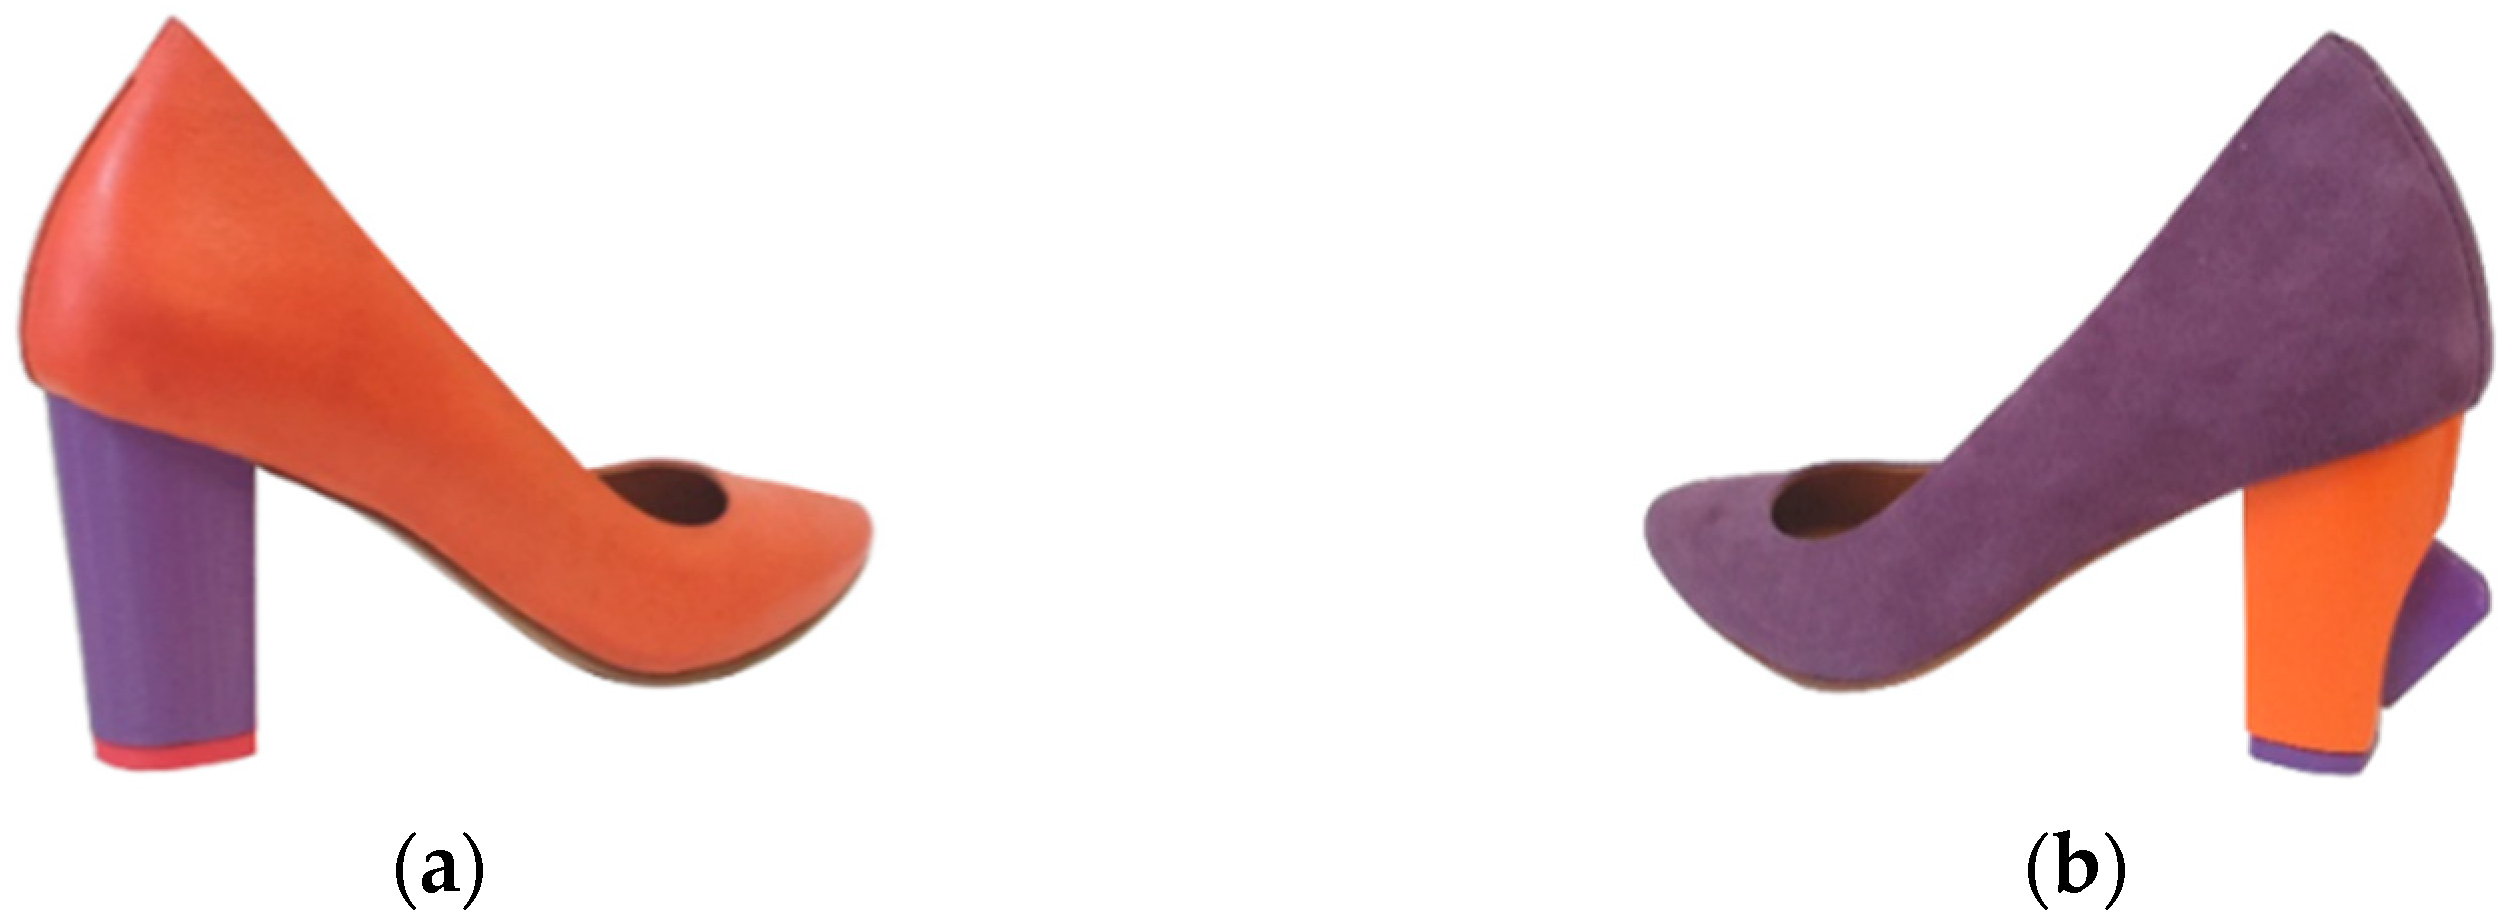
The heel prototypes were produced on a MakerBot Replicator 2X desktop printer in a two-color printing process using combinations of the available ABS colors. The vertical orientation of the print was determined in accordance with the actual orientation of the final product [61] and the central positioning on the work surface of the printer. Taking into account the selected parameters and printing orientation, the total estimated material consumption for printing the heel for prototype 1 is 65 g, and the time required for printing is 8.5 h; for prototype 2, the material consumption is 66 g, and the production time is 9.5 h. The material consumption for prototype 3 is 98 g, and the production time is 13.55 h, while prototype 4 requires 57 g of material, and the production time is 7.9 h. For the functional models of women’s shoes, the installation of prototype heels made of ABS was combined with the help of 3D printing in the industrial production of shoes (Figure 25). This approach aims to create personalized models of wearable shoes or smaller limited series. To underline the use of new technologies (3D printing) in combination with traditional methods of shoe production, contrasting colors were chosen for the material of the upper part compared to the heels. The upper part of the prototype is based on a proven model of the classic women’s salon shoe, ergonomically designed according to the rules and requirements of shoemaking. They are made of leather, which is still considered one of the most valuable and high-quality materials for shoemaking [61].
The successful realization of the prototypes shows that the heights of the 3D-printed heels and the geometry of the top of the prototype heels were accurately modeled and, thus, meet both the technical and aesthetic requirements of the assembly of heels with classic shanks under industrial production conditions. It was also found that ABS, as one of the most commonly used materials in the FDM process, can be functionally used for the production of prototypes and individual elements of the shoe bottom, i.e., in this work, for the high heels of women’s shoes.

4. Discussion

The results of the analysis of the influence of the adjustable 3D printing parameters on the observed mechanical properties are shown in Section 3.1 and Section 3.2 (Table 4, Table 6, Table 8 and Table 10). As the density of the infill increases, the observed compressive properties of both infill types increase, which was to be expected, as this increases the effective cross-sectional area that absorbs the loads to which the specimens were subjected during testing. The results of the dependence of the compressive strength on the infill density are consistent with the results of the studies by Oudah et al. [25] and Dominguez-Rodriguez et al. [26], in which the influence of 3D printing parameters for ABS similar to those in this work is observed. Oudah et al. investigated the influence of printing parameters such as the infill pattern (tri-hexagon, zig-zag and gyroid), infill density (25%, 50%, and 75%), and layer thickness (0.1, 0.2, and 0.3 mm) on the compressive strength of ABS material [25], and Dominguez-Rodriguez et al. analyzed the influence of the print orientation, infill density, and infill pattern on compressive performance [26]. The results of both studies show that an increase in infill density leads to higher compressive strengths, which is consistent with the results of the present study.
The thickness of the 3D-printed layer can be evaluated as the next influential parameter. Increasing the layer thickness leads to a decrease in the observed compressive properties. Increasing the layer thickness has a significant effect on the decrease in the compressive properties of the honeycomb specimens (visible in Figure 11 and Figure 19), while there is a smaller decrease in the observed properties for the linear infill (L45) (visible in Figure 8 and Figure 16). By reducing the layer thickness during 3D printing, a better bond between the layers is achieved, which leads to better mechanical properties. Therefore, the specimens with a thinner layer thickness have better adhesion and better mechanical properties than the test specimens with a thicker layer thickness.
The results of the influence of layer thickness in this study are in contrast to the results of the above-mentioned study by Oudah et al. [25], who investigated the same parameters (infill density and layer thickness) but different infill patterns for a compression test according to the ASTM D695 standard. Oudah et al. reported a layer thickness of 0.3 mm, an infill density of 75%, and a gyroid infill as the optimal process parameters for achieving higher compressive strength values and concluded that the compressive strength increases with increasing layer thickness [25].
However, the results mentioned in [25] are in contrast to those of a study by Ali et al. [30] that was carried out with almost identical parameters: infill density (20%, 40%, 60%), infill pattern (zig-zag, cross, gyro), and layer thickness (0.05, 0.15, and 0.25 mm). The results of the study by Ali et al. [30] on the tensile and compressive properties according to the ASTM D638 and ASTM D695 standards show that increasing the layer thickness has a negative influence on the observed mechanical properties, which is consistent with our results. This is also consistent with the results on the influence of the layer thickness of 3D printing on the compressive strength in the studies by Vidakis et al. [29], Ali et al. [30], and Banjanin et al. [33].
The least influential parameter of 3D printing on the observed printing properties is the extrusion temperature. For the honeycomb infill test specimens, the extrusion temperature was significant for the compressive strength and compressive modulus, while it had no effect on the observed properties for the linear infill (L45) test specimens. For the honeycomb test specimens, a higher temperature also led to a slight increase in the compressive strength and compressive modulus (visible in Figure 13 and Figure 21), which can be explained by the better mutual adhesion of the printed layers at higher temperatures.
For the honeycomb test specimens, a higher temperature also led to a slight increase in the compressive strength and compressive modulus (visible in Figure 13 and Figure 21), which can be explained by the better mutual adhesion of the printed layers at higher temperatures.
The effect of the extrusion temperature, although considered one of the most critical parameters for the quality of 3D-printed products in the FDM process, is, therefore, a relatively unexplored aspect and one of the possible reasons for the opposite results compared to the results of available research [4]. It has also been found that the extrusion temperature affects the quality of printing of ABS products in the FDM process on desktop 3D printers, which is explained by the fact that an inhomogeneous temperature distribution is caused by the heated extrusion temperature [62].
When comparing the maximum achievable values (ANOVA) according to the response surfaces, the compressive strength values for the L45 infill are higher both in the statistical evaluation and in the evaluation of the results from the tests that were carried out. Therefore, the overall mean value of the compressive strength of the test specimens of the linear infill (L45) is 3.4% higher than for the honeycomb infill. For the maximum values of the modulus, a higher mean value of the compressive modulus (by 1.4%) is determined for the honeycomb infill test specimens by comparing the mean values of the results of all test conditions of the linear infill (L45) and the honeycomb infill. All of the above results prove that there is also an interaction between the shape/type of infill and the parameters of the infill, as there are different results for the same observed property (e.g., compressive modulus). For the compressive modulus, both infills give comparable results, where the shape of the infill that gives the maximum achievable value of the observed property does not necessarily lead to higher average values of the mechanical property in the observed range of adjustable 3D printing parameters. The above results are consistent with the study by Morocho et al. [31], who investigated the behavior of ABS polymer under mechanical compression while considering two different infill patterns, rectangular and hexagonal. Their results showed that the rectangular sample exhibited higher compressive strength.
It must be emphasized that the field of 3D printing with FDM desktop printers is still incompletely researched and that it is difficult to draw general conclusions, as many authors come to significantly different and even opposite results in similar studies. The authors found inconsistencies in the results due to differences in material quality (identical polymers from different manufacturers), 3D printing conditions (ambient temperature and humidity), storage conditions of the samples until testing, and even different times between 3D printing and testing [4]. Kuznetsov et al. [13] also investigated the influence of hardware settings and 3D printing process parameters on the resulting strength of a PLA sample and found differences in the results when they tested identical 3D printing parameters with the same brand and color of polymer on five different FFF 3D desktop printers. In addition, authors use different standards in their studies, which further complicates the comparability of the test results.
As a conclusion of the obtained results—the same was pointed out by Spahiu et al. [63] and Mallakpour et al. [64]— production in the footwear industry is still based on human labor, and only recently in the field of industrialization as part of the Fourth Industrial Revolution have technological possibilities or the main pillars of Industry 4.0 shown that they have great impact on footwear production. Reducing production costs, cutting down waste material or zero-waste production, higher time and labor efficiency, the possibility of producing customized shoes in small batches, more flexibility in design, and applying more sophisticated materials in different colors are some of the benefits offered by additive manufacturing. The continuation of optimized production was given by Gelaziene et al. in [65], where they confirmed that additive manufacturing has the possibilities for the modern optimization of the provision of custom-made footwear for patients with foot deformities. Heels produced with fused deposition modeling with ABS material are on a par with the production of heels with compressive properties similar to those that can be obtained with other additive processes, such as selective laser sintering (SLS) with polyamide and stereolithography (SLA) with photopolymers.
In the entire product development process, each step contributes to sustainable production, and in the end, additive manufacturing contributes to the production of a sustainable product.
The best comparison for the obtained results is found in [25,30], as shown in Table 16. All tests listed in Table 16 were performed according to the ASTMD695 standard.

5. Conclusions

In this paper, the effects of three parameters of the FDM process (layer thickness, infill density, extrusion temperature) and the infill geometry (linear infill (L45) and honeycomb infill) on the compressive properties (compressive strength and compressive modulus) of ABS test specimens are presented. A central composite design with three parameters was used to analyze the effects. The influences of the selected FDM parameters showed that the infill density was the most significant factor for the observed compressive properties, regardless of the layer thickness. In general, the linear infill resulted in slightly higher properties than the honeycomb infill, but the differences are very small, so it can be concluded that both types of infills lead to satisfactory properties. The layer thickness is also an influential parameter that generally has a negative effect on the observed compressive properties of both infill types as it increases. The extrusion temperature had a positive influence on the observed compressive properties of the honeycomb infill test specimens, while it was not an influencing factor for the linear infill. From the analysis of the test results, it can be concluded that the linear infill (L45) resulted in 3.4% higher compressive strength. As far as the observed compressive modulus properties are concerned, the results of the linear infill (L45) are 1.6% lower than those of the honeycomb infill. Analyzing all of the data, it can be concluded that the test specimens with the linear infill (L45) have slightly better compressive properties. If the desired product or prototype must fulfill the highest values of printing properties, it is recommended to manufacture products with the linear infill (L45).
The realized prototypes of 3D-printed ABS heels were combined with classical methods of industrial production for functional prototypes of women’s salon shoes. In this way, a scientific contribution was made fusing advanced technologies in the development and production of small series of 3D prototypes of shoe parts or personalized shoe models in the context of industrial shoe production.
In further studies, the influence of other printing parameters (screen angle, orientation of the print on the work surface in the direction of the x, y, and z axes, etc.) that are characteristic of the FDM process for ABS products must be determined.
With the aim of improving the application of 3D printing in shoemaking, testing methods for heels will be developed to test the resistance to rear impact and the strength of the realized 3D prototypes of heels when built into a functional model of a women’s shoe and compare them with the results obtained when testing the printing properties of test specimens on the target product, high heels of women’s shoes.

Author Contributions

Conceptualization, D.G. and A.P.; methodology, D.G. and A.P.; software, D.G., A.P. and S.K.-M.; validation, S.K.-M. and D.G.; formal analysis, D.G.; investigation, S.K.-M. and A.S.; resources, S.K.-M. and A.S.; data curation, S.K.-M.; writing—original draft preparation, S.K.-M.; writing—review and editing, D.G., A.P. and A.S.; visualization, S.K.-M. and D.G.; supervision, D.G. and A.P. All authors have read and agreed to the published version of the manuscript.

Funding

As part of project ADVANCETEX, Croatian Science Foundation paid for the procurement of materials.

Data Availability Statement

The data presented in this study are available upon request from the corresponding author.

Acknowledgments

The Croatian Science Foundation has supported this work under the project “Advanced textile materials by targeted surface modifications” (ADVANCETEX) (Bischof, Sandra, HRZZIP- 2013-11); Authors want to thanks Shoe factory Ivančica d. d., Ivanec, Croatia for fabrication of the shoes with printed heels from this paper.

Conflicts of Interest

The authors declare no conflicts of interest.

References

  1. Matias, E.; Rao, B. 3D printing: On its historical evolution and the implications for business. In Proceedings of the PICMET 2015: Management of the Technology Age, Portland International Center for Management of Engineering and Technology, Portland, OR, USA, 2–6 August 2015; pp. 551–558. [Google Scholar]
  2. Godec, D.; Pilipović, A.; Breški, T.; Ureña, J.; Jordá, O.; Martínez, M.; Gonzalez-Gutierrez, J.; Schuschnigg, S.; Leoben, M.; Blasco, J.R.; et al. Introduction to Additive Manufacturing. In A Guide to Additive Manufacturing; Springer Tracts in Additive Manufacturing; Springer: Cham, Switzerland, 2022; pp. 1–44. Available online: https://link.springer.com/book/10.1007/978-3-031-05863-9 (accessed on 10 May 2023).
  3. Rigon, D.; Ricotta, M.; Meneghetti, G. A literature survey on structural integrity of 3D printed virgin and recycled ABS and PP compounds. Sci. Procedia Struct. Integr. 2020, 28, 1655–1663. [Google Scholar]
  4. Bakır, A.A.; Atik, R.; Özerinç, S. Mechanical properties of thermoplastic parts produced by fused deposition modeling: A review. Rapid Prototyp. J. 2021, 27, 537–561. [Google Scholar] [CrossRef]
  5. Liu, W.; Liu, X.; Liu, Y.; Wang, J.; Evans, S.; Yang, M. Unpacking Additive Manufacturing Challenges and Opportunities in Moving towards Sustainability: An Exploratory Study. Sustainability 2023, 15, 3827. [Google Scholar] [CrossRef]
  6. Agnusdei, L.; Del Prete, A. Additive manufacturing for sustainability: A systematic literature review. Sustain. Futures 2022, 4, 100098. [Google Scholar] [CrossRef]
  7. Jandyal, A.; Chaturvedi, I.; Wazir, I.; Raina, A.; Haq, M.I.U. 3D printing—A review of processes, materials and applications in industry 4.0. Sustain. Oper. Comput. 2022, 3, 33–42. [Google Scholar] [CrossRef]
  8. Cuan-Urquizo, E.; Eduardo Barocio, E.; Tejada-Ortigoza, V.; Pipes, R.B.; Rodriguez, C.A.; Roman-Flores, A. Characterization of the Mechanical Properties of FFF Structures and Materials: A Review on the Experimental, Computational and Theoretical Approaches. Materials 2019, 12, 895. [Google Scholar] [CrossRef] [PubMed]
  9. Attoye, S.; Malekipur, E.; El-Mounary, H. Correlation between process parameters and mechanical properties in parts printed by the fused deposition modeling process. Mech. Addit. Adv. Manuf. 2019, 8, 35–41. [Google Scholar]
  10. Decuir, F.; Phelan, K.; Hollins, B. Mechanical Strength of 3-D Printed Filaments. In Proceedings of the 32nd Southern Biomedical Engineering Conference (SBEC), Shreveport, LA, USA, 11–13 March 2016. [Google Scholar] [CrossRef]
  11. Rankouhi, B.; Javadpour, S.; Delfanian, F.; Letcher, T. Failure Analysis and Mechanical Characterization of 3D Printed ABS With Respect to Layer Thickness and Orientation. J. Fail. Anal. Prev. 2016, 16, 467–481. [Google Scholar] [CrossRef]
  12. Savvakis, K.; Petousis, M.; Vairis, A.; Vidakis, N.; Bikmeye, A.T. Experimental Determination of the Tensile Strength of Fused Deposition Modeling Parts. In Proceedings of the ASME International Mechanical Engineering Congress and Exposition IMECE2014, Montreal, QC, Canada, 14–20 November 2014; pp. 1–6. [Google Scholar]
  13. Kuznetsov, V.E.; Tavitov, A.G.; Urzhumtsev, O.D.; Mikhalin, M.V.; Moiseev, A.I. Hardware Factors Influencing Strength of Parts Obtained by Fused Filament Fabrication. Polymers 2019, 11, 1870. [Google Scholar] [CrossRef] [PubMed]
  14. Travieso-Rodriguez, J.A.; Jerez-Mesa, R.; Jordi Llumà, J.; Traver, O. Mechanical properties of 3D-printing Polylactic acid parts subjected to bending stress and fatigue testing DOE-design of experiments ANOVA—Analysis of variance. Met. Spec. Issue Adv. Plast. Deform. Technol. 2019, 12, 3859. [Google Scholar]
  15. Padhi, S.K.; Sahu, R.K.; Mahapatra, S.S.; Das, H. Optimization of fused deposition modeling process parameters using a fuzzy inference system coupled with Taguchi philosophy. Adv. Manuf. 2017, 5, 231–242. [Google Scholar] [CrossRef]
  16. Oropallo, W.; Piegl, L.A. Ten challenges in 3D printing. Eng. Comput. 2016, 32, 135–148. [Google Scholar] [CrossRef]
  17. Sun, Q.; Rizvi, G.M.; Bellehumeur, C.T.; Gu, P. Effect of processing conditions on the bonding quality of FDM polymer filaments. Rapid Prototyp. J. 2008, 14, 72–80. [Google Scholar] [CrossRef]
  18. Travieso-Rodriguez, J.A.; Jerez-Mesa, R.; Lluma, J.; Gomez-Gras, G.; Casadesus, O. Comparative study of the flexural properties of ABS, PLA and a PLA–wood composite manufactured through fused filament fabrication. Rapid Prototyp. J. 2020, 27, 81–92. [Google Scholar] [CrossRef]
  19. Sagias, V.D.; Giannakopoulos, K.I.; Stergiou, C. Mechanical properties of 3D printed polymer specimens. Procedia Struct. Integr. 2018, 10, 85–90. [Google Scholar] [CrossRef]
  20. Chaco’n, J.M.; Caminero, M.A.; Garc´ıa-Plaza, E.; Núnez, P.J. Additive manufacturing of PLA structures using fused deposition modelling: Effect of process parameters on mechanical properties and their optimal selection. Mater. Des. 2017, 24, 143–157. [Google Scholar] [CrossRef]
  21. Li, H.; Wang, T.; Sun, J.; Yu, Z. The effect of process parameters in fused deposition modelling on bonding degree and mechanical properties. Rapid Prototyp. J. 2018, 24, 80–92. [Google Scholar] [CrossRef]
  22. Zandi, M.D.; Jerez-Mesa, R.; Lluma-Fuentes, J.; Jorba-Peiro, J.; Travieso-Rodriguez, J.A. Study of the manufacturing process effects of fused filament fabrication and injection molding on tensile properties of composite PLA-wood parts. Int. J. Adv. Manuf. Technol. 2020, 108, 1725–1735. [Google Scholar] [CrossRef]
  23. Saniman, M.N.F.; Hashim, M.H.M.; Mohammad, K.A.; Abd Wahid, K.A.; Wan Muhamad, W.M.; Noor Mohamed, N.H. Tensile Characteristics of Low Density Infill Patterns for Mass Reduction of 3D Printed Polylactic Parts. Int. J. Automot. Mech. Eng. 2020, 17, 7927–7934. [Google Scholar] [CrossRef]
  24. Wu, W.; Geng, P.; Li, G.; Zhao, D.; Zhang, H.; Zhao, J. Influence of Layer Thickness and Raster Angle on the Mechanical Properties of 3D-Printed PEEK and a Comparative Mechanical Study between PEEK and ABS. Materials 2015, 8, 5834–5846. [Google Scholar] [CrossRef]
  25. Oudah, S.; Al-Attraqchi, H.; Nassir, N. The Effect of Process Parameters on the Compression Property of Acrylonitrile Butadiene Styrene Produced by 3D Printer. Eng. Technol. J. 2022, 40, 89–194. [Google Scholar] [CrossRef]
  26. Dominguez-Rodriguez, G.; Ku-Herrera, J.J.; Hernandez-Perez, A. An assessment of the effect of printing orientation, density, and filler pattern on the compressive performance of 3D printed ABS structures by fuse deposition. Int. J. Adv. Manuf. Technol. 2018, 95, 1685–1695. [Google Scholar] [CrossRef]
  27. Uddin, M.S.; Sidek, M.F.R.; Faizal, M.A.; Ghomashchi, R.; Pramanik, A. Evaluating Mechanical Properties and Failure Mechanisms of Fused Deposition Modeling Acrylonitrile Butadiene Styrene Parts. ASME. J. Manuf. Sci. Eng. 2017, 139, 081018. [Google Scholar] [CrossRef]
  28. Sood, S.; Ohdar, R.; Mahapatra, S. Parametric appraisal of mechanical property of fused deposition modelling processed parts. Mater. Des. 2010, 31, 287–295. [Google Scholar] [CrossRef]
  29. Vidakis, N.; Petousis, M.; Vairis, A.; Savvakis, K.; Maniadi, A. On the compressive behavior of an FDM Steward Platform part. J. Comput. Des. Eng. 2017, 4, 339–346. [Google Scholar] [CrossRef]
  30. Ali, H.B.; Oleiwi, J.K.; Othman, F.M. Compressive and tensile properties of ABS material as a function of 3D printing process parameters. Rev. Des Compos. Et Des Matériaux Avancés-J. Compos. Adv. Mater. 2022, 32, 117–123. [Google Scholar] [CrossRef]
  31. Morocho, J.; Sánchez, A.C.; Singaña, M.; Donoso, C. Efect of the flling pattern on the compression strength of 3D printed objects using acrylonitrile butadiene styrene (ABS). Key Eng. Mater. 2020, 834, 115–119. [Google Scholar] [CrossRef]
  32. Petousis, M.; Vidakis, N.; Mountakis, N.; Karapidakis, E.; Moutsopoulou, A. Compressive response versus power consumption of acrylonitrile butadiene styrene in material extrusion additive manufacturing: The impact of seven critical control parameters. Int. J. Adv. Manuf. Technol. 2023, 126, 1233–1245. [Google Scholar] [CrossRef]
  33. Banjanin, B.; Vladic, G.; Pal, M.; Balos, S.; Dramicanin, M.; Rackov, M.; Knezevic, I. Consistency analysis of mechanical properties of elements produced by FDM additive manufacturing technology. Matéria (Rio J.) 2018, 23, e12250. [Google Scholar] [CrossRef]
  34. Equbal, A.; Sood, K.A.; Equbal, M.I.; Badruddin, I.A.; Khan, Z.A. RSM based investigation of compressive properties of FDM fabricated part. CIRP J. Manuf. Sci. Technol. 2021, 35, 701–714. [Google Scholar] [CrossRef]
  35. Ligon, S.C.; Liska, R.; Stampfl, J.; Gurr, M.; Mulhaupt, R. Polymers for 3D Printing and Customized Additive Manufacturing. Chem. Rev. 2017, 117, 10212–10290. [Google Scholar] [CrossRef]
  36. Selvamani, S.K.; Samykano, M.; Subramaniam, S.R.; Ngui, W.K.; Kadirgama, K.; Kanagaraj, G.; Idris, M.S. 3D Printing: Overview of ABS Evolvement. In Proceedings of the 3rd International Conference on Automotive Innovation Green Energy Vehicle, Kuantan, Malaysia, 25–26 July 2018; pp. 020041-1–020041-11. [Google Scholar]
  37. Mazzanti, V.; Malagutti, L.; Mollica, F. FDM 3D Printing of Polymers Containing Natural Fillers: A Review of their Mechanical Properties. Polymers 2019, 11, 1094. [Google Scholar] [CrossRef]
  38. Chohan, J.S.; Kumar, R.; Singh, T.B.; Singh, S.; Sharma, S.; Singh, J.; Mia, M.; Pimenov, D.Y.; Chattopadhyaya, S.; Dwivedi, S.P.; et al. Taguchi S/N and TOPSIS Based Optimization of Fused Deposition Modelling and Vapor Finishing Process for Manufacturing of ABS Plastic Parts. Materials 2020, 13, 5176. [Google Scholar] [CrossRef]
  39. Kulich, D.M.; Gaggar, S.K.; Lowry, V.; Stepien, R. Acrylonitrile–Butadiene–Styrene Polymers. In Encyclopedia of Polymer Science and Technology; John Wiley & Sons: Hoboken, NJ, USA, 2001; pp. 174–201. [Google Scholar]
  40. Ngo, T.D.; Kashani, A.; Imbalzano, G.; Nguyen, K.T.Q.; Hui, D. Additive manufacturing (3D printing): A review of materials, methods, applications and challenges. Compos. Part B Eng. 2018, 143, 172–196. [Google Scholar] [CrossRef]
  41. Kutnjak-Mravlinčić, S.; Bischof, S.; Sutlović, A. Application of additive technology in footwear design. In Proceedings of the 8th Central European Conference on Fiber-Grade Polymers, Chemical Fibers and Special Textiles, Zagreb, Croatia, 16–18 September 2015; Dekanić, T., Tarbuk, A., Eds.; University of Zagreb, Faculty of Textile Technology: Zagreb, Croatia, 2015; pp. 201–206. [Google Scholar]
  42. Vanderploeg, A.; Lee, S.E.; Mamp, M. The application of 3D printing technology in the fashion industry. Int. J. Fash. Des. Technol. Educ. 2017, 10, 170–179. [Google Scholar] [CrossRef]
  43. Yap, Y.L.; Yeong, W.Y. Additive manufacture of fashion and jewellery products: A mini review. Virtual Phys. Prototyp. 2014, 9, 195–201. [Google Scholar] [CrossRef]
  44. Kutnjak-Mravlinčić, S.; Akalović, J.; Bischof, S. Merging footwear design and functionality. AUTEX Res. J. 2020, 20, 372–381. [Google Scholar] [CrossRef]
  45. Kutnjak-Mravlinčić, S.; Sutlović, A.; Glogar, M.I.; Ercegović Ražić, S.; Godec, D. Innovative Development of Batch Dyed 3D Printed Acrylonitrile/Butadiene/Styrene Objects. Molecules 2021, 26, 6637. [Google Scholar] [CrossRef]
  46. Thompson, M.K.; Moroni, G.; Vaneker, T.; Fadel, G.; Campbell, R.I.; Gibson, I.; Bernard, A.; Schulz, J.; Graf, P.; Ahuja, B.; et al. Design for Additive Manufacturing: Trends, Opportunities, Considerations, and Constraints. CIRP Ann. Manuf. Technol. 2016, 65, 737–760. [Google Scholar] [CrossRef]
  47. Rosen, D. Design for Additive Manufacturing: Past, Present, and Future Directions. J. Mech. Design. 2014, 136, 090301. [Google Scholar] [CrossRef]
  48. Kutnjak-Mravlinčić, S.; Godec, D.; Sutlović, A. 3D modeling and 3D printing of hollow structure in footwear industry. In Proceedings of the 9th Scientific—Professional Symposium Textile Science and Economy—Creative Mixer, Zagreb, Croatia, 25 January 2016; Glogar, M.I., Grilec, A., Eds.; University of Zagreb Faculty of Textile Technology: Zagreb, Croatia, 2016; pp. 100–103. [Google Scholar]
  49. Sun Lim, H. Development of 3D Printed Shoe Designs Using Traditional Muntin Patterns. Fash. Text. Res. J. 2017, 19, 134–139. [Google Scholar] [CrossRef]
  50. Dong, G.; Tessier, D.; Zhao, Y.F. Design of Shoe Soles Using Lattice Structures Fabricated by Additive Manufacturing. Proc. Des. Soc. Int. Conf. Eng. Des. 2019, 1, 719–728. [Google Scholar] [CrossRef]
  51. Kutnjak-Mravlincˇic´, S.; Pilipović, A.; Godec, D. Selection of appropriate 3D printing orientation considering actual product. In Proceedings of the RIM 2019—Development and Modernization of Production, Sarajevo, Bosnia and Herzegovina, 18–20 September 2019; Hodžić, A., Islamović, F., Mijović, B., Eds.; University of Bihac, Faculty of Engineering Sciences: Bihac, Bosnia and Herzegovina, 2019; pp. 455–460. [Google Scholar]
  52. García-Dominguez, A.; Claver, J.; Sebastián, M.A. Optimization Methodology for Additive Manufacturing of Customized Parts by Fused Deposition Modeling (FDM). Application to a Shoe Heel. Polymers 2020, 12, 2119. [Google Scholar] [CrossRef]
  53. Watkin, H. Ica & Kostika Launch 3D-Printed Exobiology Shoe Collection. Available online: https://all3dp.com/4/ica-kostika-launch-3d-printed-exobiology-shoe-collection (accessed on 31 March 2024).
  54. Yusuf, B. These Spring Heel Shoes Can Only Be Made with 3D Printing. Available online: https://all3dp.com/spring-heel-shoes/ (accessed on 31 May 2023).
  55. Sher, D. Footwear Industry Leads in Race for 3D Printed Consumer Products. Available online: https://www.3dprintingmedia.network/footwear-industry-leads-in-race-for-3d-printed-consumer-products (accessed on 31 March 2024).
  56. Scott, C. Dr. Scholl’s Partners with Wiivv for 3D Printed Custom Insoles, 3D Printing Industry. Available online: https://3dprint.com/233413/dr-scholls-partners-with-wiivv/ (accessed on 31 March 2024).
  57. Sher, D. SmarTech Issues New Report Projecting Footwear AM and 3D Printed Footwear Will Generate $6.5 Billion Yearly Revenues by 2029. SmarTech. Available online: https://www.smartechanalysis.com/news/smartech-projects-3d-printed-footwear-6-5-billion-yearly-revenues-by-2029/ (accessed on 31 March 2024).
  58. Kutnjak-Mravlinčić, S. Influence of 3D Print Parameters Produced by Fused Deposition Process and Geometry of Lattice Structures on Properties of 3D Printed Products from Acrylonitrile/Butadiene/Styrene. Ph.D. Thesis, University of Zagreb Faculty of Textile Technology, Zagreb, Croatia, 21 May 2021. [Google Scholar]
  59. HRN EN ISO 604; ISO 604:2002; EN ISO 604:2003; Plastics—Determination of Compressive Properties. Croatian Standards Institute: Zagreb, Croatia, 2003.
  60. Kutnjak-Mravlinčić, S.; Pilipović, A.; Godec, D. Influence of orientation on mechanical properties in fused deposition modelling. J. Leather Footwear 2020, 68, 4–13. [Google Scholar] [CrossRef]
  61. Kutnjak-Mravlinčić, S.; Sutlović, A.; Godec, D.; Krišković, T. Application of 3D printing from acrylonitrile/butadiene/styrene in the realization of prototypes of heels of women’s shoes. Tekst. J. Text. Cloth. Technol. 2022, 71, 48–56. [Google Scholar]
  62. Wang, M.; Liu, L.; Ren, Y.; Xu, G.; Yi Wang, Y. Investigation of Heated Nozzle Temperature in ABS Specimens Fabricated Based on Fiber Bragg Grating During Fused Deposition Modeling Process. Integr. Ferroelectr. 2020, 208, 177–180. [Google Scholar] [CrossRef]
  63. Spahiu, T.; Ehrmann, A.; Almeida, H.; Jimeno-Morenilla, A.; Kyratsis, P. Footwear products and the role of industry 4.0 for sustainable production. In Proceedings of the VI International Conference “Modern Trends and Innovations in the Textile Industry”, Belgrade, Serbia, 14–15 September 2023. [Google Scholar]
  64. Mallakpour, S.; Radfar, Z.; Mustansar Hussain, C. Advanced Application of Additive Manufacturing in the Footwear Industry: From Customized Insoles to Fully 3D-Printed Shoes. In Additive Manufacturing Materials and Technologies, Medical Additive Manufacturing; Elsevier GmbH: Berlin, Germany, 2024; pp. 153–178. [Google Scholar]
  65. Gelaziene, E.; Milasiene, D. Influence of the Type of Plastic and Printing Technologies on the Compressive Behavior of 3D-Printed Heel Prototypes. Materials 2023, 16, 1930. [Google Scholar] [CrossRef]
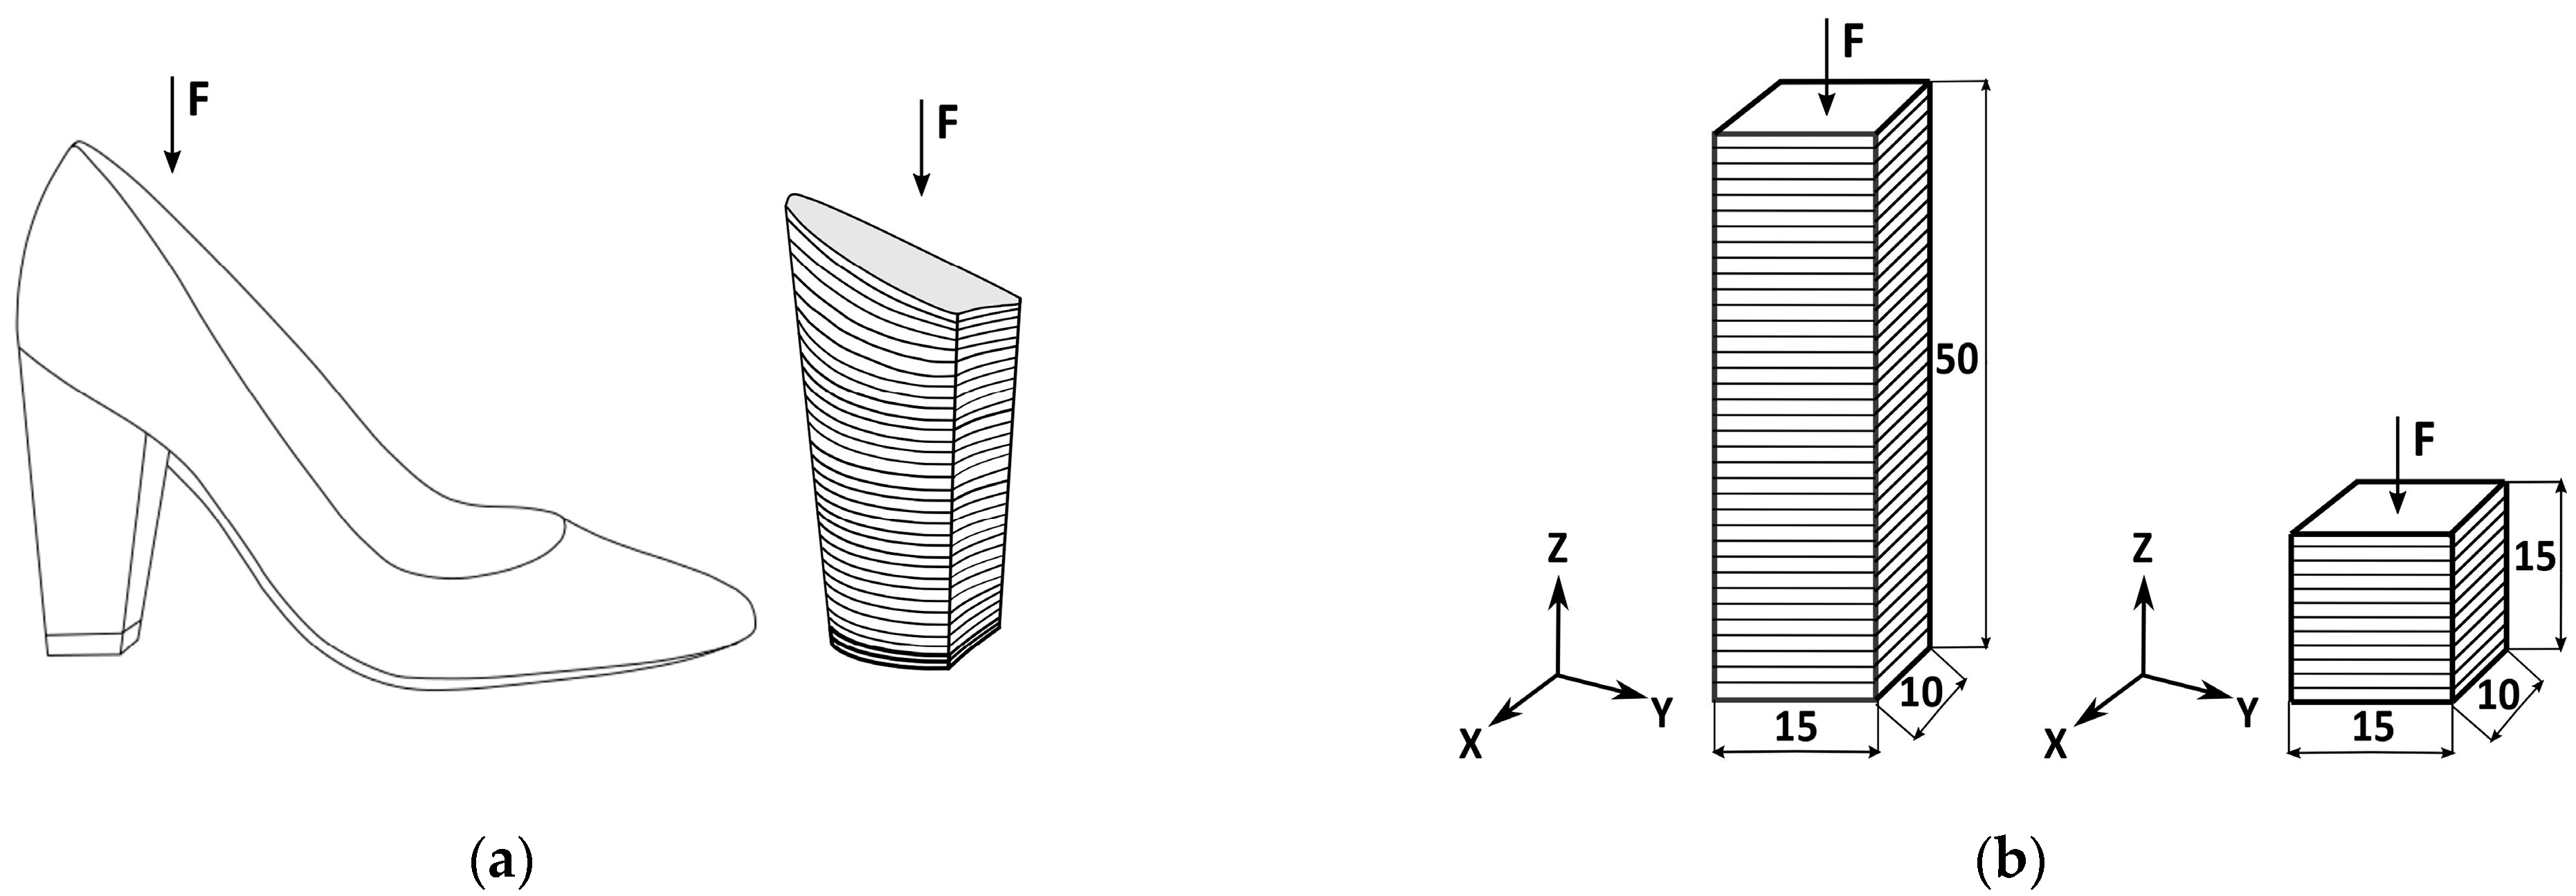
Figure 1. Production of the test specimen: (a) representation of the forces acting on a high-heeled women’s shoe and CAD model of the heel; (b) layer alignment of the specimen during 3D printing and testing of the compressive modulus and compressive strength.
Jmmp 08 00106 g001
Figure 2. Production of the test specimens: (a) positioning on a 3D printer base; (b) 3D printing on a MakerBot Replicator 2X desktop printer; (c) test specimens produced for testing the compressive modulus (d) and compressive strength.
Jmmp 08 00106 g002
Figure 3. Testing of the compressive properties: (a) compressive strength; (b) compressive modulus.
Jmmp 08 00106 g003
Figure 4. Compressive stress–strain diagram for determining the compressive strength of the linear infill (L45).
Jmmp 08 00106 g004
Figure 5. Compressive stress–strain diagram for determining the compressive strength of the honeycomb infill (H).
Jmmp 08 00106 g005
Figure 6. Compressive stress–strain diagram for determining the compressive modulus of the linear infill (L45).
Jmmp 08 00106 g006
Figure 7. Compressive stress–strain diagram for determining the compressive modulus of the honeycomb infill (H).
Jmmp 08 00106 g007
Figure 8. Two-dimensional (2D) graph of the influence of layer thickness on the compressive strength of the linear infill (infill density: 40%, extrusion temperature: 255 °C).
Jmmp 08 00106 g008
Figure 9. Two-dimensional (2D) graph of the influence of the infill density on the compressive strength of the linear infill (layer thickness: 0.10 mm, extrusion temperature: 255 °C).
Jmmp 08 00106 g009
Figure 10. A 3D graph of the simultaneous influence of the infill density and layer thickness on the compressive strength of the linear infill (extrusion temperature of 255 °C).
Jmmp 08 00106 g010
Figure 11. Two-dimensional (2D) graph of the influence of the layer thickness on the compressive strength of the honeycomb infill (infill density: 40%, extrusion temperature: 255 °C).
Jmmp 08 00106 g011
Figure 12. Two-dimensional (2D) graph of the influence of the infill density on the compressive strength of the honeycomb infill (layer thickness: 0.10 mm, extrusion temperature: 255 °C).
Jmmp 08 00106 g012
Figure 13. Two-dimensional (2D) graph of the influence of the extrusion temperature on the compressive strength of the honeycomb infill (layer thickness: 0.10 mm, infill density: 40%).
Jmmp 08 00106 g013
Figure 14. A 3D graph of the simultaneous influence of the infill density and layer thickness on the compressive strength of the honeycomb infill (extrusion temperature of 205 °C).
Jmmp 08 00106 g014
Figure 15. A 3D graph of the simultaneous influence of the infill density and layer thickness on the compressive strength of the honeycomb infill (extrusion temperature of 255 °C).
Jmmp 08 00106 g015
Figure 16. Two-dimensional (2D) graph of the influence of the layer thickness on the compressive modulus of the linear infill (infill density: 40%, extrusion temperature: 255 °C).
Jmmp 08 00106 g016
Figure 17. Two-dimensional (2D) graph of the influence of the infill density on the compressive modulus of the linear infill (layer thickness: 0.10 mm, extrusion temperature: 255 °C).
Jmmp 08 00106 g017
Figure 18. A 3D graph of the simultaneous influence of the infill density and layer thickness on the compressive modulus of the linear infill (extrusion temperature of 255 °C).
Jmmp 08 00106 g018
Figure 19. Two-dimensional (2D) graph of the influence of the layer thickness on the compressive modulus of the honeycomb infill (infill density: 40%, extrusion temperature: 255 °C).
Jmmp 08 00106 g019
Figure 20. Two-dimensional (2D) graph of the influence of the infill density on the compressive modulus of the honeycomb infill (layer thickness: 0.10 mm, extrusion temperature: 255 °C).
Jmmp 08 00106 g020
Figure 21. Two-dimensional (2D) graph of the influence of the extrusion temperature on the compressive modulus of the honeycomb infill (layer thickness: 0.10 mm, infill density: 40%).
Jmmp 08 00106 g021
Figure 22. A 3D graph of the simultaneous influence of the infill density and layer thickness on the compressive modulus of the honeycomb infill (extrusion temperature of 205 °C).
Jmmp 08 00106 g022
Figure 23. A 3D graph of the simultaneous influence of the infill density and layer thickness on the compressive modulus of the honeycomb infill (extrusion temperature of 255 °C).
Jmmp 08 00106 g023
Figure 24. CAD models of prototype heels: (a) prototype 1; (b) prototype 2; (c) prototype 3; (d) prototype 4.
Jmmp 08 00106 g024
Figure 25. Realized prototypes of functional women’s shoes: (a) prototype 1; (b) prototype 2; (c) prototype 3; (d) prototype 4.
Jmmp 08 00106 g025aJmmp 08 00106 g025b
Table 1. Parameters and their levels (adjustable).
LevelsLayer Thickness
mm
Infill Density
%
Extrusion Temperature
°C
−1.6820.1010205
−10.1515215
00.2025230
10.2535245
1.6820.3040255
Table 2. Central composite design (19 trials; five repetitions in the center).
RunFactor 1: Layer Thickness
LT, mm
Factor 2: Infill Density
ID,%
Factor 3: Temperature
ϑ, °C
10.2025230
20.1535245
30.2040230
40.1025230
50.2025230
60.2025230
70.2025255
80.2025205
90.1515245
100.1515215
110.2535245
120.2025230
130.3025230
140.2515215
150.2515245
160.2025230
170.2010230
180.1535215
190.2535215
Table 3. Results of the compressive properties of the linear infill test specimens (L45) and honeycomb infill test specimens (H).
Trial NumberFactor 1Factor 2Factor 3Linear Infill 45°Honeycomb Infill
A: Layer Thickness LT, mmB: Infill Density
ID,%
C: Temp. ϑ, °CCompressive Strength ±
SD σx (N/mm2)
Compressive
Modulus ±
SD Ec (N/mm2)
Compressive Strength ±
SD σx (N/mm2)
Compressive
Modulus ±
SD Ec (N/mm2)
10.202523026.12 ± 0.23565.32 ± 13.5930.96 ± 0.67733.12 ± 4.49
20.153524537.09 ± 0.85836.89 ± 8.3633.81 ± 1.43804.53 ± 18.81
30.204023038.99 ± 0.40808.38 ± 8.0232.98 ± 0.82772.91 ± 5.16
40.102523035.55 ± 0.90823.13 ± 12.3132.70 ± 0.24778.43 ± 27.07
50.202523030.90 ± 0.61717.28 ± 3.2329.73 ± 0.50723.16 ± 3.81
60.202523030.92 ± 0.73724.63 ± 1.0030.78 ± 0.65707.53 ± 17.59
70.202525532.63 ± 0.70755.46 ± 7.0830.30 ± 0.72725.37 ± 1.59
80.202520529.42 ± 0.06671.05 ± 1.3129.98 ± 0.14689.67 ± 5.02
90.151524523.61 ± 0.38539.24 ± 8.7828.53 ± 1.44695.55 ± 9.45
100.151521528.70 ± 0.15675.96 ± 2.9627.84 ± 1.28695.20 ± 14.67
110.253524538.15 ± 0.79747.05 ± 10.2931.44 ± 0.31738.11 ± 12.06
120.202523030.93 ± 0.30712.41 ± 7.1529.24 ± 0.06706.58 ± 6.31
130.302523023.54 ± 0.41497.94 ± 7.6828.01 ± 0.27646.33 ± 0.93
140.251521524.67 ± 0.28582.57 ± 4.7924.61 ± 0.87603.46 ± 11.16
150.251524525.93 ± 0.14646.69 ± 10.7926.28 ± 1.02655.59 ± 0.69
160.202523030.87 ± 0.37716.84 ± 7.21 29.08 ± 0.23674.96 ± 5.63
170.201023025.37 ± 0.89612.80 ± 12.5325.59 ± 0.37622.47 ± 9.08
180.153521536.21 ± 1.02835.79 ± 4.1131.52 ± 0.74768.44 ± 11.75
190.253521533.17 ± 1.16733.88 ± 2.9530.29 ± 0.40683.91 ± 10.29
Table 4. ANOVA for testing the compressive strength of the linear infill (reduced linear model).
SourceSum of SquaresDoFMean SquareF-Valuep-ValueRemark
Model356.902178.4532.56<0.0001Significant
A—Layer thickness47.99147.998.760.0092Significant
B—Infill density308.911308.9156.36<0.0001Significant
Residual87.69165.48
Lack of fit69.37125.781.260.4476Not significant
Pure Error18.3244.58
Corrected Total444.5918
Table 5. Overview of the statistical data for the compressive strength of the linear infill (L45).
Compressive Strength σc [N/mm2]
Standard deviation2.34
Mean30.67
Coefficient of determination (R-squared (r2))0.8028
Table 6. ANOVA for testing the compressive strength of the honeycomb infill (reduced quadratic model).
SourceSum of SquaresDoFMean SquareF-Valuep-ValueRemark
Model102.83425.7155.73<0.0001Significant
A—Layer thickness21.30121.3046.17<0.0001Significant
B—Infill density76.31176.31165.43<0.0001Significant
C—Temperature2.9612.966.410.0239Significant
B22.2612.264.900.0439Significant
Residual6.46140.46
Lack of fit3.44100.340.460.8569Not significant
Pure Error3.0240.75
Corrected Total109.2918
Table 7. Overview of the statistical data for the model for the compressive strength of the honeycomb infill.
Compressive Strength σc [N/mm2]
Standard deviation0.68
Mean29.67
Coefficient of determination (R-squared (r2))0.9409
Table 8. ANOVA for testing the compressive modulus of the linear infill (reduced linear model).
SourceSum of SquaresDoFMean SquareF-Valuep-ValueRemark
Model1.233 ∙ 105261,629.9816.830.0001Significant
A—Layer thickness42,856.25142,856.2511.710.0035Significant
B—Infill density80,403.71180,403.7121.960.0002Significant
Residual58,575.56163660.97
Lack of fit39,900.99123325.080.71220.7090Not significant
Pure Error18,674.5744668.64
Corrected Total1.818 ∙ 10518
Table 9. Overview of the statistical data for the model of the compressive modulus of the linear infill (L45).
Compressive Modulus Ec [N/mm2]
Standard deviation60.51
Mean694.91
Coefficient of determination (R-squared (r2))0.6779
Table 10. ANOVA for testing the compressive modulus of the honeycomb infill (linear model).
SourceSum of SquaresDoFMean SquareF-Valuep-ValueRemark
Model47,778.07315,926.0267.84<0.0001Significant
A—Layer thickness18,690.31118,690.3179.61<0.0001Significant
B—Infill density26,069.58126,029.56111.05<0.0001Significant
C—Temperature3018.1813018.1812.860.0027Significant
Residual3521.3915234.76
Lack of fit1572.4011142.940.290.9520Not significant
Pure Error1948.994487.25
Corrected Total51,299.4618
Table 11. Overview of the statistical data for the model of the compressive modulus of the honeycomb infill.
Compressive Modulus Ec [N/mm2]
Standard deviation15.32
Mean706.60
Coefficient of determination (R-squared (r2))0.9314
Table 12. Optimization criteria.
Parameter/PropertyGoalLower LimitUpper LimitImportance
A: Layer thicknessIs in range0.10 mm0.30 mm3
B: Infill densityIs in range10%40%3
C: Extrusion temperatureIs in range205 °C255 °C3
Compressive strength—L45Maximize36 N/mm242 N/mm25
Compressive strength—HMaximize30 N/mm236 N/mm25
Compressive modulus—L45Maximize880 N/mm2920 N/mm25
Compressive modulus—HMaximize800 N/mm2880 N/mm25
Table 13. Characteristic solutions of the complex optimization—linear infill (L45).
Parameter/Property123
Layer thickness [mm]0.100.100.10
Infill density [%]40.0040.0040.00
Extrusion temperature [°C]209.67222.96254.35
Compressive strength [N/mm2]41.5941.5941.59
Compressive modulus [N/mm2]918.72918.72918.72
Desirability0.950.950.95
Table 14. Characteristic solutions of the complex optimization—honeycomb infill.
Parameter/Property123
Layer thickness [mm]0.100.100.10
Infill density [%]40.0039.8539.66
Extrusion temperature [°C]255254.78255
Compressive strength [N/mm2]35.7035.6835.66
Compressive modulus [N/mm2]868.32867.43866.78
Desirability0.760.740.73
Table 15. The 3D printing parameters of the heel prototypes.
Print ParameterValue
Layer thickness0.10 mm
Infill density40%
Number of shells3
Infill build speed90 mm/s
Shell speed40 mm/s
Infill patternlinear 45°
Roof thickness1.00 mm
Extrusion temperature210 °C
Table 16. Comparison of the obtained results with previous research.
AuthorInfill Density, %Infill PatternLayer Thickness, mmCompressive Strength
Oudah et al. [25]75Tri-hexagon0.337.6
Oudah et al. [25]50Zigzag0.339.15
Oudah et al. [25]75Gyroid0.244.64
Ali et al. [30]60Zigzag0.1527.42
Ali et al. [30]60Gyroid0.0527.458
Ali et al. [30]60Cross0.2527.96
Disclaimer/Publisher’s Note: The statements, opinions and data contained in all publications are solely those of the individual author(s) and contributor(s) and not of MDPI and/or the editor(s). MDPI and/or the editor(s) disclaim responsibility for any injury to people or property resulting from any ideas, methods, instructions or products referred to in the content.