Abstract
Micro-milling, widely employed across various fields, faces significant challenges due to the small diameter and limited stiffness of its tools, making the process highly susceptible to cutting chatter and premature tool breakage. Ensuring stable and safe cutting processes necessitates the prediction of chatter by considering the tool breakage. Crucially, the modal parameters of the spindle–holder–tool system are important prerequisites for such stability prediction. In this paper, the frequency response functions (FRFs) of the micro-milling tool are calculated by direct FRFs of the micro-milling cutter and cross FRFs between a point on the shank and one on the tool tip. Additionally, by utilizing a cutting force model specific to micro-milling, the bending stress experienced by the tool is computed, and the tool breakage curve is subsequently determined based on the material’s permissible maximum allowable stress. The FRFs of the micro-milling tool, alongside the tool breakage curve, are then integrated to generate the final stability lobe diagrams (SLDs). The effectiveness and reliability of the proposed methodology are confirmed through a comprehensive series of numerical and experimental validations.
1. Introduction
With the increasing demand for miniaturization and precision in aerospace, bioengineering, microelectronics, and defense, micro-milling has received widespread attention due to its low machining cost and high efficiency [1]. Regenerative chatter is a vibration phenomenon generated by the growing chip thickness due to the phase difference between adjacent tool teeth [2]. Cutting chatter frequently leads to poor machining surface quality, tool wear, and other issues; therefore, it should be minimized as much as possible in practical machining. Unlike conventional milling, where the diameter of the milling cutter is typically larger, micro-milling cutters often have a diameter of less than 1 mm, making them prone to weak stiffness, and consequently, common chatter in micro-milling. Additionally, the weak stiffness characteristic of micro-milling also contributes to premature breakage of micro-milling cutters.
In order to ensure efficient and high-quality machining, it is particularly important to predict or suppress chatter during the cutting process. To accomplish this, two important tasks need to be undertaken. The first task is to predict chatter stability, for which there are two widely used methods. One is the analytical prediction model, known as the “zero-order method”, which was proposed by Altintas and Budak [3,4] for predicting the SLDs of a milling system. The other is the semi-discrete method, which was proposed by Insperger and Stepan [5], based on delay differential equations to predict the SLDs of the system. Another method is the semi-discrete method, aiming to predict the milling SLDs using delay differential equations, as proposed by Insperger and Stepan [5]. Additionally, Hopf stability [6,7,8] needs to be considered when there is a flexible dominant direction in the milling system. The second task is to obtain the modal parameters of the tool, which are important input parameters required by the procedure for calculating SLDs [9]. There are also two typical methods for obtaining these parameters. One method involves applying excitation at the tool tip and measuring the corresponding response signal, known as hammer impact testing. The other method is an analytical approach based on receptance coupling substructure analysis (RCSA). The diameter of the micro-milling tool is small, and the even smaller size of its tip makes achieving direct excitation challenging, even with the smallest force hammers. Furthermore, due to the tiny size of the tool tip, conventional contact measurement methods are ineffective, necessitating the use of non-contact measurement methods to capture the response signal [10]. Jin and Altintas [11] obtained the FRFs of a micro-milling tool by exciting a point on the toolbar and measuring responses both at this position and at the tool tip. Although this method avoids the excitation of the tip of the micro-milling tool, it requires the measurement of the response at the tip of the micro-milling cutter, which is more equipment-dependent.
RCSA, which was first proposed by Schmitz [12], aims to predict the FRFs of tool tips through a small number of experiments. In the first generation of the RCSA model [12], the tool was modeled by a Euler beam model, and the tool axis system was divided into a spindle–holder substructure and tool substructure, also known as a “two-component” model. In addition, the rotationally related frequency response functions are assumed to be zero. An important advancement in RCSA modeling was the computation of the FRFs including rotation based on the finite difference method by Pork et al. [13]. Another important advancement in the first generation of RCSA was the separation of the holder from the spindle–holder structure for more general coupling calculations, also known as a “three-component” model [14]. Then, Schmitz and Duncan [15] extended the three-component model further. For two nested structures that are coaxial, e.g., the holder and the part of the tool inserted into the holder, the connection is characterized using a multi-point coupling model. Alternatively, Erturk et al. [16] derived an analytical computational model of the FRFs of the tool tip. This model was based on the known internal configuration of the spindle, including the precise locations of all bearings, and the dimensions of various components such as the spindle, shank, tool, and connecting parts. They achieved this by employing vibrational differential equations of the Timoshenko beam. All the above studies were carried out for conventional milling. Lu et al. [17] and Wan et al. [10] applied RCSA to a micro-milling system and successfully realized the prediction of FRFs of a micro-milling tool.
Due to the small size of milling cutter tools (often with diameters of ≤1 mm), the issue of stress concentration induced by internal defects becomes more pronounced, consequently leading to early tool breakage. Zhou et al. [18] found that the stresses due to torsion in micro-milling cutters are small, and the breakage of micro-milling cutters is mainly caused by excessive bending stresses. Fang et al. [19] studied the tool breakage of a micro-milling cutter based on the finite element method. The results of existing studies show that the early fracture of the tool is due to the stress in the cutting process exceeding the ultimate strength of the tool material itself. Lu et al. [20] further extended the stress modeling to include not only the tool section but also the shank of the micro-cutter and the taper, concluding that the maximum bending stresses experienced by the micro-milling cutter are concentrated at the transition between the tool and the shank of the cutter.
In summary, the challenges of machining chatter and cutter breakage coexist in the micro-milling process. However, existing studies have either solely focused on addressing the issue of chatter in micro-milling or on mitigating the breakage of micro-milling cutters. The former primarily ensures the stability of the micro-milling process, while the latter primarily emphasizes the safety aspect. In this work, both the breakage and chatter issues of micro-milling cutters are addressed to ensure both stability and safety in the micro-milling process. Stability prediction primarily concerns the acquisition of modal parameters of the micro-milling cutter. However, the breakage of the micro-milling cutter often results from excessive bending moments [18,19,20,21]. Therefore, it is necessary to establish a cutting force model for micro-milling. It is important to note that the cutting force model for micro-milling is different from conventional milling. The obvious cutting edge radius of a micro-milling cutter leads to size effects, which cannot be ignored in micro-milling. Meanwhile, the cutting edge radius affects the minimum undeformed chip thickness [22,23], which starts from the separation point that is defined to distinguish the shearing and ploughing effects. In this paper, the cutting force model is taken from the authors’ previous work [24], which considers the influence of the separation point.
This paper aims to investigate the chatter stability of the micro-milling process while considering early tool fracture. The whole paper consists of four parts. The first part primarily summarizes the acquisition of modal parameters of micro-milling cutters and the current status of tool breakage. The second part theoretically focuses on describing the method for obtaining the FRFs of the micro-milling cutter and calculating tool fracture. The third part experimentally validates the proposed method. The research conclusions are summarized in the fourth part.
2. Methodology
2.1. Methods for Obtaining FRFs of Micro-Milling Cutters
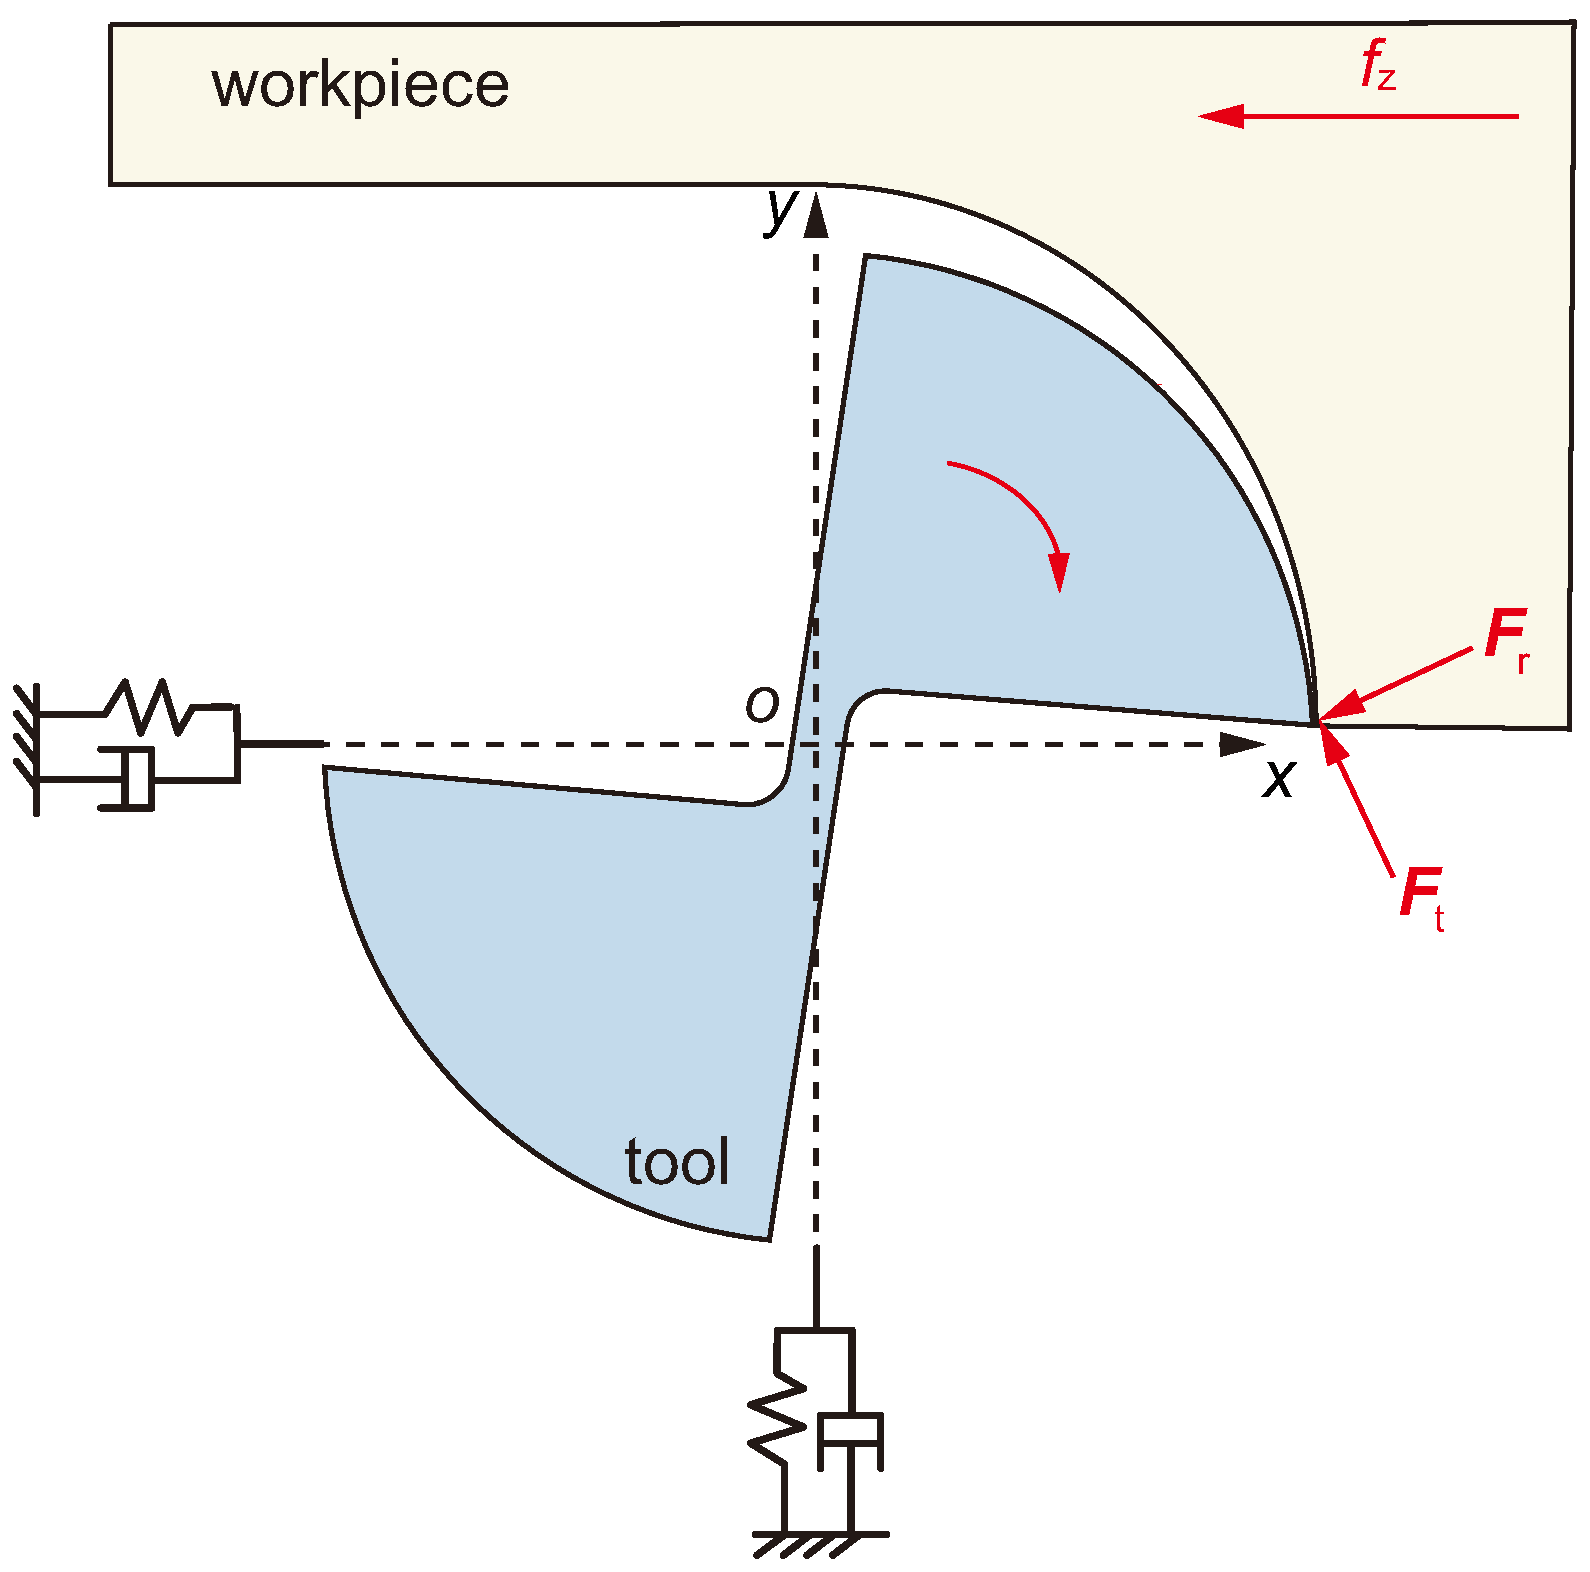
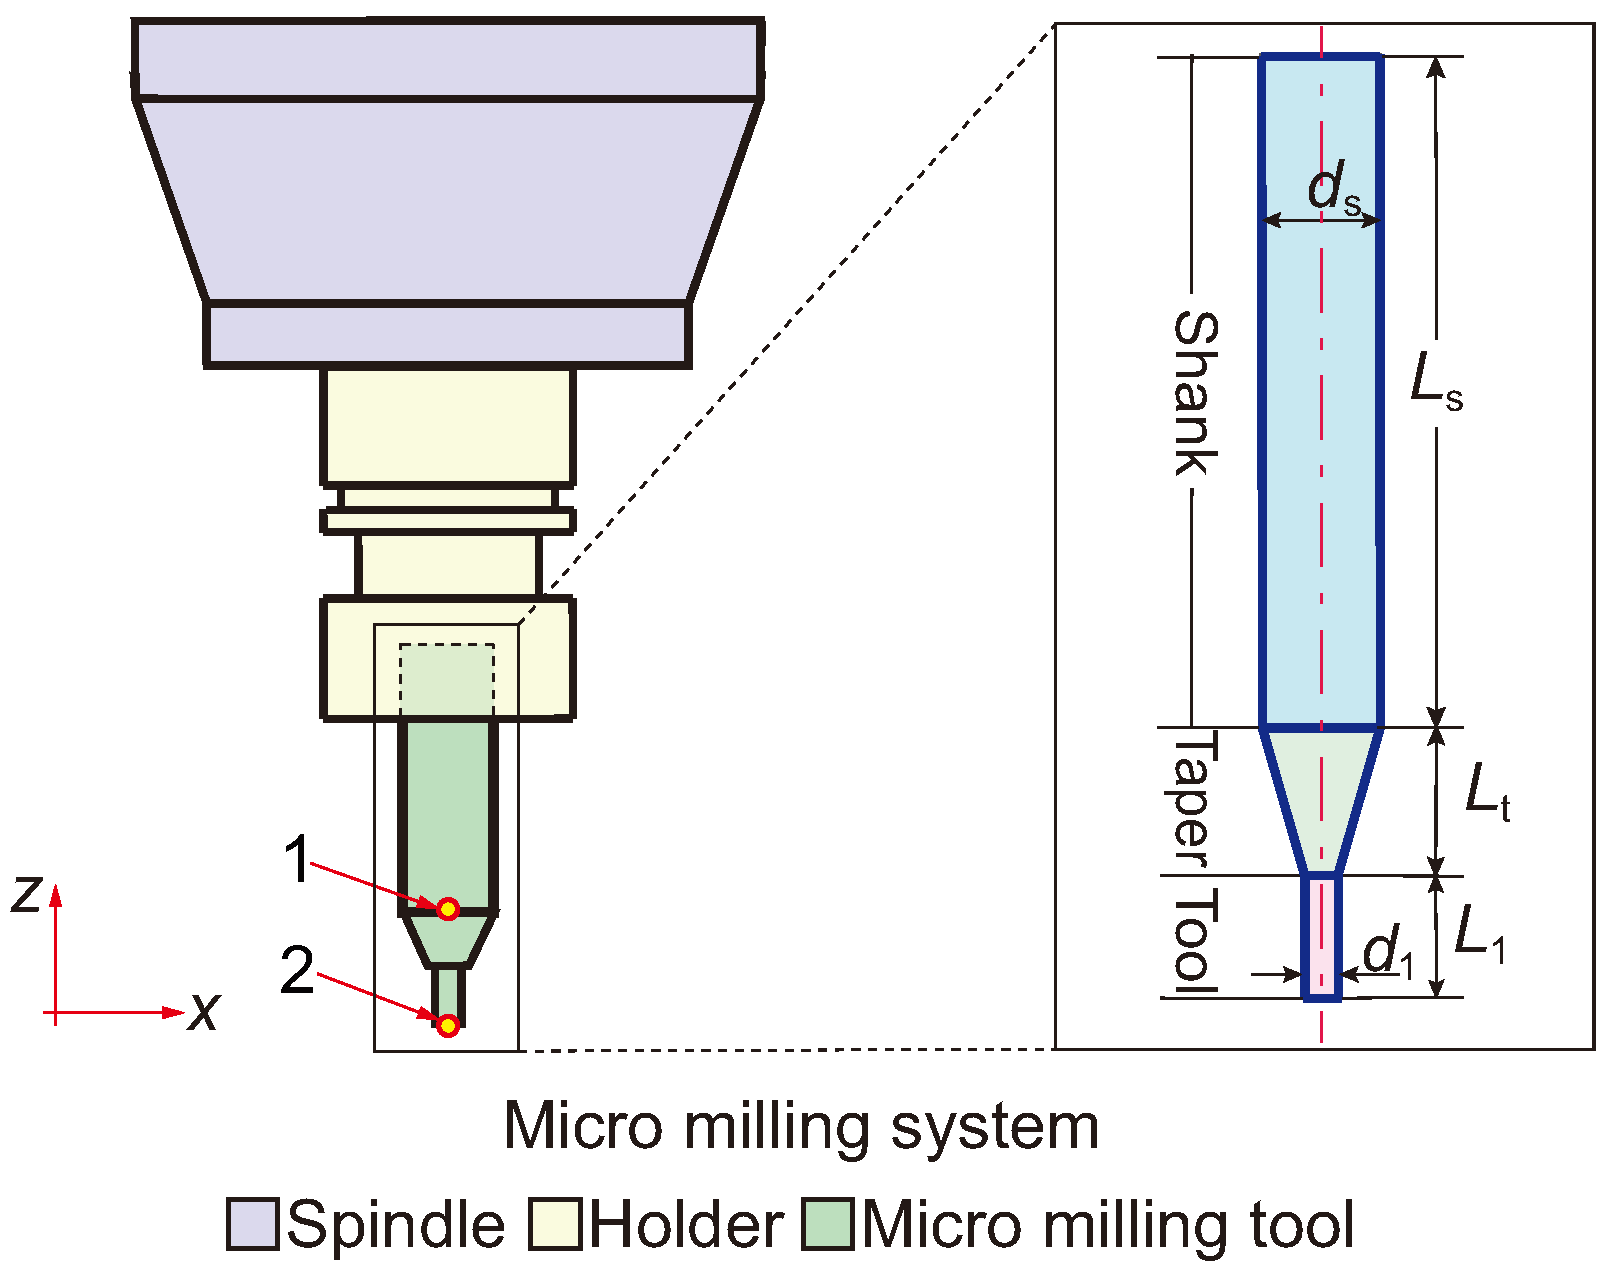
The FRFs of micro-milling cutters are difficult to measure directly by experiment, and this paper briefs a method to obtain the FRFs of micro-milling cutters based on RCSA and the Timoshenko beam model. Figure 1 shows a two-dimensional model of a micro-milling spindle–holder–tool system. The excitation and response at the tool tip can be represented as follows in the frequency domain:
where is the excitation in the x direction. is the response in the x direction. and correspond to the excitation and response in the y direction. When the applied excitation is in the j direction (b = x or y), and the measured response is in the i direction (a = x or y), the resulting FRFs can be expressed as . and are two cross-FRFs, which are generally considered to be 0, since the x and y directions are perpendicular to each other [25]. and are two direct FRFs of the micro-milling system in the x and y directions, respectively, which are approximately equal. Therefore, it is only necessary to calculate the direct FRFs in the x or y direction. This paper takes the procedure for obtaining as an example to illustrate the methodology. It is worth noting that any element from Equation (1) is a full-degree-of-freedom (DoF) FRF matrix. Four elements are contained in any matrix in Equation (1) and can be expressed as follows [16]:
where is the FRFs of translation/force. is the FRFs of translation/moment. is the FRFs of angular/force. is the FRFs of angular/moment. p = x or y and q = x or y are response and excitation, respectively. Among them, is often used to predict stability.
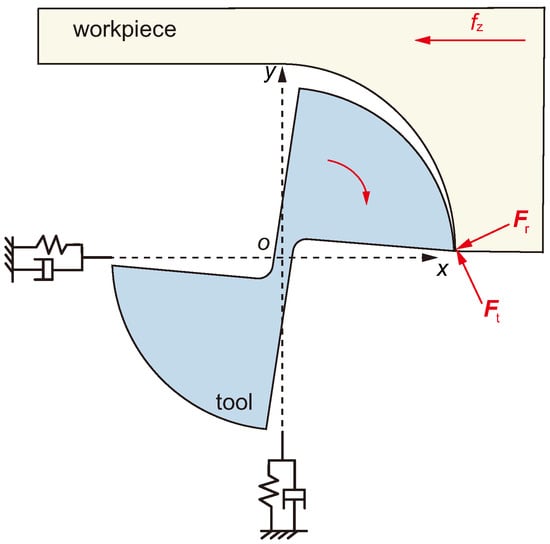
Figure 1.
A milling system with two degrees of freedom.
The micro-milling spindle–holder–tool system is divided into the spindle substructure, holder substructure, and micro-milling tool substructure, as shown in Figure 2. The FRFs of the micro-milling cutter in the x direction can be expressed as follows:
where is the FRFs of the micro-milling system in the x direction with excitation and response at point 1 in Figure 2. and are the excitation and response at point 2 in the x direction. However, the tip size of the micro-milling cutter is so small that it is difficult to apply pulsed excitation even with the smallest-size force hammers available. In addition, shaker excitation has the potential to cause failure of the tool tip. Therefore, excitation of the microtome tip should be avoided.
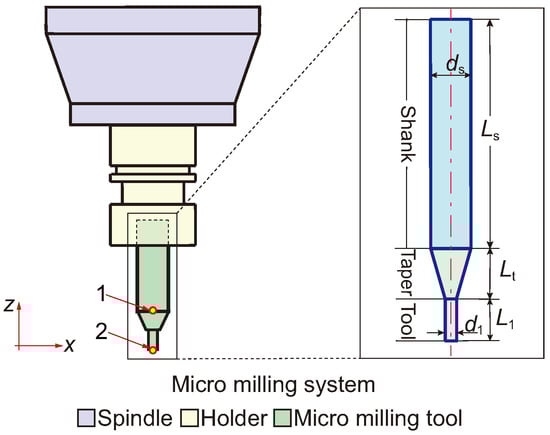
Figure 2.
Micro−milling spindle–holder–tool structure.
Fortunately, the FRFs of a micro-milling cutter can be realized with the help of the direct FRFs at a point on the shank and the cross-FRFs between this point and the tool tip. The direct FRFs of point 1 in Figure 2 can be expressed as follows:
where is the FRFs in the x direction with excitation and response at point 1 in Figure 2. and are the excitation and response at point 1 in the x direction. The cross-FRFs of points 2 and 1 in Figure 2 can be expressed as follows:
where is the FRFs of the micro-milling system in the x direction with excitation at point 2 and response at point 1 in Figure 2. is the excitation at point 2 and is the response at point 1 in the x direction. Substituting Equations (4) and (5) into Equation (3) will give a new expression for the FRFs of the tool tip [11].
Here, is the in Equation (3), which is the FRFs of the micro-milling system. It is worth noting that in previous studies [26,27,28], it was mentioned that when the value of this is close to 0 in the frequency band of interest, it causes errors in the calculation results. Fortunately, this is not the case in any of the frequency band ranges of interest in this paper, which guarantees the accuracy of the computed results.
2.2. Method for Predicting Tool Breakage
Micro-milling tool breakage is often caused by concentration bending stress, as reported in existing studies. The first step in predicting tool breakage is to build a cutting force model of the micro-milling process. Second, the maximum bending stress is calculated based on the cutting force model. Third, the tool breakage curve is confirmed according to the maximum bending stress of the tool during the cutting process and ultimate bending tensile stress of the material of the micro-milling tool. Lastly, SLDs can be predicted considering tool breakage.
2.2.1. Micro-Milling Force Model
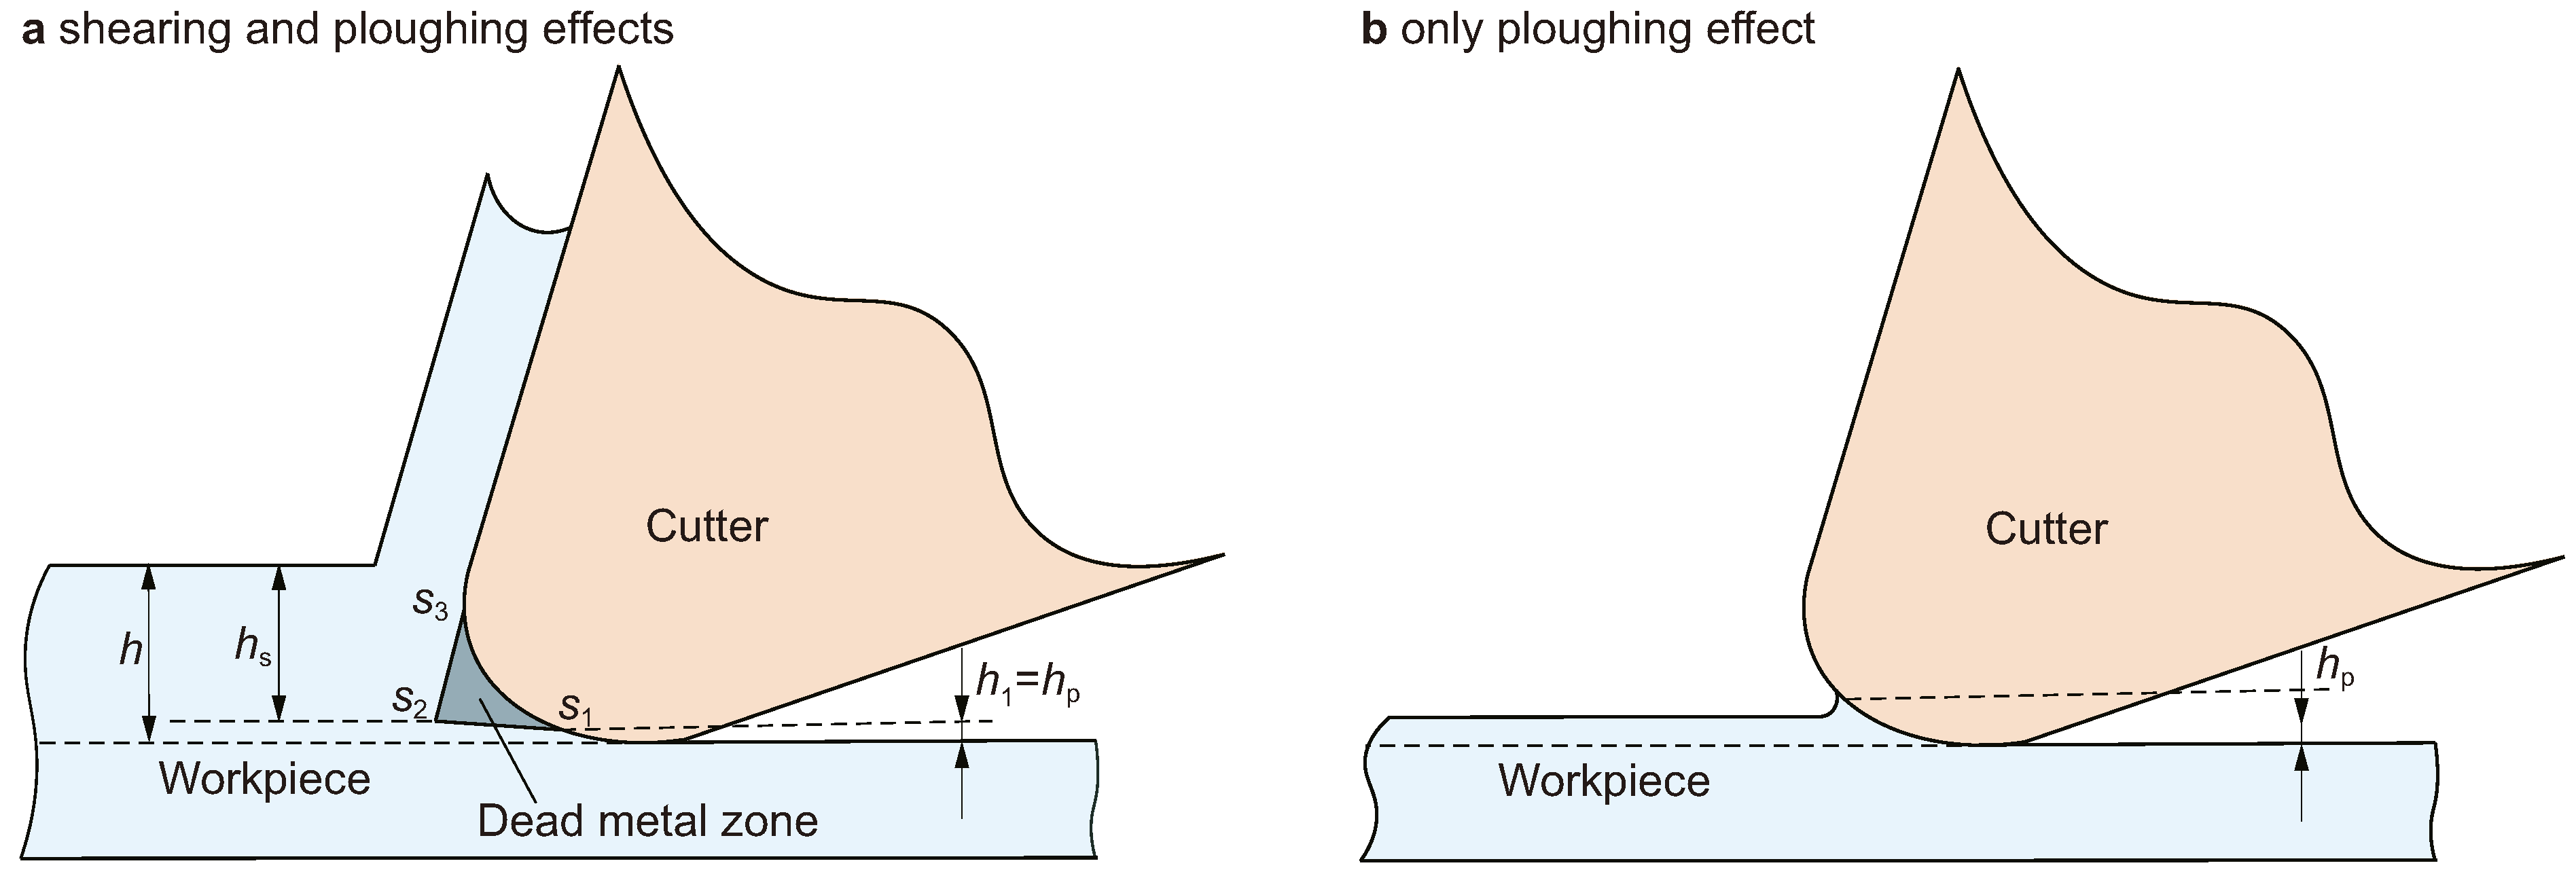
According to Wan et al. [29], there is a region near the micro-milling tool tip where workpiece materials hardly flow during the micro-milling cutting process called the “metal dead zone (MDZ)”, as shown in Figure 3.
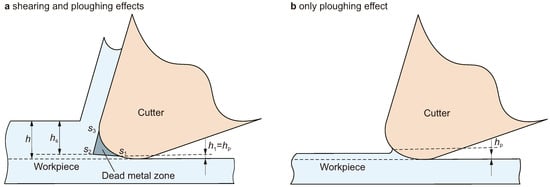
Figure 3.
Illustration of the micro-milling process. (a) Both shearing and ploughing effects. (b) Only ploughing effect.
The MDZ is a sub-triangular region, and the vertex S1 of the MDZ is the separation point between the ploughing and shearing effects during the micro-milling process. When the uncut chip thickness is greater than in Figure 3a, ploughing and shearing effects both occur. Conversely, only ploughing occurs, as shown in Figure 3b. Accordingly, the cutting force model of micro-milling can be expressed as follows [24]:
- If h >
- If h ≤
where and are the cutting forces in the tangential and radial directions. and are the ploughing force coefficients in the tangential and radial directions. and are the shearing force coefficients in the tangential and radial directions. is the tool edge radius. is the ploughing thickness. is the maximum ploughing thickness. is the shear thickness. h is the uncut chip thickness. , , , , , , , and are constants. is the axial depth of cut.
2.2.2. Calculation of the Maximum Bending Stress
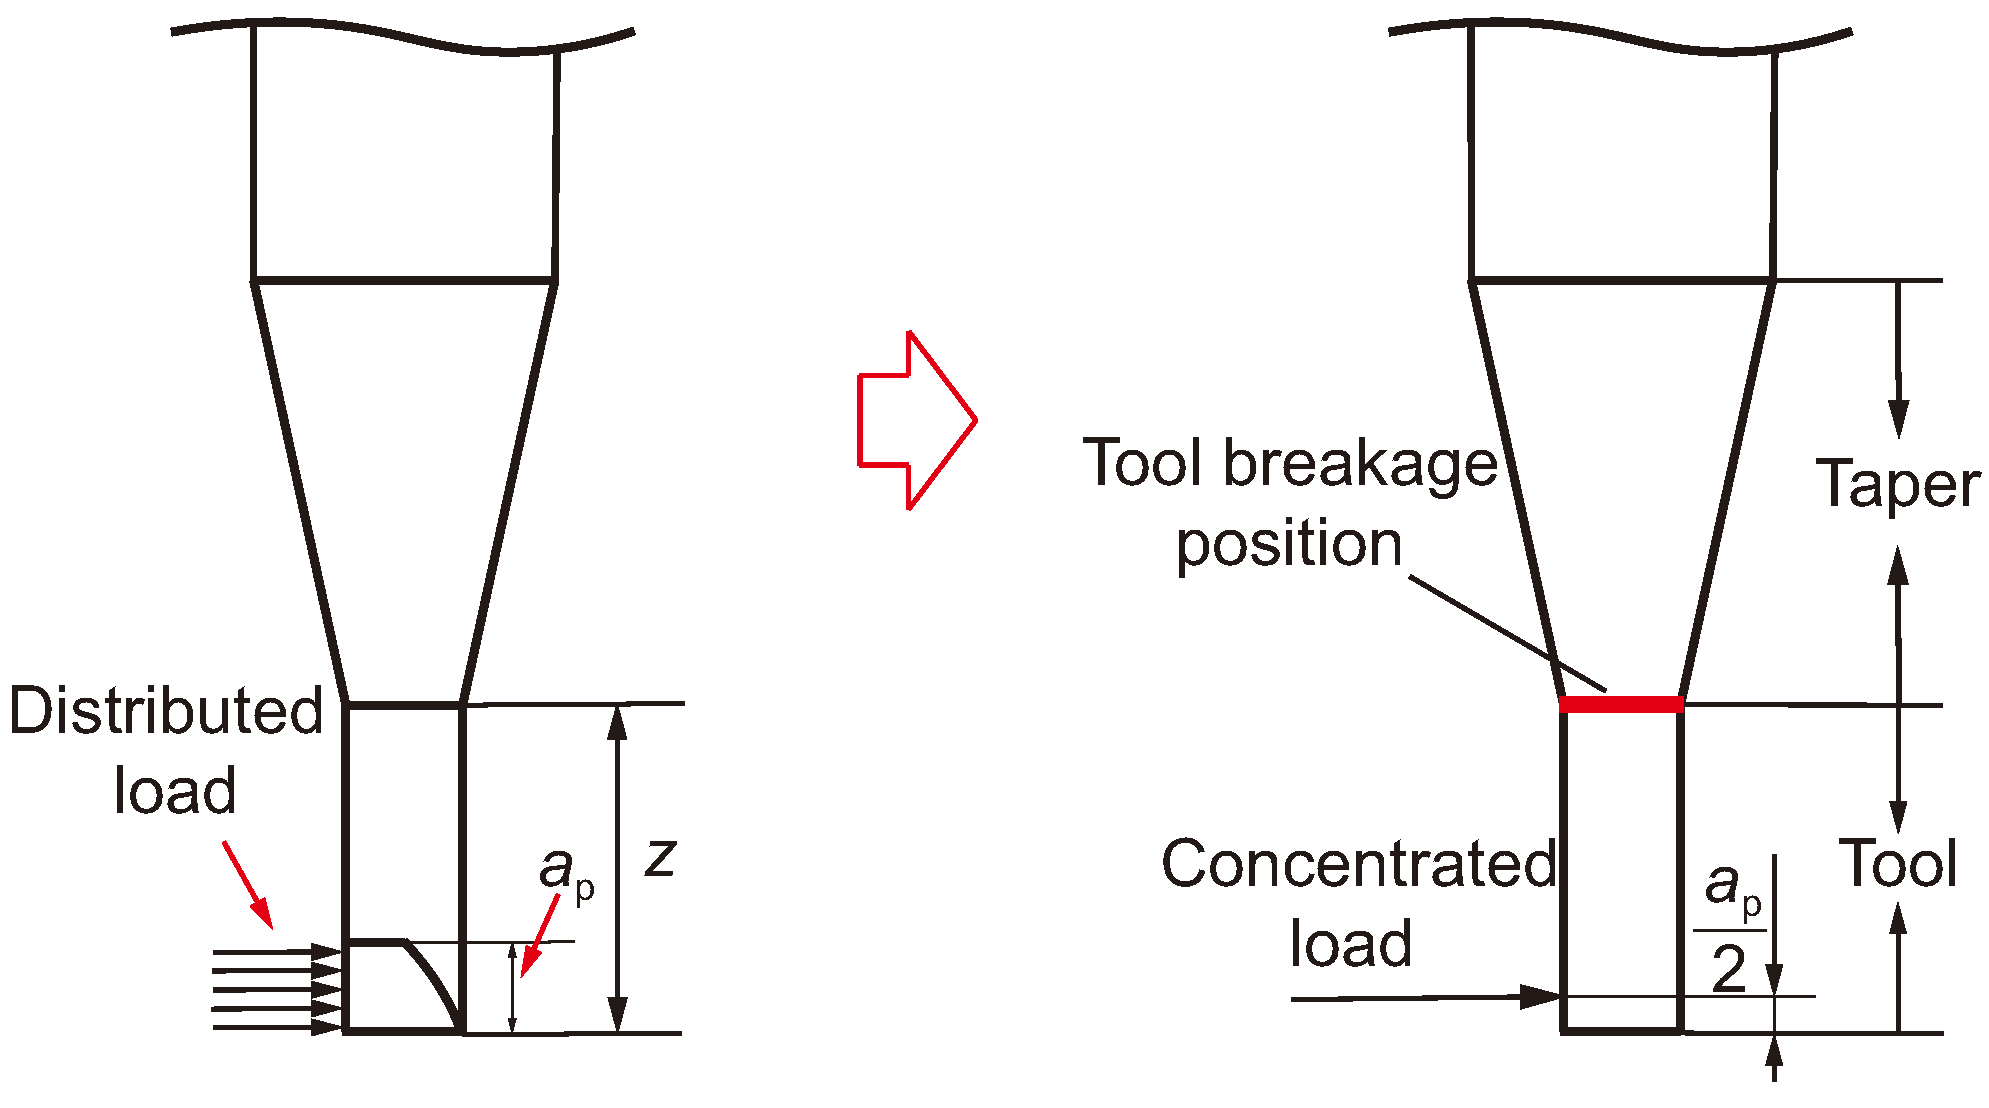
According to Lu et al. [20], the maximum bending stress of a micro-milling cutter occurs at the location of transition between the tool and taper of the micro-milling cutter. In this paper, the maximum bending stress is calculated by simplifying the distributed load on the micro-milling cutter to a concentrated load, which is positioned at a distance of /2 from the tip of the cutter, as illustrated in Figure 4.

Figure 4.
Illustration of calculation of maximum bending stress.
Considering the tool part of the micro-milling cutter as a cantilever beam, the maximum bending stress of the micro-milling cutter can be expressed as follows:
where and are the maximum bending stress and bending moment of the micro-milling tool with feed per tooth of and axial depth of cut of . is the diameter of the micro-milling tool. z is the axial length of the tool, as defined in Figure 4. is the instantaneous immersion angle of the current tooth. is the maximum total cutting force. and are the maximum cutting forces in the x and y directions, respectively.
2.2.3. Prediction of Stability Considering Tool Breakage
Actually, the maximum bending stress, denoted as , refers to the maximum bending stress induced by the cutting parameters and can be expressed as (, ). The ultimate bending stress of the tool material is . With reference to Lu et al. [20], if the maximum bending stress of the tool exceeds 80% of the ultimate bending stress, the tool is considered to be at risk of breakage. At the same time, comparing this cutting parameter with the ultimate stable axial depth of cut , the following four situations will exist.
- case1If (, ) < 0.8 ∧ <(, ) ∈ (, )
- case2If (, ) ≥ 0.8 ∧ <(, ) ∈ (, )
- case3If (, ) < 0.8 ∧ ≥(, ) ∈ (, )
- case4If (, ) ≥ 0.8 ∧ ≥(, ) ∈ (, )
where ‘ (, )’ represents the cutting parameters for micro-milling with the feed per tooth of and the axial depth of cut of . ‘ (, )’ indicates that the cutting state is stable and safe for this group of cutting parameters. It means that neither chatter nor tool breakage occurs during the micro-milling process. Similarly, ‘ (, )’ indicates that the cutting process is stable but tool breakage occurs. ‘ (, )’ indicates that the cutting process is safe but cutting chatter occurs. ‘ (, )’ indicates that both chatter and tool breakage occur. The set in case 1 is the stability prediction considering tool breakage.
3. Experimental Validation
3.1. Verification of FRFs of Micro-Milling Tool
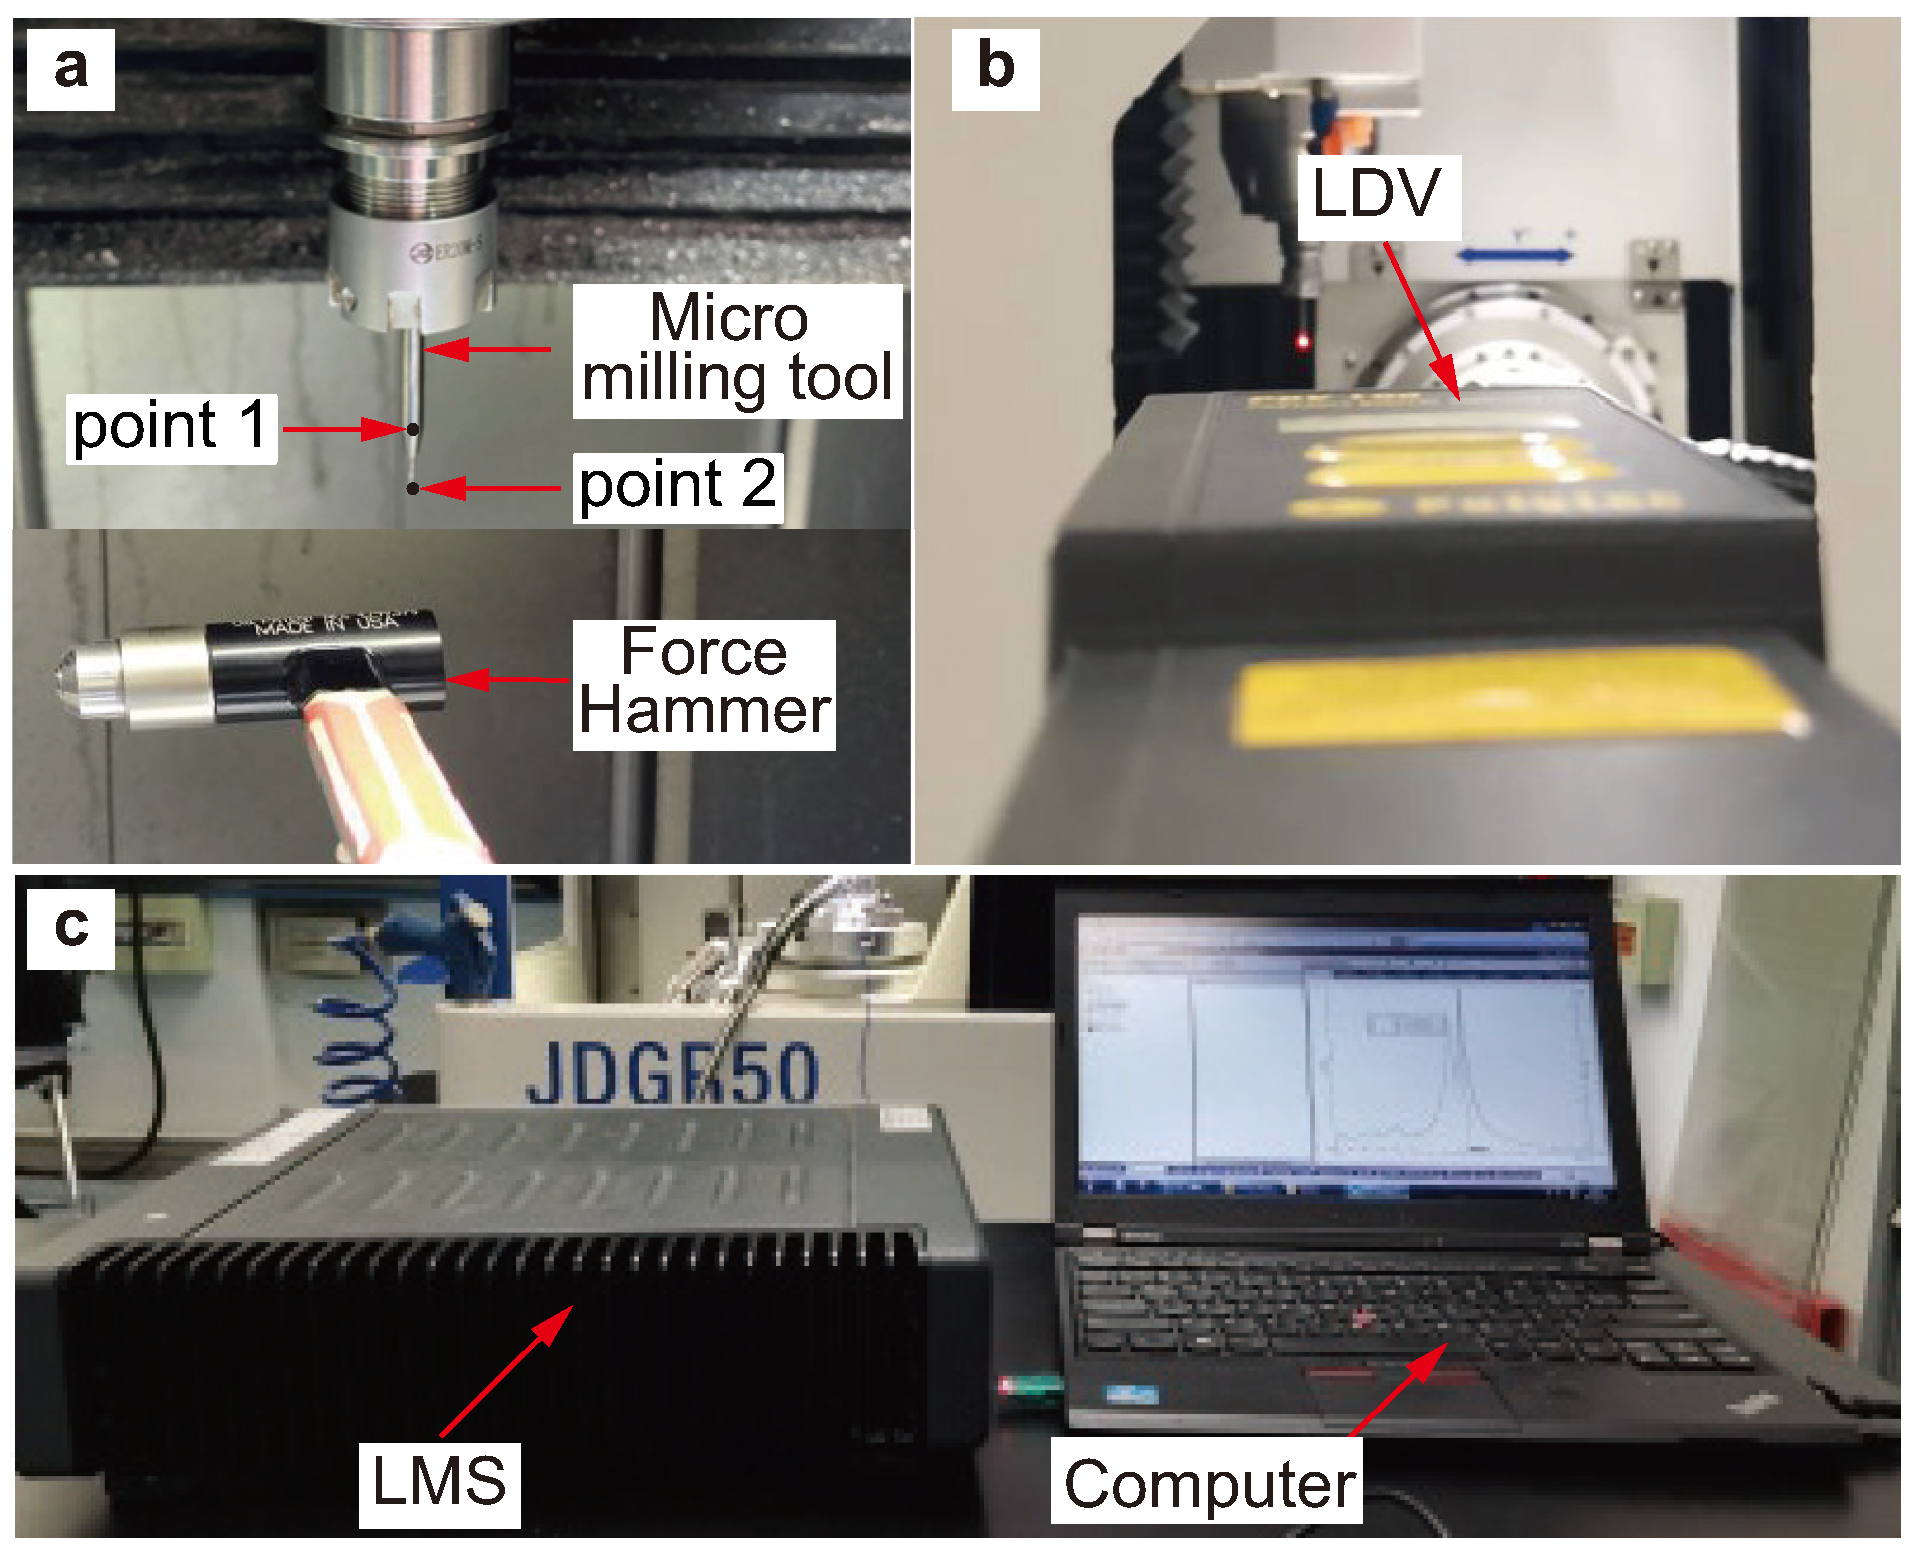
Validation experiments of tool tip FRFs are carried out using a two-fluted micro-milling cutter with a length of 50 mm. The diameters of the shank and tool of the micro-milling cutter are 4 mm and 1 mm, respectively. A commercial LDV (POLYTEC V100) and a force hammer are used to carry out a hammer impact test, as shown in Figure 5. Both excitation and response signals are collected by LMS Test Lab. The LDV is typically positioned on a tripod, which must be leveled to mount the LDV. Subsequently, the LDV is aimed at the object to be measured, and the laser spot is adjusted to be as small as possible based on the distance. Finally, the position of the LDV is fine-tuned to ensure that the signal received by the LDV is strong enough.

Figure 5.
Experimental equipment. (a) Equipment for excitation. (b) Equipment for measuring response. (c) Equipment for measuring excitation and response signals.
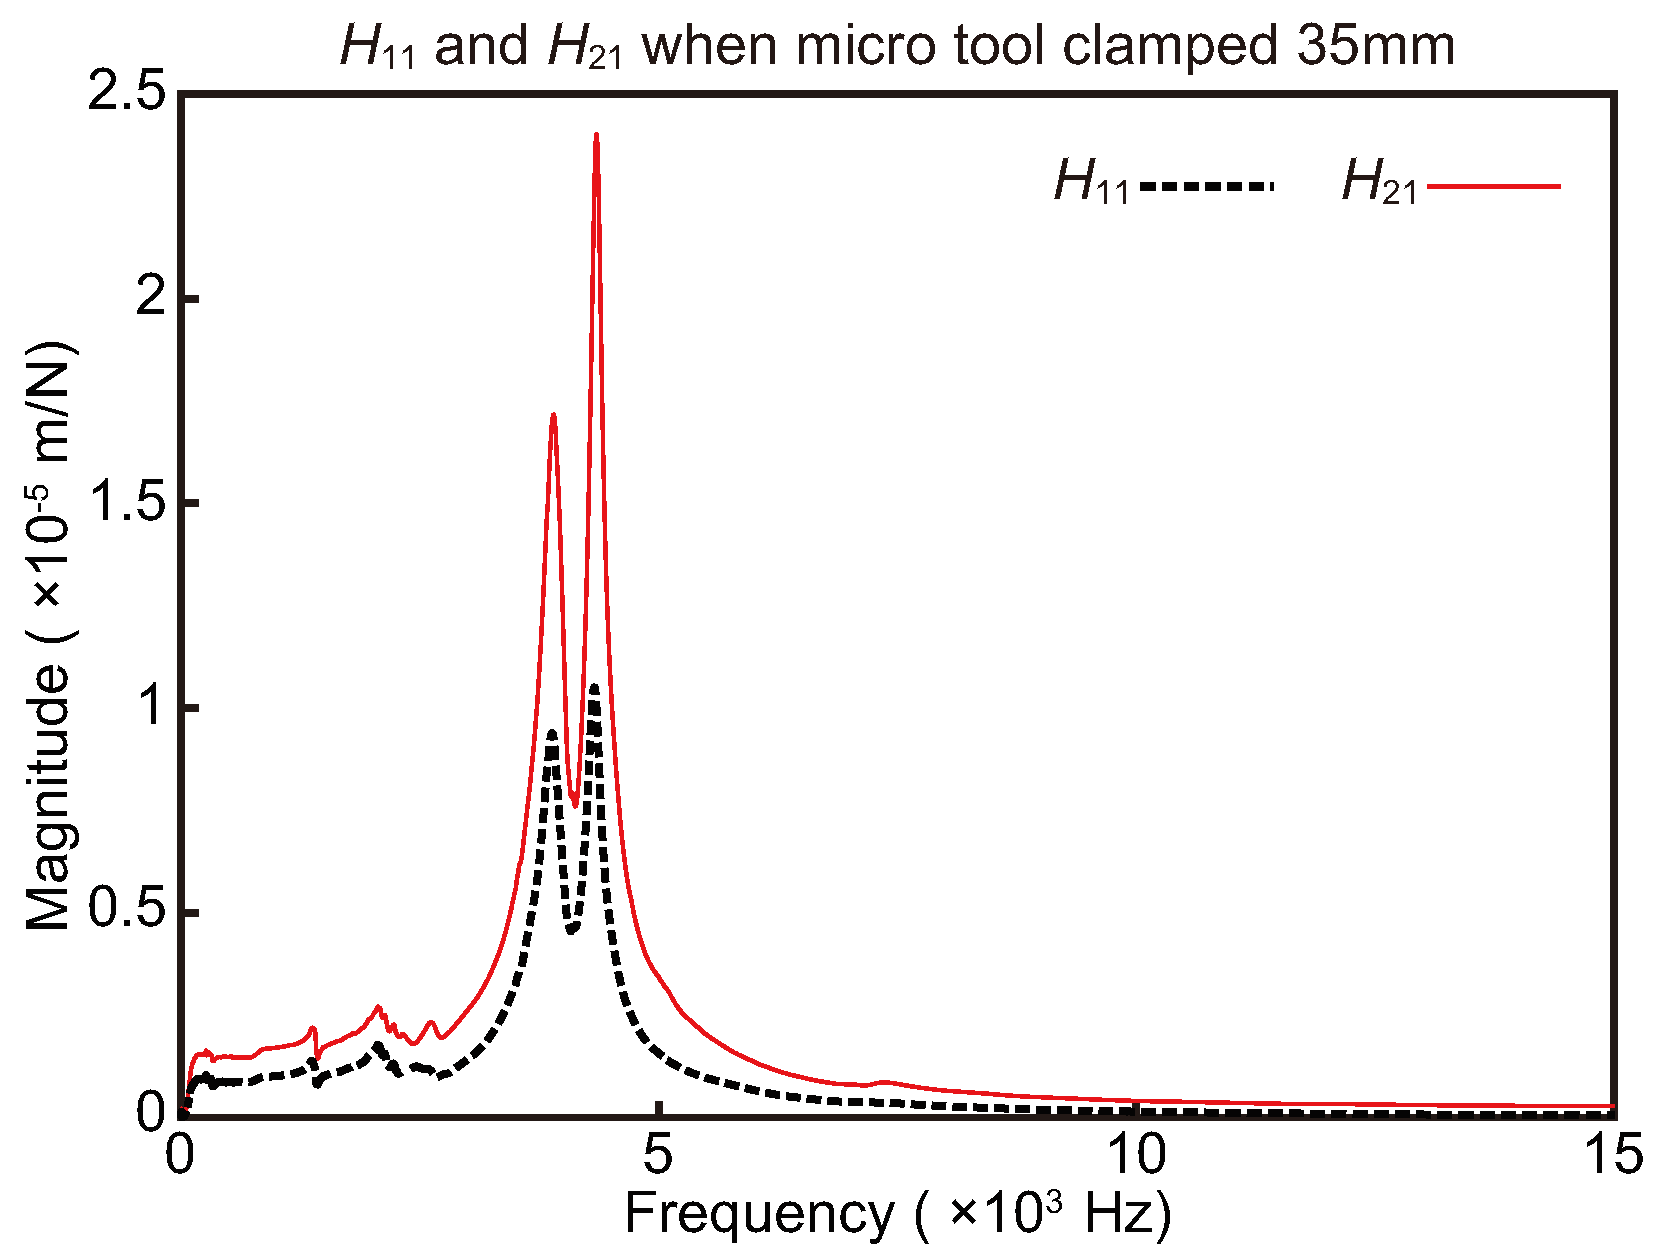
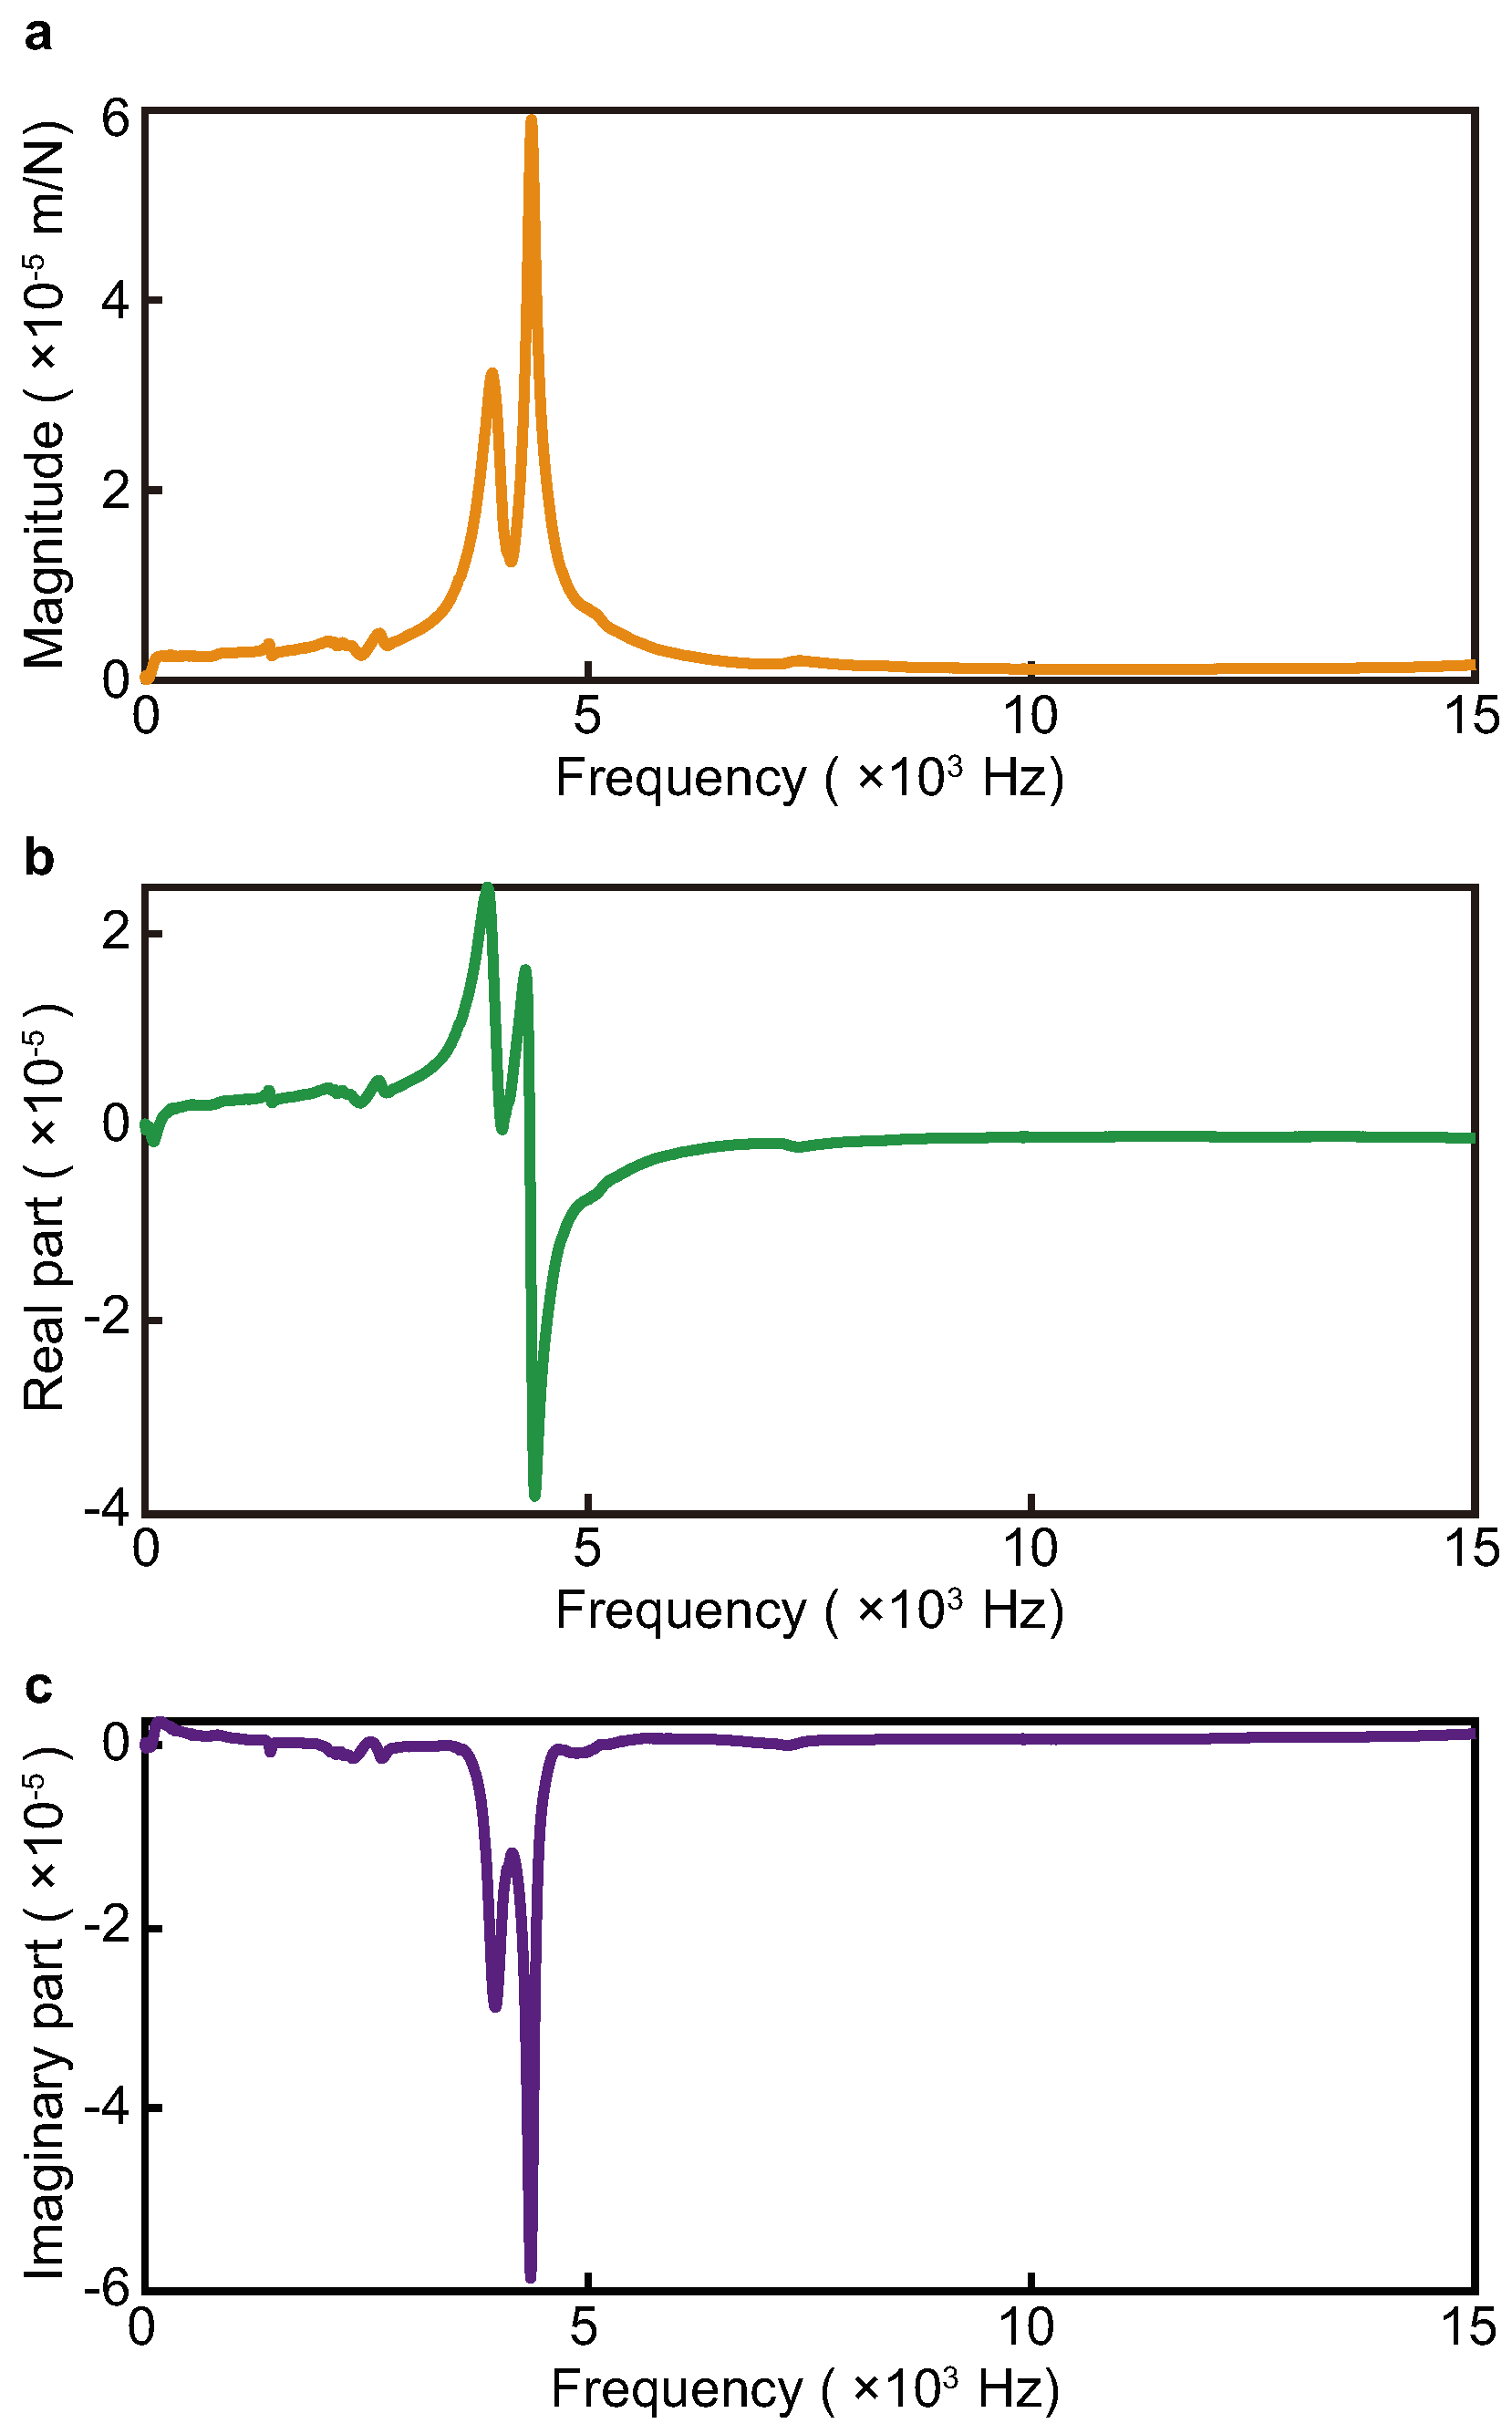
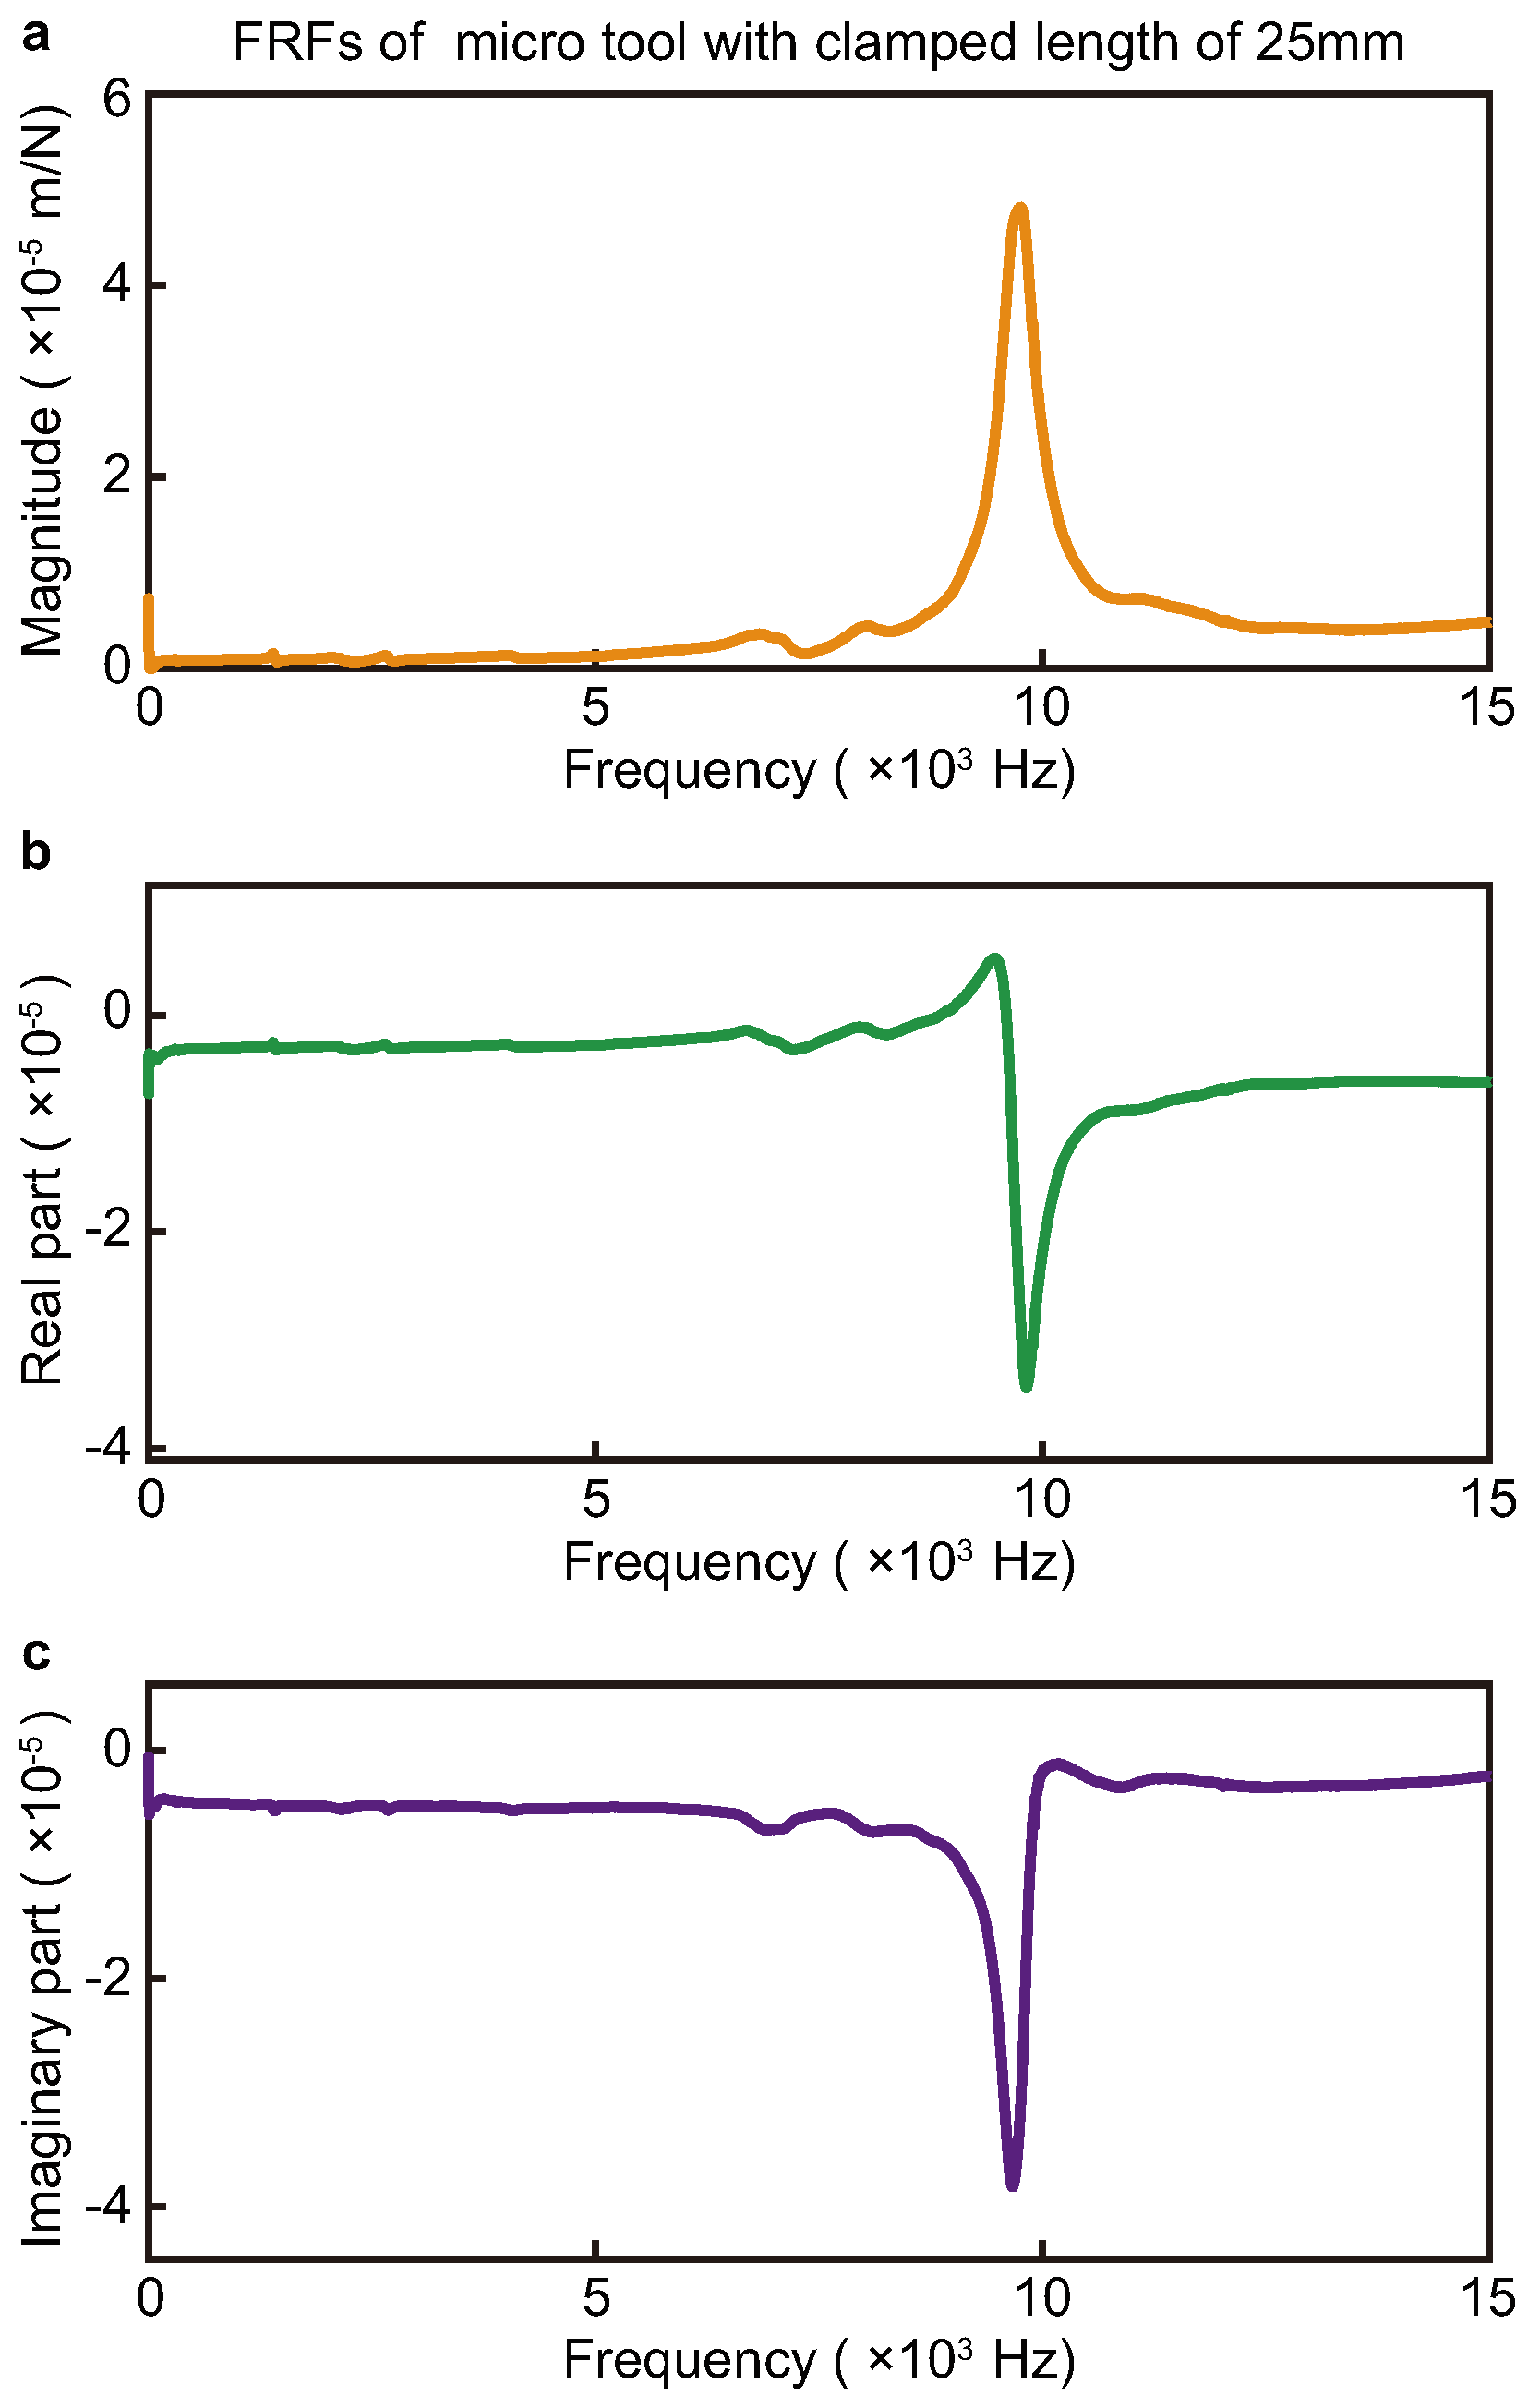
The micro-milling tool is clamped with a length of 35 mm on a 5-axis CNC machine. The geometric parameters of the cutter in Figure 2 are shown in Table 1. The excitation point is point 1 and the response points are points 1 and 2. To ensure result accuracy, each hammer impact test is repeated 15 times, and the final FRFs are determined by averaging these measurements. The direct FRFs of point 1 and cross-FRFs between points 1 and 2 are shown in Figure 6. The FRFs of the micro-tool clamped with a length of 35 mm can be calculated by Equation (6), and the result is illustrated in Figure 7. The proposed method needs to measure the response at the tip of the micro-milling cutter, which is susceptible to interference. Therefore, hammer impact tests may show poor coherence. In this case, a deliberately small excitation force should be used. The excitation generated by this force will only induce vibration in the tool itself, without generating additional signals, ensuring good coherence in the experiments. At the same time, the sensitivity of the excitation and response needs to be adjusted so that smaller physical quantities can be measured. Similarly, tool tip FRFs of a micro-milling tool with a clamped length of 25 mm can be obtained by the same experimental methods, and the results are shown in Figure 8.

Table 1.
Geometric parameters of micro-milling cutter.
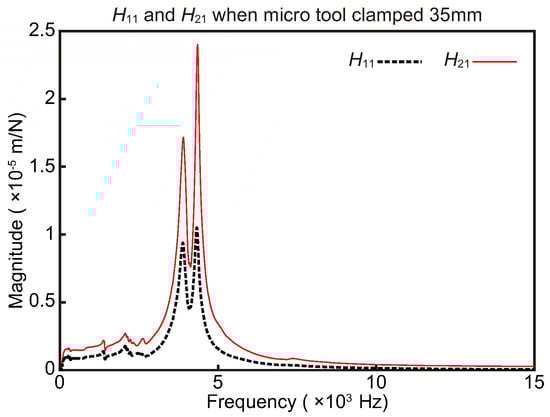
Figure 6.
FRFs of tool tip with clamped length of 35 mm.
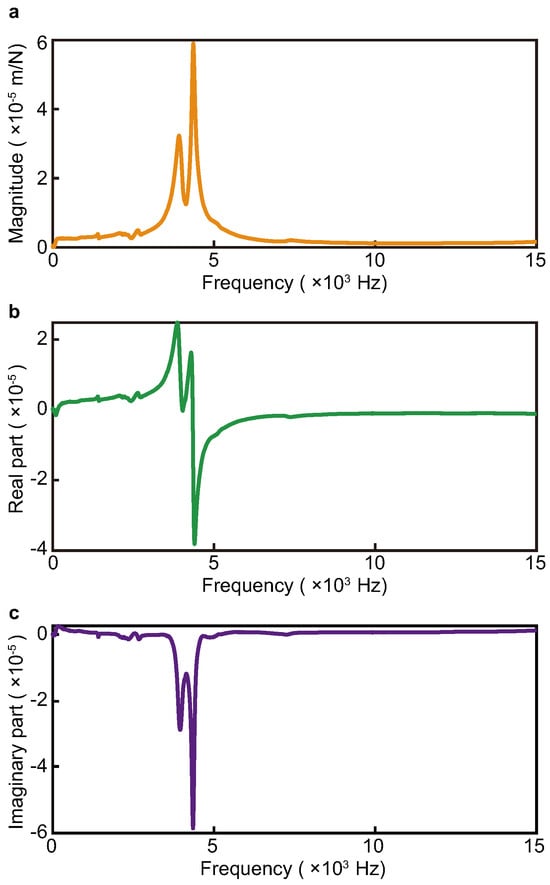
Figure 7.
FRFs of tool tip with clamped length of 35 mm. (a) Magnitude. (b) Real part. (c) Imaginary part.
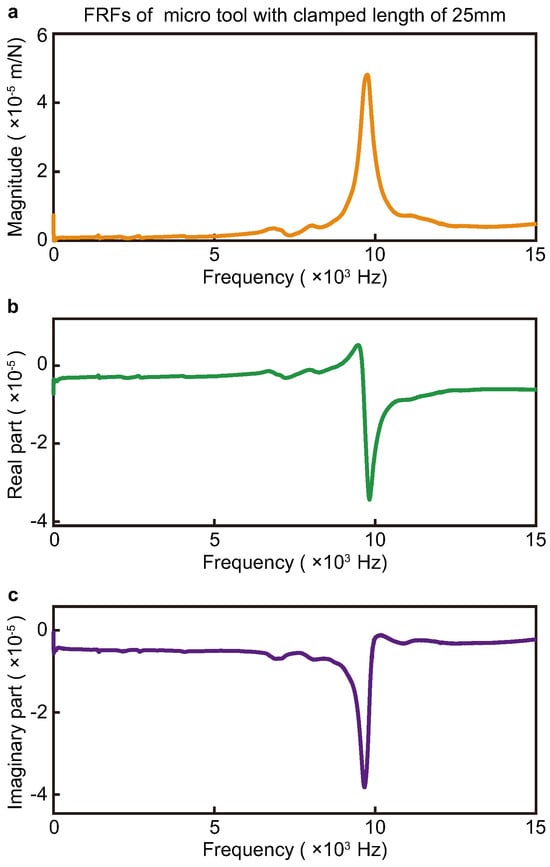
Figure 8.
FRFs of tool tip with clamped length of 25 mm. (a) Magnitude. (b) Real part. (c) Imaginary part.
Referring to Figure 7 and Figure 8, it is found that as the tool clamped length is shortened, the natural frequency is increased substantially, thus leading to an increase in the cutting stability domain. Subsequently, based on the least-squares fitting technique, the modal parameters corresponding to the tool clamped lengths of 35 mm and 25 mm are calculated and are shown in Table 2. It is worth noting that modal parameters are the important inputs for predicting SLDs.
Table 2.
Modal parameters of micro-milling tool.
3.2. Verification of Tool Breakage
3.2.1. Determination of Ultimate Bending Stress
Experiments on ultimate bending stress are carried out using three cutters with a diameter of 0.5 mm. The length of the tool part of these cutters is 6 mm. A Kistler 9119AA2 is used to measure the breaking forces applied at the tool tip. The tool part of the micro-milling cutter is modeled as a cantilever beam and the breaking force of the cutter is used to calculate the ultimate bending stress.
Two of these three cutters are used for static tests and the other one for dynamic tests. The procedure is as follows. The z-coordinate of the surface of the workpiece is defined as 0, and the coordinate of the tip of the first cutter with a clamped length of 35 mm is set to −0.05 mm. Subsequently, the machine feeds in the x-direction with a feed per tooth of 0.001 mm until the tool breaks, with the forces on the workpiece being measured simultaneously. The above steps are repeated to measure the broken force of the second cutter without the loss of generality. To ensure the accuracy of results, cutting experiments are carried out with a feed per tooth of 0.05 mm and an axial depth of cut of 0.3 mm. The tool breakage force is still measured. Ultimately, the measured tool breakage forces corresponding to the three tools are 7.8 N, 7.6 N, and 7.2 N, respectively. The proximity of the three sets of experimental results illustrates the reliability of the experimental results. Substituting the dynamic breaking force into Equation (10), the ultimate bending stress of the tool material is Pa.
3.2.2. SLDs Considering Tool Breakage
The cutting force coefficients and constants involved in the micro-milling force model, i.e., Equations (8) and (9), are determined by using the method reported by Wen et al. [24], and the calibrated results are listed in Table 3 and Table 4.
Table 3.
Cutting force coefficients and constants of ploughing effect.
Table 4.
Cutting force coefficients and constants of ploughing effect.
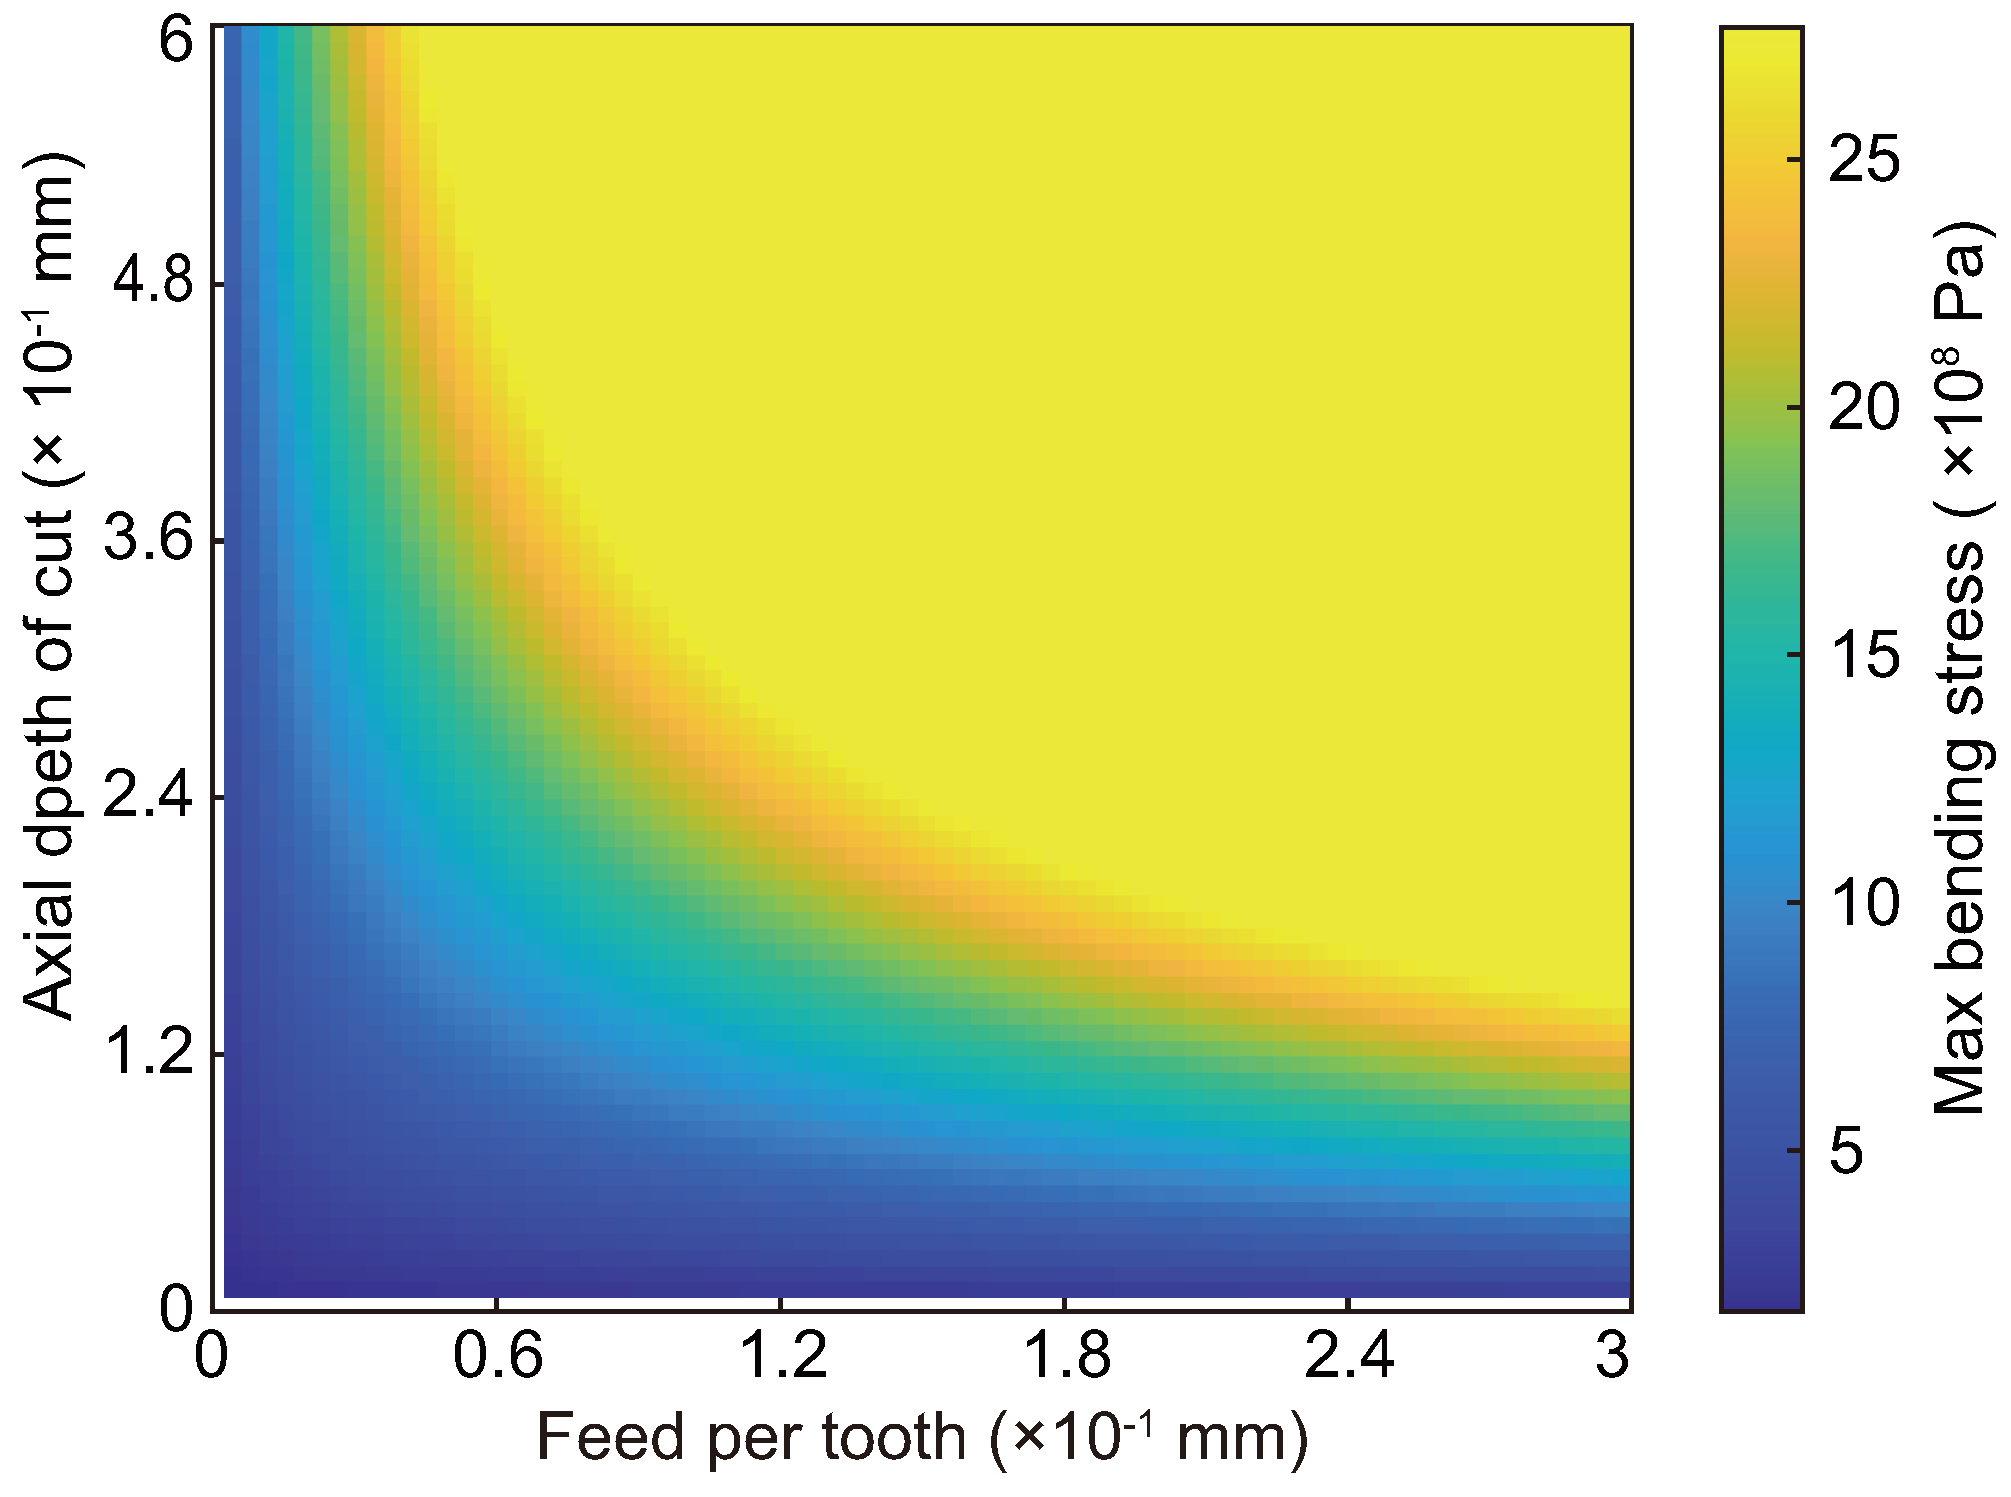
The length of the tool part of the micro-milling cutter is 6 mm. The diameter of the tool is 1 mm. The ultimate bending stress of the micro-tool is 3.3369 × Pa. By substituting these data as well as the cutting force coefficients and constants into Equations (8)–(14), the maximum bending stress at the corresponding cutting parameters can be calculated. When the bending stress during cutting reaches 80% of the ultimate bending stress, the tool is considered to be at risk of breakage.
The maximum bending stress of a 1 mm diameter micro-milling cutter with different cutting parameters, i.e., feed per tooth and axial depth of cut, can be obtained and is shown in Figure 9. The horizontal axis of Figure 9 is the feed per tooth, while the vertical axis is the axial depth of cut. The cloud shown in Figure 9 indicates the maximum bending stress of the tool at the corresponding cutting parameter couple. The value of the maximum bending stress can be determined according to the color scale on the right-hand side of Figure 9. In order to give a better indication of the critical cutting parameter that leads to tool breakage, when the maximum bending stress exceeds the ultimate bending stress of the tool material, the maximum bending stress is replaced with the ultimate bending stress. Therefore, the bending stress in the upper right region of Figure 9 is uniform yellow, and the color remains unchanged. This yellow region corresponds to all the cutting parameters for which tool breakage will occur. The cutting parameters corresponding to the yellow areas in Figure 9 will cause tool breakage. The relationship between the critical axial depth of cut, at which breakage just occurs, and the feed per tooth, illustrates the tool breakage curve for the cutter, as shown in Figure 10. The region below this line is the cutting safety area, while the region above this line is the dangerous region where breakage will occur. This curve can be combined with the predicted SLDs to judge the state of the cutting process. According to the modal parameters given in Table 2, the SLDs of micro-milling are predicted based on the semi-discrete method. It should be noted that when the tool overhang length is 35 mm, the first- and second-order modes of the tool are very close to each other, and the lowest envelope of the two modes is taken as the final SLDs. Combined with the tool breakage curve, the stability predictions considering tool breakage can be obtained, and results corresponding to the two micro-milling cutters with clamped lengths of 35 mm and 25 mm are shown in Figure 11 and Figure 12, respectively.
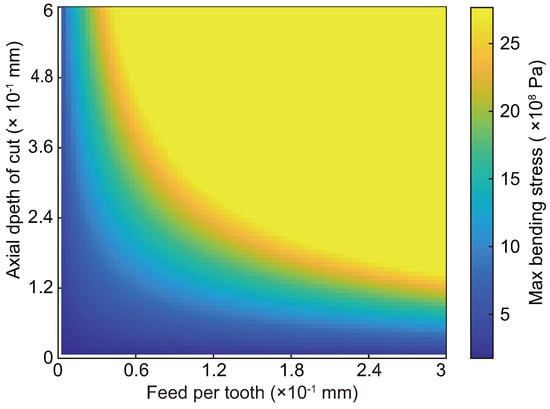
Figure 9.
Maximum of bending stress of a micro−milling cutter with diameter of 1 mm.
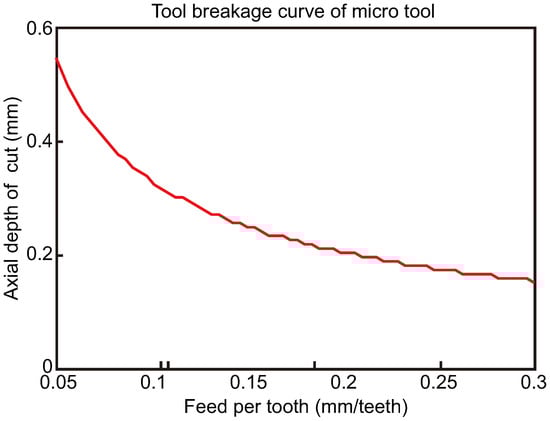
Figure 10.
Breakage curve of micro−milling cutter.

Figure 11.
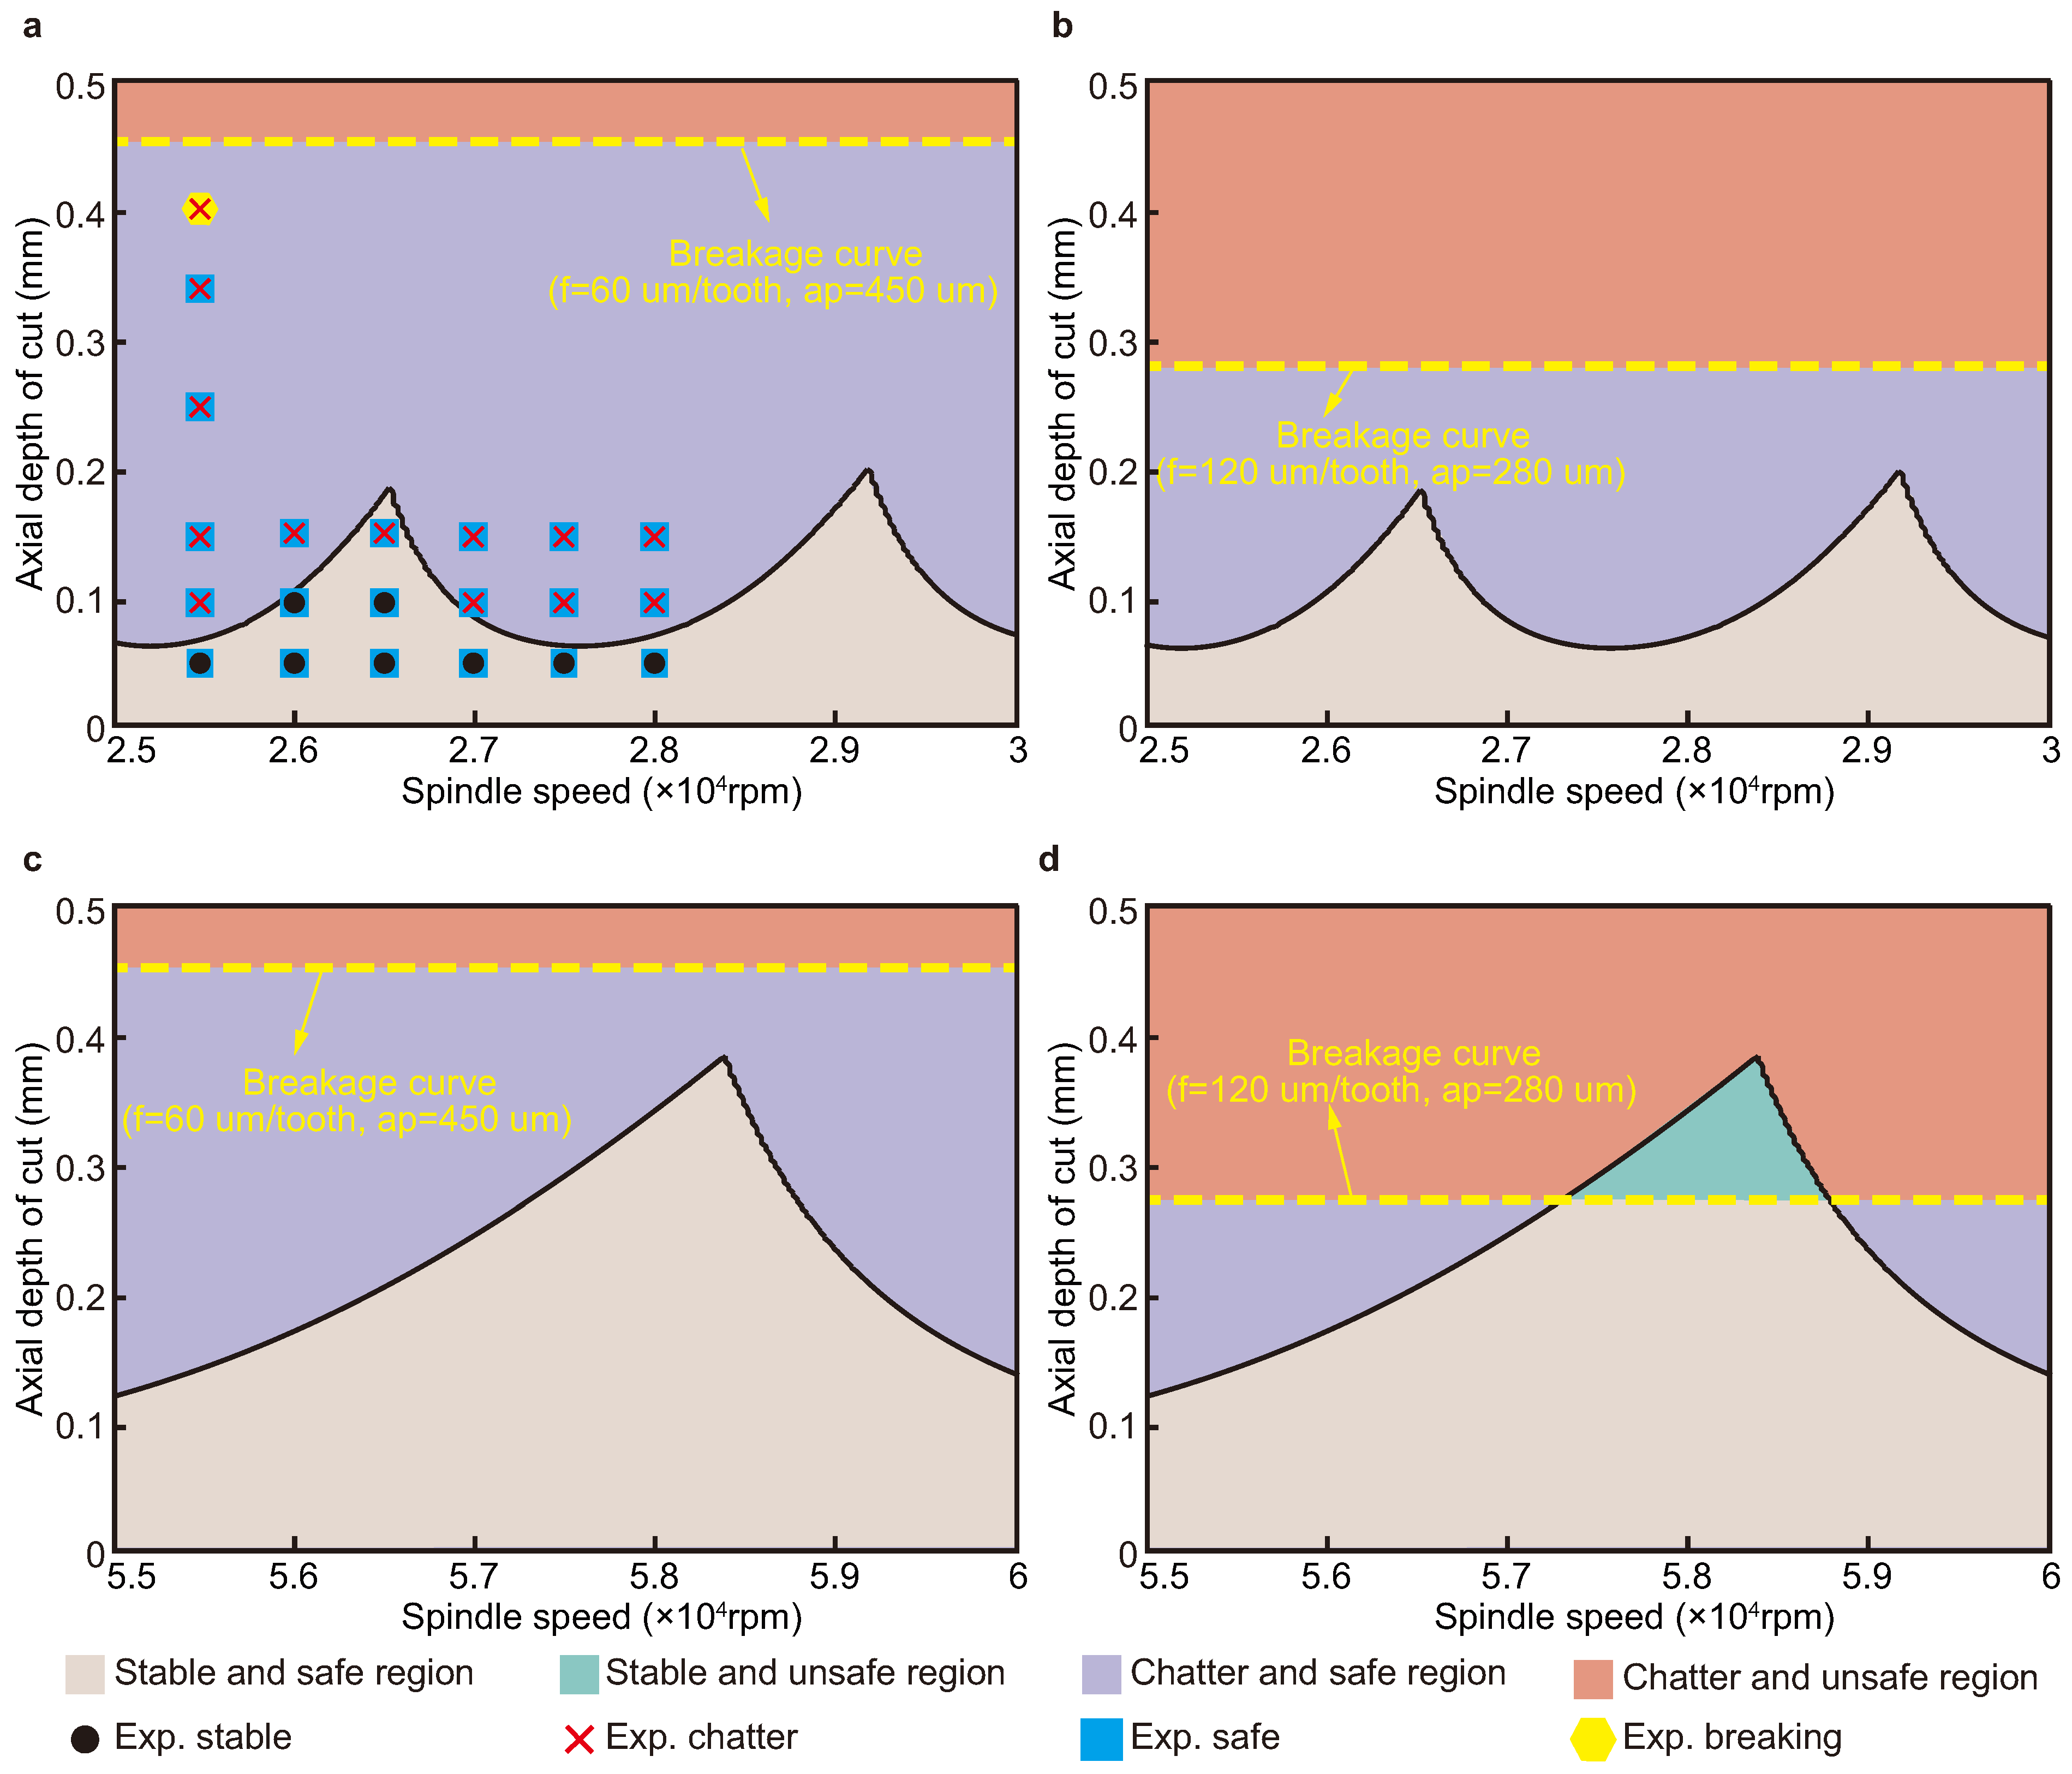
SLDs considering tool breakage with clamped length of 35 mm. (a) SLDs considering tool breakage when feed per tooth is 60 m and the spindle speed is from 25,000 to 30,000 rpm. (b) SLDs considering tool breakage when feed per tooth is 120 m and the spindle speed is from 25,000 to 30,000 rpm. (c) SLDs considering tool breakage when feed per tooth is 60 m and the spindle speed is from 55,000 to 60,000 rpm. (d) SLDs considering tool breakage when feed per tooth is 120 m and the spindle speed is from 55,000 to 60,000 rpm.

Figure 12.
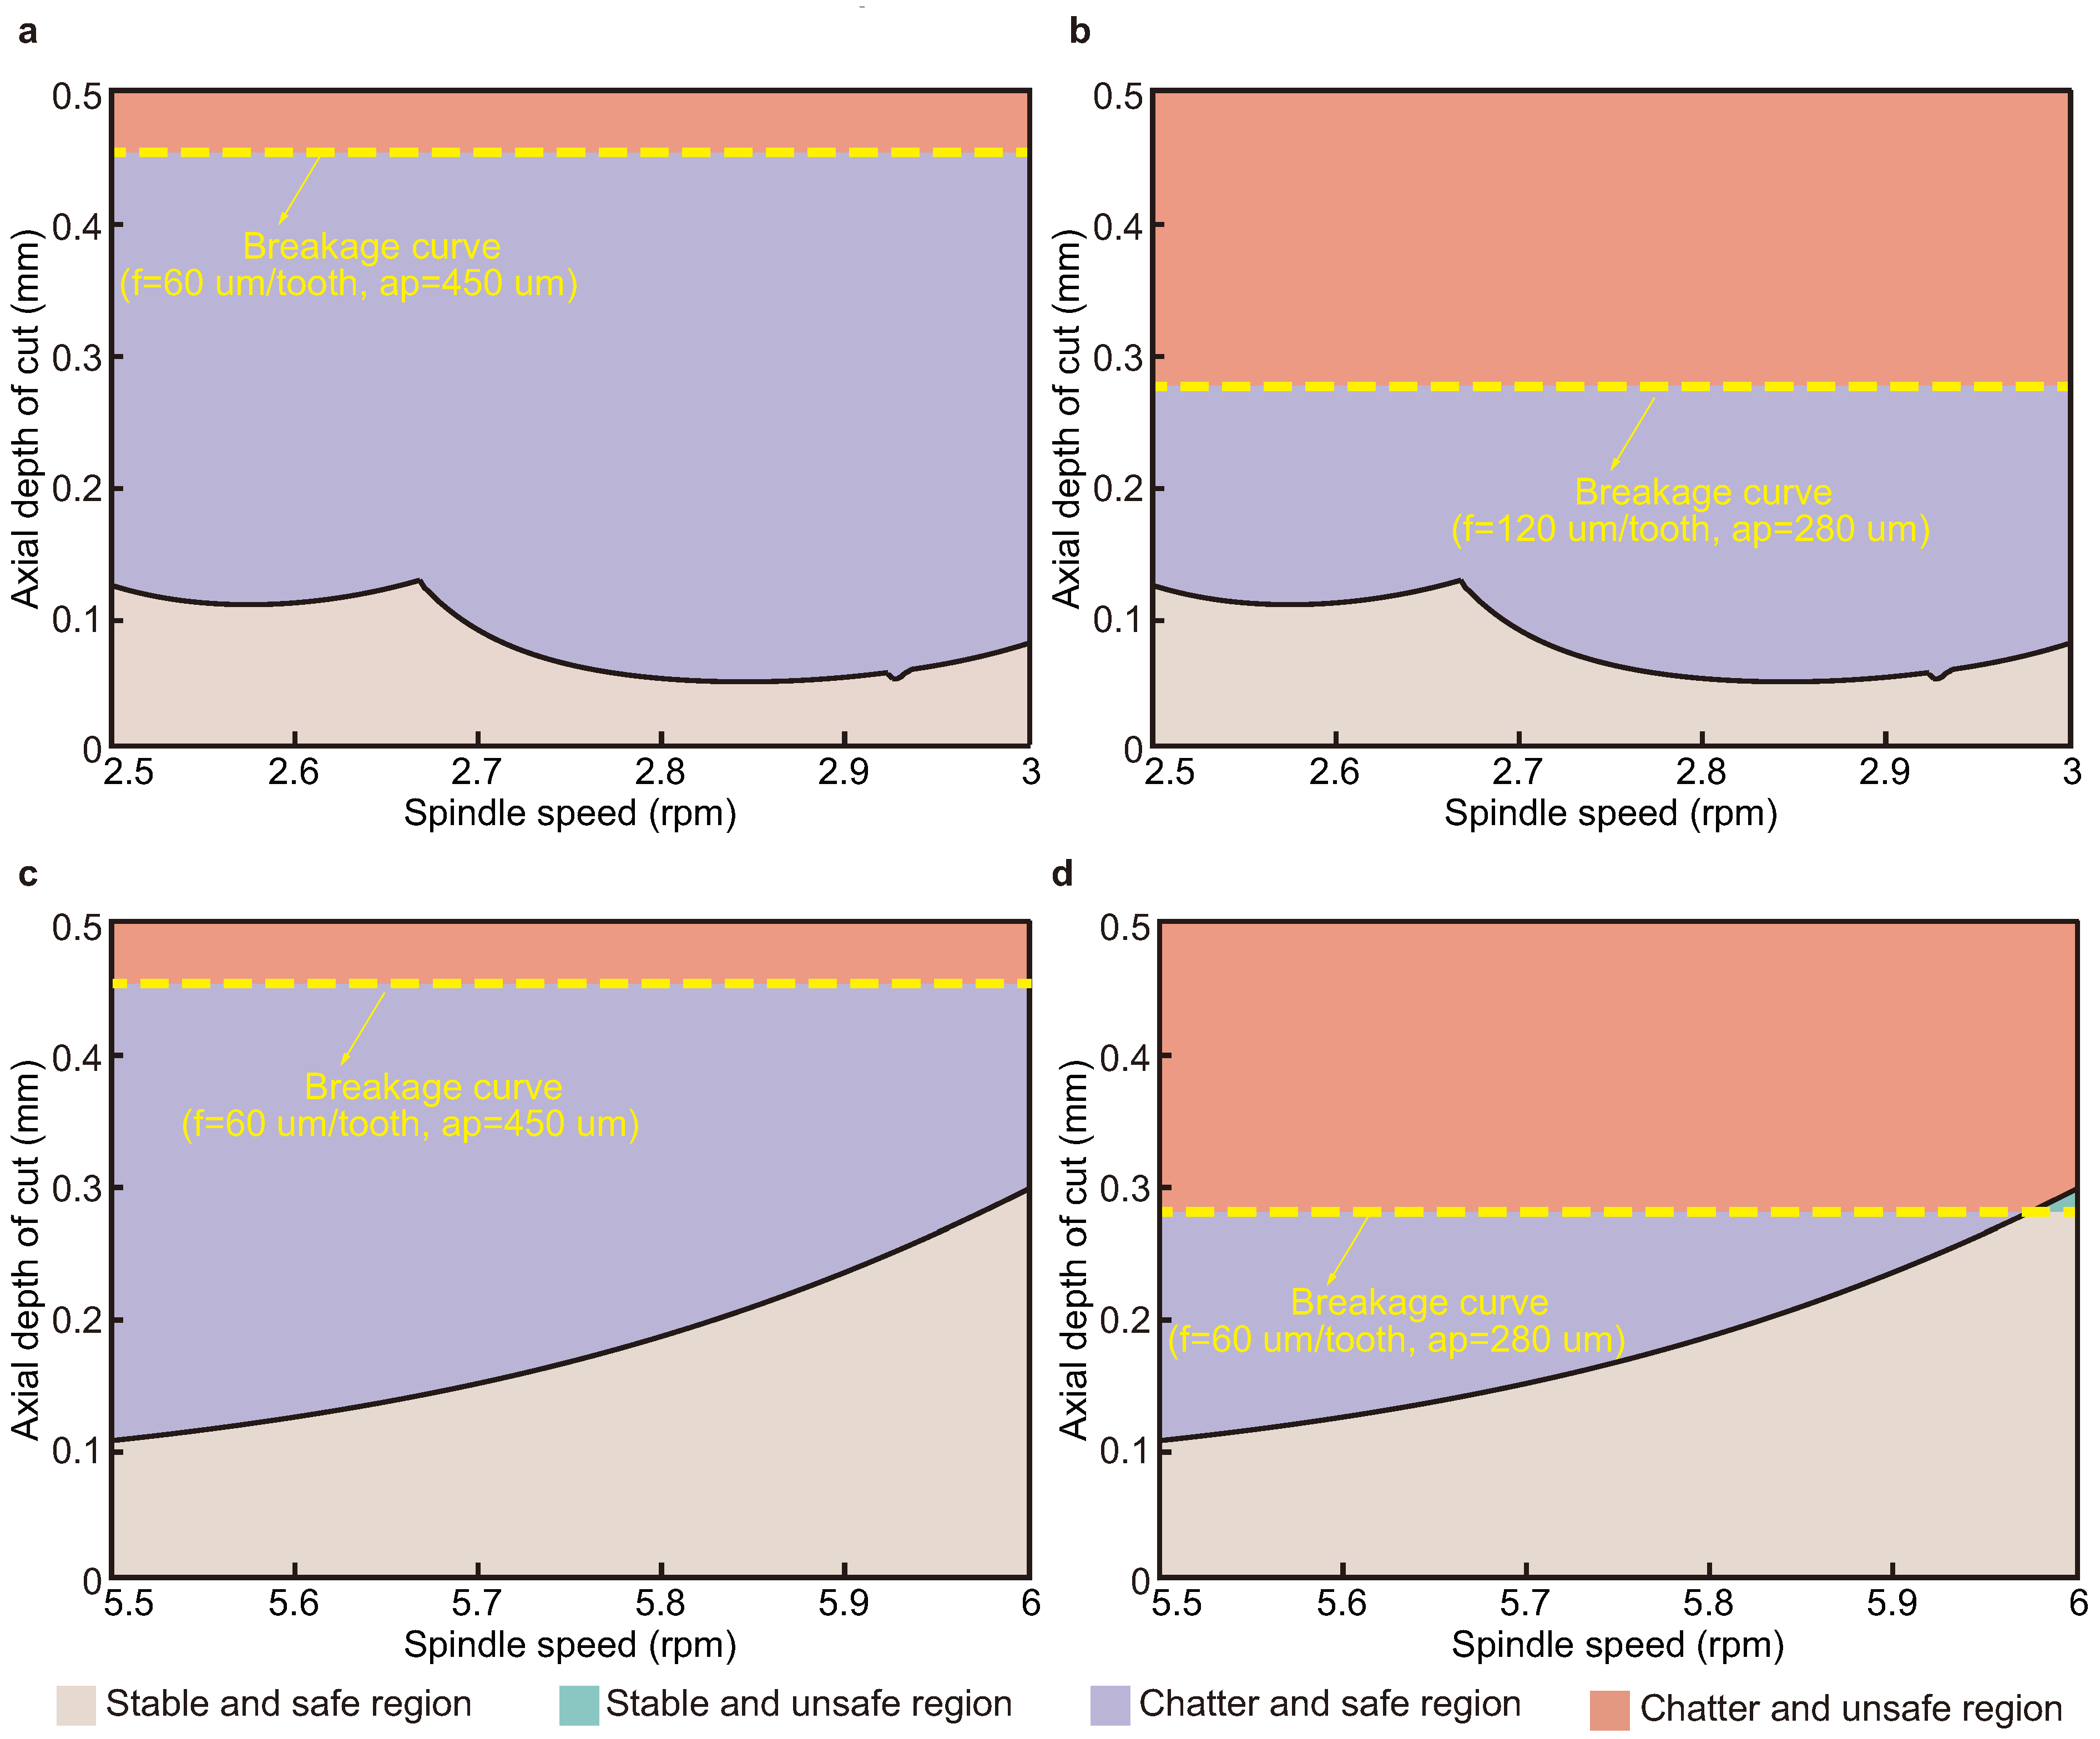
SLDs considering tool breakage with clamped length of 25 mm. (a) SLDs considering tool breakage when feed per tooth is 60 m and the spindle speed is from 25,000 to 30,000 rpm. (b) SLDs considering tool breakage when feed per tooth is 120 m and the spindle speed is from 25,000 to 30,000 rpm. (c) SLDs considering tool breakage when feed per tooth is 60 m and the spindle speed is from 55,000 to 60,000 rpm. (d) SLDs considering tool breakage when feed per tooth is 120 m and the spindle speed is from 55,000 to 60,000 rpm.
In this paper, the following four regions are defined. The region above the SLDs is defined as the chatter region, while the region below it is defined as the stable region. Similarly, the region above the tool breakage curve is defined as the unsafe region, while the region below tool breakage curve is defined as the safe region. According to these definitions, it can be found that after considering tool breakage, the SLDs, which originally only involve stable and chatter regions, are divided into four regions, i.e., stable and safe region, chatter and safe region, stable and unsafe region, and chatter and unsafe region, as delineated in Figure 11 and Figure 12. In practical cutting situations, unsafe cutting conditions and chatter must be avoided. The ideal situation is the one shown in Figure 11a–c and Figure 12a–c, where all stabilized cutting parameters guarantee safe cutting. The most important case to note is the occurrence of tool breakage in the stable region, which is the blue area in Figure 11d and Figure 12d. The stable cutting region will be split into safe and unsafe regions. The cutting parameters in the unsafe region cannot be used for actual machining, and thus, the occurrence of this situation can also be regarded as a reduction in the stable region. Since the parameters that enable tool breakage in the paper all occur at a spindle speed of 60,000 rpm, the accuracy of the methodology of this paper is demonstrated by using a simulation to simulate tool breakage due to limited experimental conditions. It is worth stating that the tool material and workpiece material will affect the final distribution of the above four regions, and the machining parameters can be selected according to the actual situation.
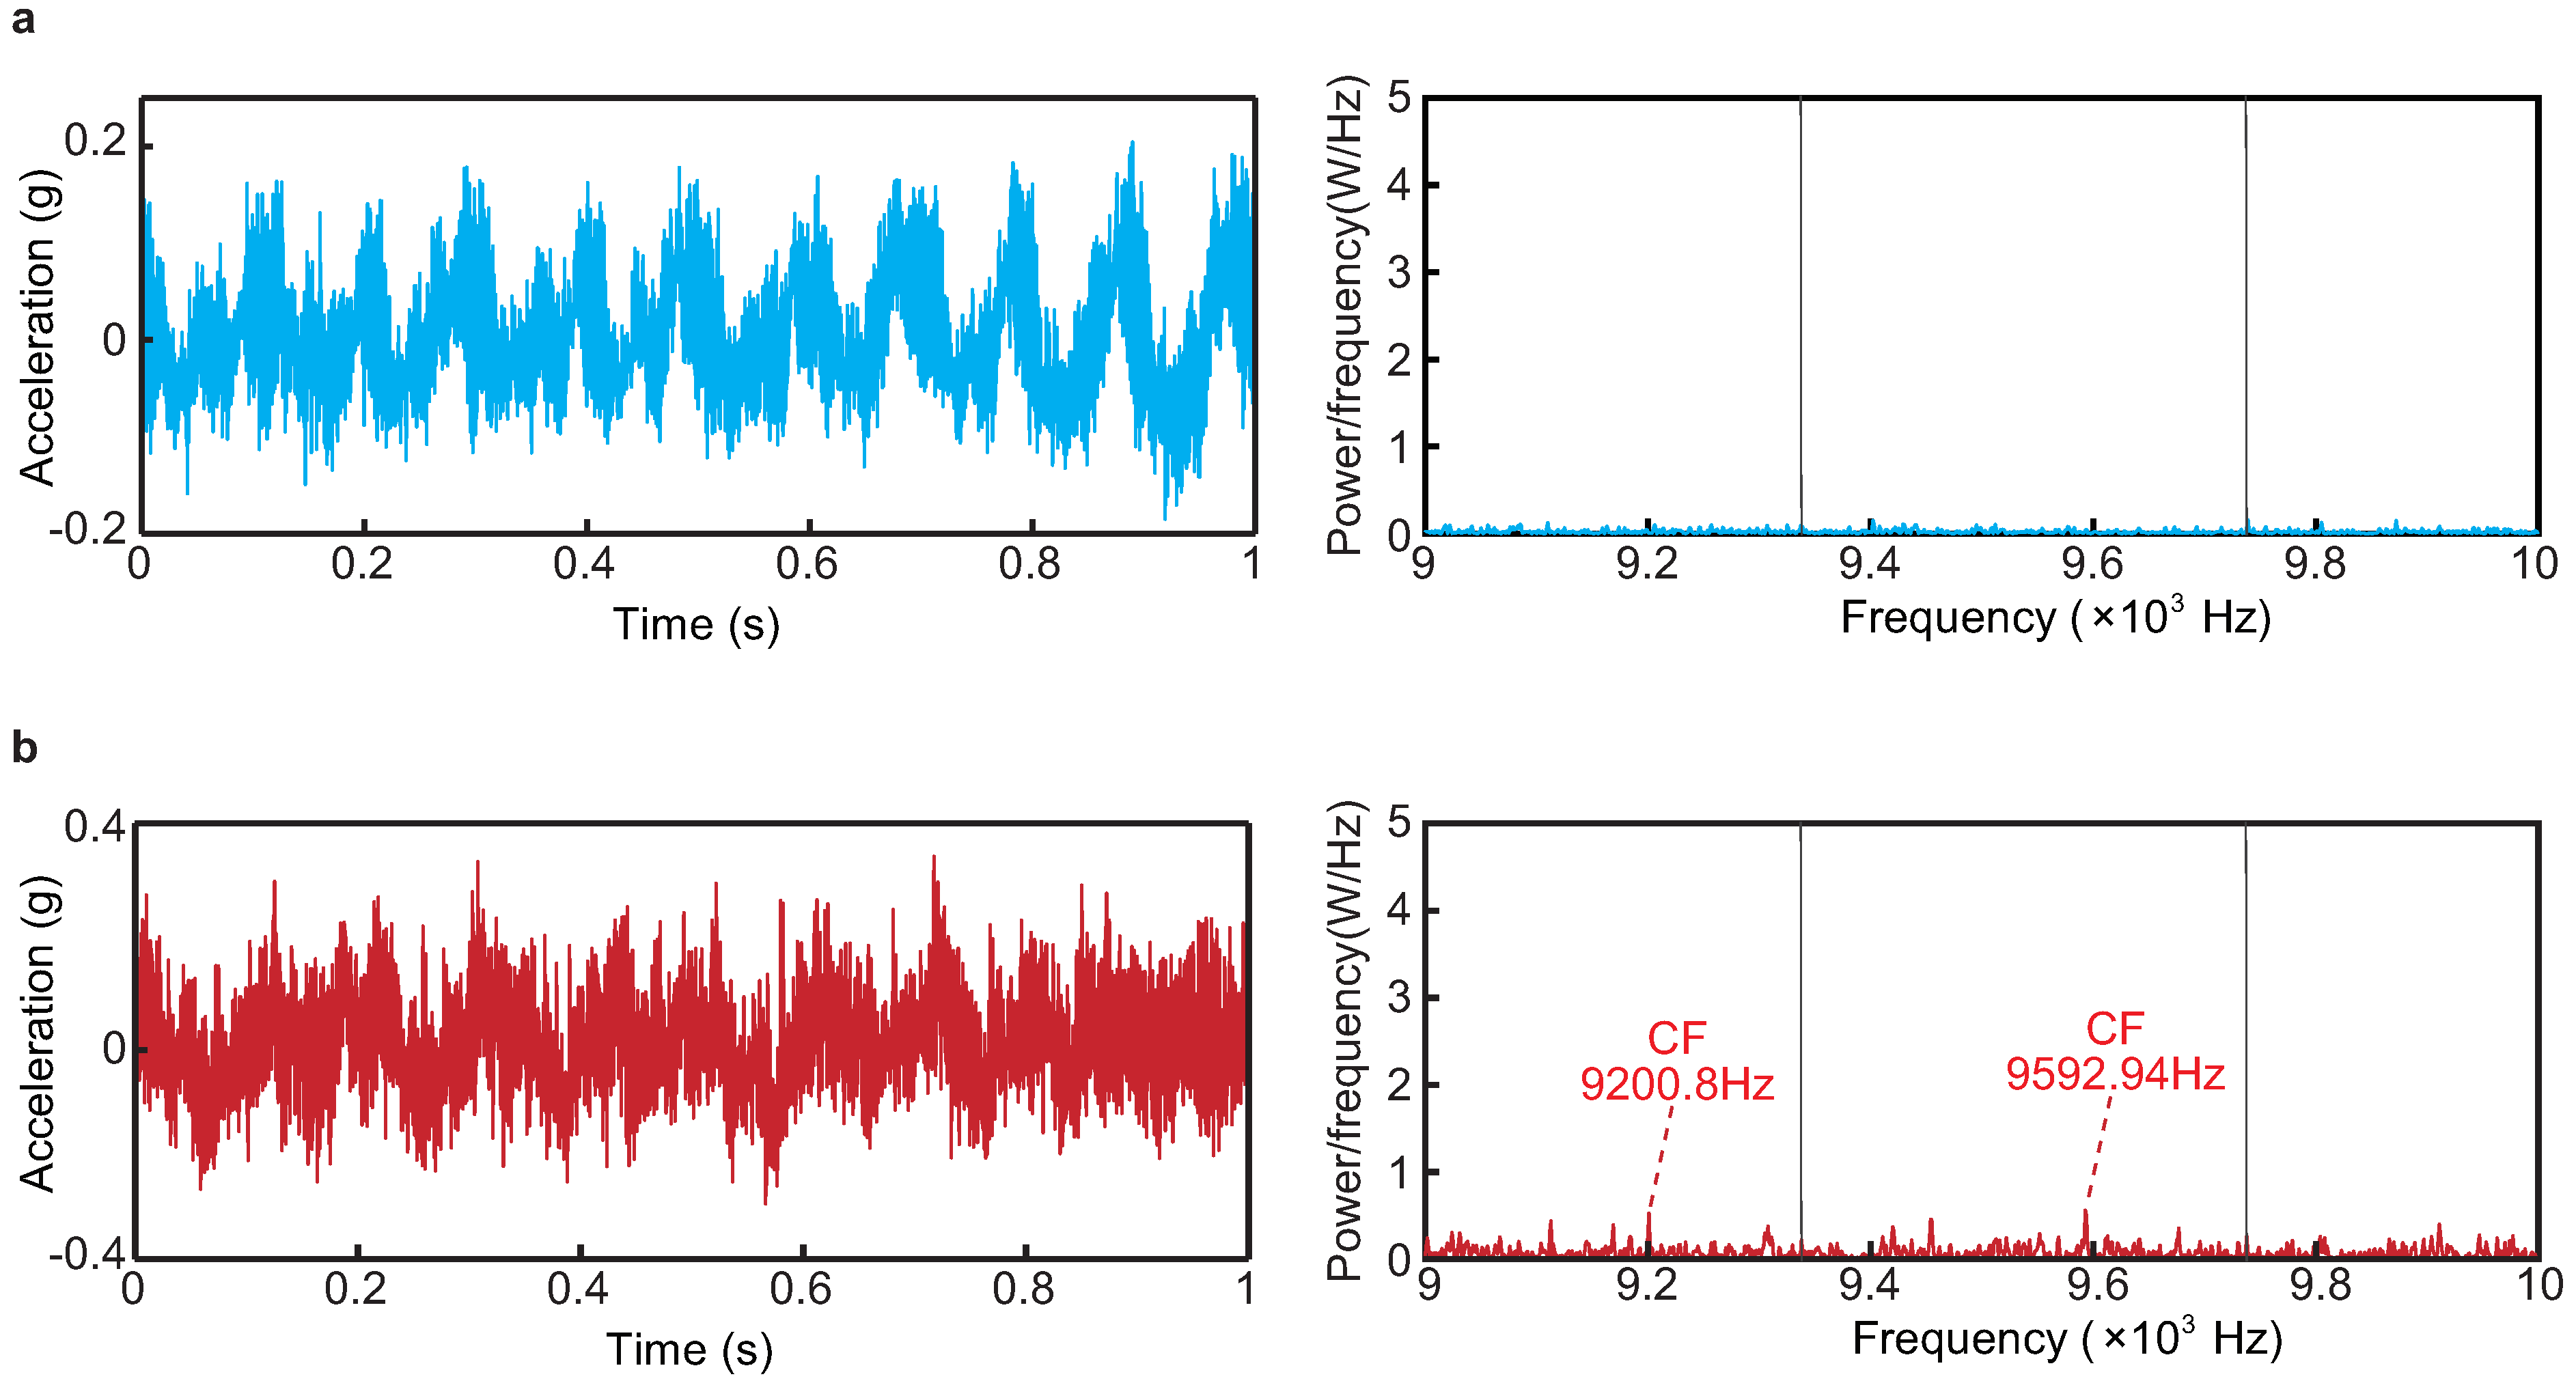
Figure 12a is obtained to verify the proposed model by existing experimental means. On the one hand, the accuracy of the SLDs is verified. When the spindle speed is 25,500 rpm and the axial depths of cut are 50 and 150 m, the acceleration signals of the workpiece as well as the power spectrum signals after filtering by the variable forgetting factor recursive least-squares (VFF-RLS) algorithm are given in Figure 13. The chatter identification method used in this paper is taken from the method proposed by Wan et al. [30]. The method takes into account the effect of environmental noise. If the cutting is stable, there is almost nothing in the filtered signal for stable cuts. If the cutting is chatter, the chatter components of the signal are retained after filtering. Similar to Wan et al. [30], in this paper, accelerometers are also positioned on the side of the workpiece. The acceleration signals from the vibration of the workpiece are utilized to determine whether or not chatter occurs during the cutting process. From Figure 13, it can be seen that when the axial depth of cut is 50 m, the magnitude of the filtered signal almost equals 0, while when the axial depth of cut is 150 m, the corresponding chatter signal with a higher magnitude appears after filtering. This indicates that the cutting state is stable when the depth of cut is 50 m, while chatter occurs when the depth of cut is 150 m. Importantly, Figure 12a also shows that tool breakage occurs when the feed per tooth is 60 m and the axial depth of cut is 400 m. The observation is basically close to the prediction. Figure 14a shows the workpiece used in the experiment, with the red arrow indicating the feed direction. The workpiece’s length along this direction is 5.5 mm. At a spindle speed of 25,500 rpm and a feed of 60 m, the time required to machine the workpiece is 1.08 s. However, as shown in Figure 15, the force signal at the moment of breakage shows a sudden drop to zero at 0.33 s, indicating tool breakage. The image of the broken cutter is shown in Figure 14b.
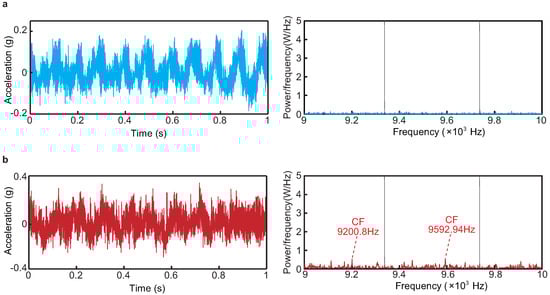
Figure 13.
Acceleration signals and power spectrum filtered by VFF−RLS algorithm when the spindle speed is 25,500 rpm and the axial depths of cut are (a) 50 and (b) 150 m.
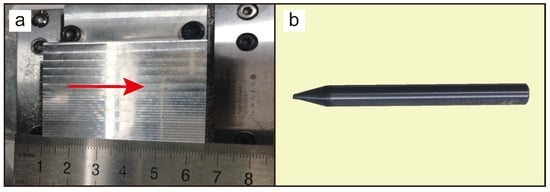
Figure 14.
Workpiece and micro-milling cutter used in experiments. (a) Workpiece. (b) Breaking cutter.
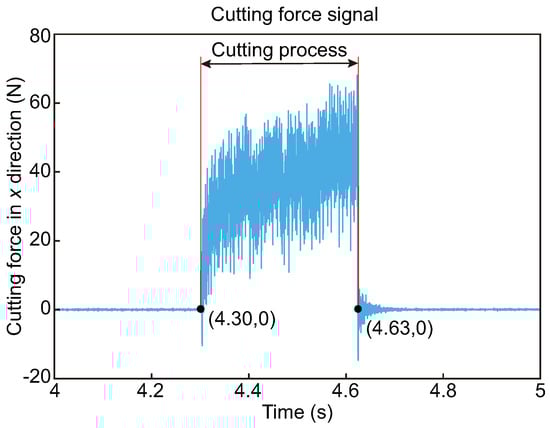
Figure 15.
Cutting force signals when axial depth of cut is 400 m and feed per tooth is 60 m.
In summary, the proposed method is verified experimentally.
4. Conclusions
- First, although the natural frequency of a micro-milling cutter increases rapidly with a decrease in tool overhang length, there is a large decrease in its modal mass. When the clamped length is shortened from 35 mm to 25 mm for the used tool, the first-order natural frequency increases by about 2.47 times, while the corresponding damping deceases to 0.16 times of the original value.
- Second, the breakage curve of a micro-milling cutter depends on the materials of both the workpiece and the tool. When the ratio of the axial depth of cut to tool length is large, the maximum bending stress of the tool can be approximately calculated based on a concentrated force.
- Third, after considering tool breakage, the original stable and chatter domains of SLDs are changed to four regions, i.e., stable and safe region, chatter and safe region, stable and unsafe region, and chatter and unsafe region. This implies that when planning machining processes, the stable and unsafe region needs to be removed from the stable area of SLDs in order to ensure both safe and stable micro-milling.
Author Contributions
Conceptualization, Y.-Y.R. and M.W.; methodology, Y.-Y.R., B.-G.J., and M.W.; validation, Y.-Y.R., B.-G.J., and H.T.; formal analysis, Y.-Y.R. and H.T.; investigation, Y.-Y.R.; resources, H.T.; data curation, B.-G.J. and H.T.; writing—original draft, Y.-Y.R.; writing—review and editing, M.W.; visualization, H.T.; supervision, M.W.; project administration, M.W.; funding acquisition, M.W. All authors have read and agreed to the published version of the manuscript.
Funding
This research has been supported by the National Natural Science Foundation of China under Grant no. 51975481.
Data Availability Statement
The authors do not have permission to share data.
Acknowledgments
The micro-milling tests were performed on a JDGR50 five-axis machining center generously donated by Beijing Jingdiao Group Co., Ltd.
Conflicts of Interest
Bao-Guo Jia and Hui Tian were employed by the AVIC Xi’an Aircraft Industry Group Company Ltd. The remaining authors declare no conflicts of interest.
Abbreviations
The following abbreviations are used in this paper:
| FRFs | Frequency response functions |
| SLDs | Stability lobe diagrams |
| RCSA | Receptance coupling substructure analysis |
| VFF-RLS | Variable forgetting factor recursive least-squares |
References
- Balazs, B.Z.; Geier, N.; Takacs, M.; Davim, J.P. A review on micro-milling: Recent advances and future trends. Int. J. Adv. Manuf. Technol. 2021, 112, 665–684. [Google Scholar] [CrossRef]
- Altintas, Y. Manufacturing Automation; Cambridge University Press: New York, NY, USA, 2012. [Google Scholar]
- Altintas, Y.; Budak, E. Analytical Prediction of Stability Lobes in Milling. CIRP Ann. 1995, 44, 357–392. [Google Scholar] [CrossRef]
- Budak, E.; Altintas, Y. Analytical Prediction of Chatter Stability in Milling—PartI: General Formulation. J. Dyn. Syst. Meas. Control. 1998, 120, 22–30. [Google Scholar] [CrossRef]
- Insperger, T.; Stepan, G. Analytical Prediction of Chatter Stability in Milling—PartI: General Formulation. J. Dyn. Syst. Meas. Control. 2004, 61, 117–141. [Google Scholar]
- Sanz-Calle, M.; Munoa, J.; Morelli, L.; Iglesias, A.; Lacalle, L.N.L.; Dombovari, Z. On the effect of radial engagement on the milling stability of modes perpendicular to the feed direction. CIRP J. Manuf. Sci. Technol. 2024, 49, 111–127. [Google Scholar] [CrossRef]
- Sanz-Calle, M.; Munoa, J.; Iglesias, A.; Lacalle, L.N.L.; Dombovari, Z. The influence of radial engagement and milling direction for thin wall machining: A semi-analytical study. Procedia CIRP 2021, 102, 180–185. [Google Scholar] [CrossRef]
- Iglesias, A.; Munoa, J.; Ciurana, J.; Dombovari, Z.; Stepan, G. Analytical expressions for chatter analysis in milling operations with one dominant mode. J. Sound Vib. 2016, 375, 403–421. [Google Scholar] [CrossRef]
- Qin, G.; Tan, Z.; Wu, Z.; Lou, W. High precision judgment method for milling stability based on Bernoulli distribution and hybrid-drive model. Mech. Syst. Signal Process. 2024, 212, 111266. [Google Scholar] [CrossRef]
- Wan, M.; Ren, Y.-Y.; Zhang, W.-H.; Yang, Y. Investigation of a cutting state-independent method for identifying in-process frequency response functions of the micro milling systeme. Mech. Syst. Signal Process. 2024, 213, 111353. [Google Scholar] [CrossRef]
- Jin, X.; Altintas, Y. Chatter Stability Model of Micro-Milling With Process Damping. J. Dyn. Syst. Meas. Control. 2013, 135, 031011. [Google Scholar] [CrossRef]
- Schmitz, T.L.; Donalson, R.R. Predicting High-Speed Machining Dynamics by Substructure Analysis. CIRP Ann. 2000, 49, 303–308. [Google Scholar] [CrossRef]
- Park, S.S.; Altintas, Y.; Movahhedy, M. Predicting High-Speed Machining Dynamics by Substructure Analysis. Int. J. Mach. Tools Manuf. 2003, 43, 889–896. [Google Scholar] [CrossRef]
- Schmitz, T.L.; Duncan, G.S. Three-Component Receptance Coupling Substructure Analysis for Tool Point Dynamics Prediction. Trans. ASME J. Manuf. Sci. Eng. 2005, 127, 781–790. [Google Scholar] [CrossRef]
- Schmitz, T.L.; Powell, K.; Won, D.; Duncan, G.S.; Sawyer, W.G.; Ziegert, J.C. Shrink fit tool holder connection stiffness/damping modeling for frequency response prediction in milling. Trans. ASME J. Manuf. Sci. Eng. 2007, 47, 1368–1380. [Google Scholar] [CrossRef]
- Erturk, A.; Ozguven, H.N.; Budak, E. Analytical modeling of spindle-tool dynamics on machine tools using Timoshenko beam model and receptance coupling for the prediction of tool point FRF. Trans. ASME J. Manuf. Sci. Eng. 2006, 46, 1901–1912. [Google Scholar] [CrossRef]
- Lu, X.; Jia, Z.; Liu, S.; Yang, K.; Feng, Y.; Liang, S.Y. Chatter Stability of Micro-Milling by Considering the Centrifugal Force and Gyroscopic Effect of the Spindle. Trans. ASME J. Manuf. Sci. Eng. 2019, 141, 111003. [Google Scholar] [CrossRef]
- Zhou, J.M.; Andersson, M.; Stahl, J.E. Cutting tool fracture prediction and strength evaluation by stress identification, part i: Stress model. Int. J. Mach. Tools Manuf. 1997, 37, 1691–1714. [Google Scholar] [CrossRef]
- Fang, F.Z.; Wu, H.; Liu, X.D.; Liu, Y.C.; Ng, S.T. Tool geometry study in micromachining. J. Micromech. Microeng. 2003, 13, 726. [Google Scholar] [CrossRef]
- Lu, X.; Zhang, H.; Jia, Z.; Feng, Y.; Liang, S.Y. A New Method for the Prediction of Micro-Milling Tool Breakage. In Proceedings of the ASME 2017 12th International Manufacturing Science and Engineering Conference, Los Angeles, CA, USA, 4–8 June 2017. [Google Scholar]
- Huang, X.; Jiang, F.; Wang, Z.; Wu, X.; Huang, S.; Liu, Y.; Zhang, J.; Shi, X. A review on the balancing design of micro drills. Int. J. Adv. Manuf. Technol. 2023, 126, 4849–4871. [Google Scholar] [CrossRef]
- Uriarte, L.; Herrero, A.; Zatarain, M.; Santiso, G.; Lacalle, L.N.L.; Lamikiz, A.; Albizuri, J. Error budget and stiffness chain assessment in a micromilling machine equipped with tools less than 0.3 mm in diameter. Precis. Eng. 2007, 31, 1–12. [Google Scholar] [CrossRef]
- Uriarte, L.; Herrero, A.; Zatarain, M.; Santiso, G.; Lacalle, L.N.L.; Lamikiz, A.; Albizuri, J. Mechanistic modelling of the micro-end milling operation. In 4M 2006—Second International Conference on Multi-Material Micro Manufacture; Menz, W., Dimov, S., Fillon, B., Eds.; Elsevier: Oxford, UK, 2006; pp. 237–240. [Google Scholar]
- Wen, D.Y.; Wan, M.; Ren, Y.Y.; Zhang, W.H.; Yang, Y. Material piling up and spreading effects in the cutting processes with small feed rates. Mech. Syst. Signal Process. 2022, 171, 108839. [Google Scholar] [CrossRef]
- Li, K.; He, S.; Liu, H.; Mao, X.; Li, B.; Luo, B. Bayesian uncertainty quantification and propagation for prediction of milling stability lobe. Mech. Syst. Signal Process. 2020, 138, 106532. [Google Scholar] [CrossRef]
- Albertelli, P.; Goletti, M.; Monno, M. A new receptance coupling substructure analysis methodology to improve chatter free cutting conditions prediction. Int. J. Mach. Tools Manuf. 2013, 72, 16–24. [Google Scholar] [CrossRef]
- Ji, Y.; Bi, Q.; Zhang, S.; Wang, Y. A new receptance coupling substructure analysis methodology to predict tool tip dynamics. Int. J. Mach. Tools Manuf. 2018, 126, 18–26. [Google Scholar] [CrossRef]
- Ma, W.; Yang, Y.; Jin, X. Chatter suppression in micro-milling using shank-mounted Two-DOF tuned mass damper. Precis. Eng. 2021, 72, 144–157. [Google Scholar] [CrossRef]
- Wan, M.; Wen, D.Y.; Ma, Y.C.; Zhang, W.H. On material separation and cutting force prediction in micro milling through involving the effect of dead metal zone. Mech. Syst. Signal Process. 2019, 146, 103452. [Google Scholar] [CrossRef]
- Wan, M.; Wang, W.K.; Zhang, W.H.; Yang, Y. Chatter detection for micro milling considering environment noises without the requirement of dominant frequency. Mech. Syst. Signal Process. 2023, 199, 110451. [Google Scholar] [CrossRef]


Disclaimer/Publisher’s Note: The statements, opinions and data contained in all publications are solely those of the individual author(s) and contributor(s) and not of MDPI and/or the editor(s). MDPI and/or the editor(s) disclaim responsibility for any injury to people or property resulting from any ideas, methods, instructions or products referred to in the content. |
© 2024 by the authors. Licensee MDPI, Basel, Switzerland. This article is an open access article distributed under the terms and conditions of the Creative Commons Attribution (CC BY) license (https://creativecommons.org/licenses/by/4.0/).