Review

Optimizing Milling Parameters for Enhanced Machinability of 3D-Printed Materials: An Analysis of PLA, PETG, and Carbon-Fiber-Reinforced PETG

Department of Mechanical, Chemical, and Materials Engineering, University of Cagliari, Via Marengo 2, 09123 Cagliari, Italy
*
Authors to whom correspondence should be addressed.
J. Manuf. Mater. Process. 2024, 8(4), 131; https://doi.org/10.3390/jmmp8040131
Submission received: 31 May 2024 / Revised: 23 June 2024 / Accepted: 24 June 2024 / Published: 26 June 2024

Abstract

:
Fused deposition modeling (FDM) is widely applied in various fields due to its affordability and ease of use. However, it faces challenges such as achieving high surface quality, precise dimensional tolerance, and overcoming anisotropic mechanical properties. This review analyzes and compares the machinability of 3D-printed PLA, PETG, and carbon-fiber-reinforced PETG, focusing on surface roughness and burr formation. A Design of Experiments (DoE) with a full-factorial design was used, considering three factors: rotation speed, feed rate, and depth of cut. Each factor had different levels: rotational speed at 3000, 5500, and 8000 rpm; feed rate at 400, 600, and 800 mm/min; and depth of cut at 0.2, 0.4, 0.6, and 0.8 mm. Machinability was evaluated by roughness and burr height using a profilometer for all the materials under the same milling conditions. To evaluate the statistical significance of the influence of various processing parameters on surface roughness and burr formation in 3D-printed components made of three different materials—PLA, PETG, and carbon-fiber-reinforced PETG—an analysis of variance (ANOVA) test was conducted. This analysis investigated whether variations in rotational speed, feed rate, and depth of cut resulted in measurable and significant differences in machinability results. Results showed that milling parameters significantly affect roughness and burr formation, with optimal conditions for minimizing any misalignment highlighting the trade-offs in parameter selection. These results provide insights into the post-processing of FDM-printed materials with milling, indicating the need for a balanced approach to parameter selection based on application-specific requirements.

1. Introduction

Originally known as Rapid Prototyping (RP), Additive Manufacturing (AM) has long been considered the process of rapidly creating a part before final commercialization. However, due to recent technological advances, its applications are continuously increasing across diverse industries (e.g., automotive and aerospace [1,2], food production [3,4], medicine [5], civil and biomedical engineering, and even art and architecture [6,7,8]), as it keeps the promise to manufacture parts and components efficiently and cost-effectively, as in mass production [9].
The basic principle of Additive Manufacturing is to slice the information contained in a 3D-virtual model into 2D cross-sections of finite thickness to automatically create a 3D object by selectively layering a blended material. Thus, compared to conventional manufacturing processes, Additive Manufacturing significantly simplifies the production process since it only needs the knowledge of the geometry component without requiring any careful and detailed analysis of the part geometry to assess the needed fixtures, the tools, and the machining sequence. For these reasons, it becomes the preferred choice for applications involving low production volumes, frequent design changes, high design complexity, and printing of multi-materials [9,10,11].
Additive Manufacturing includes a range of different techniques, including Fused Deposition Modeling (FDM), also known as Fused Filament Fabrication (FFF); Direct Metal Deposition (DMD); Selective Laser Sintering (SLS); Inkjet 3D printing; and stereo-lithography (SLA), which differ in the employed materials (e.g., metal powders, liquid resins, and plastic filaments) and both the technology and process of layers creation and bonding (e.g., binding, fusion, powders, or resin solidification), influencing the dimensional accuracy of the final part, its surface finish, and its mechanical properties [12].
In the Fused Deposition Modeling (FDM) approach, a raw thermoplastic filament is fed into a heating reservoir by means of a pinch roller arrangement to be liquefied and subsequently extruded through the nozzle. Similar to conventional polymer-extrusion processes, the nozzle, which controls the shape and size of the extruded filament, moves according to the tool path generated for each layer so that the deposed semi-solid thermoplastic material can cool, solidify, and bond to the surrounding filaments. Nowadays, Polylactic Acid (PLA) and Acrylonitrile Butadiene Styrene (ABS) are among the most widely used thermoplastic filaments, as their melting temperatures are sufficiently low (the melting temperature range is usually 150–160 °C for PLA and 200–280 °C for ABS) to be melted and extruded without a dedicated facility yet also high enough for 3D-printed objects to retain their shape at average working temperatures [13]. In recent years, PolyEthylene Terephthalate Glycol (PETG) has received increasing attention due to its high glass transition temperature (Tg = 75 °C) [14] and resistance to crystallization when exposed to high heat levels [15], good hydrophobic properties, and hygrothermal aging resistance [16,17]. Moreover, as it combines relatively high-impact resistance and machinability with higher toughness and ductility than conventional thermoplastics, PETG exhibits increased tensile modulus and strength [18,19].
Fused Deposition Modeling is a complex process in which several parameters may affect the product’s quality and properties. The layer-by-layer printing process causes the interlayer bonding (i.e., the bonding between adjacent filaments) to be inherently weak, leading to high material anisotropy and relatively poor mechanical properties. Therefore, extensive research has been aimed at identifying the elastic-constitutive equations of FDM-printed parts [20,21,22]. Meanwhile, several parametric studies have focused on the effect of printing-process variables on the mechanical properties of FMD-printed components and structures [23,24,25,26,27,28]. In this regard, the tensile and flexural strength of FDM-printed samples were explored by Durgashyam and co-workers [29]. Investigating the influence of three printing parameters (i.e., infill density, feed rate, and layer thickness), the authors found that tensile properties improve when high infill density is combined with low layer thickness, while higher flexural performance arises from lower layer thickness and the feed rate. Similarly, Kumar et al. [30] demonstrated that the infill density and the print speed individually and simultaneously affect the tensile strength and hardness of FDM-printed samples, while the height of the printed layer tends to mostly affect the flexural strength. Later on, Wang et al. [27] focused on the tensile properties of FDM-printed materials, pointing out that the interlayer bonding strength increases as the layer thickness lowers. In fact, smaller layer thickness appears to both strengthen the interlayer bonding and restrain the movement of adjacent polymer chains. In addition, printed filaments appear to be more tightly bonded when the infill density increases and, thus, as the air gap inside the printed material decreases. These authors also observed that the sample fracture mode highly depends on the printing angle: angles lower than 45° trigger the onset of interlayer fracture, while intralayer fractures appear when the printing angle exceeds this value. The influence of these parameters was further assessed by Yao and co-authors [31], who performed a series of experimental tests to demonstrate the ability of the proposed theoretical model to predict the ultimate tensile strength of 3D-printed materials. Meanwhile, several authors pointed out that annealing reduces voids and relieves internal stresses, considerably improving the mechanical properties of PLA filaments [32] and carbon fiber-reinforced PETG samples [33].
Besides the mechanical properties, the selection of printing parameters may significantly affect the dimensional tolerance of FDM-printed components [34,35] as well as their surface finish [36,37,38]. Altan et al. [39] demonstrated that deposition-head velocity and layer thickness predominantly affect the surface roughness, while Barrios and Romero [40] pointed out the impact of flow rate and print acceleration on the surface quality of 3D-printed PETG samples. Similarly, Kadhum et al. [41] investigated the effect of the infill density, identifying a quarter cubic pattern as the optimal choice to reduce the surface roughness. Also, the addition of carbon fibers to reinforce PETG filament was observed to improve the surface properties of FDM-printed samples, reducing the mean roughness from 6.34 to 4.01 μm [42]. Later on, Vidakis and co-workers [43] performed a more comprehensive study in which a variance analysis and a reduced-quadratic regression model were applied to assess both the individual and the combined effect of six printing parameters (namely, raster deposition angle, infill density, nozzle temperature, bed temperature, printing speed, and layer thickness) on three indicators (i.e., porosity, surface roughness, and dimensional deviation).
Since the above-mentioned issues may call into question the use of FDM-printed components in critical load-bearing applications, several post-printing approaches have been proposed, encompassing applying post-processing heat treatment [32,33], acetone vapor baths [44,45], hot cutter machining [46], and CNC milling [46,47,48,49]. In particular, the latter has been widely exploited to refine FDM-printed components. In this regard, Cococcetta et al. [50] focused on the surface finish, the burr formation, and the tool wear in dry milling of FDM-printed CFRP composites. By varying the fiber orientation, the infill geometry, and the density, they observed that post-process CNC milling increased the surface quality of the inspected samples, although tool wear and burr formation may occur if the feed rate is low enough to lead part of the workpiece to adhere to the milling tool. Meanwhile, Guo et al. [51] further explored the potential of CNC dry milling to enhance the surface quality of amorphous PEEK and CF/PEEK components and decrease defects (e.g., filament accumulation), bringing out the co-dependency between the selected milling parameters (namely, the cut depth, the feed rate per tooth, and the spindle speed) and the FDM-printing parameters (i.e., the raster angle and the layer thickness). Table 1 shows the main milling parameters on 3D-printed samples of different materials that are available in the literature.
This paper is an extension and mini-review of results presented at the ISM 2023 international conference [53] and in other articles [48,49] on milling as a method to improve the surface quality of 3D-printed samples. This research explores how key machining parameters—rotational speed, feed rate, and depth of cut—affect surface roughness and burr formation across three different 3D-printed materials: PLA, PETG, and carbon-fiber-reinforced PETG. The parameters were tested at various levels: rotational speeds of 3000, 5500, and 8000 rpm; feed rates of 400, 600, and 800 mm/min; and depths of cut ranging from 0.2 to 0.8 mm. Using ANOVA analysis, the study identifies which settings most significantly impact the machining process. Furthermore, the mechanical characteristics of the 3D-printed samples were assessed across three distinct print orientations to study the anisotropy of the materials. This comparative analysis sheds light on the performance and characteristics of PETG, CF-PETG, and PLA, offering valuable insights that enhance our understanding of the surface quality and processability of 3D-printed materials.

2. Materials and Methods

This investigation used three distinct types of printing filaments: CF-PETG, which is PETG infused with 20% carbon fiber; unreinforced PETG, both supplied by Soitech; and PLA from Nature-Works. As already mentioned, the choice of PLA, PETG, and CF-PETG for comparison was driven by their common use in both industrial and research 3D printing applications. The settings used for printing were an extrusion temperature of 250 °C and a bed temperature of 70 °C for the PETG and CF-PETG, while the PLA was set to an extruder temperature of 210 °C and a bed temperature of 48 °C, in accordance with the manufacturers’ specifications. The design files, specifically the mesh and g-code, were generated using the open-source software FREECAD.
Printing was performed on a TRONXY 5SA FDM printer with a 0.4 mm nozzle and the usage of lacquer spray to enhance bed adhesion. The printed items included tensile test specimens and parts for a milling machine, depicted in Figure 1. The layer thickness was set to 0.2 mm for all samples. The tensile samples’ geometry is shown in Figure 1a. They were printed aligned in three different planes, XY, YZ, and ZX (Figure 1b), following the UNE 116005:2012 standard, chosen for its reliable results [54]. Milling samples were printed parallel to the XY plane. The tensile samples had an infill density of 100%. In contrast, the milling samples had a density of 15%, featuring a 5 mm shell thickness at the top edge, which is 100% density. A Galdabini SUN500 servo-electric tensile tester with a 5 kN load cell and an HBM DD1 Displacement Transducer with a 50 mm gauge length was used to evaluate the samples, performing three repetitions for each printing direction.
For the milling tests, samples were printed with the geometry shown in Figure 2. Design of Experiments (DoE) was employed with a full factorial design, considering three variables: rotational speed (n), feed rate (Vf), and depth of cut (ap) with respectively 3, 3, and 4 levels, as detailed in Table 2. These experiments were conducted using a CNC3018 machine with a Master 660C tool (6 mm diameter), using Vectric Aspire software as CAD-CAM and GRBL Control to check the CNC speed. A coolant (mineral oil in water emulsion) was manually applied during milling to optimize the process. One replicant was conducted for each combination of parameters.
The total milled area for each condition was 6 mm in width and a length of 30 mm, as described in [48,49,53]. Surface roughness was measured over a 3 × 4 mm2 area of each milled area using a Taylor–Hobson Ultra 2 roughness meter equipped with a 50 mm stylus. The data collected were analyzed with Talymap silver software, using the Sa parameter evaluated according to Equation (1) to quantify surface quality.
S a = 1 A A S ( x , y ) d x d y
The burr height at the edges of milled surfaces was quantified by taking three perpendicular profile measurements spaced 10 mm apart with the same method used in [48]. These measurements were analyzed in Matlab using the least-squares method to define a baseline using the points without burrs. The height of each burr was then determined by the difference between the highest point of the burr and the regression line established from the unmilled surface areas.

3. Results and Discussion

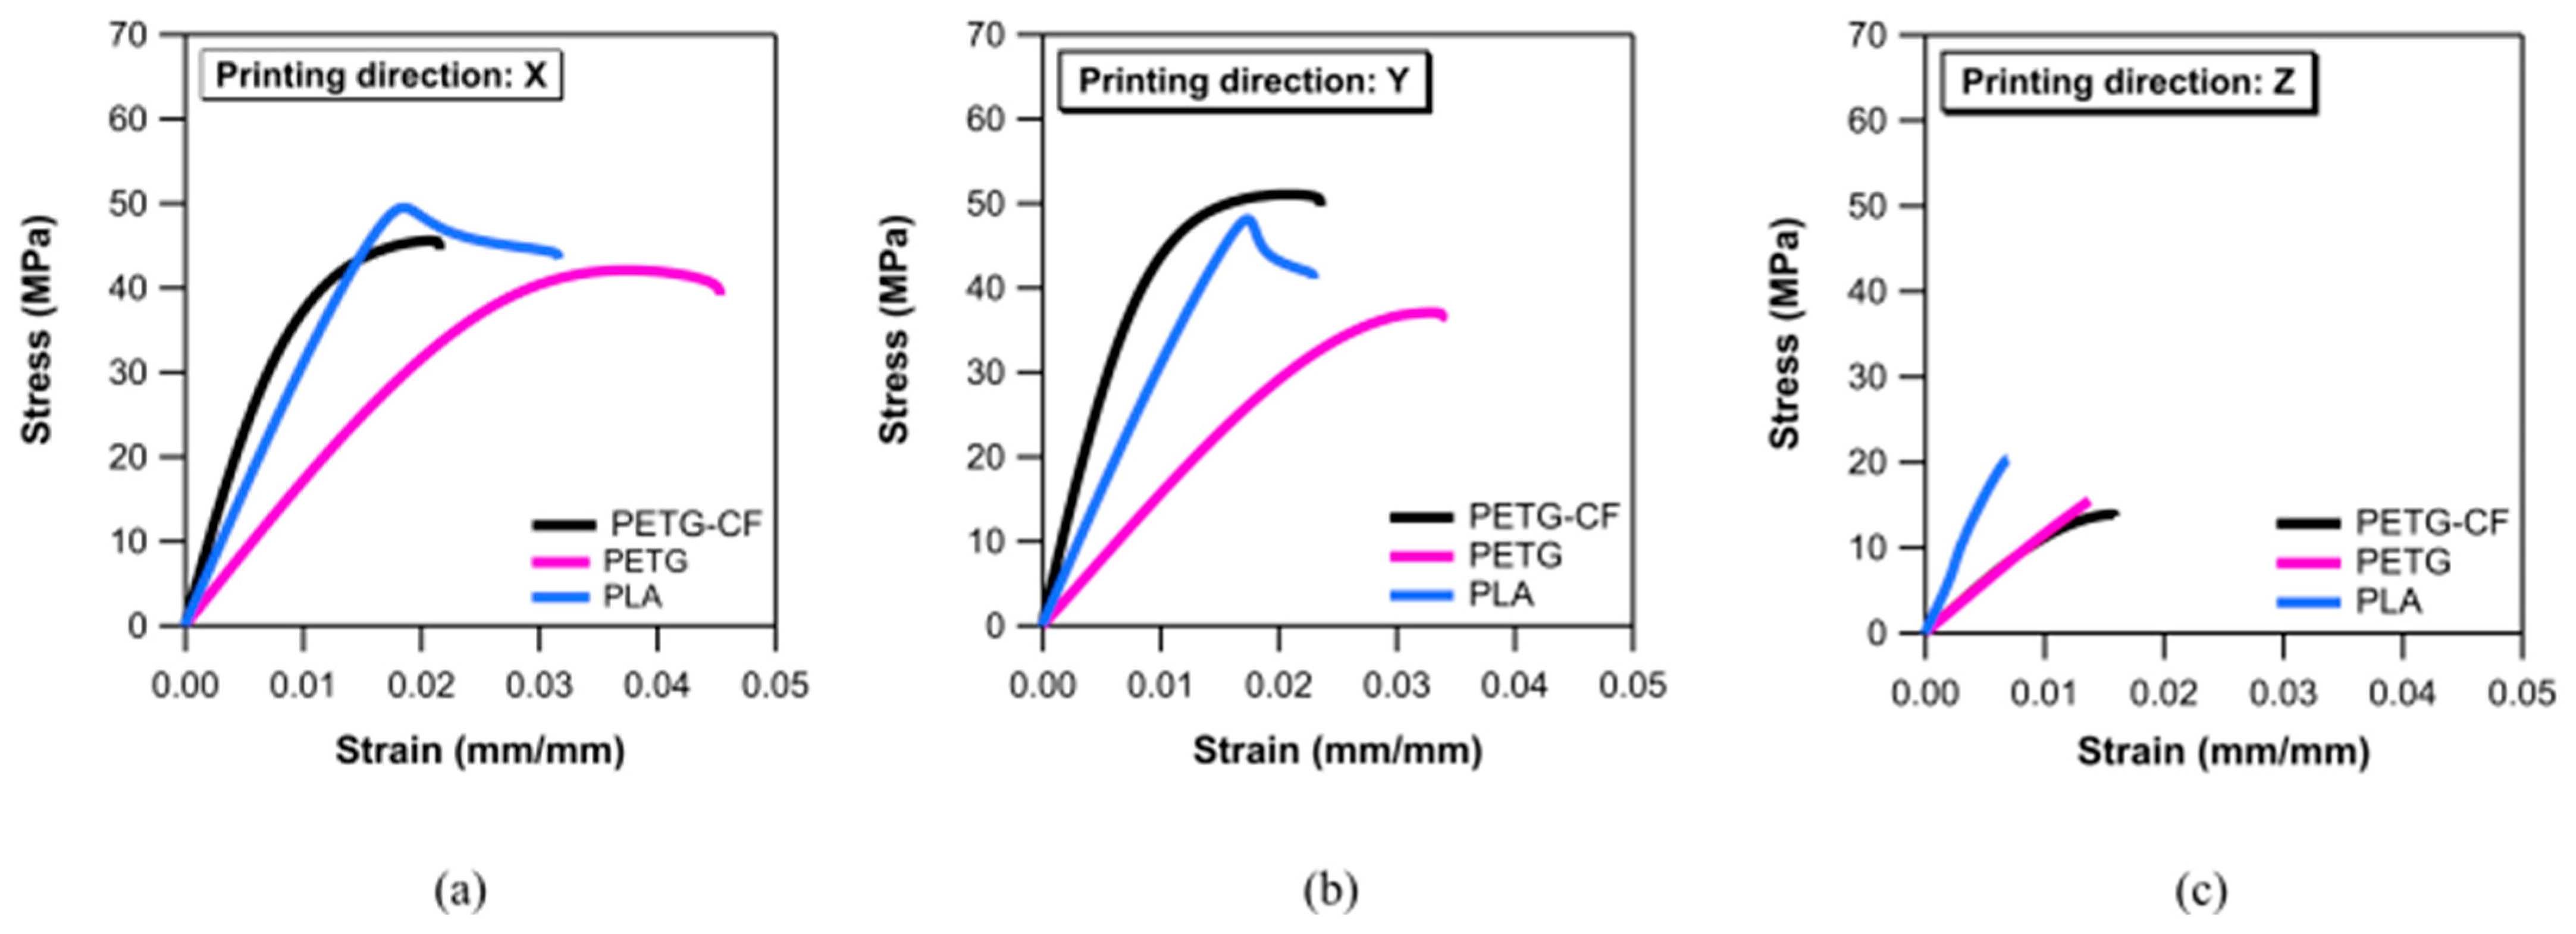
3.1. Mechanical Properties

Figure 3 presents the stress-strain curves for PLA, PETG, and CF-PETG across all printing orientations. The corresponding mechanical properties of these tests are shown in the bar charts of Figure 4 and detailed in Table 3.
The results for PLA indicate a notable trend consistent with typical FDM behavior. In the X direction, the Young’s modulus and ultimate tensile strength (UTS) are relatively high, suggesting that the material exhibits its greatest stiffness and load-bearing capacity within this direction. The similar values of E, UTS, and elongation at break (A%) in the X and Y directions imply that the in-plane mechanical properties are fairly isotropic. However, there is a notable decrease in these properties in the Z direction, reflecting the weaker inter-layer adhesion that is characteristic of FDM-printed samples [55]. This is further evidenced by the low elongation at break in the Z direction, which indicates a propensity for brittle failure when the material is subjected to tensile stress perpendicular to the layers.
For PETG, the results also reflect a decrease in mechanical properties moving from the X to the Z direction, similar to PLA. The relatively close modulus values between the X and Y directions indicate a good transfer of material properties within the plane of printing, which is beneficial for applications that require consistent in-plane performance. In the Z direction, all properties decrease, and even a reduction in Young’s modulus is observed, which does not occur in PLA.
CF-PETG shows enhanced mechanical properties when compared to non-reinforced PETG, particularly in the Y direction. The increase in Young’s modulus, in both the X and Y directions, is indicative of the substantial impact of carbon-fiber reinforcement on material stiffness. The ultimate tensile strength also shows a slight improvement, especially in the Y direction. In any case, the reinforcement with short carbon fibers does not appear to affect the mechanical properties in the Z direction (according to Figure 3c). Nevertheless, Bhandari et al. [33] found that short-carbon-fiber reinforced 3D-printed composites exhibit lower interlayer tensile strength and that annealing post-processing could effectively improve interlayer bonding. However, the elongation at break across all directions is lower for CF-PETG compared to PETG and PLA. This reduced ductility is a trade-off with increased stiffness and strength in short-fiber-reinforced composites [56].
Table 3. Mechanical properties of 3D-printed PETG, CF-PETG, and PLA across all printing orientations.
MaterialPrinting Direction E [MPa] U T S [MPa] A %
PETGX1661.1 ± 30.441.9 ± 0.65.1 ± 1.0
Y1560.8 ± 34.138.5 ± 1.25.3 ± 1.6
Z1233.4 ± 126.215.0 ± 1.81.3 ± 0.1
X Mahesh et al. [57]1768.1 ± 15.951.9 ± 2.3-
X Bex et al. [58]2010 ± 2752.2 ± 0.84.6 ± 0.1
Z Bex et al. [58]1870 ± 5123.1 ± 2.21.9 ± 0.3
X4784.5 ± 37.246.1 ± 0.72.4 ± 0.4
CF-PETGY5816.8 ± 197.949.3 ± 1.62.1 ± 0.3
Z1186.2 ± 133.713.2 ± 1.01.3 ± 0.3
X (10% CF) Mahesh et al. [57]2757.7 ± 22.750.4 ± 2.9-
X3058.1 ± 51.648.8 ± 0.62.4 ± 0.7
PLAY2871.4 ± 297.946.0 ± 4.33.2 ± 2.0
Z2812.8 ± 278.020.3 ± 2.60.8 ± 0.1
X Oksman et al. [59]3400532
X Vynias et al. [60]3470471.4
Similar results have been obtained by other authors in the literature on the mechanical properties of the materials studied, as shown in Table 3. From the table, it is clear that the mechanical properties of 3D-printed materials vary significantly based on their composition and printing direction, leading to considerable anisotropy. Similar results were observed by different authors for the same printing directions, although some differences are related to printing parameters and slight variations in the material from different manufacturers.
Comparing the three studied materials, different conclusions emerge about mechanical performance in relation to printing direction. CF-PETG exhibits superior stiffness and strength compared to PETG and PLA, with the most notable differences in the Y direction. The similarity of properties between the X and Y directions for PLA and PETG points towards consistent material behavior within the plane of the print bed. All materials demonstrate a reduction in mechanical properties in the Z direction, consistent with the limitations of FDM technology in achieving strong inter-layer bonding. However, PETG and CF-PETG show less decrease in Young’s modulus and ultimate tensile strength than PLA, indicating that they may be more suitable for applications where three-dimensional integrity is crucial.
The elongation at break for all materials is lowest in the Z direction, underscoring the brittle nature of FDM materials when stressed perpendicular to the layer planes. CF-PETG has significantly reduced ductility compared to PETG and PLA, which may be disadvantageous in applications that require a higher material deformation before failure. The high variability in the elongation at break (A%) of 3D samples, even under consistent printing parameters, can be attributed to several factors. Process-induced defects, such as porosity, which often vary in distribution and density across different prints, can significantly affect mechanical performance. Additionally, local shearing and inhomogeneous stretching due to filament arrangement also contribute to variability in mechanical performance [18].

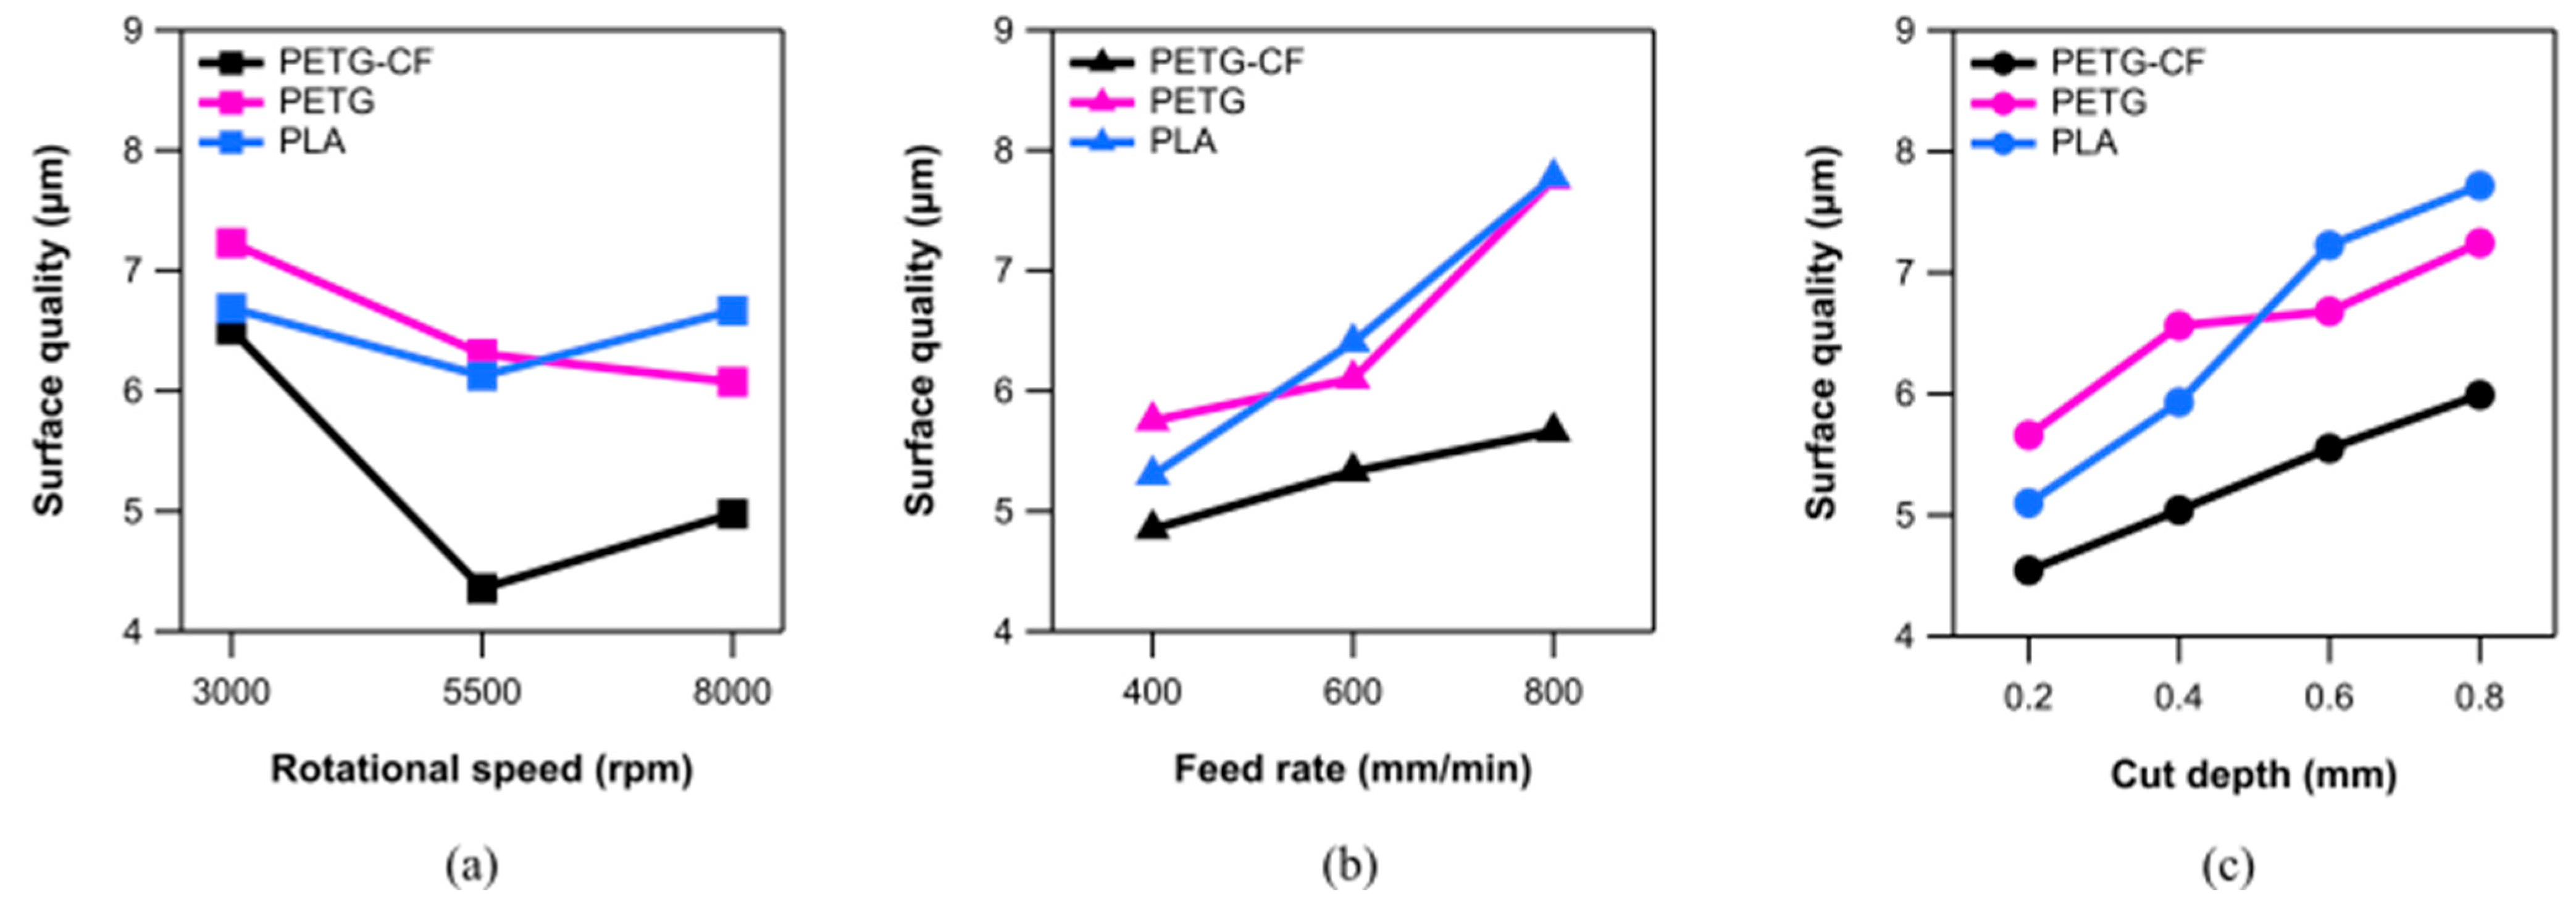
3.2. Surface Quality of Milled Samples

In Figure 5, the Pareto charts of the standardized effects for the roughness of CF-PETG, PETG, and PLA are presented. These charts are visual tools that identify the most significant factors based on the standardized effect and compare them to the defined significance limit, which is marked by the vertical red line.
The Surface roughness (Sa) values for milled surfaces in CF-PETG range from 3.04 µm to 7.65 µm. The Pareto chart for CF-PETG shows that rotational speed is the most influential factor of the milling process on roughness, with depth of cut, the combination of rotational speed and feed rate (AC), and feed rate also playing significant roles (Figure 5a). Notably, the interaction between rotational speed and depth of cut (AC) is highlighted as significant for CF-PETG in contrast to PETG. This indicates a distinctive response to the milling parameters for CF-PETG, possibly due to the material’s composite nature and the presence of carbon fibers. For PETG, the Sa values show variability within the range of 3.46 µm to 8.79 µm. The Pareto chart analysis reported in Figure 5b indicates that the feed rate is the most significant factor affecting the milling process, followed by depth of cut and rotational speed. The interactions between these factors, except the interaction between rotational speed and depth of cut (AC), are also statistically significant, indicating that the combination of these machining parameters must be considered during PETG milling to achieve optimal surface quality.
The Sa values for PLA ranged from 2 to 13 µm, with the Pareto chart highlighting three main influential factors (Figure 5c). The feed rate is the most impactful, followed by the depth of cut, and then the interaction between the rotational speed and feed rate. These factors exceed the significance threshold in the Pareto chart, denoting a p-value of less than 0.05. Other factors or their combinations do not statistically influence the surface quality of PLA after milling. The Pareto chart clarifies that optimizations in milling operations for PLA should primarily address the depth of cut and feed rate.
The depth of cut (C) is a consistently significant factor for PLA, PETG, and CF-PETG, indicating its importance in the milling process across these materials. Feed rate (B) is significant for all materials, suggesting it consistently affects the surface roughness across different types of plastics. Rotational speed (A) is significant for PETG and CF-PETG but not for PLA, highlighting material-specific responses to this milling parameter. Interactions between factors such as AB are important for PLA and PETG, whereas for CF-PETG, the only relevant interaction is AC. This demonstrates that the combined effects of these parameters can be as critical as their individual impacts on the milling outcomes, but differently for each material.
Figure 6 displays the Pareto charts showing the standardized effects on burr height for CF-PETG, PETG, and PLA.
In the case of CF-PETG (Figure 6a), four parameters are significant: the depth of cut (C) shows the most substantial impact, indicative of the material’s sensitivity to the amount of material being engaged by the milling tool. This is followed by the interaction between feed rate and rotational speed (AB), rotational speed (A), and feed rate (B). The significance of these parameters and their interactions underscores the composite nature of CF-PETG and its complex response to milling operations.
For PETG (Figure 6b), the Pareto chart identifies three parameters with significant effects on burr height. The feed rate (B) tops the list, followed by the interaction of feed rate and rotational speed (AB), and then rotational speed (A). This suggests a complex interaction between the cutting dynamics and the formation of burrs, where both the speed of the tool and the speed at which material is fed into the tool play critical roles.
The analysis indicates that the depth of cut (C) is the most influential factor affecting burr height on PLA (Figure 6c), which aligns with traditional machining experience where deeper cuts can displace more material, leading to larger burrs. The feed rate (B) also has a significant impact, followed by the interaction of feed rate and depth of cut (BC) and then the interaction of rotational speed and depth of cut (AC). Rotational speed (A) alone has the least impact. Interestingly, the interaction between rotational speed and feed rate (AB) is not statistically significant, which suggests that, within the range tested, varying these two factors in unison does not have a synergistic effect on burr formation in PLA.
The obtained results indicate that burr formation is a complex phenomenon influenced by various factors and their interactions. Although some trends, such as the significance of feed rate and rotational speed, are consistent across certain materials, their importance varies. This variation reflects the unique mechanical properties and responses of each material type. In particular:
  • The depth of cut is more impactful for PLA and CF-PETG, indicating its crucial role in burr formation;
  • The feed rate is the most critical for burr height in the case of PETG and also significant for PLA and CF-PETG. The speed of material feed into the cutting tool affects the material’s deformation and the subsequent burr size;
  • The rotational speed is significant for PETG and CF-PETG; rotational speed affects the cutting action’s temperature and pressure, influencing burr formation;
  • Interaction effects are important for all materials but vary in their order of impact. For PLA, the combination of feed rate and depth of cut (BC) and the combination of rotational speed and depth of cut are significant, whereas for PETG and CF-PETG, the interaction of feed rate and rotational speed (AB) is more critical.
Figure 7a–c shows the main effect plot for roughness against the three factors studied: rotational speed, feed rate, and depth of cut.
Roughness for PLA increases with the depth of cut and feed rate. This suggests that as more material is engaged with the tool, either through a deeper cut or a faster feed, the rougher the resultant surface is. Roughness remains largely consistent across the range of rotational speeds tested, with a slight minimum at 5500 rpm. This indicates that within the parameter space considered, the rotational speed of the milling tool is the least impactful factor on the surface finish of PLA, in accordance with the Pareto chart in Figure 5a.
For PETG, an increase in rotational speed leads to a decrease in surface roughness, which could imply that higher speeds help to produce a cleaner cut with less material deformation, improving the finish. In contrast, increases in both feed rate and depth of cut result in greater roughness, similar to PLA. This indicates that as the tool engages more material, either by cutting deeper or moving faster across the material, it tends to leave a rougher surface.
In CF-PETG, there is an optimal medium rotational speed that yields the lowest roughness. Similar to PETG, CF-PETG shows a linear increase in roughness with higher feed rates and depths of cut. This linear relationship is more pronounced than in PETG, suggesting a direct correlation between these parameters and the quality of the finish in CF-PETG.
In comparing the main effects plots across the materials, they exhibit distinct trends that reflect the influence of milling parameters on the surface finish. For PLA, the rotational speed has minimum impact, implying that within the tested range, PLA’s finish is not sensitive to this parameter. PETG and CF-PETG both show improvements in roughness with higher speeds, but CF-PETG has an optimal speed for the best surface finish at the medium level, and in fact, rotational speeds have the highest statistical impact on CF-PETG. All materials demonstrate increased roughness with higher feed rates and deeper cuts, corroborating the idea that more aggressive milling conditions can deteriorate surface finish. The increase in roughness is linear for CF-PETG, whereas for PLA and PETG, while it has an increasing trend, it does not show such a direct relationship. Even though PLA and PETG have different thermal properties (PLA has a glass transition temperature of 55 °C, whereas PETG’s is 75 °C), this does not seem to influence the roughness resulting from the milling process, as the outcomes are comparable. On the other hand, CF-PETG consistently exhibits lower roughness than PETG and PLA across all conditions. This may be attributed to the presence of carbon fibers, which makes the material more resistant during the milling process, resulting in a smoother surface. Furthermore, the presence of carbon fiber is well known to act as a self-lubricant, reducing not only tool wear but also the friction coefficient [61]. These effects generally improve the quality of the milling process compared to unreinforced PETG. Vallejo et al. [62] found that in face-milling operations, the addition of carbon fiber to PETG enhances machinability primarily in terms of energy efficiency, leading to lower energy consumption. Face milling was found to be an effective process for enhancing FDM parts in terms of dimensional accuracy, flatness, and roughness.
Figure 8a–c show the main effect plot for burr height relative to the three factors studied: rotational speed, feed rate, and depth of cut. Burr height for PLA decreases with an increase in the feed rate and depth of cut, indicating a tendency for smoother edges under these conditions. However, there is an observed maximum burr height at a 0.4 mm level of depth of cut. The optimal burr height for PLA is achieved at a medium rotational speed (5500 rpm). This specific speed may allow for the best balance between cutting efficiency and heat generation, which influences burr formation. To minimize burr height, high feed rates and depth cuts may be preferable.
Increasing the rotational speed, feed rate, and depth of cut generally leads to decreased burr height in PETG, implying that aggressive cutting parameters can effectively reduce burr size. However, at the highest levels of feed rate and depth-of-cut parameters, there is a slight increase in burr height. The slight increase in burr height at elevated feed rates and depth-of-cut levels could be due to the material’s tendency to stretch and deform rather than break cleanly, creating more substantial burrs.
CF-PETG generally shows a similar trend to PLA: burr height for CF-PETG decreases as the feed rate and depth of cut increase, with a maximum burr height observed at a depth of cut of 0.4 mm. For CF-PETG, the optimal burr height is achieved at a medium rotational speed of 5500 rpm. CF-PETG has added carbon fibers, which increase the material’s strength and stiffness but also change the cutting dynamics. The carbon fibers can provide resistance to deformation during cutting, which can help reduce burr formation at certain feed rates and depths of cut if compared to unreinforced PETG.
When examining the main effect plots of burr height, distinct trends for each material are observed. For PLA, it is evident that there is an optimum value for feed and depth of cut to minimize burr formation at the highest values in the range considered, and a rotational speed of 5500 rpm should be considered. PETG milling requires careful consideration of feed rate and depth of cut because, within the range considered, burr height decreases with increasing depth of cut and feed rate. However, at the highest levels of both, it leads to slightly increased burr formation. CF-PETG presents a complex interaction between the milling parameters and burr formation, with a similar trend to PLA. While higher parameters for feed rate and depth of cut generally reduce burrs, at the medium level of rotational speed, there is minimum burr formation. Under the same machining conditions, PLA typically exhibits a taller burr compared to PETG, which can be explained by their differing thermal properties. As already mentioned, PLA has a glass transition temperature of 55 °C, whereas PETG’s is 75 °C. This lower threshold makes PLA more vulnerable to altering its shape and flowing under machining stresses, thus increasing the likelihood of more pronounced burr development. On the other hand, PETG, with its higher glass transition temperature, shows greater resilience to these forces, potentially resulting in lesser burr formation. When compared to unreinforced PETG, CF-PETG offers superior milling characteristics due to the reinforcement provided by carbon fibers. A decrease in the friction coefficient between the tool and the material leads to a smoother surface and reduced heat generation. However, this seems not to affect the burr formation that has comparable values with unreinforced PETG.

3.3. Industrial Applications and Future Outlook

The observed trend in surface roughness and burr formation across different materials underscores the need for industry-specific machining strategies. This integration of processes can significantly benefit applications where the required roughness of FDM-printed samples is inefficient. Future research should aim to deepen our understanding of how unique material properties interact with milling conditions. Developing advanced machine-learning models could enable the prediction of optimal milling conditions for various materials, potentially in real-time, thus enhancing adaptive manufacturing processes. Additionally, exploring new composite materials or advanced cooling techniques like cryogenic milling could lead to substantial improvements in the machinability of 3D-printed polymers, especially in precision-demanding industries. Cryogenic milling, in particular, offers notable advantages, such as reduced thermal degradation of polymer materials, enhanced surface finish, dimensional accuracy, and extended tool life due to lower heat generation. This method also reduces the need for chemical coolants, making it more environmentally friendly.
All materials exhibit their own specific results in optimal milling parameters, but the following conclusion, in general, can be drawn from the present study results: parameter levels that improve surface roughness and those that minimize burr height are different, which presents a machining challenge. Results indicate that a trade-off may be necessary or that a two-stage milling process could be beneficial—initially using higher feed rates and depths of cut to minimize burrs, followed by fine milling at lower rates to improve surface finish. This study could help to establish the ideal milling conditions that not only enhance surface quality but also help to achieve dimensional precision. Milling is critical for accurately removing material, which helps in correcting any dimensional errors that occur during the 3D-printing process. This precision is particularly crucial for components that require strict tolerance. By milling, excess material and layers on the surface of a 3D-printed part can be removed, thus smoothing out the rough surfaces typical of FDM printing. This integration of techniques is beneficial for industries, including aerospace and automotive, providing an economical method for creating functional prototypes or tailor-made components just when needed. In fact, in sectors where quick repairs and ongoing maintenance are essential, this method supports the timely production of spare parts, reducing both downtime and stock-holding costs. 3D printing combined with milling can be used to create parts that are no longer available or are too costly to stock as inventory. Customized parts can be rapidly produced with 3D printing and finished with milling to meet precision requirements.

4. Conclusions

The study has elucidated key insights into the optimal milling parameters for 3D-printed materials; achieving the dual objectives of low burr formation and high surface quality necessitates a careful balance of material-specific milling parameters. The following conclusions can be drawn from the results obtained:
  • In terms of mechanical properties, CF-PETG has better performance in terms of stiffness and strength compared to PETG and PLA, which is particularly notable in the Y direction. The consistency of properties between the X and Y directions for PLA and PETG suggests a uniform material behavior within the print bed plane. Aligning with the inherent limitations of FDM technology in achieving robust inter-layer bonding, all materials exhibit poor mechanical properties in the Z direction. Furthermore, the elongation at break for all materials is notably lower in the Z direction, highlighting the brittle nature of FDM materials when subjected to stress perpendicular to the layer planes. It is noteworthy that CF-PETG exhibits significantly reduced ductility compared to PETG and PLA;
  • CF-PETG demonstrates a lower surface roughness attributed to carbon fiber reinforcement, which enhances material uniformity and structural stability during milling. Carbon fibers have inherent properties that contribute to reduced friction during the milling process. They can act as a self-lubricating agent, which helps in decreasing the friction coefficient between the tool and the material. Lower friction results in a smoother surface, reduced heat generation, and, consequently, lesser chances of material deformation;
  • Generally, PLA and PETG exhibit significantly higher surface roughness among all considered conditions compared to CF-PETG;
  • The burr heights of PLA and PETG are comparable with those of CF-PETG but with specific trends for each material, underscoring the need for precise control during machining to achieve optimal results. According to experimental results, the presence of carbon fiber does not significantly reduce the burr formation during the milling process;
  • The relationship between feed rate, depth of cut, and material finish is complex, with lower feed rate and lower depth of cuts improving surface finish at the cost of increased burr formation, which requires additional operation to remove;
  • Milling can refine 3D-printed parts by removing excess material, thus smoothing surfaces and correcting dimensional inaccuracies, which is pivotal for parts demanding tight tolerances. This combined additive and subtractive manufacturing approach is promising for industries like aerospace and automotive, offering cost-effectiveness in producing functional prototypes and custom components.

Author Contributions

Conceptualization, M.E.M., M.C., P.B. and F.A.; investigation, G.L., P.B, R.E.M., M.C., M.E.M. and F.A; writing—original draft preparation, G.L., P.B, R.E.M., M.C., M.E.M. and F.A; writing—review and editing, G.L., M.C. and M.E.M. All authors have read and agreed to the published version of the manuscript reported.

Funding

This work has been developed within the framework of the project eINS- Ecosystem of Innovation for Next Generation Sardinia (cod. ECS 00000038), funded by the Italian Ministry for Research and Education (MUR) under the National Recovery and Resilience Plan (PNRR)—MISSION 4 COMPONENT 2, “From research to business” INVESTMENT 1.5, “Creation and strengthening of Ecosystems of innovation” and construction of “Territorial R&D Leaders”.

Data Availability Statement

The data presented in the paper are available upon request.

Conflicts of Interest

The authors declare no conflicts of interest.

References

  1. Murr, L.E. Frontiers of 3D Printing/Additive Manufacturing: From Human Organs to Aircraft Fabrication. J. Mater. Sci. Technol. 2016, 32, 987–995. [Google Scholar] [CrossRef]
  2. Rinaldi, M.; Cecchini, F.; Pigliaru, L.; Ghidini, T.; Lumaca, F.; Nanni, F. Additive Manufacturing of Polyether Ether Ketone (PEEK) for Space Applications: A Nanosat Polymeric Structure. Polymers 2021, 13, 11. [Google Scholar] [CrossRef] [PubMed]
  3. Sun, J.; Zhou, W.; Huang, D.; Fuh, J.Y.H.; Hong, G.S. An Overview of 3D Printing Technologies for Food Fabrication. Food Bioprocess Technol. 2015, 8, 1605–1615. [Google Scholar] [CrossRef]
  4. Lille, M.; Nurmela, A.; Nordlund, E.; Metsä-Kortelainen, S.; Sozer, N. Applicability of Protein and Fiber-Rich Food Materials in Extrusion-Based 3D Printing. J. Food Eng. 2018, 220, 20–27. [Google Scholar] [CrossRef]
  5. Palo, M.; Holländer, J.; Suominen, J.; Yliruusi, J.; Sandler, N. 3D Printed Drug Delivery Devices: Perspectives and Technical Challenges. Expert Rev. Med. Devices 2017, 14, 685–696. [Google Scholar] [CrossRef]
  6. Labonnote, N.; Rønnquist, A.; Manum, B.; Rüther, P. Additive Construction: State-of-the-Art, Challenges and Opportunities. Autom. Constr. 2016, 72, 347–366. [Google Scholar] [CrossRef]
  7. Singh, S.; Ramakrishna, S. Biomedical Applications of Additive Manufacturing: Present and Future. Curr. Opin. Biomed. Eng. 2017, 2, 105–115. [Google Scholar] [CrossRef]
  8. Clini, P.; El Mehtedi, M.; Nespeca, R.; Ruggeri, L.; Raffaelli, E. A Digital Reconstruction Procedure from Laser Scanner Survey to 3d Printing: The Theoretical Model of the Arch of Trajan (Ancona). SCIRES-IT—SCIentific RESearch Inf. Technol. 2018, 7, 1–12. [Google Scholar] [CrossRef]
  9. Gibson, I.; Rosen, D.; Stucker, B.; Khorasani, M. Additive Manufacturing Technologies; Springer International Publishing: Cham, Germany, 2021; ISBN 978-3-030-56126-0. [Google Scholar]
  10. Abdulhameed, O.; Al-Ahmari, A.; Ameen, W.; Mian, S.H. Additive Manufacturing: Challenges, Trends, and Applications. Adv. Mech. Eng. 2019, 11, 1687814018822880. [Google Scholar] [CrossRef]
  11. Skylar-Scott, M.A.; Mueller, J.; Visser, C.W.; Lewis, J.A. Voxelated Soft Matter via Multimaterial Multinozzle 3D Printing. Nature 2019, 575, 330–335. [Google Scholar] [CrossRef]
  12. Kafle, A.; Luis, E.; Silwal, R.; Pan, H.M.; Shrestha, P.L.; Bastola, A.K. 3D/4D Printing of Polymers: Fused Deposition Modelling (FDM), Selective Laser Sintering (SLS), and Stereolithography (SLA). Polymers 2021, 13, 3101. [Google Scholar] [CrossRef] [PubMed]
  13. Tymrak, B.M.; Kreiger, M.; Pearce, J.M. Mechanical Properties of Components Fabricated with Open-Source 3-D Printers under Realistic Environmental Conditions. Mater. Des. 2014, 58, 242–246. [Google Scholar] [CrossRef]
  14. Brydson, J.A. Plastics Materials; Elsevier: Amsterdam, The Netherlands, 1999; ISBN 978-0-08-051408-6. [Google Scholar]
  15. Tsai, H.-H.; Wu, S.-J.; Wu, Y.-D.; Hong, W.-Z. Feasibility Study on the Fused Filaments of Injection-Molding-Grade Poly(Ethylene Terephthalate) for 3D Printing. Polymers 2022, 14, 2276. [Google Scholar] [CrossRef]
  16. Moreno Nieto, D.; Alonso-García, M.; Pardo-Vicente, M.-A.; Rodríguez-Parada, L. Product Design by Additive Manufacturing for Water Environments: Study of Degradation and Absorption Behavior of PLA and PETG. Polymers 2021, 13, 1036. [Google Scholar] [CrossRef] [PubMed]
  17. Li, W.; Zhao, X.; Liu, Y.; Ouyang, Y.; Li, W.; Chen, D.; Ye, D. Hygrothermal Aging Behavior and Flexural Property of Carbon Fiber-Reinforced Polyethylene Terephthalate Glycol Composites. Text. Res. J. 2023, 93, 1005–1018. [Google Scholar] [CrossRef]
  18. Guessasma, S.; Belhabib, S.; Nouri, H. Printability and Tensile Performance of 3D Printed Polyethylene Terephthalate Glycol Using Fused Deposition Modelling. Polymers 2019, 11, 1220. [Google Scholar] [CrossRef] [PubMed]
  19. Lakshman Sri, S.V.; Karthick, A.; Dinesh, C. Evaluation of Mechanical Properties of 3D Printed PETG and Polyamide (6) Polymers. Chem. Phys. Impact 2024, 8, 100491. [Google Scholar] [CrossRef]
  20. Somireddy, M.; Czekanski, A.; Singh, C.V. Development of Constitutive Material Model of 3D Printed Structure via FDM. Mater. Today Commun. 2018, 15, 143–152. [Google Scholar] [CrossRef]
  21. Garzon-Hernandez, S.; Arias, A.; Garcia-Gonzalez, D. A Continuum Constitutive Model for FDM 3D Printed Thermoplastics. Compos. Part B Eng. 2020, 201, 108373. [Google Scholar] [CrossRef]
  22. Bandinelli, F.; Peroni, L.; Morena, A. Elasto-Plastic Mechanical Modeling of Fused Deposition 3D Printing Materials. Polymers 2023, 15, 234. [Google Scholar] [CrossRef]
  23. Mohamed, O.A.; Masood, S.H.; Bhowmik, J.L. Optimization of Fused Deposition Modeling Process Parameters: A Review of Current Research and Future Prospects. Adv. Manuf. 2015, 3, 42–53. [Google Scholar] [CrossRef]
  24. Chacón, J.M.; Caminero, M.A.; García-Plaza, E.; Núñez, P.J. Additive Manufacturing of PLA Structures Using Fused Deposition Modelling: Effect of Process Parameters on Mechanical Properties and Their Optimal Selection. Mater. Des. 2017, 124, 143–157. [Google Scholar] [CrossRef]
  25. Popescu, D.; Zapciu, A.; Amza, C.; Baciu, F.; Marinescu, R. FDM Process Parameters Influence over the Mechanical Properties of Polymer Specimens: A Review. Polym. Test. 2018, 69, 157–166. [Google Scholar] [CrossRef]
  26. Gordelier, T.J.; Thies, P.R.; Turner, L.; Johanning, L. Optimising the FDM Additive Manufacturing Process to Achieve Maximum Tensile Strength: A State-of-the-Art Review. Rapid Prototyp. J. 2019, 25, 953–971. [Google Scholar] [CrossRef]
  27. Wang, S.; Ma, Y.; Deng, Z.; Zhang, S.; Cai, J. Effects of Fused Deposition Modeling Process Parameters on Tensile, Dynamic Mechanical Properties of 3D Printed Polylactic Acid Materials. Polym. Test. 2020, 86, 106483. [Google Scholar] [CrossRef]
  28. Cojocaru, V.; Frunzaverde, D.; Miclosina, C.-O.; Marginean, G. The Influence of the Process Parameters on the Mechanical Properties of PLA Specimens Produced by Fused Filament Fabrication—A Review. Polymers 2022, 14, 886. [Google Scholar] [CrossRef] [PubMed]
  29. Durgashyam, K.; Indra Reddy, M.; Balakrishna, A.; Satyanarayana, K. Experimental Investigation on Mechanical Properties of PETG Material Processed by Fused Deposition Modeling Method. Mater. Today Proc. 2019, 18, 2052–2059. [Google Scholar] [CrossRef]
  30. Ajay Kumar, M.; Khan, M.S.; Mishra, S.B. Effect of Machine Parameters on Strength and Hardness of FDM Printed Carbon Fiber Reinforced PETG Thermoplastics. Mater. Today Proc. 2020, 27, 975–983. [Google Scholar] [CrossRef]
  31. Yao, T.; Deng, Z.; Zhang, K.; Li, S. A Method to Predict the Ultimate Tensile Strength of 3D Printing Polylactic Acid (PLA) Materials with Different Printing Orientations. Compos. Part B Eng. 2019, 163, 393–402. [Google Scholar] [CrossRef]
  32. Jayanth, N.; Jaswanthraj, K.; Sandeep, S.; Mallaya, N.H.; Siddharth, S.R. Effect of Heat Treatment on Mechanical Properties of 3D Printed PLA. J. Mech. Behav. Biomed. Mater. 2021, 123, 104764. [Google Scholar] [CrossRef]
  33. Bhandari, S.; Lopez-Anido, R.A.; Gardner, D.J. Enhancing the Interlayer Tensile Strength of 3D Printed Short Carbon Fiber Reinforced PETG and PLA Composites via Annealing. Addit. Manuf. 2019, 30, 100922. [Google Scholar] [CrossRef]
  34. Sood, A.K.; Ohdar, R.K.; Mahapatra, S.S. Improving Dimensional Accuracy of Fused Deposition Modelling Processed Part Using Grey Taguchi Method. Mater. Des. 2009, 30, 4243–4252. [Google Scholar] [CrossRef]
  35. Alexopoulou, V.E.; Christodoulou, I.T.; Markopoulos, A.P. Effect of Printing Speed and Layer Height on Geometrical Accuracy of FDM-Printed Resolution Holes of PETG Artifacts. Eng. Proc. 2022, 24, 11. [Google Scholar] [CrossRef]
  36. Bhosale, V.; Gaikwad, P.; Dhere, S.; Sutar, C.; Raykar, S.J. Analysis of Process Parameters of 3D Printing for Surface Finish, Printing Time and Tensile Strength. Mater. Today Proc. 2022, 59, 841–846. [Google Scholar] [CrossRef]
  37. Mani, M.; Karthikeyan, A.G.; Kalaiselvan, K.; Muthusamy, P.; Muruganandhan, P. Optimization of FDM 3-D Printer Process Parameters for Surface Roughness and Mechanical Properties Using PLA Material. Mater. Today Proc. 2022, 66, 1926–1931. [Google Scholar] [CrossRef]
  38. Wahab Hashmi, A.; Singh Mali, H.; Meena, A. Improving the Surface Characteristics of Additively Manufactured Parts: A Review. Mater. Today Proc. 2023, 81, 723–738. [Google Scholar] [CrossRef]
  39. Altan, M.; Eryildiz, M.; Gumus, B.; Kahraman, Y. Effects of Process Parameters on the Quality of PLA Products Fabricated by Fused Deposition Modeling (FDM): Surface Roughness and Tensile Strength. Mater. Test. 2018, 60, 471–477. [Google Scholar] [CrossRef]
  40. Barrios, J.M.; Romero, P.E. Improvement of Surface Roughness and Hydrophobicity in PETG Parts Manufactured via Fused Deposition Modeling (FDM): An Application in 3D Printed Self–Cleaning Parts. Materials 2019, 12, 2499. [Google Scholar] [CrossRef]
  41. Kadhum, A.H.; Al-Zubaidi, S.; Abdulkareem, S.S. Effect of the Infill Patterns on the Mechanical and Surface Characteristics of 3D Printing of PLA, PLA+ and PETG Materials. ChemEngineering 2023, 7, 46. [Google Scholar] [CrossRef]
  42. Hadeeyah, A.; Jamhour, H.; Emhemed, I.; Alhadar, F.; Masmoudi, N.; Wali, M. The Impact Of Carbon Fiber on the Surface Properties of the 3D Printed PEGT Product. J. Pure Appl. Sci. 2023, 22, 23–27. [Google Scholar] [CrossRef]
  43. Vidakis, N.; David, C.; Petousis, M.; Sagris, D.; Mountakis, N.; Moutsopoulou, A. The Effect of Six Key Process Control Parameters on the Surface Roughness, Dimensional Accuracy, and Porosity in Material Extrusion 3D Printing of Polylactic Acid: Prediction Models and Optimization Supported by Robust Design Analysis. Adv. Ind. Manuf. Eng. 2022, 5, 100104. [Google Scholar] [CrossRef]
  44. Lalehpour, A.; Janeteas, C.; Barari, A. Surface Roughness of FDM Parts after Post-Processing with Acetone Vapor Bath Smoothing Process. Int. J. Adv. Manuf. Technol. 2018, 95, 1505–1520. [Google Scholar] [CrossRef]
  45. Demircali, A.A.; Yilmaz, D.; Yilmaz, A.; Keskin, O.; Keshavarz, M.; Uvet, H. Enhancing Mechanical Properties and Surface Quality of FDM-Printed ABS: A Comprehensive Study on Cold Acetone Vapor Treatment. Int. J. Adv. Manuf. Technol. 2024, 130, 4027–4039. [Google Scholar] [CrossRef]
  46. Pandey, P.M.; Reddy, N.V.; Dhande, S.G. Improvement of Surface finish by Staircase Machining in Fused Deposition Modeling. J. Mater. Process. Technol. 2003, 9, 323–331. [Google Scholar] [CrossRef]
  47. Lalegani Dezaki, M.; Mohd Ariffin, M.K.A.; Ismail, M.I.S. Effects of CNC Machining on Surface Roughness in Fused Deposition Modelling (FDM) Products. Materials 2020, 13, 2608. [Google Scholar] [CrossRef]
  48. El Mehtedi, M.; Buonadonna, P.; Carta, M.; El Mohtadi, R.; Marongiu, G.; Loi, G.; Aymerich, F. Effects of Milling Parameters on Roughness and Burr Formation in 3D- Printed PLA Components. Procedia Comput. Sci. 2023, 217, 1560–1569. [Google Scholar] [CrossRef]
  49. El Mehtedi, M.; Buonadonna, P.; Loi, G.; El Mohtadi, R.; Carta, M.; Aymerich, F. Surface Quality Related to Face Milling Parameters in 3D Printed Carbon Fiber-Reinforced PETG. J. Compos. Sci. 2024, 8, 128. [Google Scholar] [CrossRef]
  50. Cococcetta, N.M.; Pearl, D.; Jahan, M.P.; Ma, J. Investigating Surface Finish, Burr Formation, and Tool Wear during Machining of 3D Printed Carbon Fiber Reinforced Polymer Composite. J. Manuf. Process. 2020, 56, 1304–1316. [Google Scholar] [CrossRef]
  51. Guo, C.; Liu, X.; Liu, G. Surface Finishing of FDM-Fabricated Amorphous Polyetheretherketone and Its Carbon-Fiber-Reinforced Composite by Dry Milling. Polymers 2021, 13, 2175. [Google Scholar] [CrossRef]
  52. Pămărac, R.G.; Petruse, R.E. Study Regarding the Optimal Milling Parameters for Finishing 3D Printed Parts from ABS and PLA Materials. Acta Univ. Cibiniensis. Technol. Ser. 2018, 70, 66–72. [Google Scholar] [CrossRef]
  53. El Mehtedi, M.; Buonadonna, P.; El Mohtadi, R.; Aymerich, F.; Carta, M. Surface Quality Related to Machining Parameters in 3D-Printed PETG Components. Procedia Comput. Sci. 2024, 232, 1212–1221. [Google Scholar] [CrossRef]
  54. García-Domínguez, A.; Claver, J.; Camacho, A.M.; Sebastián, M.A. Considerations on the Applicability of Test Methods for Mechanical Characterization of Materials Manufactured by FDM. Materials 2020, 13, 28. [Google Scholar] [CrossRef]
  55. Wang, P.; Zou, B.; Ding, S.; Li, L.; Huang, C. Effects of FDM-3D Printing Parameters on Mechanical Properties and Microstructure of CF/PEEK and GF/PEEK. Chin. J. Aeronaut. 2021, 34, 236–246. [Google Scholar] [CrossRef]
  56. Patel, K.S.; Shah, D.B.; Joshi, S.J.; Patel, K.M. Developments in 3D Printing of Carbon Fiber Reinforced Polymer Containing Recycled Plastic Waste: A Review. Clean. Mater. 2023, 9, 100207. [Google Scholar] [CrossRef]
  57. Mahesh, V.; Joseph, A.S.; Mahesh, V.; Harursampath, D.; Vn, C. Investigation on the Mechanical Properties of Additively Manufactured PETG Composites Reinforced with OMMT Nanoclay and Carbon Fibers. Polym. Compos. 2021, 42, 2380–2395. [Google Scholar] [CrossRef]
  58. Bex, G.J.P.; Ingenhut, B.L.J.; Cate, T.; Sezen, M.; Ozkoc, G. Sustainable Approach to Produce 3D-printed Continuous Carbon Fiber Composites: “A Comparison of Virgin and Recycled PETG”. Polym. Compos. 2021, 42, 4253–4264. [Google Scholar] [CrossRef]
  59. Oksman, K.; Skrifvars, M.; Selin, J.-F. Natural Fibres as Reinforcement in Polylactic Acid (PLA) Composites. Compos. Sci. Technol. 2003, 63, 1317–1324. [Google Scholar] [CrossRef]
  60. Vinyas, M.; Athul, S.J.; Harursampath, D.; Nguyen Thoi, T. Mechanical Characterization of the Poly Lactic Acid (PLA) Composites Prepared through the Fused Deposition Modelling Process. Mater. Res. Express 2019, 6, 105359. [Google Scholar] [CrossRef]
  61. Giltrow, J.P.; Lancaster, J.K. Carbon-Fibre Reinforced Polymers as Self-Lubricating Materials. Proc. Inst. Mech. Eng. Conf. Proc. 1967, 182, 147–157. [Google Scholar] [CrossRef]
  62. Vallejo, J.; García-Plaza, E.; Núñez, P.J.; Chacón, J.M.; Caminero, M.A.; Romero, A. Machinability Analysis of Carbon Fibre Reinforced PET-Glycol Composites Processed by Additive Manufacturing. Compos. Part A Appl. Sci. Manuf. 2023, 172, 107561. [Google Scholar] [CrossRef]
Figure 1. (a) dimensions of the samples used for tensile testing and (b) printing directions.
Jmmp 08 00131 g001
Figure 2. Geometric dimensions of samples for machining tests.
Jmmp 08 00131 g002
Figure 3. Stress-strain curves of PLA, PETG, and CF-PETG in all tested conditions. (a) X, (b) Y, and (c) Z printing direction.
Jmmp 08 00131 g003
Figure 4. Bar charts of mechanical properties of all samples in all tested conditions: (a) Young’s modulus, (b) Ultimate Tensile strength, and (c) elongation at break.
Jmmp 08 00131 g004
Figure 5. Pareto charts of the standardized effects for roughness of (a) CF-PETG, (b) PETG, and (c) PLA.
Jmmp 08 00131 g005
Figure 6. Pareto charts of the standardized effects for burr height of (a) CF-PETG, (b) PETG, and (c) PLA.
Jmmp 08 00131 g006
Figure 7. Main effect plots for roughness of PLA, PETG, and CF-PETG for (a) rotational speed, (b) feed rate, and (c) cut depth.
Jmmp 08 00131 g007
Figure 8. Main effect plots for burr height of PLA, PETG, and CF-PETG for (a) rotational speed, (b) feed rate, and (c) cut depth.
Jmmp 08 00131 g008
Table 1. Milling parameters on 3D-printed samples of different materials.
AuthorsFDM-Printed Material Rotation   Speed   ( n ) Feed   Rate   ( V f )
Pamarac et al. [52]ABS3500 rpm35–840 mm/min
Pamarac et al. [52]PLA3500 rpm35–1880 mm/min
Lalelgani et al. [47]PLA3283–10504 rpm1000 mm/min
El Mehtedi et al. [48]PLA3500–8000 rpm400–800 mm/min
Lalegani Dezaki et al. [47]PLA3500 rpm1200 mm/min
Guo et al. [51]PEEK and CF-PEEK3000–12,500 rpm0.02–0.1 mm/teeth
Cococcetta et al. [34]Onyx and CF-Onyx6000 rpm600–1200 mm/min
Vallejo et al. [36]PETG and CF-PETG3500 rpm800 mm/min
El Mehtedi et al. [49,53]PETG and CF-PETG3500–8000 rpm400–800 mm/min
Table 2. Design of the Experiment, factors’ summary table.
FactorsLevels
NameTypeUnitsSymbols1234
Rotational speed ( n )Numeric[rpm]A300055008000-
Feed Rate ( V f )Numeric[mm/min]B400600800-
Depth of cut ( a p )Numeric[mm]C0.20.40.60.8
Disclaimer/Publisher’s Note: The statements, opinions and data contained in all publications are solely those of the individual author(s) and contributor(s) and not of MDPI and/or the editor(s). MDPI and/or the editor(s) disclaim responsibility for any injury to people or property resulting from any ideas, methods, instructions or products referred to in the content.

