Review

Cost Modelling for Powder Bed Fusion and Directed Energy Deposition Additive Manufacturing

1
Advanced Manufacturing Laboratory, Institute of Infrastructure Technology, Research and Management, Ahmedabad 380008, India
2
Department of Mechanical Engineering, University of Bath, Bath BA2 7AY, UK
3
Department of Mechanical Engineering, Izmir Institute of Technology, 35430 Izmir, Turkey
*
Author to whom correspondence should be addressed.
J. Manuf. Mater. Process. 2024, 8(4), 142; https://doi.org/10.3390/jmmp8040142
Submission received: 26 May 2024 / Revised: 27 June 2024 / Accepted: 1 July 2024 / Published: 4 July 2024

Abstract

:
Additive manufacturing (AM) is increasingly used for fabricating parts directly from digital models, usually by depositing and bonding successive layers of various materials such as polymers, metals, ceramics, and composites. The design freedom and reduced material consumption for producing near-net-shaped components have made AM a popular choice across various industries, including the automotive and aerospace sectors. Despite its growing popularity, the accurate estimation of production time, productivity and cost remains a significant challenge due to the ambiguity surrounding the technology. Hence, reliable cost estimation models are necessary to guide decisions throughout product development activities. This paper provides a thorough analysis of the state of the art in cost models for AM with a specific focus on metal Directed Energy Deposition (DED) and Powder Bed Fusion (PBF) processes. An overview of DED and PBF processes is presented to enhance the understanding of how process parameters impact the overall cost. Consequently, suitable costing techniques and significant cost contributors in AM have been identified and examined in-depth. Existing cost modelling approaches in the field of AM are critically evaluated, leading to the suggestion of a comprehensive cost breakdown including often-overlooked aspects. This study aims to contribute to the development of accurate cost prediction models in supporting decision making in the implementation of AM.

1. Introduction

Additive manufacturing (AM) has rapidly evolved and been incorporated into production systems. Several terminologies have been used to describe its introduction to the commercial sector, including solid freeform fabrication, rapid prototyping, three-dimensional printing and layered manufacturing. Conceptually, AM is a process that enables 3D designs to be produced directly from CAD files without the need for part-specific tools or die. Complex 3D objects can be created by gradually printing multiple layers on top of one another using the freeform layer-wise fabrication technique [1]. Although, there are emerging methods that do not follow the traditional layer-wise approach.
Compared to traditional subtractive manufacturing processes that remove materials to produce the final part, AM offers numerous advantages such as design flexibility, reduced material waste, cost-effective low-volume production and the elimination of expensive tooling [2,3,4,5]. AM reduces the risk of component failure from the concept phase to the final fabrication phase, while also speeding up the products’ introduction to the market, decreasing the overall production costs [6]. AM has the potential to revolutionise a wide range of applications, and more progress is essential to create cutting-edge designs and operational procedures [7].
The capabilities of AM machines have already advanced to the point where the product’s ability to be manufactured is now the restriction, rather than how the CAD model is designed and created [8]. However, AM processes are not immediately adopted or widely dispersed. Any novel technology requires new infrastructure, expertise, standards and established supply chains to be utilised effectively. In this case, it is crucial to comprehend the costs and benefits of AM in mainstream manufacturing [9]. Therefore, cost modelling plays an important role in newly established AM processes as it helps in determining the feasibility and profitability of the process.
Over time, as more models, frameworks, and systems have been developed, the field of cost modelling research in AM has also evolved. Various costing methodologies and cost factors have been used in different application areas by researchers, with different methodologies focusing on different aspects of additive manufacturing, such as design, process, or system orientation. However, the ultimate objective of all these studies is to provide a clear understanding of the costs involved in the use of AM. In order to maintain a competitive advantage, an accurate cost model that effectively describes additive manufacturing activities and uses appropriate resources is needed. The model should accurately estimate the cost per unit of the final product or service [10]. The primary function of a product cost estimating model is to forecast the total costs that will likely be incurred throughout the product development and manufacturing stages. Accurate cost estimates are considered crucial for the development of strategic product planning and control systems, which may assist enterprises in achieving their financial objectives [11]. Additionally, they should be capable of identifying the major cost drivers for a specific part so that efforts can be effectively focused for minimising manufacturing costs.
This paper provides a comprehensive analysis of the literature on the modelling techniques and methodologies used for costing AM processes. The study aims to critically evaluate the strengths and limitations of the existing cost models and highlight the gaps and challenges that need to be addressed in future research.
An overview of metal AM technologies is provided in Section 2, followed by a comparative analysis between the Directed Energy Deposition (DED) and the Powder Bed Fusion (PBF) techniques in Section 3. In Section 4, state-of the-art cost classification techniques are reviewed in the context of AM and the main cost drivers in AM are identified. Section 5 provides information on different cost modelling techniques, namely deterministic, stochastic and software/computational models. A timeline of the major developments in cost modelling for AM is introduced in Section 6. Studies on cost modelling of AM are classified by the material and costing technique. A thorough analysis of these models is performed. Finally, in Section 7 and Section 8, the findings from the analysis are discussed and concluded and a pathway for future research is provided.

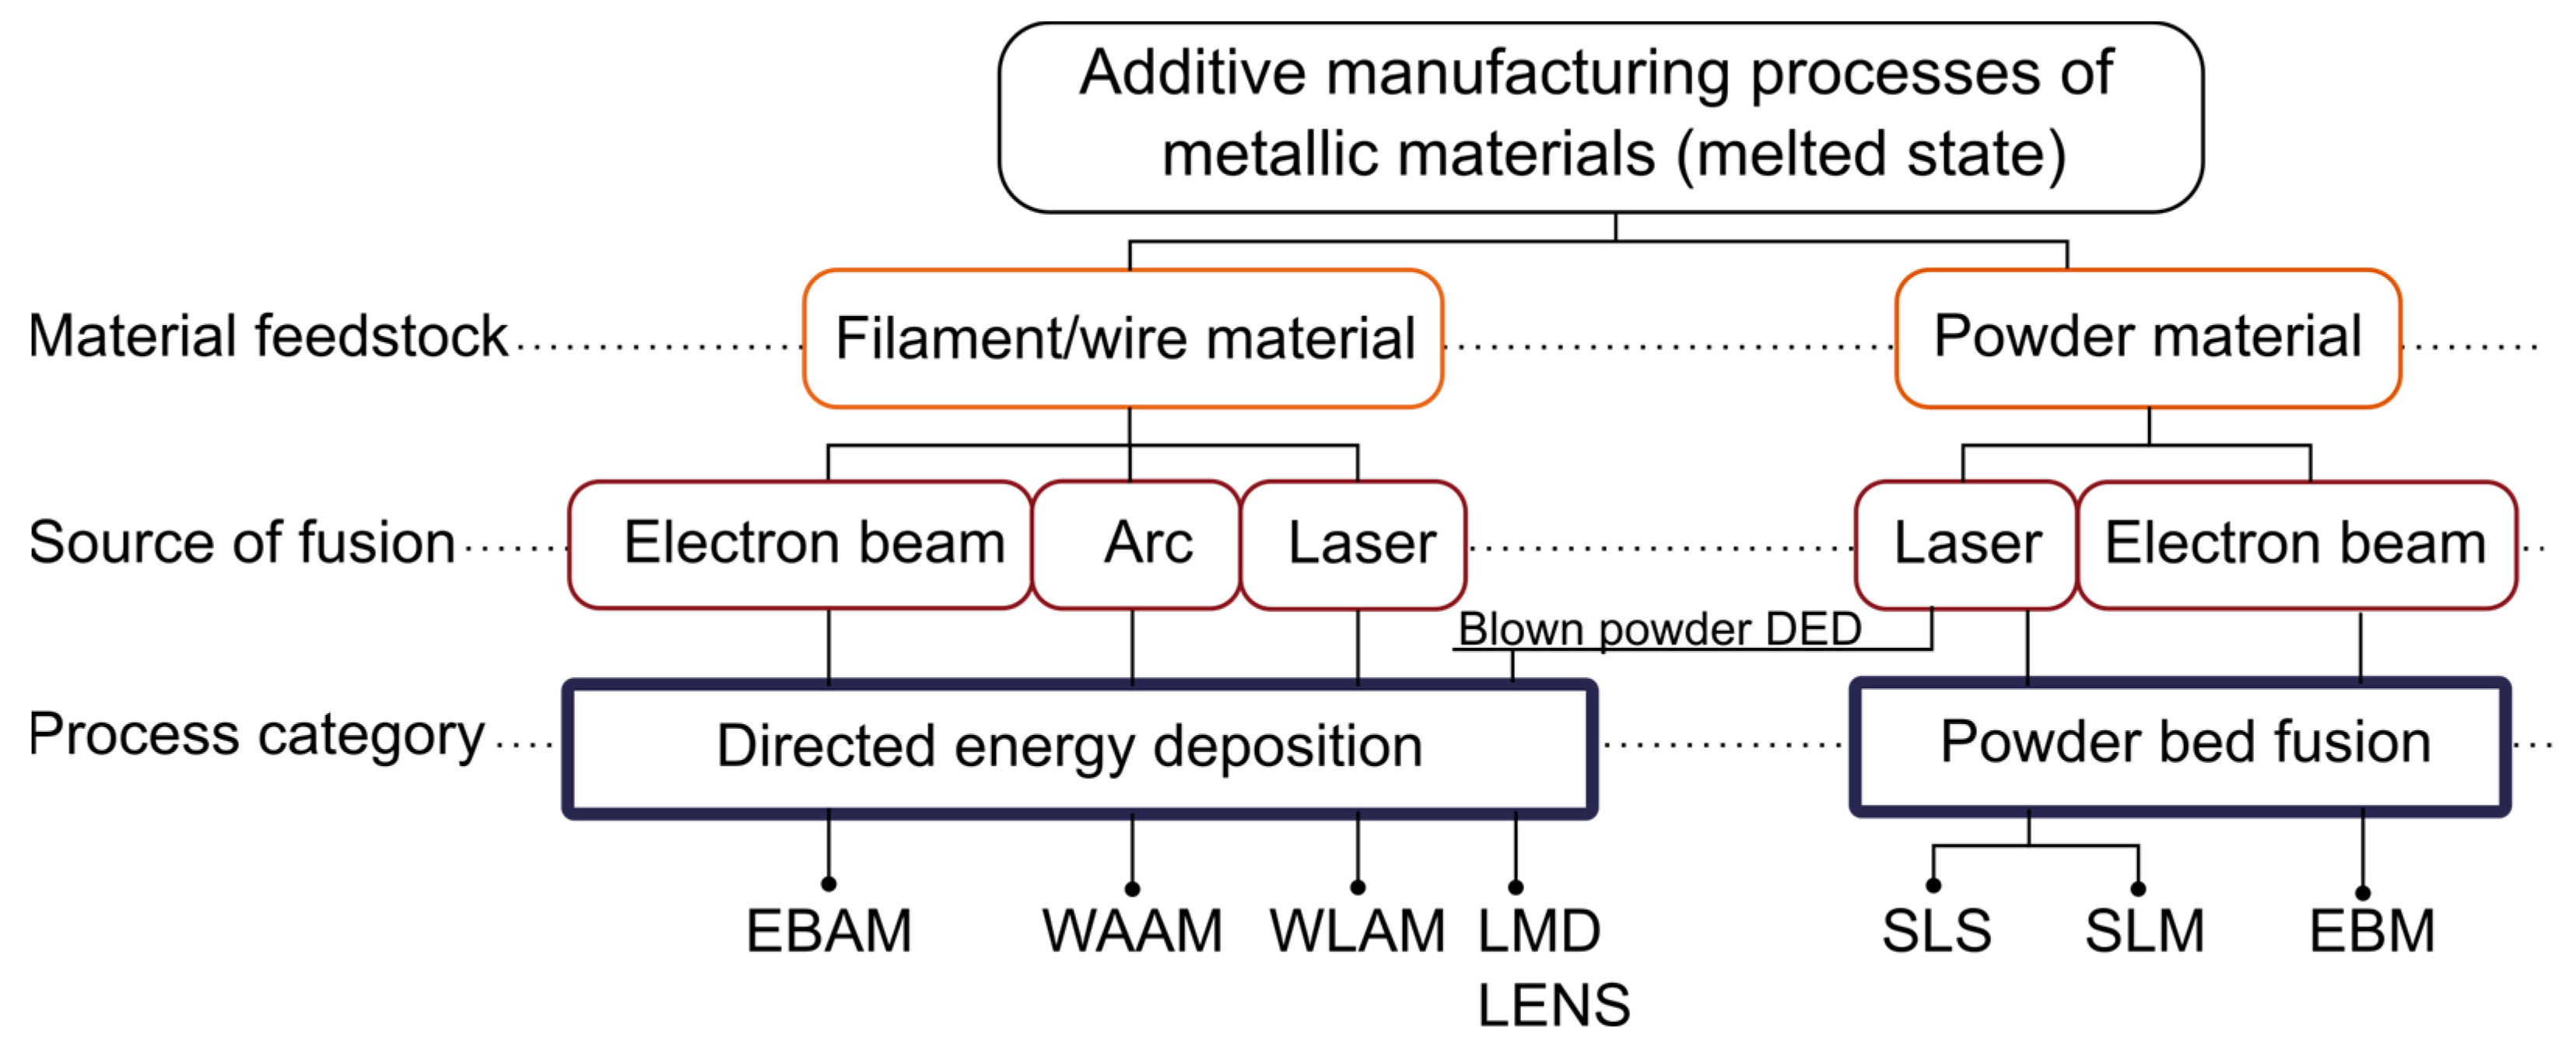
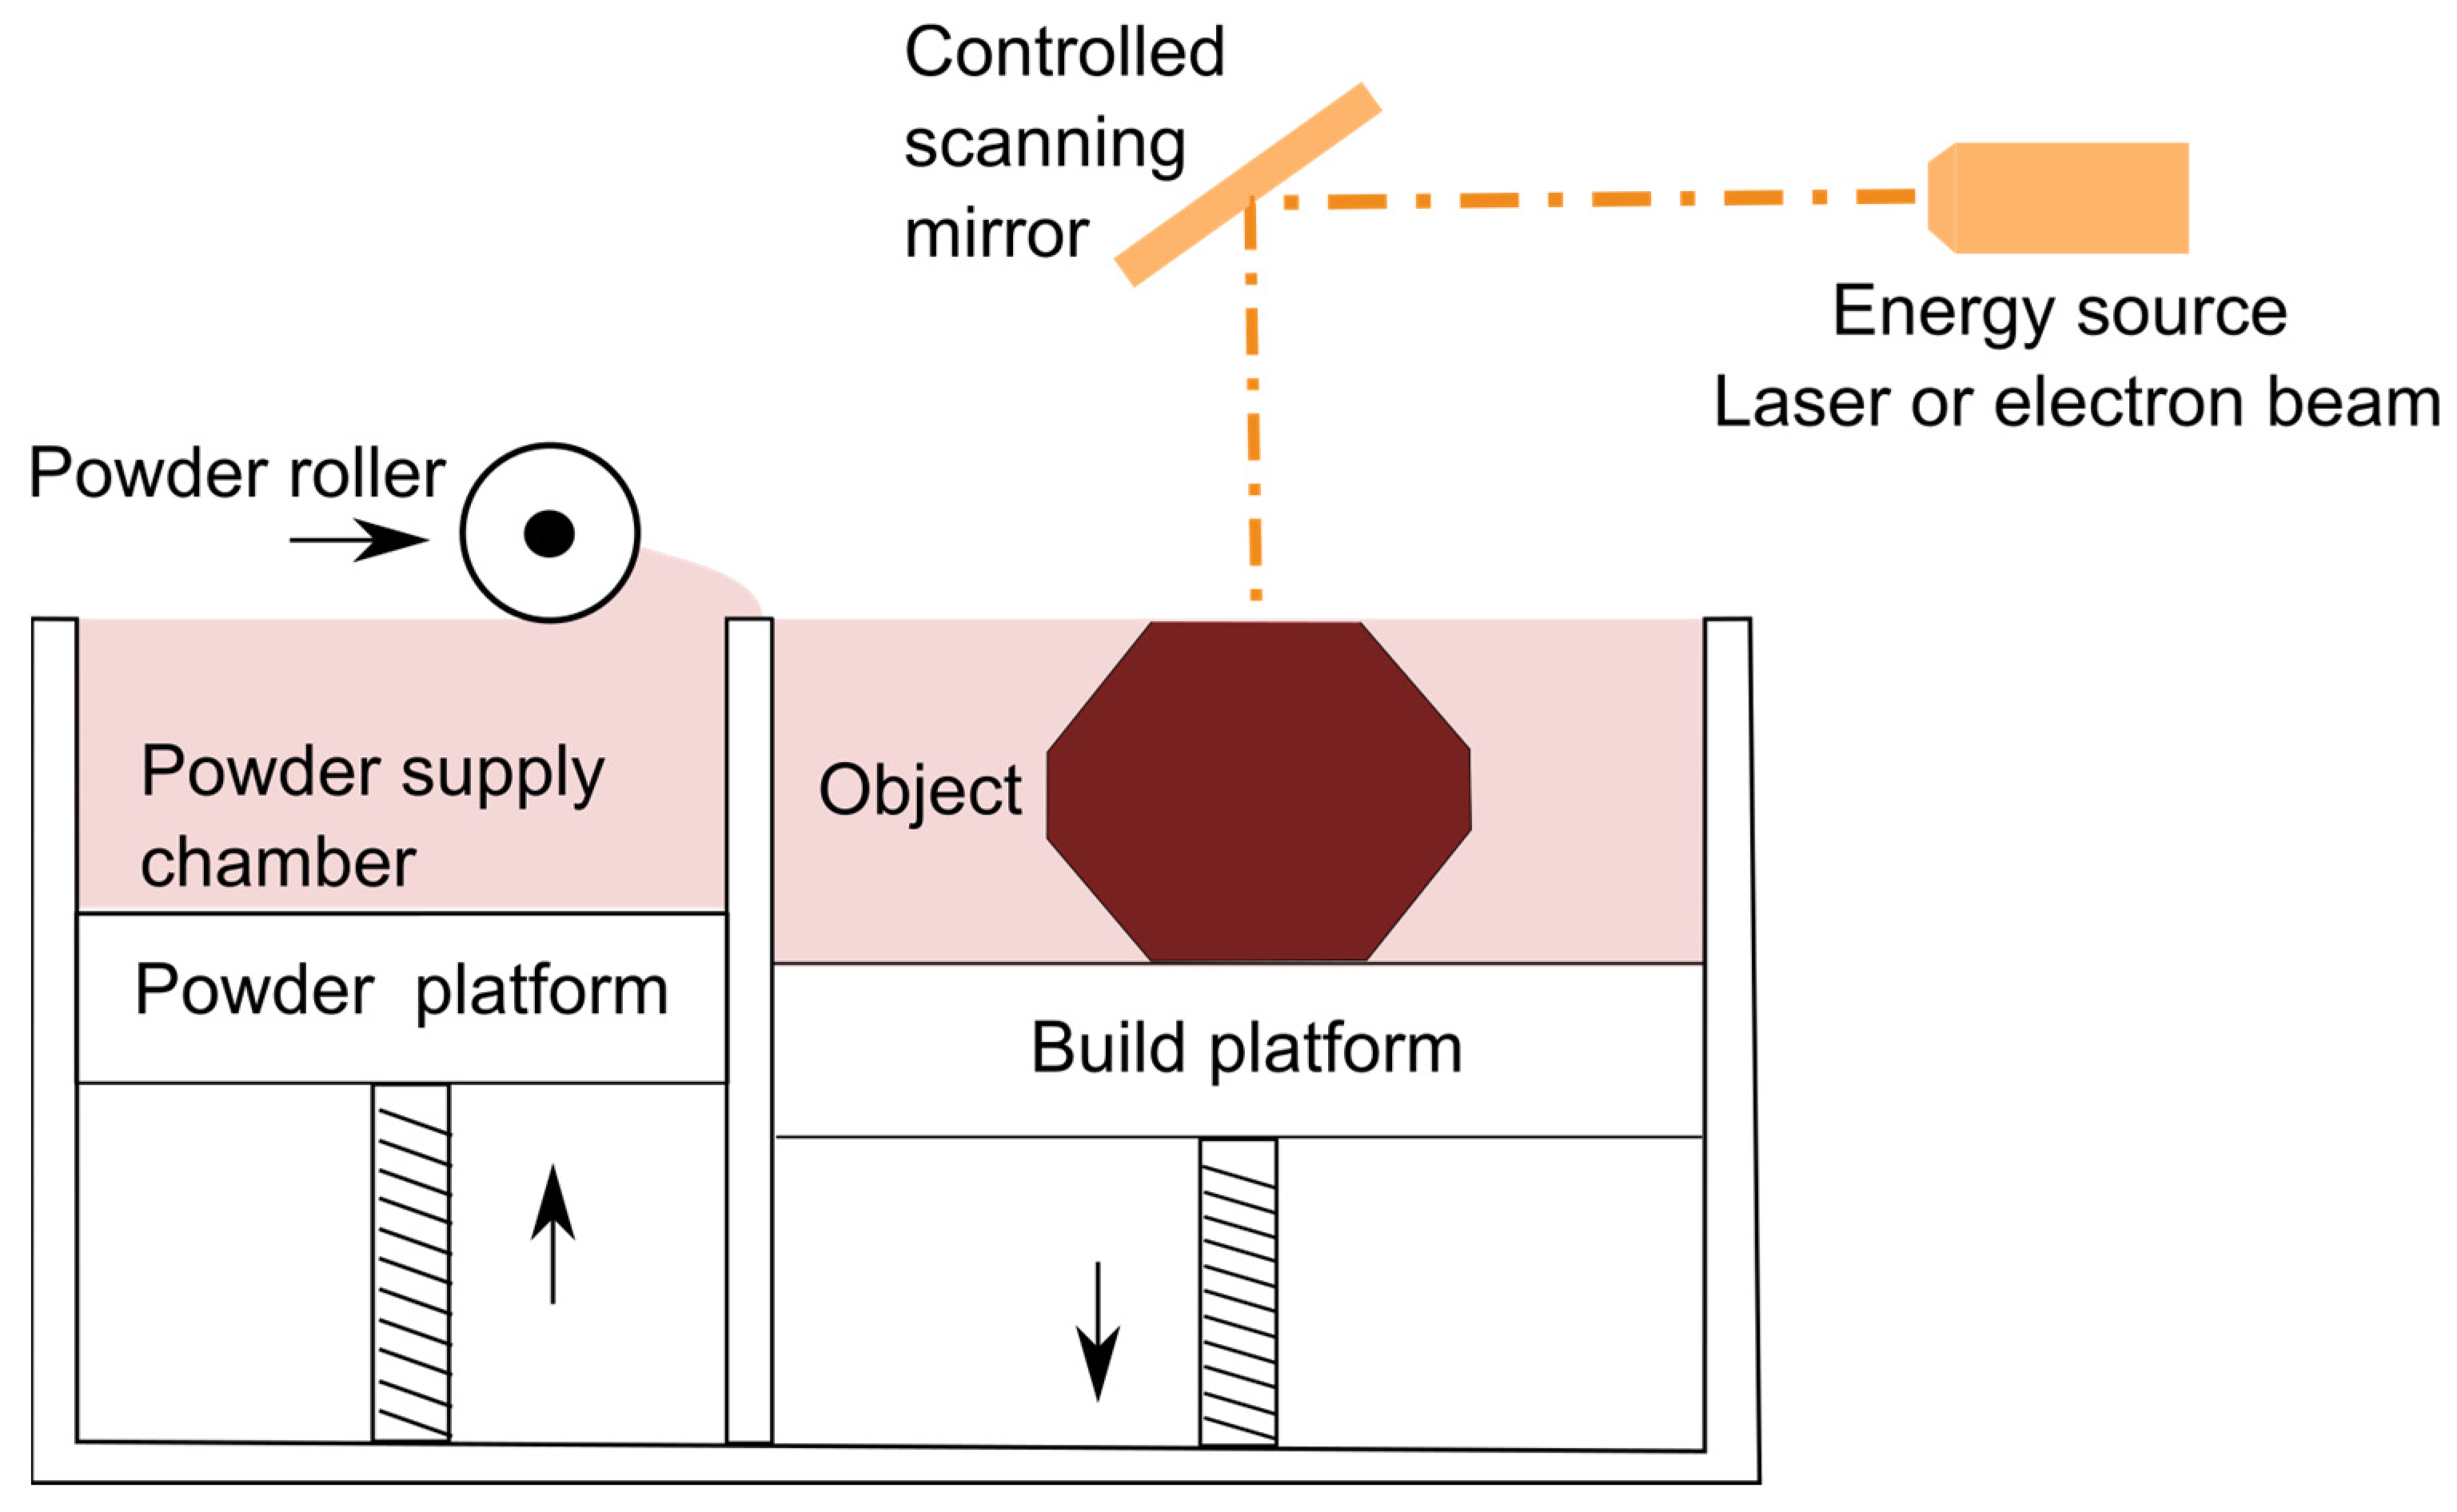
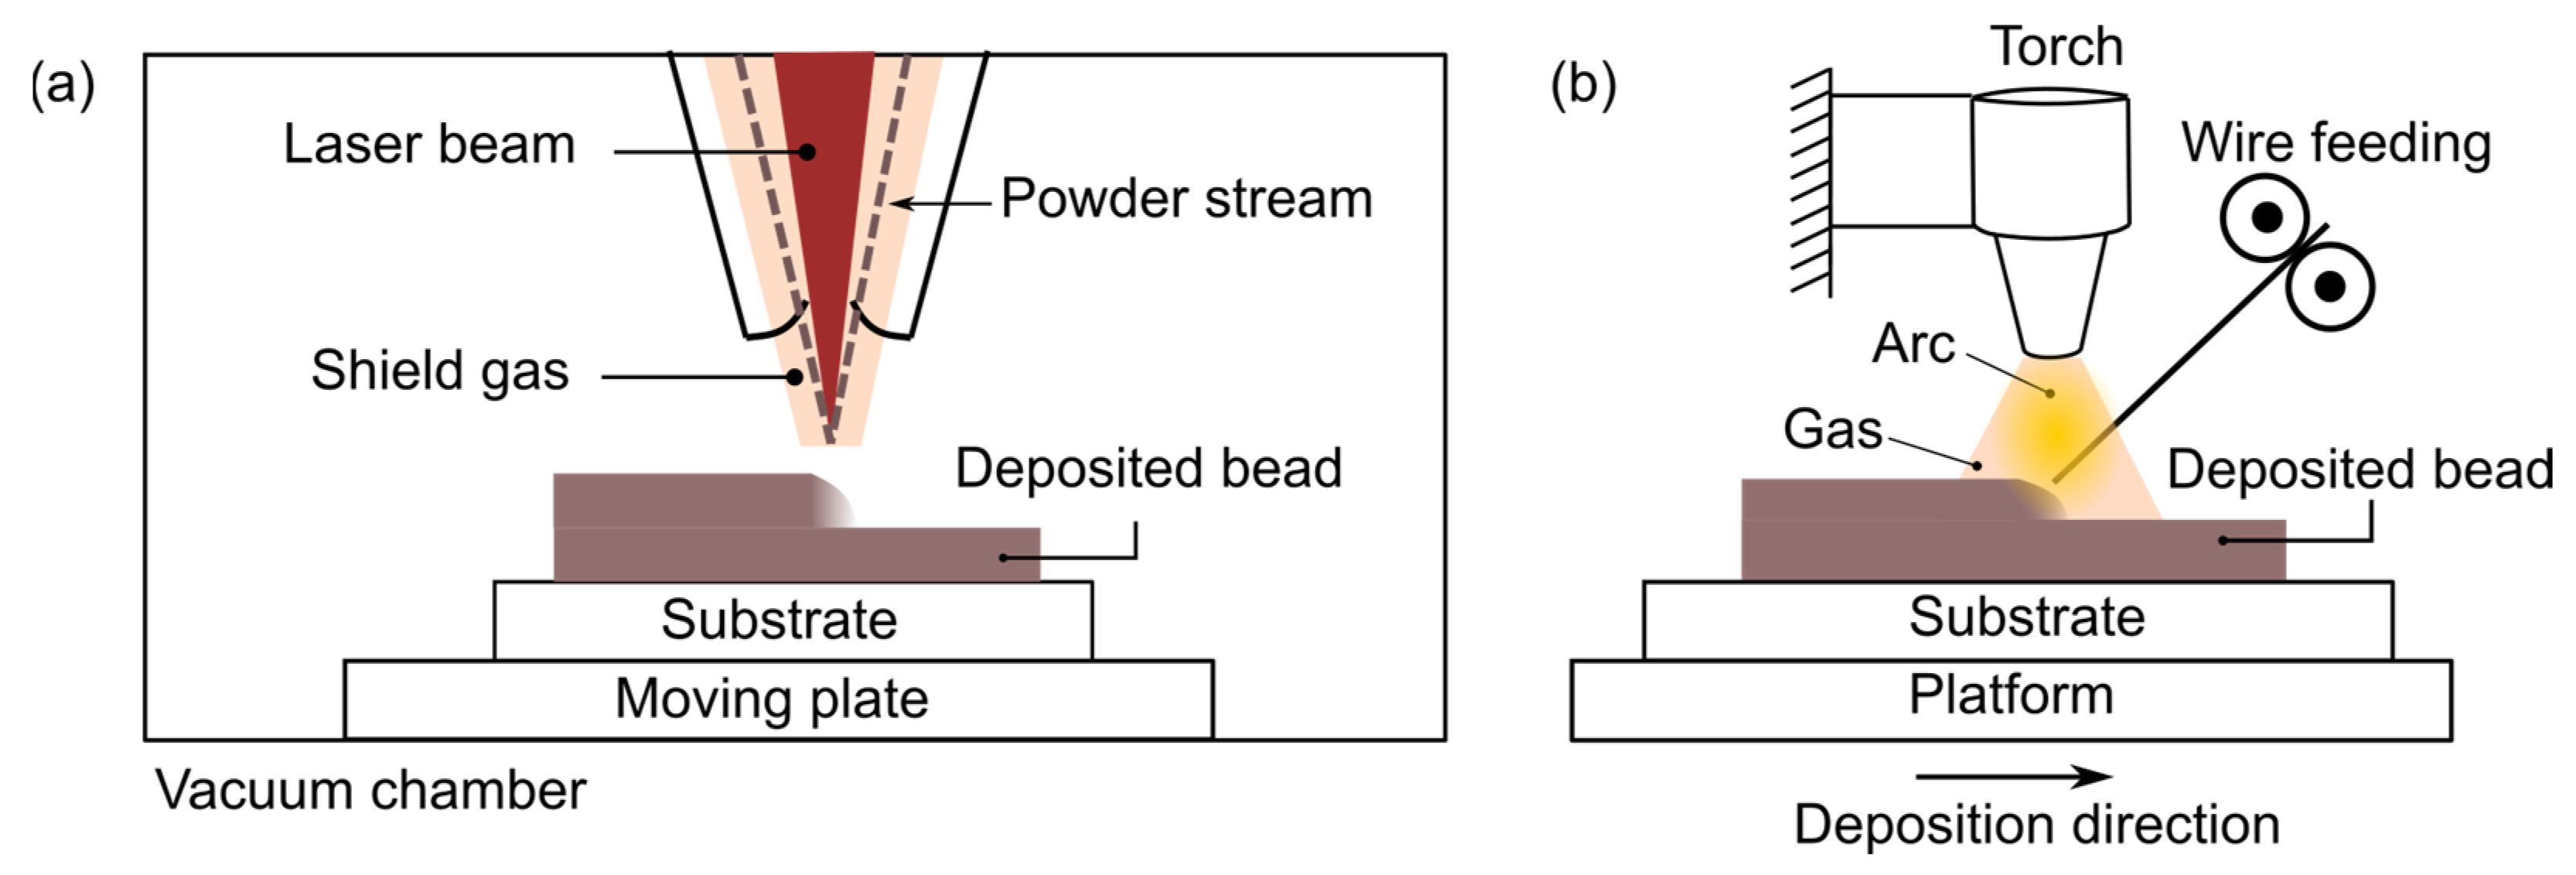
2. Powder Bed Fusion (PBF) and Directed Energy Deposition (DED) Processes

The ASTM (American Society for Testing Material) has classified AM processes into seven distinct groups based on shared characteristics in joining techniques used [12]: (i) VAT photopolymerization, (ii) material extrusion, (iii) binder jetting, (iv) material jetting, (v) sheet lamination, (vi) Powder Bed Fusion (PBF) and (vii) Directed Energy Deposition (DED).
A suitable process is selected based on the material types used, which span a range from metals and polymers to ceramics and composites. The focus of this paper is on Powder Bed Fusion (PBF) and Directed Energy Deposition (DED) processes for metal parts. ASTM categorization for metals with melted state of fusion is shown in Figure 1 [13]. Three different aspects of AM are used to categorise these AM processes, which are the state of fusion for the input material (melted or solid), material feedstock and source of fusion/bonding technique [14,15,16,17]. It is essential to accurately model the cost of these processes to ensure profitability and competitiveness in the market. Therefore, the process steps and equipment for both processes are thoroughly analysed.
PBF procedures include delivering energy to the build area via the source, such as a laser beam (PBF-LB) or electron beam (PBF-EB), which causes the powder to melt or sinter and produce the desired form. Up until the final three-dimensional item is printed, a thin fresh powder coating is then dispersed when the build platform descends, and the powder platform ascends [18]. Figure 2 shows the schematic of the PBF process. The capacity to create intricate shapes with internal channels at high resolution is one of the benefits of PBF technologies [19]. The variations between the PBF processes include those pertaining to two different energy sources used to either sinter or melt the metal powder, which are a laser or electron beam [19,20,21]. In SLS, a laser beam is used to fuse metal alloy particles layer by layer on a powder bed to create pre-defined CAD objects [22,23]. Selective Laser Melting (SLM) is an extension of the SLS process in which a melting process is used instead of sintering [24,25]. Electron Beam Melting (EBM) is another PBF process where the powder is melted during the process. The main difference between EBM and SLM is that EBM makes use of an electron beam in a vacuum environment as opposed to a laser beam under an inert gas such as argon [24]. A high-energy electron beam, acting as a heat source, melts powder by scanning the powder bed at high speed [26].
PBF processes have a constrained construction envelope and switching between materials can be time consuming and costly. Whilst there are emerging multi-material PBF technologies [27], most machines only process one material at a time. In most cases, only one material is processed on a machine, due to the need to clean the machine before switching between materials. Therefore, multiple machines will be required for processing different materials which can lead to increased capital cost. In PBF, the powder may be entrapped within the internal geometries of a part, necessitating additional post-processing which can increase the overall manufacturing costs.
In the DED technique, on the other hand, the materials, filament, wire or powder are melted first and then deposited on a solid surface or the previous layer. In DED, the substrate is heated by directing energy into a small, concentrated area, melting the substrate while also melting the material being added to the melt pool of the substrate. DED procedures are utilised to melt materials as they are being deposited rather than to melt materials that have already been put out on a powder bed [2]. The powder is targeted directly into the laser or electron beam focal point, leading to more efficient deposition. Furthermore, less powder handling in DED processes may reduce the risk of contamination and degradation that might happen in the PBF process during the collection, sieving and recycling processes. As such, powder consumption in DED may be reduced, which will have an impact on the overall AM cost. Depending on the phase of the feedstock material, DED procedures may also be divided into two subgroups: powder- and wire-based [28,29]. Figure 3a shows the schematics of Laser Engineered Net Shaping (LENS), which is a powder-based DED process, whereas Figure 3b depicts the basic schematics of the wire-based Wire-Arc Additive Manufacturing (WAAM) process.
Direct Metal Deposition (DMD) (also referred to as Laser Cladding, Laser Metal Deposition (LMD), Laser Consolidation or LENS [15,30,31]) uses a laser beam to completely melt the metal alloy particles. A close-by feeding nozzle (coaxial or off-axial) is responsible for supplying the powder. The DMD process’s small heat-affected zone allows for the construction of thin walls, which can also be useful in surface modification applications for repairs [28,32].
Wire-based AM techniques for metal alloys use an energy source, e.g., laser, electric arc or electron beam, to melt a metallic wire [33]. Wire-feed Laser Additive Manufacturing is an example process where a laser beam is concentrated on the substrate to melt the wire feedstock within an argon gas environment [34]. Apart from electron-beam AM, most wire-based AM methods operate within an open environmsent using a cartesian motion platform or a robotic system which allows for the production of components of any size, enabling cost-effective production of large structural aerospace parts [33,35,36]. WAAM is an example of a low-cost evolution of Gas Tungsten Arc Welding [37]. It has the potential to produce near-net shape preforms for large components without the use of complicated tooling, moulds or dies. This can potentially result in reductions in manufacturing costs and lead time, improved material efficiency and lower inventory and logistics costs through local, on-demand manufacturing. Busachi et al. [38] highlighted that WAAM has lower capital and feedstock costs compared to PBF and higher deposition rate makes it an attractive solution for producing large components.

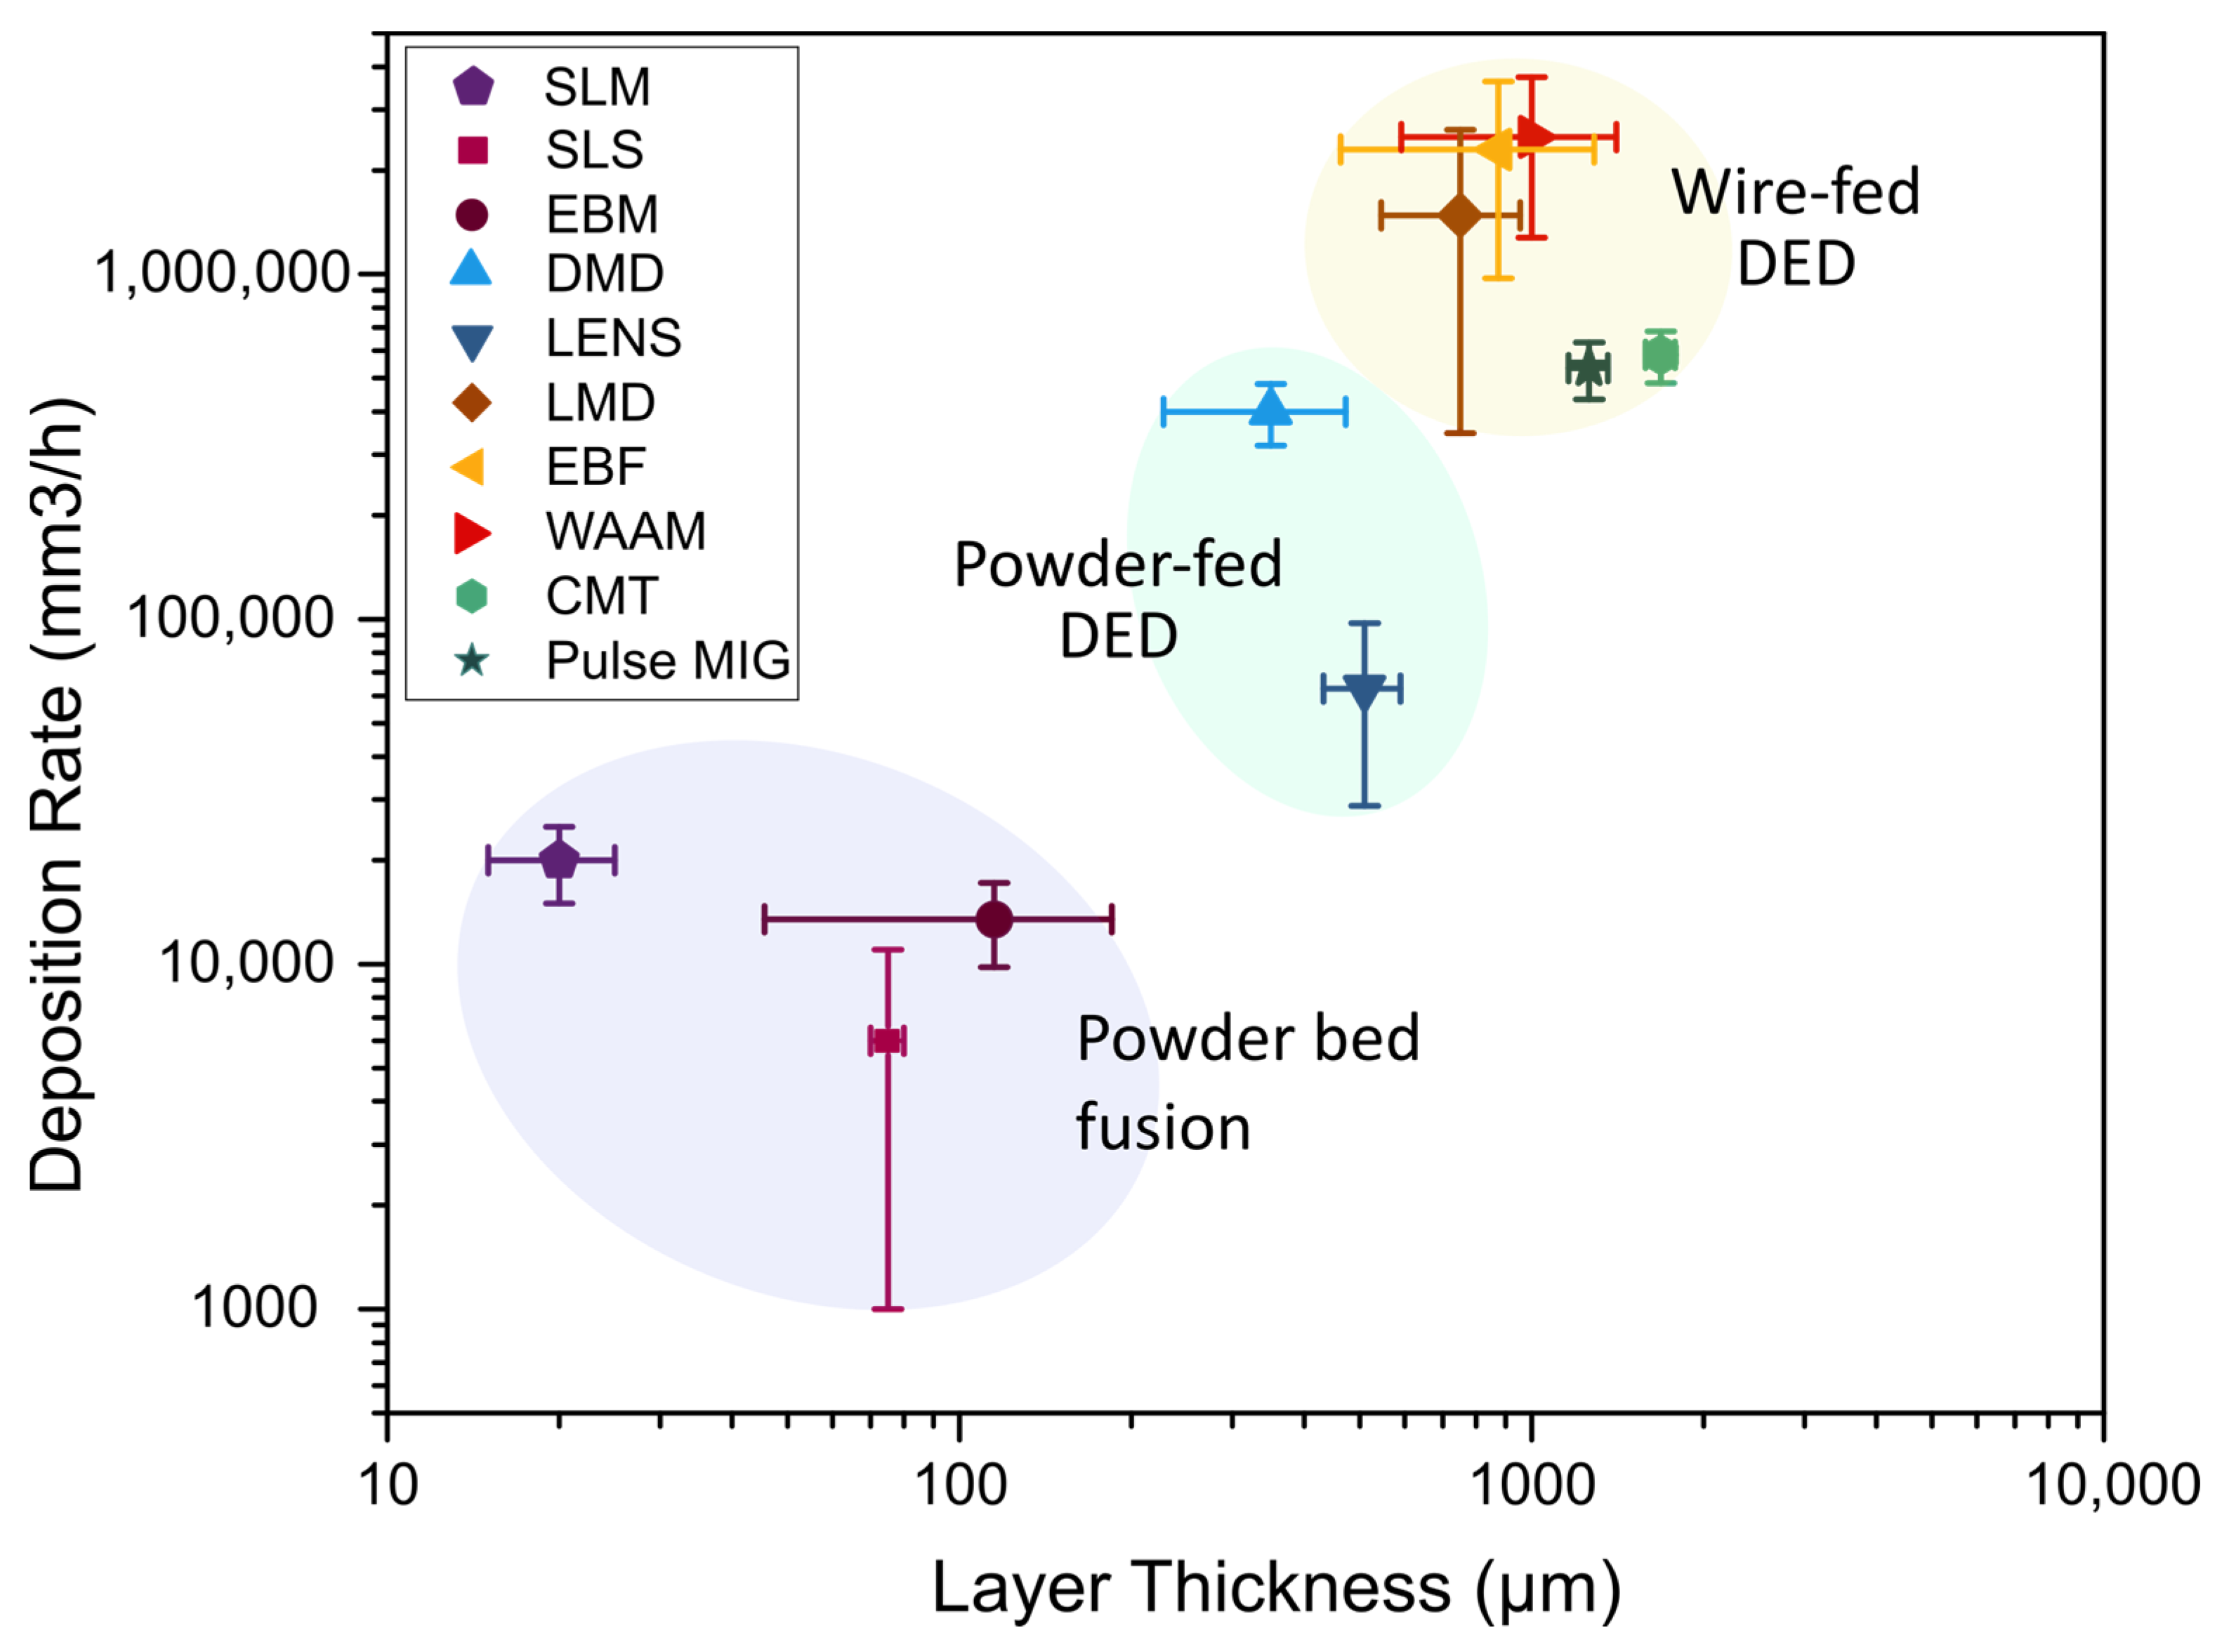
3. Comparison of the DED and PBF Processes

PBF and DED techniques have unique processing constraints and particular strengths and weaknesses. The primary pre-processing characteristics are material accessibility, design integrity, component quality (geometrical fidelity), build volume, and scanning speeds. Moreover, suitable post-processing treatments are a crucial consideration when choosing the right procedure for a certain application since they may be necessary to improve the mechanical properties and functions of the fabricated parts [39]. All of these parameters can have a direct impact on the processing costs. Therefore, evaluating the process characteristics is essential for informed decision making and accurate cost modelling in metal AM.
Vartanian et al. [40] compared DED and PBF technologies to evaluate the cost and print speed for a mid-size titanium (Ti6Al4V), Inconel 718 and AISI 316 stainless-steel metal component with a simple geometry. The findings of the research demonstrated that PBF is about ten times slower and five times more expensive than DED. They also concluded that completely dense materials with outstanding mechanical and fatigue characteristics can be produced via the powder-fed DED technique. However, it is important to consider that this conclusion might be limited to specific material types and process parameters [41]. PBF machines may be utilised to manufacture relatively small metal components with intricate internal geometries. There are studies [42,43] also investigating the impact of layer thickness on build quality, which can also speed up the manufacturing process. In PBF-LB of Ti-6Al-4V, Brudler et al. [44] reported that increasing the layer thickness from 60 μm to 300 μm can increase productivity but at the expense of reduced elongation percentage. Powder-fed DED machines can be used to create large parts that can have a layer thickness of 1 mm and above, produce features on existing components or repair damaged or worn-out metal parts.
Comparing PBF with DED in terms of deposition rate and surface roughness (caused by layer thickness), it can be observed that PBF provides a superior surface finish since it uses smaller beam sizes and thinner layers than DED. The deposition rate for PBF, however, is also lower as a result. This makes PBF suitable for smaller parts with complex geometries and internal features which cannot be easily produced using other manufacturing processes. In contrast, DED is better suited for comparatively large components with relatively high buy-to-fly ratios. In this regard, it reduces the material required for producing a part compared to machining from a block and does not have the need for rigid moulds and dies as in forging processes. In essence, DED provides a flexible manufacturing solution to forging and casting whilst reducing material consumption compared to rough machining. DED can also be used for repairing surface damage on worn-out parts or to deposit additional features onto existing components [45]. Similar observations have been reported by Dutta and Froes [46]. DED is more suitable for larger components with coarser details and a high deposition rate, whereas PBF technologies are better for smaller parts with complicated or hollow features [46,47]. Figure 4 shows the comparison between PBF, powder-fed DED and wire-fed DED in terms of layer thickness and deposition rates based on the reported data in the literature [48,49,50,51,52,53,54,55,56,57,58,59].
DED techniques often have coarser surface quality than PBF and powder-fed DED techniques. The usual average surface roughness (Ra) values for PBF and powder-fed DED procedures fall between 20 and 50 µm. The surface finish for wire-fed DED operations, however, is noticeably coarser and may exceed 200 µm [60,61]. The surface roughness of the as-built parts may necessitate post-process finish machining to achieve the design objectives. This also dictates the amount of material that needs to be machined after AM processing, which can impact the overall manufacturing costs both in terms of additional material to be deposited and the increased machining requirements [56,62]. Table 1 shows a summary of process characteristics for PBF and DED.

4. Economics of AM

To determine the suitability of either PBF or DED for manufacturing a specific type of product with a certain production rate, the economies of the processes should be fully understood. Cost estimation is a crucial aspect in the assessment of AM and the commercial viability of producing parts using a specific AM method instead of other alternative processes. As such, cost estimation is directly related to the performance of a business by preventing over- and under-pricing [38]. In this section, various cost estimation techniques are analysed in detail.

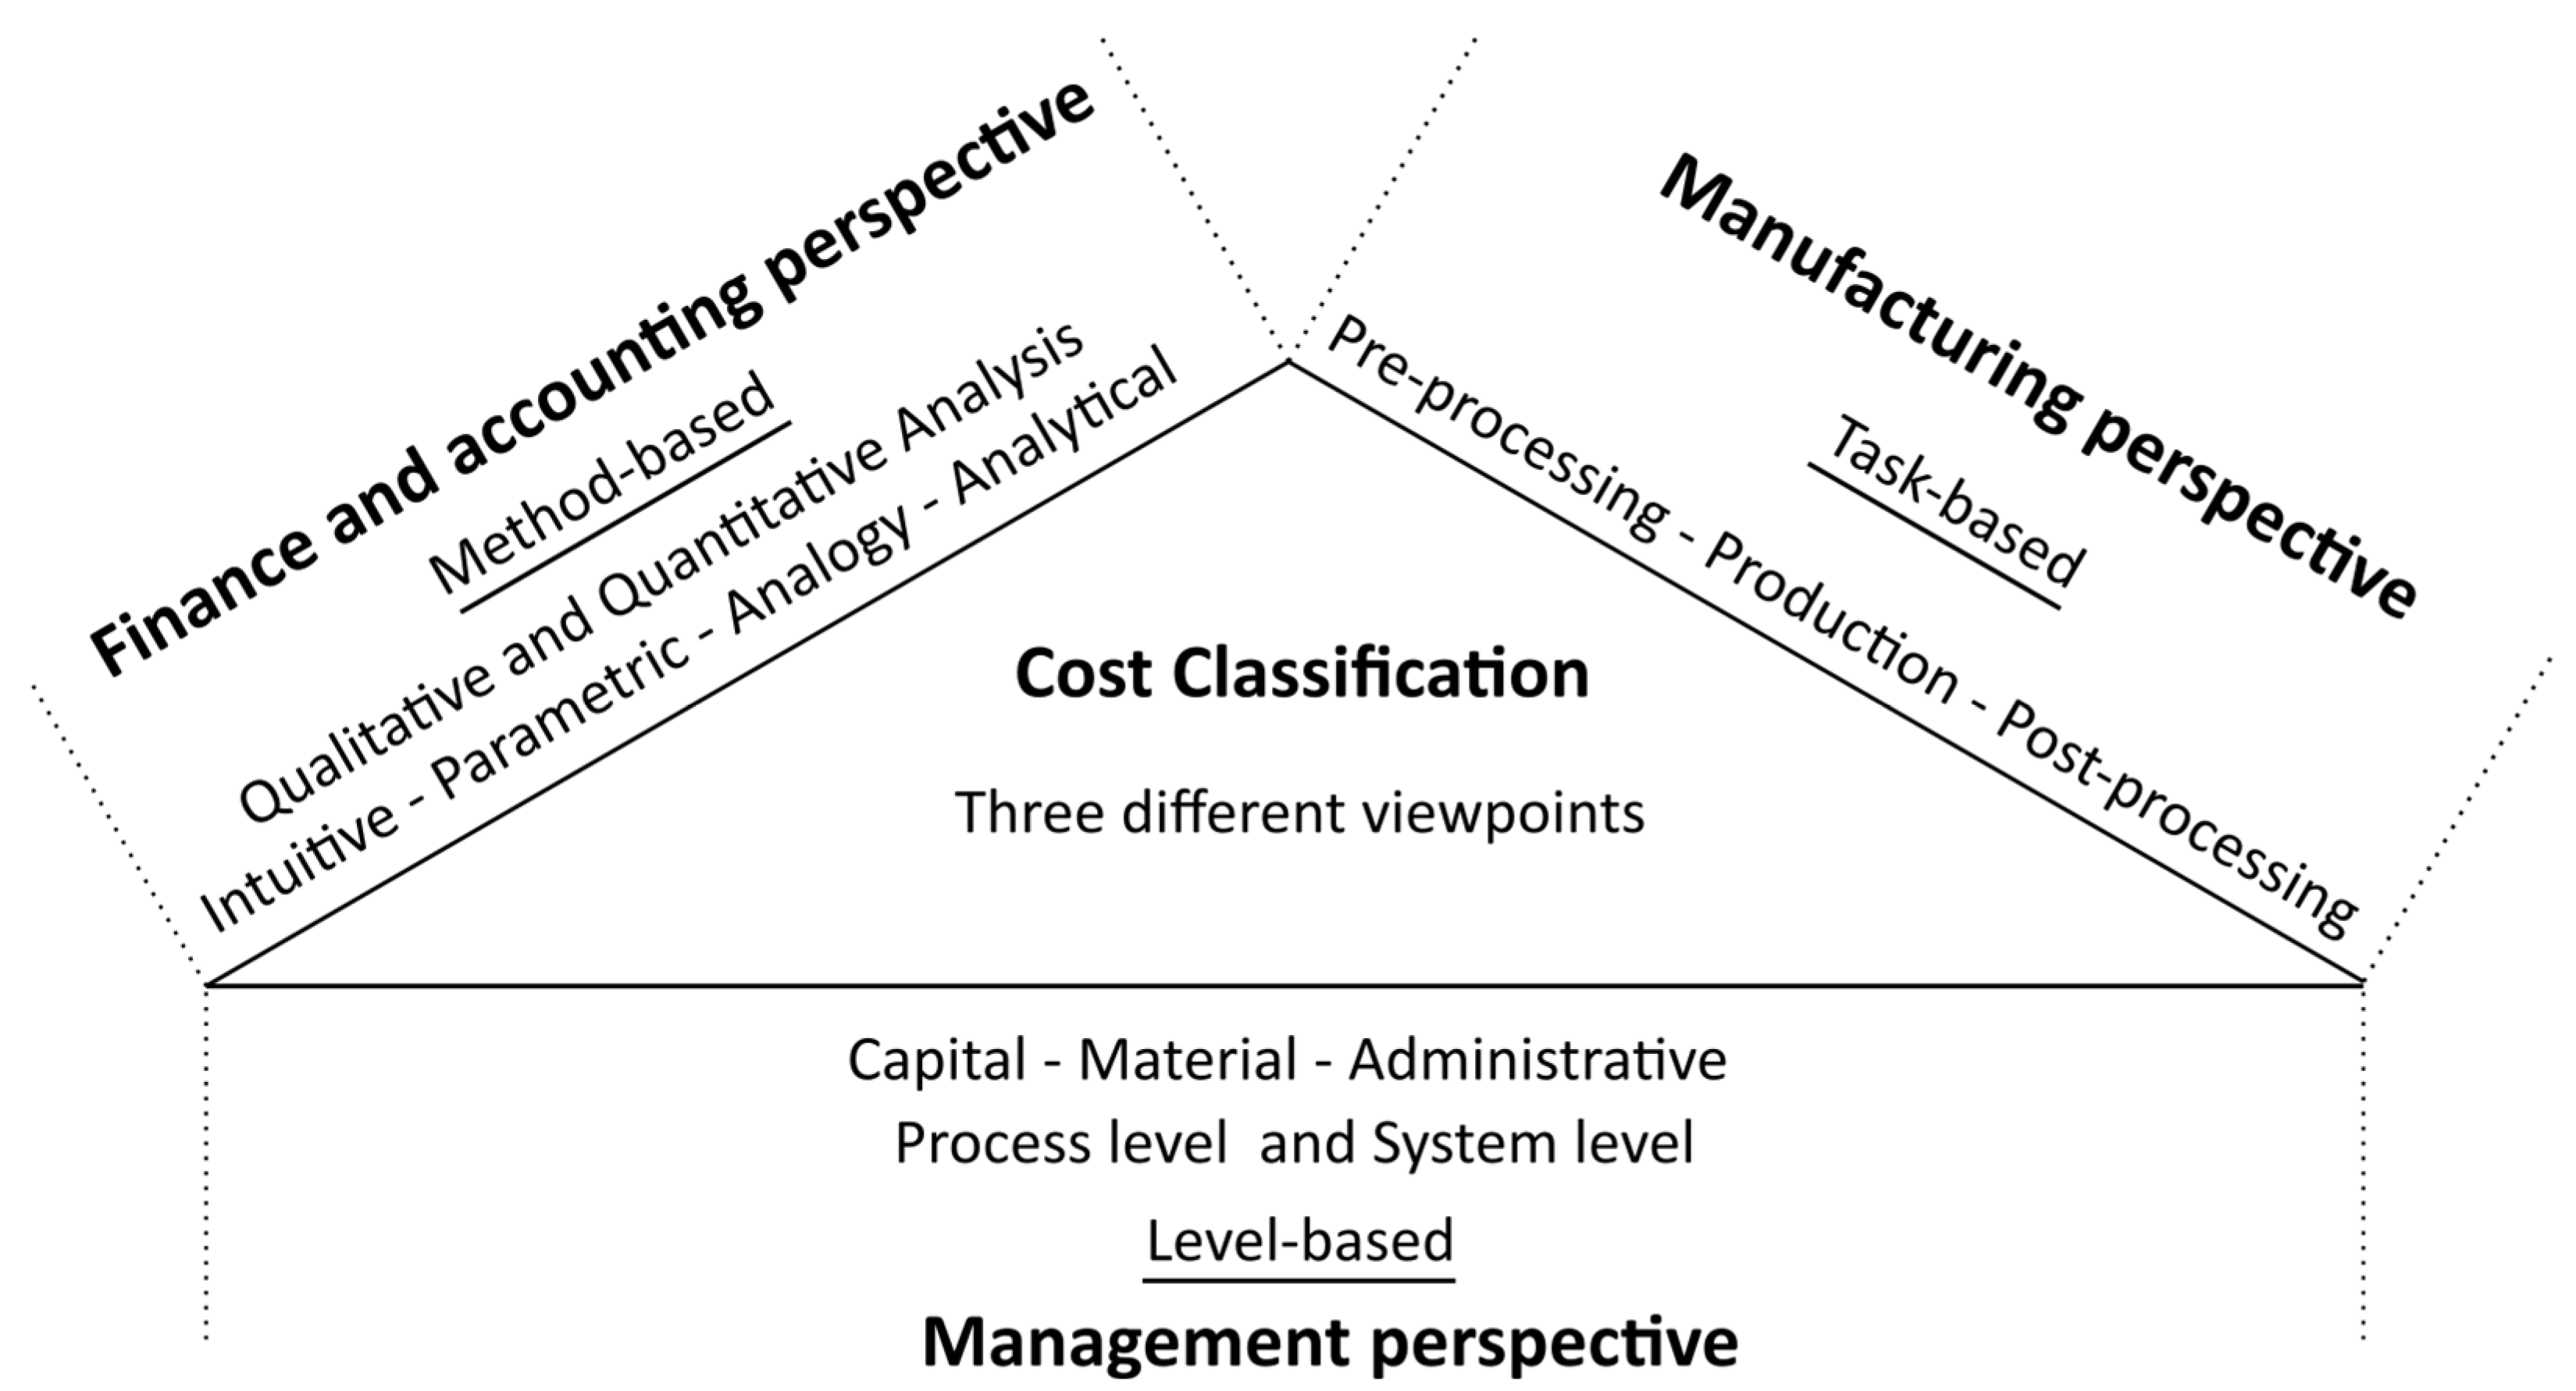
4.1. Cost Estimation Techniques

According to Niazi et al. [68], there are four main categories of cost-estimating methods:
  • Qualitative: Intuitive techniques—the expertise of a domain expert is utilised to estimate the cost based on experience.
  • Qualitative: Analogical techniques—this technique is based on previous data where cost estimation is performed by comparing how similar the old and new components are.
  • Quantitative: Parametric techniques—this technique calculates the costs based on the process cost drivers.
  • Quantitative: Analytical techniques—using this technique, a manufacturing process is divided into its basic components, operations and activities. The overall cost is then calculated by adding the costs for these.
Quantitative cost models typically contain analytical and parametric approaches, while qualitative cost models include intuitive and analogical methods. Niazi et al. [68] claimed that although they often lack accuracy, qualitative approaches are advantageous for estimating costs early in the product lifecycle since they require less information and are simple to use. Although quantitative procedures often demand more data, they typically result in more accurate results.
Intuitive cost estimation techniques can be used where there is a need for expert judgement at the early stages of innovative designs, which results in quick and flexible estimations. However, it might be inconsistent, unreliable and biassed due to the subjectivity of the estimator [38,69]. Analogical techniques take a portion of the judgement into account, but they also include characteristics for comparing data for a new product with actual data of an existing product. The level of similarity between these data affects the reliability of the estimation [70]. Parametric techniques aim to elaborate the relationships between the characteristics of a product and cost drivers. Cost drivers can be utilised effectively but the simplicity of the statistical links and lack of reflection of user experience might impact the accuracy [71]. Finally, the analytical approach is a set of mathematical procedures that breaks down the manufacturing of a component into its constituent units according to the actions or activities involved in its creation [72]. The advantages and disadvantages of these techniques are summarised in Table 2.
It was discovered that prior scholars have categorised costs within the AM context based on a number of factors depending on the cost utilisation goal and the project or research’s main emphasis. This observation holds as various viewpoints on the industry’s overall expenses may emerge depending on the specific roles and responsibilities assigned to the individuals. Kadir et al. [10] considered these various viewpoints in the AM industry and categorised the cost estimation techniques according to three different perspectives: manufacturing, management and finance, as shown in Figure 5.
Each of these viewpoints often used a distinct classification strategy, such as method-based, task-based, or level-based. From a financial and accounting standpoint, the cost models that were classified as either qualitative or quantitative were typically categorised using a traditional cost accounting approach, as Niazi et al. [68] established. This categorization is known as the “method-based methodology”, and its divisions are based on how the cost models were created [10]. When commissioning manufacturing tasks, task-based categorisation approaches are often employed. This method categorises the many stages of product development and manufacturing activities. In general, the stages may be divided into cost models that are process- or design-oriented [10]. Design-oriented cost models, such as simplified breakdown cost estimation, are often conducted during process planning for a newly designed manufacturing process and they typically cover design-related activities. If there are multiple manufacturing process options to customise for a specific product, it is possible to understand the change in production cost with design-oriented cost models [73]. Contrarily, process-oriented models include expenses associated with the manufacturing sector that are mostly connected to direct costs (such as materials, labour, equipment and energy) and indirect costs (e.g., administrative and secondary operations) [10]. Activity-based costing (ABC), which was introduced by Cooper and Kaplan [74], is one of the popular techniques that are process-oriented. Manufacturing costs can be calculated accurately since the relationship between the product and the resources assigned to the operations can be represented in a consistent way [75].
Finally, in the level-based classification, each cost model was typically classified as either a process-level or a system-level model, and often, economic and managerial viewpoints were employed. The expenses associated with manufacturing or total costs are covered at the process level, while costs associated with services, the supply chain, and the product life cycle are covered at the system level. For instance, Jarrar et al. [76] developed a process-level cost model using the ABC approach. This model was created to address the missing cost components in earlier cost models and to highlight the major drivers of AM costs, as well as how they relate to product requirements and customer needs.
The academic AM cost estimation field mainly employed analogical process-oriented techniques using the manufacturing viewpoint, whereas there have been limited studies using the management perspective. It may have been difficult to focus on the system-level approach due to the pace of development in the AM field and the unique cost drivers of each AM technology. Common cost drivers and their categorization for AM processes using a manufacturing perspective are elaborated on in the following section.

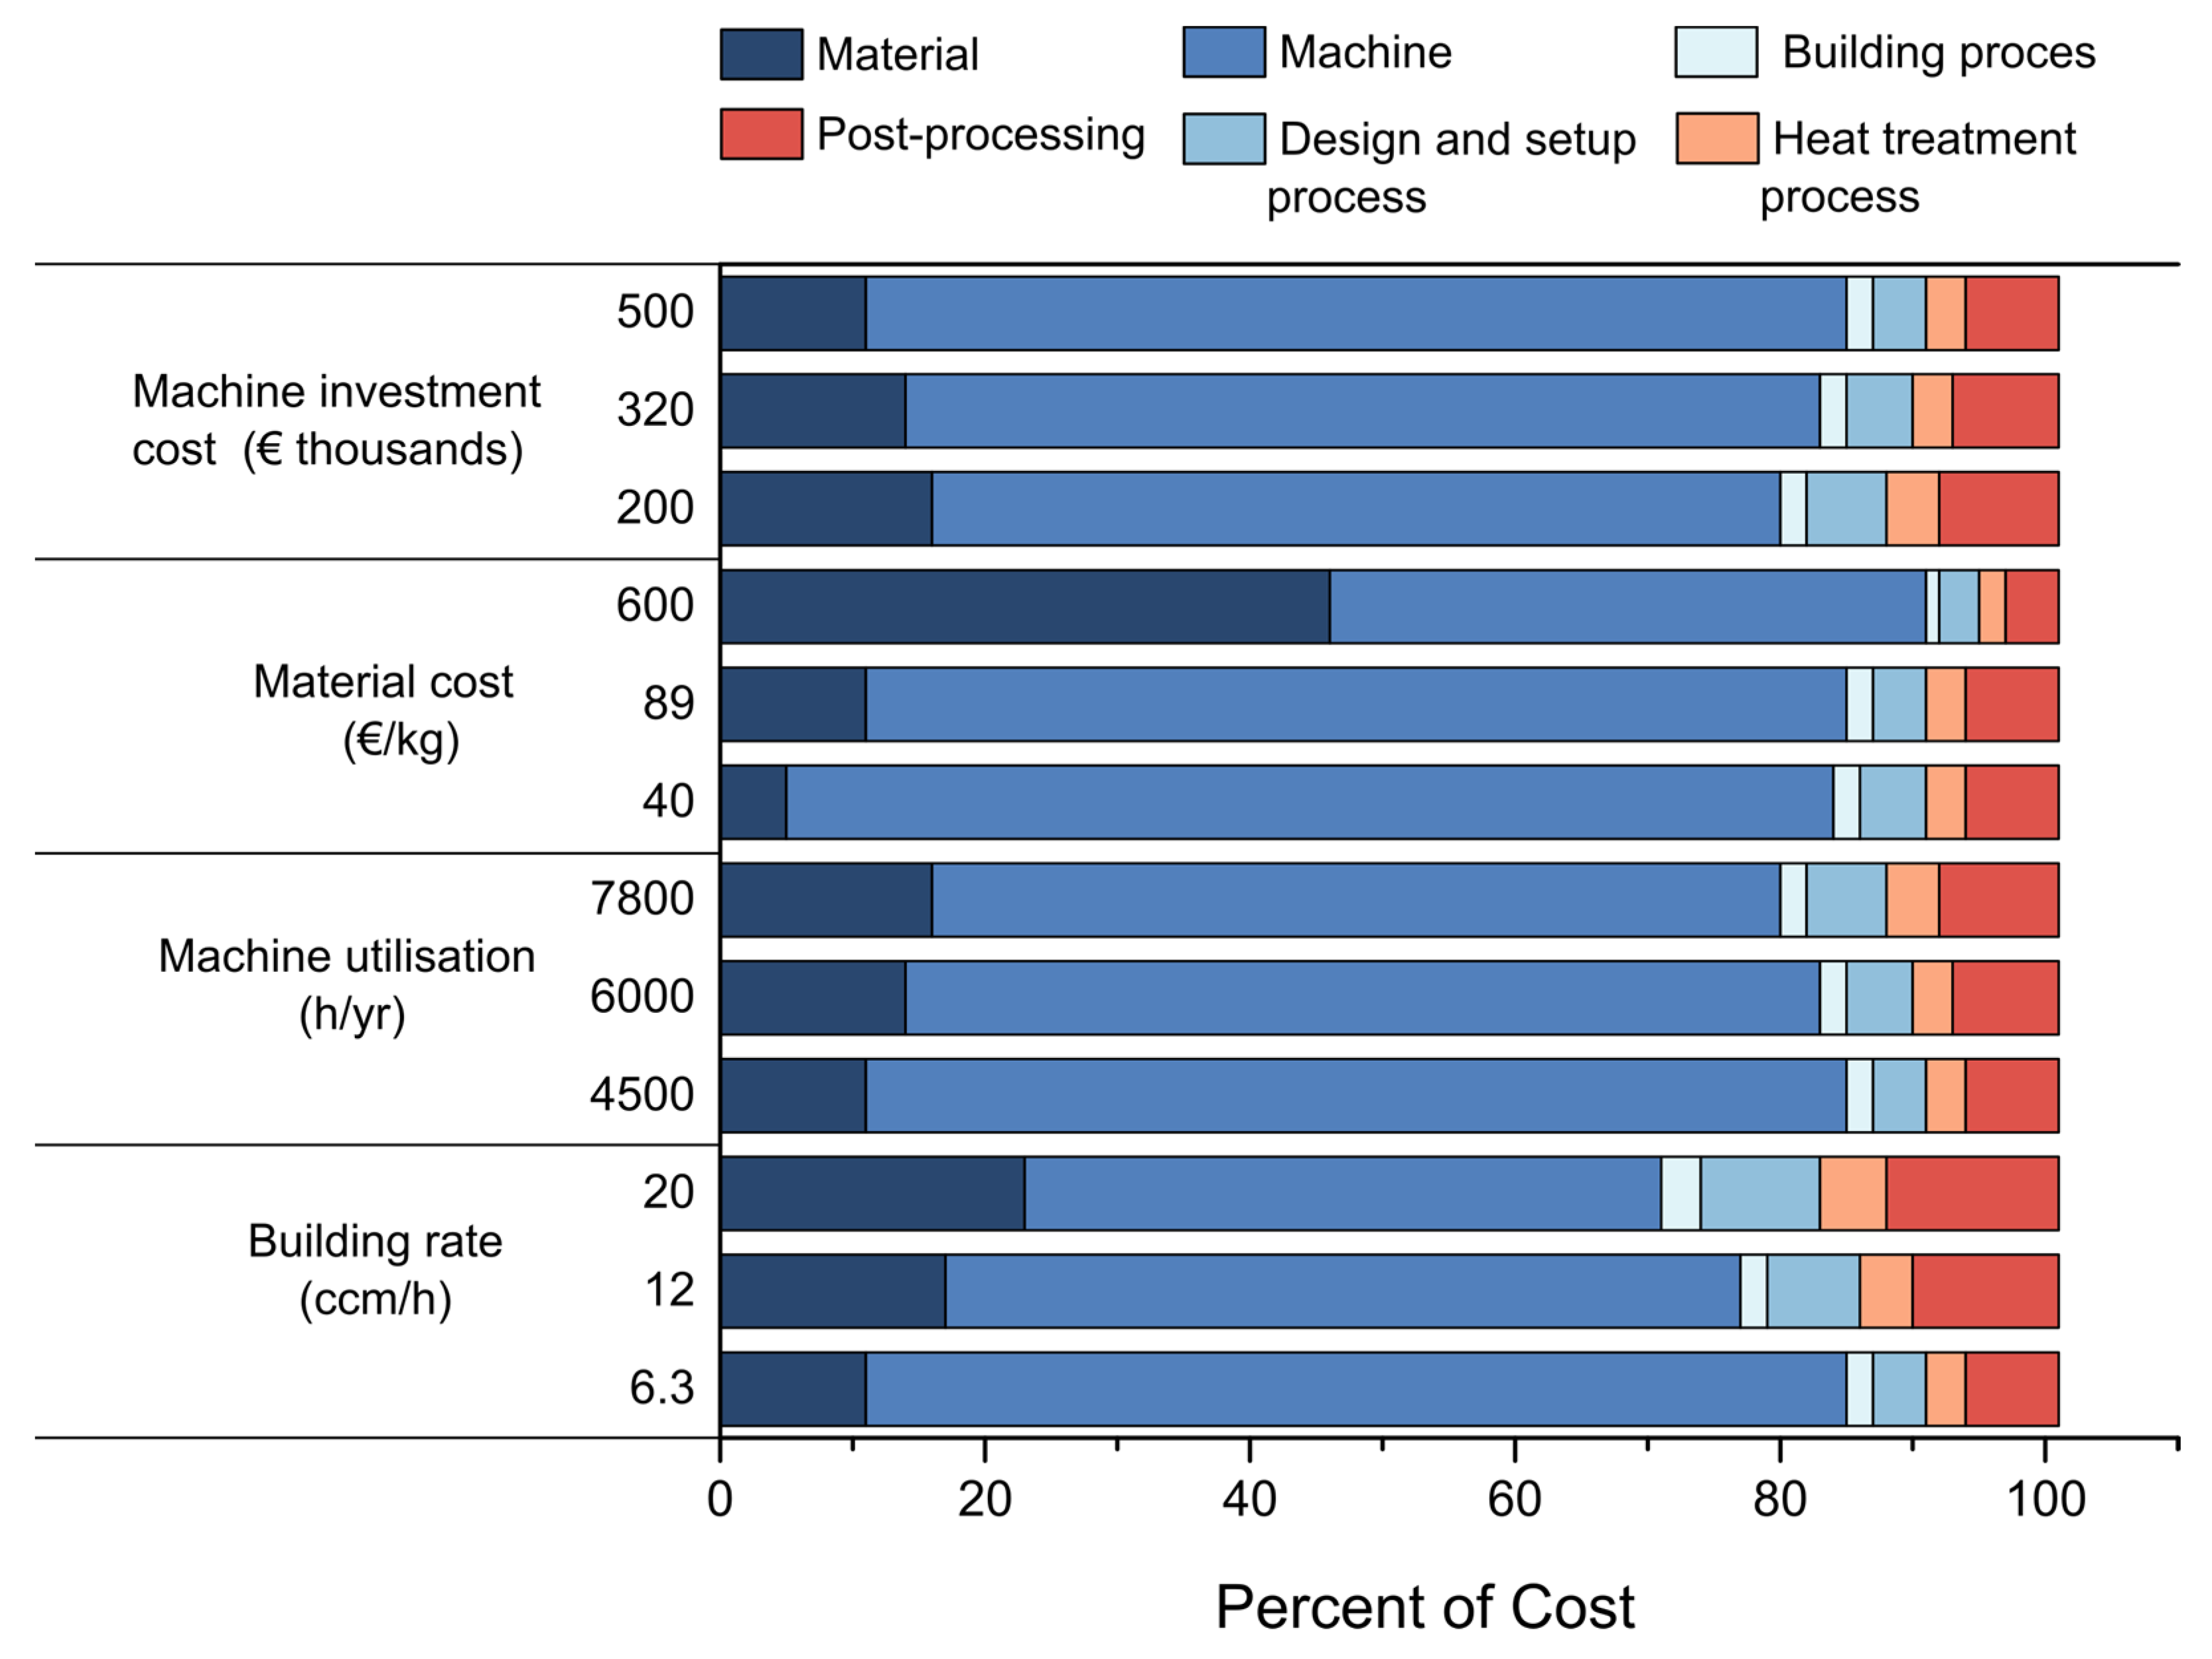
4.2. Cost Contributors in AM

In the cost analysis for AM, two main groups can be identified. The first group is focused on comparing AM with conventional manufacturing methods such as machining and injection moulding with the aim of identifying situations where AM offers an economic advantage. The second group is focused on cost estimation for AM by determining the resources used at different stages of AM, including information on the utilised resources and their general use [77].
The majority of applications for AM mentioned in the literature are based on the technology’s unique benefits, such as its ability to produce complex geometries, flexibility and that it does not require specific tooling. Whilst there are mature cost models for other manufacturing processes which allow practitioners to make informed decisions at various levels, there are still gaps in the knowledge when it comes to costing of AM technology. A comprehensive and generalised cost model for AM can enable decision making for selecting appropriate manufacturing process routes, investing in new machinery, forecasting returns on investment and bidding for contracts. This is particularly vital for the uptake of AM in industry and especially for small- and medium-sized businesses [46]. Cost is often the deciding factor, with break-even thresholds for various production methods serving as the main source of information.
The cost contributors in AM can be divided into pre-processing, processing and post-processing [78]. In order to achieve a comprehensive cost model, life cycle costing should be considered, which includes the operational costs, recycling and end of life costs of a product, as shown in Figure 6. The majority of research has focused on processing costs, whilst some researchers have taken pre-processing and post-processing into account. Each stage of AM includes direct and indirect costs. Direct costs can be linked to a particular cost object, such as a service, activity or product. Indirect costs are expenses that cannot be traced to a specific cost object and may be shared between many activities, products and services. Whilst direct costs are usually utilised for cost estimation, indirect costs may not be included in such an analysis [79]. Determining an effective and transparent method for assigning indirect costs can be challenging. As a result, many of these expenses are considered as production overheads or corporate overheads, which persist even if a specific product is not manufactured or an activity is not undertaken.
In AM, the direct costs generally include production, tooling, testing, raw materials and consumables, and energy, whereas the indirect costs consist of production overheads, inventory control, overhead expenses and handling. The term “overhead expenses” refers to the full category of indirect expenditures, which can include labour, energy and material costs [72].
i- Pre-processing costs typically account for the expense of labour, machine setup, and overheads. Labour cost includes the process of converting CAD files, selecting the appropriate part orientation, creating support structures and transmitting the CAD file into the AM system. Machine setup costs include not just the cost of the machine itself but also the time it takes to add materials and warm up the machine. Overhead costs encompass production and administrative expenditures. Pre-processing expenses may also include indirect costs such as depreciastion of assets and equipment, rent for industrial space, utilities, external legal costs, audit costs and licencing fees [80,81].
ii- Processing costs, which comprise material, machine, labour, energy, process control and administrative costs, constitute a significant portion of costs in additive manufacturing systems. Direct material, support structures and material depreciation expenses are all included in the cost of materials. Processing, depreciation of the machine and maintenance expenses are all included in the machine cost. Also included in the cost is the expense of maintaining the machine’s performance while the product is being built [81,82,83].
iii- Post-processing costs are the expenses that are often required to transform the component into its finished state. Operations such as cleaning, curing, heat treatment, reassembling and finishing are all examples of post-processing depending on the needs of the consumer. While some of these jobs may be completed with ordinary manual labour, others can need specialised equipment and operators with specialised skill sets. Post-processing expenses will thus comprise those for materials, labour, equipment, energy, overheads and testing. Machine costs include the cost of the tools and machinery used, including wire electrical discharge machines, CNC machine tools and equipment for infiltration and heat treatment. All post-processing tasks that need an operator to be present are included in labour costs. The cost of testing includes all inspection costs for determining the final product’s quality. Among them, but not exclusively, are inspections for surface integrity, mechanical properties, and dimensional accuracy. The energy used for cleaning, heat treatment, hot isostatic pressing or machining is accounted for by energy expenses [83,84].
The primary cost contributors during pre-processing, processing and post-processing operations can be listed as machine costs, material costs, energy costs, facility or infrastructure costs and labour costs. The impact of varying machine capital costs, material costs, machine utilisation and build rate, in terms of a percentage contribution, on the cost of a stainless-steel part fabricated using PBF-LB is demonstrated in Figure 7 [9,85]. For each column, a single cost driver was varied while the other parameters were kept constant to observe its impact on the overall cost composition. The variation in influencing factors has demonstrated that although a reduced machine rate cost can be achieved, it will remain one of the dominant factors in the production process.
  • Machine Costs
Schröder et al [86] discovered that machine investment costs were the main drivers of the production costs. As a result, the initial investment cost, together with operational and recurrent feedstock costs, is a crucial factor in choosing an AM process since the prices of AM technology continue to be relatively high [85]. The machines may cost anything from USD 115,000 to USD 1.9 million for a PBF machine that can make components as big as a full-scale V6 engine block. Since so many businesses are now providing their systems, there are various pricing and choice alternatives available, and rising competition is beginning to drive prices down [87].
A case study on production-focused cost modelling of a UV light-based AM technique, carried out by Wiese et al. [88], demonstrated how an increase in printer size might have a beneficial effect on the prime cost per component. This correlation, however, is not linear because different machines have varied relative shares of the total cost. According to the results of the sensitivity analysis, the best possibility for additional reductions in production costs may be found in the cost drivers linked with machine costs, such as machine leasing/ownership price or print speed. Lindemann et al. [85] examined the cost of AM production using sample Augsburg parts [84]. A breakdown of the costs for producing a stainless-steel part using PBF-LB showed that machine costs are the primary driver, accounting for 73% of the manufacturing cost, followed by material costs (12%).
The impact of depreciation is very significant on the overall cost of utilising a machine over its lifespan. Typically, machine depreciation is calculated based on 10%-15% of the initial purchase price and full write off after 8–10 years. Hopkinson and Dickens [89] calculated the annual machine cost per part assuming that the depreciation is 8 years, whereas Cerdeal et al. [90] used 10 years for the machine depreciation time. However, there can be different applications. For instance, Atzeni et al. [80] conducted a case study where they fabricated an assembly of an aluminium landing gear structure through High-Pressure Die Casting and PBF-LB. They used a straight-line depreciation technique and assumed 5 years of useful lifetime for the PBF-LB equipment. It was concluded that the allocation of the die cost on a particular component determines the cost of the part manufactured by casting. The mould cost contribution on the component decreases as the manufacturing volume increases. However, since the capital cost of the PBF-LB equipment was significant, the depreciation of the machine accounted for around 90% of the component cost in the case of AM, with material costs accounting for the majority of the remaining costs.
  • Material Costs
The cost of materials utilised in AM, in the form of powder or wire, tends to be higher compared to the wrought materials commonly employed in conventional manufacturing processes [9]. This is partly due to the additional manufacturing steps that are required in producing powder or wire. Additionally, lower volumes of materials are produced specifically for AM, contributing to the higher price. The price of AM feedstock materials such as steel, nickel and titanium alloys are sometimes up to 10 times higher than that of wrought material, leading the material cost to become a major cost driver in AM. For niche and expensive materials, the feedstock cost can be even more significant. The price of metal powder such as spheroidised titanium, which is typically used in PBF, may vary from “USD 260 to USD 450 per kg” and other spheroidised alloys such as Niobium can cost as high as USD 1200/kg [91]. However, these prices are expected to reduce in the future as more suppliers enter the market and supply chains are established. As a result, particularly for low-volume components, the impact of the selected material on overall costs will diminish even further in the future [92,93]. Table 3 shows the prices of wire and powder feedstock based on the current market research (2024). It can be seen that generally, the price of powder feedstock is higher than wire feedstock.
Dias et al. [94] noted the high material usage and deposition rates in WAAM of Ti-6Al-4V alloy and found that 55% of the overall manufacturing costs are associated with feedstock wire. This is significantly higher than the costs associated with equipment utilisation. For WAAM to be more economical, material waste should be reduced as much as possible. While the WAAM process boasts a substantially lower buy-to-fly ratio compared to traditional machining processes, the cost savings derived from the material volume are offset by the material price differences associated with the feedstock material format [94]. Kokare et al. [95] observed that when the post-processing material allowance is kept below 4 mm, WAAM is a more cost-effective process compared to traditional processes. Therefore, it is important to include post-processing material allowance in the cost sensitivity analysis.
  • Energy Costs
Energy consumption was examined in certain cost studies for AM, such as those by Hopkinson and Dickens [89], but was not reported since it made up less than 1% of the total cost. In most cases, it is considered as an overhead cost. However, when comparing the cost of AM to other production processes, energy consumption is a crucial element, particularly when assessing the expenditures from cradle to grave. It can be observed that research on energy usage in AM often only looks at the energy used by the system itself and in the refining of the materials [9]. For instance, Baumers et al. [96] investigated the energy consumption of several AM technologies, including commercial Laser Sintering and different PBF-LB and Fused Deposition Modelling systems. The results showed that the energy consumption for a single part was higher than when the machine volume was fully utilised. Morrow et al. [97] compared traditional tool and die manufacturing with DMD. They established that the solid-to-cavity volume ratio has a direct impact on energy usage. Solid-to-cavity volume ratio is defined as the ratio of the mass of a part to the equivalent mass of the volume of the envelope of the part [97]. DMD, an AM technique, uses the least amount of energy at low ratios, whereas computer numeric controlled milling uses the least amount of energy at high ratios.
Landi et al. [98] compared CNC machining and LENS to manufacture an AISI 4140 spur gear. LENS displayed a relatively superior material efficiency of 31% compared to CNC milling’s 10%. However, LENS consumed about seven times more energy than CNC milling. Consequently, both approaches demonstrated strengths and weaknesses in various impact categories, with no approach definitively outperforming the other. Thus, the WAAM process is considered the most balanced option in terms of energy consumption when compared to traditional and laser-based AM approaches [84].
Piili et al. [99] investigated the economics of the laser beam PBF process using two extreme build scenarios. It was seen that, when 40 items are being produced concurrently, the share of machine cost decreases by 6%. The time savings reduce energy consumption per item by 81%, but because of its small proportion, it is less obvious than the decrease in machine time and cost. When compared to producing parts individually, the expenses were lowered by 81–92% by manufacturing as many components as possible in one build.
In order to evaluate the overall effects of WAAM-based products with those made using traditional manufacturing processes, Priarone et al. [100] measured the performance parameters of both methods and proposed a multi-criteria decision-analysis mapping. The findings show that the WAAM-based strategy significantly cuts down on resource/energy needs and CO2 emissions. On the other hand, the costs and time required are always specific to the product and the material.
Another study on energy consumption between WAAM integrated with machining and pure machining, performed by Campatelli et al. [101], showed that the combination of WAAM + machining has higher direct energy consumption compared to machining from a solid block for manufacturing an EN S235JR steel turbine blade. However, from a sustainability point of view, the overall energy demand was lower for WAAM + machining due to lower material consumption.
From energy-intensive techniques like Laser Sintering to the more balanced approach of Wire-Arc Additive Manufacturing (WAAM), the intricate relationship between energy consumption, material efficiency, and production volume comes to the fore. These insights emphasise the need for comprehensive evaluations, not only considering costs but also energy demands and environmental consequences.
  • Facility or Infrastructure Costs
The design and layout of the manufacturing facility can have a significant impact on the efficiency and effectiveness of the manufacturing process. AM machine manufacturers may require specific ambient temperature and humidity conditions. Additionally, specific health and safety requirements in terms of fire safety, laser, plasma arc and x-ray safety, air filtration and ventilation may add to the initial and operating costs of AM [102,103].
  • Labour costs
Labour cost can change significantly depending on the operations of manufacturing processes. The majority of DED AM machines are highly automated and require minimal intervention during the build process. A large portion of the labour time is instead spent on the setup and part removal [104]. For proven builds, the in-process intervention is typically limited to restocking the feed material where possible. In an optimised WAAM process where two parts in parallel are deposited, the processing time, and therefore the working hours, would be reduced due to lower waiting times for cooling and travelling times [105]. On the other hand, the post-processing and finishing operations of AM parts can be the most labour-intensive aspect of part manufacture. Depending on the design and the AM process used, there might be a need for powder and support structure removal.

5. Cost Modelling Techniques

Deterministic modelling, stochastic modelling and software/computer-based modelling all belong to the domain of cost modelling techniques.
  • Deterministic Modelling
One of the most simplified methods for modelling is using deterministic parameters and values. When making financial planning choices, cash flow modelling techniques that employ deterministic or overly simplified stochastic predictions are essentially faulty since they cannot take ongoing factors that will alter the plan over time into account [106].
Several stages are taken in a methodical sequence to construct a complete deterministic cost model. Firstly, activities in the manufacturing process such as preparation (creating the CAD model, process planning and configuring the machine), processing and post-processing should be listed. Secondly, the time required to accomplish each task is estimated. The accuracy of the build time estimate is of utmost importance at this stage. In additive manufacturing, the time it takes to produce a product layer by layer usually makes up the majority of the build time. As part of the processing time, the warmup and cooling times are also taken into account. Time estimation is crucial since it determines the accuracy of the build time, which in turn influences the cost factors. The final stage of deterministic cost modelling is to perform cost computations using the necessary algebraic equations [107].
  • Stochastic Modelling
Stochastic models have the ability to capture the variabilities and uncertainties in costs associated with different aspects of AM. Stochastic models include some intrinsic unpredictability, resulting in a range of outcomes for identical circumstances and parameter values. By leveraging prior data, stochastic models can estimate the likelihood of future events, making them more advanced than deterministic models. In predicting future costs, a stochastic model’s ability to provide a variety of potential outcomes can be extremely helpful compared to a single value using deterministic models with limited knowledge of error margins [106].
To understand the independent operational elements influencing the implementation costs of the supply chain for AM, prior research on supply chain cost analysis was carried out. Thomas [108] suggested a method for analysing the societal costs and benefits of a sample mechanical product by using operational cost data to pinpoint the areas where AM would be able to increase overall efficiency and lower total costs. A stochastic optimisation cost model was subsequently presented by Scott and Harrison [109] to assist companies in determining when AM will have a supply chain superior to conventional manufacturing. It was claimed that lowering material costs might lead to a rise in the use of AM. Similar to this, Emelogu et al. [110] established a stochastic programming model to describe supply chain costs, with an emphasis on biomedical implants produced by AM and conventional manufacturing. Inventory, transportation, and product lead time expenses associated with AM biomedical implants were included in the quantitative study of AM supply chain costs. To identify the cost factors that may have a substantial influence on the economic viability of AM components for biomedical applications, a ratio between the unit production costs of AM and conventional manufacturing, as well as product lead time and demands, was created.
  • Software-based Computational Modelling
Software productivity, simplicity, and the speed of developing software models have significantly increased thanks to computer-aided software engineering [72]. Software-based computational models can process the part design and use a combination of deterministic and stochastic modelling to estimate the cost of producing a part. They can automatically assess the part CAD model and calculate the potential material and support requirements. Web-based programmes have been widely used for pricing AM of part designs in a range of materials.
Luo et al. [111] studied web-based price quotation models and provided a fundamental cost model for use in their AM product quoting system. A 3D CAD model file may be opened in the client-side homepage software, allowing customers to receive a product quote directly from the file. Angelo and Stefano [112] provided a parametric way to create a cost estimate that is suitable for web-based e-commerce. The suggested study examines the geometric aspects in relation to the build time of the primary layer. However, the model makes several assumptions due to a lack of in-depth research on activities. Estimation using the suggested approach also calls for the remote transmission of a few process parameters. A web-based automatic quote system was created by Lan et al. [113], which can deliver fast price quotations for Stereolithography components throughout the early stages of product development. The algorithm takes into account the 3D model’s geometrical details and the support structures’ value, which is calculated using a statistical technique.
One of the most intriguing characteristics of costing software that uses CAD is the ability to incorporate cost estimation as a module. A technique for calculating AM build costs using a commercial 3D solid modelling application was put out by Barclift et al. [114]. A case study was used to illustrate a pricing model for a metal automotive part manufactured using AM. It showed that poor build volume packing and orientation may cause powder depreciation costs to more than double compared to the material costs. In addition to the software, Dinda et al. [115] presented a mobile application that makes use of machine parameters and voxel-based manufacturability analysis. Inputting a 3D model of the part, the application calculated an estimated build time, the quantity of material required for the component and supports, and the 3D printing cost, empowering users to choose an optimal method and building orientation.

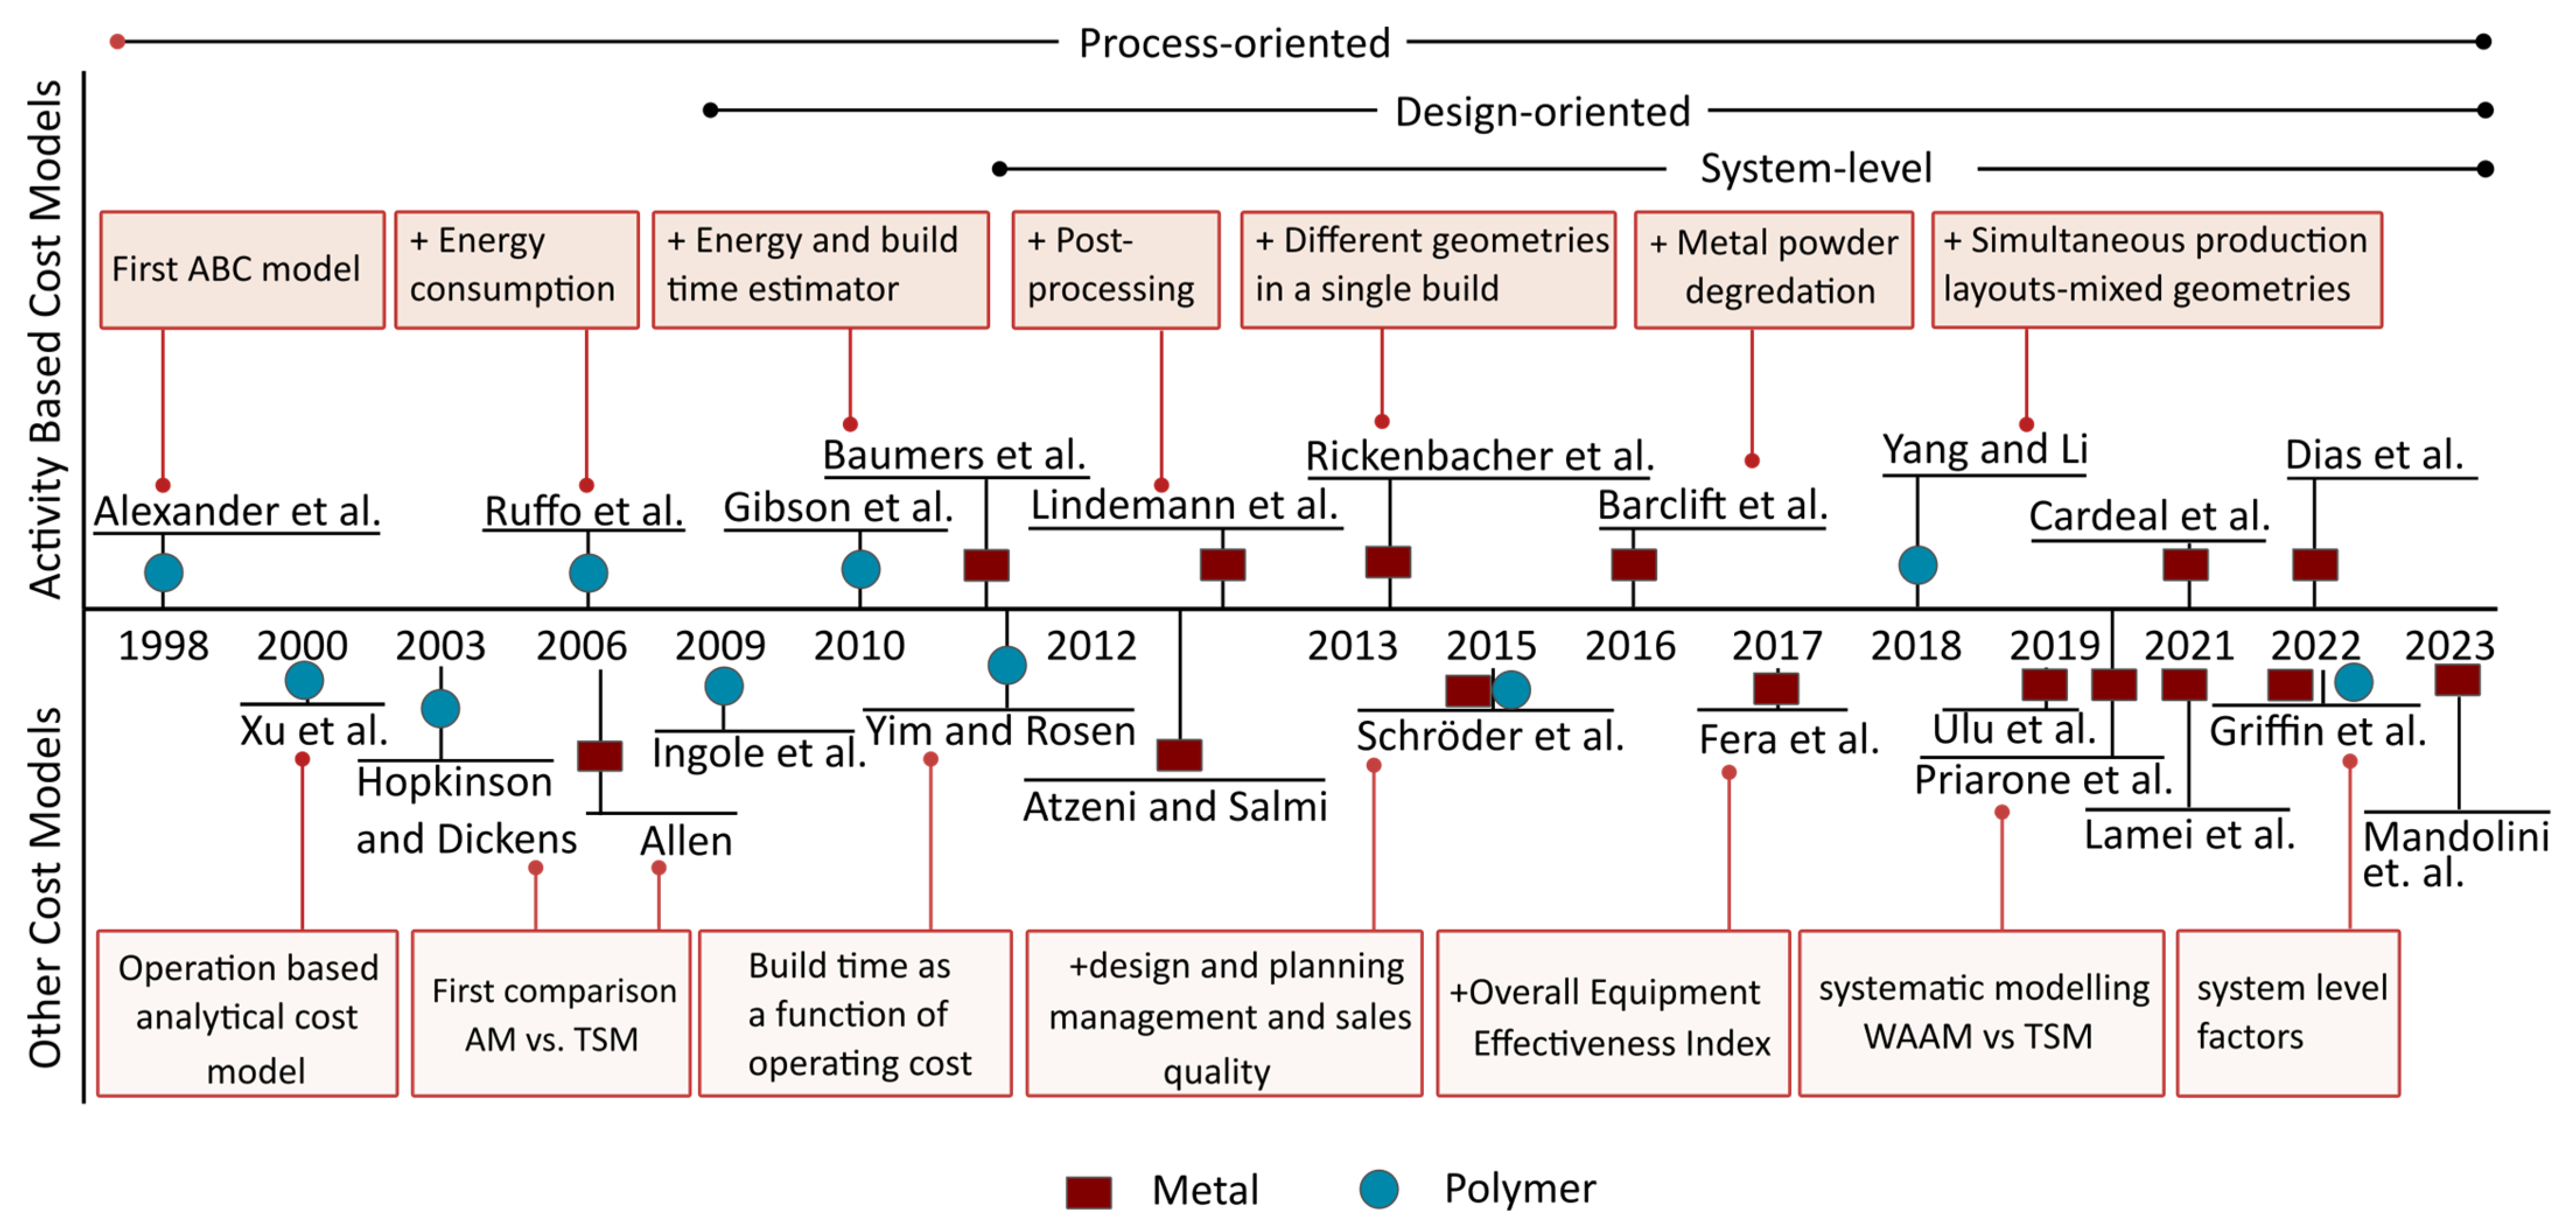
6. Development of Costing and Evaluation of AM Cost Models

The earliest attempts at costing for AM dates to the late 1990s. The models mostly focused on polymer-based AM technologies, such as Fused Deposition Modelling and Stereolithography and only partially included production costs [10]. Simple cost models were created based on direct expenses [89], a computation of the build time [116], and to account for specific cost aspects in the production domain. These conventional cost models were created using the presumption that the target component will be manufactured using a certain AM method, estimated as a single unit part and verified using case studies. They often employed intuitive or analogical methodologies and concentrated on process-oriented cost factors. During this time, the first Activity- Based Costing (ABC) framework was proposed for AM. ABC blends quantitative parametric and analytical techniques. Rather than using a generic factory-wide overhead rate assigned to each production department based on a base characteristic like labour content, machine hours or units of output, ABC is a more practical approach to modelling manufacturing processes using actual physical activities and their main cost drivers to model process costs [117].
Figure 8 shows the timeline of the progress in cost estimation models for AM. The analysis of the literature on cost modelling for AM from 1998 to 2024 indicates two distinct periods: (i) the initial period led by the work of Alexander et al. [78], focused on rapid prototyping and rapid manufacturing mainly for polymer materials and (ii) the second period, with the majority of the research focused on various metal AM processes. The earlier models on polymer materials were later evolved into cost models for metal AM.
Whilst the focus of this paper is on costing for metal AM, the cost models of polymer AM are briefly discussed in the following section since they provide the foundation of costing for metal AM by comparing the cost drivers between AM and traditional subtractive manufacturing.

6.1. Cost Models for Polymer AM

Alexander et al. [78] created an ABC model for AM to investigate the impact of part build orientation on part manufacturing costs. The overall cost ( C t o t a l ) is broken down into three categories (i) pre-processing ( C p r e ), (ii) build ( C b u i l d ), and (iii) post-processing ( C p o s t ), as shown in Equation (1) for AM of polymer materials.
C t o t a l = C p r e + C b u i l d + C p o s t
This model formed the foundation of generalised ABC models for costing AM. Each stage was segmented into activities with associated cost and time drivers. Although the overall model is still relevant and Alexander et al. [78] provided a detailed overview of the activities involved in AM, this model was based on the AM landscape in 1998. The model used deterministic average values from experiments instead of detailed parameter breakdowns.
Later, Xu et al. [118] developed an operation-based analytical cost estimate approach for their cost model for polymer AM processes. They broke down the overall cost into the costs associated with pre-processing, processing and post-processing similar to that proposed by Alexander et al. [78]. They performed a detailed time study which revealed the associated cost drivers such as design tools, labour, energy and overhead expenses. They adopted a model (Equation (2)) for machining to derive an hourly rate for various RP machines which can be used for estimating the processing costs of a machine if the processing time is known.
r f = 1 + O o p · W O + 1 + O m c h · P m c h 8760 T m c h
where r f is the hourly rate, O O p is the operator’s overhead, W O is the operator’s hourly salary, O m c h is machine’s overhead, P m c h is the machine’s purchase cost and T m c h is the machine’s amortisation period. Xu et al. [118] mentioned that the machine’s power consumption was considered. However, it was not reflected in the model presented in Equation (2).
Ruffo et al. [119] examined the effect of overhead costs for Laser Sintering using an ABC approach [89]. They assumed that in AM, the overheads can be distributed across the volume of parts rather than being constant for all quantities of manufacturing. According to Ruffo, assuming a constant cost is only reasonable when manufacturing a significant volume of the same component. The cost estimation relationship given by Ruffo et al. [119] is that the cost of a build ( C o s t B ) is calculated by adding the indirect cost associated with the building time ( t B ) and the direct cost associated with the mass of the material utilised during manufacture ( m B ):
C o s t B = C o s t t B + C o s t m B
where
C o s t m B = d i r e c t   C o s t m a s s   u n i t m B
C o s t t B = i n d i r e c t   C o s t s w o r k i n g   t i m e t B
m B = ρ × V B
t B = t x y + t z + t H C
where ρ is the material’s density, V B is the part volume, t x y is the time to laser scan the area and its boundaries so that the powder may be sintered, t z is the time to add powder layers (recoating time) and t H C is the time it takes to heat or cool the bed before and after scanning, respectively, adding layers of powder or just the waiting time to reach the required temperature.
In Ruffo et al. [119], a build chamber is represented as a 3D matrix with various components, each corresponding to a construction section. The increase in component cost within this matrix is due to three factors: (i) the addition of a new row when introducing a part as the prior row is filled, (ii) placing a new layer on top as the previous one reaches capacity and (iii) needing a completely new build for new components when the chamber is full. Each of these events results in the inclusion of new components, necessitating greater utilisation of resources in terms of both time and materials.
With the addition of powder recycling and more precise overhead expenses, such as labour as an indirect cost that is proportionate to machine operating time, Ruffo et al. [119] created a model that was more accurate than previous models. Energy consumption is applied as an overhead expense rather than a direct cost. The machine uptime is set at a more realistic 57%; however, failure and maintenance are not considered. The model’s activities break down the build process but do not consider energy consumption as a direct cost and do not account for equipment setup or post-processing time.

6.2. Cost Models for Metal AM

As shown in Figure 8, the first effort on cost modelling for metal AM was reported by Allen [120] with a focus on titanium alloy aero-engine components. The model made a comparison of the cost of obtaining a near net shape by considering simply the material cost and cost of machining. Critical parameters were addressed such as powder usage efficiency, energy, labour and depreciation to be used in the costing of future deposition systems. This study provided an initial foundation for understanding the costs involved, the difference between the buy-to-fly ratios of AM and traditional machining and its implications on the overall cost.
Through PBF-LB, Baumers et al. [120] analysed metal AM techniques. Using an ABC model akin to Ruffo et al. [119], they applied direct (material, energy) and indirect (administrative, production, labour, and machine) expenses, grouping energy as a direct cost during the build. The total cost for each build is as follows:
C b u i l d = C I n d i r e c t × T b u i l d + w × P r a w   m a t e r i a l + E b u i l d × P e n e r g y
where C I n d i r e c t   is the indirect cost per unit of time spent using machinery, T b u i l d is the total build time, w is the component’s net weight in the build (including the support structure), P r a w   m a t e r i a l is the price per kg of raw material, E b u i l d is the total energy consumption per build and P e n e r g y is the mean price of electricity.
The part orientation during the build can affect the support structure needed for producing a part, which will impact the overall material and time required. This in turn can impact the overall manufacturing cost. Therefore, optimising the position of the part without sacrificing the nesting potential is essential to efficiently utilise space, build time and material.
Previous models anticipated the manufacture of many identical parts, with any unused space in the build chamber being empty. Baumers et al. [121] noted that it was typical for AM users to pack the build area with as many pieces as they could to boost productivity and increase efficiency. To assign space for individual components in the build chamber, they used a workspace packing technique devised by Hur et al. [122] that makes use of voxel approximations of part geometry; in this case, each part is supposed to be composed of tiny voxel cubes. A higher voxel resolution can potentially lead to more efficient packing. Equation (9) may be used to determine the build time:
T b u i l d = T s e t u p + T l a y e r × l   + z = 1 z y = 1 y x = 1 x T v o x e l   x y z
where T s e t u p is the setup time for each build, l is the number of layers, T l a y e r is the time per layer and T v o x e l   x y z   is the time needed to process each voxel.
Non-variable operations in each job (warm-up/cool-down), constant baseline energy consumption throughout the development, energy necessary for layer recoating, and energy consumption based on geometry were all included in the final energy consumption calculation demonstrated in Equation (10).
E b u i l d = E j o b + P m a c h i n e × T B u i l d   + E l a y e r × l   + z = 1 z y = 1 u y x = 1 x E v o x e l   x y z
where E j o b is the energy consumption associated with a build including pre- and post-build operations, P m a c h i n e   is the base power consumption of the machine, T B u i l d is the overall build time, E layer is the energy consumption per layer, l is the number of layers and E v o x e l   x y z   is the energy needed for processing each voxel.
A collection of components typically produced by PBF-LB was chosen to cover a wide range of sizes, shapes and functionalities. The study found that as the size and geometrical intricacy of the component decreased, there was a notable reduction in the cost and energy consumption per part. The capability to compactly arrange the manufacturing process for smaller components also enabled the cost factors to be distributed more evenly across each part.
Baumers et al. [121] did not take into account any pre- or post-processing needed to guarantee the part performance. Energy costs were bundled along with other direct expenses for pre- and post-processing. This model provided an improved accuracy for estimating energy calculations and construction time compared to previous models. Nonetheless, a distinction between four cost elements was missing in the model, namely (i) process control and (ii) material depreciation in the primary step of pre-processing and (iii) material and (iv) testing cost elements in the last step of post-processing.
According to Lindemann et al. [85], earlier methods had each concentrated on a particular step in the process, but none had created a comprehensive cost model. They proposed a “Time Driven Activity-Based Costing” methodology for their analysis. This methodology is an adapted version of ABC, developed by Kaplan and Anderson [123], where you need two parameters: capacity cost rate and estimated time for the activities in service delivery. Capacity cost rate is calculated by dividing total cost of all the resources to the performing time. The following four key procedures were determined to be responsible for cost allocation:
  • Build job preparation;
  • Build;
  • Support removal;
  • Post-processing.
For the purpose of being able to depict various cost centres, the primary processes were chosen. The cost breakdown proposed by Lindemann et al. [85] closely resembles Equation (3) suggested by Ruffo et al [119]. A similar method of computing material cost to Ruffo et al.’s [119], has been used here with the following modifications:
  • Energy and gas are grouped as direct costs.
  • Fixed labour and gas costs for each build.
Lindemann et al. [85] also considered post-processing which includes the removal of supports, surface treatment, quality control procedures, documentation and verification. They concluded that machine costs, material costs, and post-processing were the most significant factors in total process costs. The analysis showed that the excess treatment needed to obtain a comparable finish to that produced by conventional manufacturing techniques must be included for a fair comparison. In addition, Lindemann et al. [85] foresaw that with the widespread use of AM technology, costs might be reduced by as much as 50% in the not-too-distant future due to greater machine utilisation, faster build times and lower material prices. They noted that the main driver of the cost was machine costs, followed by material costs. However, supporting data were limited and based on assumptions.
The cost model given by Yim and Rosen [73] broke down total costs into four categories: (i) initial investment, (ii) operating expenses, (iii) raw materials and (iv) labour. They constructed their cost model utilising a breakdown cost estimate technique. The build time is thought of as a function of the operating cost. The cost of the material is anticipated using the material volume of the element and supporting structures, along with the price of the material. The expenses of manual labour throughout the pre-processing and post-processing stages were included in the labour cost. A labour rate and an operation rate were used to define the labour and operation costs based on the time. The sum of the three main contributions, (i) recoating time, (ii) material processing time, and (iii) delay time, determines the overall build time.
An AM technology cost model was created by Atzeni and Salmi [80]. For their cost model, they used a breakdown cost estimation strategy. The costs for materials, pre-processing, processing and post-processing are separated in this cost model, as originally proposed by Alexander et al. [78]. The cost of the material was calculated by multiplying the product’s volume by the substance’s unit price. The setup time and operator rate are multiplied to determine the pre-processing cost. By calculating machine costs and the number of components manufactured in each build, processing costs were approximated. To evaluate post-processing expenses, the operator rate and heat treatment costs were considered.
In contrast to prior models, Rickenbacher et al. [124] proposed a comprehensive ABC model that included an in-depth study of all processes, including pre- and post-processing. They also saw that other models had either concentrated on producing many distinct known components or just one specific known part. The main innovations included in the model of Rickenbacher et al. [124] were as follows:
  • Modelling many distinct geometries in a single build.
  • An algorithm to determine how much time each component of the build will take in proportion.
  • A linear regression analysis of 24 separate builds was used to estimate the build time.
The cost model was created for numerous component geometries but is similar to the one used by Alexander et al. [78]. Activities are divided into the following seven categories, with the cost of each step added together to obtain the overall cost of each part:
  • Preparation;
  • Build job preparation;
  • Machine setup;
  • Build job;
  • Removal;
  • Build plate removal;
  • Post-processing.
By enabling analysis of builds with different component geometries and adding thorough pre-processing, Rickenbacher et al. [124] achieved a significant advancement above earlier models. The application of factors to simulate material changes and inert gas management is a significant development in cost modelling for AM. However, there are a few limitations to the model: The labour costs are consistent for various activities. Energy costs are not taken into account in the model and minimal details are provided on the post-processing activities. Heat treatment, material removal and machining are bundled as a single operation, and the post-processing time is underestimated at 0.1 h. The construction time estimator likewise has limitations, and no parameters for calculating machine costs are stated. The warmup and cool down durations are estimated using a regression model which is part geometry, setup and machine-dependant and requires prior experimental data.
Schröder et al. [86] took into account earlier AM cost models and claimed that the following elements are necessary to achieve a comprehensive model:
  • Integration of support structures, powder recycling, and waste of material;
  • Calculation of the build time;
  • Maximising build chamber space;
  • Representation of part complexity;
  • Post-processing;
  • Quality control.
The proposed model consists of seven primary process phases: (i) design and planning, (ii) material processing, (iii) machine preparation, (iv) manufacturing, (v) post-processing, (vi) administration and sales and (vii) quality control. In this model, different subprocesses exist for every major process phase and there is a distinct cost function for each subprocess.
The cost calculation tool determines a few significant key numbers in addition to the expenses of all major process phases. The tool incorporates all cost functions for each phase of the process. A total of 77 input values are required and a sensitivity analysis is performed. The purpose of the sensitivity analysis is to pinpoint any unique economic implications of AM. Based on their analysis, Schröder et al. [86] identified that the machine and material costs are the main drivers of costs, as was also highlighted by Ruffo et al. [119], Lindemann et al. [85] and Ingole et al. [125]. They also noted the importance of post-processing specifically for smaller parts and highlighted that only small-volume sections benefit from economies of scale.
In their cost model, Schröder et al. [86] included design and planning, management and sales and quality, none of which were included as distinct activities in earlier models. Parts will need additional design procedures in order to be ready for AM, but this need not be an additional task if the component was originally intended for AM.
Using the ABC technique, Barclift et al. [126] provided a cost model for a PBF process. They included the metal powder’s degradation in their model. Powder or feedstock expenses were formerly always regarded as fixed material costs. The Sum-of-the-Years technique was used by the authors to calculate the powder’s depreciation. Two components created using PBF-LB techniques were the subject of a case study. Their research showed that depending on the material and the number of times it may be constructed in a PBF, cost models using a constant material cost can undervalue the built parts with high-value virgin powder by as much as 3–11% or 13–75%.
By considering the whole AM process rather than just one aspect, Fera et al. [127] sought to improve earlier models by creating a model that represents numerous AM processes for the production of various geometries. The process is divided into the following activities, and the following cost drivers may be attributed to each of them: preparation, build job, setup, build (warm-up, scanning, re-coating, cool-down), and removal. The dynamic model also incorporates gas and energy prices, various geometries in a single build and a mixture of activity time estimates from earlier models.
The downside of the model by Fera et al. [127] is that some important post-processing processes are ignored, including heat treatments, material removal, build plate removal and finish processing. As the model intends to analyse the cost of production of a component made using AM, post-processing costs might be included using typical costing models for these activities. As a result, a single formula for all potential post-processing is time-consuming and out of scope. Full post-processing must be accounted for in the model in order to produce a functional part. Fera et al. [127] put out this model to calculate the expenses associated with integrating AM systems like Stereolithography, PBF-LB and EBM in a general production process on the shop floor. The advent of the Overall Equipment Effectiveness (OEE) index, which made it possible for this assessment to be more closely tied to actual production systems, served as a model for the integration of AM in the industry.
Yang and Li [128] used the ABC estimation technique, covering the pre-processing, processing and post-processing stages. Their model takes into account different component complexity, volume and height levels using a sorting algorithm. The cost of energy utilisation is influenced by the maximum height of the components in the production batch as well as a certain layer thickness. The labour expense only consists of tasks carried out before and after production. Part material and support structure material costs are two sources of material costs. As part of the overhead costs, this model also included the cost of machine depreciation, maintenance and administration. A model that examines the cost performance for mixed geometries was discovered. The material cost and the original investment are recognised as the primary variable costs based on the findings of the sensitivity analysis.
Priarone et al. [129] explored various methods that encompassed cost, production duration, energy consumption, and environmental effects. They conducted a case study to examine the framework and identified the solid to cavity ratio as the critical factor to consider. The case study revealed that as the solid to cavity ratio increased, both processing time and total costs also increased.
A methodology for calculating the cost of AM systems that use metal as the primary feedstock was proposed by Ulu et al. [130]. They used a process-based approach for cost estimation. Costs for materials, labour, energy, and equipment were all significant contributing components in their model. They showed that more cost-effective results are projected with the same amount of material by combining the construction of high-stress parts with lower power values to acquire better yield strength and boost the power elsewhere to minimise the number of passes and the build time.
An in-depth analysis of cost estimation models for products made using AM has shown that each of these cost estimation models is focused on certain AM processes, the most complete of which does not take into consideration a number of crucial components, including the recycling of AM materials, process control, testing of the finished products and the material utilised throughout the building and post-processing phases. These are essential cost components that contribute significantly to the entire cost of production.
Lamei [81] modified and expanded the model by Alexander et al. [78] and considered the impact of producing multiple parts in a single build. The total cost per component can be estimated using Equation (11). Given that various AM systems may create N identical parts during a single build, the total cost per component is represented as follows:
T o t a l C o s t = 1 N × C p r e p + C p r o c e s s i n g + C p o s t
where C p r e p , C p r o c e s s i n g and C p o s t are the costs for pre-processing, processing and post-processing activities.
The pre-processing includes all of the preliminary work required before building a part and includes labour and overhead costs, as shown in Equation (12).
C p r e p = C L 1 + C O H 1
where C L 1 is the labour cost and C O H 1 is overhead costs.
The second action, processing, may start after all preparatory tasks are finished. The AM system begins to construct the component during this activity. The expenses associated with this operation include those for the materials, equipment, labour, energy, process control and overhead. The processing cost can be estimated using Equation (13).
C p r o c e s s i n g = C M a t + C M a c h + C L 2 + C E + C P C + C O H 2
where C M a t is the cost of material required for the build, C M a c h is the AM machine cost, C L 2 is the labour cost, C E is the cost of the energy consumed by the AM machine, C P C is the processing control cost and C O H 2 represents the overhead cost.
Post-processing is the final action considered in this study, which occurs immediately after the processing operation. Consumables, equipment, labour, energy, inspection and overhead costs needed to perform post-processing are considered. As a result, Equation (14) is used to calculate the post-processing cost:
C p o s = C M a t 3 + C M a c h 3 + C L 3 + C E 3 + C T + C O H 3
where C M a t 3 is the material cost, C M a c h 3 is the machine cost, C L 3 is the labour cost, C E 3 is the energy cost, C T is the inspection cost and   C O H 3 is the overhead cost.
Lamei [81] also evaluated the validity of the proposed cost model by examining a total of eight parts with similar weight, shape, size and geometry made using PBF-LB. It was determined that conventional manufacturing processes would cost less than one-fourth of what the predicted cost of AM would be. These components are not suitable for production using AM. About 86% of the overall cost was spent on part processing, of which 81% went to equipment, overhead, and energy. Only 7% of the cost was due to the materials and 12% was associated with labour. Although a detailed cost estimation was aimed for, the gas consumption and cost of consumables were neglected in this model.
Griffin et al. [131] developed a hybrid-cost model to estimate production costs at the process level while accounting for system-level factors such as those seen in supply chain and operations management. It is a framework that takes into account the production costs of AM, identifies cost drivers and governs the choice of AM technology, components and production parameters with possible investment in mind. This approach has been developed to consider the investment options in AM and offers more flexibility for decision makers.
The overall cost of making a component on a certain AM machine is determined by the build volume, build time, availability of the machine and power and material expenses. Griffin et al. [131] derived an overall cost model based on the overall cost of ownership of an AM machine.
c t o t a l = c m a c h i n e , i n i t + c m a t , i n i t + c m a c h i n e , y r + c p o w e r , y r + c m a t , y r   P A , r w , l
where c t o t a l is the total cost to fabricate a part using AM, c m a c h i n e , i n i t is a one-off cost for the AM equipment, c m a t , i n i t is the cost of the initial mass of the material, c m a c h i n e , y r is the recurring annual costs of the AM equipment, c p o w e r , y r is the annual cost of power, c m a t , y r is the annual cost of the material, P A , r w , l is the weighted average cost of material for the lifespan (l) of the equipment and r w is the required rate of return.
The framework proposed by Griffin et al. [131] offers practitioners and prospective investors estimates via straightforward calculations. It also helps in conducting a direct comparison of make or buy strategies for AM. However, it does not address the costs and varying aspects apart from the production stage. One of the main assumptions used in this model was that a part is produced in high volume which utilises the entire build area, which is not the case in a typical industry as the manufacturers can utilise the machine at decreased build capacity. Nonetheless, in order to choose which AM equipment and AM technique best fits their budget and needs, potential investors might utilise this approach.
The activity-based costing approach has been used for PBF-LB and WAAM in recent studies [90,94]. Cardeal et al. [90] investigated supply chain and maintenance activities and performed a stock analysis on PBF-LB metal parts, which is a good example for inclusion of system-level parameters into a cost model. However, the post-processing activities were simplified and the uncertainty of the lead time was not sconsidered. Dias et al. [94] developed a detailed process-based cost model for WAAM with on-site time measurements, revealing that a significant 34% reduction in production cost can be achieved by replacing conventional manufacturing methods with WAAM. The model considered the primary WAAM stages from setup to final machining. However, it can be further enhanced by also representing the distribution of overall costs across these activities.
Mandolini et al. [132] developed an analytical cost model for the L-DED process which was tested for manufacturing of a rocket nozzle and a landing gear. The results from the analytical model deviated by 10% from the actual costs. Cost drivers such as material, labour and equipment were included. However, the costing was only performed for the setup, build and part removal processes and ignored the post-processing steps.

7. Discussion and Future Work

Despite developments in cost estimation for AM over the past two decades, a significant gap remains in costing for AM and there is no generalised model suitable for various DED AM processes. The majority of the studies have concentrated on specific processes or aimed to compare or justify the use of AM as an alternative manufacturing process to that of other conventional processes. The initial focus was on producing identical parts using AM to those made by conventional manufacturing processes. As the research progressed, it became evident that the manufacturing flexibility of AM allows for producing parts that deliver the required function whilst reducing the material required. For parts produced using expensive materials, this can lead to reduced production costs. Therefore, designing parts specifically for AM can leverage its unique capabilities, such as complex geometries and lightweight structures. Additionally, optimised AM designs can improve performance characteristics. The assembly time can be reduced by consolidating multiple components into a single part, which decreases the lead times and contributes to overall economic advantages in the production process.
These observations indicate that there is a growing need for accurate cost estimation for manufacturing systems which incorporate AM as their central manufacturing process. The distinct difference between these systems is that AM is a near-net-shape manufacturing process and the parts generated require pre-processing and post-processing. The pre-and post-processing requirements in AM are not only affected by the part’s function and application but also by the geometries defined at the design stage and the specific AM process used.
Often, the pre-and post-processing costs can surpass the direct AM costs. In this scenario, AM can be a direct replacement for processes such as casting, forging or rough machining. This necessitates a thorough understanding of the costs involved in the whole manufacturing cycle, including pre- and post-processing, rather than only the direct AM costs. This trend is also evident from the research on cost estimation for AM. Whilst the early studies focused on the AM process itself, more recent developments aim to capture the costs involved in the whole manufacturing chain using AM. Process development, testing and benchmarking steps are necessary to ensure the successful implementation of AM and should be involved in costing. The time and resources invested in the process validation phase cannot be neglected, as well as equipment and training costs. Furthermore, material selection and optimisation require extensive testing, which can contribute significantly to the overall cost.
The investigations showed that most studies have been focused on deterministic models, with few researchers implementing stochastic models. Whilst deterministic models can provide insights into the costs involved, they often fail to capture intrinsic and stochastic variations involved in AM. Compared to other processes, the stochastic variations can be larger and more profound in AM since they can also affect the material properties, feedstock reuse and thermal effects, as well as the time-dependent variables.
In the production of large AM products, such as the ones in aerospace or marine industries, pre- and post-processing may require transportation to different sites, which necessitates the inclusion of supply chains into the model. This also provides an opportunity for AM where high transportation costs justify local production using AM. Activity-based costing (ABC) has the capability to take the uncertainties involved in the production using AM and is also one of the main methods used by researchers for developing cost models. While there are some studies on the use of machine learning for cost estimation of AM processes, the application of machine learning is somewhat limited and not comparable to other areas of research. Machine learning models also require significant historical data which may become available in the future. However, synthesised data can be used for training machine learning costing models. These models can analyse CAD models, consider multiple build strategies and estimate costs for manufacturing of a part, including pre- and post-processes.
The majority of the work on cost modelling for AM is centred on case studies focused on specific parts and AM processes. Given the diversity of AM technologies, materials, equipment and applications, it is difficult to generalise these cost models and the cost estimates might vary greatly between different models. The pre- and post-processing requirements and their associated costs are greatly influenced by the part design, specific AM technology and application. For instance, a part produced by Laser Powder Bed Fusion for aerospace applications may require extensive powder removal, including hydrofluoric acid cleaning, heat treatment and hot isostatic pressing (HIPing), which may not have been necessary if a wire feedstock was used. The time required to spread a fresh layer of powder across the previous layer using a roller during the build in L-PBF processes is also as important as the powder removal time. The powder rolling time varies depending on the system and it has been observed that it is neglected in build-time calculations when cost models are generalised.
DED processes such as WAAM have poor surface quality and integrity and hence post-processing operations such as machining are an essential requirement. Therefore, all the stages including machining should be considered. Various aspects such as machine investment and labour cost, energy consumption, cutting fluid consumption, cutting tools and tooling, and waste processing/recycling have to be included for the post-processing stage of the AM-fabricated parts.
Traditional models have predominantly focused on the deposition rate and its impact on overall production costs when timing activities to calculate labour and energy costs. However, minimising non-deposition time can also provide substantial reductions in total processing time. Non-deposition time may include stochastic elements such as inter-layer cooling time in WAAM, manual interventions during the process, restocking the powder/wire, etc., which have been largely overlooked by the earlier models. Whilst a degree of autonomy has been achieved in PBF processes, Wire-DED processes largely require supervision and manual intervention during the build process. This limits machine utilisation which can increase the overheads costs and those associated with capital investments per component.
Figure 9 shows an example curve of production costs per part against production volume for both PBF and DED processes when parameters such as coating time and inter-layer cooling time are considered. As also stated by Ruffo et al. [119], the time to add powder layers (recoating time) and predetermined warm-up and cool-down durations during each construction phase are responsible for the curve’s variability in Figure 9a. The cost per part goes down as the number of parts in a build increases and goes up again when the increase in the number of parts overflows to another build. As costs are dispersed across more parts, the cost curve stabilises at increasing production volumes. In the context of DED processes, the cost per part initially decreases as the production volume increases. The effect of inter-layer cooling time and machine uptime remain inconsequential as the machine seamlessly transitions to construct layers for other parts during this phase. However, there is a threshold at the number of parts where these factors become significant, leading to a slight increase in the cost per part. It is possible to reduce the cost again with the introduction of new machines into the system, as suggested by Dias et al. [94]. The exploration of economy of scale in AM necessitates a comprehensive examination that takes into account crucial parameters and opportunities in the domain of cost modelling studies.
Considering the production parameters, several key strategies applicable to different AM processes can be employed in cost modelling studies with the aim of reducing production costs. Firstly, the number of build cycles can be reduced by efficiently packing the build chamber and optimising the part orientation. Secondly, designing parts to minimise the need for support structures can significantly reduce the material consumption and build time, which also impacts the material removal time. Therefore, it is essential to consider the post-processing activities at the design stage. Other useful strategies during the build process include using thicker layers where technically feasible and minimising machine idle time, which would speed up the process through faster deposition and maximum utilisation. Recycling and re-using powder in powder-based processes should also be considered as it can provide substantial savings. Implementing a robust quality control system, similar to traditional manufacturing, can enhance efficiency by preventing defects and reducing the need for rework. Cost modelling should incorporate the cost of integrating advanced control systems into AM to ensure comprehensive cost optimisation.
In addition to production-related parameters, market demand for the product, availability of resources, and delivery timelines play an important role in the estimation of the cost of a finished product. Hence, these aspects must also be considered in designing a robust cost model. Figure 10 shows the cost elements that can be considered for producing a comprehensive cost model. Some elements that have not been considered in the literature have been added, which include market demand in the pre-processing stage; lead time and shielding gas costs in the processing stage; and cutting tool, lubrication or coolants, recycling and labour charges in the post-processing phase. Recycling of the machining chips obtained from machining, cutting tools, lubrication or coolants and solutions or chemicals are important as the focus of the machining industry is shifting towards sustainability and the economic viability is an important pillar in supporting the foundation of sustainability [133].
Whilst the cost estimation models found in the literature can provide a comprehensive view of the AM processing, they do not capture the impact that the design and pre-processing have on the overall costs. There is an opportunity to further break down these models into distinct activities and identify the interrelations between different components of the models. Part orientation can affect the material properties and powder and support structure removal, whilst process parameters can impact energy consumption, material properties, the need for post-processing and material reuse. These can potentially be incorporated into a simulation-based or computational model. It is also noteworthy to mention that existing cost models may not apply to some specific post-processing activities for AM processes, such as powder removal for PBF, and specific tooling requirements for finish machining processes.

8. Conclusions

This paper provides a comprehensive review of advances in cost modelling techniques for metal additive manufacturing (AM) and identifies important, often-overlooked cost elements that needs to be considered for developing a comprehensive cost model.
With the increasing adoption of AM in industry and its incorporation in mainstream manufacturing systems, there is a growing need for a better understanding of the production costs involved when using AM. Cost estimation and prediction for part production are necessary for decision making, which will have a substantial impact on the future adoption and growth of AM technologies. There have been a multitude of cost models proposed over the past two decades which are concentrated on specific parts, processes and applications. Recent advances have focused on developing generalisable models that can be used for different AM processes and applications. The complexities and intrinsic behaviour of AM cannot entirely be captured by static deterministic models and further developments in stochastic and dynamic cost models are necessary. This can potentially lead to the development of digital twins capable of analysing and predicting manufacturing costs for AM. In addition, when using AM as a primary manufacturing process, decisions at the early stages of design such as the processing parameters and the selection of the AM process can have a profound impact on the pre-and post-processing costs. However, in existing cost models, different cost variables are considered independent, and the interrelationships are neglected.
Future developments should concentrate on identifying the interactions of different cost variables, taking into account the stochastic nature of the process costs and integrating these into the design of the part. There is a need for more transparent and standardised methodologies that can be used across different application areas to facilitate benchmarking, sharing of knowledge and collaboration between researchers and practitioners in the field. More empirical studies should be carried out to validate and improve existing cost models and to identify new factors that may affect the cost of AM processes.

Author Contributions

Conceptualization, A.S.; methodology, N.K., H.S., B.K., I.F. and A.S.; investigation, N.K., B.K. and A.S.; resources, A.S.; data curation, B.K. and I.F.; writing—original draft preparation, H.S. and B.K.; writing—review and editing, A.S. and B.K.; visualisation, B.K.; supervision, A.S.; project administration, A.S. All authors have read and agreed to the published version of the manuscript.

Funding

This research received no external funding.

Data Availability Statement

No new data were created or analysed in this study. Data sharing is not applicable to this article.

Conflicts of Interest

The authors declare no conflicts of interest.

Abbreviations

ABCActivity-based costing
AMAdditive manufacturing
CMTCold Metal Transfer
DEDDirected Energy Deposition
DMDDirect Metal Deposition
EBAMElectron Beam Additive Manufacturing
EBFElectron Beam Fabrication
EBMElectron Beam Melting
HIPHot isostatic pressing
LENSLaser Engineered Net Shaping
LMDLaser Matel Deposition
MIGMetal Inert Gas
PBFPowder Bed Fusion
PBF-EBPowder Bed Fusion—Electron Beam
PBF-LBPowder Bed Fusion—Laser Beam
SLMSelective Laser Melting
SLSSelective Laser Sintering
WAAMWire Arc Additive Manufacturing

References

  1. Bandyopadhyay, A.; Heer, B. Materials Science & Engineering R Additive manufacturing of multi-material structures. Mater. Sci. Eng. R 2018, 129, 1–16. [Google Scholar] [CrossRef]
  2. Gibson, I.; Rosen, D.; Stucker, B. Additive Manufacturing Technologies: 3D Printing, Rapid Prototyping, and Direct Digital Manufacturing, 2nd ed.; Springer: New York, NY, USA, 2015; ISBN 9781493921133. [Google Scholar]
  3. Mellor, S.; Hao, L.; Zhang, D. Additive manufacturing: A framework for implementation. Int. J. Prod. Econ. 2014, 149, 194–201. [Google Scholar] [CrossRef]
  4. Das, S.; Wohlert, M.; Beaman, J.J.; Bourell, D.L. Processing of titanium net shapes by SLS/HIP. Mater. Des. 1999, 20, 115–121. [Google Scholar] [CrossRef]
  5. Pham, D.T.; Gault, R.S. A comparison of rapid prototyping technologies. Int. J. Mach. Tools Manuf. 1998, 38, 1257–1287. [Google Scholar] [CrossRef]
  6. Hague, R.; Campbell, I.; Dickens, P. Implications on design of rapid manufacturing. Proc. Inst. Mech. Eng. Part C J. Mech. Eng. Sci. 2003, 217, 25–30. [Google Scholar] [CrossRef]
  7. Baumers, M.; Dickens, P.; Tuck, C.; Hague, R. The cost of additive manufacturing: Machine productivity, economies of scale and technology-push. Technol. Forecast. Soc. Chang. 2016, 102, 193–201. [Google Scholar] [CrossRef]
  8. Hopkinson, N.; Hague, R.J.M.; Dickens, P.M. Rapid Manufacturing: An Industrial Revolution for the Digital Age; John Wiley & Sons: Chichester, UK, 2005; ISBN 9780470016138. [Google Scholar]
  9. Thomas, D.S.; Gilbert, S.W. Costs and cost effectiveness of additive manufacturing: A literature review and discussion. In Additive Manufacturing: Costs, Cost Effectiveness and Industry Economics; National Institute of Standards and Technology: Gaithersburg, MD, USA, 2014; pp. 1–96. [Google Scholar] [CrossRef]
  10. Kadir, A.Z.A.; Yusof, Y.; Wahab, M.S. Additive manufacturing cost estimation models—A classification review. Int. J. Adv. Manuf. Technol. 2020, 107, 4033–4053. [Google Scholar] [CrossRef]
  11. Chang, K.H. Product Manufacturing and Cost Estimating Using CAD/CAE: A Volume in the Computer Aided Engineering Design Series; Academic Press: Cambridge, MA, USA, 2013; ISBN 9780124017450. [Google Scholar]
  12. ASTM52900-15; Standard Terminology for Additive Manufacturing—General Principles—Terminology. ASTM International: West Conshohocken, PA, USA, 2015; Volume 3, p. 5.
  13. ASTM/ISO 52900. Additive Manufacturing—General Principles—Terminology. ASTM International: West Conshohocken, PA, USA, 2021; Volume 2021, pp. 1–14.
  14. Youssef, H.A.; El-Hofy, H.A.; Ahmed, M.H. Manufacturing Technology: Materials, Processes, and Equipment, 1st ed.; CRC Press: Boca Raton, FL, USA, 2011; ISBN 9780429184895. [Google Scholar]
  15. Guo, N.; Leu, M.C. Additive manufacturing: Technology, applications and research needs. Front. Mech. Eng. 2013, 8, 215–243. [Google Scholar] [CrossRef]
  16. Gibson, I.; Rosen, D.; Stucker, B. Additive Manufacturing Technologies: Rapid Prototyping to Direct Digital Manufacturing; Springer: New York, NY, USA, 2014. [Google Scholar]
  17. Wong, K.V.; Hernandez, A. A Review of Additive Manufacturing. ISRN Mech. Eng. 2012, 2012, 208760. [Google Scholar] [CrossRef]
  18. Mirzaali, M.J.; Bobbert, F.S.L.; Li, Y.; Zadpoor, A.A. Additive manufacturing of metals using powder bed-based technologies. In Additive Manufacturing; CRC Press: Boca Raton, FL, USA, 2019; pp. 93–145. ISBN 0429466234. [Google Scholar]
  19. Frazier, W.E. Metal additive manufacturing: A review. J. Mater. Eng. Perform. 2014, 23, 1917–1928. [Google Scholar] [CrossRef]
  20. Froes, F.H.; Dutta, B. The additive manufacturing (AM) of titanium alloys. Adv Mater Res 2014, 1019, 19–25. [Google Scholar] [CrossRef]
  21. Herzog, D.; Seyda, V.; Wycisk, E.; Emmelmann, C. Additive manufacturing of metals. Acta Mater. 2016, 117, 371–392. [Google Scholar] [CrossRef]
  22. Kruth, J.P.; Mercelis, P.; Van Vaerenbergh, J.; Froyen, L.; Rombouts, M. Binding mechanisms in selective laser sintering and selective laser melting. Rapid Prototyp. J. 2005, 11, 26–36. [Google Scholar] [CrossRef]
  23. Khanna, N.; Mistry, S.; Rashid, R.A.R.; Gupta, M.K. Investigations on density and surface roughness characteristics during selective laser sintering of Invar-36 alloy. Mater. Res. Express 2019, 6, 086541. [Google Scholar] [CrossRef]
  24. Gupta, M.K.; Singla, A.K.; Ji, H.; Song, Q.; Liu, Z.; Cai, W.; Mia, M.; Khanna, N.; Krolczyk, G.M. Impact of layer rotation on micro-structure, grain size, surface integrity and mechanical behaviour of SLM Al-Si-10Mg alloy. J. Mater. Res. Technol. 2020, 9, 9506–9522. [Google Scholar] [CrossRef]
  25. Ponnusamy, P.; Rashid, R.A.R.; Masood, S.H.; Ruan, D.; Palanisamy, S. Mechanical properties of slm-printed aluminium alloys: A review. Materials 2020, 13, 4301. [Google Scholar] [CrossRef]
  26. Zhang, L.C.; Liu, Y.; Li, S.; Hao, Y. Additive Manufacturing of Titanium Alloys by Electron Beam Melting: A Review. Adv. Eng. Mater. 2018, 20, 1700842. [Google Scholar] [CrossRef]
  27. Mussatto, A. Research progress in multi-material laser-powder bed fusion additive manufacturing: A review of the state-of-the-art techniques for depositing multiple powders with spatial selectivity in a single layer. Results Eng. 2022, 16, 100769. [Google Scholar] [CrossRef]
  28. Das, M.; Balla, V.K.; Kumar, T.S.S.; Manna, I. Fabrication of Biomedical Implants using Laser Engineered Net Shaping (LENSTM). Trans. Indian Ceram. Soc. 2013, 72, 169–174. [Google Scholar] [CrossRef]
  29. Balla, V.K. Deposition-Based and Solid-State Additive Manufacturing Technologies for Metals. In Additive Manufacturing; CRC Press: Boca Raton, FL, USA, 2019; pp. 147–182. ISBN 0429466234. [Google Scholar]
  30. Yakout, M.; Elbestawi, M.A.; Veldhuis, S.C. A review of metal additive manufacturing technologies. Solid State Phenom. 2018, 278, 1–14. [Google Scholar] [CrossRef]
  31. Rahman Rashid, R.A.; Palanisamy, S.; Attar, H.; Bermingham, M.; Dargusch, M.S. Metallurgical features of direct laser-deposited Ti6Al4V with trace boron. J. Manuf. Process. 2018, 35, 651–656. [Google Scholar] [CrossRef]
  32. Rahman Rashid, R.A.; Barr, C.J.; Palanisamy, S.; Nazari, K.A.; Orchowski, N.; Matthews, N.; Dargusch, M.S. Effect of clad orientation on the mechanical properties of laser-clad repaired ultra-high strength 300 M steel. Surf. Coat. Technol. 2019, 380, 125090. [Google Scholar] [CrossRef]
  33. Bermingham, M.J.; Nicastro, L.; Kent, D.; Chen, Y.; Dargusch, M.S. Optimising the mechanical properties of Ti-6Al-4V components produced by wire + arc additive manufacturing with post-process heat treatments. J. Alloys Compd. 2018, 753, 247–255. [Google Scholar] [CrossRef]
  34. Jamnikar, N.; Liu, S.; Brice, C.; Zhang, X. Comprehensive molten pool condition-process relations modeling using CNN for wire-feed laser additive manufacturing. J. Manuf. Process. 2023, 98, 42–53. [Google Scholar] [CrossRef]
  35. Bermingham, M.J.; Thomson-Larkins, J.; St John, D.H.; Dargusch, M.S. Sensitivity of Ti-6Al-4V components to oxidation during out of chamber Wire + Arc Additive Manufacturing. J. Mater. Process. Technol. 2018, 258, 29–37. [Google Scholar] [CrossRef]
  36. Geng, H.; Li, J.; Xiong, J.; Lin, X.; Zhang, F. Optimization of wire feed for GTAW based additive manufacturing. J. Mater. Process. Technol. 2017, 243, 40–47. [Google Scholar] [CrossRef]
  37. Sachs, E.; Cima, M.; Cornie, J.; Brancazio, D.; Bredt, J.; Curodeau, A.; Fan, T.; Khanuja, S.; Lauder, A.; Lee, J.; et al. Three-Dimensional Printing: The Physics and Implications of Additive Manufacturing. CIRP Ann. Manuf. Technol. 1993, 42, 257–260. [Google Scholar] [CrossRef]
  38. Busachi, A.; Erkoyuncu, J.; Colegrove, P.; Martina, F.; Watts, C.; Drake, R. A review of Additive Manufacturing technology and Cost Estimation techniques for the defence sector. CIRP J. Manuf. Sci. Technol. 2017, 19, 117–128. [Google Scholar] [CrossRef]
  39. Conner, B.P.; Manogharan, G.P.; Martof, A.N.; Rodomsky, L.M.; Rodomsky, C.M.; Jordan, D.C.; Limperos, J.W. Making sense of 3-D printing: Creating a map of additive manufacturing products and services. Addit. Manuf. 2014, 1, 64–76. [Google Scholar] [CrossRef]
  40. Vartanian, K.; Brewer, L.; Manley, K.; Cobbs, T. Powder bed fusion vs. directed energy deposition benchmark study: Mid-size part with simple geometry. Optomec Corp. 2018, 3–6. Available online: https://www.optomec.com/wp-content/uploads/2018/06/PBF-vs-DED-BENCHMARK-STUDY_7March_2018-03.pdf (accessed on 3 July 2024).
  41. Svetlizky, D.; Das, M.; Zheng, B.; Vyatskikh, A.L.; Bose, S.; Bandyopadhyay, A.; Schoenung, J.M.; Lavernia, E.J.; Eliaz, N. Directed energy deposition (DED) additive manufacturing: Physical characteristics, defects, challenges and applications. Mater. Today 2021, 49, 271–295. [Google Scholar] [CrossRef]
  42. Leicht, A.; Fischer, M.; Klement, U.; Nyborg, L.; Hryha, E. Increasing the Productivity of Laser Powder Bed Fusion for Stainless Steel 316L through Increased Layer Thickness. J. Mater. Eng. Perform. 2021, 30, 575–584. [Google Scholar] [CrossRef]
  43. Paradise, P.; Patil, D.; Van Handel, N.; Temes, S.; Saxena, A.; Bruce, D.; Suder, A.; Clonts, S.; Shinde, M.; Noe, C.; et al. Improving Productivity in the Laser Powder Bed Fusion of Inconel 718 by Increasing Layer Thickness: Effects on Mechanical Behavior. J. Mater. Eng. Perform. 2022, 31, 6205–6220. [Google Scholar] [CrossRef]
  44. Brudler, S.; Medvedev, A.E.; Pandelidi, C.; Piegert, S.; Illston, T.; Qian, M.; Brandt, M. Systematic investigation of performance and productivity in laser powder bed fusion of Ti6Al4V up to 300 µm layer thickness. J. Mater. Process. Technol. 2024, 330, 118450. [Google Scholar] [CrossRef]
  45. Zadpoor, A.A. Frontiers of additively manufactured metallic materials. Materials 2018, 11, 1566. [Google Scholar] [CrossRef]
  46. Dutta, B.; Froes, F.H. The Additive Manufacturing (AM) of titanium alloys. Met. Powder Rep. 2017, 72, 96–106. [Google Scholar] [CrossRef]
  47. Liu, Z.; He, B.; Lyu, T.; Zou, Y. A Review on Additive Manufacturing of Titanium Alloys for Aerospace Applications: Directed Energy Deposition and Beyond Ti-6Al-4V. JOM 2021, 73, 1804–1818. [Google Scholar] [CrossRef]
  48. Ding, D.; Pan, Z.; Cuiuri, D.; Li, H. Wire-feed additive manufacturing of metal components: Technologies, developments and future interests. Int. J. Adv. Manuf. Technol. 2015, 81, 465–481. [Google Scholar] [CrossRef]
  49. Ahn, D.G. Directed Energy Deposition (DED) Process: State of the Art. Int. J. Precis. Eng. Manuf. Green Technol. 2021, 8, 703–742. [Google Scholar] [CrossRef]
  50. Jafari, D.; Vaneker, T.H.J.; Gibson, I. Wire and arc additive manufacturing: Opportunities and challenges to control the quality and accuracy of manufactured parts. Mater. Des. 2021, 202, 109471. [Google Scholar] [CrossRef]
  51. Ferreira, B.T.; de Campos, A.A.; Casati, R.; Gonçalves, A.; Leite, M.; Ribeiro, I. Technological Capabilities and Sustainability Aspects of Metal Additive Manufacturing; Springer International Publishing: Berlin/Heidelberg, Germany, 2023; ISBN 0123456789. [Google Scholar]
  52. Mumtaz, K.A.; Hopkinson, N. Selective Laser Melting of thin wall parts using pulse shaping. J. Mater. Process. Technol. 2010, 210, 279–287. [Google Scholar] [CrossRef]
  53. Zhu, H.H.; Lu, L.; Fuh, J.Y.H. Development and characterisation of direct laser sintering Cu-based metal powder. J. Mater. Process. Technol. 2003, 140, 314–317. [Google Scholar] [CrossRef]
  54. Osipovich, K.; Kalashnikov, K.; Chumaevskii, A.; Gurianov, D.; Kalashnikova, T.; Vorontsov, A.; Zykova, A.; Utyaganova, V.; Panfilov, A.; Nikolaeva, A.; et al. Wire-Feed Electron Beam Additive Manufacturing: A Review. Metals 2023, 13, 279. [Google Scholar] [CrossRef]
  55. Wippermann, A.; Gutowski, T.G.; Denkena, B.; Dittrich, M.A.; Wessarges, Y. Electrical energy and material efficiency analysis of machining, additive and hybrid manufacturing. J. Clean. Prod. 2020, 251, 119731. [Google Scholar] [CrossRef]
  56. Taminger, K.M.; Hafley, R.A. Electron Beam Freeform Fabrication for Cost Effective Near-Net Shape Manufacturing. In Proceedings of the NATO/RTO AVT-139 Specialists’’ Meeting on Cost Effective Manufacture via Net Shape Processing, Amsterdam, The Netherlands, 15–17 May 2006; Volume 19. [Google Scholar]
  57. Ayed, A.; Bras, G.; Bernard, H.; Michaud, P.; Balcaen, Y.; Alexis, J. Additive manufacturing of Ti6Al4V with wire laser metal deposition process. Mater. Sci. Forum 2021, 1016 MSF, 24–29. [Google Scholar] [CrossRef]
  58. Williams, S.W.; Martina, F.; Addison, A.C.; Ding, J.; Pardal, G.; Colegrove, P. Wire + Arc additive manufacturing. Mater. Sci. Technol. 2016, 32, 641–647. [Google Scholar] [CrossRef]
  59. Busachi, A.; Erkoyuncu, J.; Colegrove, P.; Martina, F.; Ding, J. Designing a WAAM based manufacturing system for defence applications. Procedia CIRP 2015, 37, 48–53. [Google Scholar] [CrossRef]
  60. Arrizubieta, J.I.; Klocke, F.; Klingbeil, N.; Arntz, K.; Lamikiz, A.; Martinez, S. Evaluation of efficiency and mechanical properties of Inconel 718 components built by wire and powder laser material deposition. Rapid Prototyp. J. 2017, 23, 965–972. [Google Scholar] [CrossRef]
  61. Dzogbewu, T.C.; de Beer, D. Powder Bed Fusion of Multimaterials. J. Manuf. Mater. Process. 2023, 7, 15. [Google Scholar] [CrossRef]
  62. Breinan, E.M.; Kear, B.H. Rapid Solidification Laser Processing at High Power Density. Mater. Process. Theory Pract. 1983, 3, 235–295. [Google Scholar] [CrossRef]
  63. Singh, A.; Kapil, S.; Das, M. A comprehensive review of the methods and mechanisms for powder feedstock handling in directed energy deposition. Addit. Manuf. 2020, 35, 101388. [Google Scholar] [CrossRef]
  64. Oliveira, J.P.; Gouveia, F.M.; Santos, T.G. Micro wire and arc additive manufacturing (µ-WAAM). Addit. Manuf. Lett. 2022, 2, 100032. [Google Scholar] [CrossRef]
  65. Halisch, C.; Radel, T.; Tyralla, D.; Seefeld, T. Measuring the melt pool size in a wire arc additive manufacturing process using a high dynamic range two-colored pyrometric camera. Weld. World 2020, 64, 1349–1356. [Google Scholar] [CrossRef]
  66. Sun, Z.; Guo, W.; Li, L. In-process measurement of melt pool cross-sectional geometry and grain orientation in a laser directed energy deposition additive manufacturing process. Opt. Laser Technol. 2020, 129, 106280. [Google Scholar] [CrossRef]
  67. Sow, M.C.; De Terris, T.; Castelnau, O.; Hamouche, Z.; Coste, F.; Fabbro, R.; Peyre, P. Influence of beam diameter on Laser Powder Bed Fusion (L-PBF) process. Addit. Manuf. 2020, 36, 101532. [Google Scholar] [CrossRef]
  68. Niazi, A.; Dai, J.S.; Balabani, S.; Seneviratne, L. Product cost estimation: Technique classification and methodology review. J. Manuf. Sci. Eng. 2006, 128, 563–575. [Google Scholar] [CrossRef]
  69. Chwastyk, P.; Kołosowski, M. Estimating the cost of the new product in development process. In Procedia Engineering; Elsevier: Amsterdam, The Netherlands, 2014; Volume 69, pp. 351–360. [Google Scholar]
  70. Datta, P.P.; Roy, R. Cost modelling techniques for availability type service support contracts: A literature review and empirical study. CIRP J. Manuf. Sci. Technol. 2010, 3, 142–157. [Google Scholar] [CrossRef]
  71. Huang, X.X.; Newnes, L.B.; Parry, G.C. The adaptation of product cost estimation techniques to estimate the cost of service. Int. J. Comput. Integr. Manuf. 2012, 25, 417–431. [Google Scholar] [CrossRef]
  72. Stewart, R.D.; Wyskida, R.M.; Johannes, J.D. Cost Estimator’s Reference Manual; John Wiley & Sons: Hoboken, NJ, USA, 1995; ISBN 0471305103. [Google Scholar]
  73. Yim, S.; Rosen, D. Build time and cost models for Additive Manufacturing process selection. In Proceedings of the ASME Design Engineering Technical Conference; American Society of Mechanical Engineers, Chicago, IL, USA, 12–15 August 2012; Volume 2, pp. 375–382. [Google Scholar]
  74. Cooper, R.; Kaplan, R.S. Measure costs right: Make the right decisions. Harv. Bus. Rev. 1988, 66, 96–103. [Google Scholar]
  75. Özbayrak, M.; Akgün, M.; Türker, A.K. Activity-based cost estimation in a push/pull advanced manufacturing system. Int. J. Prod. Econ. 2004, 87, 49–65. [Google Scholar] [CrossRef]
  76. Jarrar, Q.; Belkadi, F.; Bernard, A. An Activity-Based Costing Model for Additive Manufacturing. In Proceedings of the IFIP Advances in Information and Communication Technology, Grenoble, France, 10–13 July 2022; Volume 639 IFIP, pp. 492–507. [Google Scholar]
  77. Abdulhameed, O.; Al-Ahmari, A.; Ameen, W.; Mian, S.H. Additive manufacturing: Challenges, trends, and applications. Adv. Mech. Eng. 2019, 11, 1687814018822880. [Google Scholar] [CrossRef]
  78. Alexander, P.; Allen, S.; Dutta, D. Part orientation and build cost determination in layered manufacturing. CAD Comput. Aided Des. 1998, 30, 343–356. [Google Scholar] [CrossRef]
  79. Costabile, G.; Fera, M.; Fruggiero, F.; Lambiase, A.; Pham, D. Cost models of additive manufacturing: A literature review. Int. J. Ind. Eng. Comput. 2016, 8, 263–282. [Google Scholar] [CrossRef]
  80. Atzeni, E.; Salmi, A. Economics of additive manufacturing for end-usable metal parts. Int. J. Adv. Manuf. Technol. 2012, 62, 1147–1155. [Google Scholar] [CrossRef]
  81. Lamei, Z. A Comprehensive Cost Estimation for Additive Manufacturing A Thesis by a Comprehensive Cost Estimation for Additive Manufacturing. Ph.D. Thesis, Wichita State University, Wichita, KS, USA, 2021. [Google Scholar]
  82. Ruffo, M.; Hague, R. Cost estimation for rapid manufacturing—Simultaneous production of mixed components using laser sintering. Proc. Inst. Mech. Eng. Part B J. Eng. Manuf. 2007, 221, 1585–1591. [Google Scholar] [CrossRef]
  83. Atzeni, E.; Iuliano, L.; Minetola, P.; Salmi, A. Redesign and cost estimation of rapid manufactured plastic parts. Rapid Prototyp. J. 2010, 16, 308–317. [Google Scholar] [CrossRef]
  84. Kokare, S.; Oliveira, J.P.; Godina, R. Life cycle assessment of additive manufacturing processes: A review. J. Manuf. Syst. 2023, 68, 536–559. [Google Scholar] [CrossRef]
  85. Lindemann, C.; Jahnke, U.; Moi, M.; Koch, R. Analyzing product lifecycle costs for a better understanding of cost drivers in additive manufacturing. In Proceedings of the 23rd Annual International Solid Freeform Fabrication Symposium—An Additive Manufacturing Conference, SFF 2012, Austin, TX, USA, 6–8 August 2012; pp. 177–188. [Google Scholar]
  86. Schröder, M.; Falk, B.; Schmitt, R. Evaluation of cost structures of additive manufacturing processes using a new business model. In Procedia CIRP; Elsevier B.V.: Amsterdam, The Netherlands, 2015; Volume 30, pp. 311–316. [Google Scholar]
  87. Wohlers, T.; Diegel, O. Costs and considerations when investing in a metal additive manufacturing system. In Metal Additive Manufacturing; Inovar Communications Ltd.: Shewsbury, UK, 2017; Volume 3, pp. 93–97. [Google Scholar]
  88. Wiese, M.; Kwauka, A.; Thiede, S.; Herrmann, C. Economic assessment for additive manufacturing of automotive end-use parts through digital light processing (DLP). CIRP J. Manuf. Sci. Technol. 2021, 35, 268–280. [Google Scholar] [CrossRef]
  89. Hopkinson, N.; Dickens, P. Analysis of rapid manufacturing—Using layer manufacturing processes for production. Proc. Inst. Mech. Eng. Part C J. Mech. Eng. Sci. 2003, 217, 31–40. [Google Scholar] [CrossRef]
  90. Cardeal, G.; Sequeira, D.; Mendonça, J.; Leite, M.; Ribeiro, I. Additive manufacturing in the process industry: A process-based cost model to study life cycle cost and the viability of additive manufacturing spare parts. Procedia CIRP 2021, 98, 211–216. [Google Scholar] [CrossRef]
  91. Medina, F. Reducing Metal Alloy Powder Costs for Use in Powder Bed Fusion Additive Manufacturing: Improving the Economics for Production. Ph.D. Thesis, University of Texas at El Paso, El Paso, TX, USA, 2013. [Google Scholar]
  92. Wohlers, T.T. Wohlers Report 2012: Additive Manufacturing and 3D Printing State of the Industry: Annual Worldwide Progress Report; Wohlers Associates: Fort Collins, CO, USA, 2012; ISBN 0975442988. [Google Scholar]
  93. Langelandsvik, G.; Akselsen, O.M.; Furu, T.; Roven, H.J. Review of Aluminum Alloy Development for Wire Arc Additive Manufacturing. Materials 2021, 14, 5370. [Google Scholar] [CrossRef] [PubMed]
  94. Dias, M.; Pragana, J.P.M.; Ferreira, B.; Ribeiro, I.; Silva, C.M.A. Economic and Environmental Potential of Wire-Arc Additive Manufacturing. Sustainability 2022, 14, 5197. [Google Scholar] [CrossRef]
  95. Kokare, S.; Oliveira, J.P.; Godina, R. A LCA and LCC analysis of pure subtractive manufacturing, wire arc additive manufacturing, and selective laser melting approaches. J. Manuf. Process. 2023, 101, 67–85. [Google Scholar] [CrossRef]
  96. Baumers, M. Economic Aspects of Additive Manufacturing: Benefits, Costs and Energy Consumption. Ph.D. Thesis, Loughborough University, Loughborough, UK, 2012; pp. 1–256. [Google Scholar]
  97. Morrow, W.R.; Qi, H.; Kim, I.; Mazumder, J.; Skerlos, S.J. Environmental aspects of laser-based and conventional tool and die manufacturing. J. Clean. Prod. 2007, 15, 932–943. [Google Scholar] [CrossRef]
  98. Landi, D.; Zefinetti, F.C.; Spreafico, C.; Regazzoni, D. Comparative life cycle assessment of two different manufacturing technologies: Laser additive manufacturing and traditional technique. Procedia CIRP 2022, 105, 700–705. [Google Scholar] [CrossRef]
  99. Piili, H.; Happonen, A.; Väistö, T.; Venkataramanan, V.; Partanen, J.; Salminen, A. Cost Estimation of Laser Additive Manufacturing of Stainless Steel. In Physics Procedia; Elsevier: Amsterdam, The Netherlands, 2015; Volume 78, pp. 388–396. [Google Scholar]
  100. Priarone, P.C.; Pagone, E.; Martina, F.; Catalano, A.R.; Settineri, L. Multi-criteria environmental and economic impact assessment of wire arc additive manufacturing. CIRP Ann. 2020, 69, 37–40. [Google Scholar] [CrossRef]
  101. Campatelli, G.; Montevecchi, F.; Venturini, G.; Ingarao, G.; Priarone, P.C. Integrated WAAM-Subtractive Versus Pure Subtractive Manufacturing Approaches: An Energy Efficiency Comparison. Int. J. Precis. Eng. Manuf. Green Technol. 2020, 7, 1–11. [Google Scholar] [CrossRef]
  102. Macaulay, C.S. Fire Risks in Additive Manufacturing: Assessing 3D Printing & Combustible Dust Hazards [White Paper]. TÜV SÜD Global Risk Consultants. 2021. Available online: https://www.tuvsud.com/en-us/resource-centre/white-papers/fire-risks-in-additive-manufacturing (accessed on 3 July 2024).
  103. CCOHS Safety Hazards Additive Manufacturing. Available online: https://www.ccohs.ca/oshanswers/safety_haz/additive_manufacturing.html#section-3-hdr (accessed on 1 October 2023).
  104. Franchetti, M.; Kress, C. An economic analysis comparing the cost feasibility of replacing injection molding processes with emerging additive manufacturing techniques. Int. J. Adv. Manuf. Technol. 2017, 88, 2573–2579. [Google Scholar] [CrossRef]
  105. Feier, A.; Buta, I.; Florica, C.; Blaga, L. Optimization of Wire Arc Additive Manufacturing (WAAM) Process for the Production of Mechanical Components Using a CNC Machine. Materials 2023, 16, 17. [Google Scholar] [CrossRef]
  106. Romansky, R.P.; Hinov, N.L. Deterministic and Stochastic Approaches in Computer Modeling and Simulation; IGI Global: Hershey, PA, USA, 2023. [Google Scholar]
  107. Sharma, F.; Dixit, U.S. Fuzzy set based cost model of additive manufacturing with specific example of selective laser sintering. J. Mech. Sci. Technol. 2019, 33, 4439–4449. [Google Scholar] [CrossRef]
  108. Thomas, D. Costs, benefits, and adoption of additive manufacturing: A supply chain perspective. Int. J. Adv. Manuf. Technol. 2016, 85, 1857–1876. [Google Scholar] [CrossRef] [PubMed]
  109. Scott, A.; Harrison, T.P. Additive Manufacturing in an End-to-End Supply Chain Setting. 3D Print. Addit. Manuf. 2015, 2, 65–77. [Google Scholar] [CrossRef]
  110. Emelogu, A.; Marufuzzaman, M.; Thompson, S.M.; Shamsaei, N.; Bian, L. Additive manufacturing of biomedical implants: A feasibility assessment via supply-chain cost analysis. Addit. Manuf. 2016, 11, 97–113. [Google Scholar] [CrossRef]
  111. Luo, R.C.; Lan, C.C.; Tzou, J.H.; Chen, C.C. The development of WEB based e-commerce platform for rapid prototyping system. In Proceedings of the IEEE International Conference on Networking, Sensing and Control, Taipei, Taiwan, 21–23 March 2004; IEEE: New York, NY, USA, 2004; Volume 1, pp. 122–127. [Google Scholar]
  112. Di Angelo, L.; Di Stefano, P. Parametric cost analysis for web-based e-commerce of layer manufactured objects. Int. J. Prod. Res. 2010, 48, 2127–2140. [Google Scholar] [CrossRef]
  113. Lan, H.; Ding, Y. Price quotation methodology for stereolithography parts based on STL model. Comput. Ind. Eng. 2007, 52, 241–256. [Google Scholar] [CrossRef]
  114. Barclift, M.; Armstrong, A.; Simpson, T.W.; Joshi, S.B. CAD-Integrated Cost Estimation and Build Orientation Optimization to Support Design for Metal Additive Manufacturing. In Proceedings of the Volume 2A: 43rd Design Automation Conference, American Society of Mechanical Engineers, Cleveland, OH, USA, 6–9 August 2017; Volume 2A-2017. [Google Scholar]
  115. Dinda, S.; Modi, D.; Simpson, T.W.; Tedia, S.; Williams, C.B. Expediting Build Time, Material, and Cost Estimation for Material Extrusion Processes to Enable Mobile Applications. In Proceedings of the Volume 2A: 43rd Design Automation Conference, American Society of Mechanical Engineers, Cleveland, OH, USA, 6–9 August 2017; Volume 58127. [Google Scholar]
  116. Campbell, I.; Combrinck, J.; De Beer, D.; Barnard, L. Stereolithography build time estimation based on volumetric calculations. Rapid Prototyp. J. 2008, 14, 271–279. [Google Scholar] [CrossRef]
  117. Innes, J.; Mitchell, F. The application of activity-based costing in the United Kingdom’s largest financial institutions. Serv. Ind. J. 1997, 17, 190–203. [Google Scholar] [CrossRef]
  118. Xu, F.; Wong, Y.S.; Loh, H.T. Toward generic models for comparative evaluation and process selection in rapid prototyping and manufacturing. J. Manuf. Syst. 2001, 19, 283–296. [Google Scholar] [CrossRef]
  119. Ruffo, M.; Tuck, C.; Hague, R. Cost estimation for rapid manufacturing—Laser sintering production for low to medium volumes. Proc. Inst. Mech. Eng. Part B J. Eng. Manuf. 2006, 220, 1417–1427. [Google Scholar] [CrossRef]
  120. Allen, J. An Investigation into the Comparative Costs of Additive Manufacture vs. Machine from Solid for Aero Engine Parts. Cost Eff. Manuf. Net-Shape Process. 2006, 17, 17-1–17-10. [Google Scholar]
  121. Baumers, M.; Tuck, C.; Wildman, R.; Ashcroft, I.; Rosamond, E.; Hague, R. Combined build-time, energy consumption and cost estimation for direct metal laser sintering. In Proceedings of the 23rd Annual International Solid Freeform Fabrication Symposium—An Additive Manufacturing Conference, SFF 2012, Austin, TX, USA, 6–8 August 2012; pp. 932–944. [Google Scholar]
  122. Hur, S.M.; Choi, K.H.; Lee, S.H.; Chang, P.K. Determination of fabricating orientation and packing in SLS process. J. Mater. Process. Technol. 2001, 112, 236–243. [Google Scholar] [CrossRef]
  123. Kaplan, R.; Anderson, S. Time-Driven Activity Based Costing: A Simpler and More Powerful Path to Higher Profits. Harvard Business School Press: Boston, MA, USA, 2007. [Google Scholar]
  124. Rickenbacher, L.; Spierings, A.; Wegener, K. An integrated cost-model for selective laser melting (SLM). Rapid Prototyp. J. 2013, 19, 208–214. [Google Scholar] [CrossRef]
  125. Ingole, D.S.; Kuthe, A.M.; Thakare, S.B.; Talankar, A.S. Rapid prototyping—A technology transfer approach for development of rapid tooling. Rapid Prototyp. J. 2009, 15, 280–290. [Google Scholar] [CrossRef]
  126. Barclift, M.; Joshi, S.; Simpson, T.; Dickman, C. Cost modeling and depreciation for reused powder feedstocks in powder bed fusion additive manufacturing. In Proceedings of the Solid Freeform Fabrication 2016: Proceedings of the 27th Annual International Solid Freeform Fabrication Symposium—An Additive Manufacturing Conference, SFF 2016, Austin, TX, USA, 8–10 August 2016; University of Texas at Austin: Austin, TX, USA, 2016; pp. 2007–2028. [Google Scholar]
  127. Fera, M.; Fruggiero, F.; Costabile, G.; Lambiase, A.; Pham, D.T. A new mixed production cost allocation model for additive manufacturing (MiProCAMAM). Int. J. Adv. Manuf. Technol. 2017, 92, 4275–4291. [Google Scholar] [CrossRef]
  128. Yang, Y.; Li, L. Cost modeling and analysis for Mask Image Projection Stereolithography additive manufacturing: Simultaneous production with mixed geometries. Int. J. Prod. Econ. 2018, 206, 146–158. [Google Scholar] [CrossRef]
  129. Priarone, P.C.; Campatelli, G.; Montevecchi, F.; Venturini, G.; Settineri, L. A modelling framework for comparing the environmental and economic performance of WAAM-based integrated manufacturing and machining. CIRP Ann. 2019, 68, 37–40. [Google Scholar] [CrossRef]
  130. Ulu, E.; Huang, R.; Kara, L.B.; Whitefoot, K.S. Concurrent Structure and Process Optimization for Minimum Cost Metal Additive Manufacturing. J. Mech. Des. Trans. ASME 2019, 141, 061701. [Google Scholar] [CrossRef]
  131. Griffin, C.; Hale, J.; Jin, M. A framework for assessing investment costs of additive manufacturing. Prog. Addit. Manuf. 2022, 7, 903–915. [Google Scholar] [CrossRef]
  132. Mandolini, M.; Sartini, M.; Favi, C.; Germani, M. An Analytical Cost Model for Laser-Directed Energy Deposition (L-DED) BT—Advances on Mechanics, Design Engineering and Manufacturing IV; Gerbino, S., Lanzotti, A., Martorelli, M., Mirálbes Buil, R., Rizzi, C., Roucoules, L., Eds.; Springer International Publishing: Cham, Switzerland, 2023; pp. 993–1004. [Google Scholar]
  133. Shokrani, A.; Arrazola, P.; Biermann, D.; Mativenga, P.; Jawahir, I.S. Sustainable machining: Recent technological advances. CIRP Ann. 2024, 2. [Google Scholar]
Figure 1. Categorization of additive manufacturing processes for metallic materials according to ASTM standards.
Jmmp 08 00142 g001
Figure 2. The schematics of Metal Powder Bed Fusion process.
Jmmp 08 00142 g002
Figure 3. The schematics of powder-based and wire-based DED processes: (a) LENS process; (b) WAAM process.
Jmmp 08 00142 g003
Figure 4. Relation between deposition rate and layer thickness for typical PBF, powder-fed DED and wire-fed DED; SLM: Selective Laser Melting, SLS: Selective Laser Sintering, EBM: Electron Beam Melting, DMD: Direct metal melting, LENS: Laser Engineered Net Shaping, LMD: Laser Metal Deposition, EBF: Electron Beam Fabrication, WAAM: Wire-Arc Additive Manufacturing, CMT: Cold Metal Transfer, MIG: Metal Inert Gas.
Jmmp 08 00142 g004
Figure 5. Different viewpoints of cost classification. Adapted from [10].
Jmmp 08 00142 g005
Figure 6. Stage of AM production for whole life cost analysis.
Jmmp 08 00142 g006
Figure 7. Cost breakdown of AM metal parts with varying factors. Adapted from [85].
Jmmp 08 00142 g007
Figure 8. Progress in cost models for AM as a timeline.
Jmmp 08 00142 g008
Figure 9. Example curves of cost per part against production volume: (a) PBF; (b) DED.
Jmmp 08 00142 g009
Figure 10. Cost elements that can be included to obtain a comprehensive model.
Jmmp 08 00142 g010
Table 1. Comparison of PBF and DED technologies [51,60,61,63,64,65,66,67].
PropertiesPBF-LB (e.g., SLM, SLS)PBF-EB (e.g., EBM)Powder-Fed DED (e.g., LMD)Wire-Fed DED (e.g., WAAM)
Beam size20–100 μm100–200 μm0.5–3 mm0.9–1.2 mm (wire diameter)
Average density of fabricated parts99.53%99.5%99.4%99%
Layer thickness25–75 μm50–200 μm0.4–1 mm1.5 mm
Powder particle size10–45 μm45–106 μm50–150 μmNA
Surface finishRa 9–12 μmRa 25–35 μmRa 20–50 μmRa 200 μm
Melt pool dimension0.5–1.5 μm2–3 μm2–5 mm3–12 mm
Min. dimensional accuracy0.2–0.4 mm0.1–4 mm
Build volume<200 mm3, can reach 700 mm3Can reach above 8000 mm3
Table 2. Advantages and limitations of method-based classification techniques.
Method-Based Cost ClassificationAdvantagesLimitations
QualitativeIntuitive
-
Quick and flexible.
-
Easy comparison between projects.
-
Uncertainties can handled effectively.
-
Inconsistent and therefore not repeatable.
-
Prone to bias and error.
-
Nondeterministic.
Analogical
-
Quick access to historical data.
-
The origin of estimation is known by the user.
-
Alteration of existing data is subjective.
-
Limited change in cost variables.
QuantitativeParametric
-
Objective/repeatable due to statistical analysis.
-
Flexible customisation.
-
Lack of user experience.
-
Use of generic algorithms may affect the representation of reality.
Analytical
-
High accuracy due to the availability of cost driver information.
-
Large data required.
-
May not be suitable at design stage.
-
Requires technical expertise.
Table 3. Price comparison for 1 kg of different types of material feedstock.
Material FeedstockTitaniumInconel 718Stainless Steel 316
Wire—1–1.5 mm diameterUSD 92.5USD 114.53USD 39.9
Powder—AM GradeUSD 429USD 198USD 135
Disclaimer/Publisher’s Note: The statements, opinions and data contained in all publications are solely those of the individual author(s) and contributor(s) and not of MDPI and/or the editor(s). MDPI and/or the editor(s) disclaim responsibility for any injury to people or property resulting from any ideas, methods, instructions or products referred to in the content.

