Abstract
The laser welding of magnesium alloys presents challenges attributed to their low laser-absorbing efficiency, resulting in instabilities during the welding process and substandard welding quality. Furthermore, the complexity of signals during laser welding processes makes it difficult to accurately monitor the molten state of magnesium alloys. In this study, magnesium alloys were welded using near-infrared and blue lasers. By varying the power of the near-infrared laser, the energy absorption pattern of magnesium alloys toward the composite laser was investigated. The U-Net model was employed for the segmentation of welding images to accurately extract the features of the melt pool and keyhole. Subsequently, the penetrating states were predicted using the convolutional neural network (CNN), and the novel approach employing Local Binary Pattern (LBP) features + a backpropagation (BP) neural network was applied for comparison. The extracted images achieved MPA and MIoU values of 89.54% and 81.81%, and the prediction accuracy of the model can reach up to 100%. The applicability of the two monitoring approaches in different scenarios was discussed, providing guidance for the quality of magnesium welding.
1. Introduction
The laser welding of magnesium alloys is an important task in industry. The widespread recognition of magnesium alloys stems from their exceptional specific strength [1,2], thermal formability, and excellent machinability, rendering them highly valuable in various industrial applications such as the aerospace and automotive industries [3]. Laser welding, characterized by its high-energy density heat source, offers advantages including localized heating, a minimal heat-affected zone, and narrow weld seams, thus garnering considerable attention in the welding processing of magnesium alloys.
Research on magnesium alloy laser welding is currently in the developing stage, focusing primarily on parameter optimization, microstructure–property relationships, joint quality evaluation, welding defect control, and quality assurance. These efforts [4,5,6,7] aim to enhance welding quality and efficiency; to meet the demand for high-performance welding materials in aerospace, automotive manufacturing, electronics, and other fields; and to promote the widespread application and development of magnesium alloy laser welding technology. Some researchers [8,9] investigated hybrid near-infrared laser and blue laser welding and they found that hybrid welding could improve the laser absorption efficiency, thereby enhancing welding performance. Tang et al. [10] conducted welding experiments on copper–aluminum alloys using a 450 nm blue laser, investigating the characteristics of copper and aluminum melt pools in high-power blue laser welding and establishing the relationship between melt pool characteristics and weld seam quality. Yuan et al. [11] studied a 7075-T6 aluminum alloy and carbon fiber-reinforced polyether ether ketone as research materials, performing innovative comparative experiments on blue laser welding and fiber laser oscillation welding and explaining the laser welding mechanism. Zhou et al. [12] conducted welding experiments on a 6082 aluminum alloy using a blue laser with a wavelength of 455 nm and a near-infrared (NIR) laser with a wavelength of 1080 nm, systematically analyzing the physical phenomena of the two lasers during the welding process. It can be seen that most of these studies focused on aluminum alloys. Although magnesium alloys are also high-reflection materials, the research is limited by the more reactive nature of magnesium element.
Currently, magnesium alloys involved in laser welding are mainly Mg-Al-based, including deformable alloys such as AZ31 and AZ61 and cast alloys like AZ91 and AM60, which exhibit excellent welding performance with a weight percentage (w.t.) of Al ≤ 10%, resulting in grain refinement and improved weldability. Wang et al. [13] used a fiber laser operating at 2.5–4 kW to weld an AZ31B magnesium alloy, producing sound weld seams without macroscopic defects. The minimum tensile strength of the weld joint reached 227 MPa, equivalent to 94.6% of the base material. However, when the heat input control is <62.5 J/mm or ≥85.7 J/mm, porosity may be generated. Li et al. [14] conducted welding experiments on a 4 mm thick AZ31B magnesium alloy, observing changes in weld seam penetration depth, width, and formation with variations in processing parameters such as laser power, welding speed, and focus offset. Zhang et al. [15] modulated the frequency and amplitude of a laser in the welding of 3 mm AZ31B sheets and found that, compared with constant-power welding, welding with sinusoidal power could increase the size of the melt pool by increasing the energy coupling efficiency, thus enhancing the welding quality. Similarly, Jiang [16] discovered that in magnesium alloy laser melting welding, the energy coupling between the metal and laser largely depended on the time of the laser beam reflection within the keyhole. Power modulation helped increase this reflection time, thereby enhancing magnesium alloy laser absorption rate and penetration depth. Ning et al. [17] explored the influence of sub-atmospheric environments on low-wave processes, sub-atmospheric process parameters on weld formation, and welding stability under the sinusoidal modulation of laser power under sub-atmospheric conditions. Jiang et al. [18] applied vacuum laser welding technology to process an AZ31 magnesium alloy, symmetrically investigating the impact of environmental pressure on the weld seam surface appearance and the weld fusion cross-section. The research started with the enhancement of magnesium alloy welding stability through auxiliary facilities and then examined the influence of processing parameters on the quality of magnesium alloy laser welding.
However, comprehensive explanations of the mechanisms underlying signal variations in phenomena like melt pools and keyholes during magnesium alloy welding processes are still lacking, posing challenges to fully understanding the changes in the welding process. Due to the highly reactive and easily oxidizable nature of magnesium alloy materials, capturing the dynamic changes in phenomena such as keyholes and melt pools is challenging, hindering explanations for different manifestations of weld seams, melt pools, and keyholes under varying processing conditions. Developing a method to improve magnesium alloy laser absorption and welding stability would facilitate the analysis of these issues.
In recent years, advancements in deep learning and signal processing [19,20,21,22,23,24] have provided powerful tools for the analysis of welding processes. The integration of image segmentation techniques and deep learning algorithms offers the potential for the automated analysis of complex melt patterns, thereby providing solutions for welding processes that were previously challenging to tackle. Cai et al. [25] utilized the U-Net method to segment the acquired welding melt pool images, improving the efficiency of melt pool and keyhole segmentation recognition while significantly reducing the impact of factors such as lighting and spatter on segmentation results. Subsequently, they combined an optimized network structure with lightweight convolutional neural network (CNN) models with varying input image sizes to predict penetrating states. This research indicated that this monitoring approach exhibits strong robustness and generalization capabilities, with a prediction accuracy of 98.68%. Ai et al. [26] extracted regions of interest (ROIs) from fusion zone metallographic images and transformed them into grayscale images for filtering. They performed feature extraction on weld seam images of different materials including low-carbon steel (Q235) and stainless steel (316L) through a multi-threshold image segmentation method based on genetic algorithm (GA), seed region growing (SRG) with automatic seed selection, and RGB image segmentation based on Euclidean distance, achieving an error rate below 4%. Liu et al. [27] focused on the melt pool signals in aluminum alloy laser welding processes, utilizing image segmentation to extract melt pool and keyhole regions. They constructed a hyperparameter-optimized data-driven deep learning model through hyperparameter optimization to identify various penetration states with high accuracy and reliability.
This paper evaluates the weld appearance and quality of an AZ31 magnesium alloy by assessing the morphology of the melt pool and keyhole during the welding process. A composite welding approach using near-infrared and blue lasers was employed as an auxiliary means to enhance the welding stability. Using the U-Net model for welding image segmentation, characteristic information from the melt pool and keyhole could be extracted effectively. The penetration state of the magnesium alloy under the composite welding mode was predicted using a CNN model and a LBP+BP model. The research results show that varying the processing power of the near-infrared laser led to different states in the images of the melt pool and keyhole in magnesium alloy, namely under-penetrated (UP), fully penetrated (FP), and excessive-penetrated (EP) states. The effective evaluation and prediction of welding quality can be achieved by monitoring and assessing these three penetration states.
2. Materials and Methods
2.1. Experimental Setup
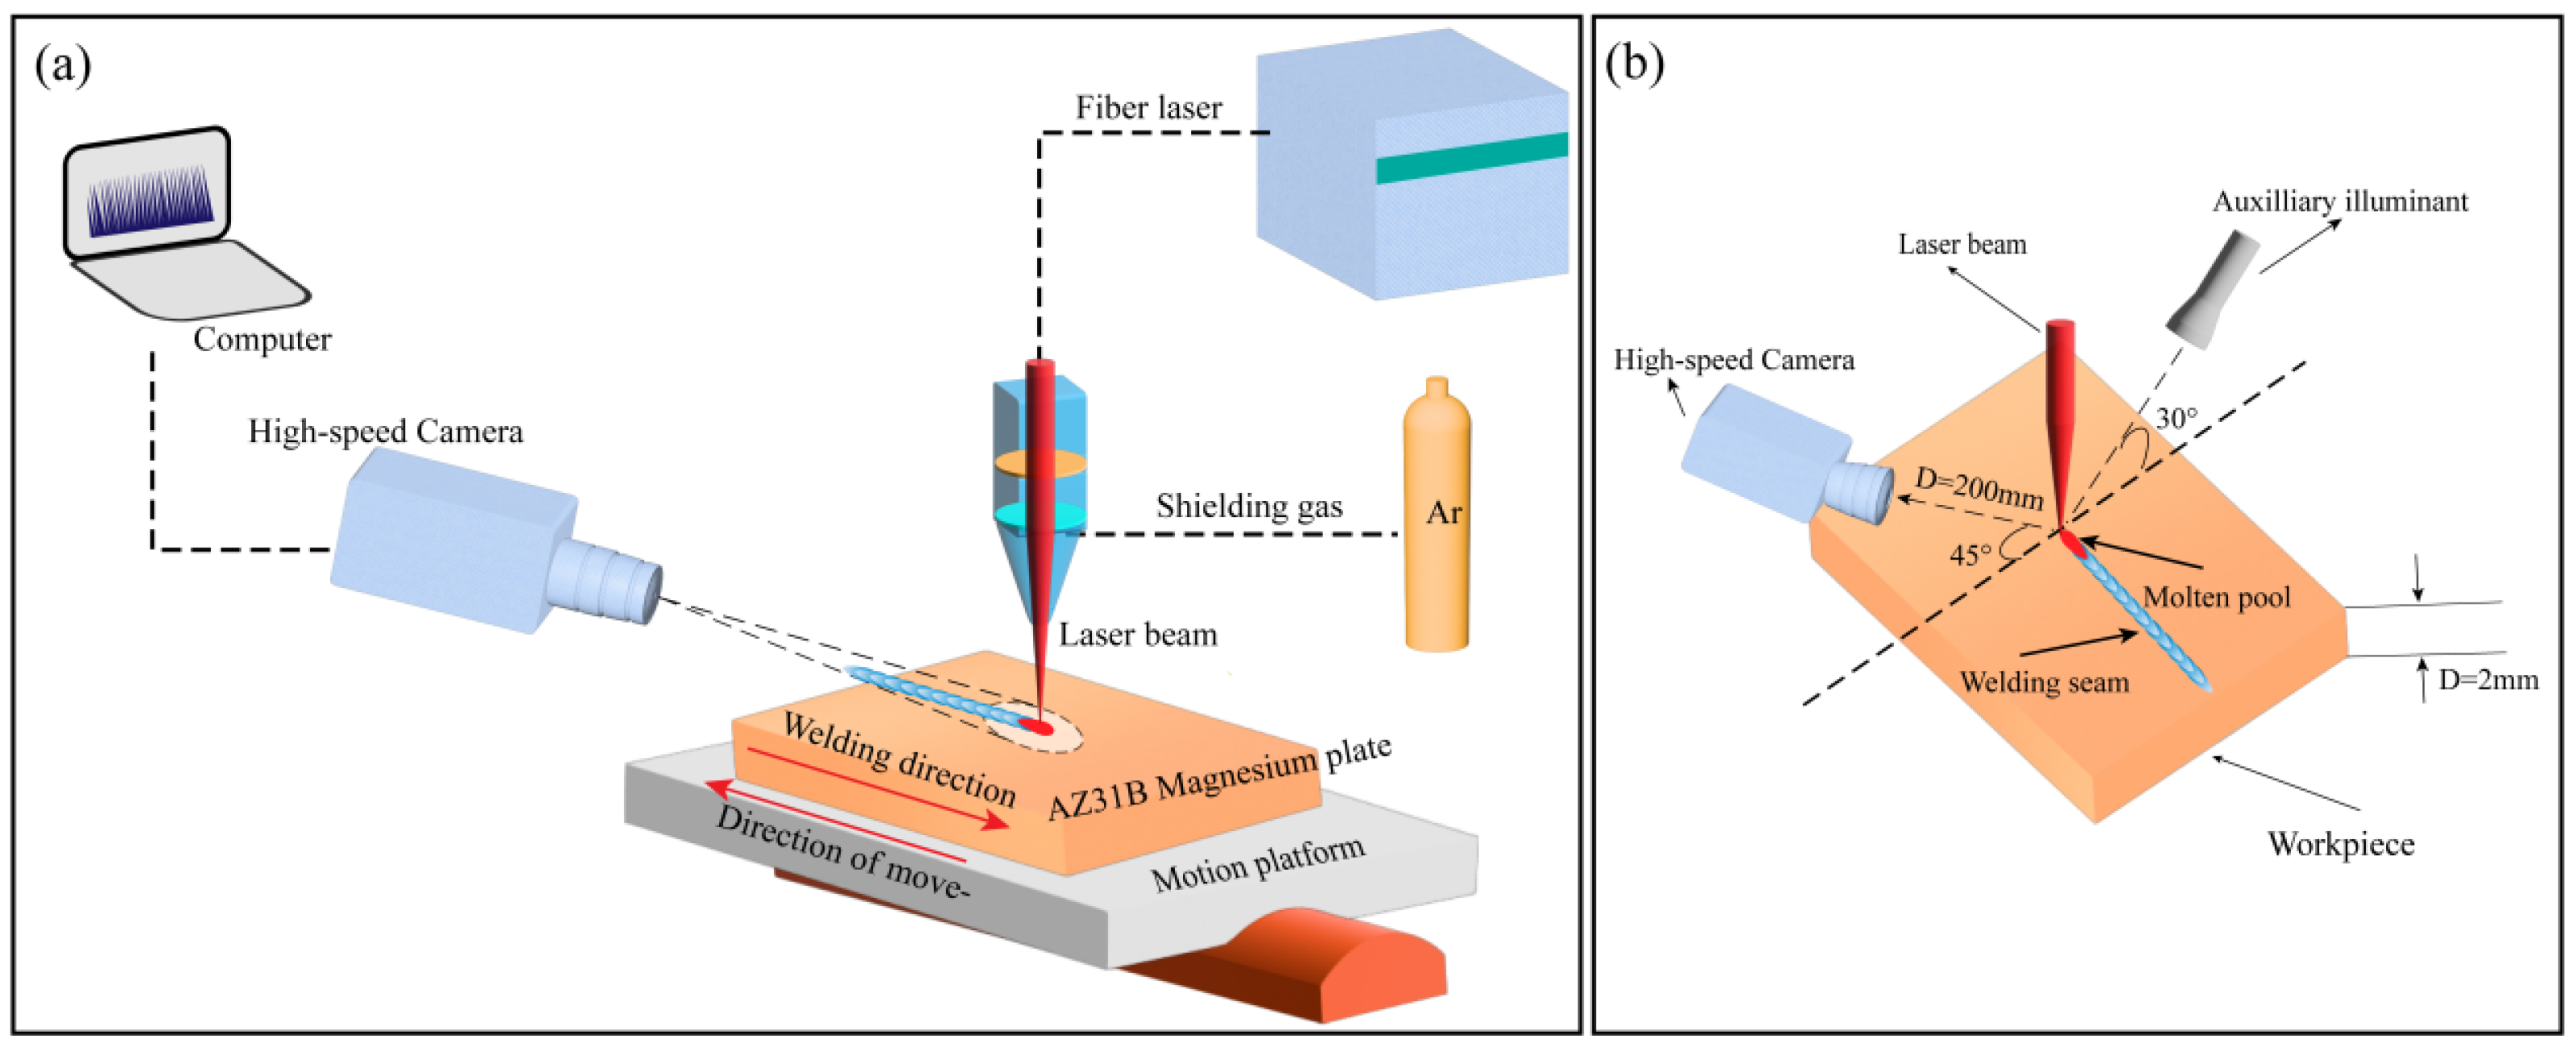
Table 1 displays the chemical elemental composition of the AZ31B magnesium alloy used in the experiment. Figure 1a depicts the red-blue composite laser welding and monitoring system. A 2 mm thick magnesium alloy plate was used, as shown in Figure 1b. The blue laser system employed the United Winners UW1000 blue semiconductor laser(Shenzhen United Winners Laser Co., Ltd., Shenzhen, China), with a peak power of 1000 W, an 800 µm fiber diameter, and a wavelength of 455 nm. The near-infrared laser system utilized the Raycus RFL-C6000X laser (Wuhan Raycus Fiber Laser Technologies Co., Ltd., Wuhan, China), with a peak power of 6000 W. The laser was transmitted through a 200 µm diameter and 1080 nm wavelength fiber to the laser welding head, which was equipped with a focusing lens with a focal length of 100 mm for collimation and 150 mm for focusing. The beam diameter on the focusing plane for the blue laser was 1.2 mm and for the near-infrared laser, this was 0.3 mm. The welding platform provided a maximum welding speed of 40 mm/s, and the pre-treated workpieces were fixed using fixtures to ensure a level welding surface and consistent focus. A protective argon gas system was employed with a pressure setting of 0.4 MPa. A high-speed camera (Revealer X213M, Hefei Agile Device Co., Ltd., Hefei, China, capable of up to 10,000 fps) and a pulsed laser auxiliary light source were installed on one side of the welding system to monitor the melt pool and keyhole. The high-speed camera was equipped with a filter and protective lenses matching the wavelength of the auxiliary light source to filter out optical noise generated by the welding process, plasma, and laser beam. Images were captured at a rate of 1000 fps, with a resolution of 1280 × 1024.

Table 1.
Chemical compositions of AZ31 magnesium alloy (wt %).

Figure 1.
Schematic of the laser welding platform and the monitoring system. (a) Schematic diagram of welding and monitoring system, (b) Schematic diagram of installation location of equipment and samples.
2.2. Penetration State Definition
In this study, the melting states were classified into three categories, namely I, II, and III, corresponding to the under-penetrated (UP), fully penetrated (FP), and excessive-penetrated (EP) states, respectively. As illustrated in Figure 2, the two regions in the monitoring images (the green dashed line) represent the overall melt pool area (the bigger one) and the keyhole area (the smaller one), respectively.
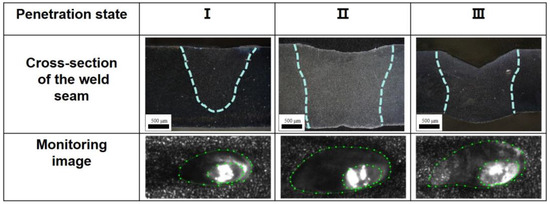
Figure 2.
Cross-sectional images and monitoring images of the weld in the three penetration states. I, II, and III, corresponding to the UP, FP, and EP states, The dashed line represents the weld edge of the welded sample cross-section, and the green dotted line represents the weld pool and keyhole edge tracks manually marked in the monitoring image.
2.3. Overview of the Proposed Monitoring Architecture
An overview of the proposed melt penetration state monitoring method is presented in Figure 3, which primarily includes two components based on deep learning: image semantic segmentation using U-Net and penetration state prediction based on CNN. The U-Net model segmented the real-time captured monitoring images to extract the melt pool and keyhole, which were then analyzed using a trained CNN model to predict the corresponding penetration state. It was observed in the experiments that changes in the power of the composite laser led to different welding states of the magnesium alloy material, resulting in variations in the width, depth, and shape of the magnesium alloy weld seam. Correspondingly, changes were observed in both the melt pool and keyhole. The relationship between the monitoring signals from the melt pool and keyhole and the welding seam and melting states of the magnesium alloy will be further investigated.
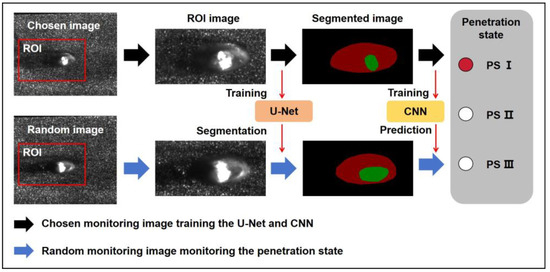
Figure 3.
Overview of the state monitoring method. In the segmented image, the red area represents the molten pool and the green area represents the keyhole.
3. Results and Discussion
3.1. Weld Morphology at Different Laser Powers
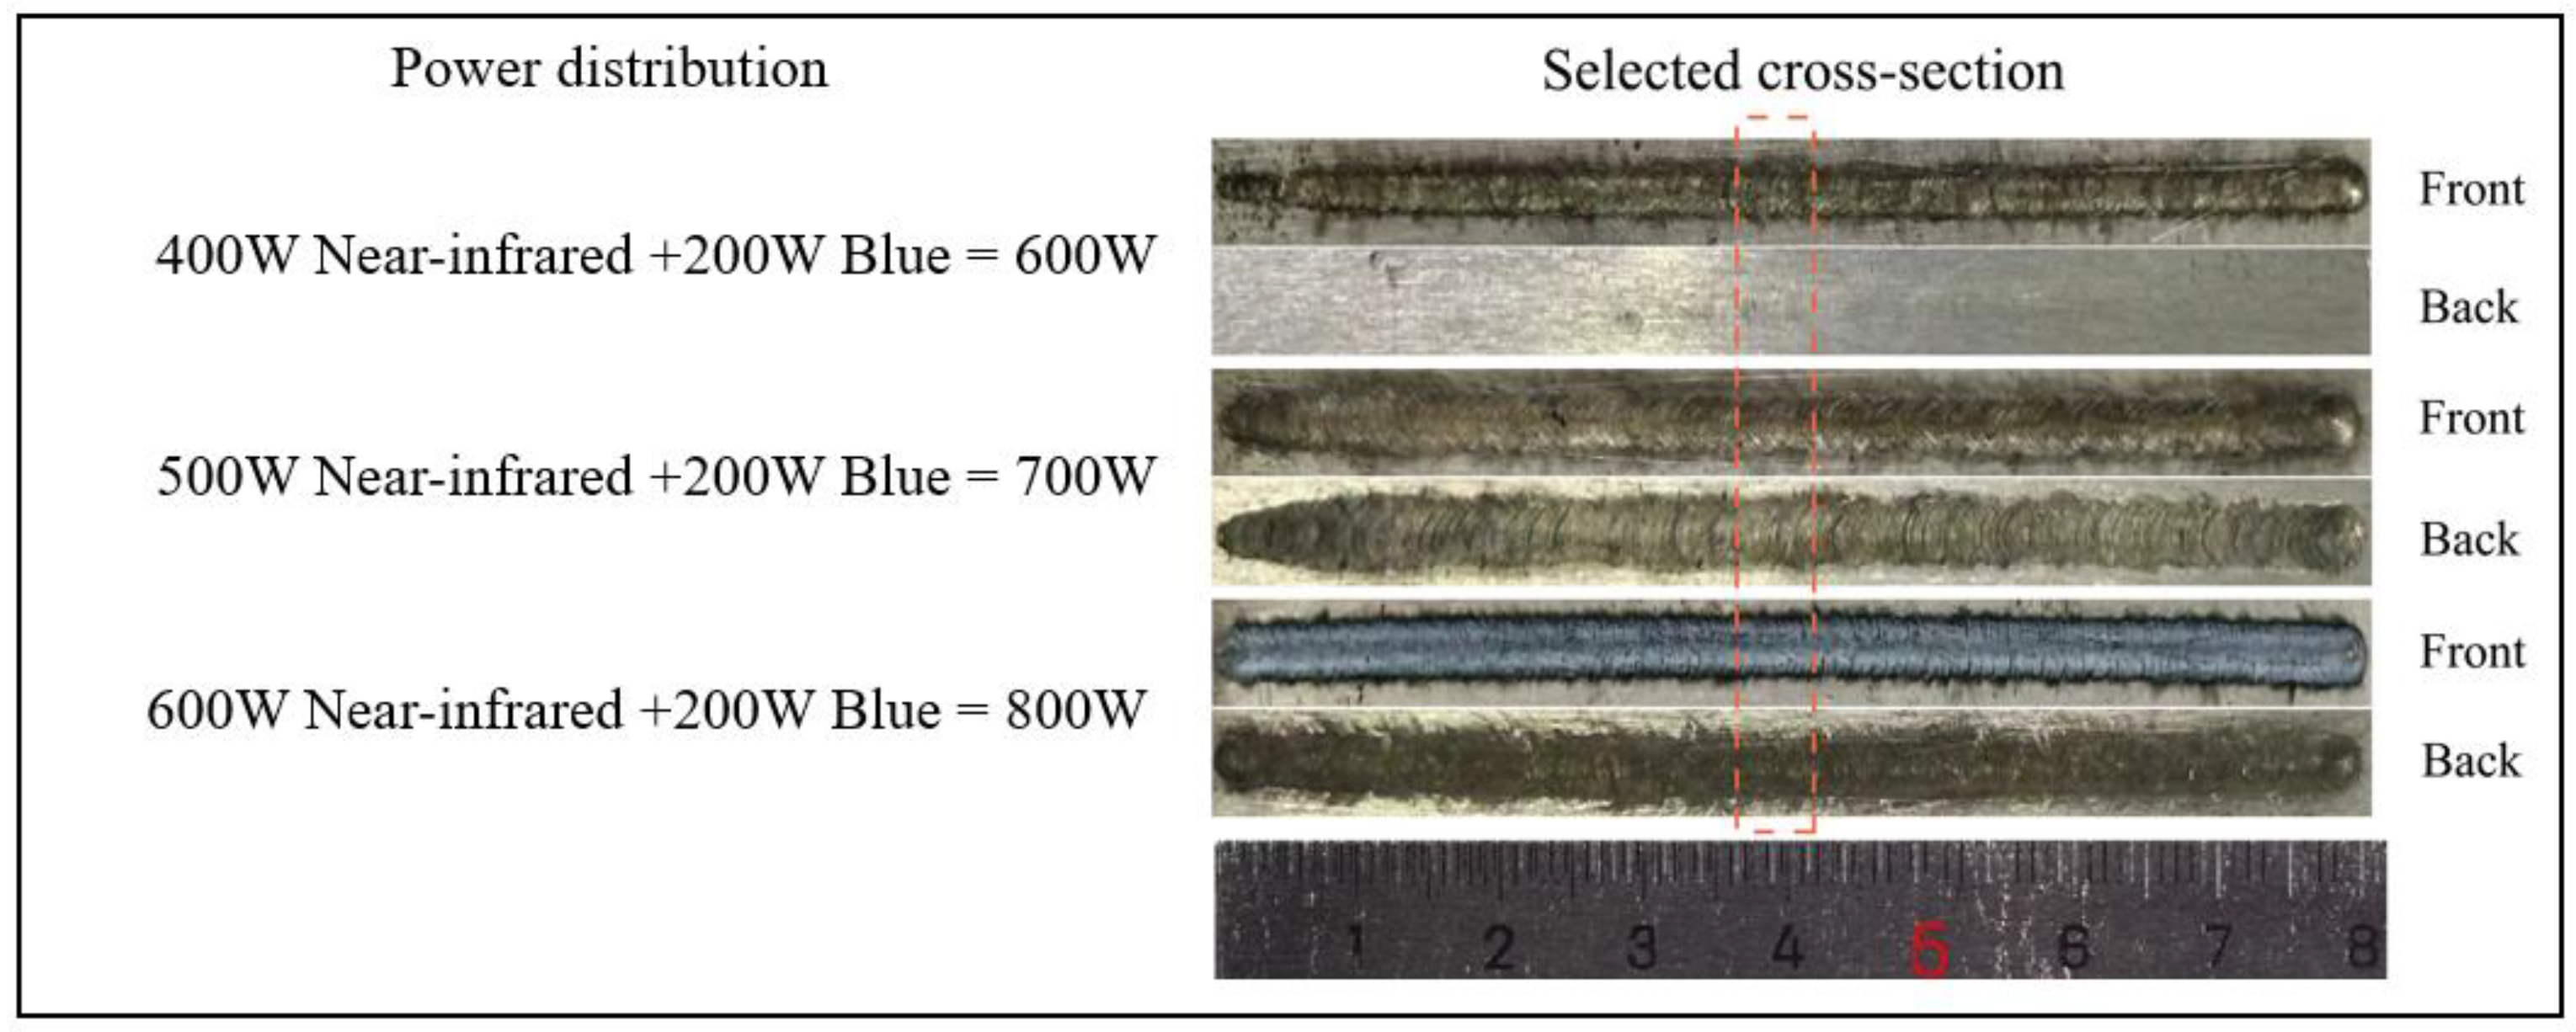
Under a fixed welding speed of 15 mm/s and zero defocus distance, different combinations of infrared-blue laser powers were used to conduct welding experiments on the AZ31B magnesium alloy. Figure 4 illustrates the morphology of weld seam performance at different laser powers, where the powers presented in the figures are the sum of the infrared laser and the blue laser (fixed at 200 W). When the near-infrared laser power was set at 400 W, the weld seam on the surface of the magnesium alloy material appeared shallow, with no visible weld seam on the back, indicating that the material was under-penetrated. Correspondingly, the melt pool area and the depth of the keyhole were relatively small. As the near-infrared laser power increased to 500 W, the width and depth of the weld seam on the surface of the magnesium alloy material increased, and a noticeable weld seam appeared on the back, indicating that the material had reached a fully penetrated state. The melt pool area significantly increased, and the depth of the keyhole also increased. When the near-infrared laser power further increased to 600 W, the width and depth of the weld seam on the surface of the magnesium alloy material decreased compared to the fully penetrated state. The color of the weld seam surface changed noticeably from dark gray to white, and a bulge appeared on the back of the weld seam. The area of the melt pool monitoring image decreased compared to the fully penetrated state, indicating that the magnesium alloy material had reached an excessive-penetrated state. These results suggest that changes in laser thermal input in the red-blue composite mode exhibit strong regulation capabilities over the melt pool and keyhole during the magnesium alloy welding process, thereby influencing the formation of the magnesium alloy weld seam.
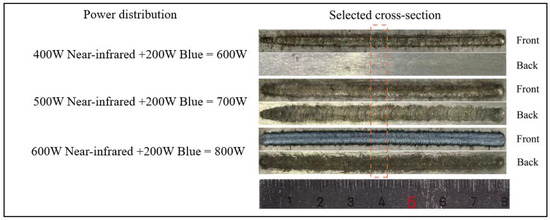
Figure 4.
The morphology of welding seams at different laser powers. The red dashed lines correspond to each section in Figure 2.
3.2. Data Processing
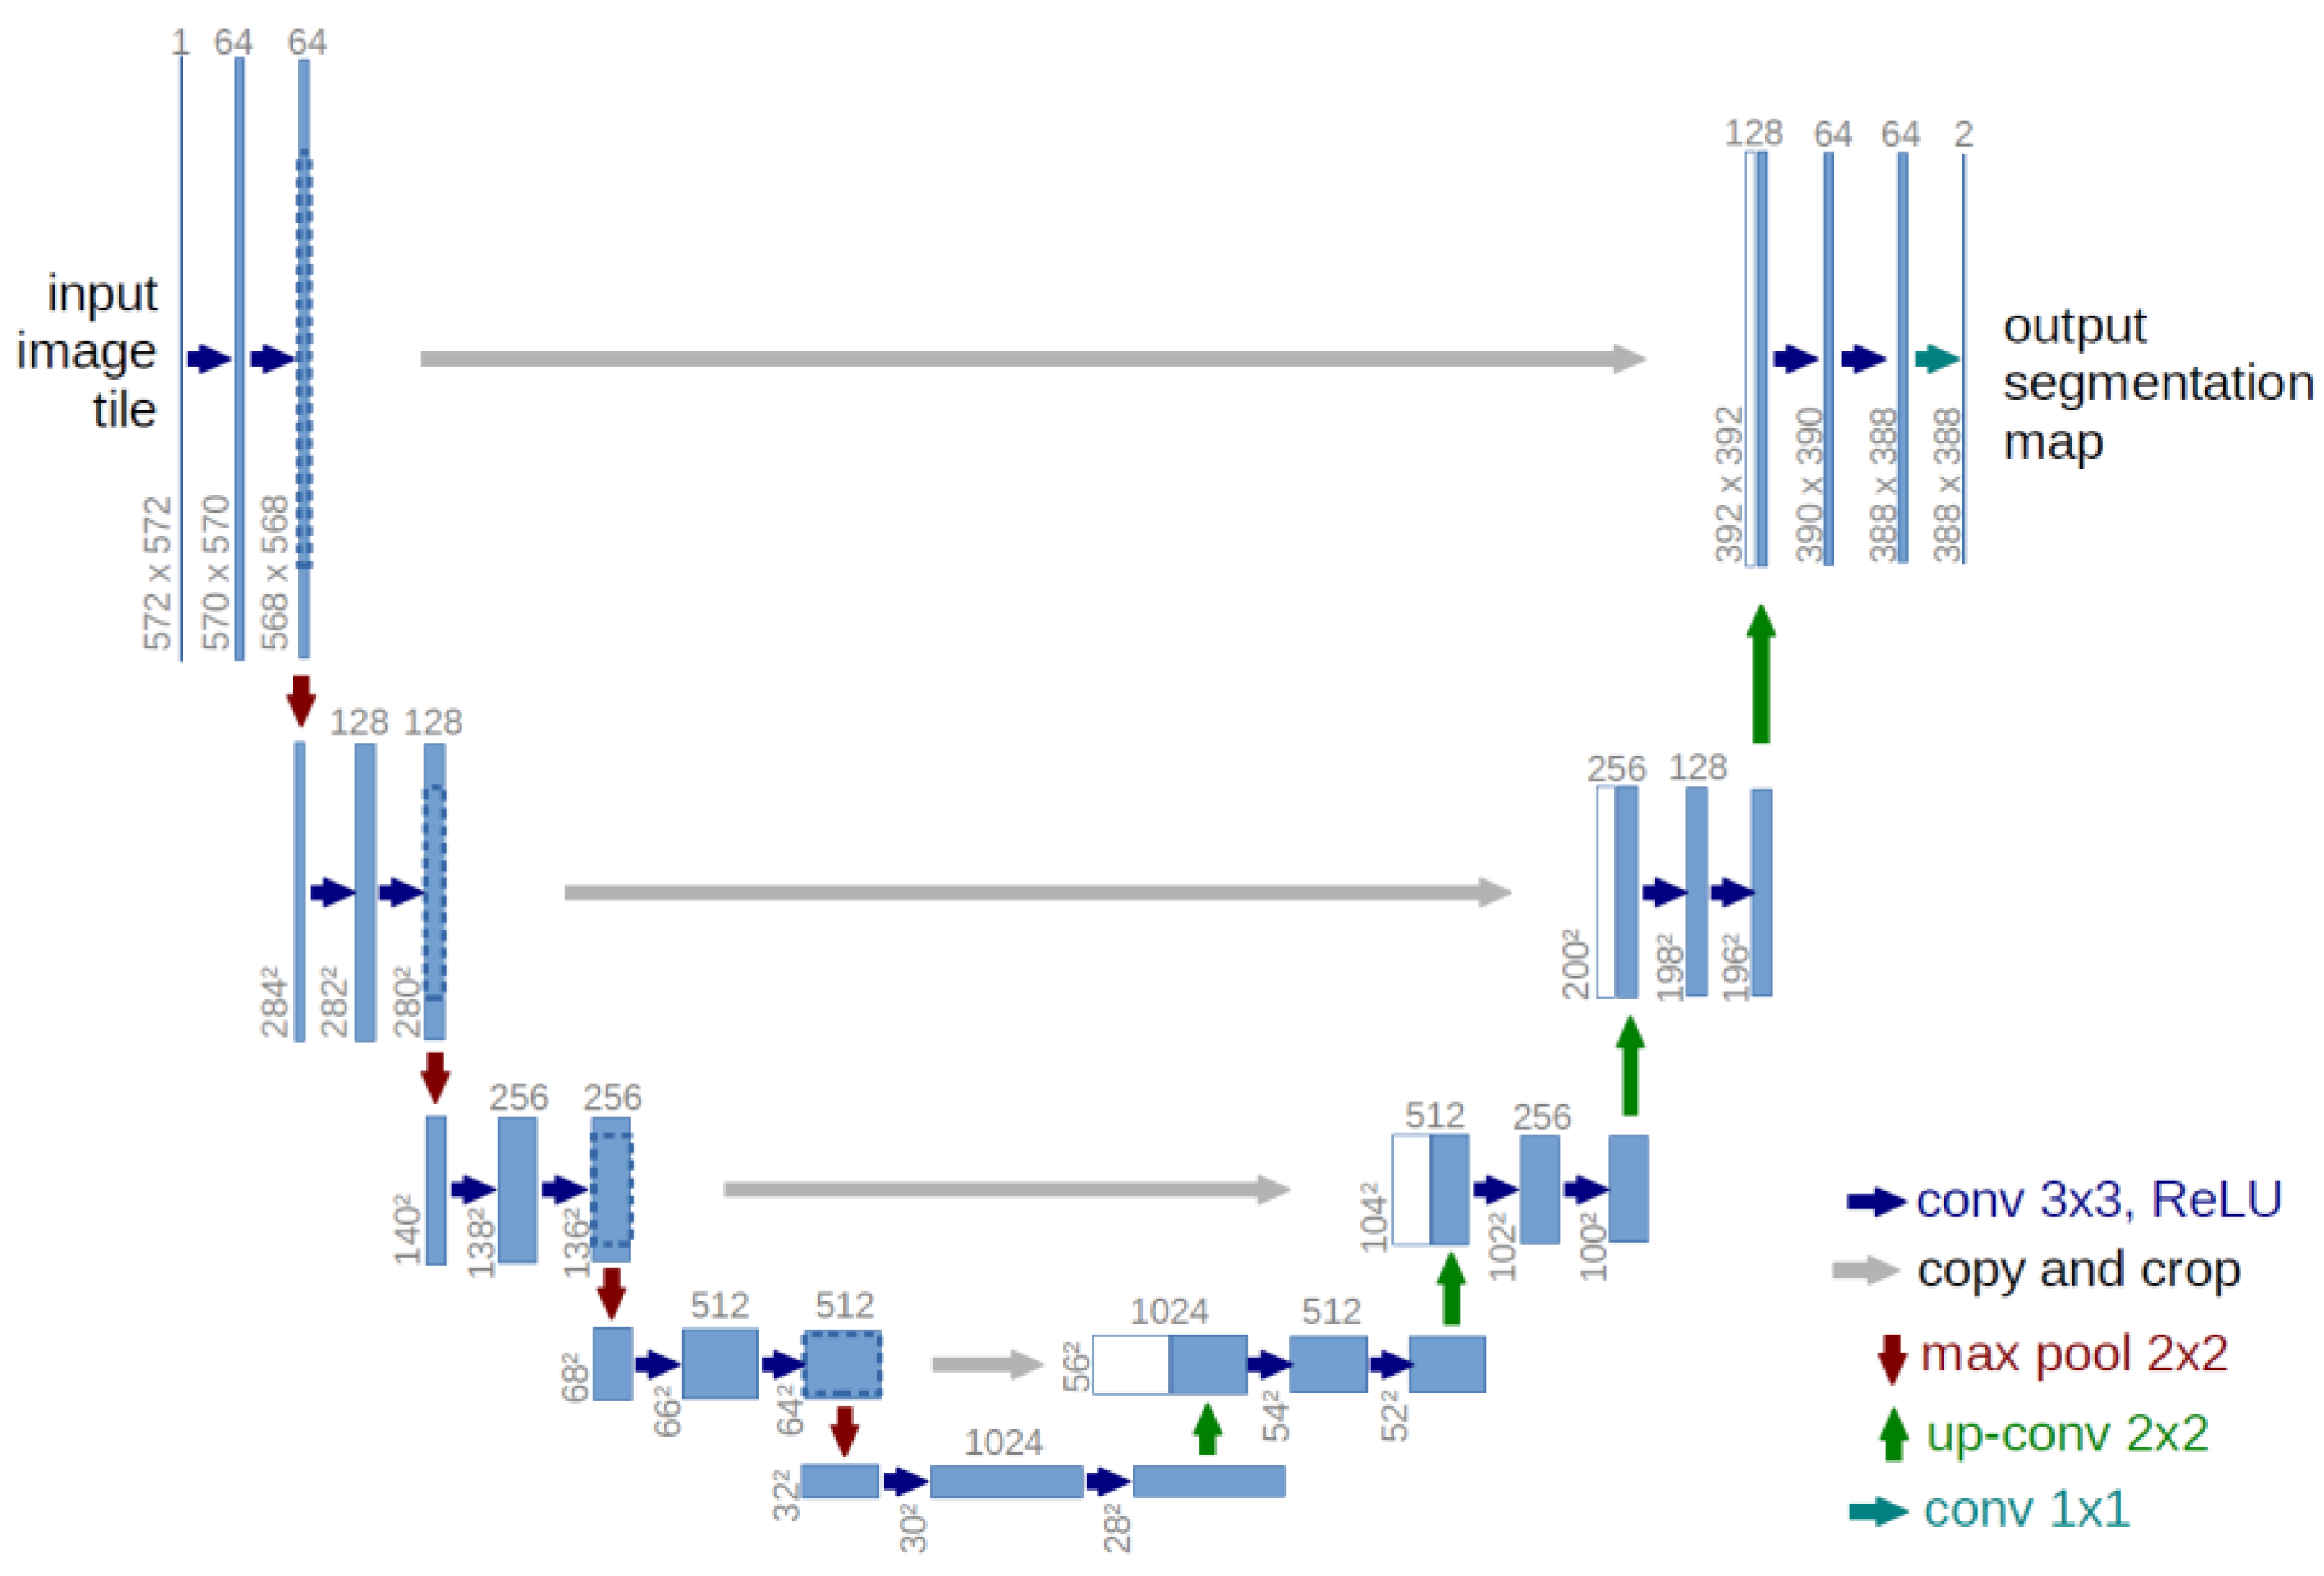
The U-Net is a deep learning architecture used for image segmentation, initially proposed by Olaf Ronneberger et al. in 2015 [28]. The overall structure is illustrated in Figure 5, and this architecture is based on the fully convolutional network (FCN) with a series of improvements, primarily employed in medical image segmentation tasks such as organ segmentation in medical imaging. The design inspiration for U-Net stems from the full convolutional networks and encoder–decoder structures in the field of image segmentation. The core idea of the fully convolutional network is to transform traditional convolutional neural networks into a fully convolutional structure, allowing for the acceptance of input images of any size and the outputting of segmented images of the same size. The encoder–decoder structure achieves the mapping from input images to output segmented images through hierarchical feature extraction and upsampling operations. The fundamental principle of U-Net can be divided into two key parts: the encoder and the decoder. The encoder gradually reduces the spatial size of the input image and extracts features, typically composed of a series of convolutional and pooling layers. In U-Net, after each convolution operation, the number of channels of the feature map increases while the spatial size decreases, enabling the gradual extraction of high-level semantic information from the image. The role of the decoder is to upsample the extracted feature maps from the encoder, perform feature fusion and output the segmentation result. The decoder usually consists of upsampling and convolution layers. In U-Net, upsampling operations typically use transpose convolution or upsampling combined with convolution to increase the size of the feature maps and fuse low-level and high-level features from the encoder through skip connections. These skip connections facilitate the network in better locating fine features, thereby improving segmentation accuracy. During the training process, U-Net commonly employs pixel-level loss functions (such as cross-entropy loss or Dice loss) to measure the difference between the predicted segmented image and the ground truth segmented image. This difference is minimized through backpropagation and gradient descent algorithms to update network parameters, gradually approaching the real segmented image and achieving accurate image segmentation.
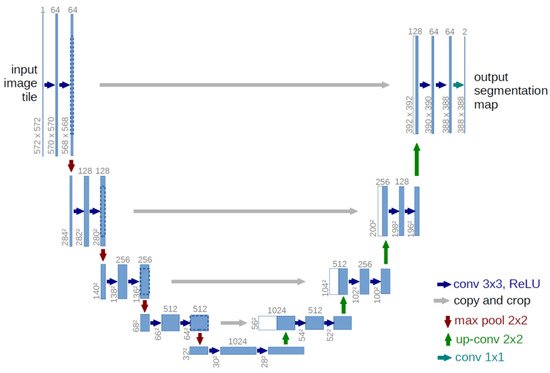
Figure 5.
U-Net architecture [21].
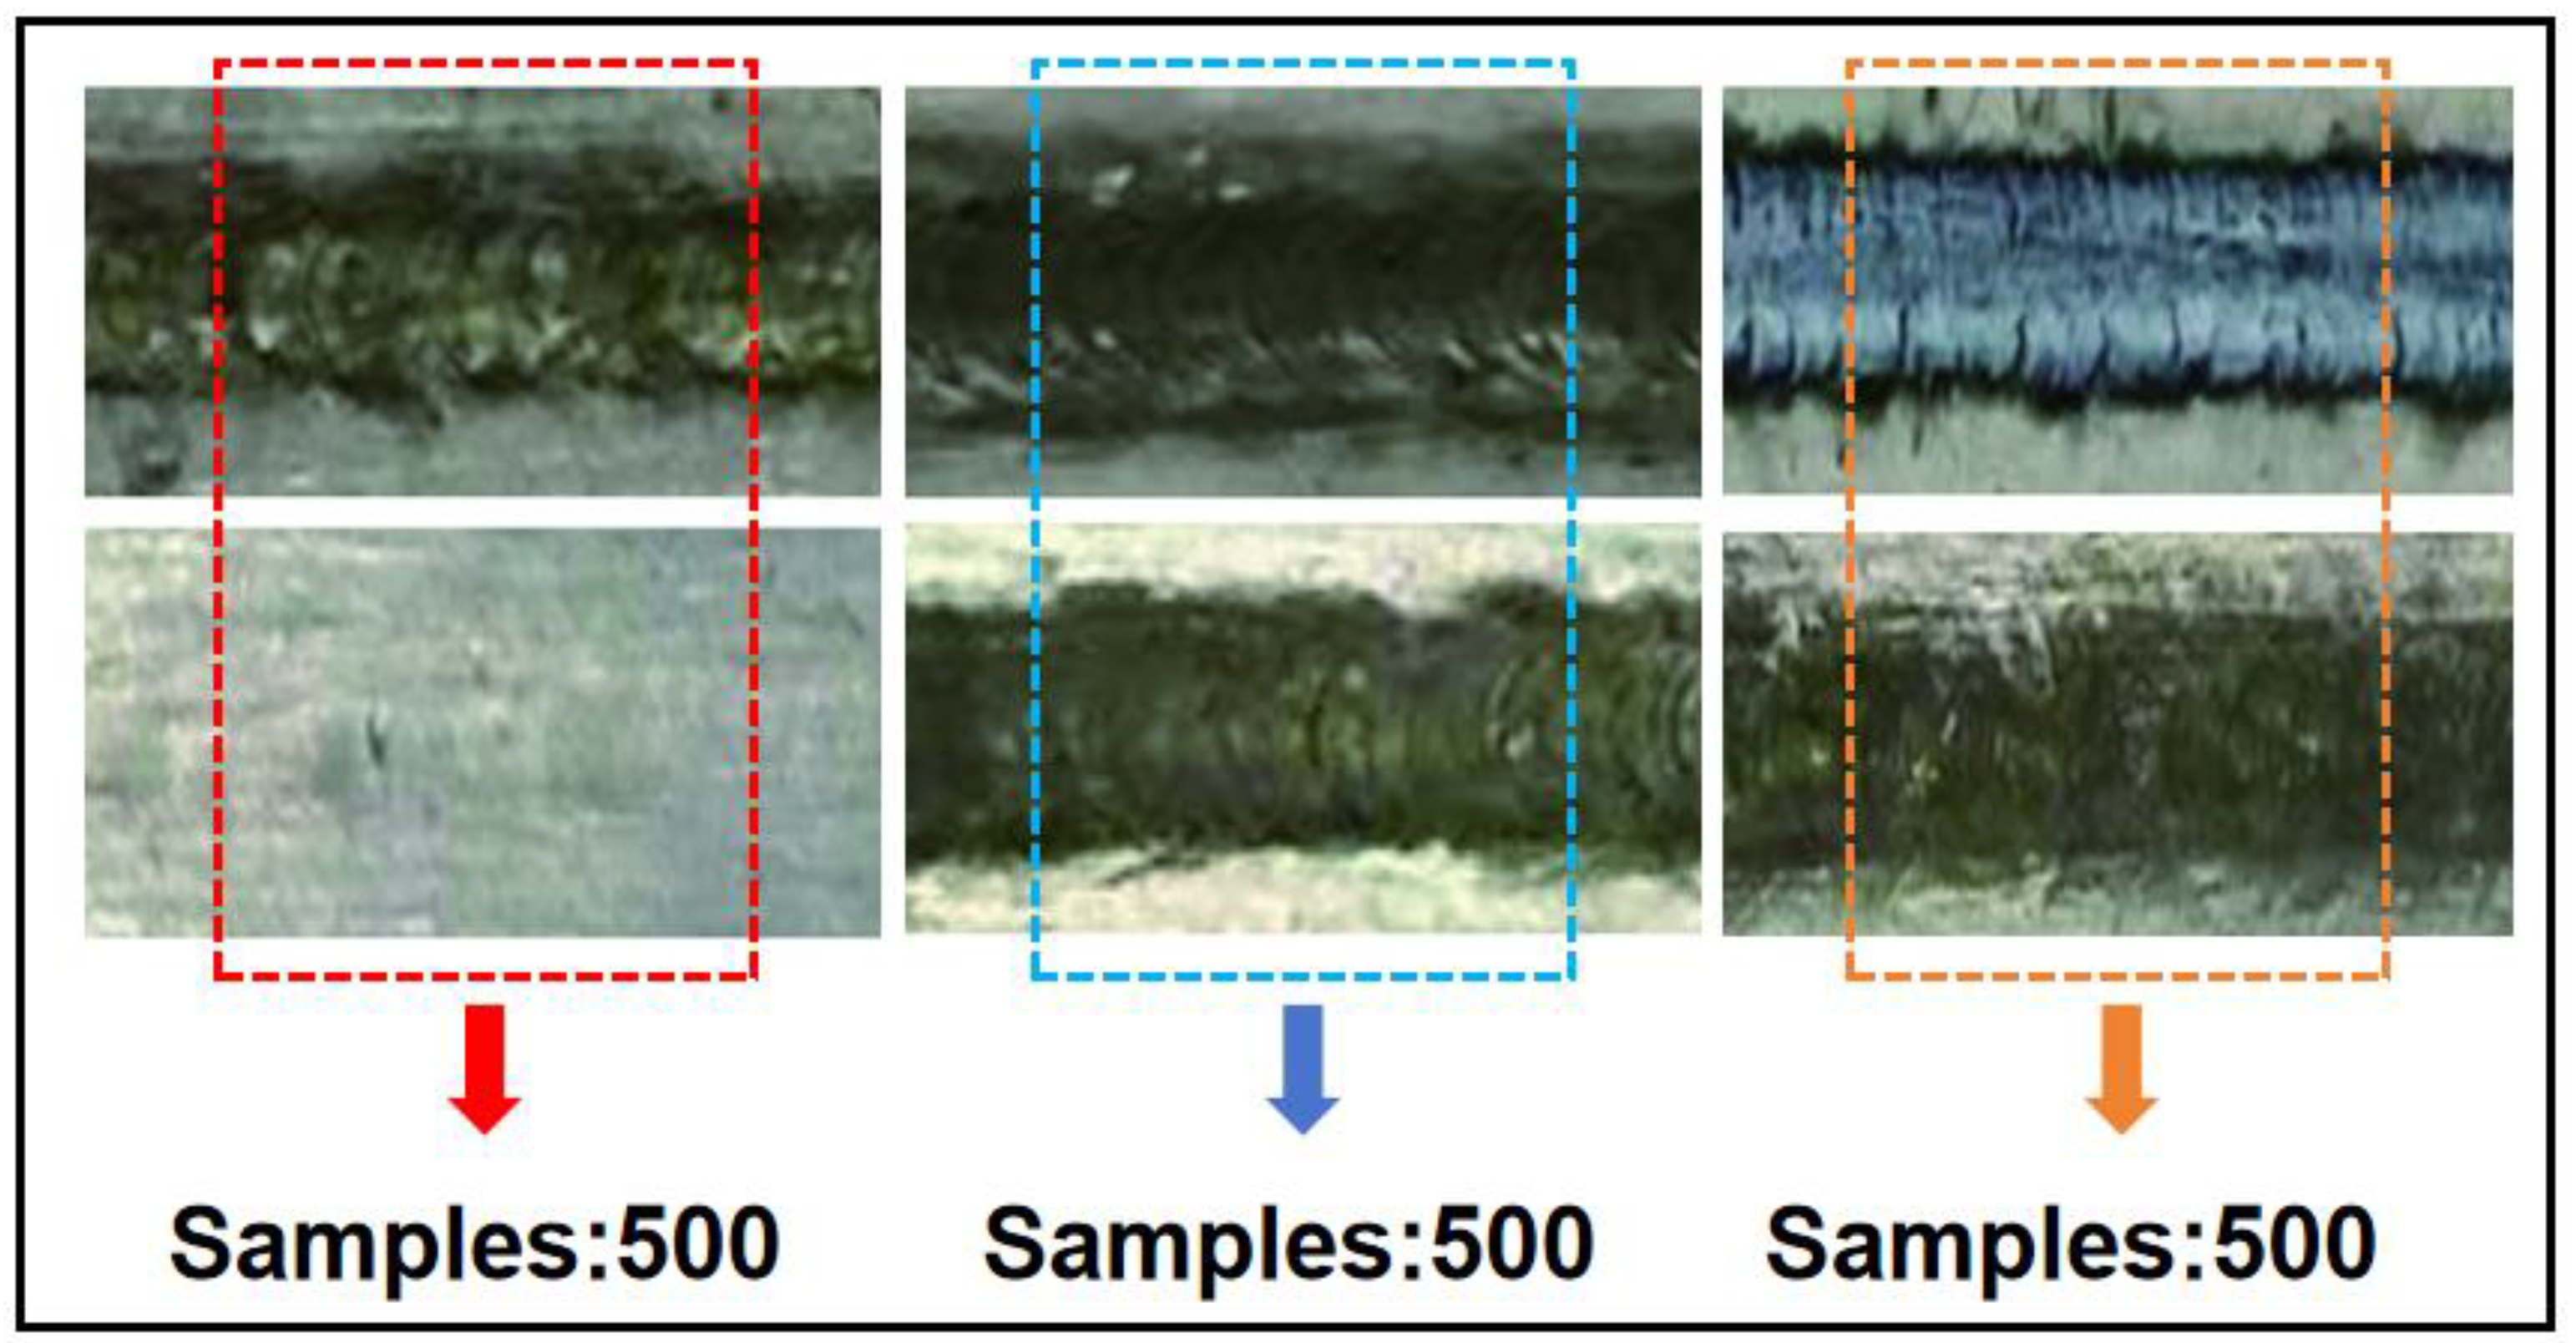
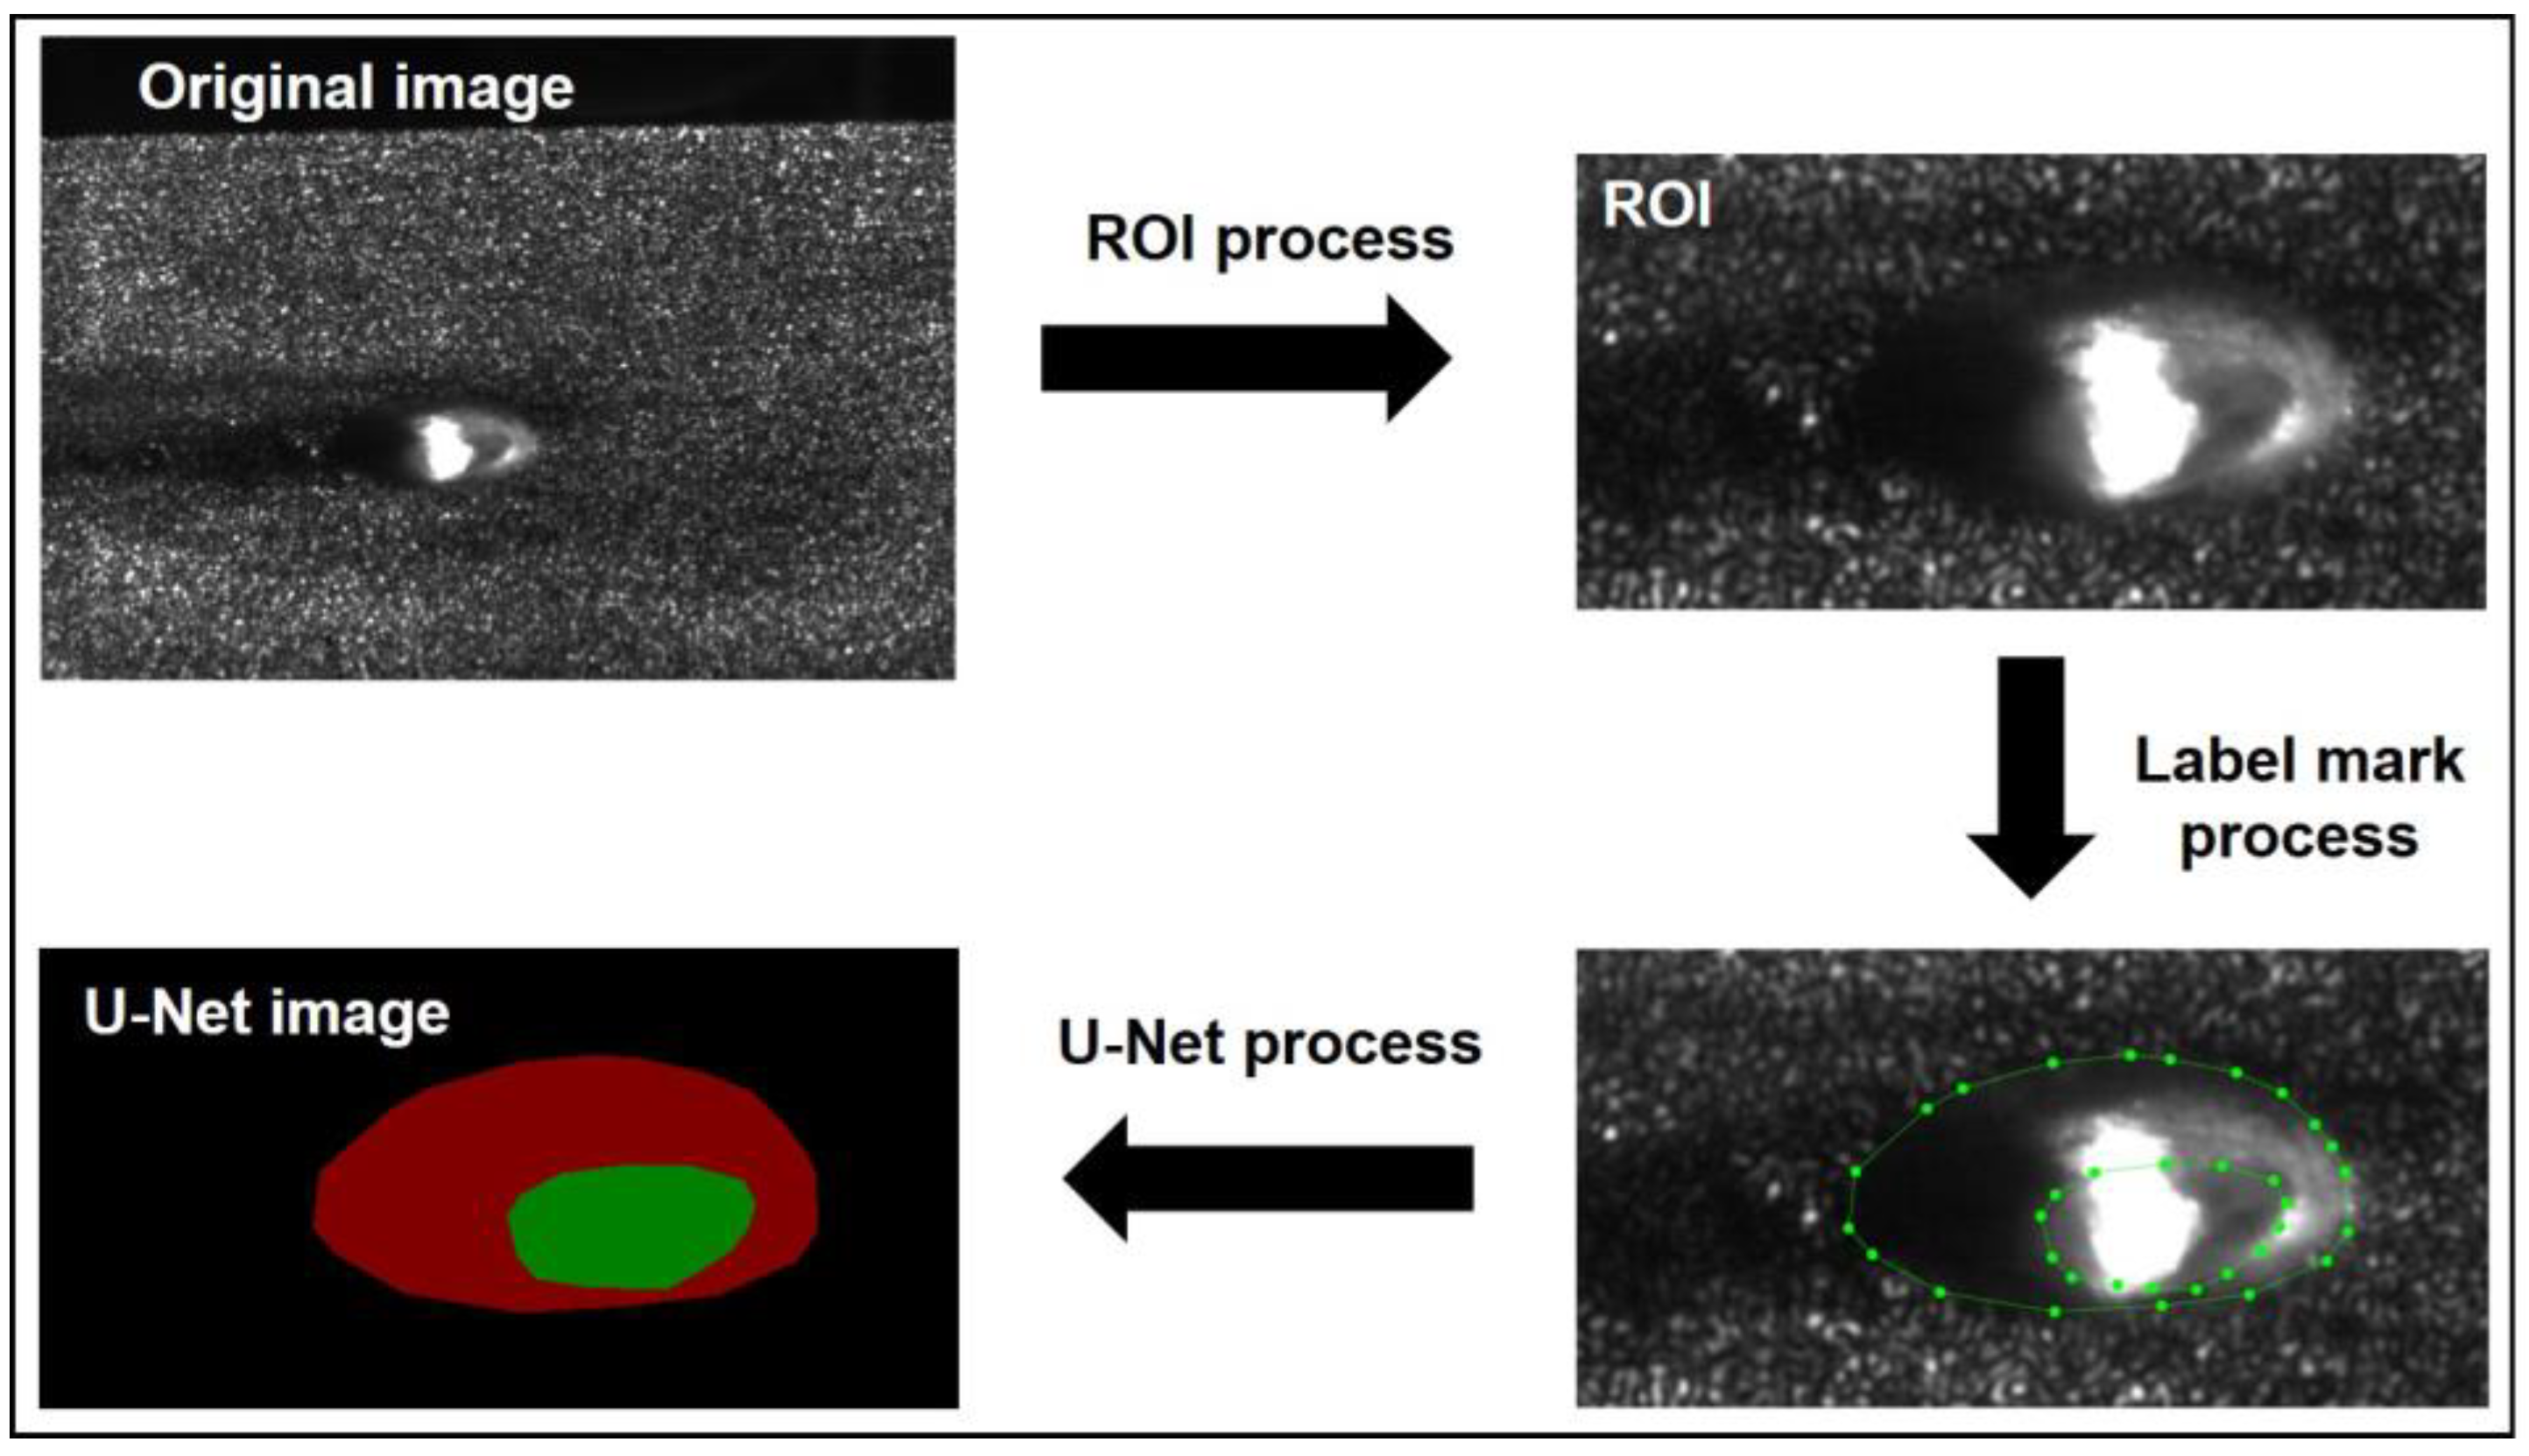
Figure 6 presents the weld seam images of the magnesium alloy obtained under different combinations of near-infrared laser and blue laser powers at a welding speed of 15 mm/s. During the welding process, over 4000 images were acquired. After excluding transitional images at the beginning and end of the welding stages, 1500 images were included in the dataset, with 500 images processed for each condition. Due to the high resolution of the original monitoring images (1280 × 1024 pixels) and the small size of the melt pool area, the preprocessing of the original images was conducted as shown in Figure 7. Initially, the images were cropped to regions of interest (ROIs); this was followed by processing the ROI images using LabelMe to obtain label data. Then, 90% of the label data was chosen as the training set for the U-Net model, while the remaining 10% was utilized as the validation set. Finally, after training the U-Net model, the classification of targets in the input images was divided into three categories: keyhole, melt pool, and background.
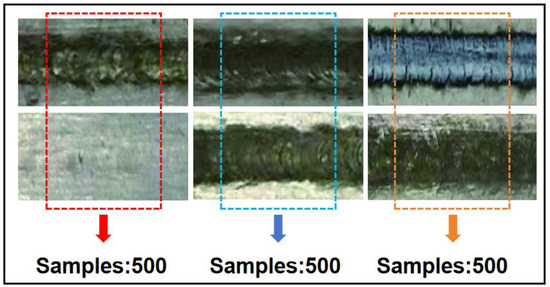
Figure 6.
The weld seam position distribution and the number of sample images of the dataset.

Figure 7.
U-Net image processing flow. The green dots lines are manually marked weld pool and keyhole edge tracks.
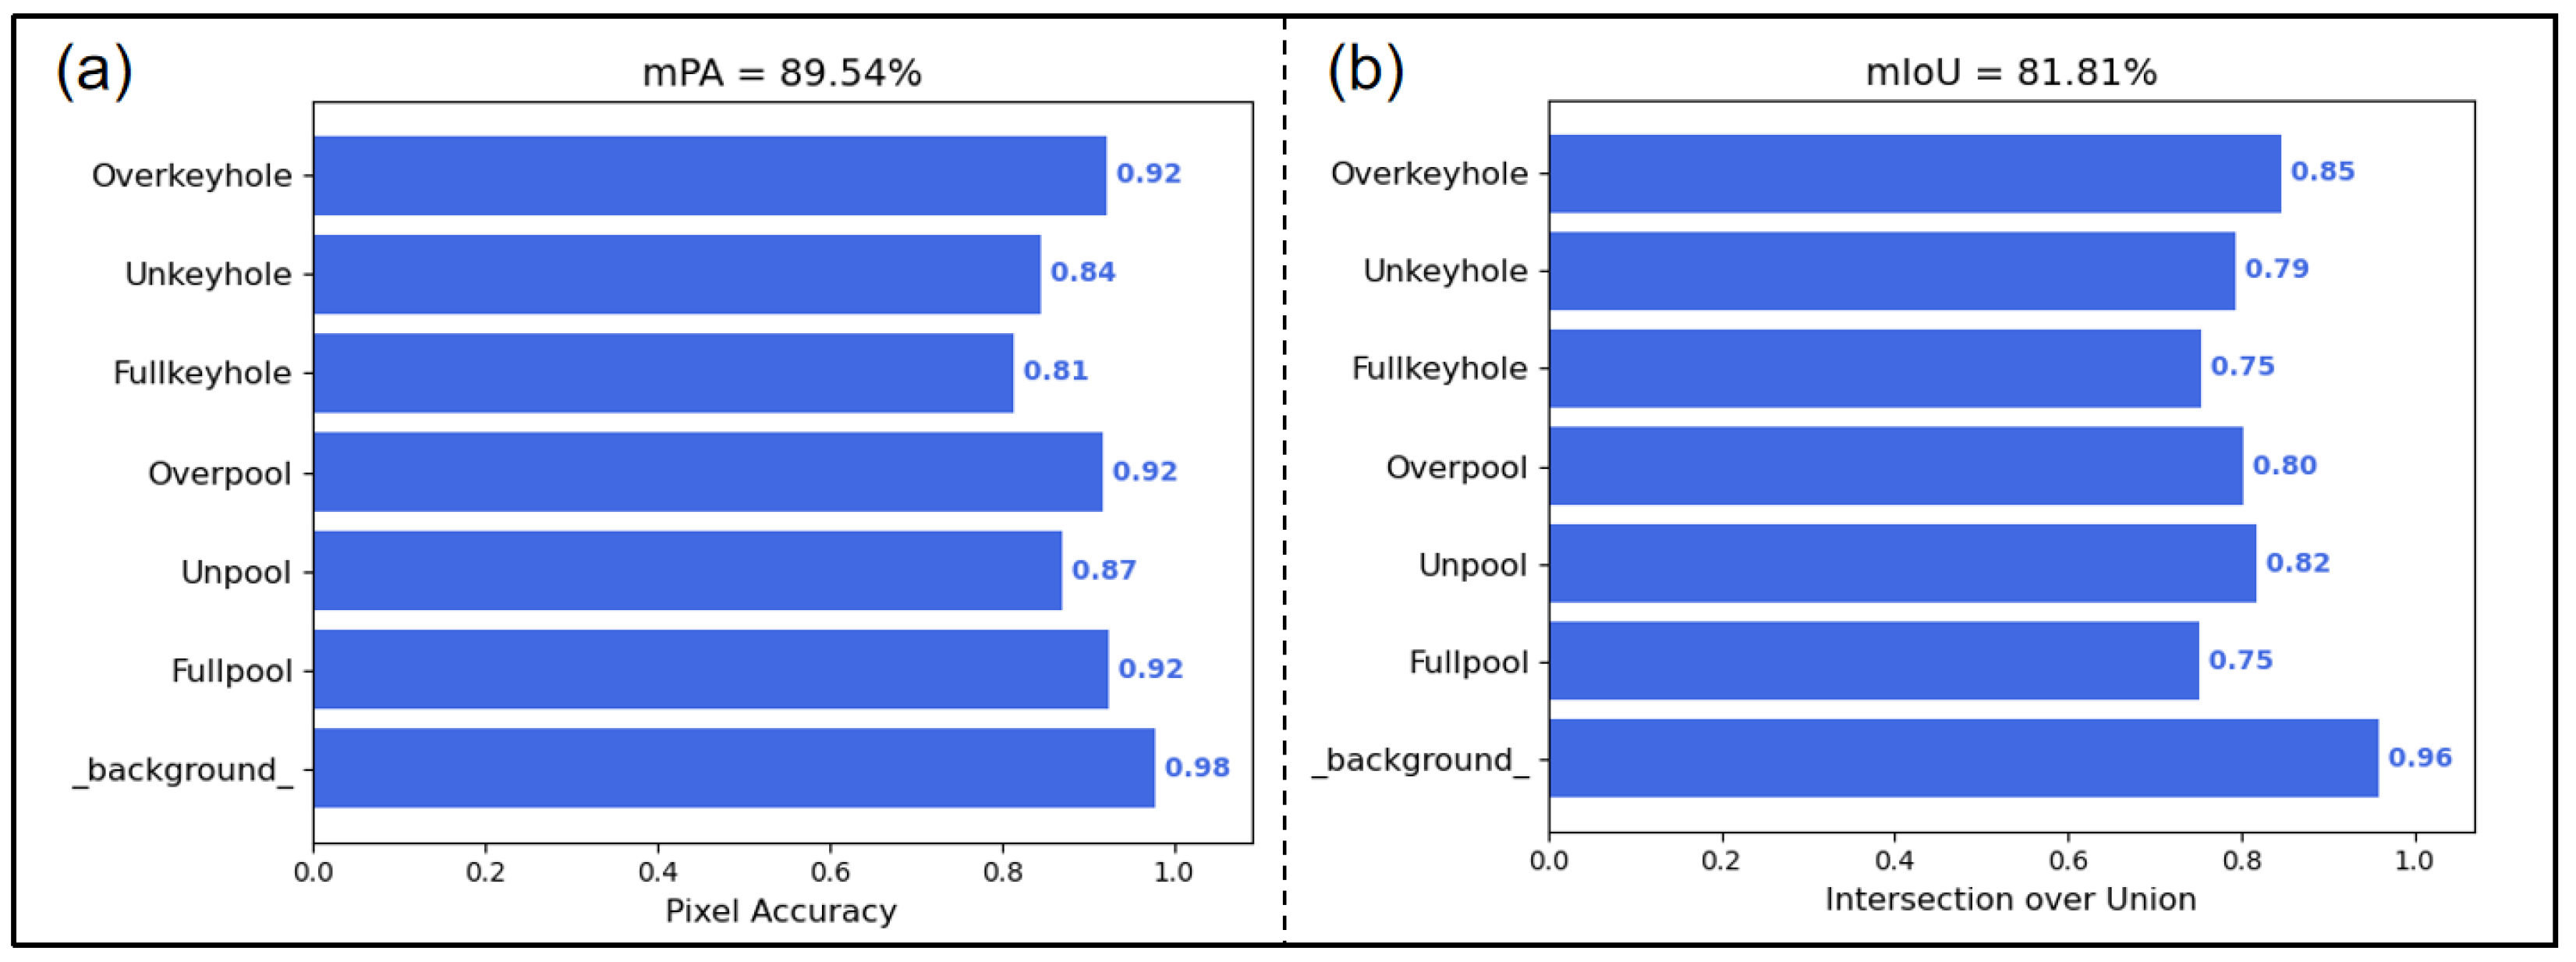
The U-Net model was employed to segment 1500 original monitoring images. Figure 8 illustrates segmented images under three different penetration states, and Figure 9 displays the evaluation metrics of the U-Net segmentation. In this paper, we evaluate the U-Net model using two metrics, namely the Mean Pixel Accuracy (MPA) and the Mean Intersection over Union (MIoU). MPA calculates the percentage of correctly classified pixels in a semantic segmentation task. MIoU computes the intersection over union (IoU) for each class and then takes the average across all classes to evaluate the segmentation accuracy in computer vision tasks. Strong metallic vapor plume interference in the fused images was eliminated, with clear boundaries between the keyhole (inner region) and the melt pool (outer region) although optical noise interference persisted in the images, particularly in the reflective parts of magnesium alloy. The intensity of interfering parts varies across different monitoring images and approaches the brightness values of certain regions within the melt pool, making the accurate segmentation of the melt pool boundary challenging. The use of traditional methods to obtain the melt pool boundary is susceptible to inaccurate results due to the influence of optical noise. In contrast, the pixel-level semantic segmentation method based on the U-Net model in monitoring images yields segmented images with the precise boundaries of the melt pool and keyhole. The shapes of the melt pool and crucial hole in the segmented images closely resemble those in the ground truth images.
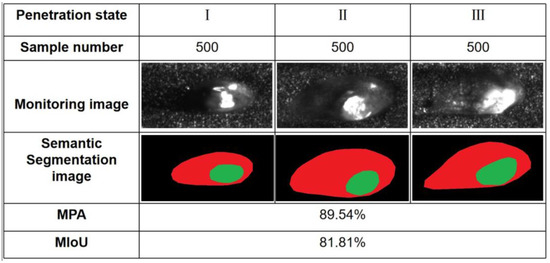
Figure 8.
The segmented image of the fused monitoring image and the original monitoring image.
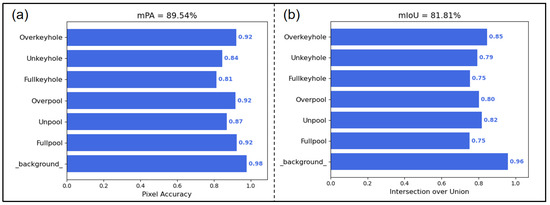
Figure 9.
U-Net performance evaluation indicators. (a) MPA; (b) MioU.
3.3. Penetration State Monitoring Based on CNN
This study initially selected two classic models in image classification algorithms, VGG16 and lightweight MobileNet, for the classification task. After using U-Net for semantic segmentation of the monitoring images, precise information such as the shape and size of the melt pool and keyholes could be better presented. Therefore, there is no need to employ overly complex neural network models for extensive feature extraction on the input images. The advantages of image recognition brought by the convolutional capability of convolutional neural networks compared to simple BP neural networks are not particularly significant. Hence, this study also attempted to extract melt pool information using Local Binary Patterns (LBPs) and train classification with a lightweight BP neural network. LBP is a classic algorithm used to describe local texture features in images. The classical LBP algorithm defines a 3 × 3 neighborhood, compares the central pixel with its eight neighboring pixels, generates an 8-bit binary number, and converts it into a decimal LBP code. The LBP code represents the relationship between the pixel and its surrounding environment.
The dataset used for training consisted of Image data obtained during the monitoring process after semantic segmentation with U-Net, with 500 images for each state of penetration. The ratio of the training set to the test set was 8:2. In terms of network construction, the modules before the fully connected layers of VGG16 utilized pre-trained parameters in TensorFlow, with 256 nodes in the fully connected layer, ReLU activation function, and the last layer and the softmax activation function for prediction. For the MobileNet model, to maintain similarity with the LBP algorithm, the convolutional kernel size was set to 3.
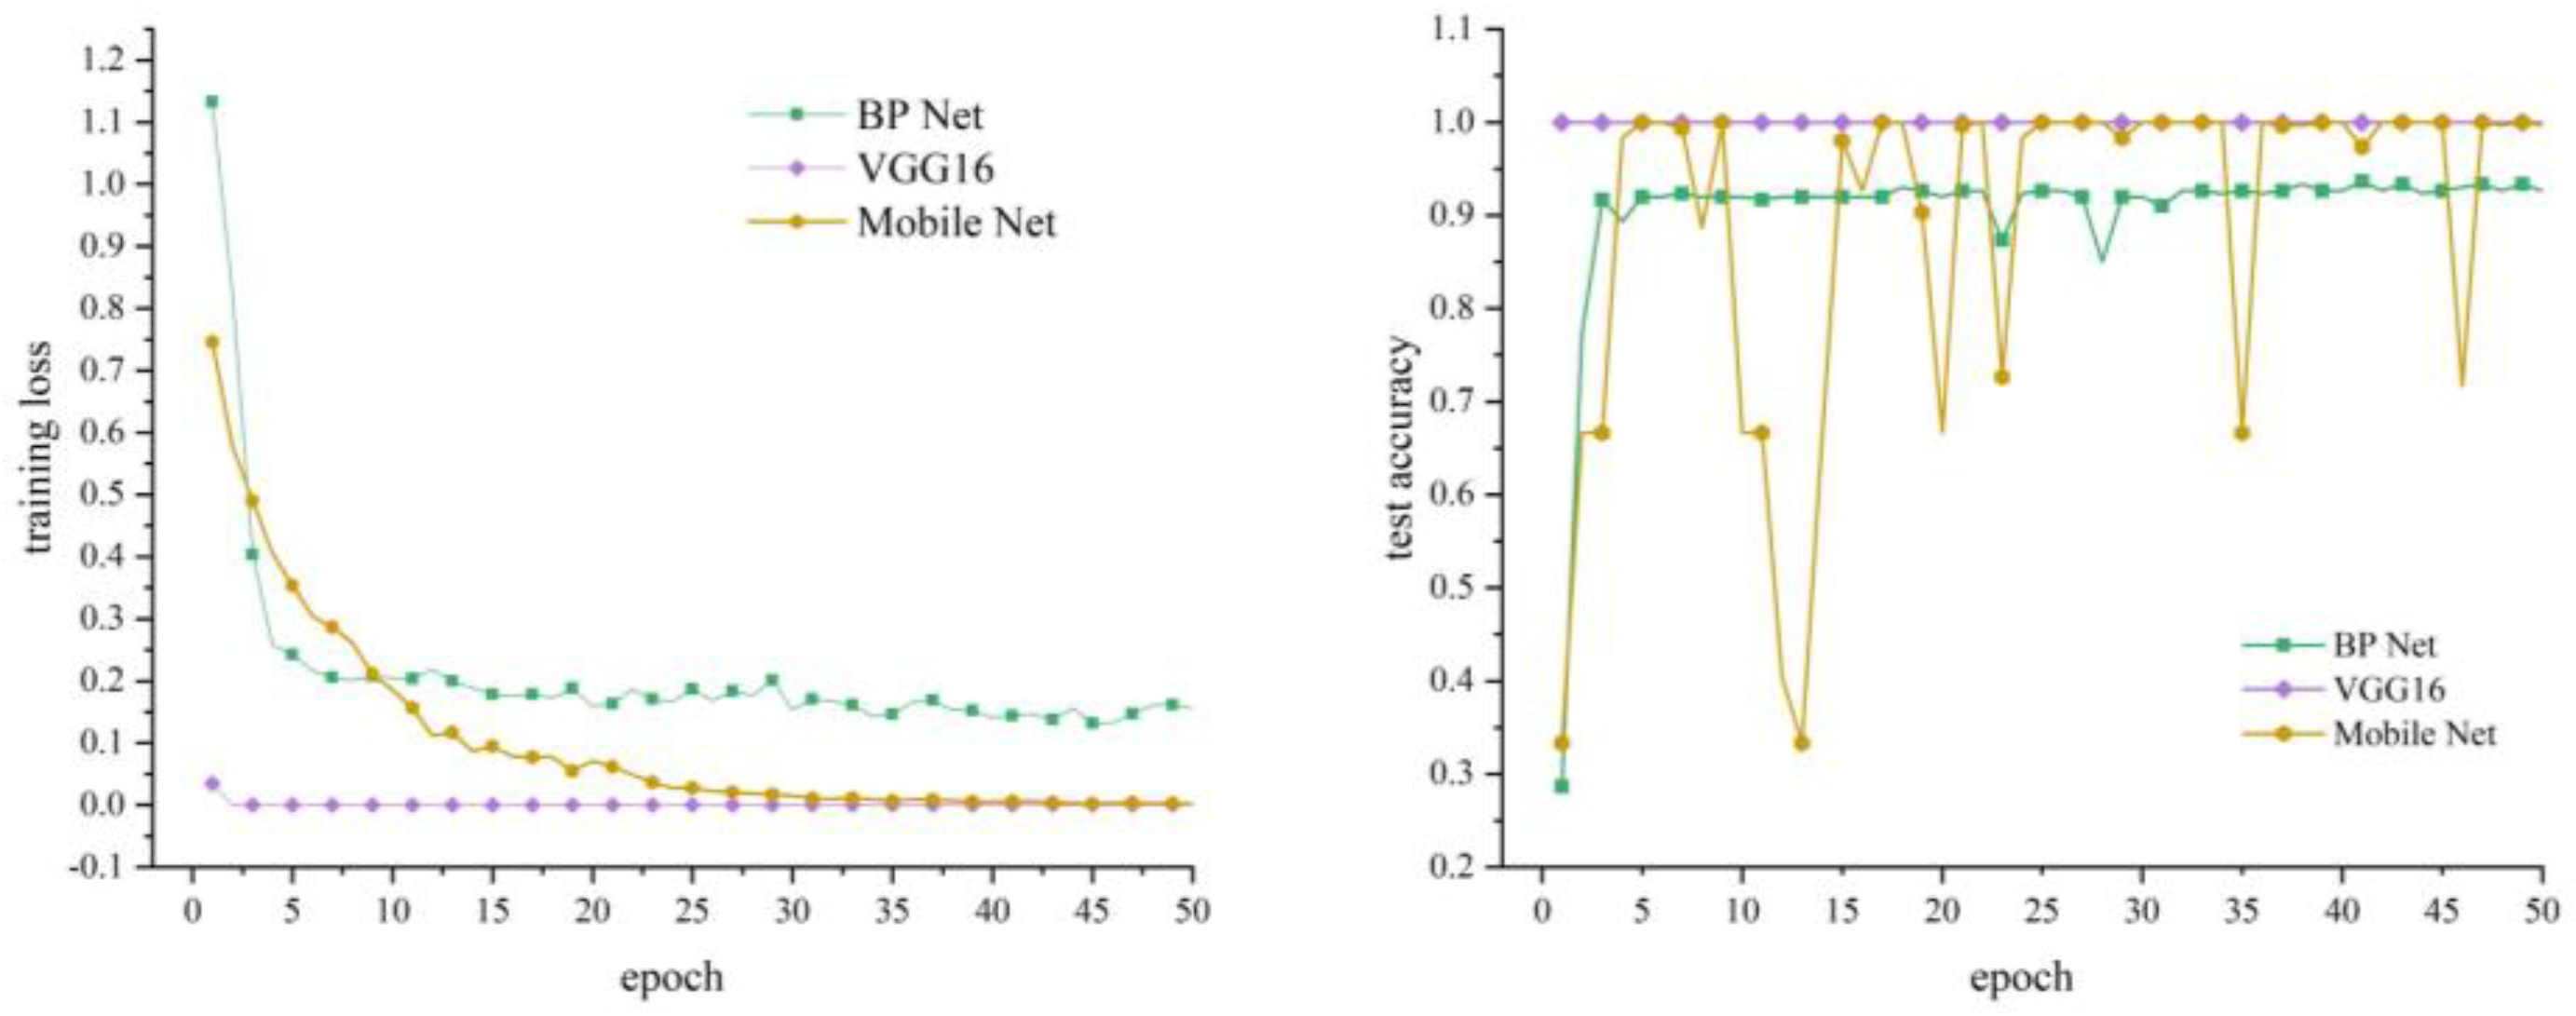
Figure 10 depicts the training loss and testing accuracy of the three models during the training process. It can be observed from the figures that due to the pre-training of VGG16, it achieved 100% accuracy after only 2–3 iterations of formal training. In the training process of the lightweight MobileNet, although the loss gradually decreased on the training set and the training accuracy reached 100%, the performance on the validation set was highly unstable, exhibiting clear signs of overfitting. The BP neural network also achieved 100% accuracy during training but maintained an accuracy of approximately 92% on the validation set.
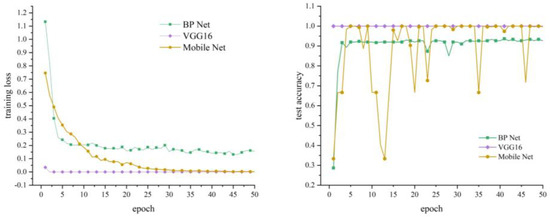
Figure 10.
Training loss and test accuracy of three different models.
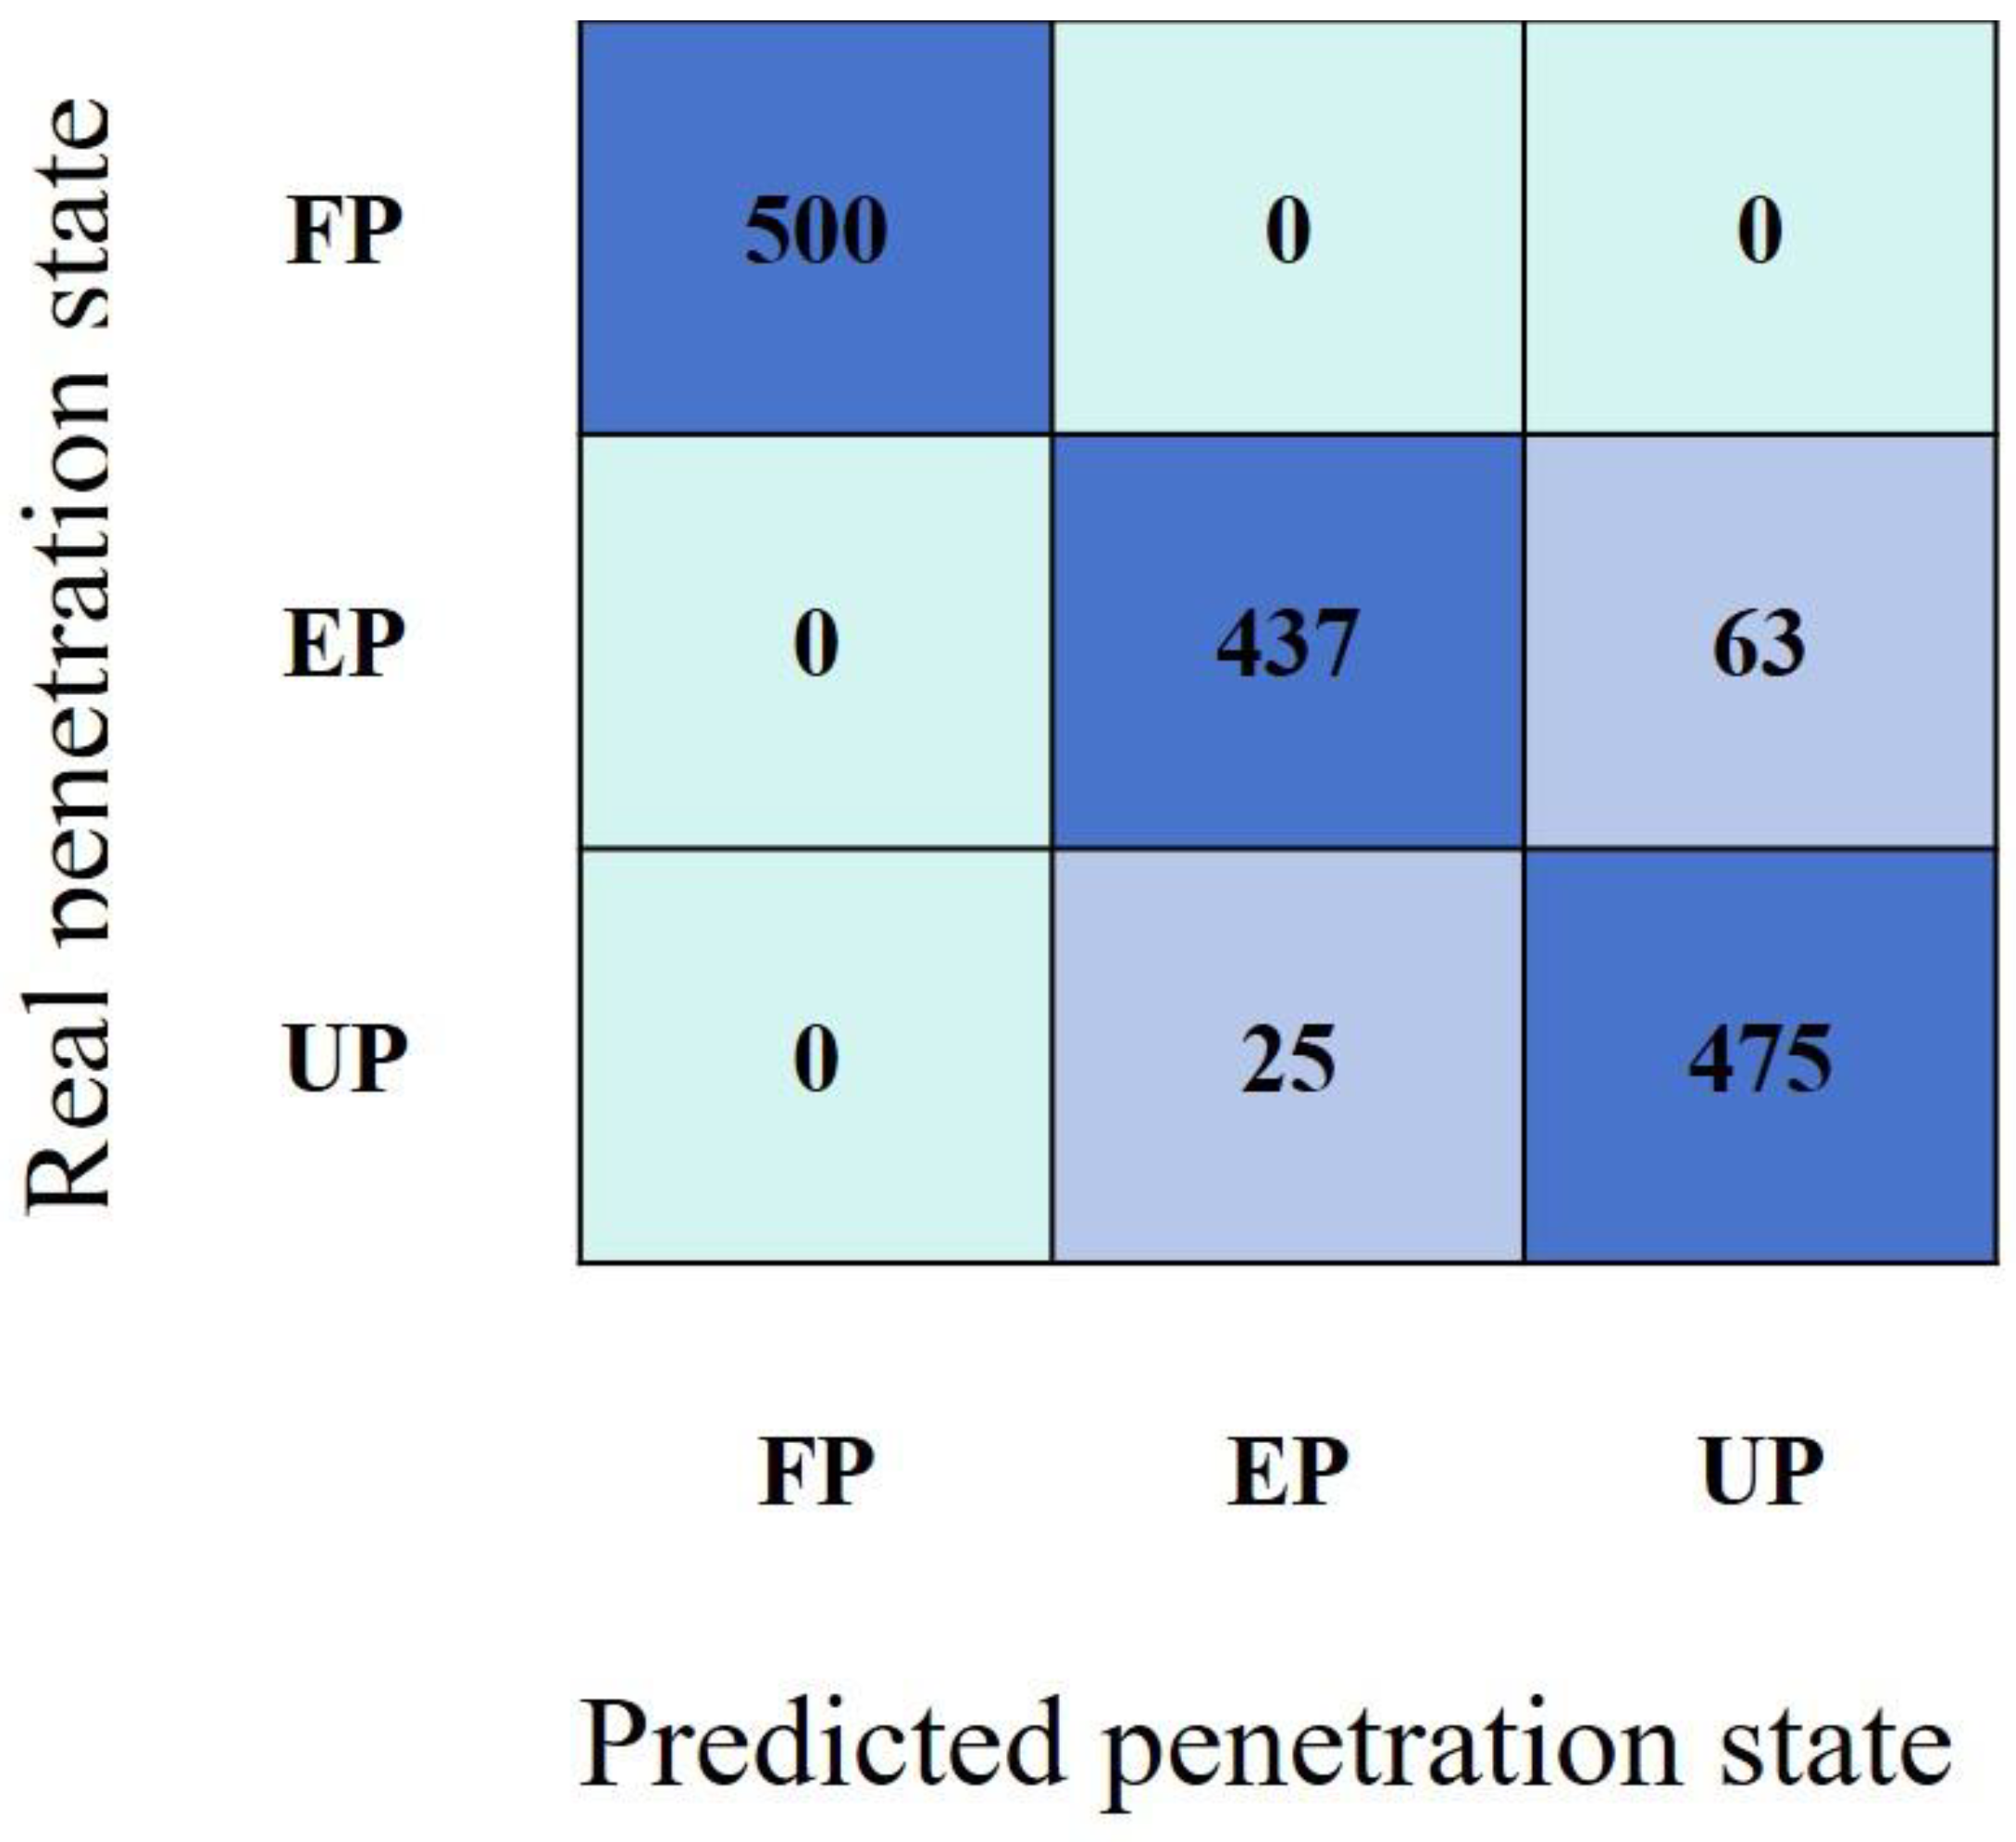
Therefore, this study examined the prediction results of the BP neural network model on the validation set, with the confusion matrix shown in Figure 11. In the confusion matrix, it was noted that the model’s prediction accuracy for the fully penetrated state was 100%, with the main errors occurring in predicting over-penetration and under-penetration. Hence, if monitoring the welding process for normality is the primary focus, using a simpler structure with higher-computational-efficiency LBP features combined with a BP neural network can achieve reliable monitoring equally. The raw data were processed to remove noise and outliers. Then, the saturated data were compared with the reference data, and regions and extents of saturation could be identified by analyzing the differences in the datasets. If saturated areas were small and non-critical, the overall data could be applied. Large or key position saturation required special attention through repeated experiments to ensure the consistency of data. If trends remained consistent, overall data quality was acceptable despite the saturation.

Figure 11.
Confusion matrix of BP neural network. The model can predict 100% of the state of FP accurately, and the error is due to the misjudgment between UP and EP.
4. Conclusions
To eliminate disturbances such as metal spatter and optical noise during the monitoring process, this study conducted processing and an analysis of monitoring images using the U-Net model to accurately extract key information about the melt pool and keyholes. Furthermore, predictions of the penetration states were made using the CNN model. The main conclusions are as follows:
- The U-Net model constructed in this study can accurately extract the contours of the melt pool and keyholes from monitoring images with interference, demonstrating good model performance in the magnesium alloy welding field. The extracted images achieved MPA and MIoU values of 89.54% and 81.81%.
- The proposed image processing method using the VGG16 method can achieve 100% monitoring accuracy, meeting the stringent requirements for monitoring.
- When the focus of the welding process monitoring is solely on determining normality, utilizing the LBP feature + BP neural network approach offers advantages in terms of computational efficiency and model size.
In future works, the neural network model could be enhanced by incorporating the data on melt pool depths with the application of equipment such as Optical Coherence Tomography [29], thereby realizing online monitoring.
Author Contributions
Conceptualization, W.W. and Y.L.; methodology, H.D.; software, Y.L., T.W. and H.D.; validation, Y.L., Z.W., T.W. and H.D; formal analysis, W.W. and H.D.; investigation, W.W.; resources, H.D. and G.L.; data curation, Y.L., Z.W. and H.D.; writing—original draft preparation, Y.L.; writing—review and editing, W.W., Y.L. and H.D.; visualization, Y.L.; supervision, W.W. and G.L.; project administration, W.W.; funding acquisition, W.W. All authors have read and agreed to the published version of the manuscript.
Funding
This research was funded by the Guangxi Key R&D Program (No. Gui Ke AB23026101) and the Base, Talent Special Project of the Guangxi Science and Technology Plan Project (No. Gui Ke AD23026149), and the program of China Scholarship Council (No. 202306660011).
Data Availability Statement
The dataset will be made available upon request from the authors.
Conflicts of Interest
The authors declare no conflicts of interest.
References
- Haferkamp, H.; Niemeyer, M.; Dilthey, U.; Trager, G. Laser and electron beam welding of magnesium materials. Weld. Cutt. 2000, 52, 178–180. [Google Scholar]
- Sanders, P.G.; Keske, J.S.; Leong, K.H.; Kornecki, G. High power Nd:YAG and CO2 laser welding of magnesium. J. Laser Appl. 1999, 11, 96–103. [Google Scholar] [CrossRef]
- Dziubińska, A.; Gontarz, A.; Horzelska, K.; Pieśko, P. The Microstructure and Mechanical Properties of Az31 Magnesium Alloy Aircraft Brackets Produced by a New Forging Technology. Procedia Manuf. 2015, 2, 337–341. [Google Scholar] [CrossRef]
- Nie, P.; Zhi, G.; Lin, H.; Chen, Y.; Xu, Q.; Zhou, J.; Long, Y. Metallurgical analysis of laser welded AZ31/5A06 lap joints with Ti–Ni interlayer. Mater. Sci. Eng. A 2024, 901, 146344. [Google Scholar] [CrossRef]
- Zhou, J.; Chen, C.; Zhou, Z.; Long, H.; Jia, J.; He, L.; Long, Y. Dissimilar laser lap welding of Mg and Al alloys using a CoCrFeNi medium-entropy alloy interlayer. Opt. Laser Technol. 2023, 157, 108639. [Google Scholar] [CrossRef]
- Li, G.; Xu, W.; Jin, X.; Liu, L.; Ding, S.; Li, C. The machinability of stainless steel 316 L fabricated by selective laser melting: Typical cutting responses, white layer and evolution of chip morphology. J. Mater. Process. Technol. 2023, 315, 117926. [Google Scholar] [CrossRef]
- Li, G.; Ye, J.; Xu, W.; Wei, W.; Li, C.; Ding, S. Investigation of coatings with in-situ TiX reinforcements fabricated by additive-subtractive manufacturing: Hardness, microstructure and machinability. Surf. Coat. Technol. 2024, 467, 130271. [Google Scholar] [CrossRef]
- Chen, C.; Jia, J.; Xu, Q.; Zhang, J.; Long, Y. Study on laser welding of Cu/Ti dissimilar materials using a hybrid light source with wavelengths of 455/1080 nm. J. Manuf. Process. 2024, 115, 94–107. [Google Scholar] [CrossRef]
- Yang, H.; Wu, J.; Wei, Q.; Tang, Z.; Wang, A.; Jin, X.; Li, X.; Wu, Y.; Lu, G.; Wang, H.; et al. Stable cladding of high reflectivity pure copper on the aluminum alloy substrate by an infrared-blue hybrid laser. Addit. Manuf. Lett. 2022, 3, 100040. [Google Scholar] [CrossRef]
- Tang, Z.; Wan, L.; Yang, H.; Zhu, C.; Wu, Y.; Wang, H.; Wang, H. Stable conduction mode welding of conventional high-reflectivity metals with 2000 W blue laser. Opt. Laser Technol. 2024, 168, 109971. [Google Scholar] [CrossRef]
- Yuan, G.; Zhou, Z.; Li, X.; Long, Y. Blue laser welding of 7075-T6 aluminum alloy and carbon fiber reinforced polyetheretherketone. Opt. Laser Technol. 2022, 155, 108440. [Google Scholar] [CrossRef]
- Zhou, J.; Zhou, Z.; Chen, C.; Long, Y. Comparison study of 6082 Al alloy laser welding using 455 nm blue laser and 1080 nm near-infrared laser. Optik 2023, 272, 170224. [Google Scholar] [CrossRef]
- Wang, Z.; Gao, M.; Tang, H.; Zeng, X. Characterization of AZ31B wrought magnesium alloy joints welded by high power fiber laser. Mater. Charact. 2011, 62, 943–951. [Google Scholar] [CrossRef]
- Xu, Y.; Qian, P.; Qiao, Y.; Li, J.; Zhang, J. Study on laser welding process, microstructure and properties of AZ31B magnesium alloy. Trans. Indian Inst. Met. 2022, 75, 2905–2912. [Google Scholar] [CrossRef]
- Zhang, M.; Wu, J.; Mao, C.; Cheng, B.; Shakhawat, H.M.; Li, H.; Wang, K.; Zhang, J.; Hu, Y.; Bi, Z. Impact of power modulation on weld appearance and mechanical properties during laser welding of AZ31B magnesium alloy. Opt. Laser Technol. 2022, 156, 108490. [Google Scholar] [CrossRef]
- Jiang, P.; Dong, H.; Cai, Y.; Gao, M. Effects of laser power modulation on keyhole behavior and energy absorptivity for laser welding of magnesium alloy AZ31. Int. J. Adv. Manuf. Technol. 2023, 125, 563–576. [Google Scholar] [CrossRef]
- Ning, J.; Na, S.-J.; Zhang, L.J.; Wang, X.; Long, J.; Cho, W.I. Improving thermal efficiency and stability of laser welding process for magnesium alloy by combining power modulation and subatmospheric pressure environment. J. Magnes. Alloys 2022, 10, 2788–2800. [Google Scholar] [CrossRef]
- Jiang, Y.; Jiang, M.; Chen, X.; Chen, A.; Ma, S.; Jiang, N.; Zhang, S.; Wang, Z.; Lei, Z.; Chen, Y. Vacuum laser beam welding of AZ31 magnesium alloy: Weld formability, microstructure and mechanical properties. Opt. Laser Technol. 2024, 169, 110115. [Google Scholar] [CrossRef]
- Hinton, G.E.; Osindero, S.; Teh, Y.W. A fast learning algorithm for deep belief nets. Neural Comput. 2006, 18, 1527–1554. [Google Scholar] [CrossRef]
- Krizhevsky, A.; Sutskever, I.; Hinton, G.E. Imagenet classification with deep convolutional neural networks. Commun. Acm 2017, 60, 84–90. [Google Scholar] [CrossRef]
- Silver, D.; Huang, A.; Maddison, C.J.; Guez, A.; Sifre, L.; Van Den Driessche, G.; Schrittwieser, J.; Antonoglou, I.; Panneershelvam, V.; Lanctot, M.; et al. Mastering the game of Go with deep neural networks and tree search. Nature 2016, 529, 484–489. [Google Scholar] [CrossRef] [PubMed]
- Wang, J.; Ma, Y.; Zhang, L.; Gao, R.X.; Wu, D. Deep learning for smart manufacturing: Methods and applications. J. Manuf. Syst. 2018, 48, 144–156. [Google Scholar] [CrossRef]
- Wei, W.; He, G.; Yang, J.; Li, G.; Ding, S. Tool Wear Monitoring Based on the Gray Wolf Optimized Variational Mode Decomposition Algorithm and Hilbert–Huang Transformation in Machining Stainless Steel. Machines 2023, 11, 806. [Google Scholar] [CrossRef]
- Zhao, Y.; Ren, H.; Zhang, Y.; Wang, C.; Long, Y. Layer-wise multi-defect detection for laser powder bed fusion using deep learning algorithm with visual explanation. Opt. Laser Technol. 2024, 174, 110648. [Google Scholar] [CrossRef]
- Cai, W.; Jiang, P.; Shu, L.; Geng, S.; Zhou, Q. Real-time identification of molten pool and keyhole using a deep learning-based semantic segmentation approach in penetration states monitoring. J. Manuf. Process. 2022, 76, 695–707. [Google Scholar] [CrossRef]
- Ai, Y.; Han, S.; Lei, C.; Cheng, J. The characteristics extraction of weld seam in the laser welding of dissimilar materials by different image segmentation methods. Opt. Laser Technol. 2023, 167, 109740. [Google Scholar] [CrossRef]
- Liu, S.; Wu, D.; Luo, Z.; Zhang, P.; Ye, X.; Yi, Z. Measurement of pulsed laser welding penetration based on keyhole dynamics and deep learning approach. Measurement 2022, 199, 111579. [Google Scholar] [CrossRef]
- Ronneberger, O.; Fischer, P.; Brox, T. U-Net: Convolutional Networks for Biomedical Image Segmentation. arXiv 2015, arXiv:1505.04597. [Google Scholar]
- He, G.; Gao, X.; Li, L.; Gao, P. OCT monitoring data processing method of laser deep penetration welding based on HDBSCAN. Opt. Laser Technol. 2024, 179, 111303. [Google Scholar] [CrossRef]


Disclaimer/Publisher’s Note: The statements, opinions and data contained in all publications are solely those of the individual author(s) and contributor(s) and not of MDPI and/or the editor(s). MDPI and/or the editor(s) disclaim responsibility for any injury to people or property resulting from any ideas, methods, instructions or products referred to in the content. |
© 2024 by the authors. Licensee MDPI, Basel, Switzerland. This article is an open access article distributed under the terms and conditions of the Creative Commons Attribution (CC BY) license (https://creativecommons.org/licenses/by/4.0/).