Article

Revealing the Relationship between Critical Inlet Velocity and a Double-Layer Oxide Film Combined with Low-Pressure Casting Technology

1
National Key Laboratory for Precision Hot Processing of Metals, Harbin Institute of Technology, Harbin 150001, China
2
School of Materials Science and Engineering, Harbin Institute of Technology, Harbin 150001, China
3
School of Materials Science and Engineering, Jiangsu University, Zhenjiang 212000, China
4
School of Materials Science and Engineering, North University of China, Taiyuan 030051, China
*
Author to whom correspondence should be addressed.
J. Manuf. Mater. Process. 2024, 8(4), 168; https://doi.org/10.3390/jmmp8040168
Submission received: 2 July 2024 / Revised: 31 July 2024 / Accepted: 1 August 2024 / Published: 3 August 2024
(This article belongs to the Special Issue Industry 4.0: Manufacturing and Materials Processing)

Abstract

:
In the context of low-pressure casting, an excessive inlet velocity may result in the introduction of an oxide film and air into a liquid metal, leading to the formation of a two-layer film structure within the casting. Such defects can significantly degrade the mechanical properties of the castings. In order to optimize the advantages of low-pressure casting, an empirically designed equation for the inlet velocity was formulated and the concept of critical inlet velocity was further refined. A comprehensive numerical simulation was conducted to meticulously analyze the liquid metal spreading phase within the cavity. Subsequently, low-pressure casting experiments were carried out with actual castings of an A357 alloy, using two different entrance velocities—one critical and the other exceeding the critical entrance velocity. Tensile test specimens were extracted from the castings for the comparative evaluation of mechanical properties. It was observed that the average tensile strength of specimens cast at the critical inlet velocity exhibited a notable 16% enhancement. In contrast, specimens cast at velocities exceeding the critical inlet velocity manifested the presence of double oxide film defects. This evidence suggests that casting at a velocity faster than the critical inlet velocity leads to the formation of double oxide film defects, which in turn reduces the mechanical properties of the castings.

1. Introduction

The casting process possesses distinct technical advantages for the fabrication of intricate components. In the contemporary era of industrial advancement, designers increasingly opt to amalgamate multiple castings into a singular entity. This transformation results in larger and more intricate castings, accompanied by a heightened demand for metallurgical excellence. The low-pressure casting technique, renowned for its smooth and regulated filling procedure, emerges as a particularly efficacious solution for intricate thin-walled castings. Low-pressure casting employs a bottom-up filling technique to fill the mold cavity, providing the technical advantage of smooth filling [1], which is widely employed in industry. A decreasing inlet velocity during the filling process results in a stable filling process [2]. However, low inlet velocity can lead to an increased filling time, resulting in a huge temperature decrease. Hence, it causes casting defects, such as cold shut, shrinkage porosity, etc. Double oxide film inside the casting is a well-known defect that was recently emphasized. Furthermore, when the inlet velocity is too fast, the oxide film and gas are incorporated into the metal liquid, and part of them is retained inside the casting, forming a double oxide film casting defect and affecting its mechanical properties. Therefore, it is imperative to determine a properly critical inlet velocity, which represents the maximum velocity without gas and oxide film involvement in full-filling castings.
Inlet velocity is critical to the low-pressure casting process, which can be delineated into three sequential stages, as shown in Figure 1a. In stage 1, the liquid metal enters the cavity from the inlet, followed by stage 2, wherein the liquid metal flows along the bottom of the cavity, touches the side walls, and reverses the flow towards the inlet, known as the spreading stage. In stage 3, the liquid metal gradually rises in the cavity and eventually fills it [3]. The previous research reported by Campell revealed that an inlet velocity exceeding 0.5 m/s for aluminum alloys during stage 1 results in the backward flow of molten metal [2], leading to the involvement of oxide films and gas within the liquid metal. The existence of oxide film defects has been proven by several experiments and simulations [4,5]. Moreover, the critical inlet velocity varies with the type of alloys. As the liquid level within the cavity rises in stage 3, the static pressure at the inlet increases, thereby making gas involvement on the liquid metal surface difficult [6]. During the spreading stage, excessive relative velocities of forward- and reverse-flowing liquid metal can lead to the involvement of oxide film and gas, causing defects within casting that influence mechanical properties and reliability of castings. However, there is little research on the critical inlet velocity for stage 2 and 3. Therefore, numerical simulations are employed to analyze the flow behavior of liquid metal during the spreading stage (stage 2) in this study and provide an empirical formula for determining the critical inlet velocity during this stage [7,8].
It is noted that the critical inlet velocity is influenced by the cavity structure during the spreading stage. By conducting numerical simulations on a simplified cavity structure, a direct relationship between the distance of the inlet to the side wall and the critical inlet velocity was revealed. The velocity of the metal liquid in the spreading stage will gradually increase. The faster the speed of the spreading process, the easier it is for the oxide film and gas to be involved in the metal liquid. Hence, the shorter the distance between the inlet and the side wall, the greater the critical inlet velocity that leads to the involvement of the oxide film and gas [9,10].
To simplify, we abstract the cavity structure into an elongated plate-like model with a fixed cross-sectional area, representing a situation where the inlet is situated farthest from the side wall. Subsequently, we determine the critical inlet velocity for this typical structure and leverage simulation data to formulate an empirical equation for process design. In order to demonstrate the effect of the critical inlet velocity of the metallic fluid during the spreading stage on the involvement of the double oxide film, we conducted a series of validations. For validation 1, an 80 mm high section was taken from an actual casting and then numerically simulated to verify that the critical inlet velocity of a typical structure can be applied to an actual casting with the same cross-section ratio [11]. Validation 2 focused on a grid-independent validation of the numerical simulation process for 2D and 3D structures to minimize errors [12]. For validation 3, actual casting was produced using low-pressure casting technology combined with different inlet velocities, including the calculation of the critical inlet velocity and a faster speed. Subsequently, the mechanical performances of two castings were analyzed to verify the correlation between the performance and double oxide film defect influenced by critical velocity [13,14]. The results of these validations confirmed the accuracy of our numerical simulations and the feasibility of using a critical inlet velocity calculation method in commercial production.

2. Mathematical Model

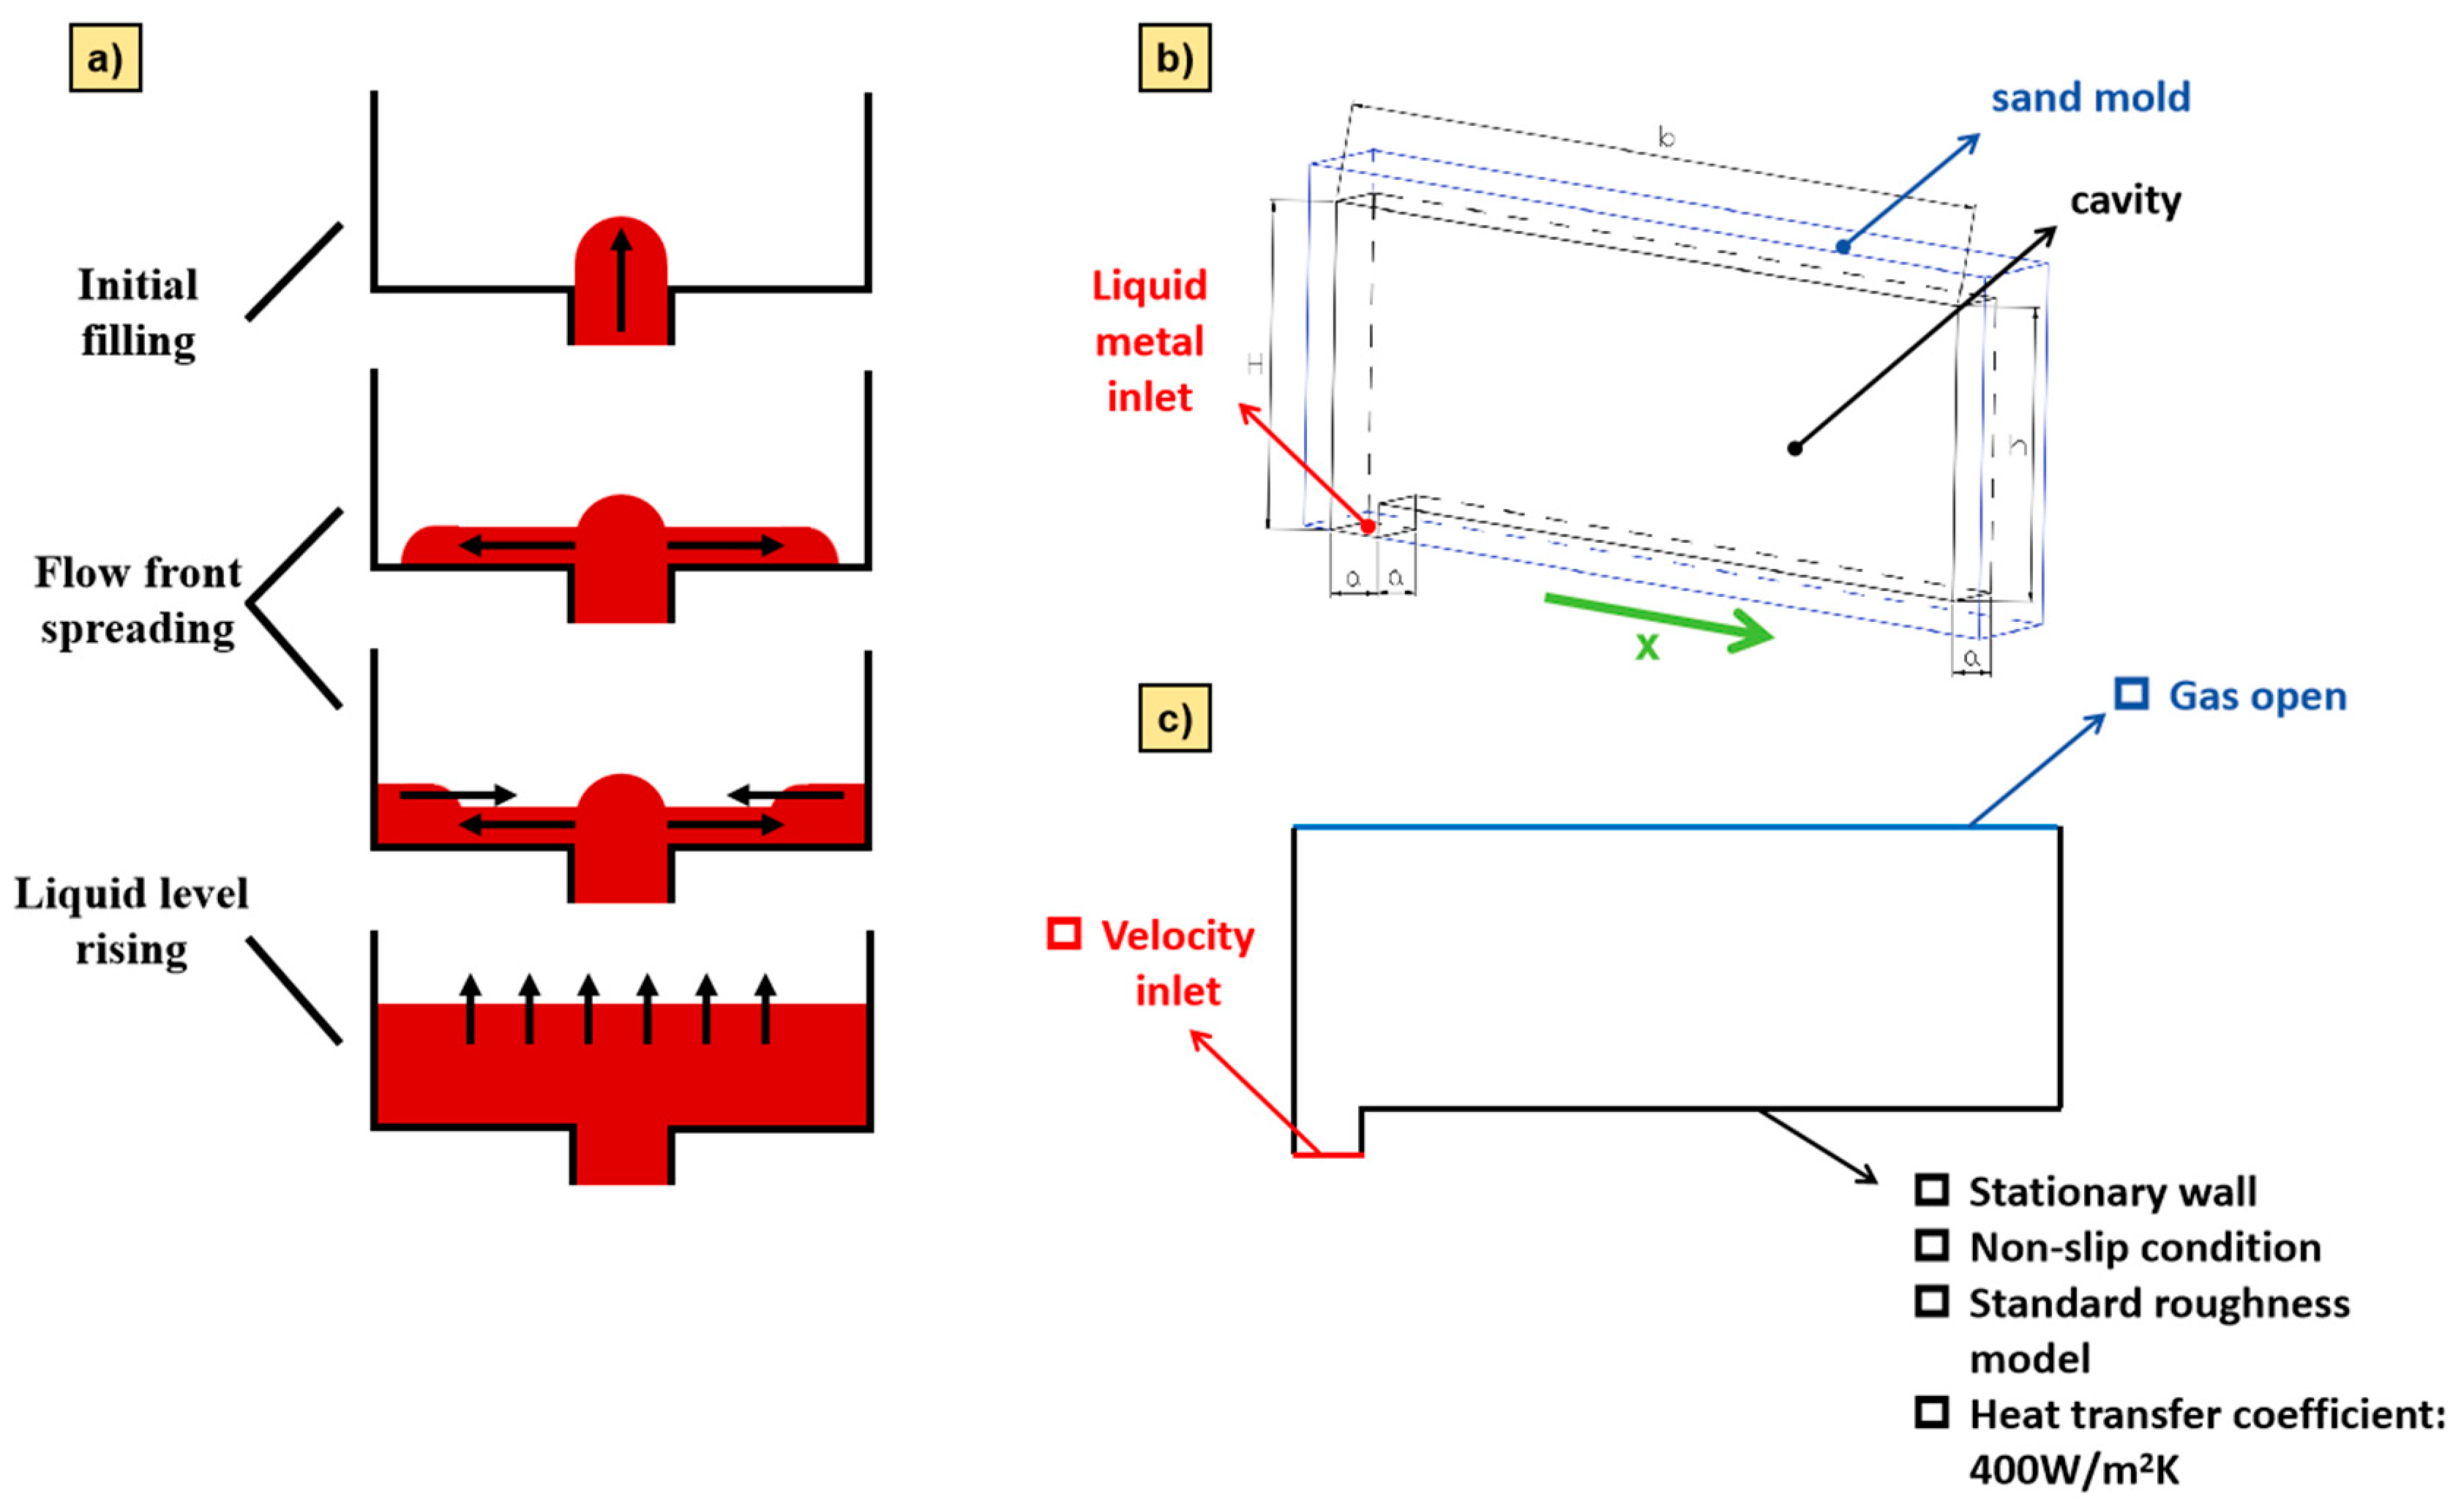
2.1. Typical Structural Model and Streamlining

It is well known that the cavity structure will affect the flow velocity of liquid metal, so whether or not the double oxide film will be involved in the liquid metal during the spreading stage is related to the structure of the cavity. However, the structure of cavities is so complex that it is difficult for us to classify them in a uniform way. In order to provide a calculation method for the critical inlet velocity of the metallic liquid in the spreading phase, a typical structural model related to the proportion of cross-section increase is designed. Compared to the actual casting, the liquid metal is more constrained at the inlet of the typical structure, which means that the liquid metal flows laterally at a higher speed. The faster the lateral flow, the easier it is for the double oxide film to be involved in the liquid metal during the spreading stage. Therefore, when the cross-sectional area increases by the same proportion, the critical inlet velocity of the typical structure must be smaller than that of the actual casting.
The schematic depiction of the typical structural model is shown in Figure 1b, wherein the black line symbolizes the cavity, featuring an inlet in the form of a square with a cross-sectional dimension of edge length a and height h. The cavity width aligns with the inlet, boasting a cross-sectional size of edge length a and b, and height H. Furthermore, the blue line represents the sand for casting, characterized by a wall thickness of 100 mm. Notably, the typical structural model maintains a uniform profile shape along the X-axis, as shown in Figure 1b. For computational efficiency, the model was simplified to a two-dimensional structure, as illustrated in Figure 1c.

2.2. Volume Fraction Equation

During numerical simulation, the volume-of-liquid (VOF) model was employed for the interfacial capture of the molten metal filling process. In this model, the phase volume fraction is determined according to the following equation [15,16]:
1 ρ q t α q ρ q + · α q ρ q v q = S α q + p = 1 n m ˙ p q m ˙ q p
where m ˙ p q is the mass transfer from the p phase to the q phase, m ˙ q p denotes the mass transfer from the q phase to the p phase, S α q is the source term.
The volume fraction of the initial phase is determined by the following equation:
q = 1 n α q = 1
The computational procedure adopts an explicit formulation for transient calculations; at this point, the volume fraction equation is discretized in the manner shown in Equation (3):
α q n + 1 ρ q n + 1 α q n ρ q n t V + f ρ q U f n α q , f n = p = 1 n m ˙ p q m ˙ q p + S α q V
where n + 1 is the new time step index and n is the index of the previous time step, α q , f n is the nominal value of the volume fraction of the fluid in phase q, v is the unit volume, and U f is the volumetric flux through the surface based on the normal phase velocity.

2.3. Turbulence and Momentum Model

The computational procedure uses the RNG standard K-ε turbulence model [17], where the K equation can be written as Equation (4):
ρ K t + ρ u j ¯ K x j = x j μ + μ t P r K K x j + P K + G b ρ ε Y M
where ρ is the fluid density, K is the turbulent kinetic energy, t is the time, u j ¯ is the velocity vector, x is the spatial coordinate, μ is the dynamical viscosity, P K is the turbulent kinetic energy transport term, and ε is the turbulent kinetic energy dissipation term. The related equation is written as Equation (5):
ρ ε t + ρ u j ¯ ε x j = x j α ε μ + μ t P r ε ε x j + C ε 1 ε K P K + C ε 3 G b C ε 2 * ρ ε 2 K
where μ t is the turbulent viscosity.
The momentum equation used for the calculation is given in Equation (6):
t ρ v + · ρ v v = p + · μ v + v T + ρ g + F
where ρ is the density and μ is the viscosity.

2.4. Surface Tension Equation

The continuum surface force model was employed to calculate the surface tension, which was introduced to the momentum equation by means of a source term, as shown below [18,19]:
p 2 p 1 = σ 1 R 1 + 1 R 2
where p 1 and p 2 are the pressure values on both sides of the interface, σ is the surface tension coefficient, and R 1 and R 2 are the radii of the curvature of the perpendicular surface.
We use n to denote the normal to the interface:
n = α q
We use K to express the scatter in the unit direction:
K = · n ^
The surface tension is quantitatively expressed in terms of scattering as a volumetric force and added to the momentum equation as a source term:
F v o l = σ i j ρ k i α i 1 2 ρ i + ρ g

2.5. Density and Viscosity Equations

The density and viscosity methods used for the calculation are as follows:
ρ x , t = F x , t ρ i + 1 F x , t ρ g
μ x , t = F x , t μ i + 1 F x , t μ g
where ρ g is the air density, ρ i is the metal liquid density, μ g is the air viscosity, and μ i is the metal liquid viscosity.

2.6. Thermal Equation

The following equations were used for the thermal calculations:
t ρ C p T + ρ C p u · T = · k T + q v
where ρ is the density, C p is the specific heat capacity, T is the temperature, u is the velocity vector, k is thermal conductivity, and q v is the volumetric heat source.

2.7. Material Properties

The heat transfer between the liquid metal and the mold is taken into account in the calculation of the liquid metal flow process. The viscosity, density, and surface tension of the metal fluid are dependent on the temperature of the calculated time step, and the specific parameters were obtained from the materials database of ProCAST 2010.0, as shown in Table 1. For computational convenience, a constant heat transfer coefficient of 400 W/m2K was determined for the interface between the sand mold and the metal liquid following the instruction of ProCAST software.

3. Experimental Methods

3.1. Simulation Scheme

The numerical simulation scheme for the typical structural model is shown in Table 2.

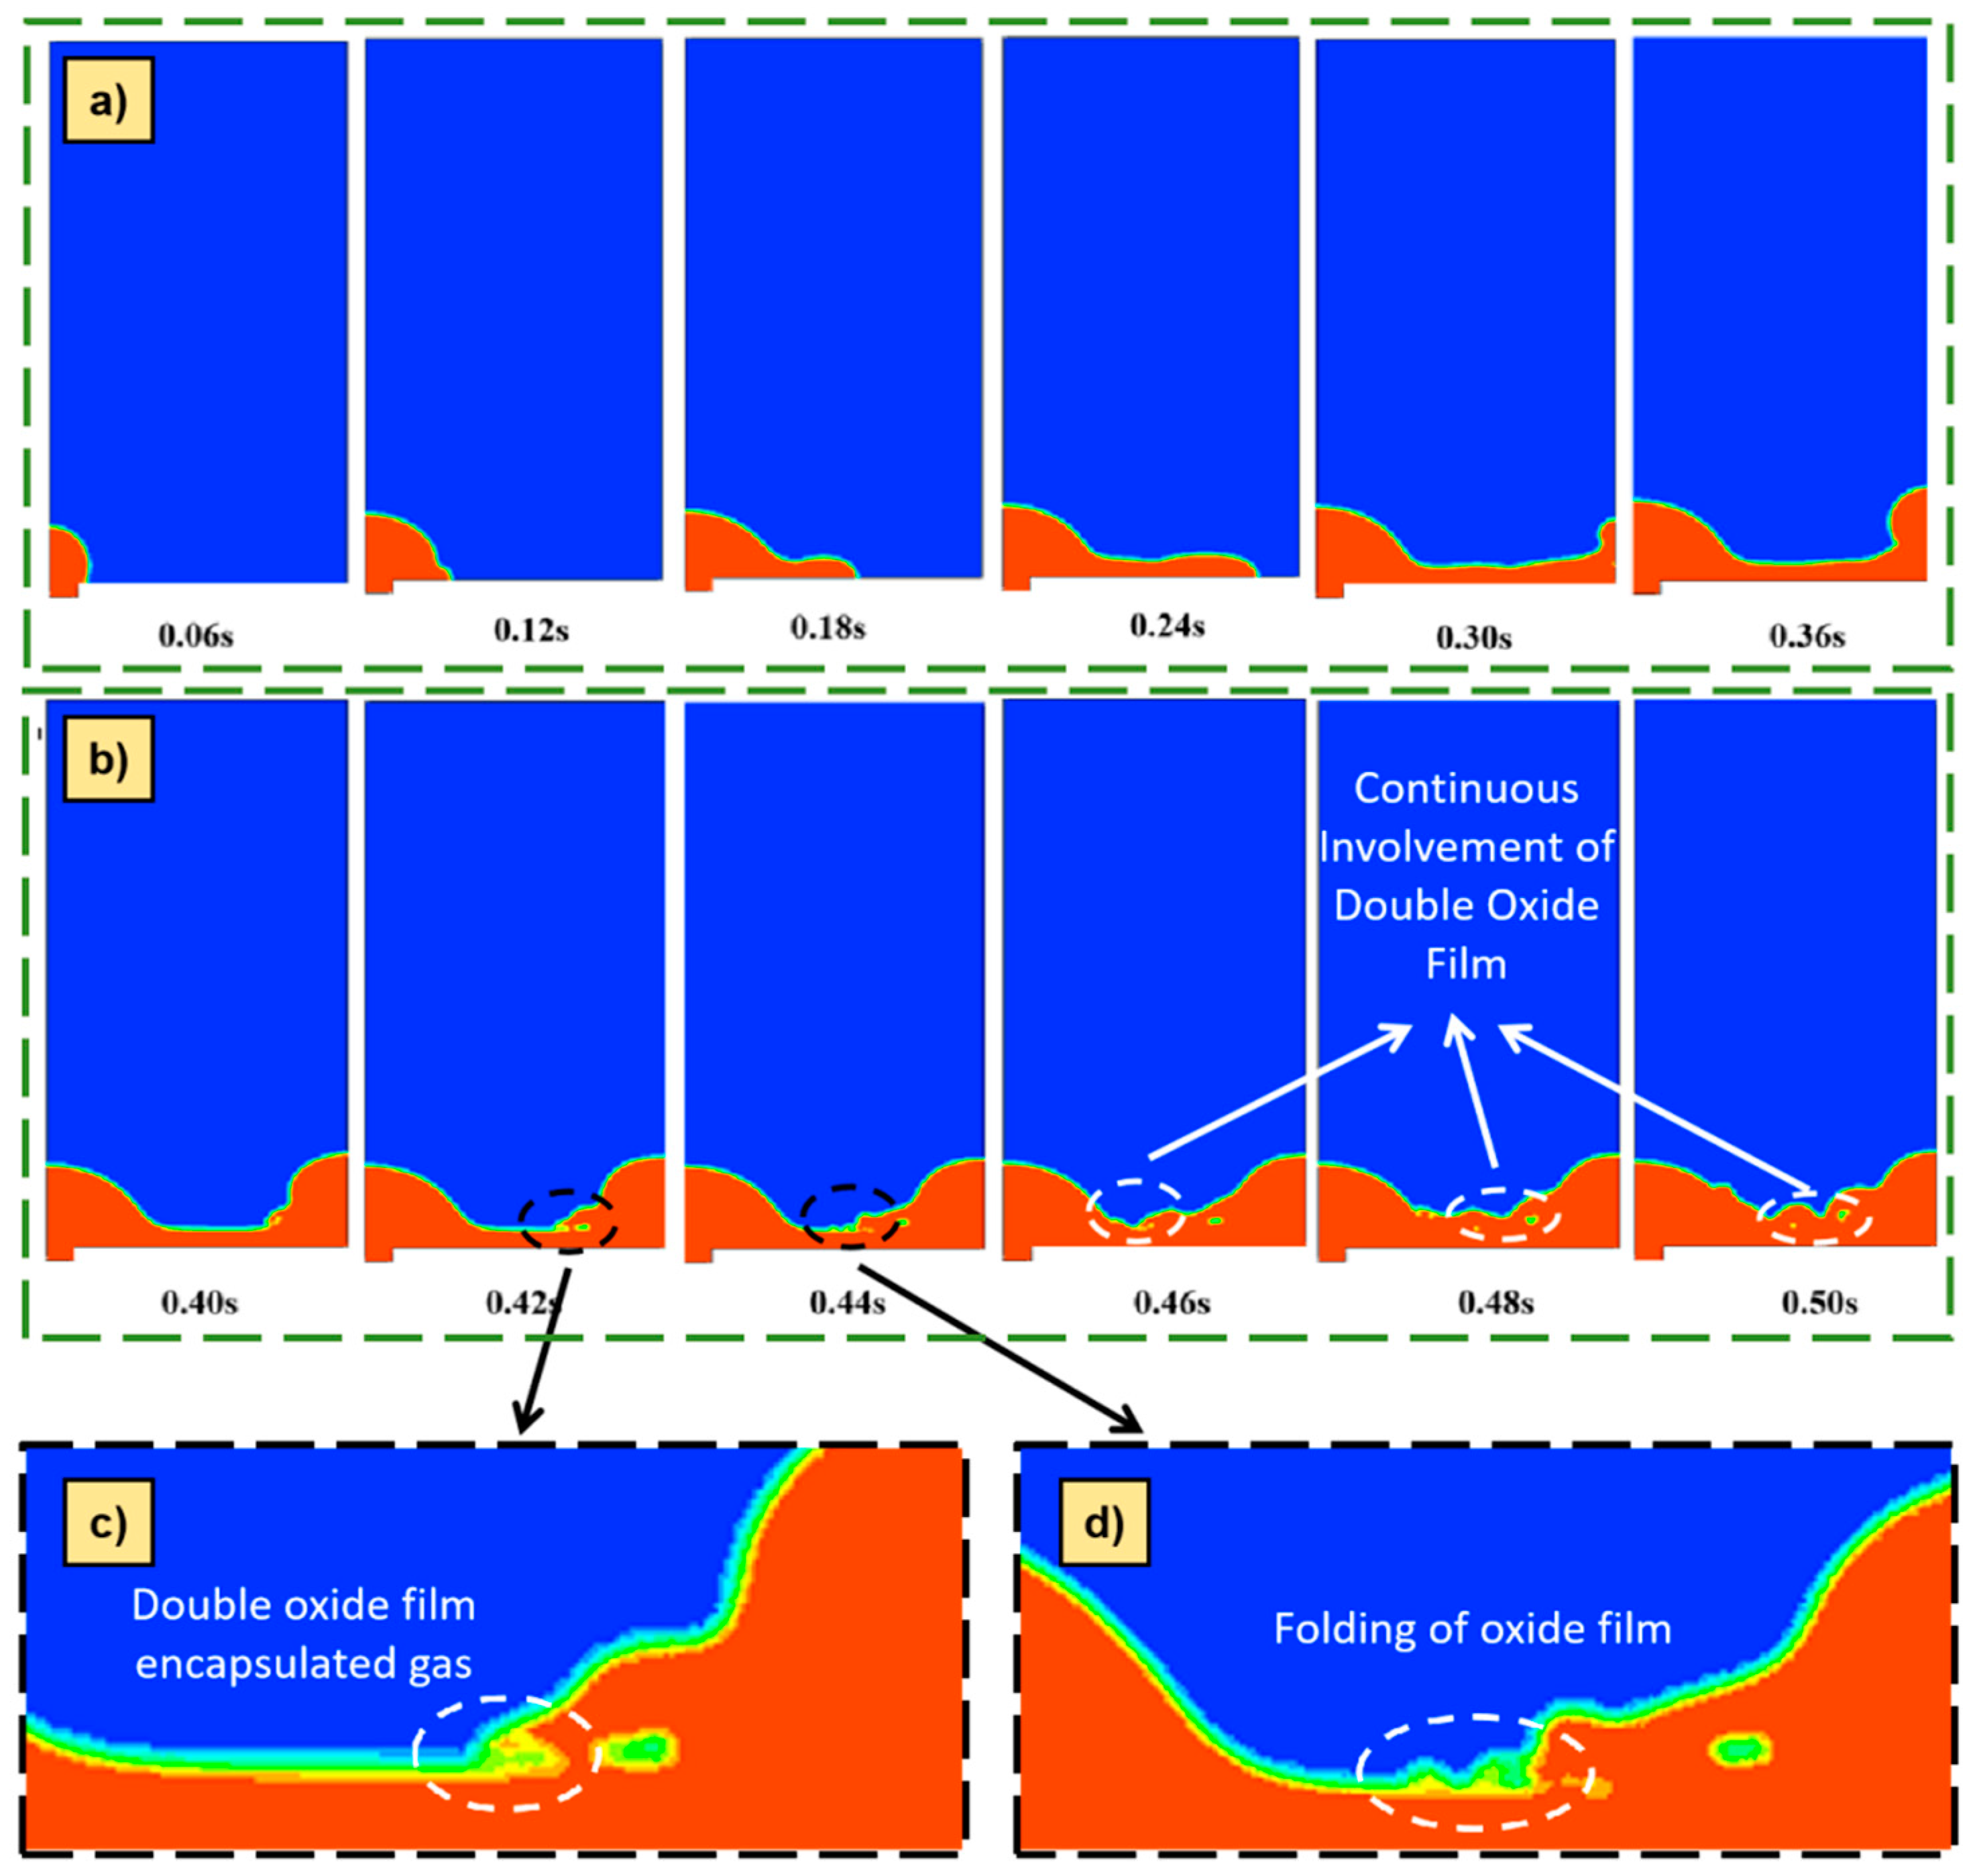
3.2. Numerical Simulation Results for the Determination of the Phenomenon of Gas Entrapment Using a Double Oxide Film Wrapping

In this study, numerical simulations of 2D and 3D structures are conducted to investigate the involvement process of a double-layer film structure during the flow of metal liquid. The observation of real-time volume fractions of the liquid and gas phases are crucial for determining the existence of such structures. In the 2D structure, variations in the inlet velocity allow for the direct observation of the double-layer oxide film formation on the metal liquid surface, enclosing entrapped gas as shown in Figure 2a. Contrarily, in 3D structural models, the involvement of the double oxide film is less apparent in rendered graphics of volume fractions. Hence, multiple observation surfaces are strategically placed along the flow path of the metal liquid, as depicted in Figure 2b. Therefore, the identification of a double-layer of oxide film on the free surface of the liquid metal follows the same criteria as in the 2D model [20,21].

3.3. Low-Pressure Casting Validation

Comparative casting experiments were conducted on the actual castings, as shown in Figure 5b. This casting features an inlet-cross-sectional-area-to-cavity-cross-sectional-area ratio of 1:11.78. In the typical physical model with the same cross-sectional-area ration, a critical inlet velocity of 0.34 m/s is captured in the spreading phase. For the low-pressure casting process, two inlet velocities of 0.34 m/s and 0.4 m/s were employed. The casting material utilized was an A357 alloy, and the casting temperature was maintained at 993 K ± 5 K [22]. The melt was degassed by rotating blowing Ar gas before casting.

3.4. Mechanical Performance and Reliability Analysis

Two castings were dissected, and ten tensile specimens with a cross-sectional area of 5 mm were prepared from the center of the thick-wall section of the castings. After cleaning the surfaces of the specimens, tensile tests were conducted without heat treatment on an Instron−5569 electronic universal materials testing machine with a strain rate of 8.0 × 10⁻⁴ s−1. Subsequently, the tensile samples were examined using a Helios Nanolab600i Scanning Electron Microscope (SEM, Helios NanoLab 600i, FEI, America) to investigate factors contributing to the deterioration of the mechanical properties of the casting [23].
In order to assess the impact of critical entrance velocity during the spreading phase on the fracture reliability of the castings, a Weibull distribution analysis of the involvement defects that influenced the mechanical properties was carried out [24,25]. According to previous reports, the Weibull distribution serves as a simple and effective method for evaluating the strength reliability of castings. The Weibull distribution is described as follows:
P = 1 e x p x x T x 0 m
where P is the possibility of failure appearing at a given value, x 0 is the scale parameter which corresponding to the characteristic stress at x = 63% and the threshold value x T is the lowest value expected to failure, respectively. The term m is Weibull modulus and used to characterize the distribution of measured properties. Generally, Equation (14) is written as follows:
l n l n 1 P = m l n ( x x T ) m l n ( x 0 )
Additionally, x T = 0 is usually applied and the two-parameter Weibull distribution analysis is described as follows:
P = 1 e x p x x 0 m
Then, the equation can be written as follows:
l n l n 1 P = m l n ( x ) m l n ( x 0 )

4. Results and Discussion

4.1. Grid-Independent Verification

In order to enhance the accuracy of the mathematical model, a mesh-independence validation was conducted. The validation encompassed numerical simulations of both 2D and 3D structures. For the models shown in Figure 2a and Figure 5b, five distinct mesh sizes were employed in numerical simulations to investigate the effect of mesh size on the simulation accuracy. The objective of this validation was to identify the suitable mesh size that guarantees the reliability of calculation results, while reducing computation time for subsequent extensive simulations.
The numerical simulation results conducted with varying grid sizes were counted. Table 3 presents the simulation details, such as computational time, velocity at the fixed point, and the corresponding relative error for each grid size. These simulations were performed on a computational system with 64 cores, 128 threads, and 256 G of RAM. Notably, a decrease in mesh size was found to lead to a gradual stabilization of results, albeit at the expense of increased computation time. In order to save computational resources, the grid-independence threshold was set to 1%, signifying the threshold at which computational accuracy was acceptable. Subsequent calculations entailed the utilization of a 0.25 mm mesh for the 2D structural model and a 2 mm mesh for the 3D structural model.

4.2. Mechanism of Defect Formation

During the liquid metal cavity filling process, the contact area with air progressively expands. As the oxide film on the surface of the liquid metal ahead of the filling level ruptures, a new oxide film promptly regenerates on the exposed surface that interacts with the air [26]. Typically, the size of this newly formed oxide film ranges between 3 nm and 5 nm, characterized by a modest Young’s modulus and exceptional plasticity and toughness [27,28]. Therefore, during the filling process, the flow state of the liquid surface front is almost unaffected by the oxide film [29]. Under this precondition, we simplified the computational modeling.
The process of filling a cavity with liquid metal consists of three phases: liquid metal, oxide film, and gas. Neglecting the effect of the oxide film, the computational model then only considers the gas and the metal liquid. In order to increase the speed of the calculation, we ignore the effect of the oxide film, and then the calculation model contains only the gas and the liquid metal.
We assumed that the surface of the liquid metal exposed to the air is a single layer of oxide film, characterized by a perpetuating cycle of fracturing and rejuvenation in tandem with the liquid metal flow. The single layer of oxide film within the casting does not cause a degradation of its mechanical properties. Therefore, within our numerical model, whenever gas entrapment occurs at the liquid metal’s free surface, we posit that the formation of minuscule air pockets encapsulated by oxide films occurs, effectively trapped within the liquid metal. These minute entities traverse with the liquid metal flow and eventually embed themselves within the solidified casting, producing dual-layer oxide film defects [30]. The spreading process of the metal liquid in the cavity is shown in Figure 3a,b and it can be seen that when the metal liquid touches the side wall and starts to flow in the reverse direction, it moves relative to the forward flowing metal liquid at the free surface. In Figure 3c, it can be seen that the oxide film encapsulates the gas and enters into the liquid metal during the flow of the metal. Figure 3d portrays the continuous folding and involution of the oxide film along the liquid metal surface [31]. Defects of the double-layer oxide film structure can seriously affect the mechanical properties of castings. Our analysis of simulation outcomes substantiates that an excessively high inlet velocity of the liquid metal during the spreading phase engenders the formation of double-layer oxide film defects within the casting [32]. In light of these findings, this study envisions the mitigation of casting imperfections associated with double-layer oxide film structures through the meticulous regulation of the inlet velocity.

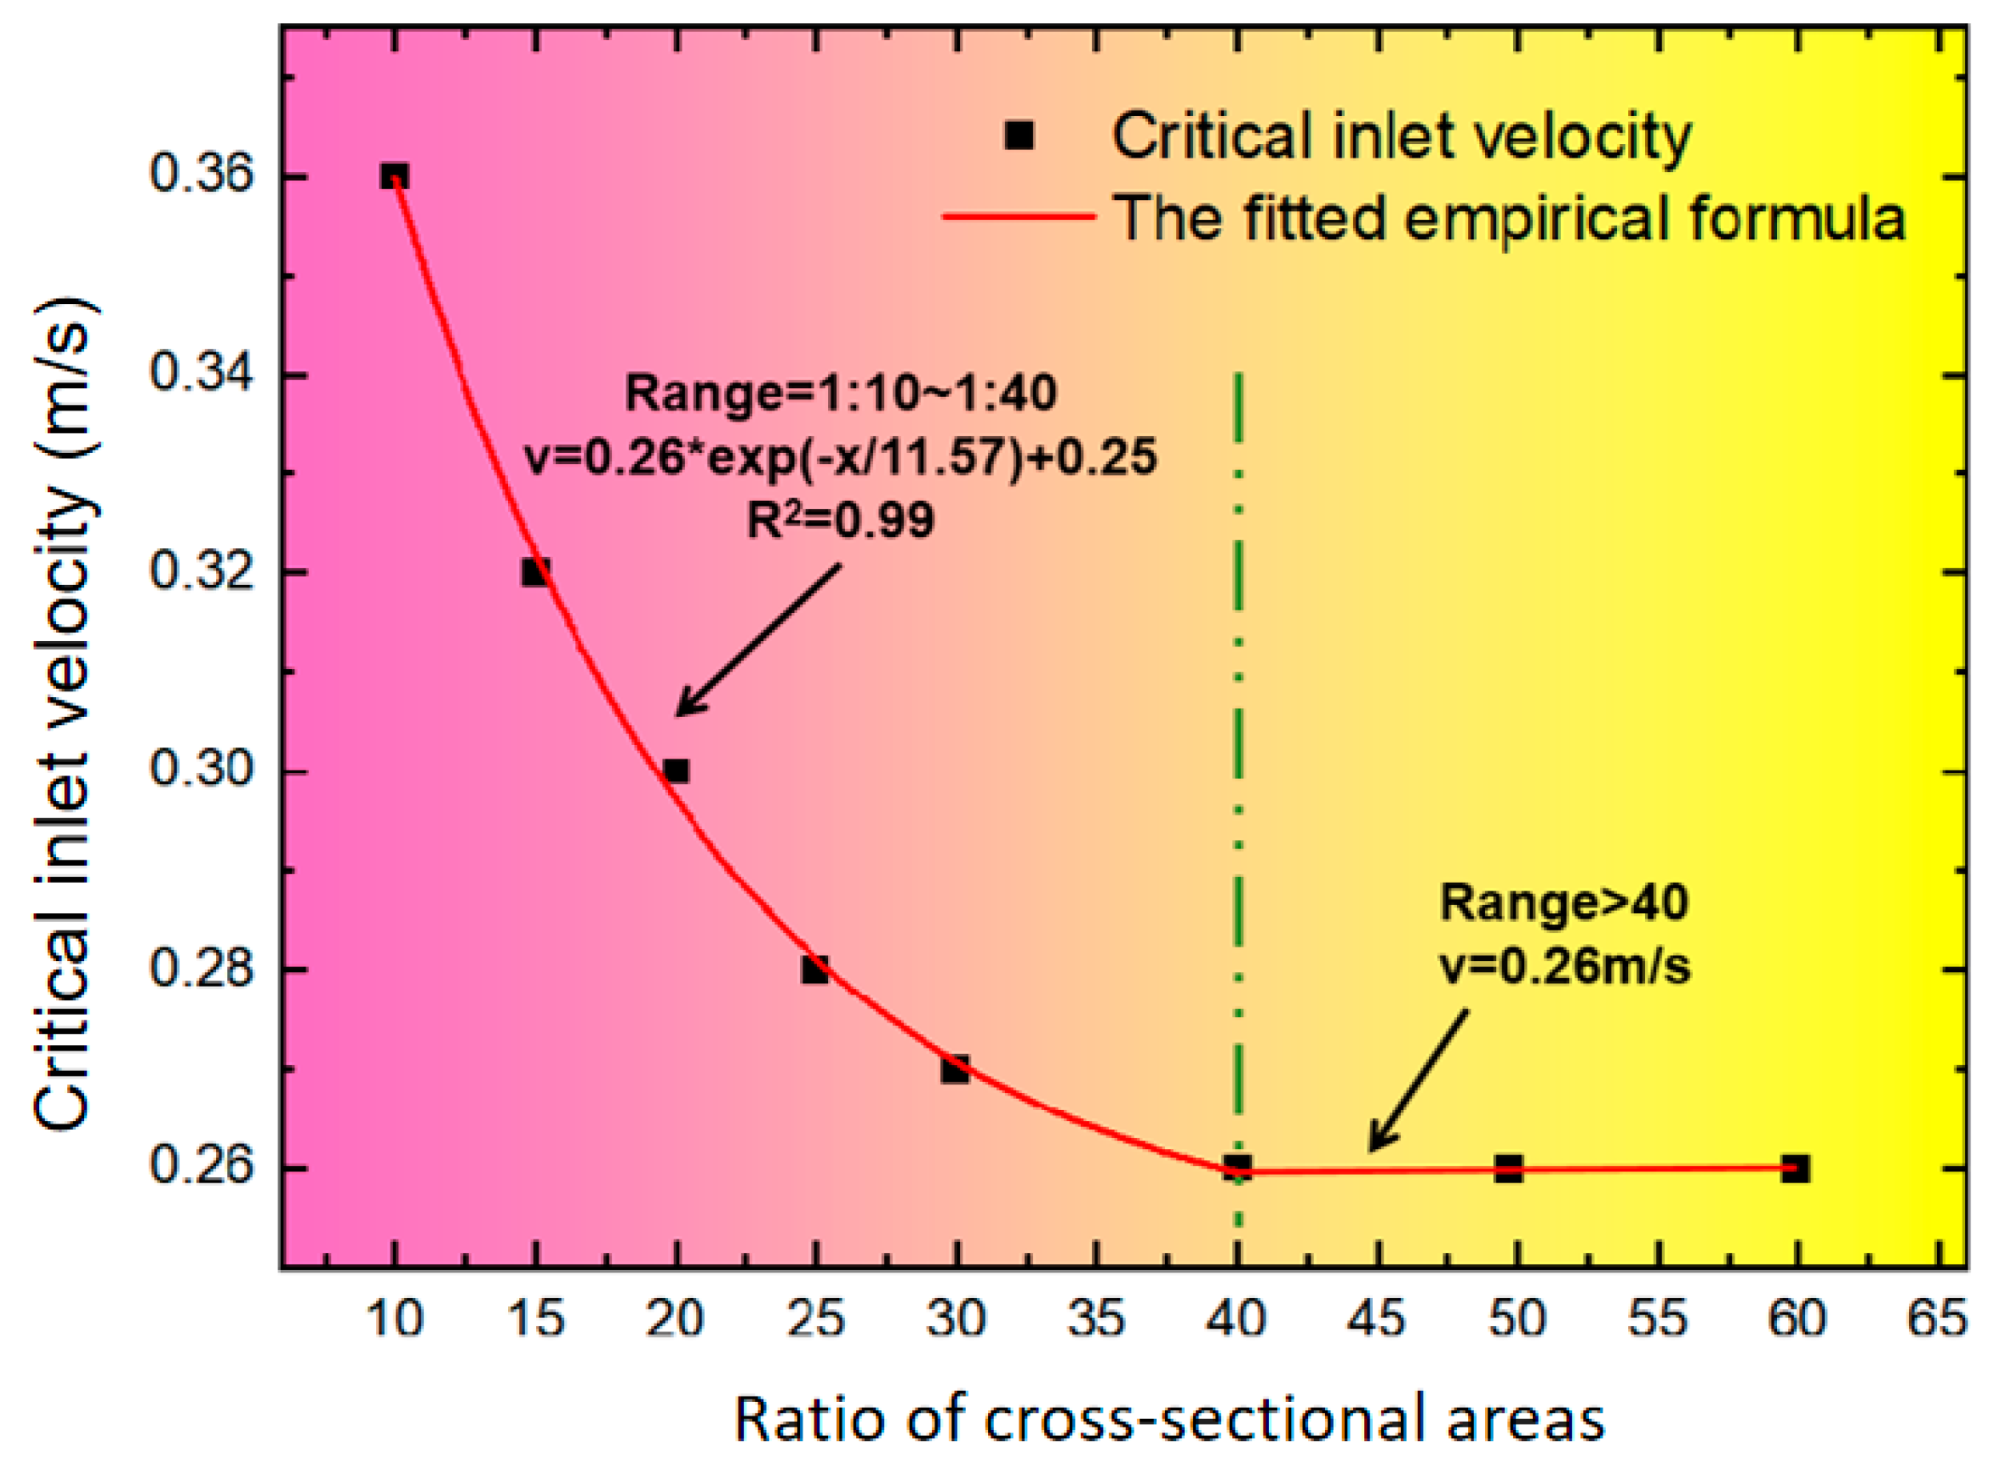
4.3. Calculation of Critical Inlet Velocity

The numerical simulation results of a typical structural model revealed that gas involvement within the spreading phase was mainly triggered by the excessive relative velocity of the liquid metal at the free surface during the rebound process after the liquid metal touch the side wall. Due to the complexity and variety of actual castings, classification poses a formidable challenge. To address this, we attempted to provide specific calculations for the design of actual casting inlet velocities by using the following approach.
Numerical simulations were conducted on typical structures with different cross-section ratios, wherein the inlet velocity was adjusted with an accuracy of 0.01 m/s. When the simulation results showed that no gas entrainment occurred in the spreading phase of the liquid metal, we recorded this velocity as the critical inlet velocity for this cross-section ratio. Numerical simulations of critical inlet velocities were carried out for typical structures with 1:10, 1:15, 1:20, 1:25, 1:30, 1:40, 1:50, and 1:60 section ratios, and the results were obtained, as shown in Figure 4. It can be seen that the critical inlet velocity progressively diminishes with increasing cross-sectional ratios, ultimately converging to 0.26 m/s. The data for the critical inlet velocity to cross-section ratio were fitted to Equation (18).
v = 0.26 · e x p x 11.57 + 0.25
where v is the critical inlet velocity and x is the ratio of the cavity cross-sectional area to the inlet cross-sectional area.
When the ratio of the inlet and cavity cross-sectional area remains constant, the typical structural model constrains the liquid metal significantly more at the outlet compared to the actual casting. Consequently, the liquid metal’s flow rate during the spreading stage in the standard structure must exceed that in practical casting operations. By utilizing the critical inlet velocities derived from standard structures with identical cross-sectional area ratios in real casting processes, it should be feasible to mitigate gas entrainment.
Based on the above results, further simulations were carried out within a 3D model presenting the actual casting process, as shown in Figure 5b. During the spreading phase, the liquid metal typically achieves a spread height of around twice the maximum sustainable height via the liquid metal’s surface tension, and this can be calculated using Equation (19). For the A357 alloy, the spread height measures approximately 25 mm. Therefore, the height of the actual casting is intercepted as 80 mm, designated as casting A. The cross-sectional area of the casting A inlet is 15,596 mm2, and the cross-sectional area of the cavity is 183,859 mm2, representing an 11.78-fold increase in the cross-sectional area.
h = 2 ( γ / ρ g ) 1 / 2
From the derivation of Equation (18), a critical inlet velocity of 0.3439 m/s is obtained for a section ratio of 1:11.78. Consequently, during the numerical simulations, the inlet velocity of the casting is given as 0.3439 m/s. As shown in Figure 5c,d, no occurrence of double oxide film involvement was observed during the casting process. This proves that the critical entrance velocity of the typical structural model is slower than the actual casting when the section ratio is the same. Subsequent simulations involved incrementally adjusting the inlet velocity in increments of 0.0025 m/s until gas involvement manifested on the liquid metal surface. The critical inlet velocities for standard structural models and actual casting operations are compared in Table 4. The relative error of 4.84 percent falls within the acceptable bounds for engineering applications, indicating the suitability of the critical inlet velocity derived from the standard structural model for engineering purposes.

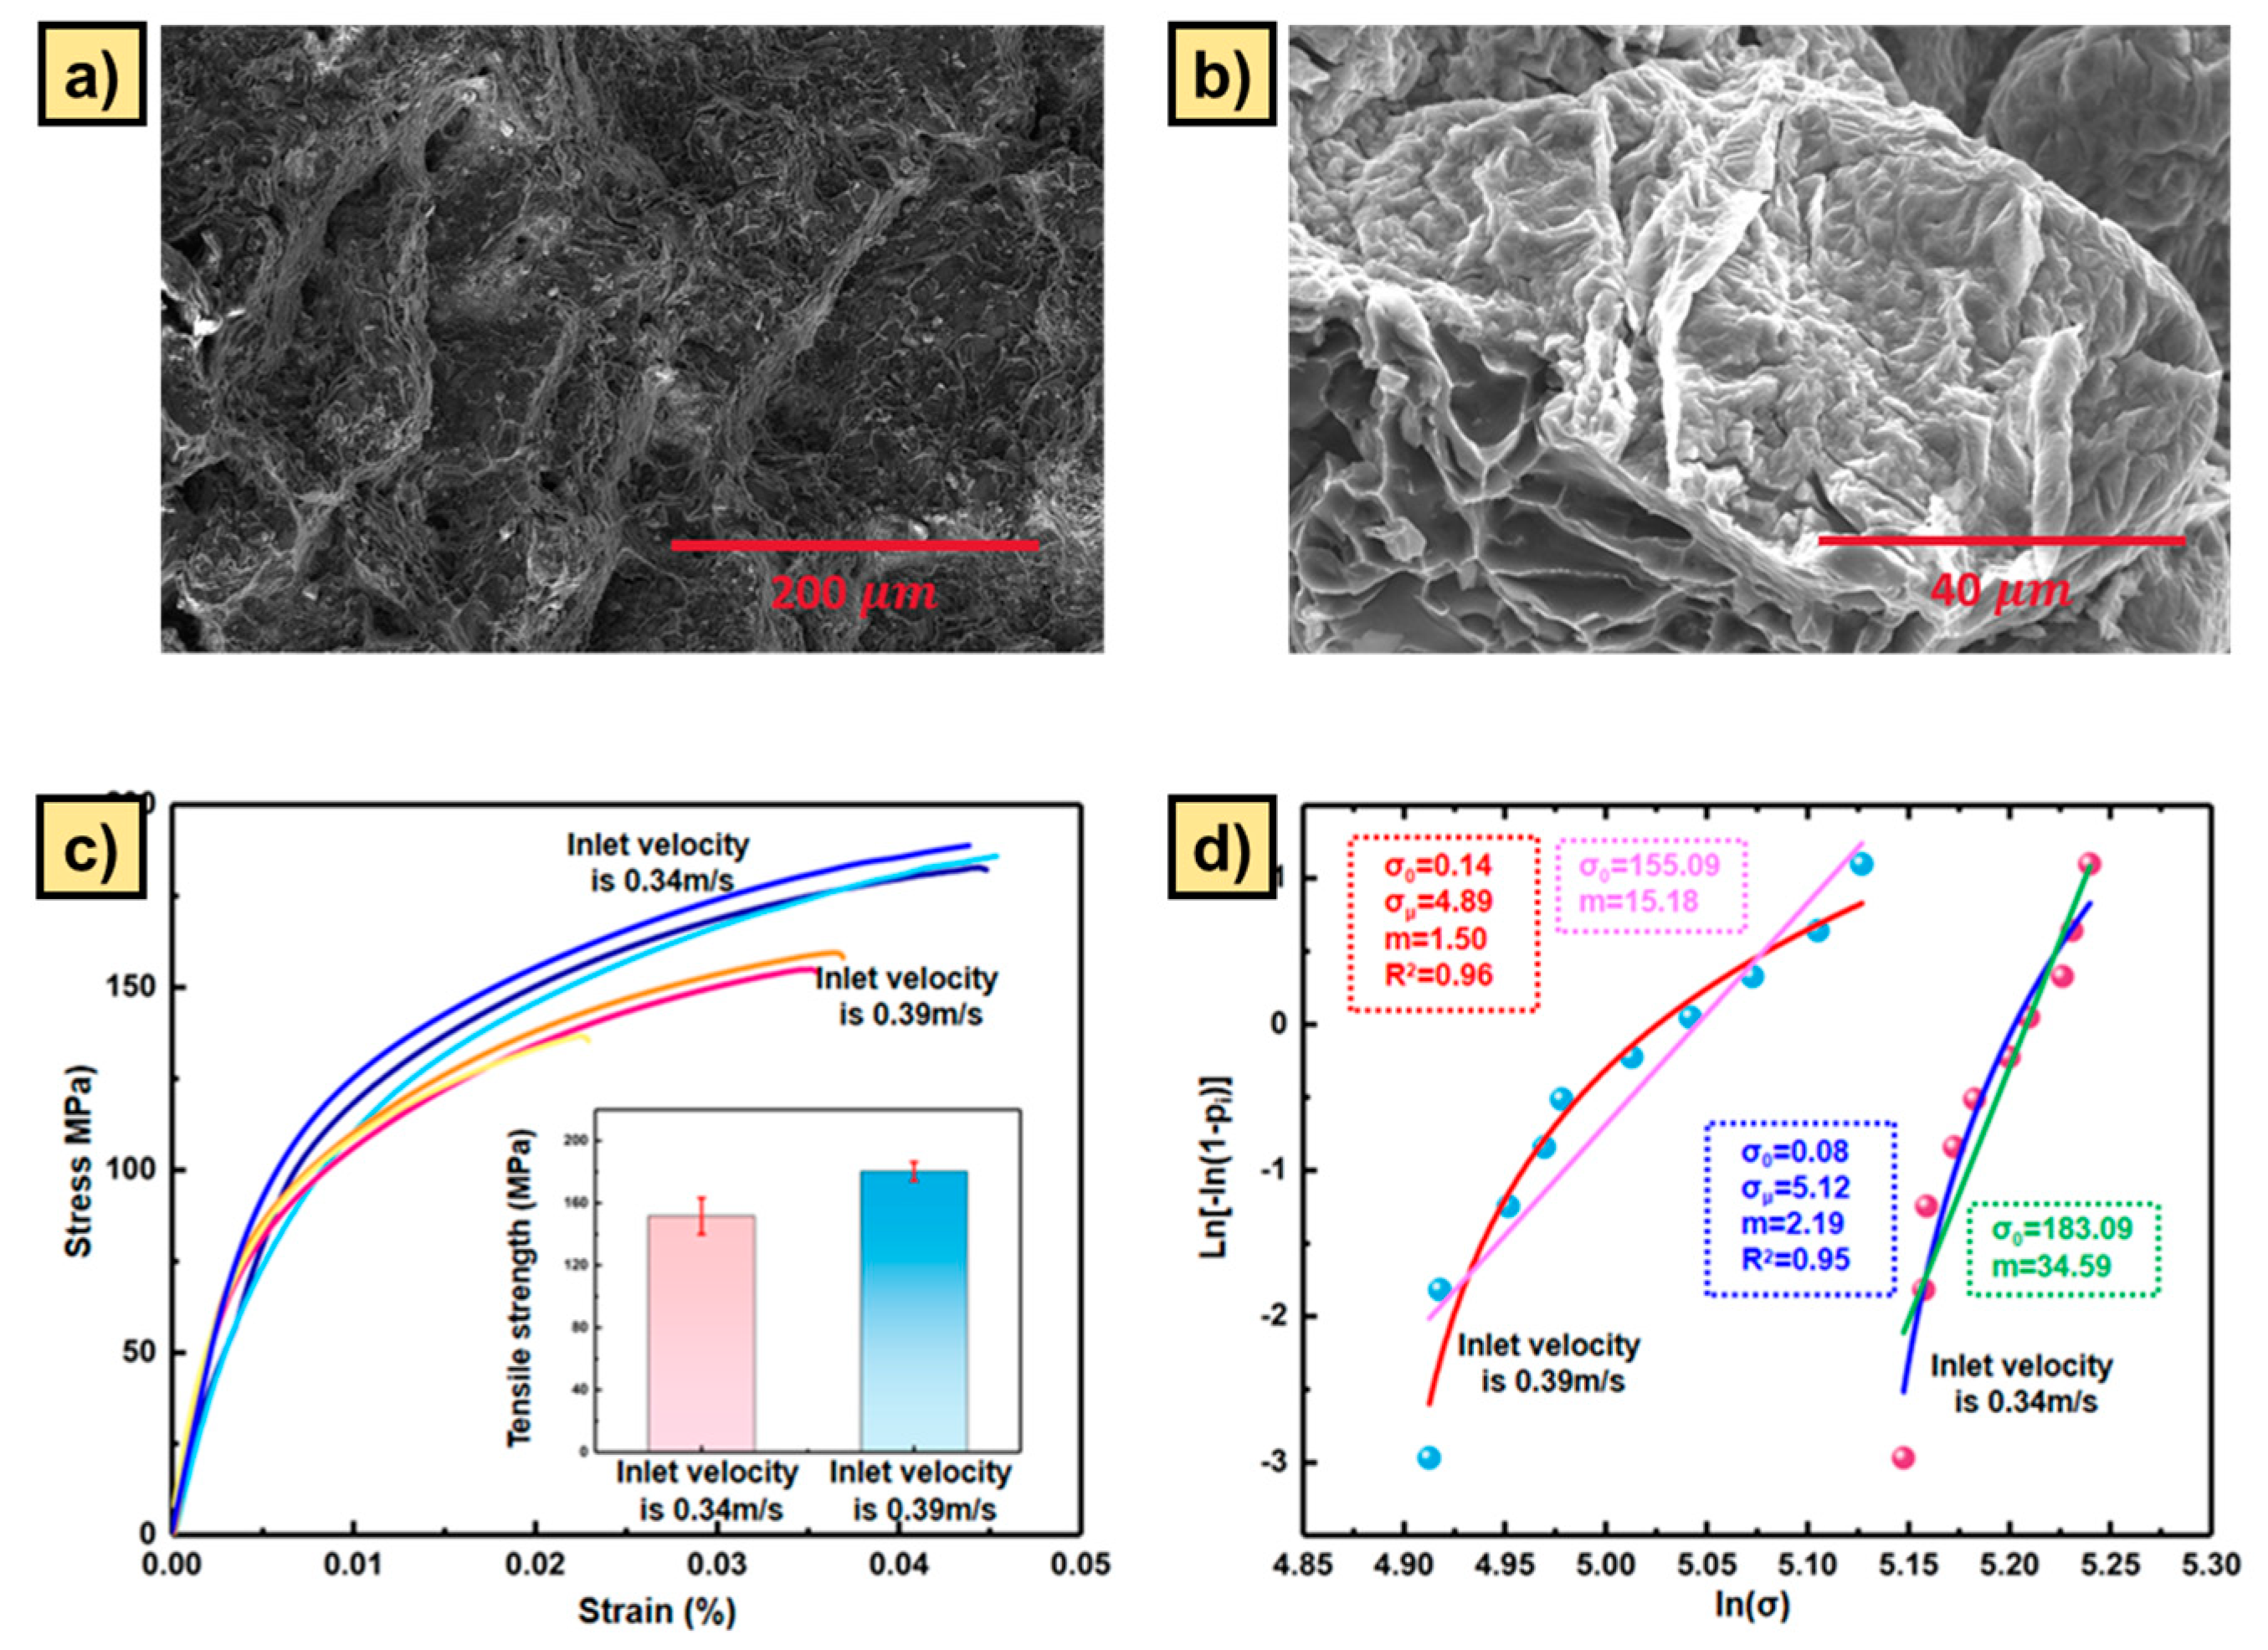
4.4. Casting Experiment and Reliability Analysis

By combining the numerical simulation results of the 3D model, the viability of low-pressure casting was confirmed for casting A. Two castings were produced: casting 1 had an inlet velocity of 0.34 m/s and casting 2 had an inlet velocity of 0.39 m/s. Ten tensile test bars were extracted from the inside of each casting, and three bars from each group were randomly selected for plotting. The stress–strain curves of the tensile specimens are shown in Figure 6. The average tensile strength of the castings is 180.38 MPa at an entrance speed of 0.34 m/s and 151.67 MPa at 0.39 m/s. These results indicate that the casting with an inlet velocity of 0.34 m/s exhibited a superior performance compared to that with an inlet speed of 0.39 m/s, showcasing a 16 percent increase in average tensile strength. The two-parameter and three-parameter Weibull statistics analysis of tensile strength are shown in Figure 6. The two-parameter Weibull modulus ( m ) of casting 2 is 15.18, which is lower than casting 1 ( m = 34.59). The scale parameter ( σ 0 ) of casting 2 is 155.09 MPa, indicating a 15 percent reduction compared to that of casting 1 (183.09 MPa). The three-parameter Weibull analysis showed similar results. The ( m ) of the specimen from casting 1 is 2.19, which is higher than the casting 2 sample ( m = 1.50). This suggests that the casting properties become more consistent when poured with the critical inlet velocity [33,34].
The SEM images depicting the fracture morphology of the tensile specimens are illustrated in Figure 6a,b. For inlet velocities exceeding the critical threshold, Figure 6b displays a fracture surface characterized by a folded structure indicative of a double-layer oxide film defect. It exhibited the typical characteristics of entrained oxide film defects caused by turbulence during the filling process. Due to the turbulent flow, the free surface of the liquid flow experiences partial uplift, and when it falls back, it folds and entrains the surface oxide layer into the melt, ultimately remaining within the casting. These types of defects are the most susceptible to cracking within the casting, which is why they are often observed at the fracture surfaces of tensile specimens. Since the inlet velocity remained less than 0.5 m/s, it indicated that the oxide film defects (shown in Figure 6b) formed in the so-called spreading stage. Conversely, when the inlet velocity falls below the critical threshold proposed in this study, Figure 6a illustrates a fracture surface devoid of any double-layer oxide film defects. Therefore, pouring with critical inlet velocity can effectively eliminate the double-layer oxide film defects within the casting.

5. Conclusions

In this study, a mathematical model of the spreading flow of liquid metal at the bottom of the cavity during the low-pressure casting process was developed, and the mathematical model was verified for mesh independence in both 2D and 3D models. A typical structural model was designed based on the proportional relationship between the cross-sectional area of the bottom of the casting cavity and the cross-sectional area of the inlet. The results of numerical simulations of typical structures and actual castings were compared, and a low-pressure casting pour was performed on one of the castings. The final conclusions are summarized as follows:
  • The critical inlet velocity of the spreading stage was obtained based on simulation results. When the ratio of the cross-sectional area change is less than 40, the relationship between the critical velocity and the cross-sectional area ratio follows the empirical formula v = 0.26 · e x p x 11.57 + 0.25 . The critical inlet velocity remains 0.26 m/s when the ratio of the cross-sectional area exceeds 40.
  • The experimental results show that when the inlet velocity is below the critical velocity of 0.5 m/s proposed by Campbell, oxide film defects can still be observed at the tensile fracture of the casting, and the mechanical properties decrease. This proves that the oxide film defects can also be entrained during the spreading stage.
  • The critical inlet velocity of the actual casting is larger than the critical inlet velocity of the typical structures. This can be attributed to the difference between cross-sectional shapes of the typical structures and actual castings. The critical velocity obtained from typical structures shows stricter requirements and can be used for the process design of actual castings to eliminate oxide film defects.

Author Contributions

Conceptualization, Z.Q. and F.C.; methodology, Z.Q., L.Z. and F.C.; software, Z.Q. and H.S. (Heqian Song); validation, Z.Q. and X.Z.; investigation, C.Z., Z.J. and G.C.; data curation, Z.Q. and C.Z.; writing—original draft preparation, Z.Q.; writing—review and editing, C.Z. and H.S. (Hongxian Shen); visualization, Z.Q., H.S. (Heqian Song) and X.Z.; supervision, J.S. and F.C.; project administration, J.S. and X.Z.; funding acquisition, J.S. and X.Z. All authors have read and agreed to the published version of the manuscript.

Funding

This research was funded by National Key Research and Development Program of China, grant number ZDYF20230129 and National Natural Science Foundation of China, grant number 52105349.

Data Availability Statement

The data that support the findings of this study are available from the corresponding author upon reasonable request.

Conflicts of Interest

The authors declare no conflicts of interest.

References

  1. Luo, A.A.; Sachdev, A.K.; Apelian, D. Alloy development and process innovations for light metals casting. J. Mater. Process. Technol. 2022, 306, 117606. [Google Scholar] [CrossRef]
  2. Lai, N.W.; Griffiths, W.D.; Campbell, J. Modelling of the potential for oxide film entrainment in light metal alloy castings. Model. Cast. Weld. Adv. Solidif. Process.-X 2003, 415–422. [Google Scholar]
  3. Liu, S.G.; Cao, F.Y.; Zhao, X.Y.; Jia, Y.D.; Ning, Z.L.; Sun, J.F. Characteristics of mold filling and entrainment of oxide film in low pressure casting of A356 alloy. Mater. Sci. Eng. A—Struct. Mater. Prop. Microstruct. Process. 2015, 626, 159–164. [Google Scholar] [CrossRef]
  4. Li, Q.; Hao, Q.T.; Jie, W.Q.; Daan, M. Influence of filling parameters on fatigue properties of A357 alloy produced by counter pressure plaster mold casting. Trans. Nonferrous Met. Soc. China 2013, 23, 1281–1285. [Google Scholar] [CrossRef]
  5. Fox, S.; Campbell, J. Visualisation of oxide film defects during solidification of aluminium alloys. Scr. Mater. 2000, 43, 881–886. [Google Scholar] [CrossRef]
  6. Sun, J.Y.; Le, Q.C.; Fu, L.; Bai, J.; Tretter, J.; Herbold, K.; Huo, H.W. Gas entrainment behavior of aluminum alloy engine crankcases during the low-pressure-die-casting process. J. Mater. Process. Technol. 2019, 266, 274–282. [Google Scholar] [CrossRef]
  7. Viswanath, A.; Manu, M.V.; Savithri, S.; Pillai, U.T.S. Numerical simulation and experimental validation of free surface flows during low pressure casting process. J. Mater. Process. Technol. 2017, 244, 320–330. [Google Scholar] [CrossRef]
  8. Puga, H.; Barbosa, J.; Azevedo, T.; Ribeiro, S.; Alves, J.L. Low pressure sand casting of ultrasonically degassed AlSi7Mg0.3 alloy: Modelling and experimental validation of mould filling. Mater. Des. 2016, 94, 384–391. [Google Scholar] [CrossRef]
  9. Niu, Z.C.; Liu, G.Y.; Li, T.; Ji, S.X. Effect of high pressure die casting on the castability, defects and mechanical properties of aluminium alloys in extra-large thin-wall castings. J. Mater. Process. Technol. 2022, 303, 117525. [Google Scholar] [CrossRef]
  10. Duan, Z.Q.; Chen, W.P.; Pei, X.L.; Hou, H.; Zhao, Y.H. A multimodal data-driven design of low pressure die casting gating system for aluminum alloy cabin. J. Mater. Res. Technol. 2023, 27, 2723–2736. [Google Scholar] [CrossRef]
  11. Dong, G.J.; Li, S.D.; Ma, S.Z.; Zhang, D.S.; Bi, J.; Wang, J.; Starostenkov, M.D.; Xu, Z. Process optimization of A356 aluminum alloy wheel hub fabricated by low-pressure die casting with simulation and experimental coupling methods. J. Mater. Res. Technol. 2023, 24, 3118–3132. [Google Scholar] [CrossRef]
  12. Sulaiman, S.; Hamouda, A.M.S. Modeling of the thermal history of the sand casting process. J. Mater. Process. Technol. 2001, 113, 245–250. [Google Scholar] [CrossRef]
  13. Tiryakioglu, M.; Yousefian, P.; Eason, P.D. Quantification of Entrainment Damage in A356 Aluminum Alloy Castings. Metall. Mater. Trans. A—Phys. Metall. Mater. Sci. 2018, 49, 5815–5822. [Google Scholar] [CrossRef]
  14. Zhang, Z.H.; Liu, J.H.; Chen, J.M.; Wen, F.L.; Jia, R.; Ma, Q.X. Optimization of residual stress in low-pressure casting of ZL205A alloys. J. Manuf. Process. 2023, 99, 338–350. [Google Scholar] [CrossRef]
  15. Aniszewski, W.; Ménard, T.; Marek, M. Volume of Fluid (VOF) type advection methods in two-phase flow: A comparative study (vol 97, pg 52, 2014). Comput. Fluids 2017, 152, 193–194. [Google Scholar] [CrossRef]
  16. Homayonifar, P.; Babaei, R.; Attar, E.; Shahinfar, S.; Davami, P. Numerical modeling of splashing and air entrapment in high-pressure die casting. Int. J. Adv. Manuf. Technol. 2008, 39, 219–228. [Google Scholar] [CrossRef]
  17. Zhai, Y.Y.; Fuhrman, D.R.; Christensen, E.D. Numerical simulations of flow inside a stone protection layer with a modified k-w turbulence model. Coast. Eng. 2024, 189, 104469. [Google Scholar] [CrossRef]
  18. Fernández-Fidalgo, J.; Cueto-Felgueroso, L.; Ramírez, L.; Martínez, A.; Nogueira, X. Pore-scale simulation of multiphase flows using equations of state that preserve the correct surface tension. Comput. Methods Appl. Mech. Eng. 2024, 428, 117072. [Google Scholar] [CrossRef]
  19. Huang, G.J.; Xie, S.S.; Cheng, L. Simulation and Experiment on Direct Continuous Casting Process of Lead Frame Copper Alloy. In Proceedings of the 10th International Conference on Numerical Methods in Industrial Forming Processes (NUMIFORM 2010), Pohang, Republic of Korea, 13–17 June 2010; pp. 515–522. [Google Scholar]
  20. Li, T.; Davies, J.M.T. Evolution of Entrainment Defects Formed in Mg-Y Alloy Castings. Metall. Mater. Trans. A—Phys. Metall. Mater. Sci. 2020, 51, 5389–5400. [Google Scholar] [CrossRef]
  21. Seydani, M.Z.; Krimi, A.; Khelladi, S.; Bedel, M.; El Mansori, M. 3D numerical simulation and experimental validation of resin-bonded sand gravity casting: Filling, cooling, and solidification with SPH and ProCAST approaches. Therm. Sci. Eng. Prog. 2024, 47, 102329. [Google Scholar] [CrossRef]
  22. Green, N.R.; Campbell, J. Influence in oxide film filling defects on the strength of Al-7si-Mg Alloy Castings. Trans. Am. Foundry Soc. 1994, 102, 341–347. [Google Scholar]
  23. Yang, H.H.; Zhang, Z.H.; Tan, C.H.; Ito, M.K.; Pan, P.; Wang, X.S. Rotating Bending Fatigue Microscopic Fracture Characteristics and Life Prediction of 7075-T7351 Al Alloy. Metals 2018, 8, 210. [Google Scholar] [CrossRef]
  24. Jia, X.; Cheng, Z.; Guo, B. Nonlinear Fitting Based Weibull Distribution Parameter Confidence Interval Estimation Method. CN201811441043.8, 7 August 2020. [Google Scholar]
  25. Jia, X.; Cheng, Z.; Guo, B. Distribution Function Logarithmic Transformation Based Weibull Distribution Parameter Estimating Method, Involves Estimating Failure Probability of Each Sample Data, and Performing Logarithm Transform by Weibull Distribution Function. CN109101466A, 22 March 2019. [Google Scholar]
  26. Jian, L.; Jian, P.; Bing, H.; Xie, G.Y. Oxidation kinetics of Haynes 230 alloy in air at temperatures between 650 and 850 °C. J. Power Sources 2006, 159, 641–645. [Google Scholar] [CrossRef]
  27. Divandari, M.; Campbell, J. Morphology of oxide films of Al5Mg alloy in dynamic conditions in casting. Int. J. Cast Met. Res. 2005, 18, 187–192. [Google Scholar] [CrossRef]
  28. Song, H.Q.; Zhang, L.Y.; Cao, F.Y.; Shen, H.X.; Ning, Z.L.; Huang, Y.J.; Zhao, X.Y.; Gu, X.; Qiu, Z.A.; Sun, J.F. Three-dimensional reconstruction of bifilm defects. Scr. Mater. 2021, 191, 179–184. [Google Scholar] [CrossRef]
  29. Mirak, A.R.; Divandari, M.; Boutorabi, S.M.A.; Campbell, J. Oxide film characteristics of AZ91 magnesium alloy in casting conditions. Int. J. Cast Met. Res. 2007, 20, 215–220. [Google Scholar] [CrossRef]
  30. Rashid, A.; Campbell, J. Oxide defects in a vacuum investment-cast Ni-based turbine blade. Metall. Mater. Trans. A—Phys. Metall. Mater. Sci. 2004, 35, 2063–2071. [Google Scholar] [CrossRef]
  31. Griffiths, W.D.; Lai, N.W. Double Oxide Film Defects in Cast Magnesium Alloy. Metall. Mater. Trans. A 2007, 38, 190–196. [Google Scholar] [CrossRef]
  32. Bozchaloei, G.E.; Varahram, N.; Davami, P.; Kim, S.K. Effect of oxide bifilms on the mechanical properties of cast Al–7Si–0.3Mg alloy and the roll of runner height after filter on their formation. Mater. Sci. Eng. A 2012, 548, 99–105. [Google Scholar] [CrossRef]
  33. Zhao, X.Y.; Ning, Z.L.; Cao, F.Y.; Liu, S.G.; Huang, Y.J.; Liu, J.S.; Sun, J.F. Effect of Double Oxide Film Defects on Mechanical Properties of As-Cast C95800 Alloy. Acta Metall. Sin.-Engl. Lett. 2017, 30, 541–549. [Google Scholar] [CrossRef]
  34. Song, H.Q.; Zhang, L.Y.; Cao, F.Y.; Shen, H.X.; Ning, Z.L.; Huang, Y.J.; Zhao, X.Y.; Gu, X.; Li, L.; Sun, J.F. Structure of oxide bifilms in nickel-aluminium bronze alloys. Appl. Surf. Sci. 2021, 541, 148491. [Google Scholar] [CrossRef]
Figure 1. A schematic of (a) the liquid metal flow state of the mold-filling process during low-pressure casting, (b) the typical structural model, and (c) a simplified computational model.
Jmmp 08 00168 g001
Figure 2. The double-layer oxide films encapsulate the gas movement inside the liquid metal: (a) involvement of double-layer oxide films in a two-dimensional model; (b) involvement of double-layer oxide films in a three-dimensional model.
Jmmp 08 00168 g002
Figure 3. Mechanism of the formation of double-layer oxide film defects in the spreading stage of the liquid metal: (a,b) the flow process of the metal liquid in the spreading stage; (c) the double oxide film encapsulates the gas; (d) folding of the oxide film on the surface of the liquid metal.
Jmmp 08 00168 g003
Figure 4. Relationship between critical inlet velocity and cross-section ratio for typical structures.
Jmmp 08 00168 g004
Figure 5. (a,b) Computational conditions for numerical simulations and (c,d) calculations from numerical simulations.
Jmmp 08 00168 g005
Figure 6. (a) SEM results of fracture in casting 1, (b) SEM results of fracture in casting 2, (c) statistical results of mechanical properties, and (d) Weibull distribution analysis of the specimens.
Jmmp 08 00168 g006
Table 1. Variation in physical parameters of alloy A357 with temperature.
Temperature (K)Surface Tension (mN·m−1)Density
(kg/m−3)
Newtonian Viscosity
(kg·m−1·s−1)
995.158762390.940.001152
979.158822395.460.001191
963.15887.622399.990.001233
947.15892.32404.510.001277
931.15896.922409.040.001325
915.15902.972413.560.001376
899.15907.422418.090.001432
888.15910.142421.030.00147
886.15910.242430.720.001484
883.15910.562439.450.001499
880.15910.672447.340.001513
878.15910.892454.510.001528
874.15911.172464.150.001551
870.15911.392472.650.001574
866.15911.582480.230.001598
861.15911.732489.160.00163
856.15911.832497.010.001663
850.15911.892505.620.001706
844.15911.912537.130.001741
843.15907.912542.750.001754
839.15887.142547.520.001777
831.15871.412553.110.001838
Table 2. The numerical simulation scheme.
Cross-Sectional Area Ratio1:101:151:201:251:301:401:501:60
Inlet velocity (m/s)0.31  0.32  0.33  0.34  0.35  0.36  0.37  0.38  0.39  0.40
0.41  0.42  0.43  0.44  0.45  0.46  0.47  0.48  0.49  0.50
a (mm)20
b (mm)20030040050060080010001200
h (mm)5
H (mm)200
Table 3. Results of numerical discretization case study.
Model StructureMesh Size
(mm)
ConvergenceComputation TimeVelocity
(m/s)
Relative Error
(%)
2D2.5Stable17 min 23 s0.7906-
1Stable25 min 10 s0.77292.24
0.5Stable31 min 35 s0.75971.71
0.25Stable12 h 16 min0.75310.87
0.1Stable17 h 35 min0.74910.53
3D10Stable6 h 13 min0.6155-
8Stable9 h 12 min0.59832.79
5Stable29 h 45 min0.59171.10
2Stable56 h 56 min0.58660.86
1Stable179 h 33 min0.58230.73
Table 4. Comparison of critical inlet velocity.
Cross-Sectional RatioCritical Inlet Velocity of Castings
(m/s)
Critical Inlet Velocity
of Typical Structure
(m/s)
Relative Error
(%)
Castings A1:11.780.36140.34394.84
Disclaimer/Publisher’s Note: The statements, opinions and data contained in all publications are solely those of the individual author(s) and contributor(s) and not of MDPI and/or the editor(s). MDPI and/or the editor(s) disclaim responsibility for any injury to people or property resulting from any ideas, methods, instructions or products referred to in the content.

