Article

Laser Powder Bed Fusion of Superelastic Ti-Ni Lattice Structures: Process Design and Testing

by
Anatolie Timercan
,
Donatien Campion
,
Patrick Terriault
and
Vladimir Brailovski
*
Department of Mechanical Engineering, École de Technologie Supérieure, 1100 Notre-Dame West, Montreal, QC H3C 1K3, Canada
*
Author to whom correspondence should be addressed.
J. Manuf. Mater. Process. 2024, 8(4), 176; https://doi.org/10.3390/jmmp8040176
Submission received: 8 July 2024 / Revised: 29 July 2024 / Accepted: 7 August 2024 / Published: 13 August 2024

Abstract

:
Laser powder bed fusion allows the production of complex geometries and eases the shaping of difficult-to-transform materials, such as near-equiatomic Ti-Ni shape memory alloys. In this study, a numerical model was used to select 11 sets of printing parameters with different volumetric energy densities (VEDs) and build rates (BRs) to produce bulk Ti-50.26at%Ni alloy specimens. The manufactured specimens were studied in terms of their structural integrity, printed density, chemical composition, transformation temperatures, and crystalline phases. At high VEDs and low BRs, a significant decrease in the nickel content was observed. VED = 90 J/mm3 and BR = 10 cm3/h yielded a printed density of 99.94% and an austenite finish temperature of Af = 26.3 °C. The same printing conditions were used to produce 60% porous diamond and gyroid lattice structures. After heat treatment at 500 °C for 30 min, the diamond lattices manifested larger apparent recovery strains (7 vs. 6%), higher compliance (2.9 vs. 3.4 GPa), and similar yield stresses (~48 MPa) compared to their gyroid equivalents. The numerical model predicted that at an equivalent apparent compression strain of 6%, only a ~2% volume fraction of the diamond lattice material underwent plastic deformation as compared to ~20% for its gyroid equivalent.

1. Introduction

The advent of additive manufacturing (AM) has opened the door to numerous new applications and developments in recent years, most notably the manufacture of complex geometries for the aerospace and biomedical fields [1,2]. Particularly of interest in biomedical science is the production of porous implants with mechanical properties close to those of bone [3,4,5]. In this context, various types of lattice structures are being studied and are providing favorable outcomes [6,7]. Additive manufacturing has also facilitated the shaping of materials that are difficult and costly to form. One such material is near-equiatomic Ti-Ni shape memory alloy (SMA), also known as Nitinol, a functional metallic material that has been widely used in stents and orthodontics due to its shape memory and superelastic properties [8]. These remarkable properties are attributable to the diffusionless transformation occurring between the two crystallographic phases: high-temperature austenite and low-temperature martensite. This martensitic transformation can be triggered either by inducing mechanical stress or by changing the temperature. The notoriously low formability of Ti-Ni has been a limiting factor for its wider practical application, since commonly used forming methods such as casting, forging, rolling, drawing, and laser or electrochemical machining restrain the product geometry to relatively simple shapes [9]. Since additive manufacturing allows the production of complex geometries and eases the shaping of difficult-to-transform functional materials, an investigation is warranted into the synergy between benefits offered by AM, the design flexibility of porous structures, and the functional properties of Ti-Ni. The most common metal AM processes are laser-directed energy deposition (L-DED) and laser or electron beam powder bed fusion (L(EB)-PBF). L-DED involves feeding powdered material through a nozzle into the focus of a laser beam, fusing the powder particles to the substrate. This process is primarily used for repairs. In contrast, L(EB)-PBF processes involve spreading a powder layer on a previously fused substrate, with the new layer being melted by a laser or electron beam. Within the PBF processes, EB-PBF is characterized by greater productivity, reduced cooling rates and residual stresses, and therefore lower risks of distortion and cracking. On the other hand, LPBF provides higher resolution and better surface finish, both advantages being crucial for the production of such intricate geometries as lattice structures [10].
Multiple attempts to produce Ti-Ni by laser powder bed fusion have been documented in the literature, but with varying degrees of success [11,12,13]. The main difficulty encountered in this effort appears to be the selection of printing parameters which would allow the printing of defect-free parts, while preventing excessive nickel evaporation from the alloy [14,15,16,17,18,19]. The latter is especially important, since the shape memory and superelastic properties of Ti-Ni are strongly dependent on the chemistry of the material [20]. In a bid to produce low-stiffness structures, Bartolomeu et al. [21] attempted to manufacture superelastic Ti-Ni lattices, but they were not able to observe in them any superelastic response. Biffi et al. [22] were more successful, but the superelasticity of their lattice structures was only partial. This was partially due to increased martensitic transformation temperatures caused by the complexity of controlling the material composition during printing. The above-mentioned difficulties mean that more work must be devoted to the optimization of laser powder bed fusion of superelastic Ti-Ni lattice structures.
With this objective in mind, this study aims to design, manufacture, numerically simulate, and experimentally characterize superelastic Ti-Ni lattice structures [23]. To find an optimal manufacturing regime, a series of Ti-Ni specimens were manufactured using a simulation-driven density process mapping. The printed specimens were analyzed in terms of their density and chemical composition, and subjected to structural and differential scanning calorimetry analyses. Next, the most promising printing regime was selected and used to manufacture bulk testing coupons as well as diamond and gyroid lattice structures. The lattice structures were analyzed in terms of their structural integrity, geometric conformity, and mechanical behavior, and the experimental results were compared to those of the numerical simulations to validate the numerical model and establish a comprehensive basis for the optimal use of these structures.

2. Materials and Methods

2.1. Manufacturing Parameter Selection

In this study, Ti-50.26 at% Ni 15–53 µm powder was procured from Avimetal Powder Metallurgy Technology Co., Ltd. (Beijing, China) and loaded into a laser powder bed fusion TruPrint 1000 system (Trumpf GmbH, Ditzingen, Germany) equipped with two 200 W fiber lasers (spot diameter of 55 µm). The powder was also subjected to a particle size analysis using an LS 13 320 XR apparatus (Beckman Coulter, Indianapolis, IN, USA) (Figure 1a) and to scanning electron microscopy (SEM) observations, using a TM3000 microscope (Hitachi, Tokyo, Japan) (Figure 1b).
To determine the process parameter sets allowing us to print highly dense components, a proprietary numerical algorithm allowing the prediction of the density of printed material as a function of the volumetric laser energy density (VED—Equation (1)) and the material build rate (BR—Equation (2)) was used:
VED = P/(v × t × h)
BR = v × t × h
with P [W] being the laser power; v [mm/s], the laser speed; t [mm], the layer thickness; and h [mm], the hatch distance [24].
This algorithm is based on the numerical modeling of a melt pool created by moving a Gaussian heat source across the powder bed and targeting the simultaneous satisfaction of three adimensional ratios relating melt pool dimensions to laser scanning parameters: the melt pool width-to-hatch distance ratio, W/h ∈ 1.5–2.5; the melt pool depth-to-layer thickness ratio, D/t ∈ 2–3.5; and the melt pool length-to-width ratio, L/W ≤ 4. The Ti-Ni alloy material properties used in the model are presented in Table 1.
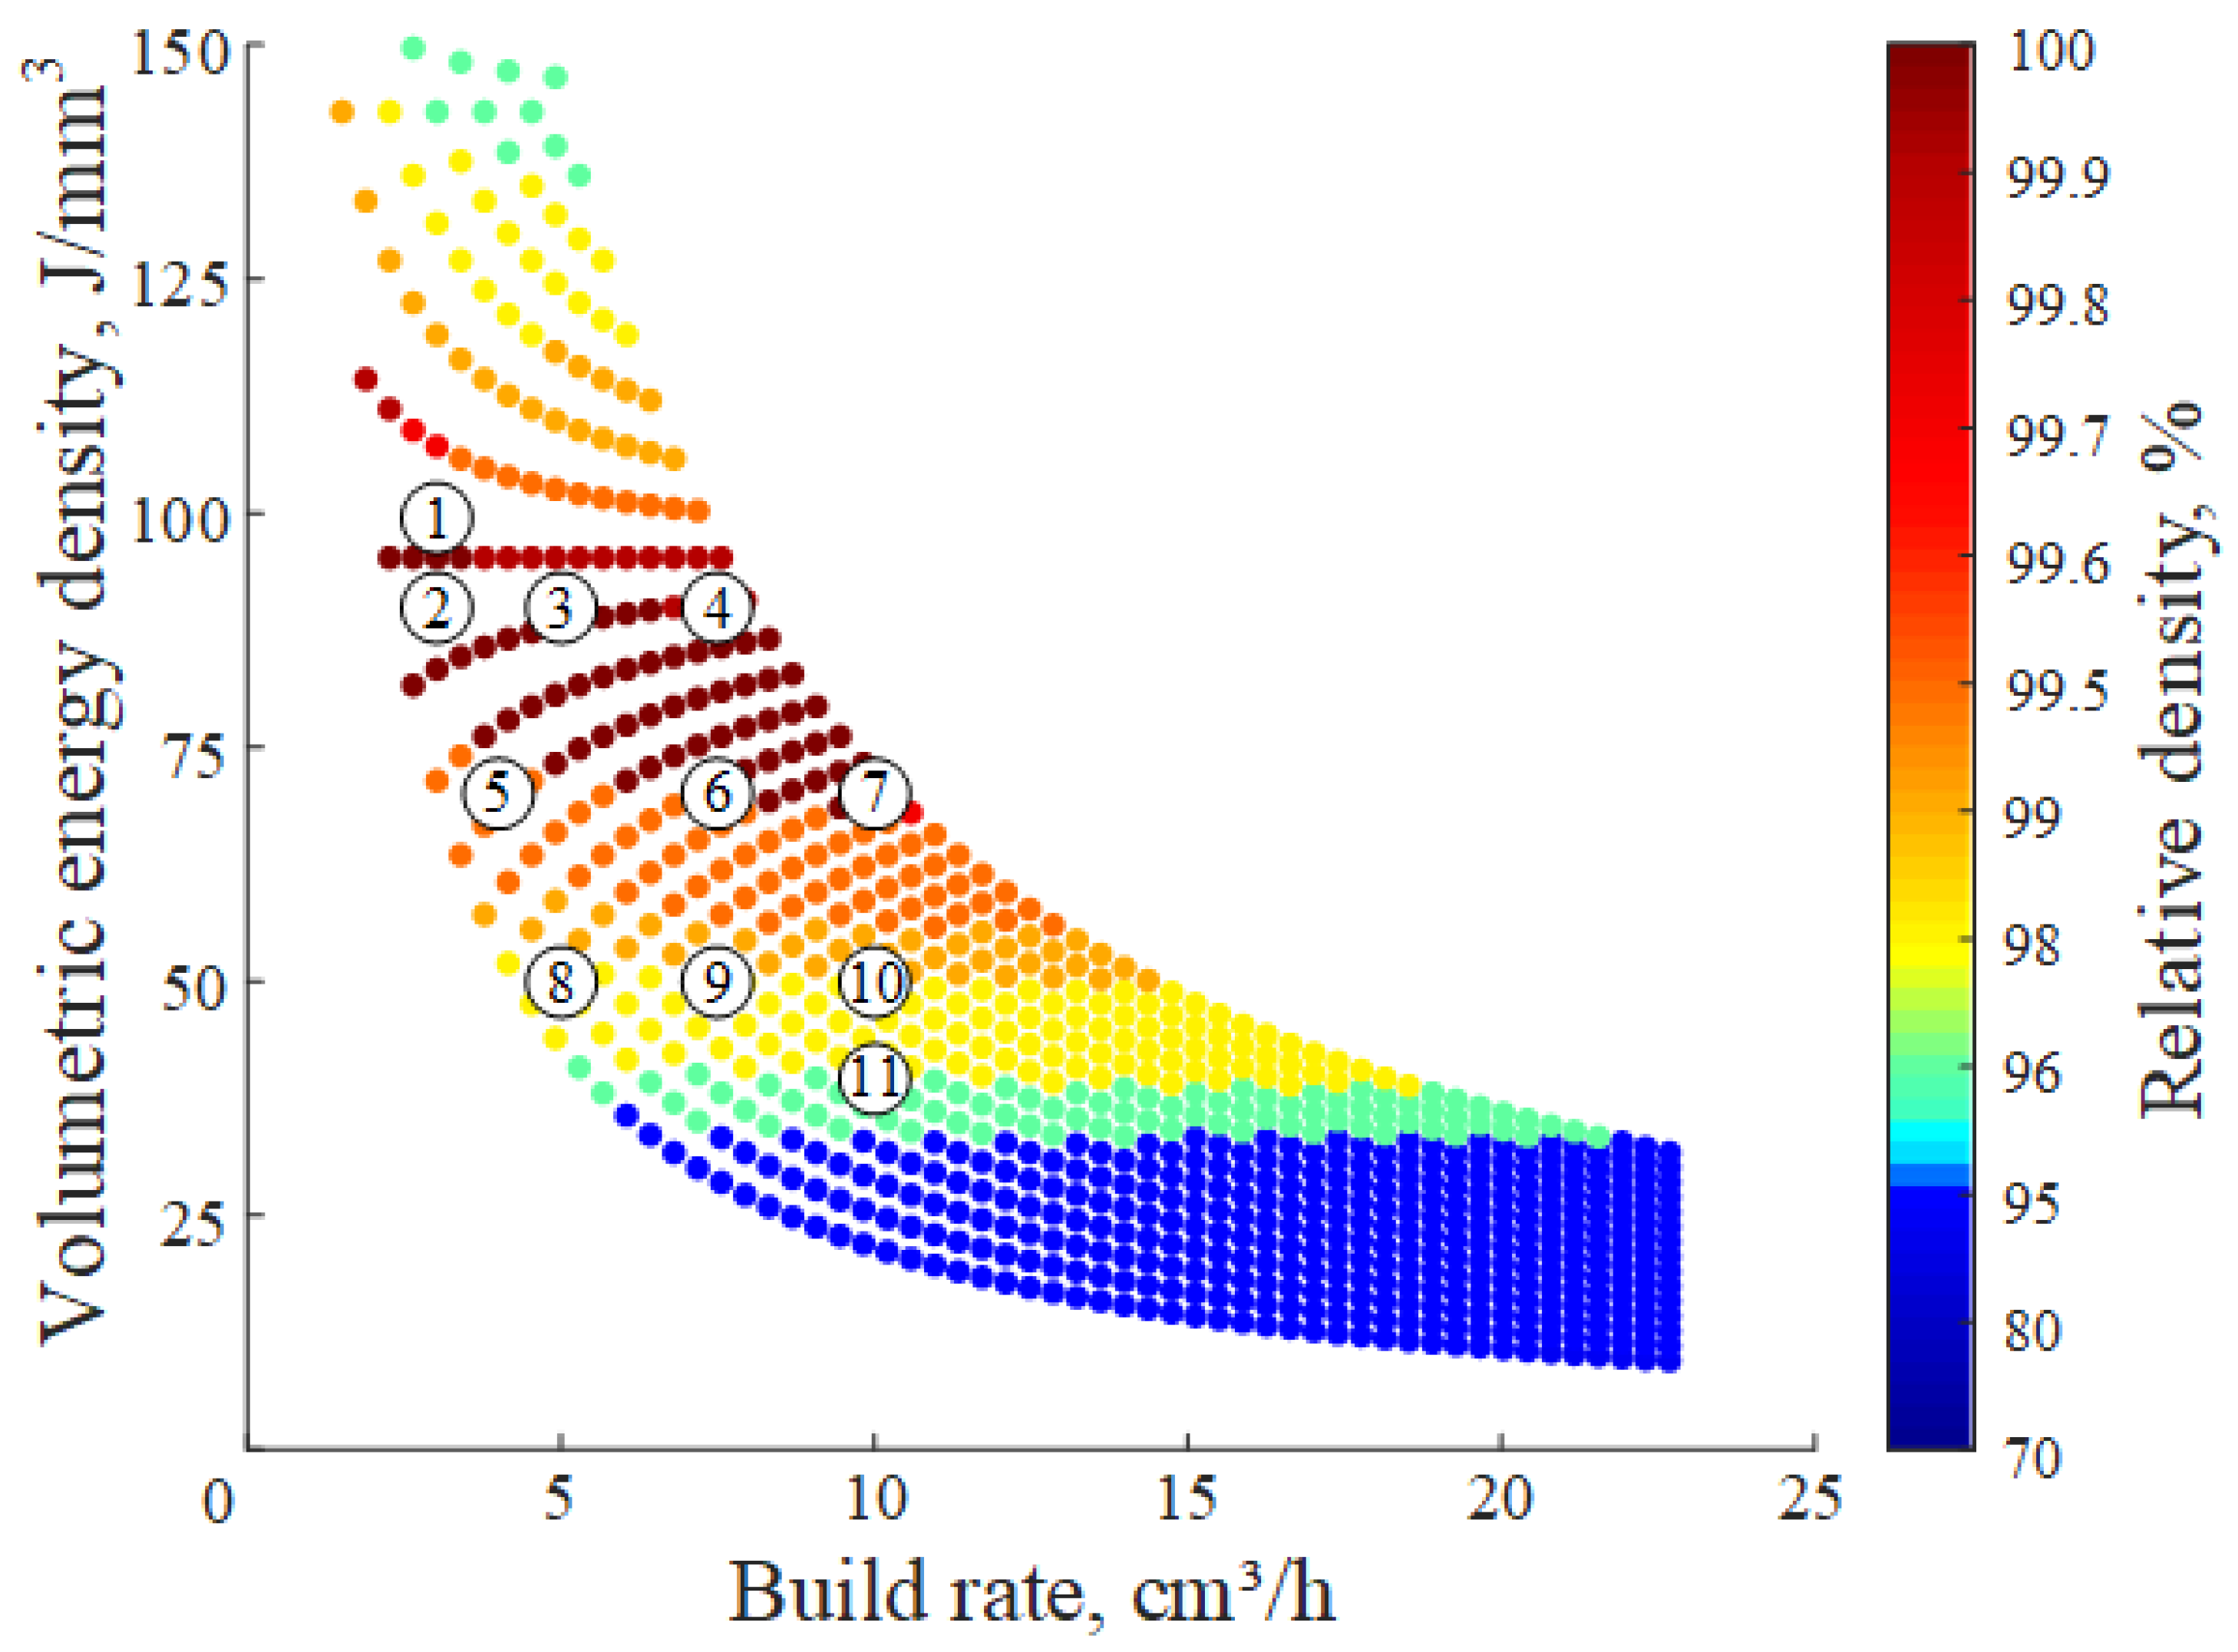
To build the printed density process map shown in Figure 2, the laser power P was varied from 60 to 200 W, the laser speed v from 200 to 3000 mm/s, and the hatch distance h from 30 to 130 µm. Based on the particle size distribution available, the layer thickness t was set to 30 µm. In accordance with the algorithm predictions, a 70 µm hatch distance with VED = 70–100 J/mm3 and BR = 3–10 cm3/h processing parameter ranges predicted a sufficiently large area of the highest printed density. Next, to cover a large portion of the processing map with predicted densities ranging from 97 to 100% with a bid to validate the algorithm, eleven processing parameter sets were selected (Table 2).

2.2. Manufacture, Preparation, Chemical and Structural Analyses of Printed Specimens

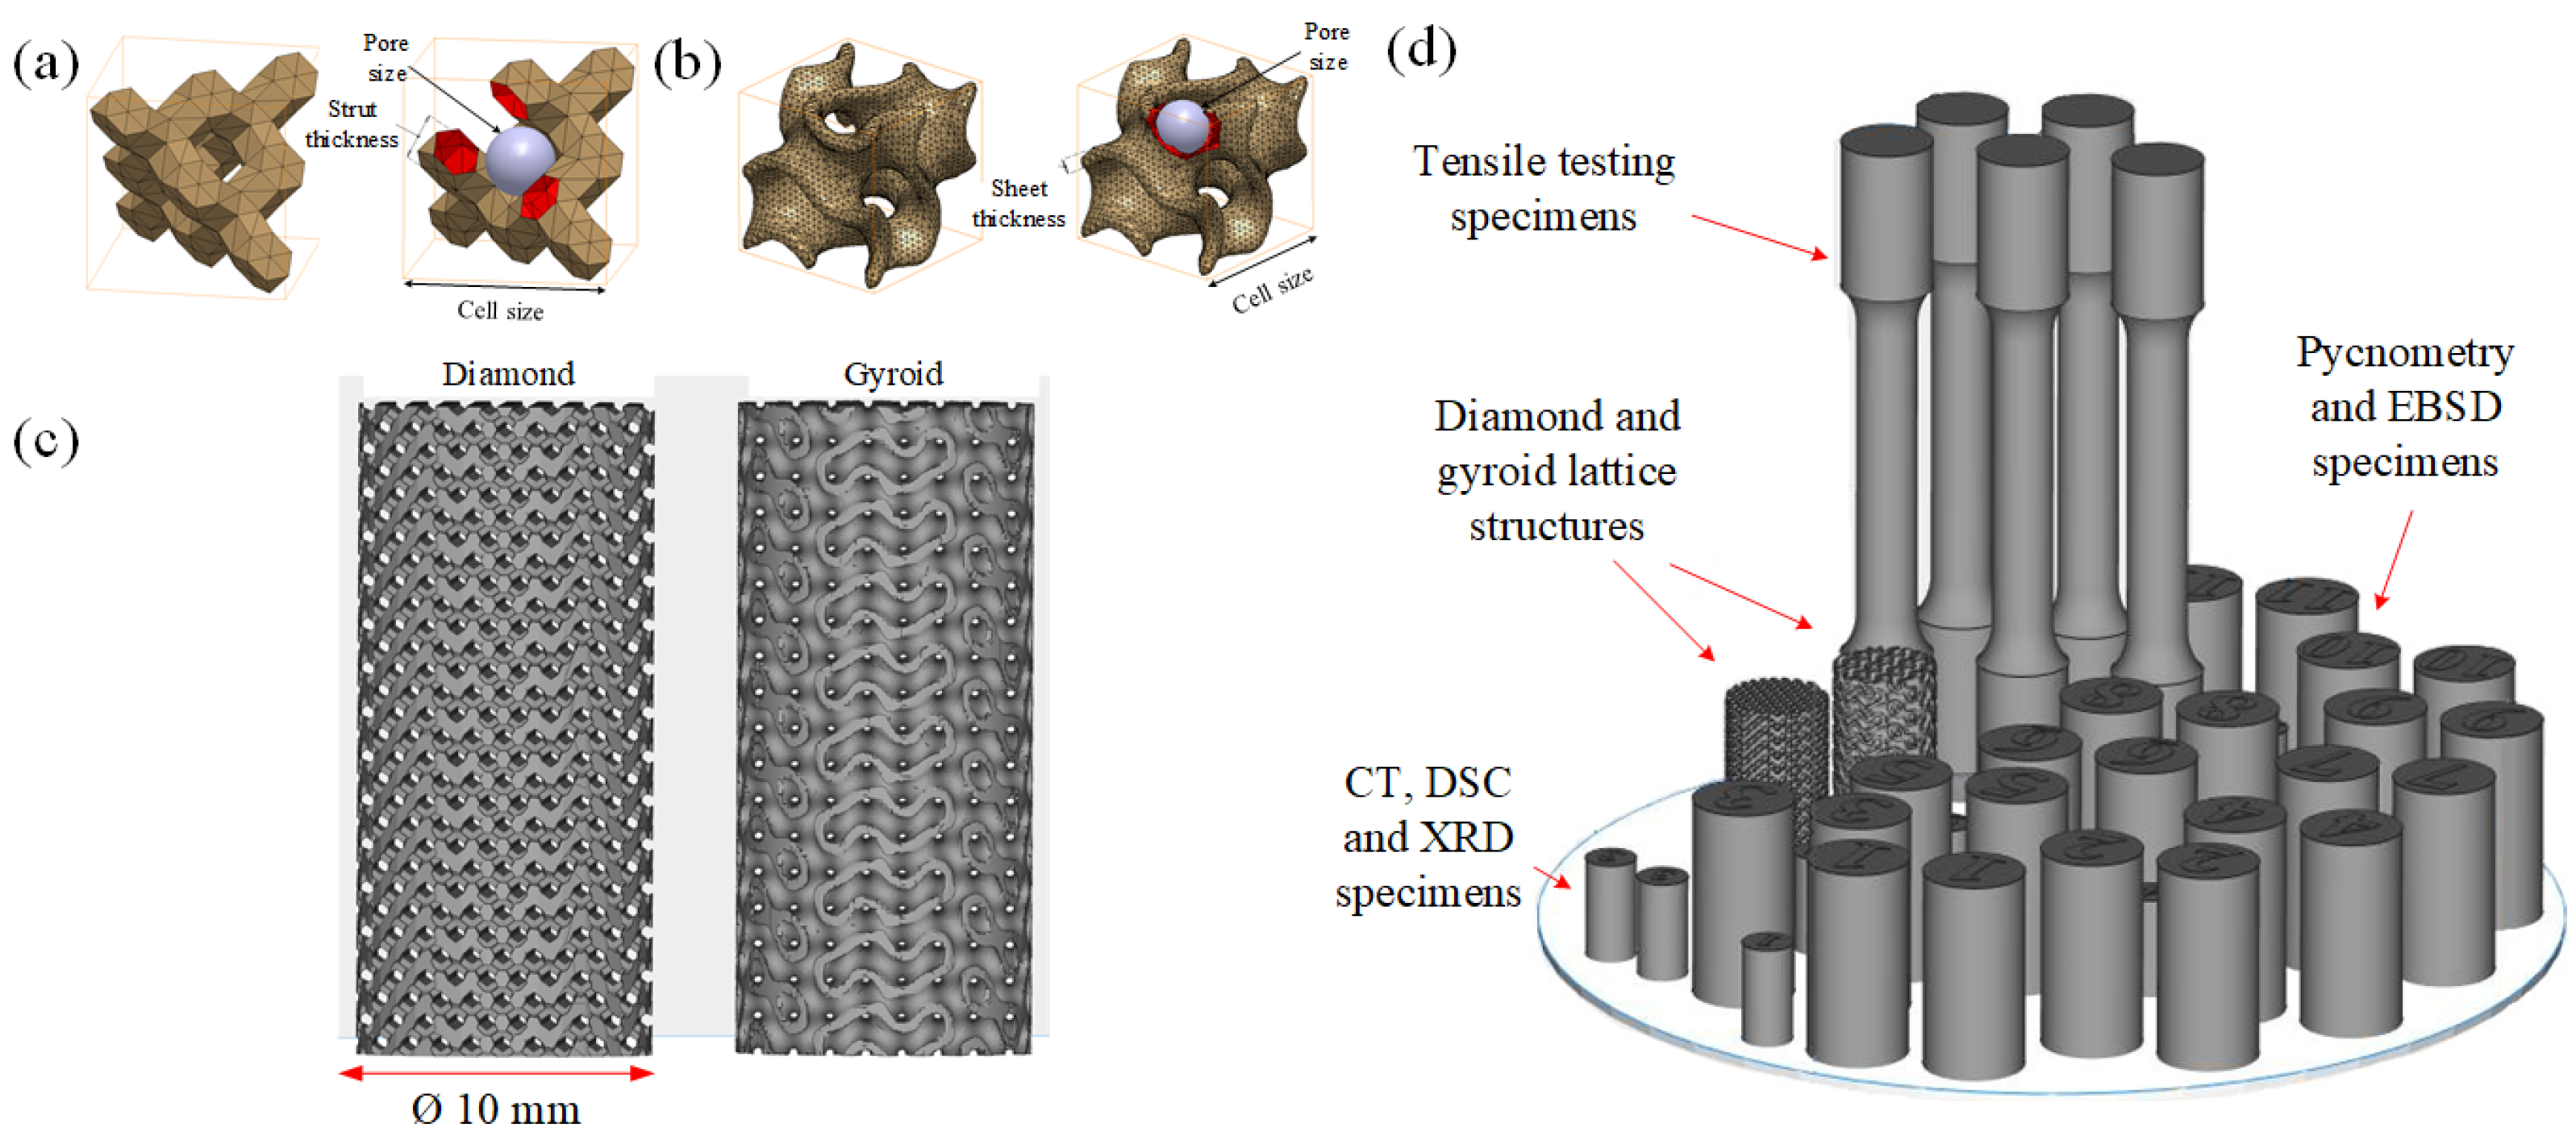
The first printing iterations were carried out on titanium and steel substrates and resulted in the separation of parts from the build plate, forcing the cancelation of the builds after a few layers. This problem was resolved by using a Ti-Ni build plate. Printing was carried out under an argon atmosphere with an O2 content ≤0.01%. Two types of cylindrical specimens were manufactured for each parameter set: 5 mm diameter–10 mm height for DSC and XRD measurements, and 10 mm diameter–20 mm height for density measurements (Figure 3d). Furthermore, 60% porous gyroid and diamond lattice structures were manufactured with Parameter set 7, which had a predicted density of 99.87% and the fastest productivity (BR) among the selected parameters (Figure 3c). The sheet-based gyroid lattice structure was designed using nTop (nTopology, New York, NY, USA) software with the following parameters: a sheet thickness of 0.305 mm, a cell size of 2.431 mm, and a pore size of 0.75 mm (Figure 3b). The equivalent porosity strut-based diamond structure was designed using a proprietary MATLAB (MathWorks, Natick, MA, USA) algorithm with a strut thickness of 0.455 mm, a cell size of 1.485 mm, and a pore size of 0.75 mm (Figure 3a). The selection of these lattice configurations was discussed in detail in a previously published study [26]. Finally, a heat treatment at 500 °C for 30 min followed by air cooling was performed on some of the printed specimens to study the effect of removing residual stresses on the printed material properties.
Titanium and nickel compositions of the as-received powder and printed specimens were measured using electron probe microanalysis (EPMA) on a Cameca SX100 FiveFE system (Ametek, Gennevilliers, France). An accelerating voltage of 20 kV, a beam current of 20 nA, and a beam size of 5 µm were used to analyze 10 points on each specimen. In accordance with Tukey’s significant difference test results, outlier values were discarded. Porosity analyses on the 5 mm diameter cylinders and lattice structures were carried out using a Nikon XTH225 (Tokyo, Japan) computed tomography (CT) system. Scans were carried out using a 0.25 mm Cu filter with a 208 kV tube voltage, 60 µA current and 5 µm resolution for the cylinders, and a 210 kV tube voltage, 93 µA current, and 12.4 µm resolution for the lattice structures. The resulting images, with grey values representing the density of the material, were treated in Dragonfly software (Comet Technologies Inc., Montreal, QC, Canada) where a binarization (thresholding) was performed to separate air and pores from the solid material. Using porosity segmentation, the volume of pores and solid material were calculated and converted to relative density [27]. To validate the CT scan results, pycnometry density measurements on the 10 mm diameter specimens were carried out on an AccuPyc II 1340 (Micromeritics, Norcross, GA, USA) apparatus using helium gas with three repetitions of 10 purging cycles.
A phase analysis of the as-received powder, and of the as-built and heat-treated specimens, was carried out on a Panalytical X’Pert Pro (Malvern Panalytical, Malvern, UK) X-ray diffractometer in the 30 to 100° 2θ range, using copper Kα radiation (λ = 0.1506 nm), a step size of 0.0167°, a generator voltage of 45 kV, and a tube current of 40 A. Specimens for the XRD analyses were polished to remove the surface oxide layer using 400-grit sandpaper. To remove the background, smoothen the curves, and identify the phase peaks, the resulting data were treated using a custom MATLAB algorithm. References from the HighScore software database (Malvern Panalytical, Malvern, UK) were used to correlate the measured phase peaks with the known austenitic (B2), martensitic (B19’), and R-phase peak positions [28,29,30,31,32,33]. The as-built and heat-treated Parameter set 7 specimens were observed by an optical microscope (Leica DMLM, Leica Microsystems, Wetzlar, Germany) and subjected to electron backscatter diffraction (EBSD) analysis using a Hitachi SU8230 SEM (Hitachi, Tokyo, Japan). For the latter, specimens were mounted in carbon-charged resin, polished using grit 400, 600, 800, and 1200 SiC sandpaper and colloidal silica (24 h), and etched using Kroll’s reagent (1.9% HF, 4.7% HNO3 and 93.4% H2O) for 45 s. Finally, the EBSD specimens were subjected to secondary colloidal silica polishing for 2 h and ion milling.

2.3. Measurement of the Transformation Temperatures and Mechanical Testing

The phase transition temperatures of the powder, as-built and heat-treated specimens were measured by differential scanning calorimetry using a DSC2500 apparatus (TA Instruments, New Castle, DE, USA). Specimens in the shape of disks cut from the 5 mm diameter cylinders were sanded down in cold water until reaching a mass of 15 to 45 µg and tested in the −85 to 100 °C temperature range at a heating–cooling rate of 5 °C/min under nitrogen cover gas. It is known that Ti-Ni SMA can undergo martensitic transformation via direct austenite–martensite transformation, asymmetric R-phase transformation, and symmetric R-phase transformation. Depending on the material condition, multiple phase transformation peaks could therefore be expected: during cooling, an R-phase peak (R) and a martensite peak (M) representing the austenite transformation to R-phase and the R-phase change to martensite, respectively. Inversely, during heating, an R-phase peak (R) and an austenite peak (A) appeared, representing the transformation of martensite into R-phase and then into austenite. For each peak (p), the transformation start (s) and finish (f) temperatures can be identified as intercepts between the tangents of the baselines and the tangents to the inflection points on the heating and cooling peaks, as per ASTM F2004-17 [34] (Figure 4a). The characteristic temperature of greatest interest for this study is Af (austenite finish), and it corresponds to the fully austenitic state of the material; above this temperature, Ti-Ni should manifest the superelastic behavior, which is targeted for the biomedical applications of lattice structures.
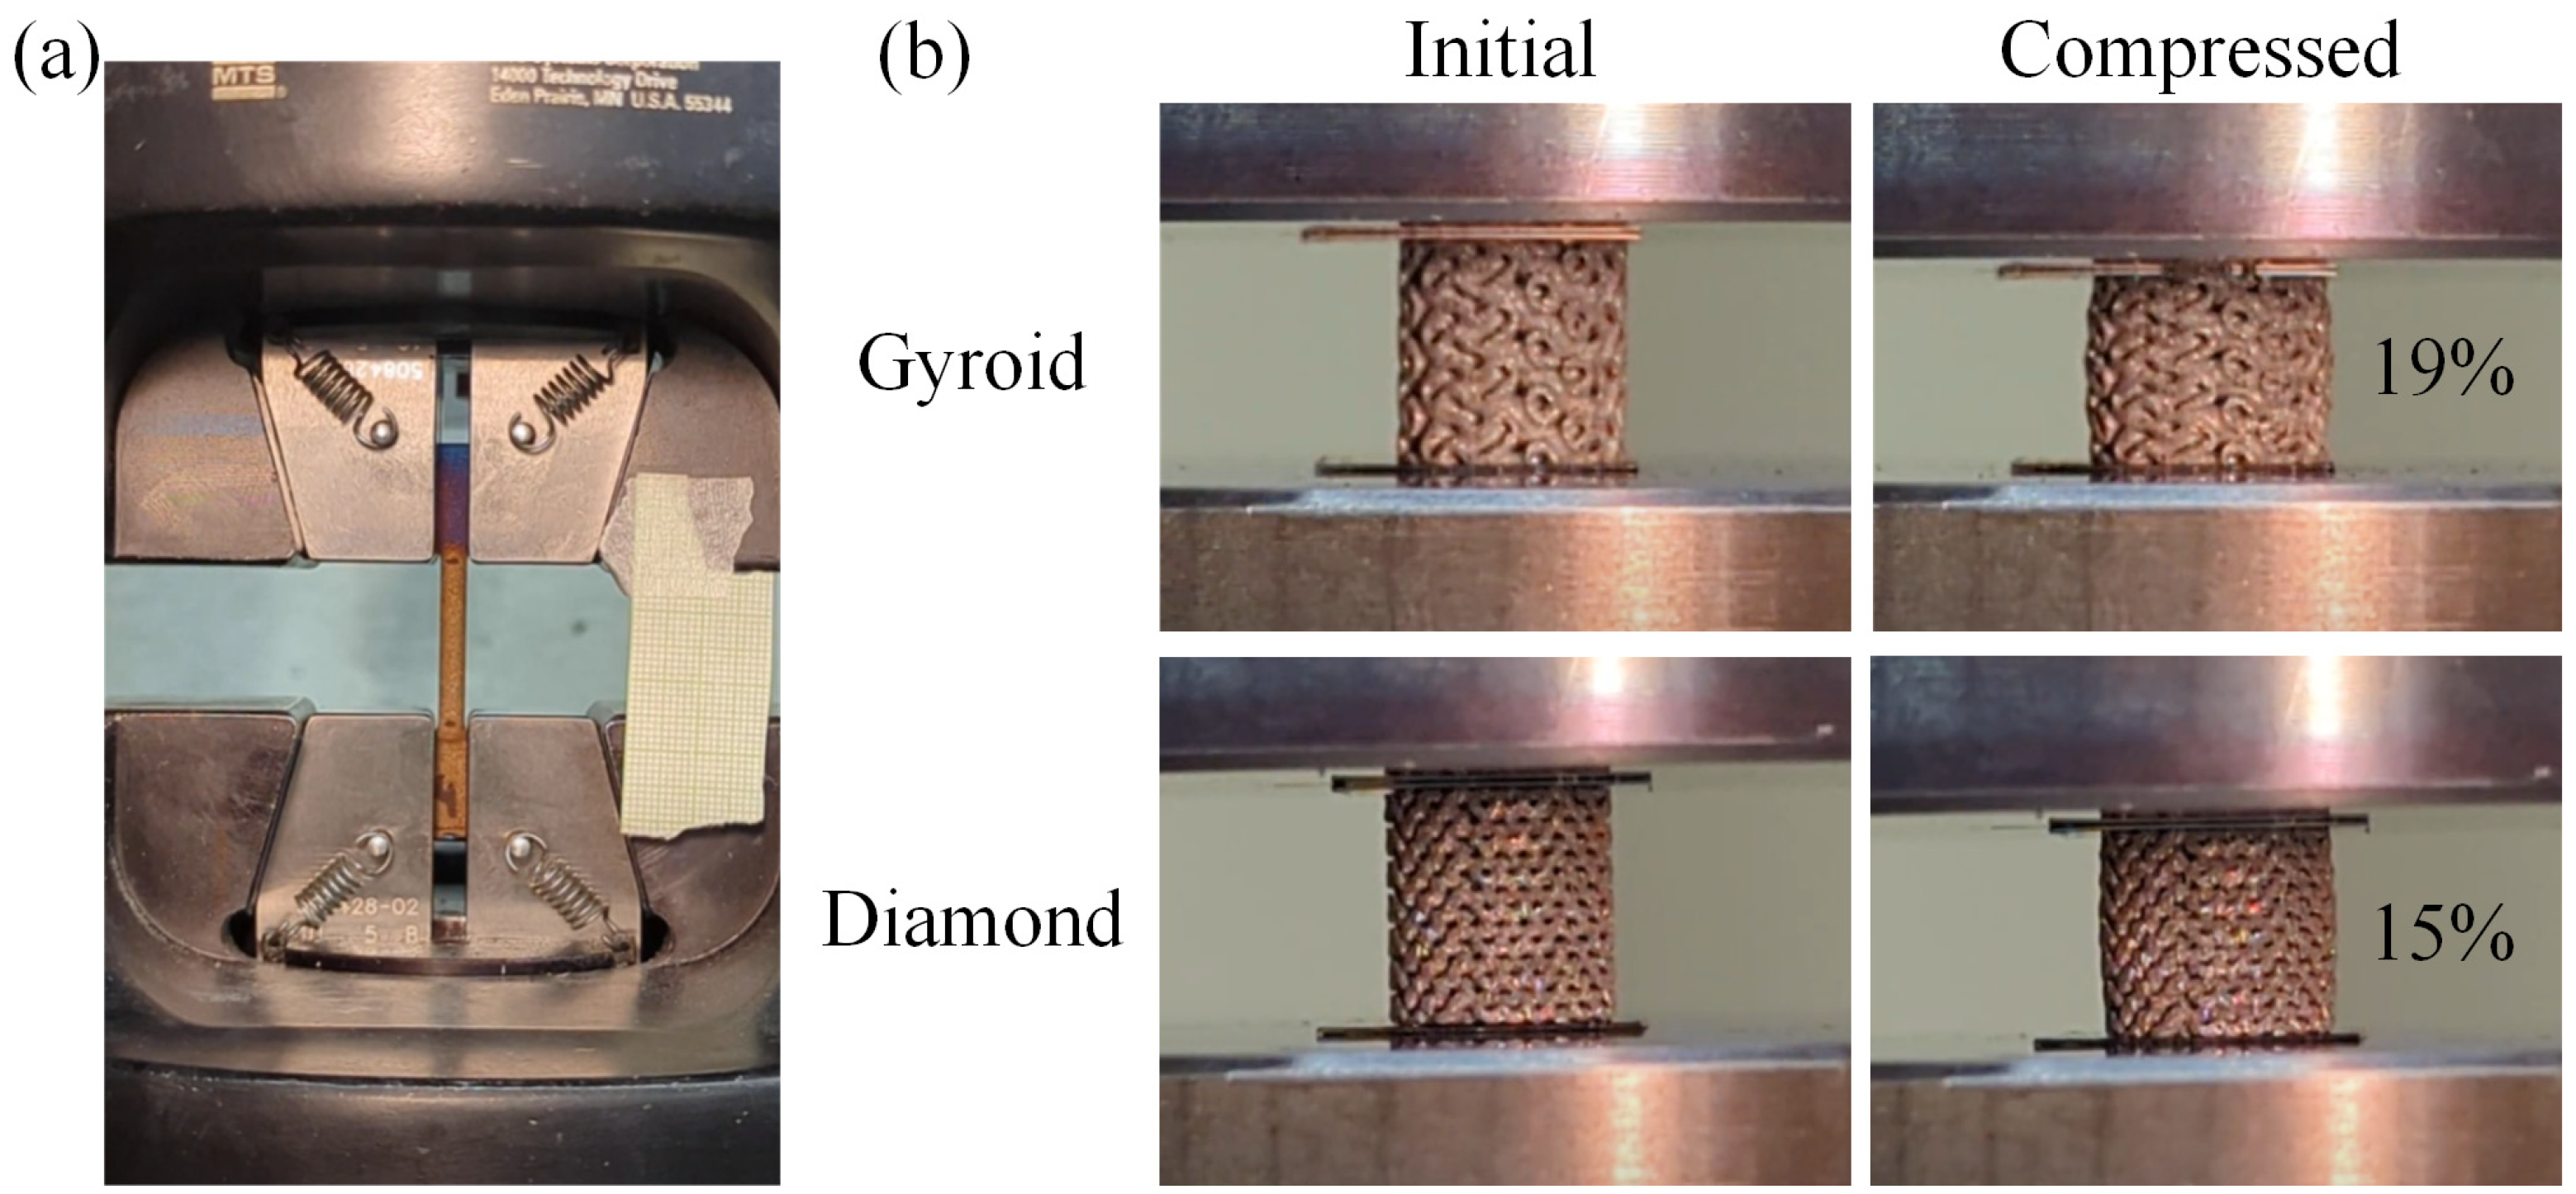
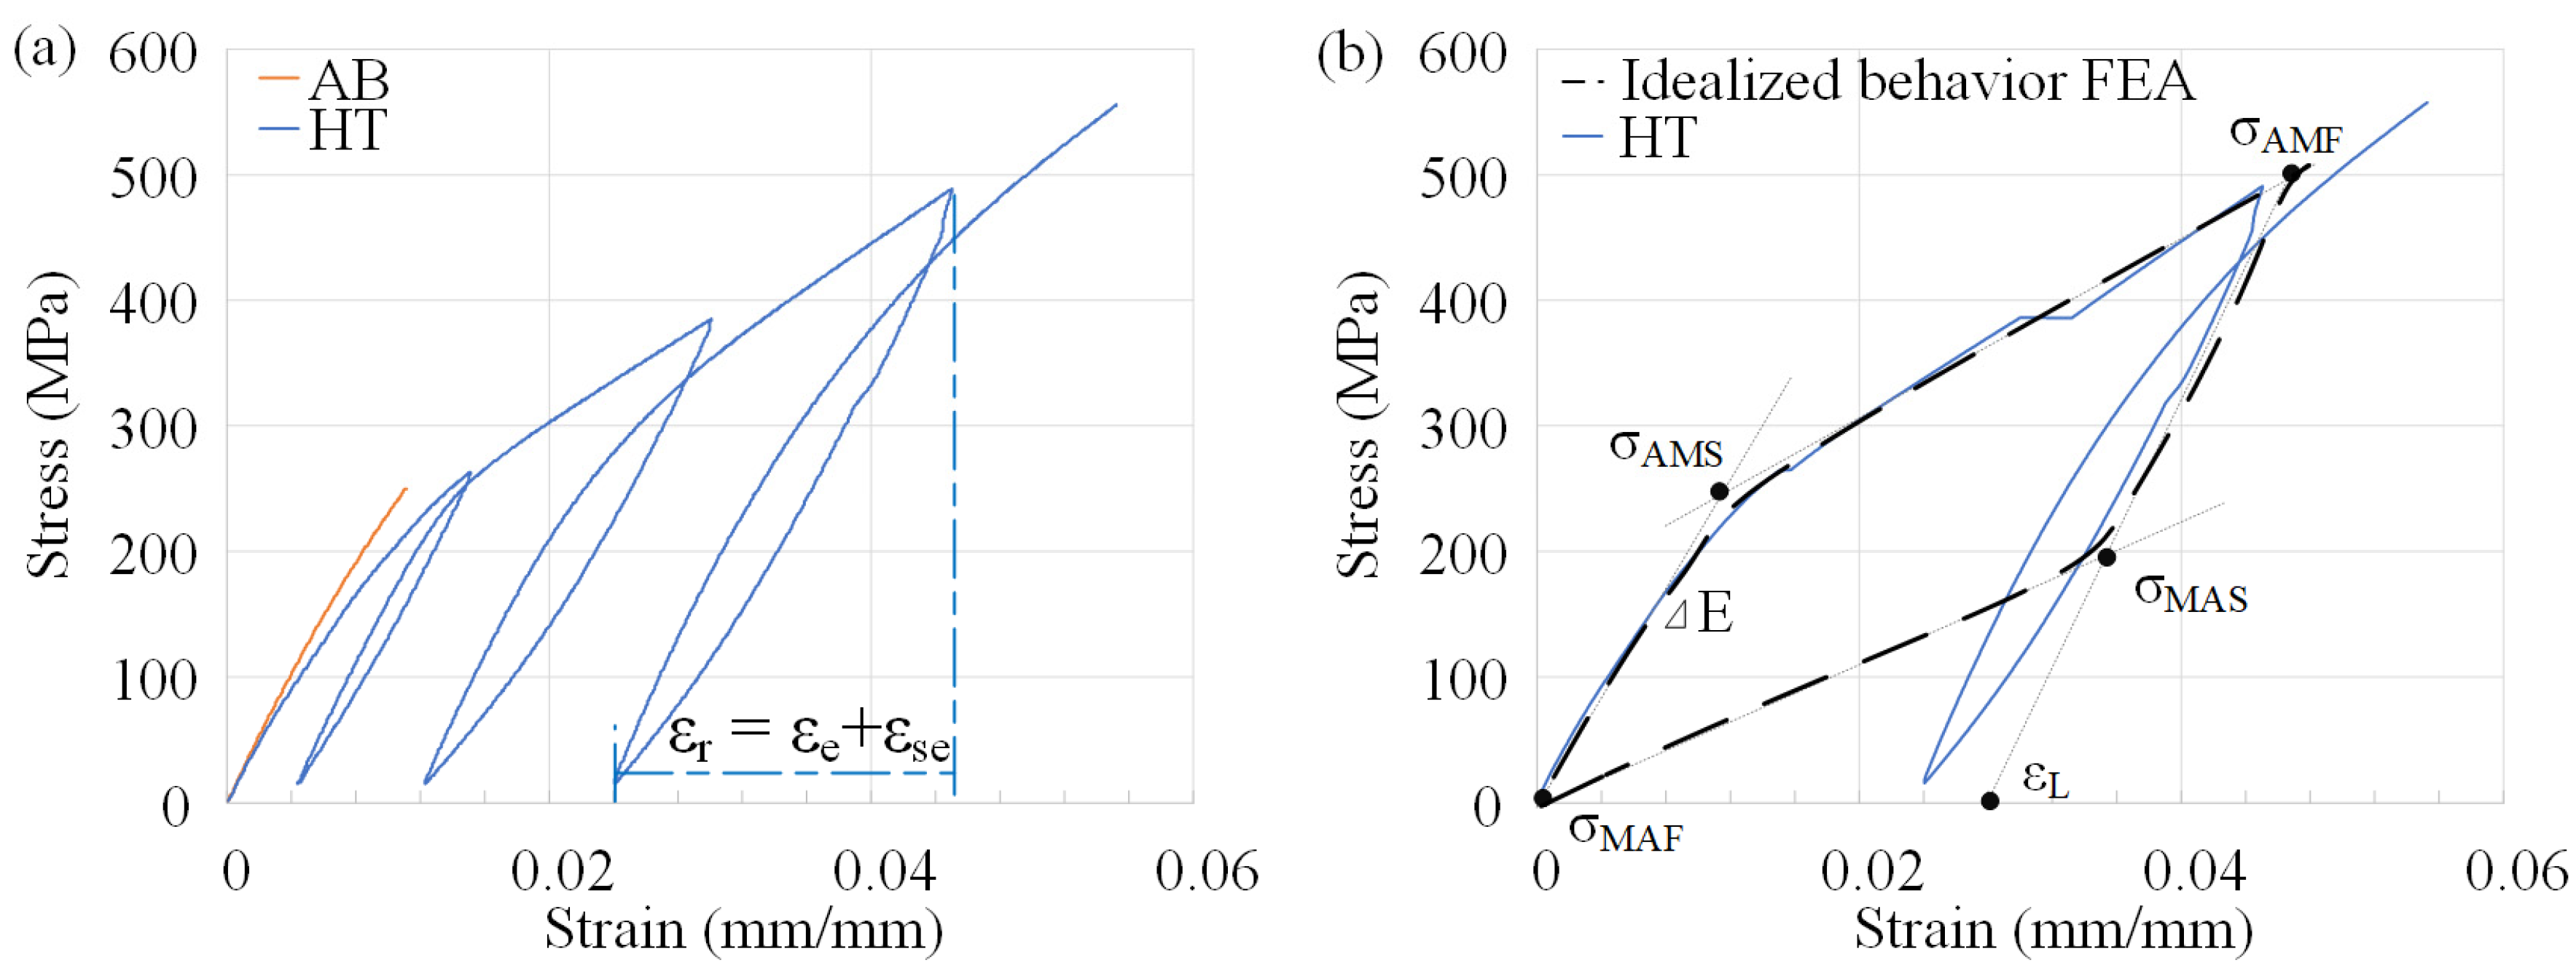
Mechanical tensile testing was performed on bulk specimens manufactured with Parameter set 7. ASTM E8 dogbone sub-specimens with a 4 mm diameter and a 24 mm length gauge section were tested in tension to assess the mechanical response of the alloy. An Alliance RF/200 system (MTS, Eden Prairie, MN, USA) was used to apply incremental displacements in 0.015 mm/mm steps at a rate of 0.001 mm/mm/s (Figure 5a). The load–displacement data are used to determine the modulus of elasticity (E), the martensite transformation start (σtr or σAMS) and finish (σAMF) stresses, the austenitic transformation start (σMAS) and finish (σMAF) stresses, the dislocation yield stress (σy), the maximum stress before failure (σmax), and the relative elongation to failure (δ), as shown on the idealized stress–strain diagram of Figure 4b. These material properties represent a minimum set of material characteristics required for the finite element analysis (FEA) of superelastic lattice structures using ANSYS software.

2.4. Numerical Simulations and Experimental Validation

Numerical simulations were carried out on the idealized CADs of the 60% porous gyroid and diamond lattice specimens using a workstation with two 14-core Intel Xeon E5-2660 CPUs and 256GB of RAM. STLs of the specimens were imported into Ansys Workbench 2021R1 where compression was simulated with large deformation analysis. Following a mesh convergence analysis using a 5% deviation criterion, a layered tetrahedron method with an element size of 0.1 mm and a layer height of 0.1 mm was used to create the FEA mesh with an average of 2.5 million elements. For the simulation of the structures, a standard Ansys idealized superelastic material law was approximated from the tensile testing results.
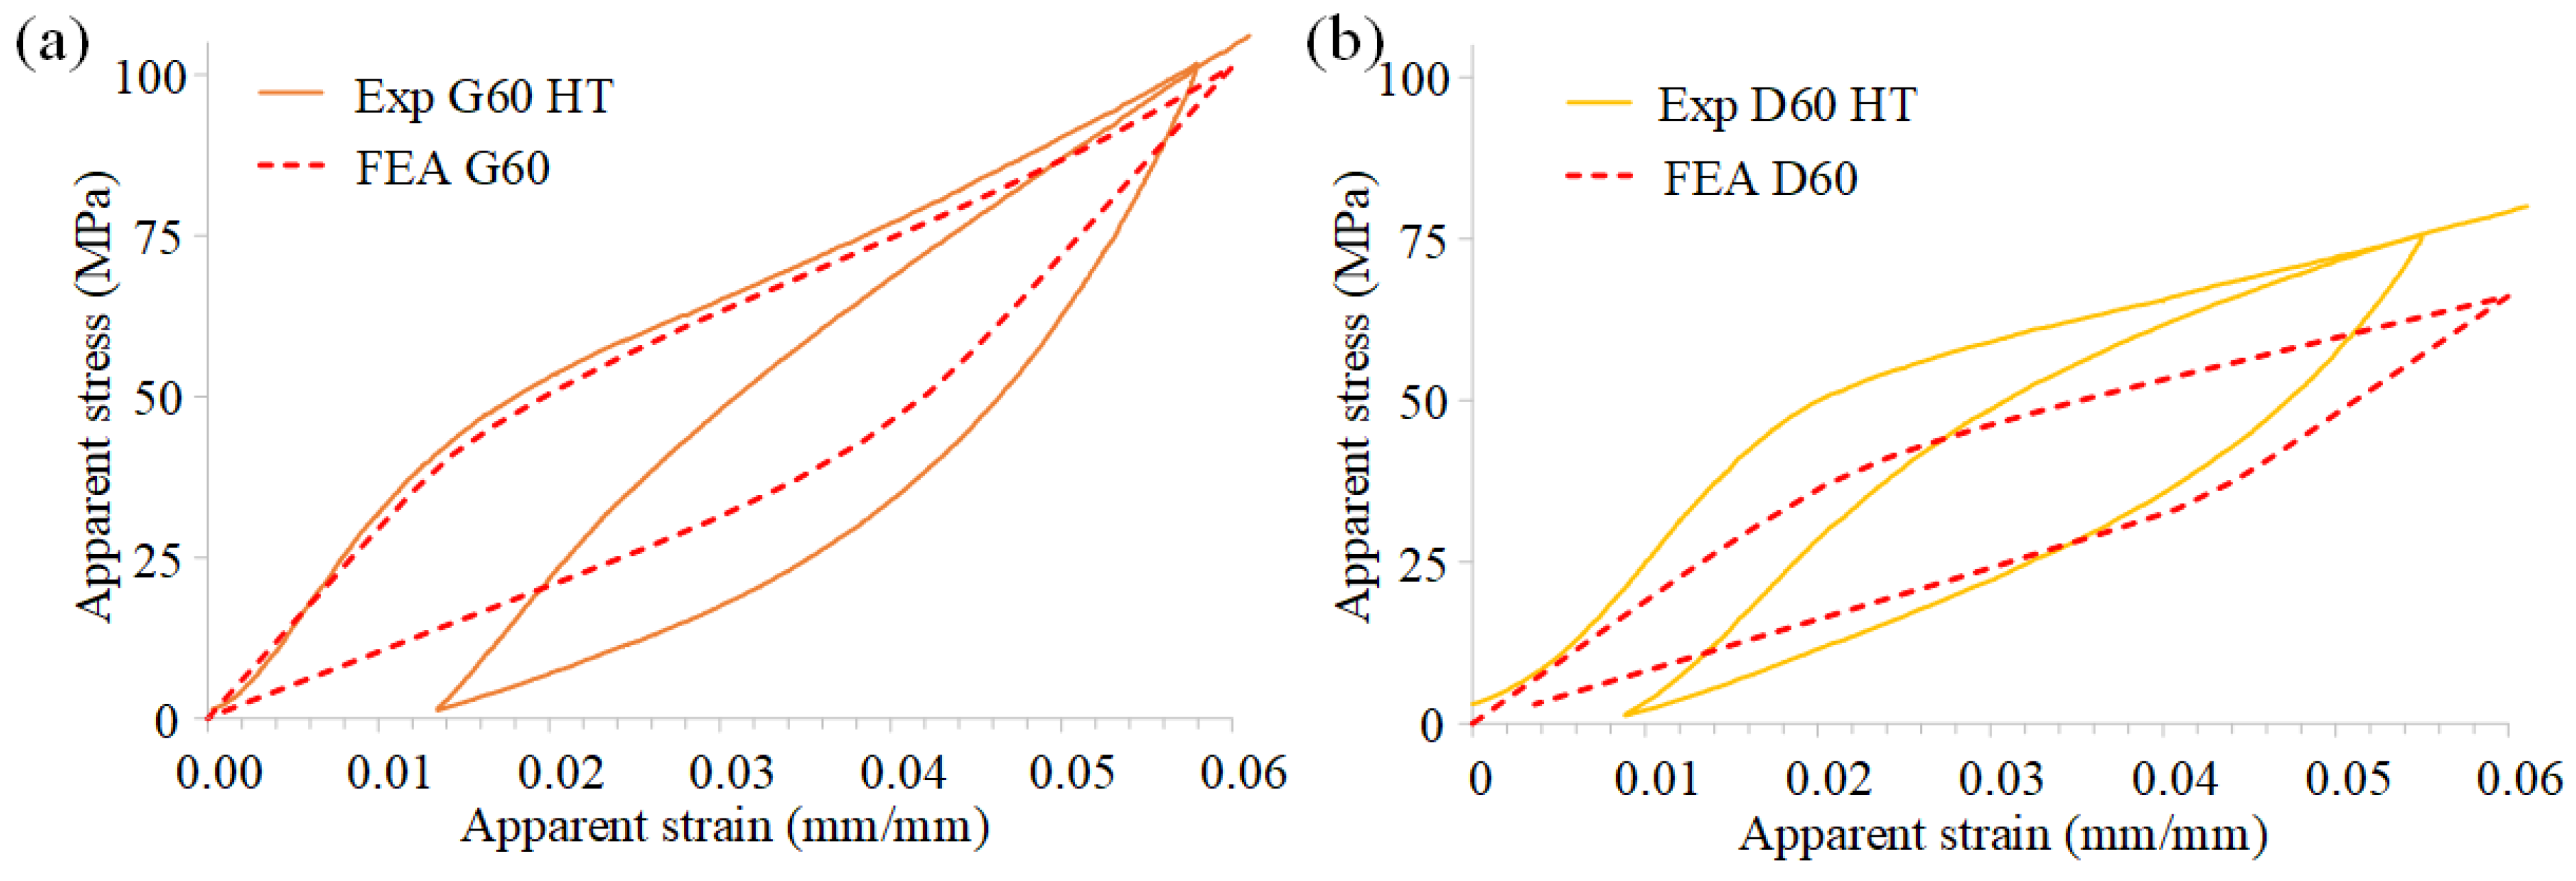
The boundary conditions consisted of displacements applied directly to the mesh nodes. The displacements of all bottom surface nodes were set to zero in the axial direction and the bottom nodes along the symmetry planes were blocked laterally to prevent the transverse displacement of the structure. The axial displacements of the top nodes were applied using automatic stepping up to 6% apparent strain, with an average of 20 steps to resolution. The reaction force probe was applied to the blocked displacements and then converted to compression stress using the specimens’ apparent cross-sectional area. The resulting stress–strain data were used to calculate the apparent modulus of elasticity and the apparent yield stress of the structures. In addition to calculating the stress–strain data, the simulations were also used to assess the material volume fractions under different states (elastic, plastic, stress-induced phase transformation). To select the elements in different states and extract their relative volumes, a script was written using the Ansys parametric design language (APDL) command tool. The numerical model was validated by testing the manufactured lattice structures in compression and comparing the measured apparent stress–strain responses of the specimens to those of the simulations (Figure 5b).

3. Results

3.1. Integrity and Density of Manufactured Specimens

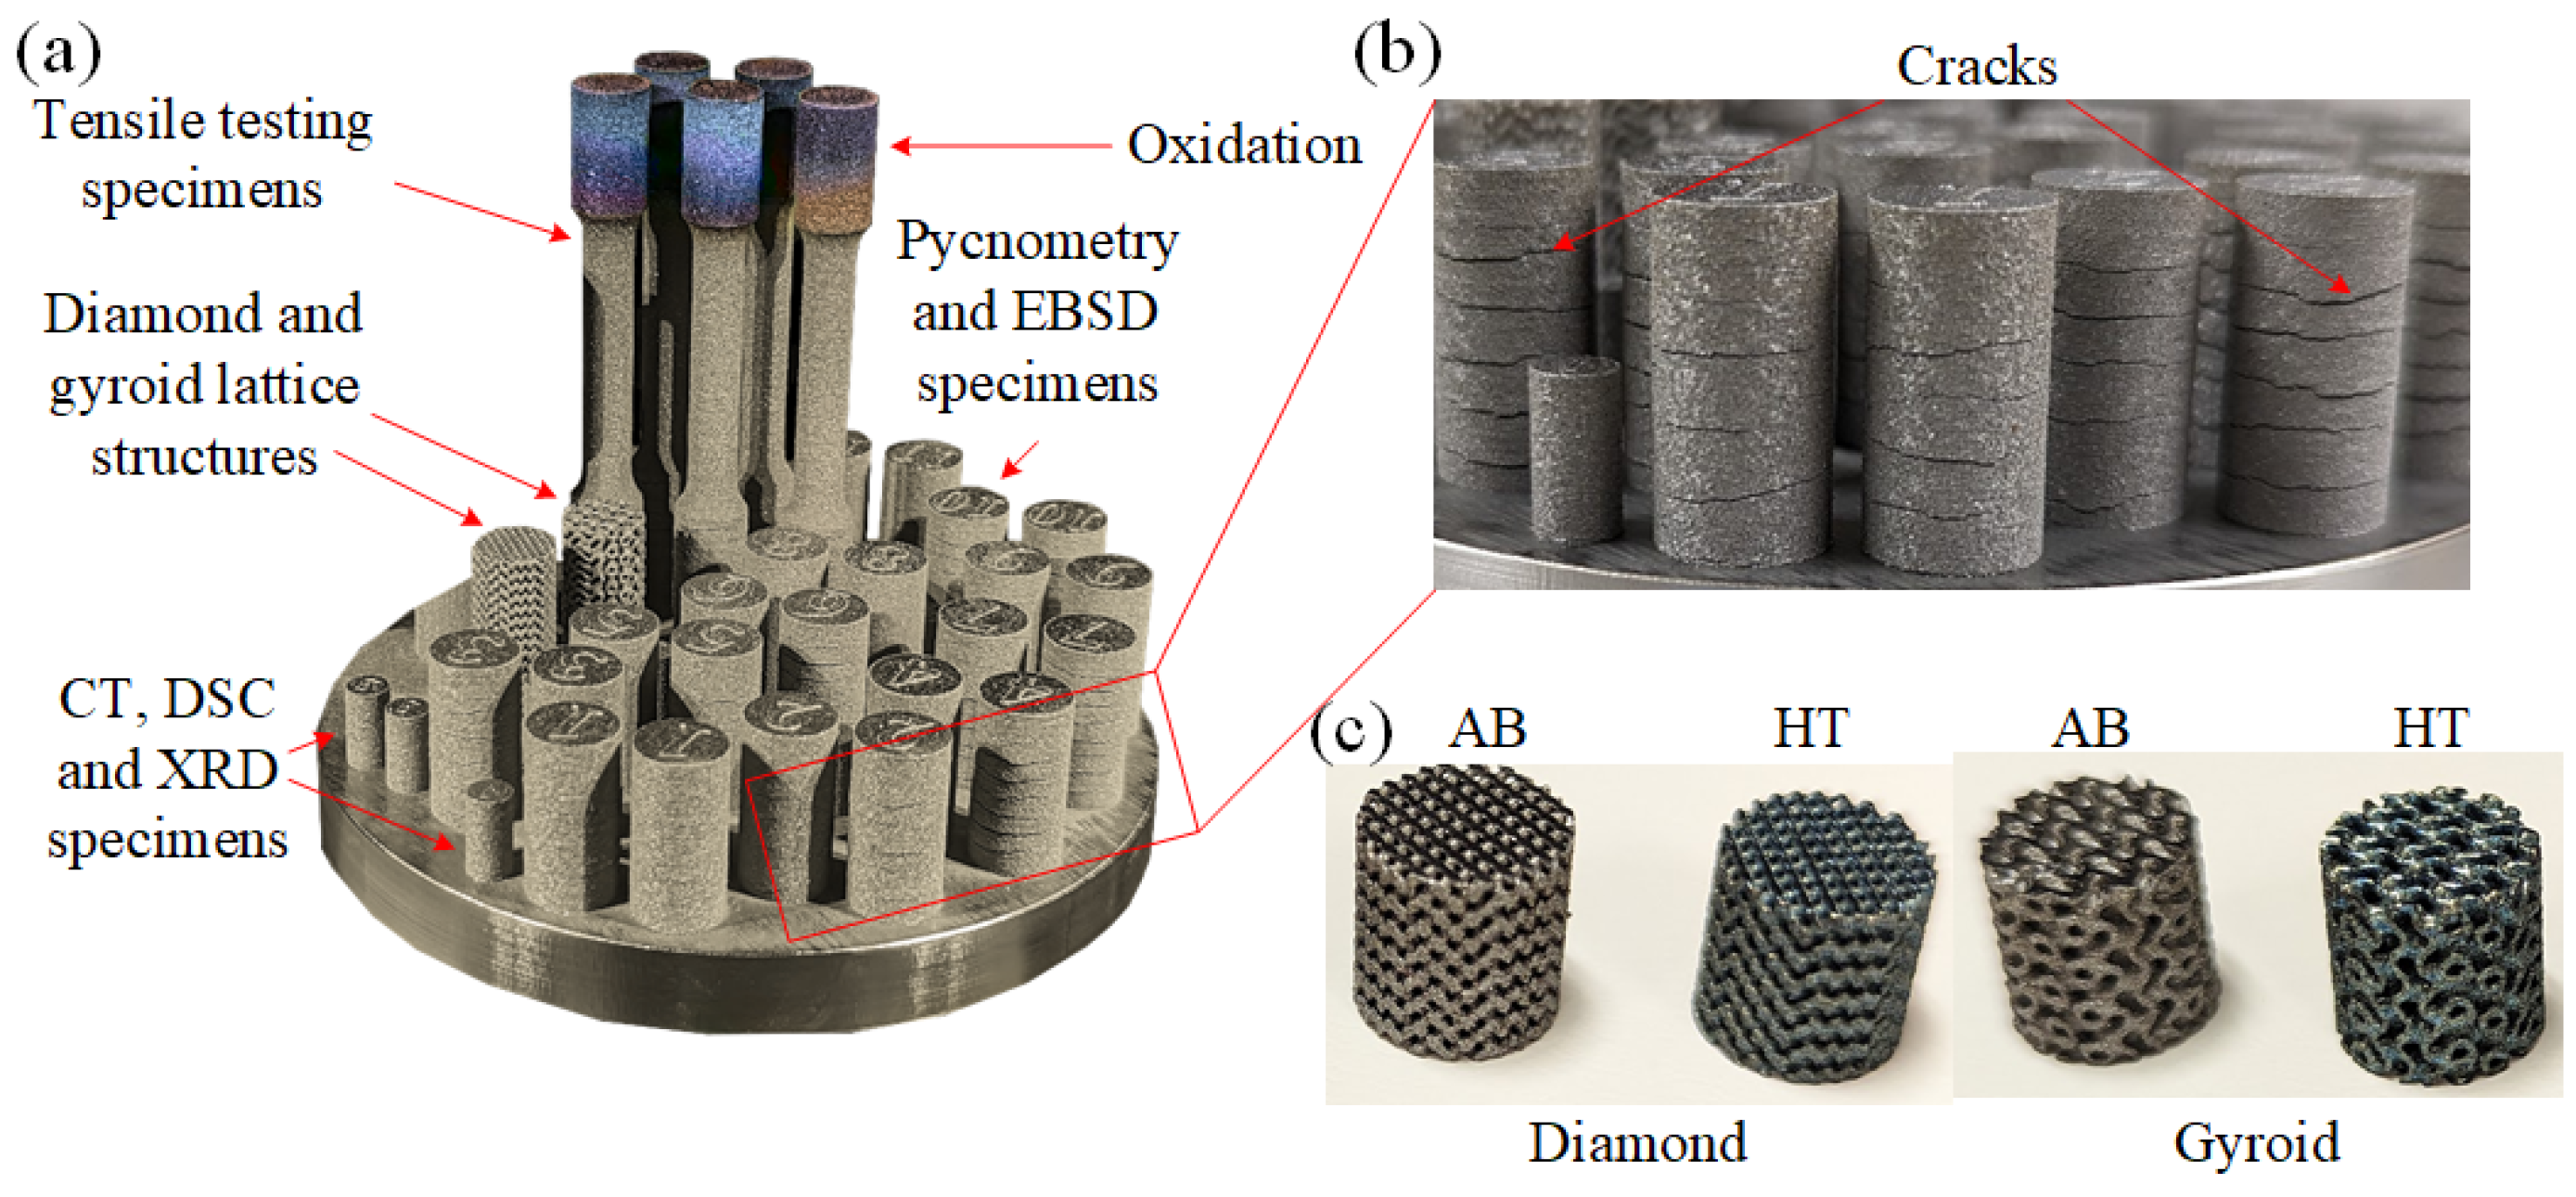
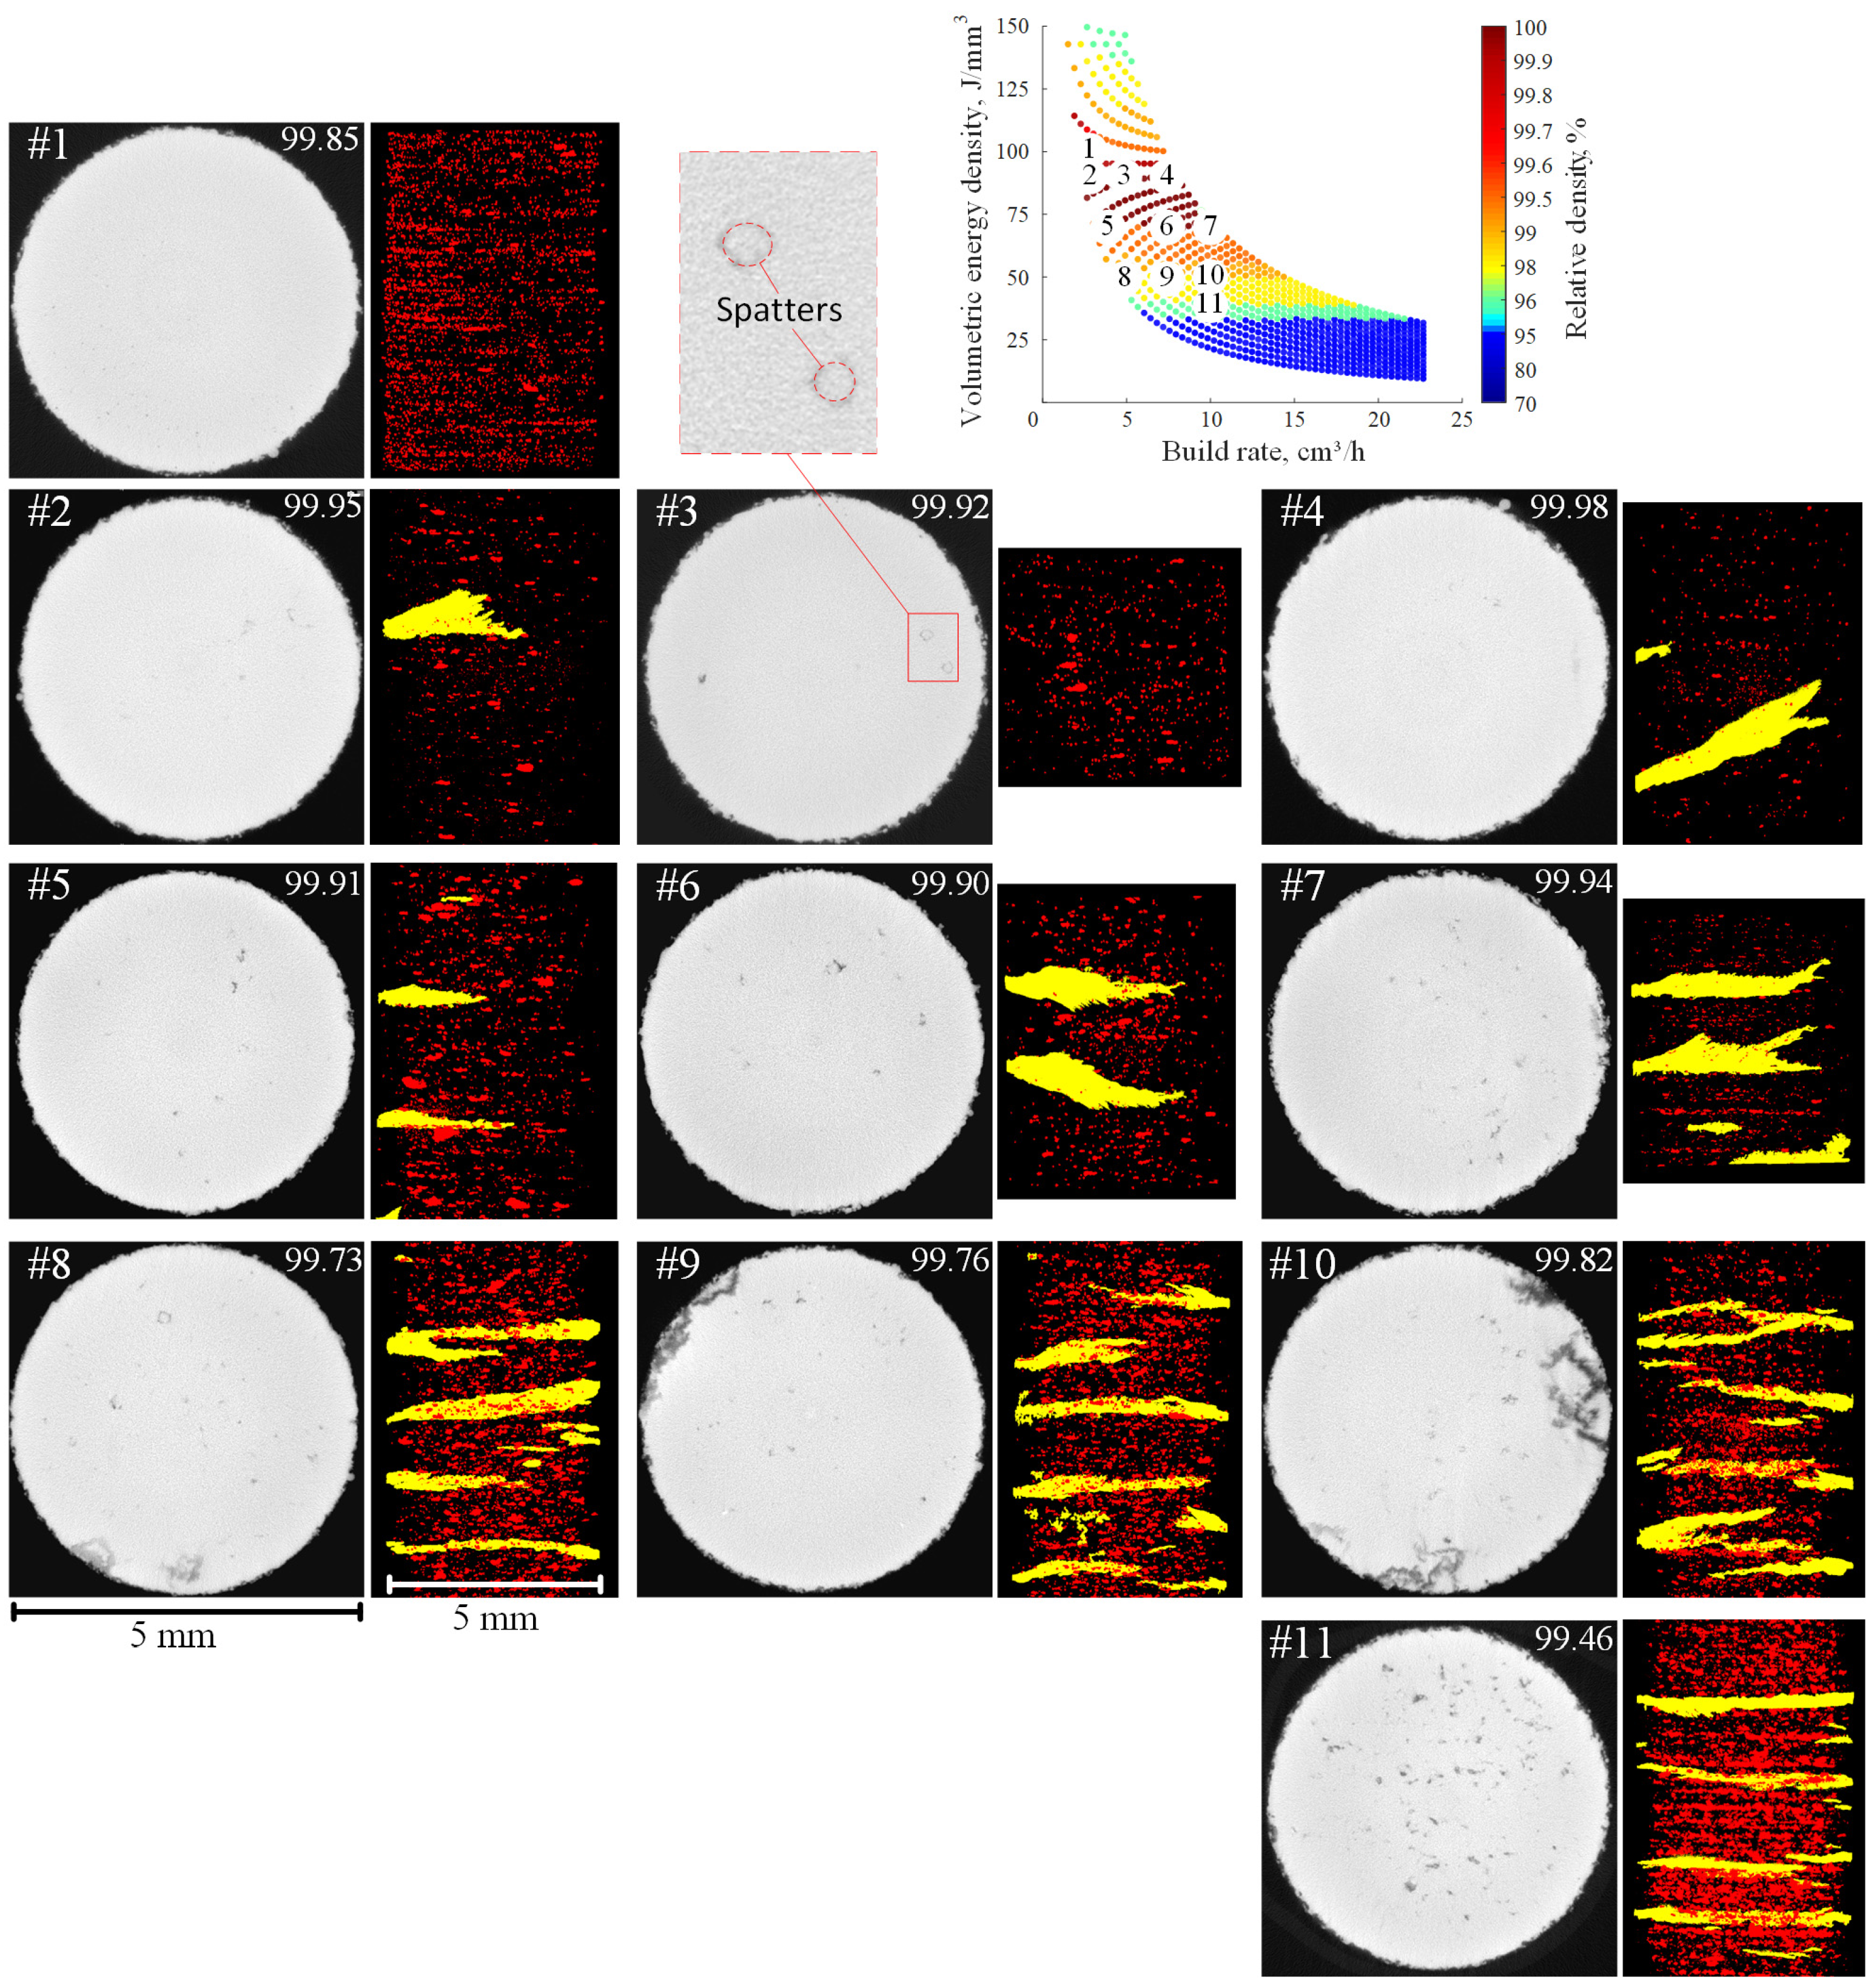
By using a Ti-Ni substrate, all components were manufactured in their entirety, as shown in Figure 6. However, all the 10 mm diameter specimens exhibited cracking, while only some of the 5 mm diameter specimens showed visible cracks. However, CT scanning showed that most of the 5 mm diameter cylinders also contained cracks (highlighted in yellow on the sideview of Figure 7), which were more pronounced and more numerous with a decrease in the VED. While gauge sections of the tensile specimens did not show signs of cracking, the endpieces touching the baseplate contained some cracks and the endpieces away from the baseplate showed signs of oxidation. No cracks were found in the lattice structures and the measured porosities of diamond lattices were 54.4% and those of gyroid lattices were 56.7%, i.e., 5.6% and 3.3% lower than the 60% design target, respectively.
Relative density results are presented in Figure 8 and in Table A1 of Appendix A. It is noteworthy that the CT scan and pycnometry measurements did not consider the presence of cracks. During the CT measurements, the cracks were removed in the imaging software, while during the pycnometry measurements, cracks were filled with gas, thus being neglected. Various types of processing-induced pores were detected by the CT measurements, with the largest ones caused by spattering. These spatters, up to 0.25 mm in diameter, or 5 times the size of an average powder particle, were trapped and formed toroidal pores partially filled with unmelted powder particles, as can be observed in Specimens 3, 6, and 8 of Figure 7.
All measurements indicated that the relative density of the printed parts was higher than 99%, which significantly diverged from the numerical predictions, which underestimated the printed densities by 1–3%. However, the low-VED Parameter sets 8–11 resulted in the lowest densities (≤99.4%), while the high-VED Parameter sets 1–7 resulted in the highest densities (≥99.7%), which is qualitatively consistent with the predicted values. Note that when taking into account the standard deviations of density measurements, only the results of pycnometry measurements on specimens printed using Parameter sets 8–11 and 1–7 were statistically different (p ˂ 0.05). Although specimens printed using Parameter set 1 did not show signs of cracking, they manifested systematic porosity, which was repeated layer-wise, as seen in Figure 7. Finally, specimens printed using Parameter set 7 were among the densest, while also providing the fastest build rate. Based on these results, this parameter set was selected for future printing.

3.2. Chemical Composition

A chemical analysis of the as-received powder showed that its nickel content was ~50.26 at%. As illustrated in Figure 9, all the printed specimens had lower nickel concentrations as compared to the powder, indicating different levels of nickel evaporation during manufacturing. Figure 9b shows a best-fit model of the experimental points in the VED-BR design space. It appeared, as a general trend, that the nickel content decreased as the VED increased and the BR decreased. Specimen 1, manufactured with a VED of 100 J/mm3 and BR of 3 cm3/h, had the lowest nickel content of 49.83 at%, and Specimen 7, manufactured with a VED of 70 J/mm3 and BR of 10 cm3/h, had one of the highest nickel contents of 50.16 at%. Specimen 3 appeared to be an outlier, having a nickel content identical to that of the powder. Note, however, that considering a relatively high standard deviation of the measurements (±0.15 at%), the observed differences in the chemical compositions are not statistically significant (p ˂ 0.05). Of note, such a significant scatter in otherwise very precise EPMA measurements could be caused by a high level of chemical heterogeneity in the as-printed specimens.

3.3. Phase Transition Temperatures

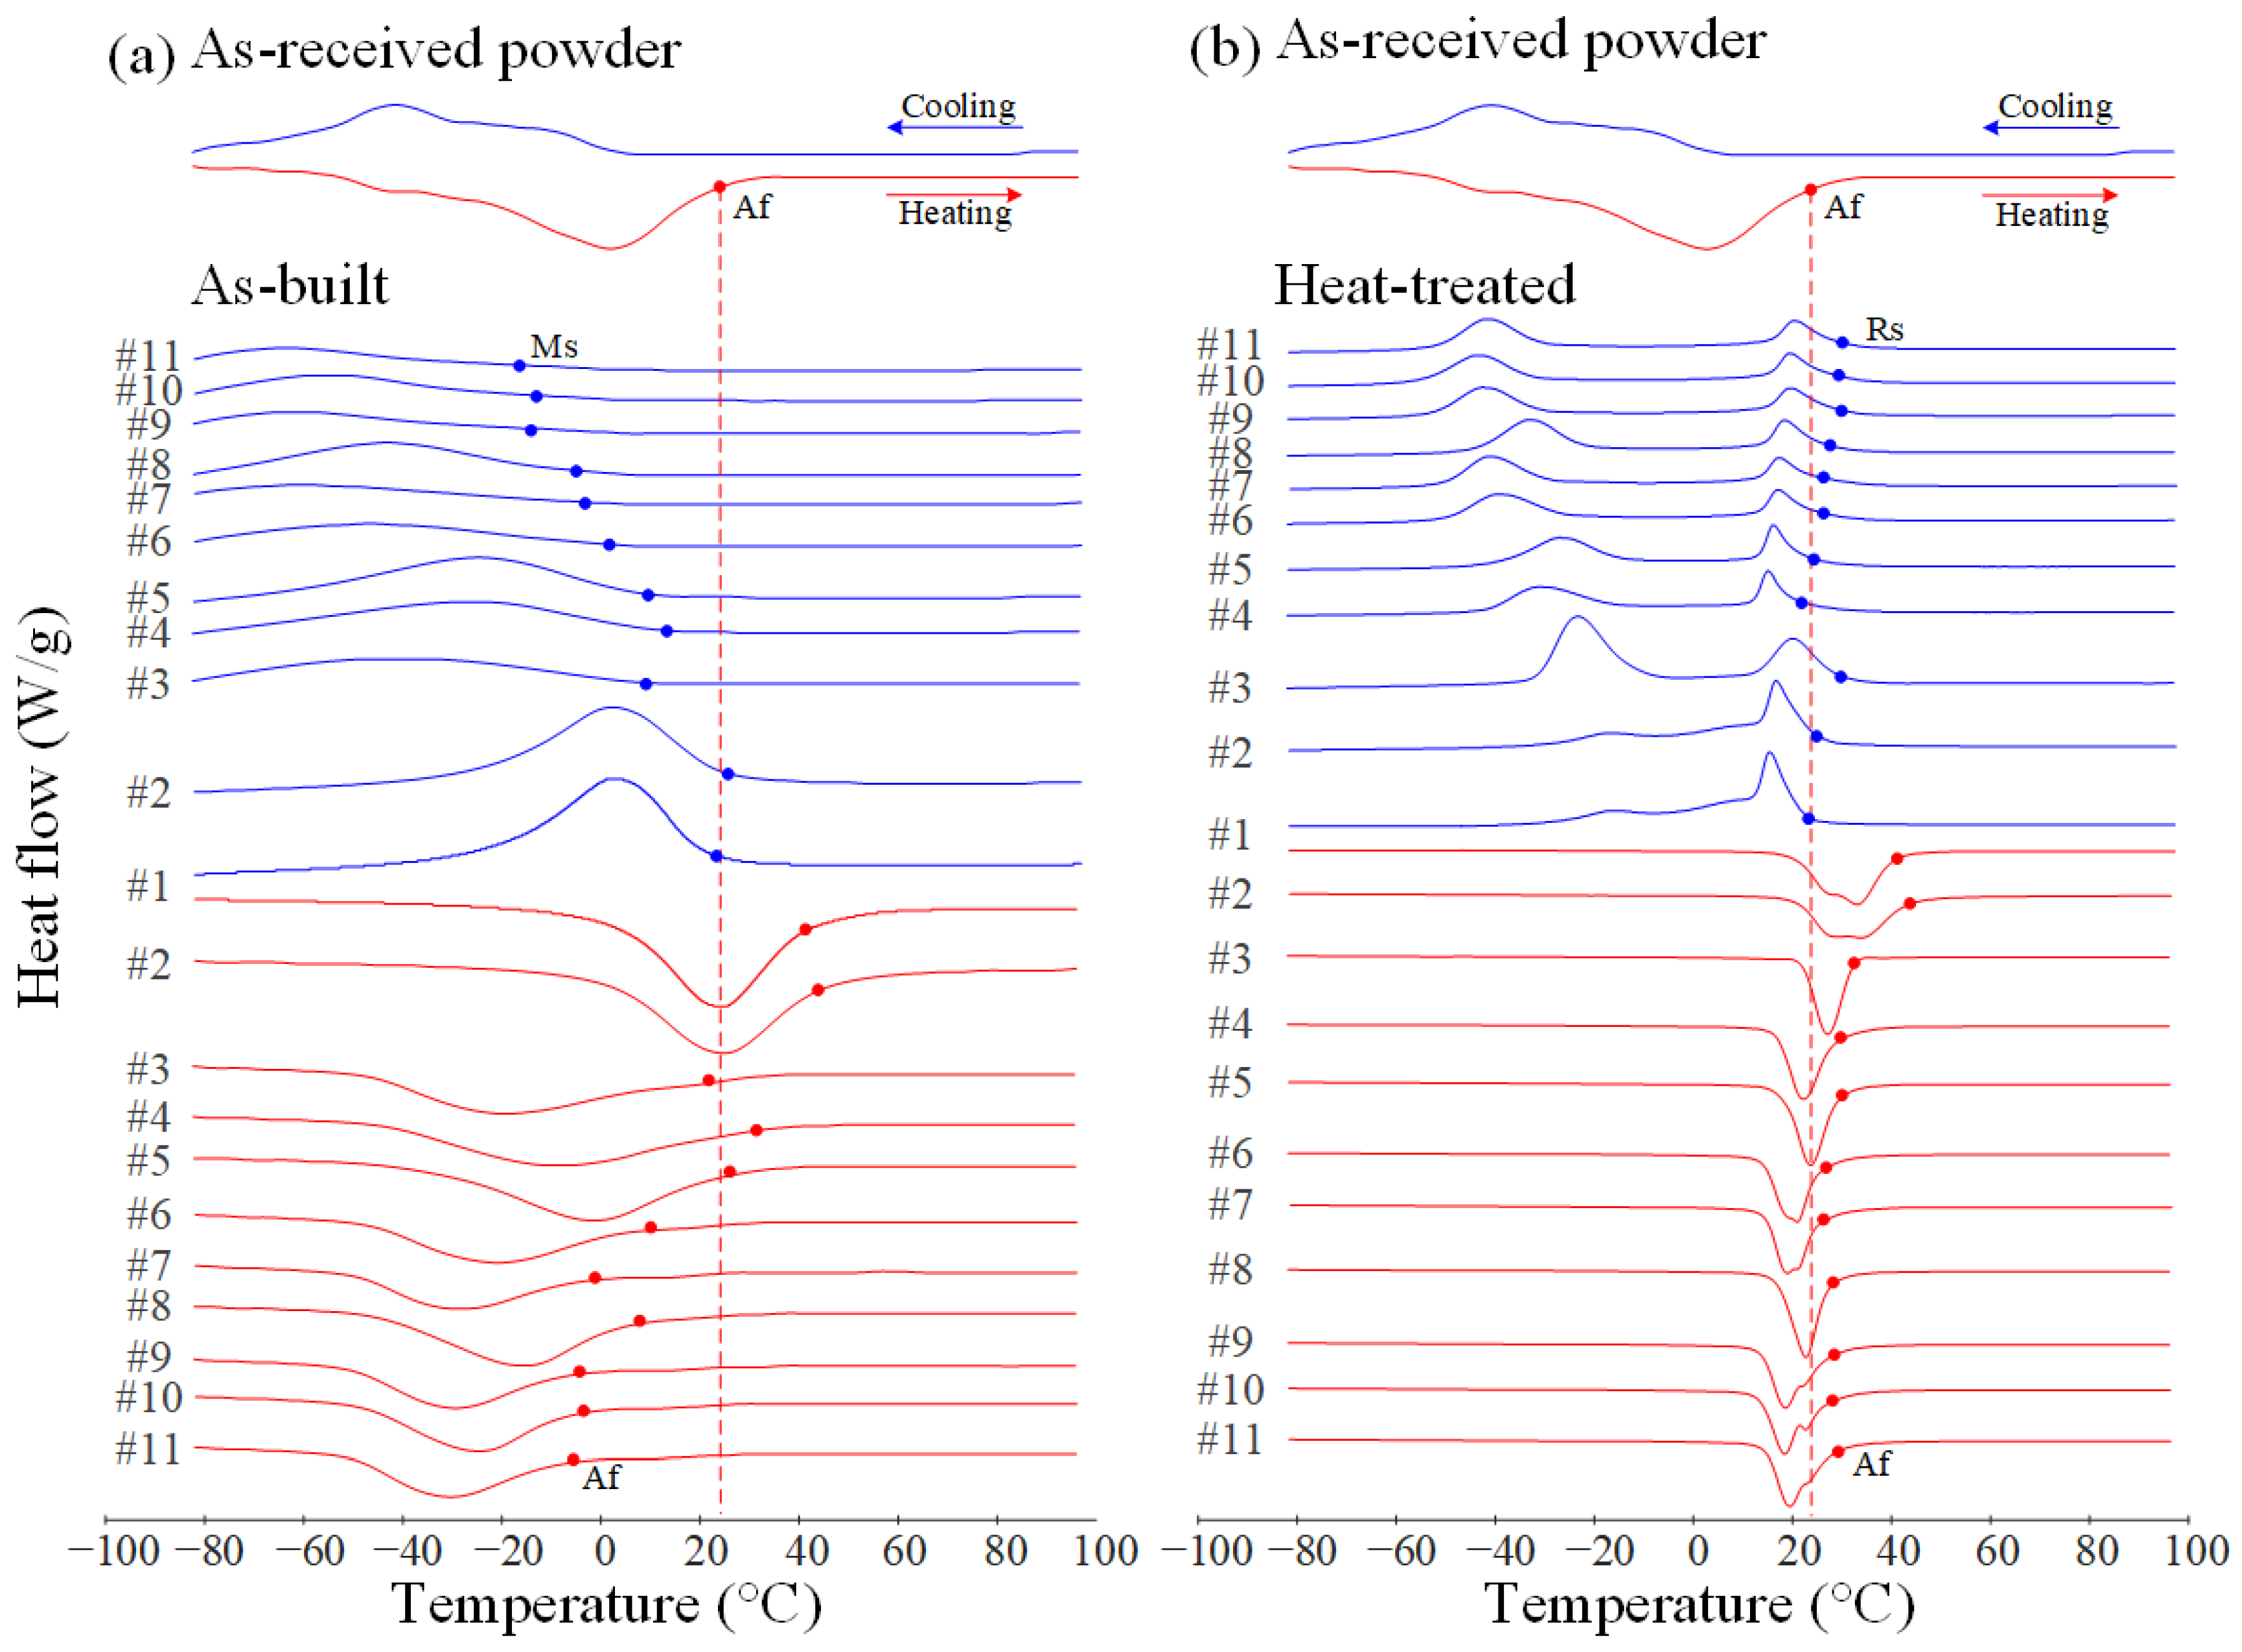
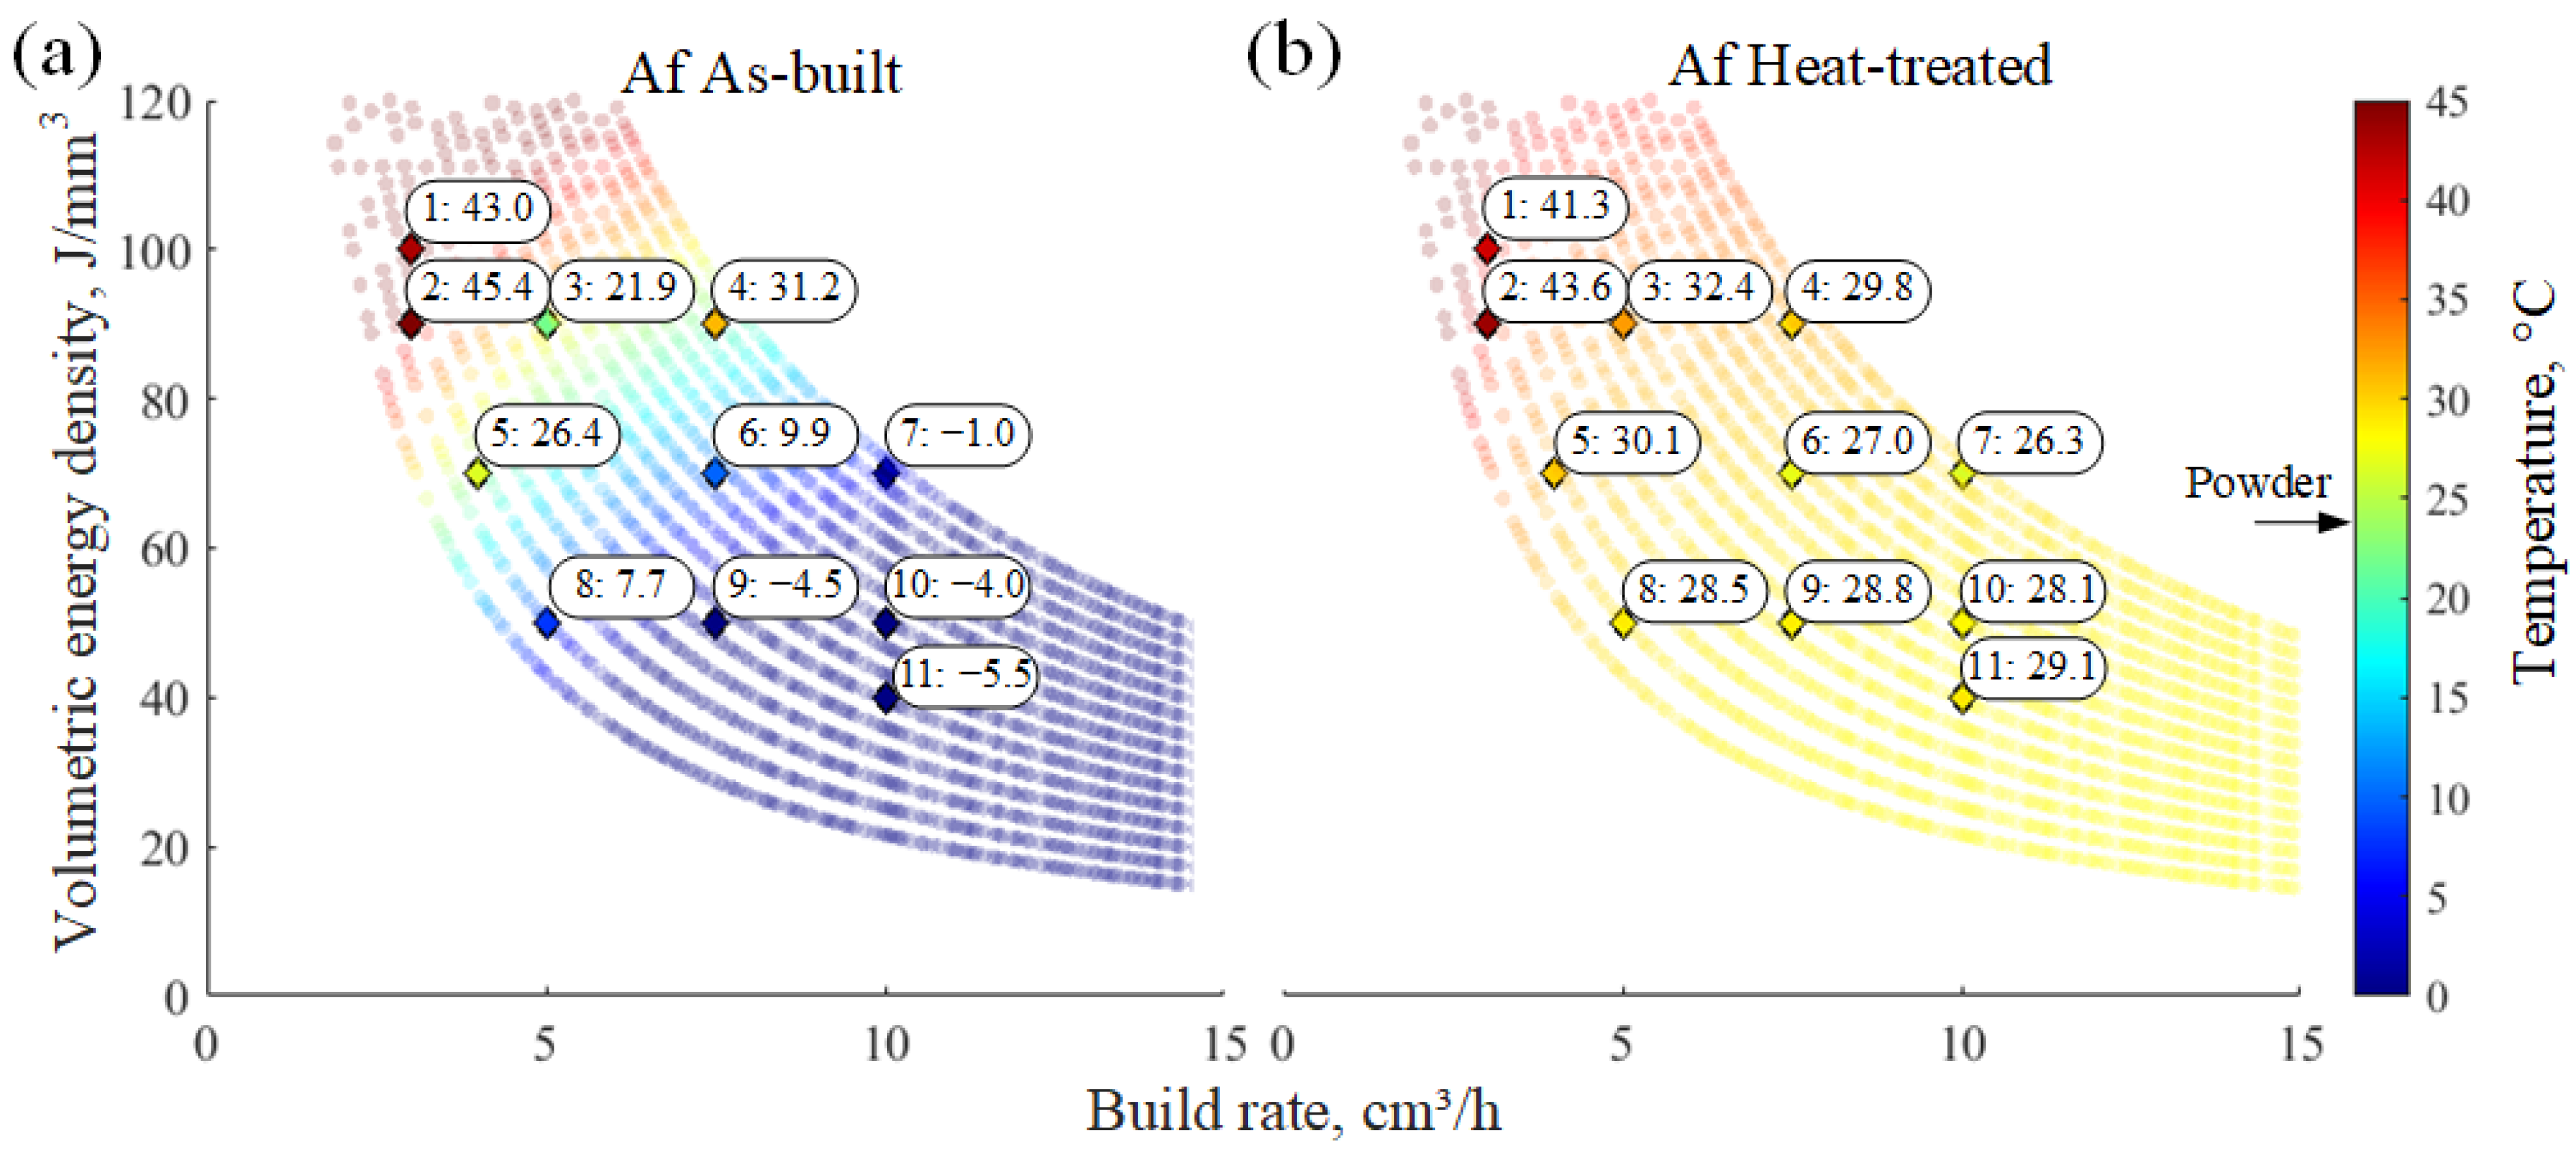
It can be seen from the DSC curves (Figure 10) that the printing parameters influence phase transformation temperatures. Indeed, these temperatures were lower by 40 to 60 °C for the low VED–high BR than for the high VED–low BR specimens. Specimens 1 and 2 were significantly different from the other specimens, and were the only specimens with transformation temperatures higher than those of the as-received powder. The as-built specimens had wide peaks revealing direct austenite-to-martensite transformation during cooling and heating. Following the heat treatment, the transformation peaks became narrower and more pronounced, and the presence of transient R-phase was observed. The appearance of R-phase proved problematic when it came to determining the transition temperatures, since some specimens exhibited asymmetric transformations, and others, symmetric transformations, resulting in an overlap between the R-phase and austenite transformation peaks during heating, as observed for Specimens 1, 2, 6, 7, 9, 10, and 11. The heat treatment increased the phase transition temperatures of all the investigated specimens, except for Specimens 1 and 2, for which the Mf and Af temperatures remained virtually unchanged (Table A2 in Appendix A). Moreover, the differences in Af temperatures of the specimens manufactured using different VED-BR parameter sets were reduced from ~50 °C in the as-built conditions to ~12 °C after the heat treatment, with Specimens 4–11 stabilizing at an Af of 26–30 °C (Figure 11).

3.4. Crystalline Phase Analysis

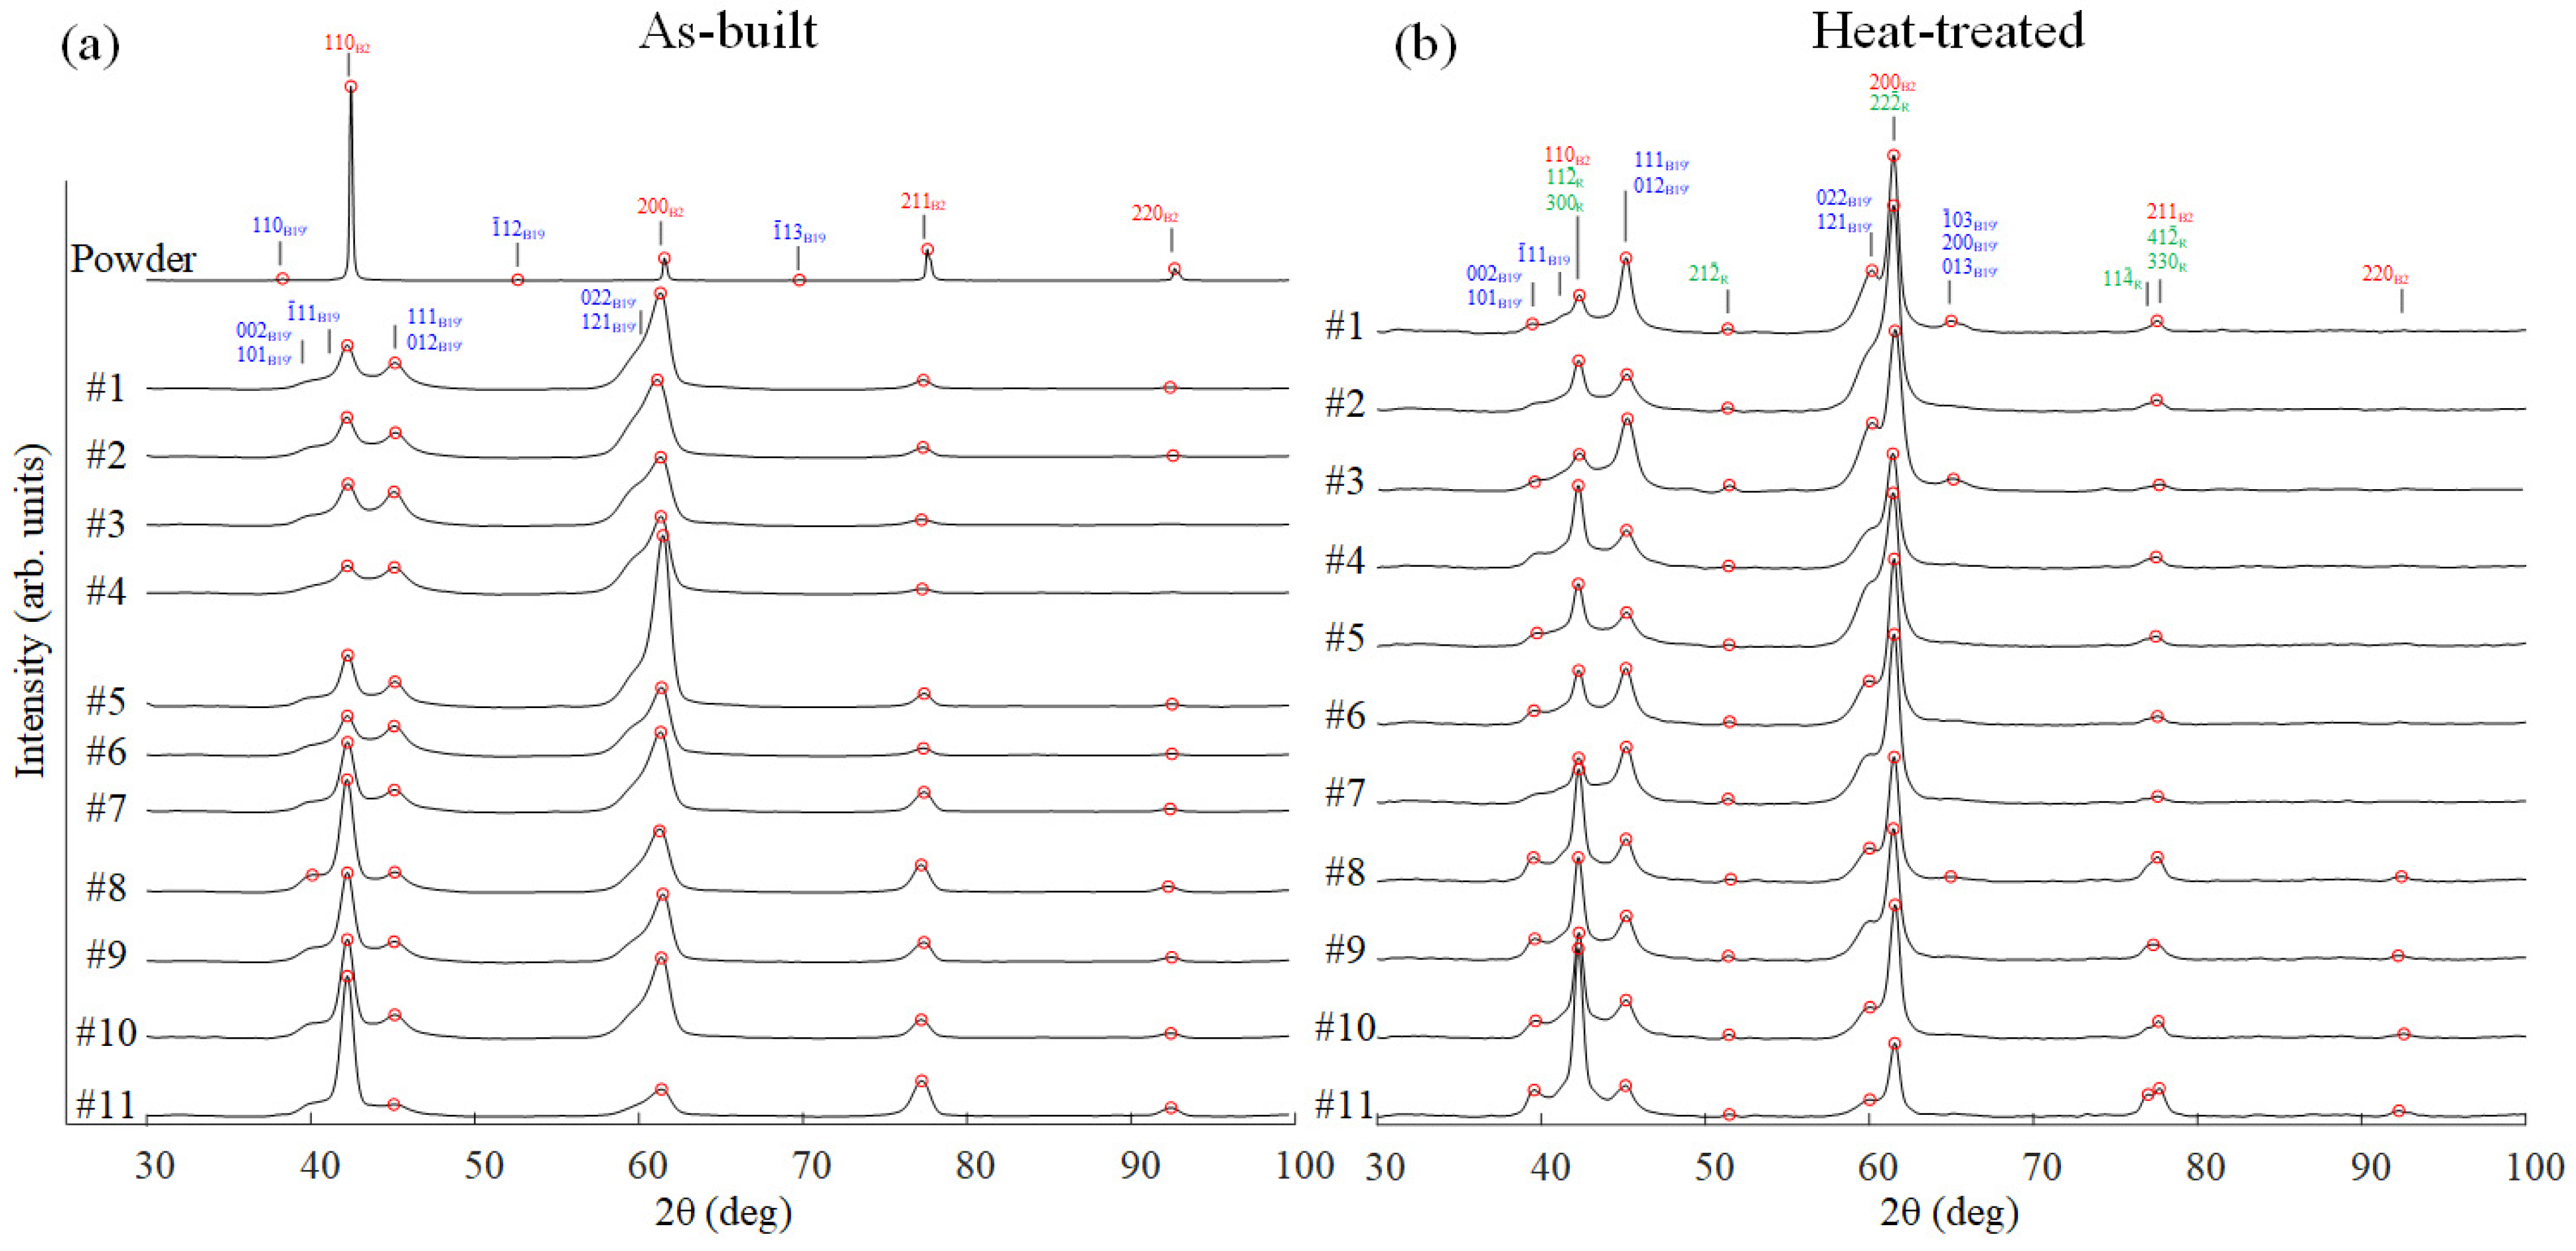
Figure 12 presents XRD diffractograms with the detected phase peaks encircled. Phases were identified as austenitic (red), martensitic (blue), or R-phase (green). The as-received powder had four main diffraction peaks of the austenite (B2) phase and three minor peaks representing the martensite (B19’) phase. Specimens in the as-built conditions displayed the same austenitic peaks as the powder, their intensities, however, being lower. Austenite in the high VED–low BR specimens had a preferential (200) orientation, whereas in the low VED–high BR specimens, the (110) peak was the most intense, similarly to the powder. The martensitic phase increased in intensity, and new martensite peak positions appeared in the printed specimens, as compared to the powder. Some B19 peaks were not detected by the software, because they blended in with adjacent peaks (e.g., B19 (022) with B2 (200)).
The heat-treated specimens were different from the as-built specimens in two ways: an increased intensity and shifted angular positions of the martensite peaks as well as the appearance of new peaks, indicating the presence of R-phase. The latter was consistent with the DSC results, which indicated that at room temperature, all heat-treated specimens underwent R-phase transformation. An apparently lower martensite content in the as-built specimens as compared to their heat-treated counterparts could be explained by the presence of high residual stresses in the former. Figure 13 illustrates the as-built and heat-treated microstructures of the specimen printed with Parameter set 7. Columnar grains typical of the LPBF process were observed in both states. However, it appeared that the as-built specimens were mostly austenitic, whereas after the heat treatment, fine lamella appeared inside the grains, indicative of an increase in the martensite content also seen in the XRD results. On the top surfaces, grains are aligned along the laser tracks. EBSD analyses showed a preferential (100) grain orientation in the build direction in both the as-built and heat-treated states. In addition, the as-built specimens manifested a larger fraction of non-indexed phases than their heat-treated equivalents because of a higher dislocation density and a higher level of residual stresses in the former.

3.5. Numerical Model and Validation

The tensile stress–strain diagrams of bulk specimens printed with Parameter set 7 are shown in Figure 14, and the mechanical properties determined from these diagrams are collected in Table 3. It can be seen that the as-built specimens had a fragile behavior, suffering failure at 1% strain, whereas the heat-treated specimens failed at 5.5%. For both conditions, the phase transformation yield stress corresponded to ~250 MPa and the modulus of elasticity varied as a function of the specimen state: 22.2 GPa in the as-built condition and 18.7 GPa in the heat-treated condition. Even though testing of the as-built specimens was performed above their DSC-measured Af temperatures (−1 °C), the presence of residual stresses hindered superelasticity. After the heat treatment, the Af temperature increased and the room-temperature microstructure was no longer completely austenitic, thus resulting in a partial superelastic behavior with recoverable strains (elastic and superelastic, εr = εe + εse) of ~2%. For the FEA of lattice structures, an idealized stress–strain material diagram was approximated from the tensile diagrams of heat-treated specimens (Figure 14b), with E = 18.7 GPa, ν = 0.3, σAMS = 250 MPa, σAMF = 500 MPa, σMAS = 200 MPa, σMAF = 0 MPa and εL = 0.028 (Table 3). The alpha parameter, which reflects the asymmetrical behavior of the material in tension and compression, was assumed to be zero.
Figure 15a compares the stress–strain behavior of the simulated gyroid and diamond lattice structures under compression, the former being significantly stiffer than the latter, despite the equivalent 60% porosity. The gyroid lattices had an apparent elastic modulus of 2.9 GPa and a yield stress of 48 MPa, whereas their diamond equivalents had an apparent elastic modulus of 1.8 GPa and a yield stress of 41 MPa. The stress distributions in the structures close to their respective apparent yield strains (1.8 and 2.4%, respectively) were almost identical for both lattices, ~75% of the volume of material in the elastic state and ~25% in the superelastic state. However, at an equivalent apparent strain of 6%, ~20% of the gyroid structure underwent plastic deformation, as compared to only ~2% for its diamond equivalent because of the much higher compliance of the latter (Figure 15b,c).
Figure 16a,b shows the stress–strain diagrams resulting from compression testing of the gyroid and diamond lattices in the as-built and heat-treated conditions. It was observed that, as predicted by the numerical simulations, the gyroids are stiffer than the diamonds both in the as-built (E = 3.5 vs. 3.1 GPa) and heat-treated (E = 3.4 vs. 2.9 GPa) conditions. Although yield stresses in both structures in the as-built (Sy = ~70 MPa) and heat-treated conditions (Sy = ~48 MPa) are similar, the ultimate stress and compression strain at failure are significantly greater for the gyroids. Similarly to the effect on the bulk material, heat treatment appeared to decrease the yield stress and reduce the compression strain at failure for both types of lattice structures, while increasing their ultimate stresses (Figure 16c). Going up to 5% applied strain, the recovered strain εr was the same for both tested structures (Figure 16d), while beyond that, the diamond lattices outperformed their gyroid counterparts. At ~11% applied strain, the heat-treated diamond lattices exhibited recoverable strains reaching 7.25%, about 1.25% more than their gyroid counterparts. These results are consistent with the numerical simulations, which showed that for the same level of apparent strain, the diamond lattices limit the degree of irreversible (plastic) deformation because of their higher compliance.
The simulated and experimental stress–strain diagrams of the lattice structures are compared in Figure 17. The simulation of the loading behavior of the gyroid lattices reproduced the experimental behavior almost exactly, whereas in the case of diamonds, the simulation underestimated the experiment both in terms of stress and stiffness. These discrepancies might be attributed to two facts: the manufactured diamond lattices were 2.3% less porous (54.4%) than their gyroid equivalents (56.7%), with their strut junctions significantly blended by the manufacturing process (Figure 18). In addition, unlike the experiments, where the superelastic behavior of the material was only partial, the numerical model was built using an idealized superelastic material law.

4. Discussion

The bulk-printed Ti-Ni specimens exhibited macroscopic cracking resulting from large residual stresses caused by significant thermal gradients during laser printing. The specimen size and the VED-BR conditions appeared to influence the size and frequency of cracking: 10 mm diameter cylinders had cracks up to 2 mm thick, whereas in the 5 mm diameter cylinders, the cracks were much finer and could not be detected with the naked eye. The lower the VED and the higher the BR values, the more intensive the cracking. Cracking of bulk specimens has also been reported in the literature [15,35,36]. Potential solutions to this problem include heating the printing substrate [37,38], applying higher VED and lower BR (at the risk of evaporating too much nickel and altering the functional properties of the alloy) [15,39], using specifically designed support structures to reduce the heat transfer to the build plate and, therefore, the thermal gradients [40], or using HIP [41] and spark plasma sintering [42] to heal the processing-induced microcracks. Lattice structures did not exhibit any cracks or delamination due to, in part, their architecture; being less stiff, the lattice structure accommodated the residual stresses better than their bulk counterparts.
The measured density of solid regions in all the specimens was ≥99.4% (CT) and ≥99.1% (pycnometry). Although each measurement method had its limitations (human bias of the manual thresholding of the CT analyses and specimen size dependence of the pycnometry measurements), a similar trend was found between the two. The density prediction model accurately forecasted the area of increased density at BR = 3–10 cm3/h and VED = 70–100 J/mm3 ranges (Figure 19a). Discrepancies outside this region might be due to the assumptions made on the material property inputs for the model. In particular, the specific heat capacity and thermal conductivity of Ti-Ni can vary by a factor of 0.5 and 2, respectively, depending on the phase state of the material, i.e., austenitic or martensitic [25].
At higher VED–lower BR printing conditions, Specimen 1 had numerous small pores distributed layer-wise, similar to the keyhole defects and gas pores caused by over-melting (Figure 19b). At lower VED–higher BR conditions, Specimen 7 showed larger lack-of-fusion and spatter-related defects. These defects were most pronounced at the lowest VED (Specimen 11). A VED of 70–90 J/mm3 and BR of 3–10 cm3/h appeared to yield the highest densities. Similar trends of increased porosity for VEDs under 60 J/mm3 and over 163 J/mm3 were observed in the literature by Biffi et al. [17] and Zamani et al. [43]. Conversely, Ge et al. [44] were unable to successfully print specimens with VEDs higher than 75.8 J/mm3, whereas Saghaian et al. [45] successfully manufactured specimens with VEDs up to 666 J/mm3, but failed for specimens with VEDs lower than 80 J/mm3. This indicates that the manufacturability of Ti-Ni SMA is highly dependent on the LPBF system and the effective printing conditions, including the temperature of a build plate, the laser spot size, and the scanning strategy, and therefore should be optimized accordingly.
In addition to the structural integrity of printed specimens at the macroscopic and microscopic levels, it is known that printing parameters can affect the chemical composition, which in turn changes the transformation temperatures and alters the functional properties of Ti-Ni SMA at a given temperature. In agreement with the chemical analysis observations, at higher VEDs, the nickel content was lower than at low VEDs, which has also been reported in the literature [14,15,16,17,18,19]. This can be explained by the physical properties of nickel and titanium, particularly the higher boiling point of titanium (3289 °C) as compared to nickel (2914 °C), and 3 times higher vapor pressure of the latter as compared to the former at the Ti-Ni alloy’s melting temperature [35]. Together, these effects result in an overall higher evaporation of nickel than that of titanium. Nickel-rich powders can be used to mitigate this problem, although it was noted that Ni-rich Ti-Ni feedstock has a higher propensity to in-process macro-cracking due to the formation of Ni-rich precipitates that strengthen the matrix and reduce the material ductility [35].
As a result of nickel evaporation, transformation temperatures of the printed parts are expected to increase with respect to those of the powder. As such, higher VEDs and lower BRs lead to increased phase transition temperatures [15,18,46]. In this study, although this trend was observed (Figure 11), some as-built specimens manifested lower Af temperatures than the powder (e.g., −5.5 °C for Specimen 11 vs. 23.7 °C for powder). After the heat treatment, Af temperatures of all the specimens increased, but to different extents. For example, intermediate-VED-BR Specimens 5–11 demonstrated an increase by 26–29 °C, low-VED–high-BR Specimen 11 by 35 °C, while high-VED–low-BR Specimens 1 and 2 saw almost no changes in their Af temperatures after the heat treatment.
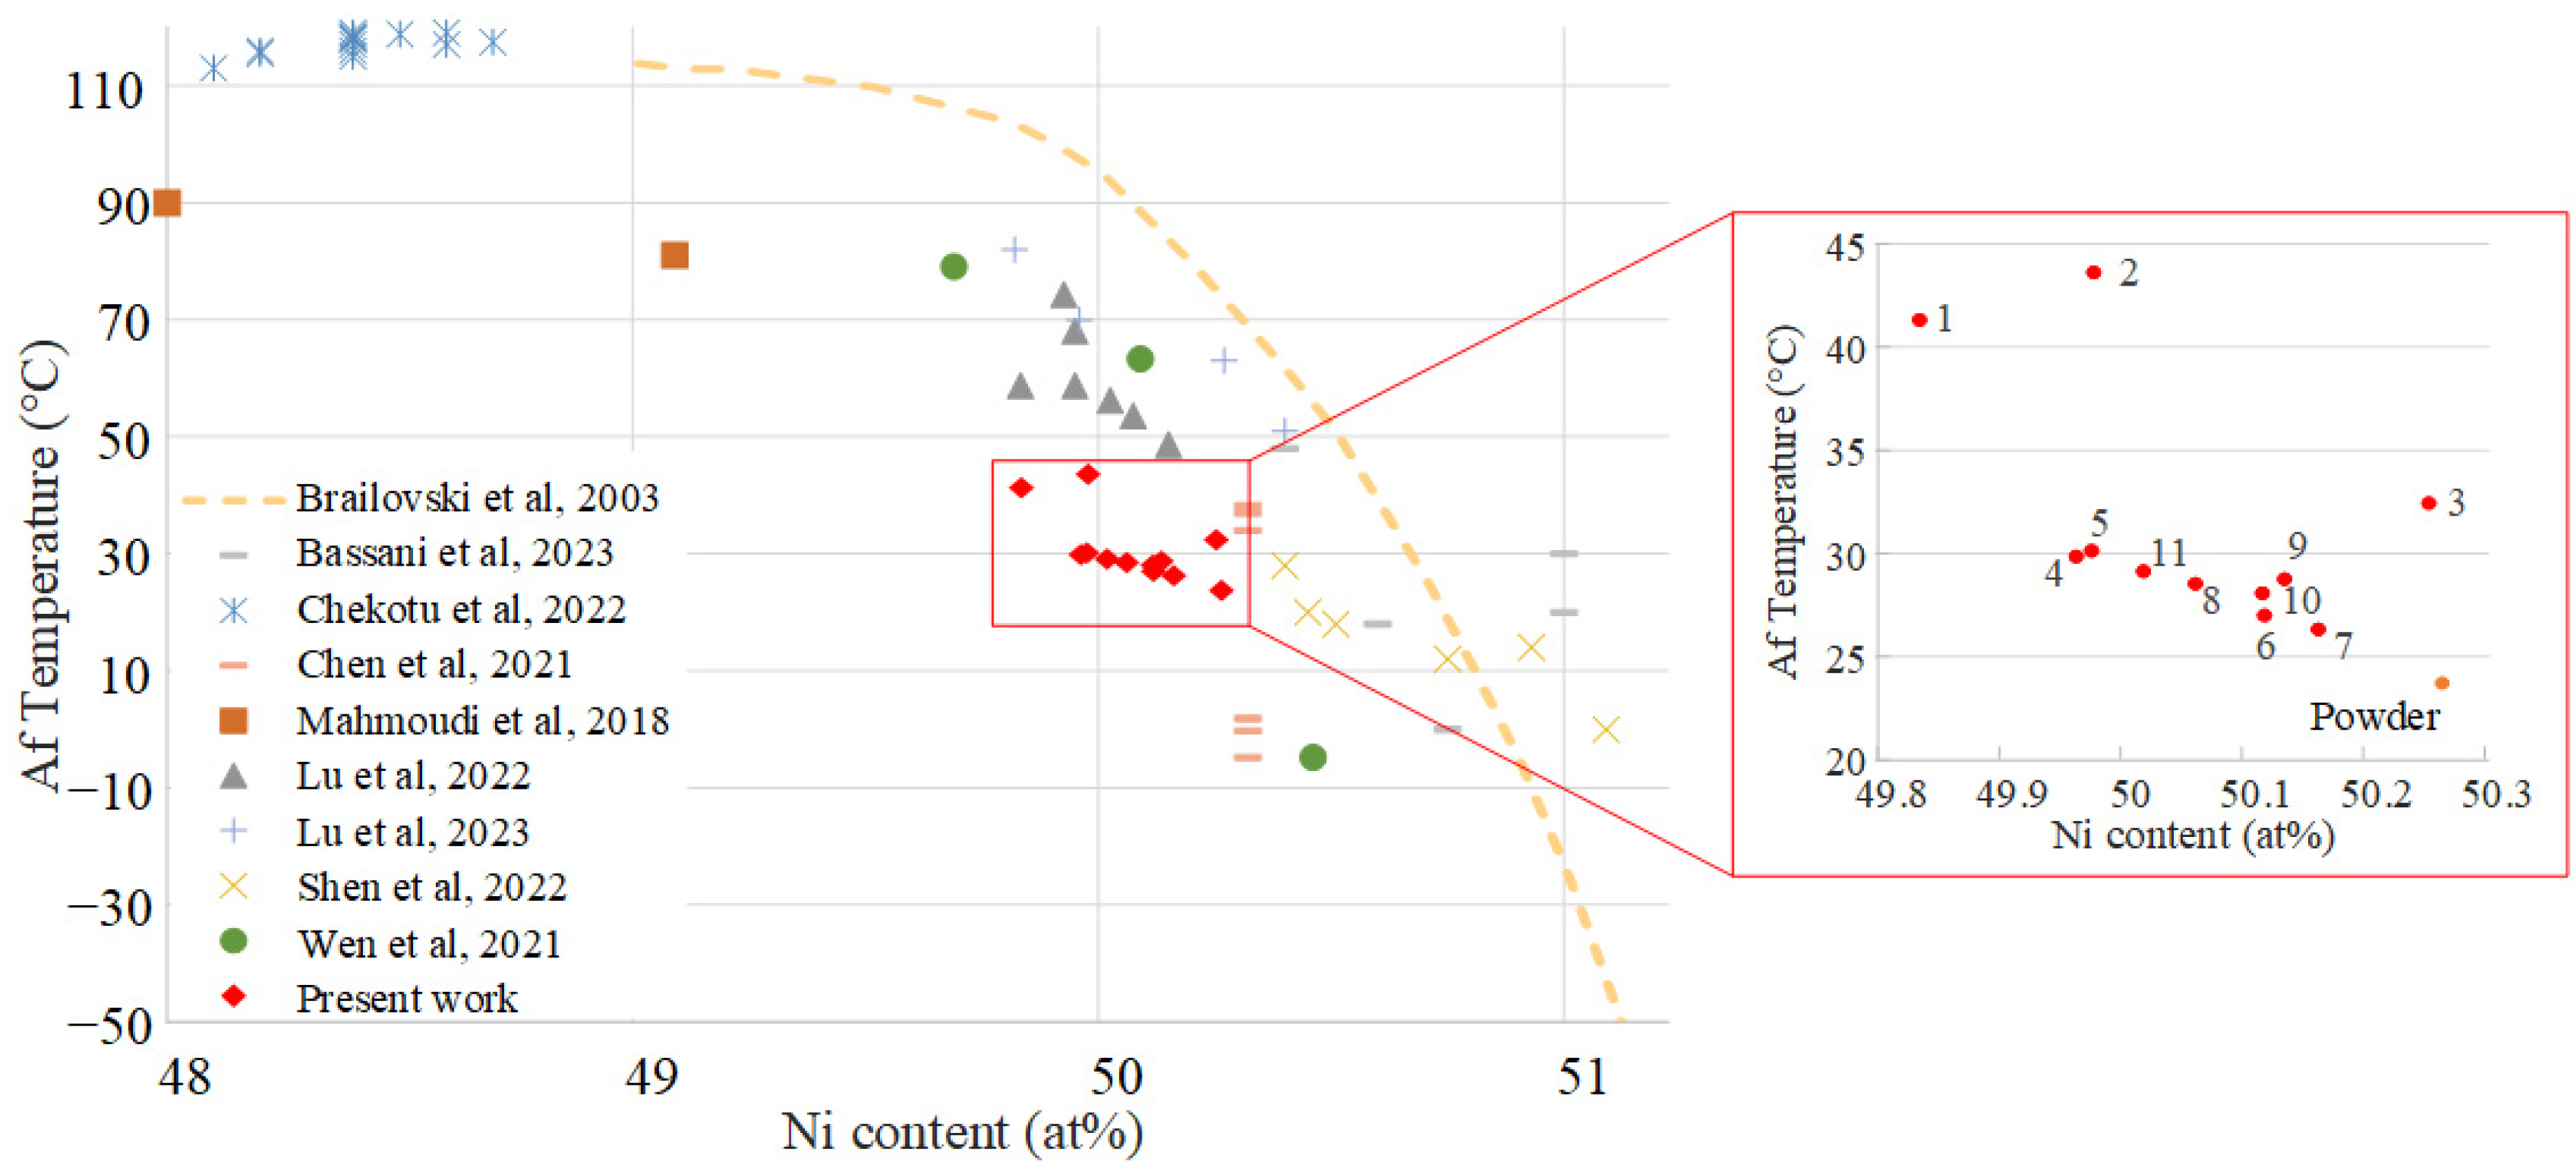
It is well known that the phase transformation temperatures in Ti-Ni SMA are dependent not only on the chemical composition of the alloy (Figure 20) but also on the stress state of the matter. Therefore, these variations in the phase transformation temperatures can be explained by high residual stresses generated during printing and by their relaxation during heat treatment. It can be stipulated that when the VED is high and BR is low, the specimens contain less residual stress because the excess energy partially acts as a stress relief throughout the printing process. Biffi et al. [17] and Saedi et al. [47] similarly observed an increase in the transformation temperatures after heat treatments, which was attributed to the relaxation of residual stresses and to the formation of nickel-rich precipitates Ni4Ti3 that depleted nickel from the matrix.
The XRD analyses showed that by varying the VED delivered to the powder bed, the phase content and crystallographic texture can be modified. Indeed, low-VED–high-BR specimens were more austenitic and had a signature closer to that of the powder. High-VED–low-BR specimens displayed more intense martensitic peaks and a preferential (200) austenitic orientation. The same effect was noted in the literature, with higher VED parts exhibiting a preferential (100) crystallographic orientation corresponding to the building direction [17,18,35,54,55]. It was found that such a texture improves superelasticity in compression, effectively allowing the mechanical behavior of printed material to be tailored by adjusting the printing parameters [47,55,56]. Moreover, the superelastic behavior can also be improved by increasing the heat treatment temperatures and times: Saedi, Turabi, Andani, Moghaddam, Elahinia, and Karaca [47] showed that 600 °C aging for 1.5 h significantly increased the stress recovery of printed Ti-Ni alloy samples.
The results of mechanical testing of the bulk specimens in the as-built state (ultimate tensile stress of 250 MPa and failure strain of 1%) and after the heat treatment (550 MPa and 5.5%, respectively) are comparable to those reported in the literature [35,41,44,50]. The heat treatment resulted in a partial superelastic behavior of the material, bringing forth the classic “flag”-like aspect of the stress–strain curve reported by Biffi et al. [17] and Elahinia et al. [11], with an onset martensite transformation stress of ~250 MPa, which is also in the literature range [11,39,52,53,56].
Numerical simulations of the lattices predicted that the diamond structures are more suited to take advantage of the functional properties of Ti-Ni SMA, and that was confirmed by experimental testing. In effect, at the same apparent strain, highly compliant diamond structures had a lower volume fraction of plastically deformed material as compared to their gyroid equivalents. Although fully superelastic behavior was not observed experimentally, partly due to the difficulty of controlling the material composition during printing, the recoverable strains were increased from ~2% for the bulk to 6–7% for the lattices, and the stiffness was reduced from ~19 GPa for the bulk to 3–4 GPa for the lattices. Similar difficulties in achieving perfect superelasticity in lattices were encountered by Lu et al. [57], Bartolomeu et al. [21], and Biffi et al. [22].
Nonetheless, the benefits of using SMAs in the manufacturing of lattice structures can be observed when comparing the experimental behavior of Ti-Ni lattices studied in this work to the behavior of analogous Ti64 structures from a previously published work [26] (Figure 21). Indeed, although the Ti-Ni lattices are ~2 times less strong than their Ti64 equivalents, they exhibit ~3–4 times larger recoverable strains, thus offering an extra margin of safety, if loaded above the onset of phase transformation (≥σAMS). When comparing the strength-to-stiffness ratios (Sy/E or σAMS/E) of the Ti-Ni lattices of this study with those of their Ti-6Al-4V equivalents [26], both with 60% porosity, the former outperform the latter, being closer to the range of properties of trabecular bones [58]. As a result, Ti-Ni lattices have become an intriguing option to be considered for use in intervertebral cages. Of note, since for the same porosity, the stiffness of Ti-Ni structures is significantly lower than that of their Ti64 equivalents, the stiffness of Ti-Ni lattices can be adjusted to match that of Ti64 lattices by using larger struts/walls with lesser sensitivity to the presence of manufacturing defects (in fact, 60% porous diamond Ti-Ni lattice has the same stiffness as the 80% porous diamond Ti64 lattice).

5. Conclusions

Laser powder bed fusion of Ti-50.26 at% Ni powders was carried out with the goal of finding an optimal printing regime to manufacture superelastic lattice structures. Different printing parameters were selected with the use of a numerical algorithm that predicts the density of the printed material. The manufactured specimens were characterized in terms of structural integrity, density, chemical composition, phase transformation temperatures, and crystalline phases. A parameter set offering the best compromise between printed density (99.94%) and transformation temperatures (Af 26.3 °C), while also achieving a relatively high build rate (10 cm3/h), was selected for mechanical testing and lattice manufacturing. Simultaneously, a numerical FEA model was built to simulate the mechanical behavior of superelastic lattice structures. Using the FEA model, partially validated in the framework of this study, Ti-Ni SMA superelastic lattice structures could be optimized further to better exploit their superelastic potential for particular applications.
The following conclusions can be drawn:
  • While the proposed melt pool-based model can be used to select printing parameters yielding high-density specimens, the predicted densities were significantly lower than their measured equivalents. Better predictions can be achieved by considering the temperature-dependent behavior of Ti-Ni powders.
  • Higher VEDs and slower BRs resulted in increased Ni evaporation, increased transformation temperatures and increased fraction of martensitic phase. The nickel content and, therefore, the transformation temperatures of printed specimens can be tailored by adjusting both the powder composition and the printing parameters.
  • As-built parts exhibited large residual stresses which resulted in cracking and affected the mechanical behavior of printed material. Heat treatment was necessary to relieve these stresses and improve superelasticity. A partial superelastic behavior of the printed material at room temperature with a recoverable strain of up to ~2% was achieved using a VED = 90 J/mm3 and BR = 10 cm3/h parameter set and a stress-relief heat treatment at 500 °C for 30 min.
  • Numerical simulation of the 60% porous Ti-Ni lattice structures offered useful insights into the material stress/strain state during loading. These simulations accurately predicted the apparent yield stress of the gyroid lattices, but underestimated their apparent stiffness by 18%. As far as the diamond lattices are concerned, the model underestimated their apparent yield stress by 25% and stiffness by 60%.
  • At the same apparent strain of 6%, recovery strains of the highly compliant diamond lattices were significantly higher than those of their gyroid equivalents (7.25 vs. 6%). This effect is caused by a significantly lower volume fraction of the material undergoing plastic deformation in the diamond lattices (2%) as compared to their gyroid equivalents (20%).

Author Contributions

Conceptualization, A.T., D.C. and V.B.; methodology, A.T. and D.C.; software, P.T.; validation, A.T.; formal analysis, A.T. and V.B.; investigation, A.T.; resources, V.B.; data curation, D.C.; writing—original draft preparation, A.T.; writing—review and editing, P.T and V.B.; visualization, A.T. and V.B.; supervision, V.B.; project administration, V.B.; funding acquisition, V.B. All authors have read and agreed to the published version of the manuscript.

Funding

This research was funded by the Fonds de Recherche du Québec—Nature et Technologies [272262]; the Natural Sciences and Engineering Research Council of Canada [V. Brailovski’s Discovery grant]; and the Fonds de Développement de l’École de technologie supérieure [A. Timercan’s scholarship].

Data Availability Statement

The raw and processed data required to reproduce these findings cannot be shared at this time as the data also form part of an ongoing study.

Acknowledgments

The authors would like to thank R. Romanica, S-E. Brika, A. Ayatollahi Tafti, M. Saadati, and S. Plamondon for their technical support with AM system preparation, CT scanning, specimen preparation, SEM, and mechanical testing, respectively.

Conflicts of Interest

The authors declare no conflicts of interest.

Appendix A

Table A1. Density measurements using CT imaging and pycnometry.
SpecimenPredicted Density (%)CT Scan (%) *Pycnometry (%) *
199.8699.85 ± 0.299.78 ± 0.06
2100.0099.95 ± 0.299.89 ± 0.09
399.9499.92 ± 0.299.85 ± 0.08
499.8599.98 ± 0.299.92 ± 0.11
599.6699.91 ± 0.299.74 ± 0.05
699.8699.90 ± 0.299.82 ± 0.04
799.8799.94 ± 0.299.95 ± 0.10
897.7399.73 ± 0.299.38 ± 0.06
998.0499.76 ± 0.299.24 ± 0.07
1098.0799.82 ± 0.299.22 ± 0.09
1196.1099.46 ± 0.299.13 ± 0.07
* standard deviation values are not always symmetrical, since the density has an upper limit of 100%.
Table A2. Phase transition temperatures (°C) of the powder (as-received) and printed specimens (as-built and heat-treated).
MfMsAsAfMfMsRfRsAsAf
As-Received Powder−57.63.7−33.923.7−57.63.7 −33.923.7
As-BuiltHeat Treated
Specimen1−19.722.01.443.0−27.1−3.011.523.019.941.3
2−23.625.7−1.345.4−29.7−3.310.024.919.343.6
3−77.98.7−45.721.9−32.0−11.612.729.822.032.4
4−60.012.9−42.331.2−42.4−15.610.622.215.929.8
5−50.19.3−33.426.4−40.0−14.911.524.116.930.1
6−80.91.6−50.29.9−51.1−25.511.626.413.227.0
7−80.1−3.9−50.8−1.0−51.6−30.010.526.312.826.3
8−73.7−5.5−44.47.7−44.5−22.012.727.616.028.5
9−81.0−14.6−51.7−4.5−53.6−30.513.130.012.628.8
10−80.6−13.9−51.0−4.0−55.4−32.313.329.112.028.1
11−81.2−17.1−50.7−5.5−52.4−29.714.330.113.129.1

References

  1. Khorasani, A.; Gibson, I.; Veetil, J.K.; Ghasemi, A.H. A review of technological improvements in laser-based powder bed fusion of metal printers. Int. J. Adv. Manuf. Technol. 2020, 108, 191–209. [Google Scholar] [CrossRef]
  2. Wong, K.V.; Hernandez, A. A review of additive manufacturing. ISRN Mech. Eng. 2012, 2012, 208760. [Google Scholar] [CrossRef]
  3. Mahmoud, D.; Elbestawi, M. Lattice structures and functionally graded materials applications in additive manufacturing of orthopedic implants: A review. J. Manuf. Mater. Process. 2017, 1, 13. [Google Scholar] [CrossRef]
  4. Wang, X.; Xu, S.; Zhou, S.; Xu, W.; Leary, M.; Choong, P.; Qian, M.; Brandt, M.; Xie, Y.M. Topological design and additive manufacturing of porous metals for bone scaffolds and orthopaedic implants: A review. Biomaterials 2016, 83, 127–141. [Google Scholar] [CrossRef] [PubMed]
  5. Zhang, X.-Y.; Fang, G.; Zhou, J. Additively manufactured scaffolds for bone tissue engineering and the prediction of their mechanical behavior: A review. Materials 2017, 10, 50. [Google Scholar] [CrossRef] [PubMed]
  6. Chen, L.-Y.; Liang, S.-X.; Liu, Y.; Zhang, L.-C. Additive manufacturing of metallic lattice structures: Unconstrained design, accurate fabrication, fascinated performances, and challenges. Mater. Sci. Eng. R Rep. 2021, 146, 100648. [Google Scholar]
  7. Kelly, C.N.; Wang, T.; Crowley, J.; Wills, D.; Pelletier, M.H.; Westrick, E.R.; Adams, S.B.; Gall, K.; Walsh, W.R. High-strength, porous additively manufactured implants with optimized mechanical osseointegration. Biomaterials 2021, 279, 121206. [Google Scholar] [CrossRef] [PubMed]
  8. Otsuka, K.; Wayman, C.M. Shape Memory Materials; Cambridge University Press: Cambridge, UK, 1999. [Google Scholar]
  9. Mwangi, J.W.; Nguyen, L.T.; Bui, V.D.; Berger, T.; Zeidler, H.; Schubert, A. Nitinol manufacturing and micromachining: A review of processes and their suitability in processing medical-grade nitinol. J. Manuf. Process. 2019, 38, 355–369. [Google Scholar] [CrossRef]
  10. Brandt, M. Laser Additive Manufacturing: Materials, Design, Technologies, and Applications; Woodhead Publishing: Cambridge, UK, 2016. [Google Scholar]
  11. Elahinia, M.; Shayesteh Moghaddam, N.; Taheri Andani, M.; Amerinatanzi, A.; Bimber, B.A.; Hamilton, R.F. Fabrication of NiTi through additive manufacturing: A review. Prog. Mater. Sci. 2016, 83, 630–663. [Google Scholar] [CrossRef]
  12. Chekotu, J.C.; Groarke, R.; O’Toole, K.; Brabazon, D. Advances in Selective Laser Melting of Nitinol Shape Memory Alloy Part Production. Materials 2019, 12, 809. [Google Scholar] [CrossRef]
  13. Zhang, Y.; Attarilar, S.; Wang, L.; Lu, W.; Yang, J.; Fu, Y. A Review on Design and Mechanical Properties of Additively Manufactured NiTi Implants for Orthopedic Applications. Int. J. Bioprinting 2021, 7, 340. [Google Scholar] [CrossRef] [PubMed]
  14. Chmielewska, A.; Wysocki, B.; Buhagiar, J.; Michalski, B.; Adamczyk-Cieślak, B.; Gloc, M.; Święszkowski, W. In situ alloying of NiTi: Influence of Laser Powder Bed Fusion (LBPF) scanning strategy on chemical composition. Mater. Today Commun. 2021, 30, 103007. [Google Scholar] [CrossRef]
  15. Mahmoudi, M.; Tapia, G.; Franco, B.; Ma, J.; Arroyave, R.; Karaman, I.; Elwany, A. On the printability and transformation behavior of nickel-titanium shape memory alloys fabricated using laser powder-bed fusion additive manufacturing. J. Manuf. Process. 2018, 35, 672–680. [Google Scholar] [CrossRef]
  16. Leon, E.S.; Singamneni, S.; Guraya, T.; Chen, Z. Effect of laser power in laser powder bed fusion on Ni content and structure of Nitinol. Mater. Today Proc. 2023. [Google Scholar] [CrossRef]
  17. Biffi, C.A.; Fiocchi, J.; Valenza, F.; Bassani, P.; Tuissi, A. Selective Laser Melting of NiTi Shape Memory Alloy: Processability, Microstructure, and Superelasticity. Shape Mem. Superelasticity 2020, 6, 342–353. [Google Scholar] [CrossRef]
  18. Bassani, P.; Fiocchi, J.; Tuissi, A.; Biffi, C.A. Investigation of the Effect of Laser Fluence on Microstructure and Martensitic Transformation for Realizing Functionally Graded NiTi Shape Memory Alloy via Laser Powder Bed Fusion. Appl. Sci. 2023, 13, 882. [Google Scholar] [CrossRef]
  19. Borisov, E.; Starikov, K.; Popovich, A.; Tihonovskaya, T. Investigation of the possibility of tailoring the chemical com-position of the NiTi alloy by selective laser melting. Metals 2021, 11, 1470. [Google Scholar] [CrossRef]
  20. Brailovski, V.; Prokoshkin, S.; Terriault, P.; Trochu, F. Shape Memory Alloys: Fundamentals, Modeling and Applications; École de technologie supérieure: Montréal, QC, Canada, 2003. [Google Scholar]
  21. Bartolomeu, F.; Costa, M.; Alves, N.; Miranda, G.; Silva, F. Engineering the elastic modulus of NiTi cellular structures fabricated by selective laser melting. J. Mech. Behav. Biomed. Mater. 2020, 110, 103891. [Google Scholar] [CrossRef]
  22. Biffi, C.A.; Bassani, P.; Fiocchi, J.; Tuissi, A. Microstructural and mechanical response of NiTi lattice 3D structure produced by selective laser melting. Metals 2020, 10, 814. [Google Scholar] [CrossRef]
  23. Timercan, A. Fabrication Additive de Structures Architecturées en Alliages de Titane Conventionnel et Superélastique pour Cages Intervertébrales; École de technologie supérieure: Montréal, QC, Canada, 2024. [Google Scholar]
  24. Letenneur, M.; Brailovski, V.; Kreitcberg, A.; Paserin, V.; Bailon-Poujol, I. Laser powder bed fusion of water-atomized iron-based powders: Process optimization. J. Manuf. Mater. Process. 2017, 1, 23. [Google Scholar] [CrossRef]
  25. Davis, J.R.; Committee, A.I.H. Metals Handbook Desk Edition, 2nd ed.; Taylor & Francis: Milton Park, UK, 1998. [Google Scholar]
  26. Timercan, A.; Terriault, P.; Brailovski, V. Axial tension/compression and torsional loading of diamond and gyroid lattice structures for biomedical implants: Simulation and experiment. Mater. Des. 2023, 225, 111585. [Google Scholar] [CrossRef]
  27. du Plessis, A. Effects of process parameters on porosity in laser powder bed fusion revealed by X-ray tomography. Addit. Manuf. 2019, 30, 100871. [Google Scholar] [CrossRef]
  28. Semenova, E.L.; Kudryavtsev, Y.V. Structural phase transformation and shape memory effect in ZrRh and ZrIr. J. Alloys Compd. 1994, 203, 165–168. [Google Scholar] [CrossRef]
  29. Sitepu, H. Texture and structural refinement using neutron diffraction data from molybdite (MoO3) and calcite (CaCO3) powders and a Ni-rich Ni50.7Ti49.30 alloy. Powder Diffr. 2009, 24, 315–326. [Google Scholar] [CrossRef]
  30. Sitepu, H. In situ structural and texture analyses of monoclinic phase for polycrystalline Ni-rich Ti49.86Ni50.14 alloy from neutron diffraction data. Powder Diffr. 2008, 23, 35–40. [Google Scholar] [CrossRef]
  31. Kudoh, Y.; Tokonami, M.; Miyazaki, S.; Otsuka, K. Crystal structure of the martensite in Ti-49.2 at.% Ni alloy analyzed by the single crystal X-ray diffraction method. Acta Metall. 1985, 33, 2049–2056. [Google Scholar] [CrossRef]
  32. Sitepu, H. Use of synchrotron diffraction data for describing crystal structure and crystallographic phase analysis of R-phase NiTi shape memory alloy. Textures Microstruct. 2003, 35, 185–195. [Google Scholar] [CrossRef]
  33. Krishnan, V.; Manjeri, R.M.; Clausen, B.; Brown, D.; Vaidyanathan, R. Analysis of neutron diffraction spectra acquired in situ during mechanical loading of shape memory NiTiFe at low temperatures. Mater. Sci. Eng. A 2008, 481, 3–10. [Google Scholar] [CrossRef]
  34. ASTM F2004-17; Standard Test Method for Transformation Temperature of Nickel-Titanium Alloys by Thermal Analysis. ASTM: West Conshohocken, PA, USA, 2017.
  35. Xue, L.; Atli, K.; Zhang, C.; Hite, N.; Srivastava, A.; Leff, A.; Wilson, A.; Sharar, D.; Elwany, A.; Arroyave, R. Laser Powder Bed Fusion of Defect-Free NiTi Shape Memory Alloy Parts with Superior Tensile Superelasticity. Acta Mater. 2022, 229, 117781. [Google Scholar] [CrossRef]
  36. Zhao, C.; Liang, H.; Luo, S.; Yang, J.; Wang, Z. The effect of energy input on reaction, phase transition and shape memory effect of NiTi alloy by selective laser melting. J. Alloys Compd. 2020, 817, 153288. [Google Scholar] [CrossRef]
  37. Zhang, Q.; Hao, S.; Liu, Y.; Xiong, Z.; Guo, W.; Yang, Y.; Ren, Y.; Cui, L.; Ren, L.; Zhang, Z. The microstructure of a selective laser melting (SLM)-fabricated NiTi shape memory alloy with superior tensile property and shape memory recoverability. Appl. Mater. Today 2020, 19, 100547. [Google Scholar] [CrossRef]
  38. Qiu, P.; Gao, P.; Wang, S.; Li, Z.; Yang, Y.; Zhang, Q.; Xiong, Z.; Hao, S. Study on corrosion behavior of the selective laser melted NiTi alloy with superior tensile property and shape memory effect. Corros. Sci. 2020, 175, 108891. [Google Scholar] [CrossRef]
  39. Fu, J.; Hu, Z.; Song, X.; Zhai, W.; Long, Y.; Li, H.; Fu, M. Micro selective laser melting of NiTi shape memory alloy: Defects, microstructures and thermal/mechanical properties. Opt. Laser Technol. 2020, 131, 106374. [Google Scholar] [CrossRef]
  40. McCue, I.; Peitsch, C.; Montalbano, T.; Lennon, A.; Sopcisak, J.; Trexler, M.M.; Storck, S. Scalable laser powder bed fusion processing of nitinol shape memory alloy. MRS Commun. 2019, 9, 1214–1220. [Google Scholar] [CrossRef]
  41. Ren, D.; Zhang, L.; Liu, Y.; Ji, H.; Li, S.; Jin, W.; Lei, J. Effect of hot isostatic pressing on the mechanical and corrosive properties of Ti-Ni alloy fabricated by selective laser melting. J. Mater. Res. Technol. 2023, 26, 4595–4605. [Google Scholar] [CrossRef]
  42. Zhu, J.-N.; Ding, Z.; Borisov, E.; Yao, X.; Brouwer, J.C.; Popovich, A.; Hermans, M.; Popovich, V. Healing cracks in additively manufactured NiTi shape memory alloys. Virtual Phys. Prototyp. 2023, 18, e2246437. [Google Scholar] [CrossRef]
  43. Zamani, M.; Kadkhodaei, M.; Badrossamay, M.; Foroozmehr, E. Adjustment of the scan track spacing and linear input energy to fabricate dense, pseudoelastic Nitinol shape memory alloy parts by selective laser melting. J. Intell. Mater. Syst. Struct. 2022, 33, 1719–1730. [Google Scholar] [CrossRef]
  44. Ge, J.; Yuan, B.; Chen, H.; Pan, J.; Liu, Q.; Yan, M.; Lu, Z.; Zhang, S.; Zhang, L. Anisotropy in microstructural features and tensile performance of laser powder bed fusion NiTi alloys. J. Mater. Res. Technol. 2023, 24, 8656–8668. [Google Scholar] [CrossRef]
  45. Saghaian, S.E.; Nematollahi, M.; Toker, G.; Hinojos, A.; Moghaddam, N.S.; Saedi, S.; Lu, C.Y.; Mahtabi, M.J.; Mills, M.J.; Elahinia, M. Effect of hatch spacing and laser power on microstructure, texture, and thermomechanical properties of laser powder bed fusion (L-PBF) additively manufactured NiTi. Opt. Laser Technol. 2021, 149, 107680. [Google Scholar] [CrossRef]
  46. Lu, H.; Yang, C.; Luo, X.; Ma, H.; Song, B.; Li, Y.; Zhang, L. Ultrahigh-performance TiNi shape memory alloy by 4D printing. Mater. Sci. Eng. A 2019, 763, 138166. [Google Scholar] [CrossRef]
  47. Saedi, S.; Turabi, A.S.; Andani, M.T.; Moghaddam, N.S.; Elahinia, M.; Karaca, H.E. Texture, aging, and superelasticity of selective laser melting fabricated Ni-rich NiTi alloys. Mater. Sci. Eng. A 2017, 686, 1–10. [Google Scholar] [CrossRef]
  48. Chekotu, J.C.; Goodall, R.; Kinahan, D.; Brabazon, D. Control of Ni-Ti phase structure, solid-state transformation temperatures and enthalpies via control of L-PBF process parameters. Mater. Des. 2022, 218, 110715. [Google Scholar] [CrossRef]
  49. Chen, W.; Yang, Q.; Huang, S.; Huang, S.; Kruzic, J.J.; Li, X. Laser power modulated microstructure evolution, phase transformation and mechanical properties in NiTi fabricated by laser powder bed fusion. J. Alloys Compd. 2021, 861, 157959. [Google Scholar] [CrossRef]
  50. Lu, H.; Ma, H.; Cai, W.; Luo, X.; Qu, S.; Wang, J.; Lupoi, R.; Yin, S.; Yang, C. Altered phase transformation behaviors and enhanced bending shape memory property of NiTi shape memory alloy via selective laser melting. J. Mater. Process. Technol. 2022, 303, 117546. [Google Scholar] [CrossRef]
  51. Lu, H.; Ma, H.; Yang, Y.; Cai, W.; Luo, X.; Yan, A.; Kang, L.; Yin, S.; Yang, C. Tailoring phase transformation behavior, microstructure, and superelasticity of NiTi shape memory alloys by specific change of laser power in selective laser melting. Mater. Sci. Eng. A 2023, 864, 144576. [Google Scholar] [CrossRef]
  52. Shen, F.; Li, H.; Guo, H.; Guo, N.; Fang, X. Effect of energy density on the superelastic property of Ni-rich NiTi alloy fabricated by laser powder bed fusion. Mater. Sci. Eng. A 2022, 854, 143874. [Google Scholar] [CrossRef]
  53. Wen, S.; Liu, Y.; Zhou, Y.; Zhao, A.; Yan, C.; Shi, Y. Effect of Ni content on the transformation behavior and mechanical property of NiTi shape memory alloys fabricated by laser powder bed fusion. Opt. Laser Technol. 2021, 134, 106653. [Google Scholar] [CrossRef]
  54. Saedi, S.; Shayesteh Moghaddam, N.; Amerinatanzi, A.; Elahinia, M.; Karaca, H.E. On the effects of selective laser melting process parameters on microstructure and thermomechanical response of Ni-rich NiTi. Acta Mater. 2018, 144, 552–560. [Google Scholar] [CrossRef]
  55. Moghaddam, N.S.; Saedi, S.; Amerinatanzi, A.; Hinojos, A.; Ramazani, A.; Kundin, J.; Mills, M.J.; Karaca, H.; Elahinia, M. Achieving superelasticity in additively manufactured NiTi in compression without post-process heat treatment. Sci. Rep. 2019, 9, 41. [Google Scholar]
  56. Dadbakhsh, S.; Vrancken, B.; Kruth, J.P.; Luyten, J.; Van Humbeeck, J. Texture and anisotropy in selective laser melting of NiTi alloy. Mater. Sci. Eng. A 2016, 650, 225–232. [Google Scholar] [CrossRef]
  57. Lu, H.; Ma, H.; Luo, X.; Wang, Y.; Wang, J.; Lupoi, R.; Yin, S.; Yang, C. Microstructure, shape memory properties, and in vitro biocompatibility of porous NiTi scaffolds fabricated via selective laser melting. J. Mater. Res. Technol. 2021, 15, 6797–6812. [Google Scholar] [CrossRef]
  58. Timercan, A.; Sheremetyev, V.; Brailovski, V. Mechanical properties and fluid permeability of gyroid and diamond lattice structures for intervertebral devices: Functional requirements and comparative analysis. Sci. Technol. Adv. Mater. 2021, 22, 285–300. [Google Scholar] [CrossRef] [PubMed]
Figure 1. (a) Ti-Ni powder particle size distribution and (b) particle morphology observed by SEM.
Jmmp 08 00176 g001
Figure 2. Processing map of the predicted material density as a function of VED and BR for 30 µm layer thickness and 70 µm hatch distance; zone encompassed by VED = 70–100 J/mm3 and BR = 3–10 cm3/h corresponds to the highest expected printed density. The numbers correspond to parameter sets selected to be studied.
Jmmp 08 00176 g002
Figure 3. Unit cell of the (a) diamond lattice and (b) gyroid lattice, (c) design of the lattice specimens, (d) design of the build plate with different specimens.
Jmmp 08 00176 g003
Figure 4. Idealized (a) DSC and (b) tensile diagrams of Ti-Ni SMA and corresponding temperature, stress, and strain characteristics.
Jmmp 08 00176 g004
Figure 5. Mechanical testing setup of (a) bulk specimens in tension and (b) lattice structures in compression.
Jmmp 08 00176 g005
Figure 6. (a) Ti-Ni substrate featuring cylindrical specimens (10 and 5 mm diameter), tensile specimens and lattice structures, (b) zoomed view into crack defects, and (c) diamond and gyroid lattice structures in the as-built and heat-treated conditions.
Jmmp 08 00176 g006
Figure 7. CT scan analysis of the 5 mm diameter specimens printed with the 11 sets of parameters shown as a cross-section image and the sideview of the specimen porosity (red) and cracks (yellow). Images are arranged according to the specimen position on the processing map.
Jmmp 08 00176 g007
Figure 8. (a) Measured relative density compared to the model prediction for each parameter set as related to the (b) processing map.
Jmmp 08 00176 g008
Figure 9. Nickel content in the manufactured specimens as (a) a function of the VED and (b) in the BR-VED design space. Specimen 3 is considered an outlier; arrow indicates nickel content in the as-received powder.
Jmmp 08 00176 g009
Figure 10. DSC results of the as-received powder and printed specimens: (a) as-built and (b) heat-treated.
Jmmp 08 00176 g010
Figure 11. Af temperature of the specimens in the (a) as-built and (b) heat-treated conditions in the VED-BR coordinates; arrow indicates Af temperature of the as-received powder.
Jmmp 08 00176 g011
Figure 12. X-ray diffractograms of the powder and printed specimens in the (a) as-built condition and (b) after heat treatment; peaks of austenite (red), martensite (blue), and R-phase (green) are identified.
Jmmp 08 00176 g012
Figure 13. Microstructure of the specimen printed using Parameter set 7: (a,b) optical microscopy and (c,d) EBSD in the as-built (a,c) and heat-treated (b,d) conditions.
Jmmp 08 00176 g013
Figure 14. Tension stress–strain diagrams of the bulk specimens (Parameter set 7) in the as-built (AB) and heat-treated (HT) conditions with (a) incremental loading and (b) idealized material behavior law for the FEA simulations (dashed curve) based on an averaged stress–strain diagram in the heat-treated state (solid curve).
Jmmp 08 00176 g014
Figure 15. (a) Simulated stress–strain curves of the gyroid and diamond lattices, and stress distribution in the (b) gyroid and (c) diamond structures at a common apparent strain of 6% with the material volume fraction in the plastic, superelastic, and elastic stress states.
Jmmp 08 00176 g015
Figure 16. Compression behavior of the as-built and heat-treated 60% porous (a) gyroid and (b) diamond lattices. (c) Apparent stress and (d) recovered strain values are plotted against the applied strain of all the tested structures with arrows indicating the effect of the heat treatment on the structures’ properties.
Jmmp 08 00176 g016
Figure 17. Comparison of experimental and simulated stress–strain behavior of 60% porous (a) gyroid and (b) diamond lattices.
Jmmp 08 00176 g017
Figure 18. Geometrical comparison between the designed and manufactured (a) gyroid and (b) diamond lattices. The red outline corresponds to the CAD and the colored outline corresponds to the printed surface, color-coded to the distance between the printed and CAD surfaces.
Jmmp 08 00176 g018
Figure 19. (a) Color-coded measured densities superimposed on the model predictions map, (b) typical pore shape for high- and low-VED specimens, and (c) pore size distribution for Specimens 1, 7, and 11.
Jmmp 08 00176 g019
Figure 20. Af temperature in relation to the nickel content as presented in the literature [15,18,20,48,49,50,51,52,53] and detailed view of the powder and the heat-treated specimens from the present work. The numbers in the zoomed view correspond to the studied parameter sets.
Jmmp 08 00176 g020
Figure 21. Comparison of the (a) experimental stress–strain diagrams of 60% porous Ti64 and Ti-Ni gyroid and diamond lattices and (b) Sy/E ratios of the studied lattices structures and data adapted from Timercan et al. [26].
Jmmp 08 00176 g021
Table 1. Material properties of Ti-Ni used for the LPBF process modeling and specimen density prediction [8,25].
Melting temperature [K]1573
Thermal conductivity [W/m·K]18
Specific heat capacity [J/kg·K]450
Laser absorptivity, % *45.6
Powder bed density, %60
* Absorptivity was calculated using the Hagen–Rubens model and an electrical resistivity value of 1 × 10⁻⁶ Ohm · m [24].
Table 2. Printing parameters and predicted densities for 30 µm layer thickness and 70 µm hatch distance.
SpecimenPower (W)Speed (mm/s)Volumetric Energy Density (J/mm3)Build Rate (cm3/h)Predicted Density (%)
183397100399.86
275397903100.00
312566190599.94
4188992907.599.85
57852970499.66
6146992707.599.86
71941323701099.87
86966150597.73
9104992507.598.04
101391323501098.07
111111323401096.10
Table 3. Mechanical properties of the as-built and heat-treated specimens in tension and idealized stress–strain parameters of the heat-treated specimens used for FEA simulations.
E
(GPa)
σAMS
(MPa)
σAMF
(MPa)
σMAS
(MPa)
σMAF
(MPa)
σmax
(MPa)
ε
(%)
ExperimentalAs-built22.2----2501
Heat-treated18.7250---5565.5
SimulationIdealized heat-treated18.72505002000-2.8
Disclaimer/Publisher’s Note: The statements, opinions and data contained in all publications are solely those of the individual author(s) and contributor(s) and not of MDPI and/or the editor(s). MDPI and/or the editor(s) disclaim responsibility for any injury to people or property resulting from any ideas, methods, instructions or products referred to in the content.