Article

Additive Friction Stir Deposition of a Tantalum–Tungsten Refractory Alloy

by
R. Joey Griffiths
1,
Alexander E. Wilson-Heid
1,
Marissa A. Linne
1,
Eleanna V. Garza
1,
Arnold Wright
2 and
Aiden A. Martin
1,*
1
Lawrence Livermore National Laboratory, 7000 East Avenue, Livermore, CA 94550, USA
2
Bond Technologies, 1353 Wade Drive, Suite B, Elkhart, IN 46514, USA
*
Author to whom correspondence should be addressed.
J. Manuf. Mater. Process. 2024, 8(4), 177; https://doi.org/10.3390/jmmp8040177
Submission received: 24 June 2024 / Revised: 8 August 2024 / Accepted: 8 August 2024 / Published: 14 August 2024

Abstract

:
Additive friction stir deposition (AFSD) is a solid-state metal additive manufacturing technique, which utilizes frictional heating and plastic deformation to create large deposits and parts. Much like its cousin processes, friction stir welding and friction stir processing, AFSD has seen the most compatibility and use with lower-temperature metals, such as aluminum; however, there is growing interest in higher-temperature materials, such as titanium and steel alloys. In this work, we explore the deposition of an ultrahigh-temperature refractory material, specifically, a tantalum–tungsten (TaW) alloy. The solid-state nature of AFSD means refractory process temperatures are significantly lower than those for melt-based additive manufacturing techniques; however, they still pose difficult challenges, especially in regards to AFSD tooling. In this study, we perform initial deposition trials of TaW using twin-rod-style AFSD with a high-temperature tungsten–rhenium-based tool. Many challenges arise because of the high temperatures of the process and high mechanical demand on AFSD machine hardware to process the strong refractory alloy. Despite these challenges, successful deposits of the material were produced and characterized. Mechanical testing of the deposited material shows improved yield strength over that of the annealed reference material, and this strengthening is mostly attributed to the refined recrystallized microstructure typical of AFSD. These findings highlight the opportunities and challenges associated with ultrahigh-temperature AFSD, as well as provide some of the first published insights into twin-rod-style AFSD process behaviors.

1. Introduction

Refractory metals, namely, chromium, niobium, tantalum, molybdenum, tungsten, and rhenium, are renowned for their high melting temperatures, high strengths, and good corrosion resistances. Such properties make them attractive for use in biomedical, electronic, and aerospace applications [1,2,3]. Even with such demand, the use and implementation of refractory metals can be challenging because of their limited formabilities [2,4,5]. Their extremely high melting temperatures also make casting and heat treatment challenging. High strength, in particular, high strength at elevated temperatures, limits the forging and workability of refractory materials. High strength and hardness also reduce the machinability of most refractories, while ductile–brittle transitions and strain hardening behaviors can further complicate machining operations. With these limitations, the production capability for large parts with complex features poses a significant challenge.
Additive manufacturing (AM) is a popular methodology for addressing material formability and modern manufacturing challenges [3,6,7]. In the past decade, the AM of refractory metals and their alloys has been an active field of research [3,8,9,10,11] and typically focused on melt-based AM processes. In such processes, a laser, electron beam, or electrical arc are used to melt and solidify small volumes of materials on a localized, site-by-site basis to form a three-dimensional part. Though these strategies bypass the inability to melt and cast many refractories at the bulk scale by focusing on low individual volumes, the extreme thermal gradients between liquids and solidified materials create high residual stresses and hot-cracking challenges. Furthermore, the feedstock for these processes, typically a powder or a wire, can be challenging to produce in form and fit to the AM process needs, limiting the ability to develop and test new alloys.
Additive friction stir deposition (AFSD) is a solid-state AM technique, which leverages the deformation of low independent volumes to deposit materials [7,12,13] and potentially bypass the limited bulk forgeability of many refractory metals. During AFSD, a consumable rod of material is heated and subsequently plasticized via frictional heating and plastic deformation, allowing for it to be deformed or “stirred” beneath a rigid rotating tool. As the tool travels across the surface, the plasticized material is sheared off to form a track behind the tool, while fresh material is continuously fed into the plasticized stir region beneath the tool. Models and measurements of AFSD [14,15,16] ascribe a dynamic processing regime bound between hot-working and severe plastic deformation (SPD) processes [17,18], and these forging-like conditions produce materials with high densities and low residual stresses. Importantly, the feedstock for AFSD is typically a solid rod, which can be produced via casting, conventional drawing and forging, sectioning plate materials, as well as the consolidation of chips or powders [19,20,21]. Commonly, AFSD has been shown to be highly compatible with aluminum and copper alloys [13,14,15,19,22,23,24,25]. The deposition of titanium alloys [20,26,27] and stainless-steel alloys [28,29,30,31,32] has been demonstrated with AFSD but tends to represent the current high-temperature limit of the technology for sustained continuous deposition. Other high-temperature materials, including nickel-based alloys [33,34], steels [35], and high-entropy alloys [36], have also been demonstrated. AFSD typically operates at 50–90 percent of the melting temperature of the processed metal [13,16,21,22,37]; therefore, the AFSD of refractory metals is expected to occur at temperatures exceeding 1000 °C. Given that the AFSD tool head needs to remain rigid in order to plastically deform and deposit feed materials, there are very few materials suitable for dynamic loading under these conditions, most being refractory alloys themselves. Friction stir welding and processing have seen success utilizing ceramics, namely, polycrystalline boron nitride, for such applications [38,39,40]; however, the tooling in these applications experiences mostly compressive forces, whereas an AFSD tool experiences tensile expansive forces, making ceramics difficult for use as AFSD tooling materials. Another direct deposition process, friction surfacing, does not require the use of a tool [41,42]. During the AFSD process startup with a featureless tool, it bears a strong similarity to friction surfacing. This similarity means existing studies on friction-surfacing behaviors may be leveraged for insight into AFSD as well [43,44,45,46].
Herein, we investigate the AFSD of refractory alloys utilizing a tantalum–2.5 wt.% tungsten (Ta2.5W) alloy as the feedstock and state-of-the-art high-temperature AFSD tooling. Common tantalum–tungsten alloys vary in the W concentration from ~2.5 to 10 wt.% and can include small amounts of a number of other metals. The lower-W-concentration alloys behave much like the more ductile refractories (Nb and Ta), whereas the high-W-concentration alloys behave more like the brittle refractories (Cr, Mo, W, and Re) [1,47,48,49,50,51]. These properties and their availabilities in common bar and plate forms, make the Ta-W alloys good benchmarks for developing the AFSD of refractory metals. As noted, the ceramics commonly used in high-temperature friction stir welding and processing are not well suited to AFSD conditions. Tungsten–lanthanum and tungsten–rhenium alloys represent some of the highest-working-temperature and wear-resistant materials of the commercially available monolithic structural materials (i.e., no coatings, composites, or bespoke alloys). In this study, utilizing a W-Re-HfC tool, AFSD is demonstrated with the Ta2.5W feedstock material. The material is successfully deposited; however, the deposition of a continuous track is hindered by tool jamming, machine hardware overloads, and the dynamic behavior of the plasticized feed material. The deposited material displays an increase in the yield strength, which is attributed to the refined microstructure produced by AFSD. Despite the challenges in achieving sustained deposition, the observations during the process startup provide insight into high-temperature AFSD. Furthermore, although the deposit is found to contain more defects than typical of AFSD, these prove to be valuable indicators of the AFSD process behavior in the new twin-rod configuration. This work demonstrates the merit for using AFSD for the formation of high-temperature refractory materials and defines the process improvements that must be addressed for sustained deposition as well as proposed solutions to these challenges.

2. Materials and Methods

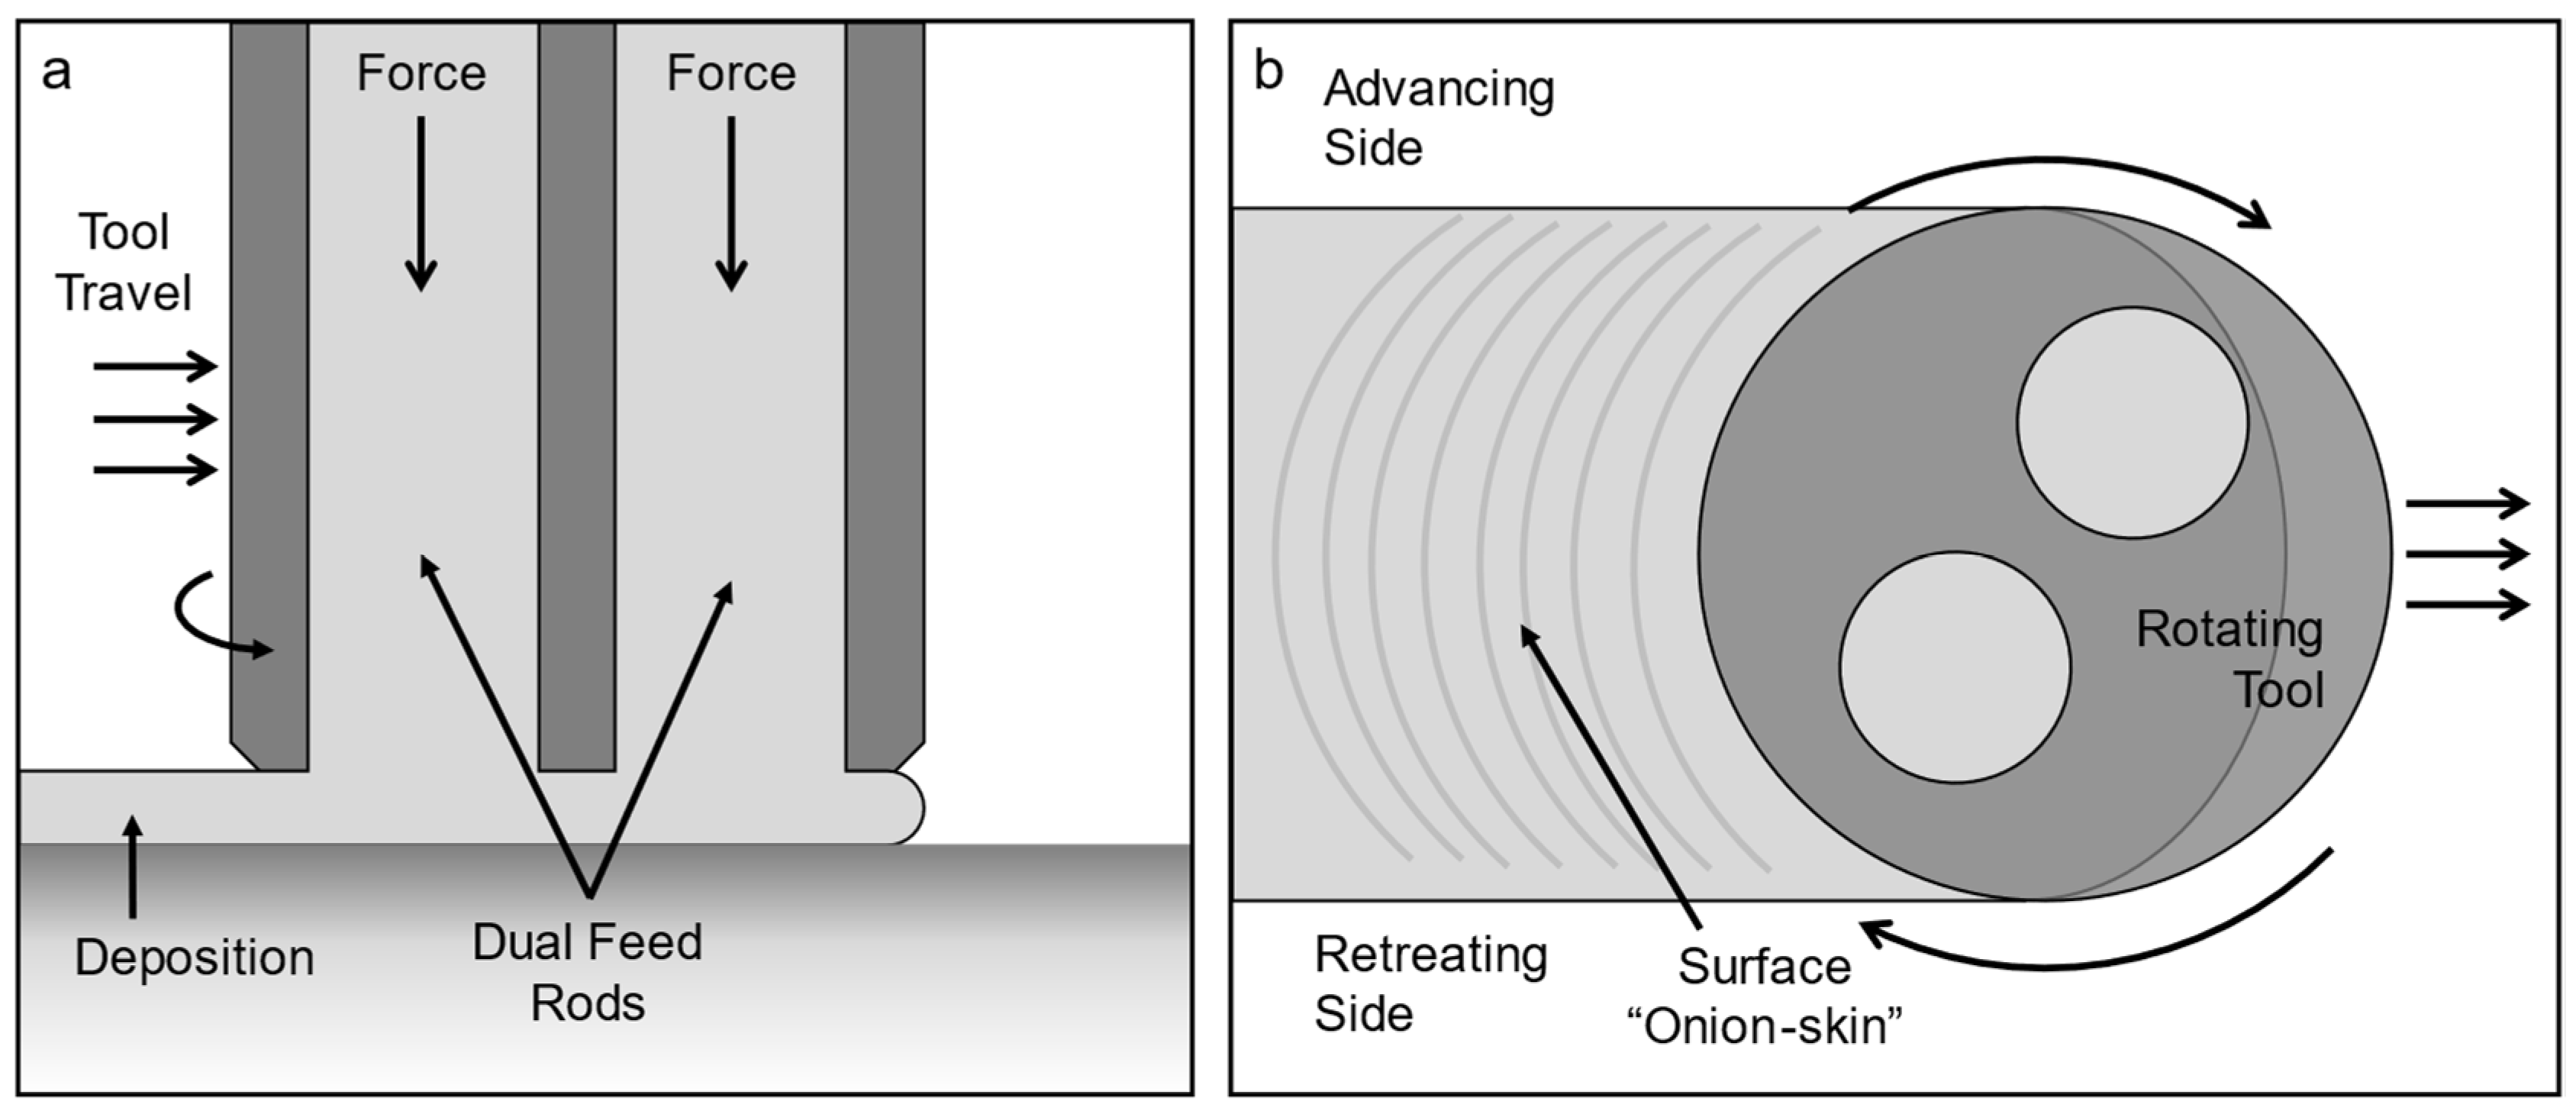
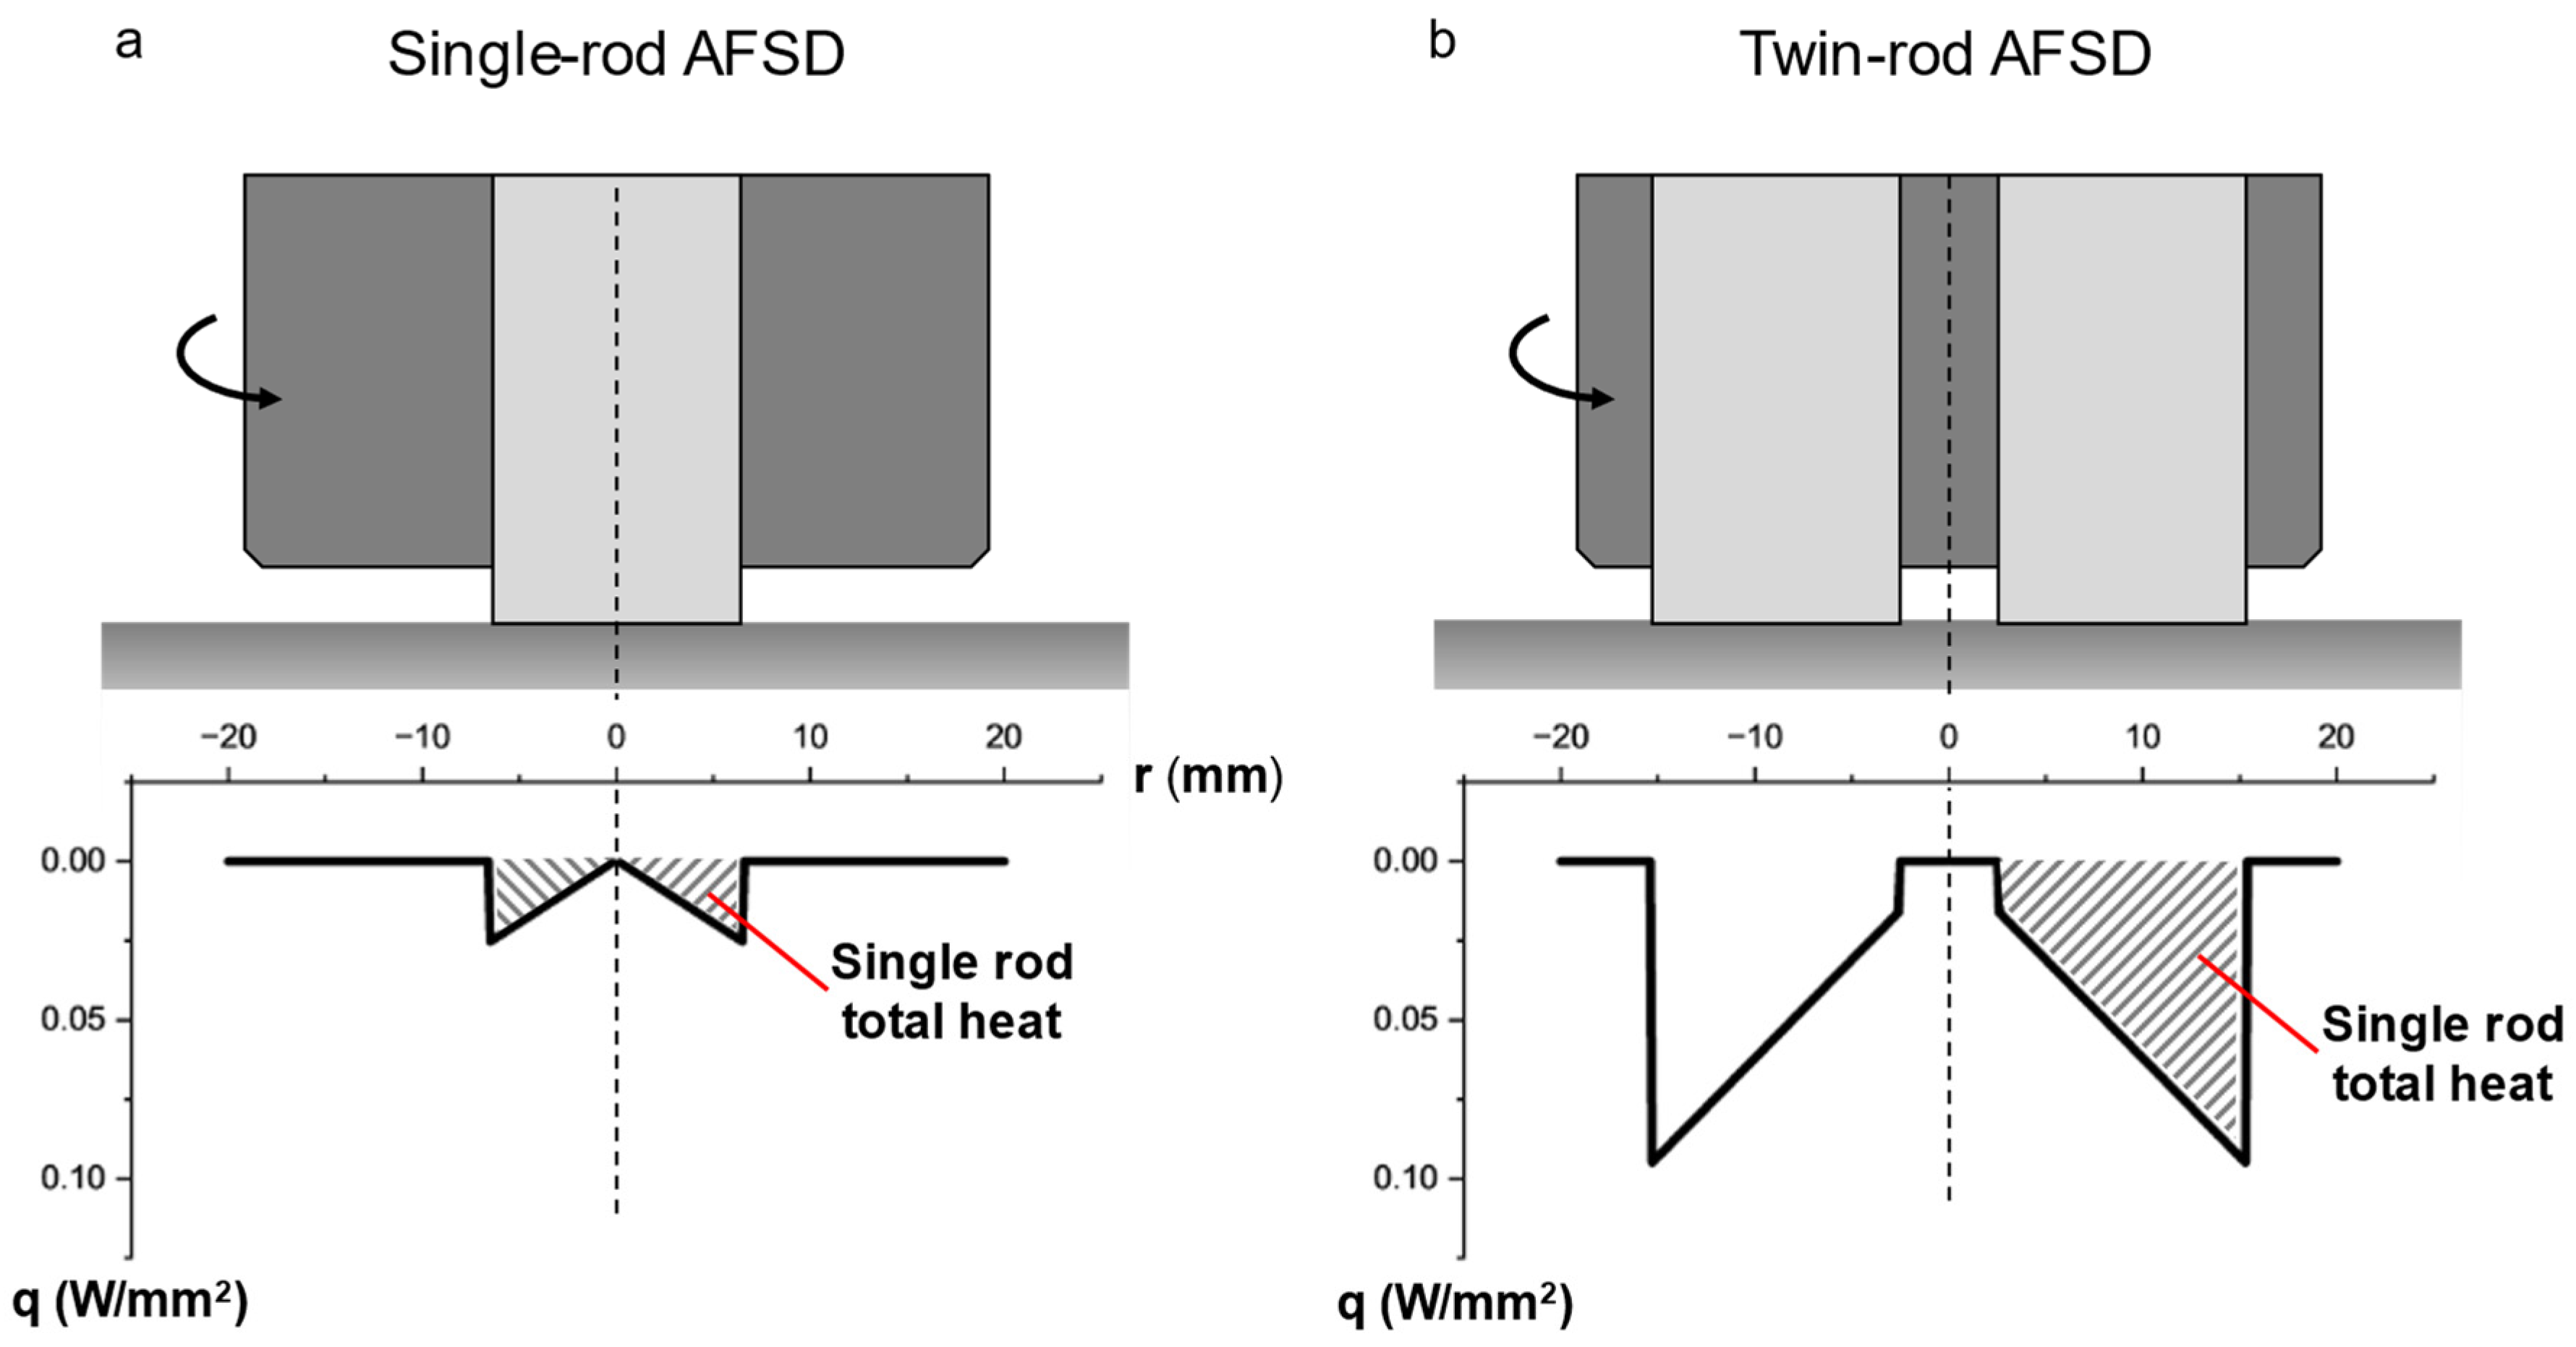
2.1. Twin-Rod Additive Friction Stir Deposition

AFSD was performed using a Bond Technologies (Elkhart, IN, USA) LS7 FSW machine capable of AFSD, utilizing a twin-rod feed material input design. A diagram of twin-rod-style AFSD is provided in Figure 1. The operation of the twin-rod configuration is nominally the same as that in single-rod AFSD. Instead of a center-bored channel, the twin-rod tool has two radial channels running through the tool, from which two separate feed rods are extruded. The axial load is maintained throughout the deposition by a linear actuator assembly, and the feed rods rotate with the tool, much like in single-rod approaches. Deposition was performed using 12.7 mm diameter, 305 mm long circular rods of Ta2.5W as the feed material and a 3.2 mm thick plate of Ta2.5W material as a substrate. The rod and plate materials were sourced from ADMAT Inc. (Norristown, PA, USA). The Ta2.5W substrate was mounted on a 9.5 mm plate of 304 stainless steel during processing. Machine process conditions, such as axial loads and motor torques, were recorded via integrated sensors on the LS7 machine. A tungsten–25 wt.% rhenium–4 wt.% hafnium-carbide tool was used for deposition and supplied by Bond Technologies. During deposition, argon gas was directed at the deposition zone using a shroud around the tool head.

2.2. Material Characterization

Following AFSD, the successful deposits were fully adhered to the build substrate. This deposited material was removed from the substrate and then sectioned for characterization, using electric discharge machining. Sample cross-sections were cut and polished following standard metallographic practices. Optical imaging was performed using a Keyence VHX-7000 microscope (Keyence, Osaka, Japan). Electron microscopy and electron backscatter diffraction (EBSD) were performed using an Apreo S (ThermoFisher Scientific, Waltham, MA, USA) equipped with an EDAX Velocity EBSD detector (EDAX, Pleasanton, CA, USA). Collected EBSD data was analyzed and plotted into graphics using OIM Analysis 7 software (EDAX, Pleasanton, CA, USA).
Six AFSD samples were evaluated with a Nikon Metrology MCT 225 X-ray computed tomography (XCT) instrument (Nikon Metrology, Brighton, MI, USA), with scan parameters given in Table 1. For each scan, a ring artifact reduction technique was applied using a slight shift of the sample between frames, perpendicular to the magnification axis. Reconstruction of the scan data was performed with Nikon Inspect-X software version XT 6.10 (Nikon Metrology, Brighton, MI, USA), and during reconstruction, a beam-hardening correction was used. Reconstructed data were exported as image sequences for viewing image slices in the ImageJ software package version Fiji-1.53c (National Institutes of Health, Bethesda, MD, USA) [52].
Uniaxial tensile tests were performed using a Kammrath and Weiss tensile 10 kN load frame module (Schwerte, Germany). Tensile samples were machined from the AFSD deposit using wire electrical discharge machining. The gauge regions were nominally 2 mm wide, 1.2 mm thick, and 20 mm long. Load and displacement were recorded with Kammrath and Weiss MDS software version 4.1 (Schwerte, Germany), while the surface strain of the sample was measured using the digital image correlation technique. A Teledyne FLIR Grasshopper3 camera (Wilsonville, OR, USA) was used to take images at a frequency of 1 Hz. Images were analyzed in Correlated Solutions VIC-2D software version 7.2.12, build 4401. Surface strain was calculated with a subset size of 37 pixels, a step size of 9 pixels, and a filter of 15 pixels for a virtual strain gauge size of 163 pixels or 2.38 mm. A 6 mm virtual extensometer was used to extract the engineering strain evolution in the sample along the loading direction.

3. Results

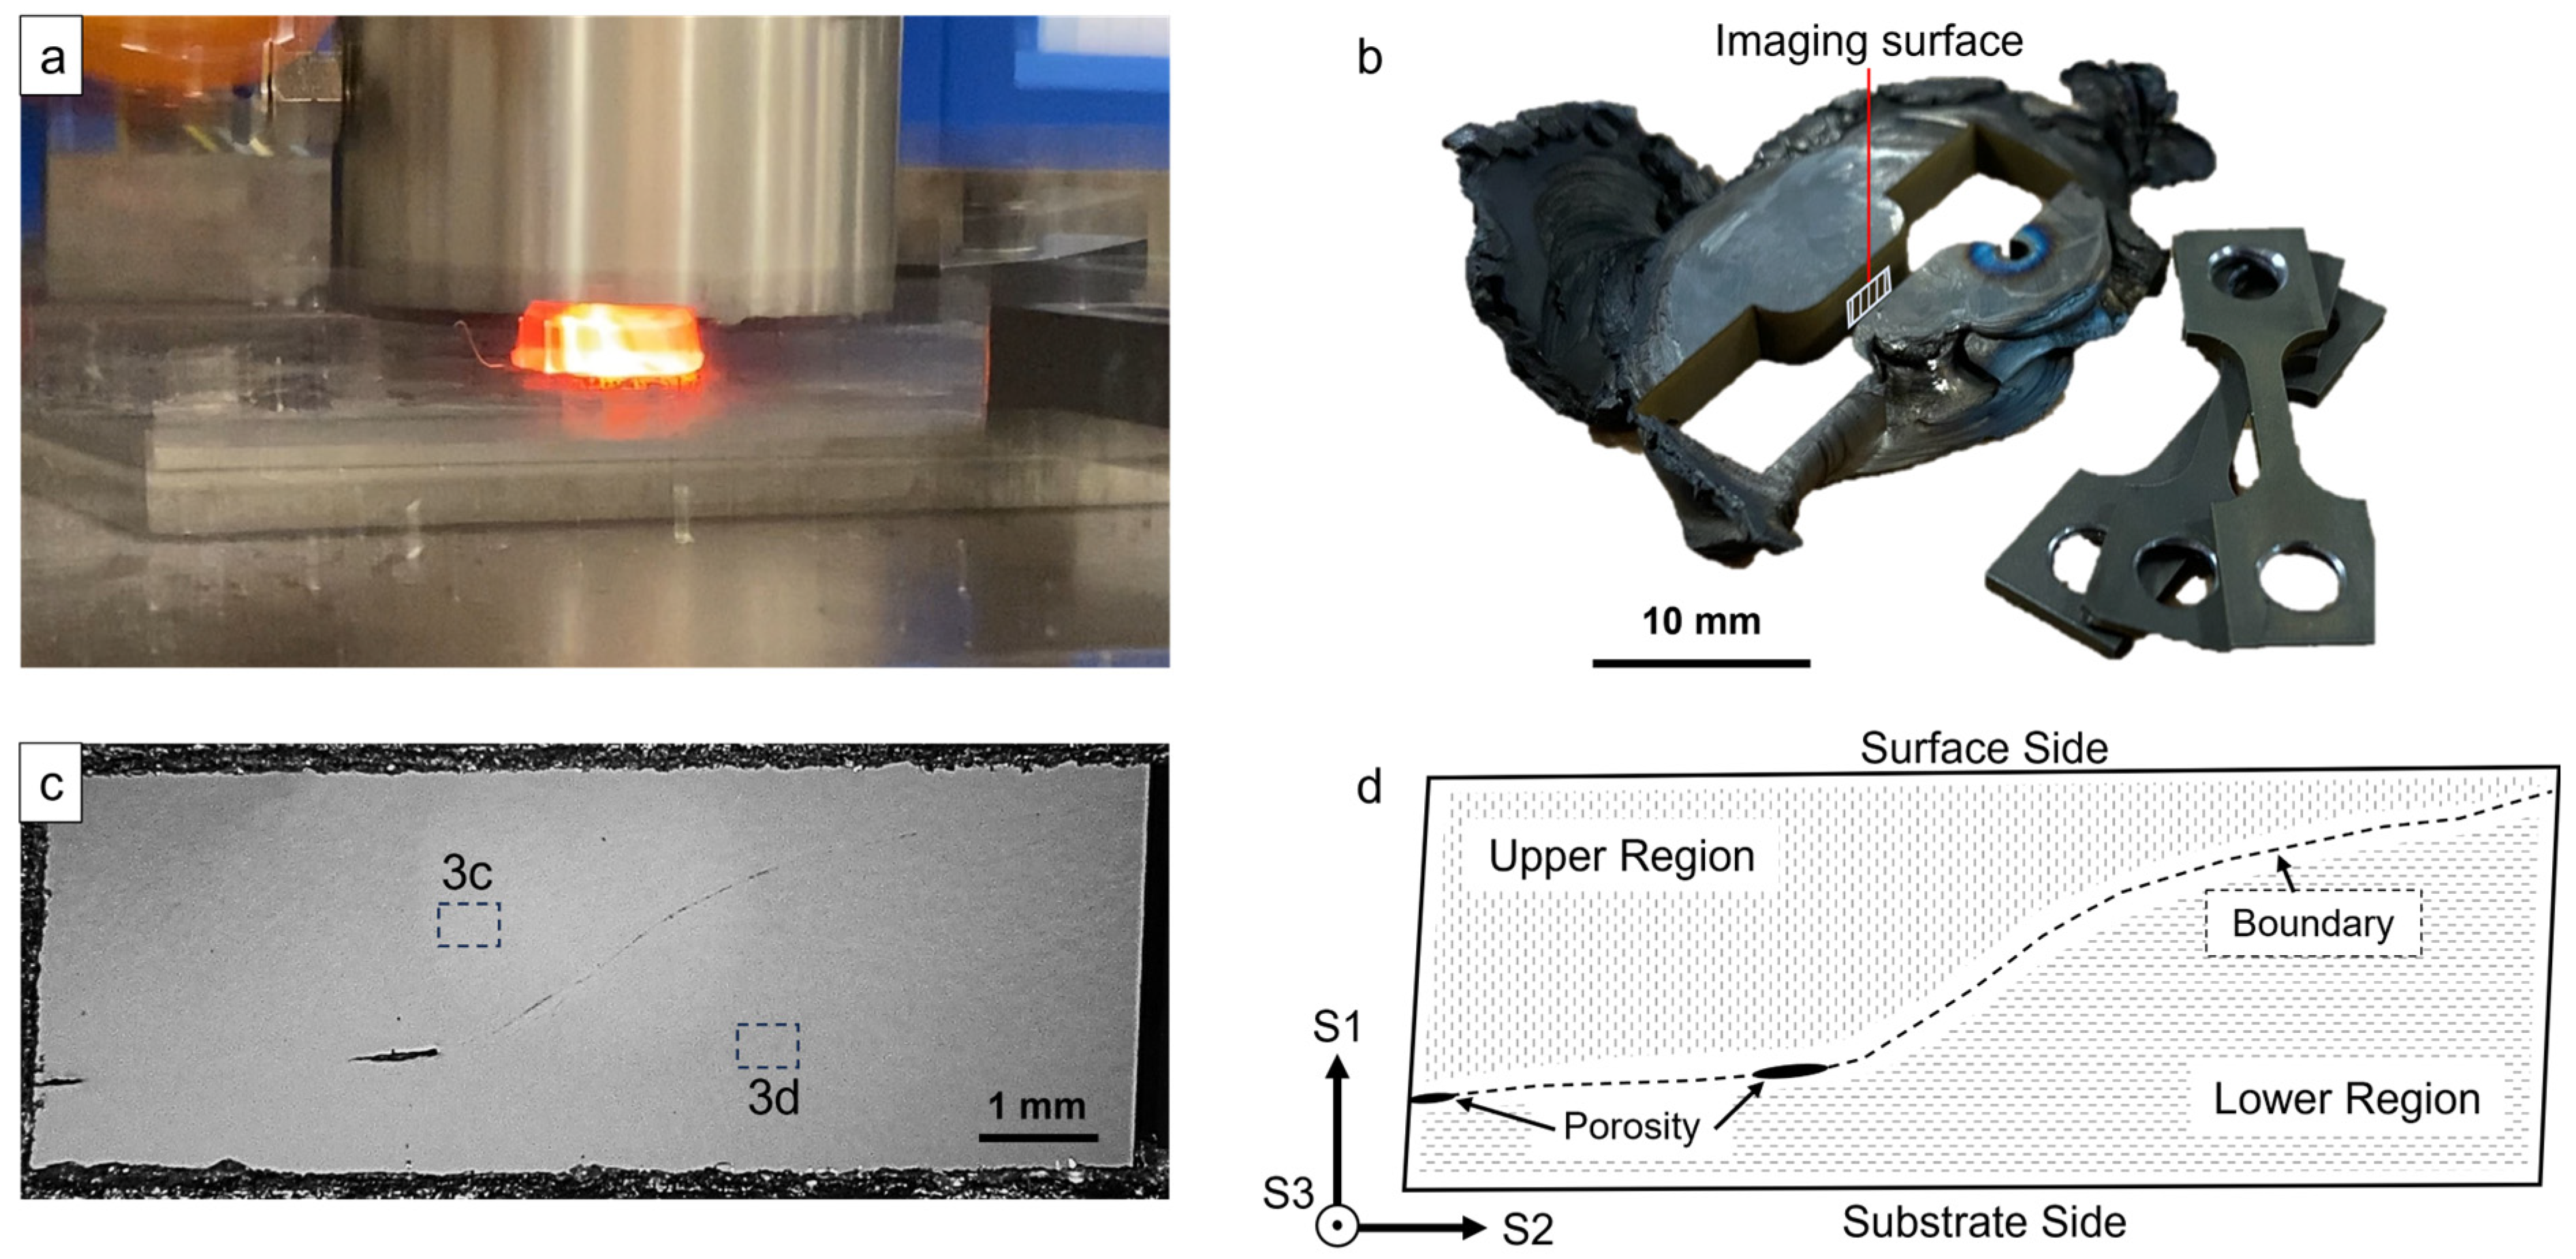
3.1. Deposition Behavior

Ten trials were run in an effort to produce a successful deposit of Ta2.5W. Table 2 provides a breakdown of the average process conditions used in each trial, the machine conditions during the trial, and the outcome of the trial. During these trials, the AFSD of the Ta2.5W using the twin-rod style was extremely vigorous. Figure 2a shows an image taken during the deposition of the Ta2.5W, where the incandescent tool and deposit can be seen in the center of the frame. The shaken appearance of the image was caused by the vibrations experienced by the machine and imaging camera. The intense noise and vibrations were far different than those in the depositions of more common materials, such as aluminum. Once the extruded feed rods made contact with the substrate, they were observed to heat rapidly, reaching incandescent temperatures within ~1–2 s. Typically, process temperatures could be estimated using thermocouples located within the AFSD tool; however, the limited machinability of the W-Re-4HfC tool made it incompatible with these machine systems and attempts to directly measure the process temperature. Following this rapid heating, the feed material plasticized and spread to fill the space between the tool and substrate. This heating and spreading occurred readily under all the trial parameters. Achieving actual deposition, wherein the plasticized feed material sheared away to form a track as the tool traveled laterally, was much less consistent. The plasticized mass of the feed material beneath the tool was most commonly observed to “skate” across the surface of the substrate instead of adhering and creating a proper deposit. Multiple times during or before this skating behavior, different failures occurred, halting the trial.
One type of failure observed was characterized by feed rod swaging or “jamming”, where the heat from the deposition conducted up the feed rods, softening them to the point where the applied load barreled or buckled the rod. Once the rod yielded, the axial load on the feed rods climbed; however, the transmission of this load to the substrate/deposit dropped. After this failure mode, the jammed feed material had to be removed using subtractive machining operations.
The second failure mode occurred because of overloading the motor driving the rotation of the AFSD tool. In trials 1 and 2, where more rapid deposition build up was attempted, this occurred rapidly. In other trials, the motor stalled after an extended period of the described “skating” behavior. In these cases, after a period of skating, ~5–150 mm of lateral travel, the plasticized mass would successfully adhere to the substrate, which corresponded with a huge spike in the rotary torque on the tooling, causing the motor to overload and halt rotation. After the rotation stopped, the recently deposited material rapidly cooled, ending the trial. Two of these cases of skating followed by deposition and overload resulted in solid deposited masses sufficient for characterization and analysis of AFSD interactions with refractory alloys. One such deposit is shown in Figure 1b, which also highlights the mechanical test bars that were sectioned from the piece, and the imaging surface used for microscopy.
The large spikes in the rotary torque, upon the initial deposition, typically measured ~300 Nm or higher before the motor overloaded; however, the average rotary torque during the trials was less than ~100 Nm. The applied load on the feed rods was typically less than 10 kN, with spikes up to ~30 kN. For comparison, in sustained depositions of 6061 aluminum alloy performed using the same setup, the average rotary torque was ~80 Nm, and the average axial loading on the feed rods was ~14 kN. Spikes in these values, 175 Nm and 22 kN, respectively, were also observed in the 6061 aluminum alloy deposits at the onset of the substrate adhesion. Under the similar conditions used in trials 8 and 10, deposition could be achieved; however, this deposition ended the trial by overloading the motor or jamming the tool.

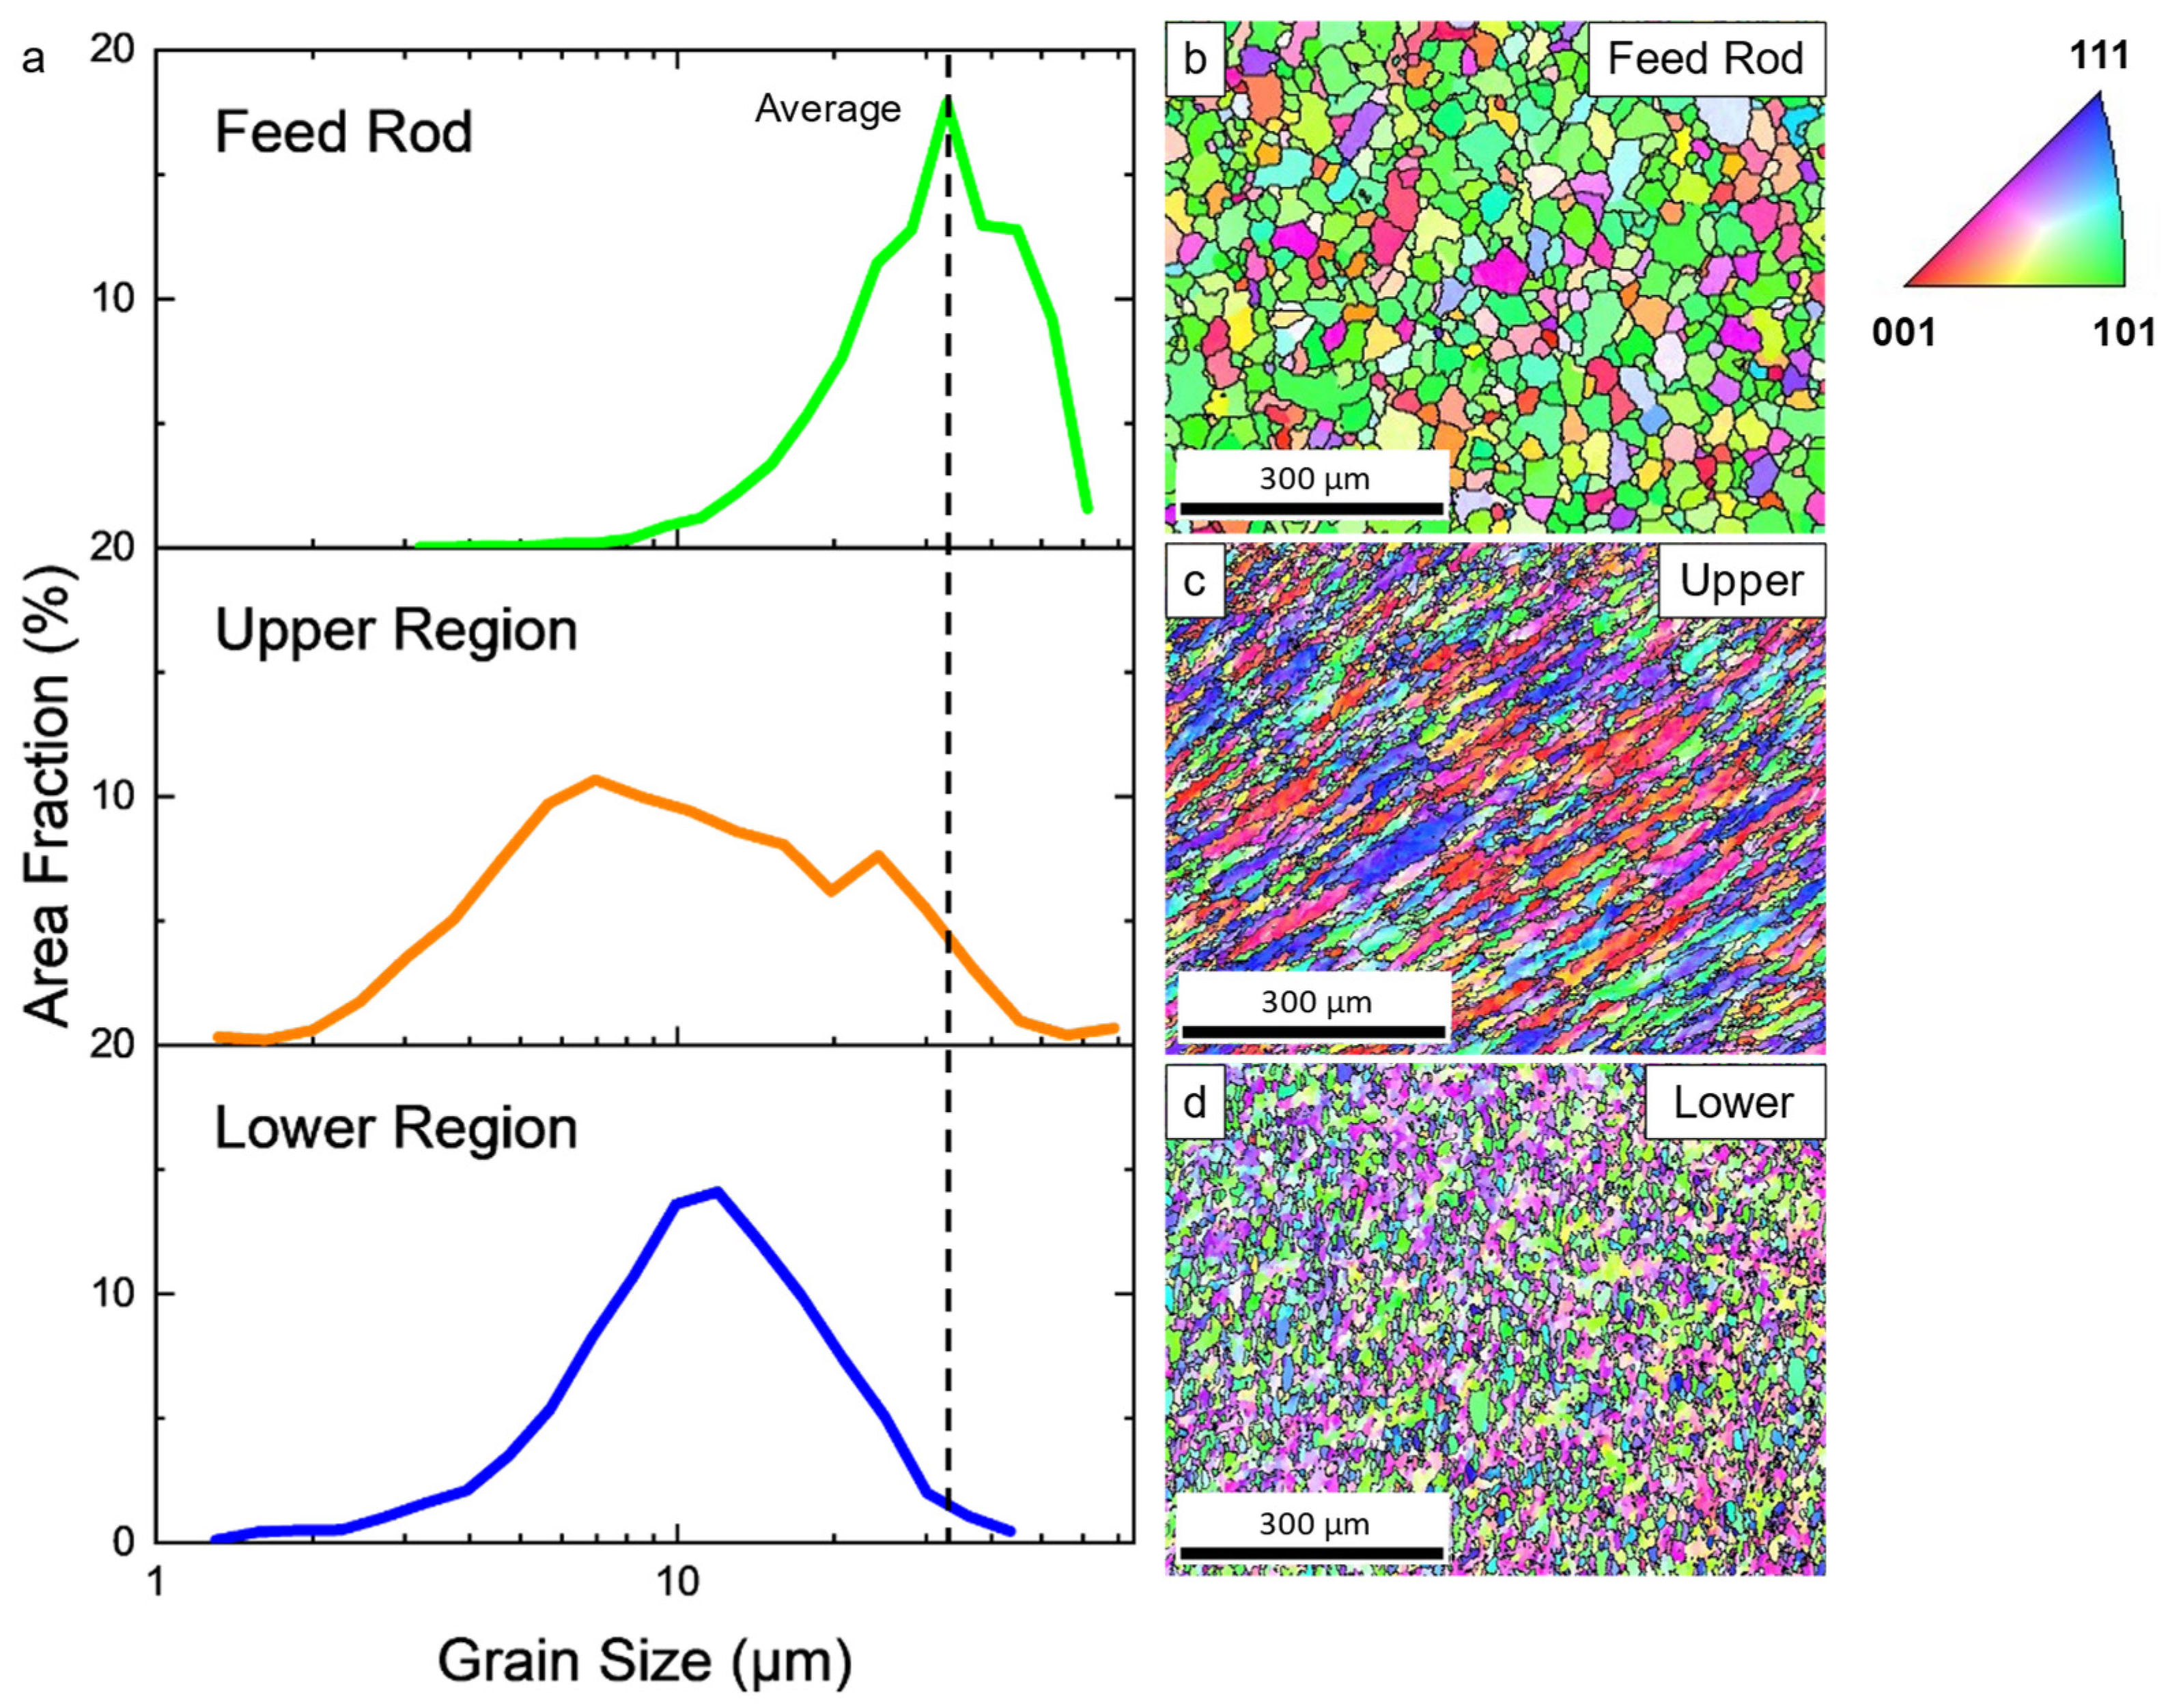
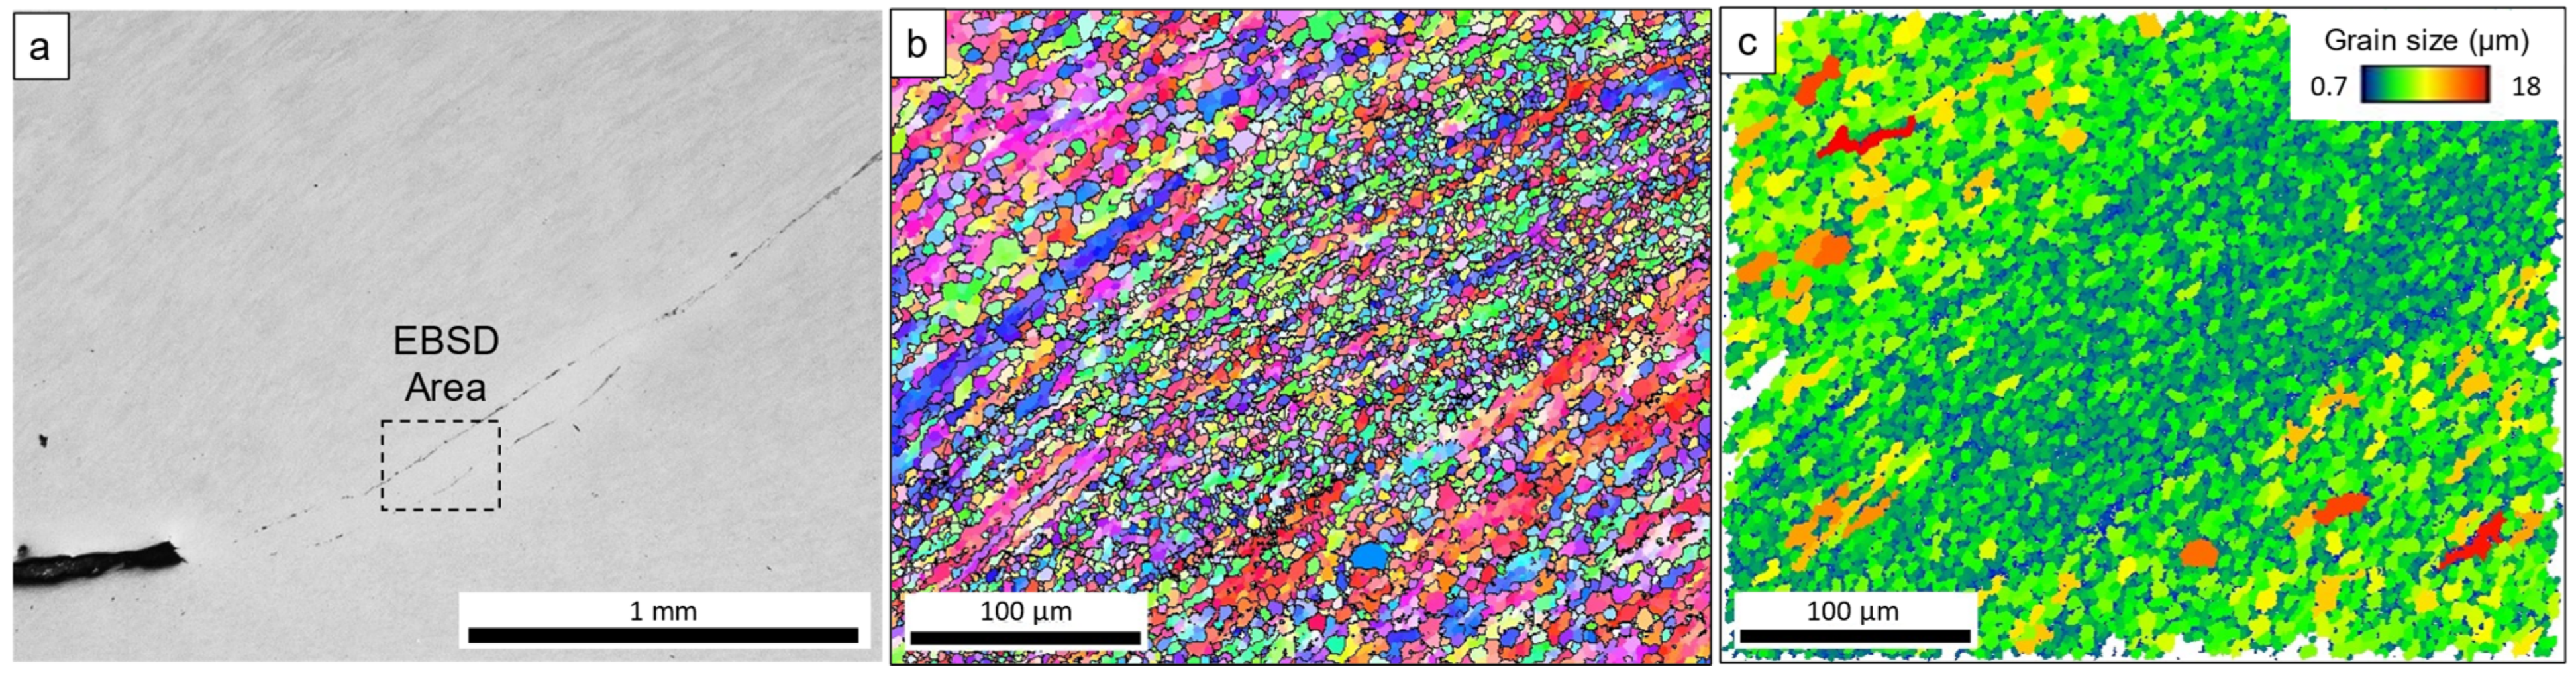
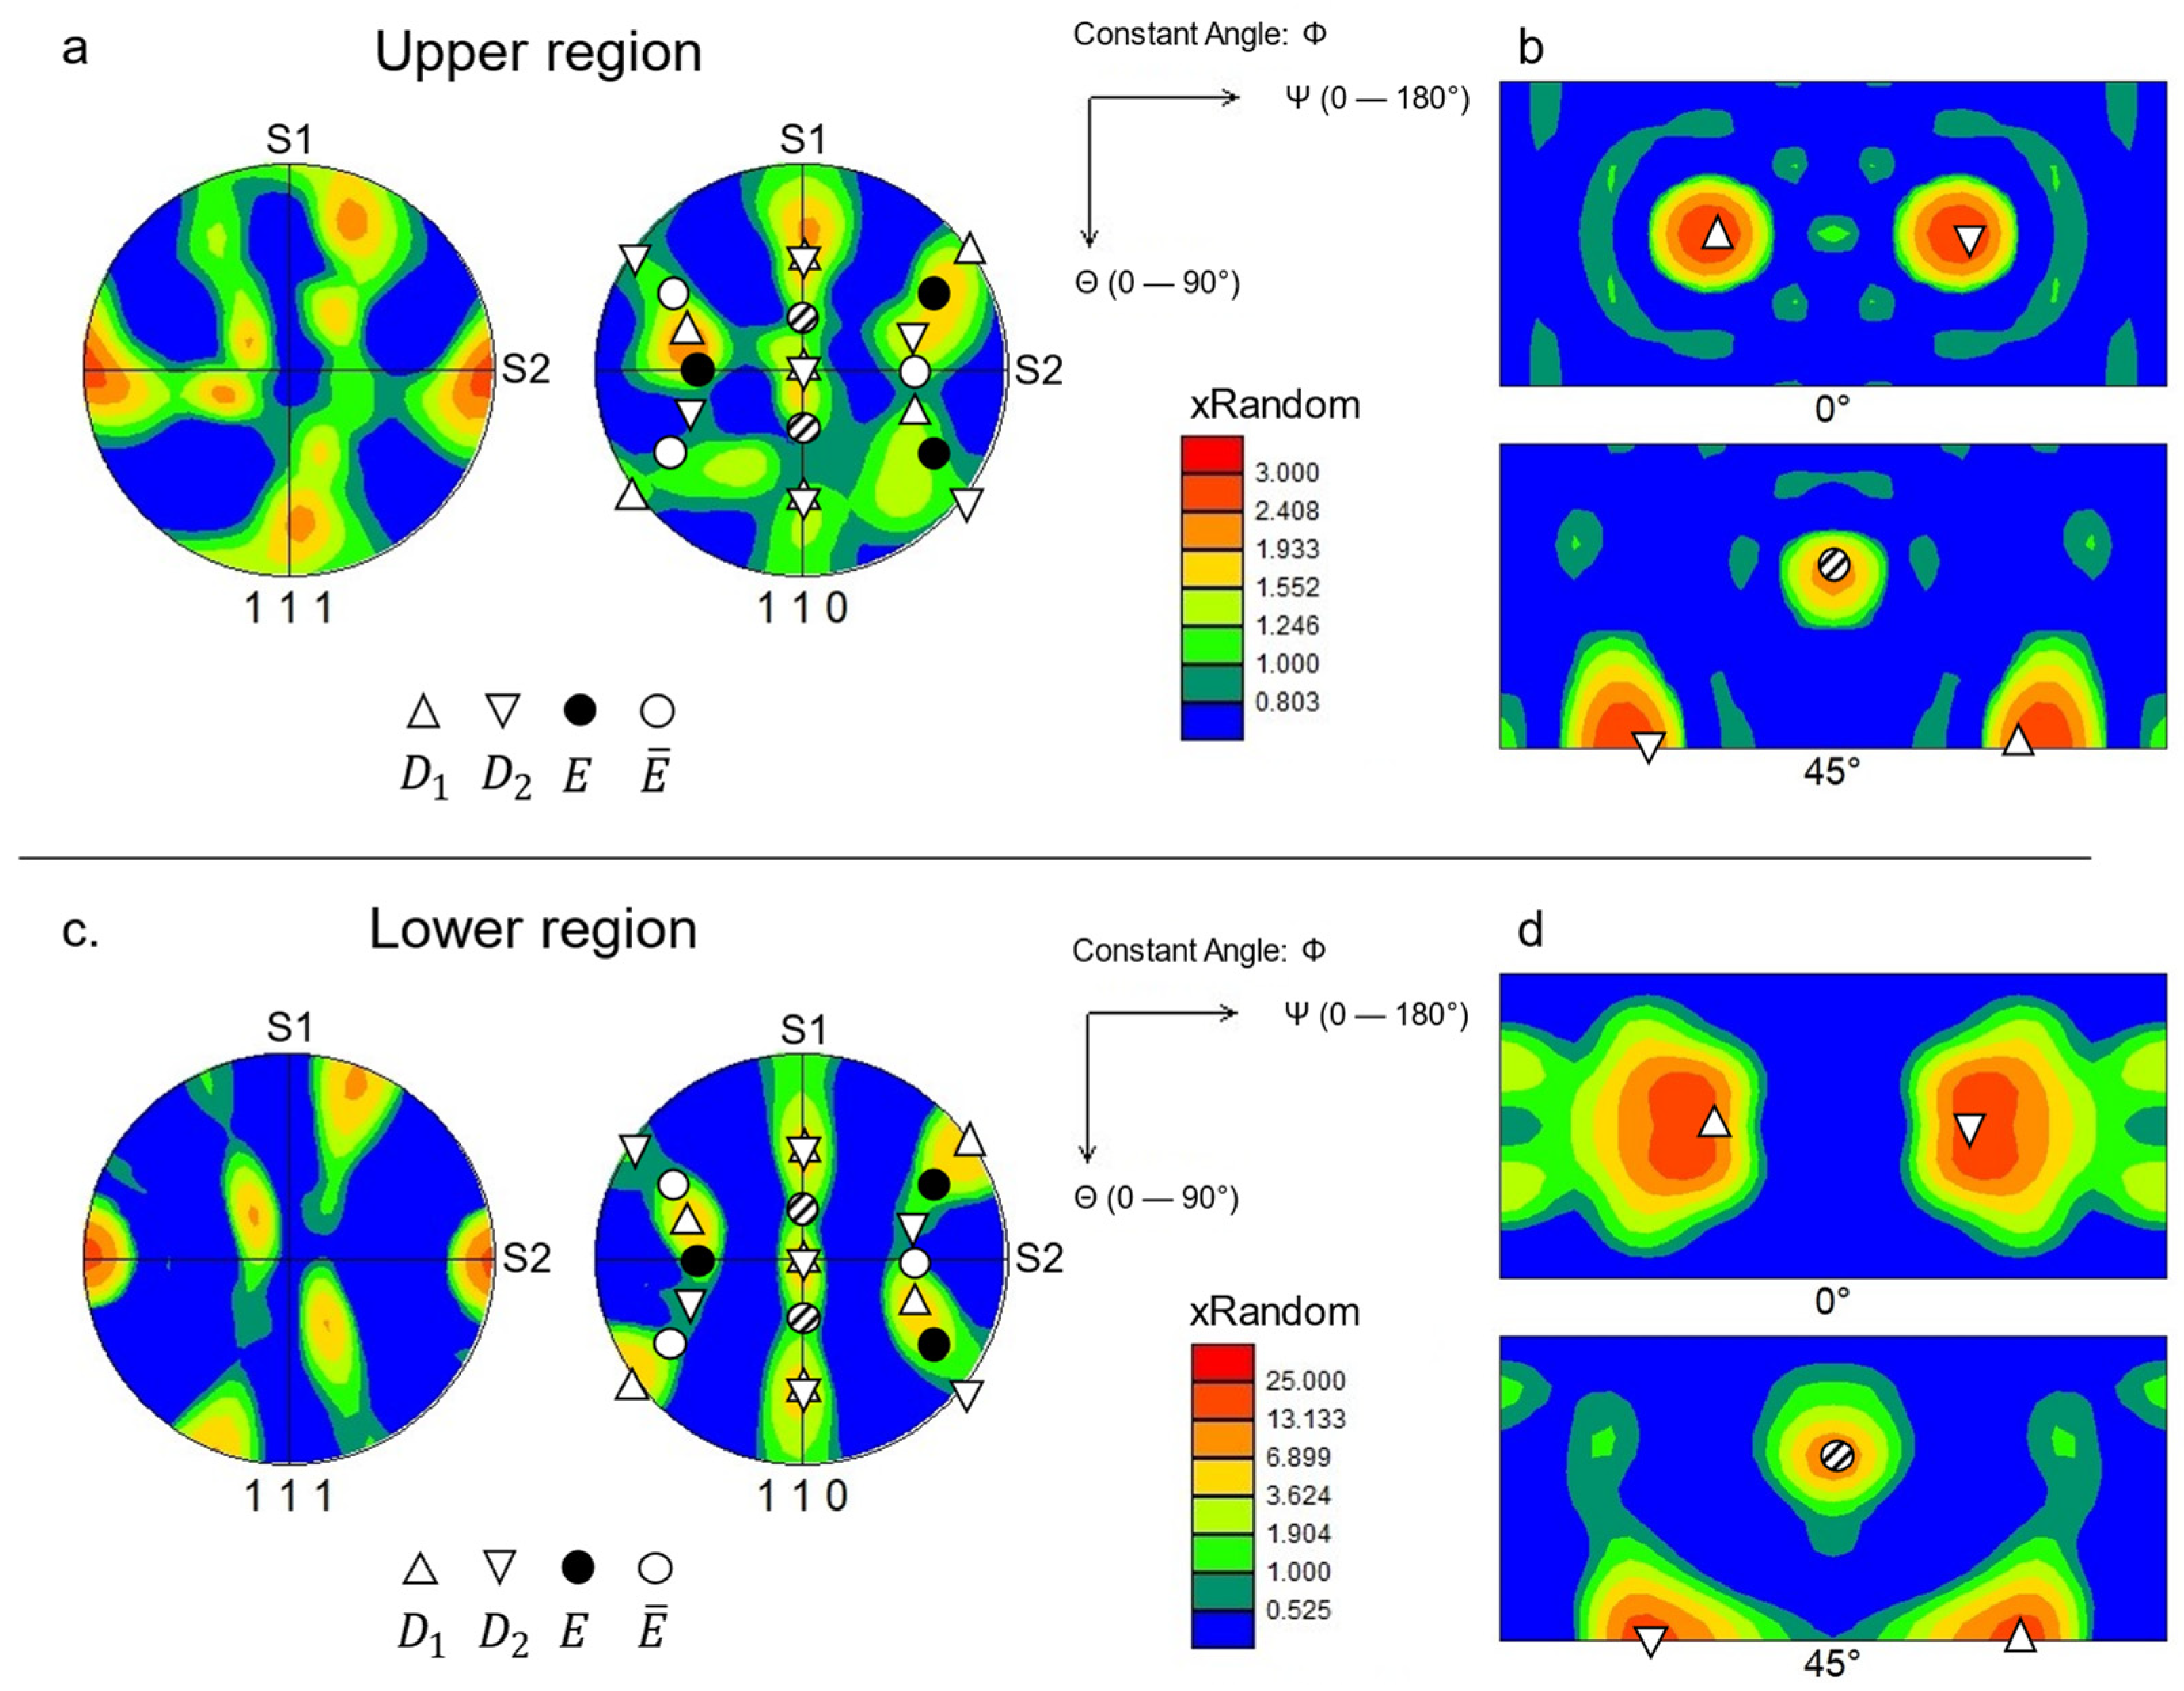
3.2. Microstructural Characterization

A section of material from the trial 8 AFSD deposit was prepared for microscopy, as shown in Figure 2b–d. The initial optical imaging of this cross-section, shown in Figure 2c, revealed physical features running roughly diagonally across the cross-section, which are redrawn for clarity in Figure 2d. The most prominent of these features is a pair of large, flat, elongated pores on the lower left side of the image. The other main feature is a boundary or “crease” running diagonally across the image. The presence of such distinct features is unusual for AFSD deposits and may be a sign of the lack of sustained deposition achieved during the trials. Near the center of Figure 2c, this boundary is very clearly defined but is less apparent at the edges of the cross-section. Figure 2d shows the apparent path of the boundary based on observed features, such as small aligned pores and the surface topography. Here, S1, S2, and S3 represent the sample directions necessary for crystallographic-orientation-based characterization. The deposit was sectioned based on where sufficient material was available to produce tensile test bars, so the cross-section did not align directly with any process directions (i.e., the working direction, transverse direction, and normal direction). The long axis (S2) of the tensile bars was approximately 45° off-parallel from the process working direction.
To assess the microstructure of the deposited Ta2.5W, EBSD scans were taken on both sides of this boundary, dubbed the “upper” and “lower” regions based on their proximities to the boundary. The only phase identified via EBSD was body-centered-cubic tantalum. Figure 3c,d show inverse pole figure (IPF) maps generated from the EBSD scans in these regions. Figure 3b shows an IPF map at the same scale taken on a sectioned and polished piece of the as-received Ta2.5W feed material for comparison. All the IPF maps shown in this article use the same crystallographic orientation reference for color grading. The microstructure in the upper region, Figure 3c, appears heavily deformed, with the presence of many long drawn-out grains intermixed with smaller equiaxed grains throughout. The microstructure in the lower region appears to have a much more consistent grain size, and it lacks the clearly deformed appearance of the upper region scan. In comparison, the feed material has a relatively equiaxed microstructure with large deformation-free grains, indicative of its annealed state. The variability of the microstructure displayed in the AFSD deposit is particularly interesting given the relatively close distance of the EBSD scans, ~2 mm apart, and the typical consistencies of microstructures produced within AFSD deposits. It is not immediately evident whether this heterogeneity is due to the twin-rod style approach, or the lack of sustained deposition during the trials. Nominally, the continued deformation and mixing that occurs during sustained deposition would be expected to homogenize the microstructure more than observed here.
Figure 3a plots the area-weighted grain size data for the feed material and upper and lower regions of the deposit, using scan data from the images presented in Figure 3b–d (i.e., lower-magnification scans). The average grain size of the feed material is highlighted across the distributions and is 32.3 µm. From this starting point, the distributions in Figure 3a show that AFSD has refined the grain size in both the upper and lower regions, with averages of 13.3 µm and 12.6 µm, respectively. The grain size in the lower region has a single mode with a normal distribution. In the upper region, the distribution is much broader and includes a shoulder at ~25 µm, which can be attributed to the larger elongated grains.
For a deeper understanding of microstructural development in the Ta2.5W, higher-resolution EBSD scans were taken in the upper and lower regions of the deposit. Figure 4a–c show data collected from the upper region, and Figure 4d–f show data collected from the lower region of the deposit. At higher resolution, the IPF maps shown in Figure 4a and 4d are similar to those from Figure 3, but more detailed features can be discerned. In the Figure 3 and 4 IPF maps, high-angle grain boundaries (HAGBs), with greater than 15° of misorientation, are outlined in black. In both the upper and lower regions, cellular structures can be seen on the interiors of many of the larger grains, indicative of low-angle grain boundaries (LAGBs) and subgrain formation. Figure 4b,e elaborate on this by displaying color-coded grain boundaries for the upper and lower regions, respectively. The LAGBs, defined here as 5–15° of misorientation, are outlined in blue, while the HAGBs are outlined in black. Finally, calculated geometrically necessary dislocations (GNDs) are mapped in Figure 4c,f for the upper and lower regions, respectively. Here, a second-nearest neighbor is used to reduce the noise and overestimation of the dislocation density. The upper and lower regions are found to have an average GND density of 0.94 × 10¹⁴ m−2 and 1.12 × 10¹⁴ m−2, respectively. Outside of the slightly different grain sizes, the higher-magnification scans appear very similar, indicative of similar microstructural evolutions in the upper and lower regions. Overall, the higher-resolution scans reveal significant substructures and a high fraction of LAGBs in the deposited Ta2.5W.
In addition to imaging the bulk regions of the deposited Ta2.5W, the boundary running through the cross-section was analyzed via EBSD. Figure 5a shows an optical micrograph of the boundary, with the EBSD scan area highlighted. The IPF map in Figure 5b once again shows a refined and equiaxed microstructure in this interfacial zone. Though similar to the structures seen in the bulk regions of the deposit, the grain size within the boundary layer of the crease appears smaller than those in the surrounding areas. This appearance is confirmed in Figure 5c, wherein the grains in the EBSD scan are colored based on their size. The varied appearance of this region is indicative of a different thermomechanical history.
The large-area EBSD scans from Figure 3 were assessed for the formation of any preferred orientation, which can provide insight into the thermomechanical history of the material, as well as the influence of recrystallization phenomena. As measured, the scan data were not aligned with any standard textural components and, as such, were rotated. Table 3 gives the minimum right-handed rotations about the sample axis, previously provided in Figure 2d, that aligned with conventional textural components, and all the plots in Figure 6 use this rotated data. The identified components also had a threefold symmetry about S2, as indicated in the table.
Figure 6 shows pole figures and orientation distribution functions (ODFs) for the upper and lower regions of the deposit’s cross-section. Both sets of figures have been annotated with the ideal orientations for the observed components [53,54,55,56,57]. In both regions, D1, D2, E, and   E ¯ body-centered-cubic simple shear components are identified. Although the shear components are the same between the two regions, the preferred orientation (xRandom) is an order of magnitude stronger in the lower region than in the upper region. To produce the plots in Figure 5, the raw scan data have been rotated to align with the conventional presentation of the simple shear components. The main difference seen here is an ~40° tilt about S2, indicating a difference in the primary shear plane’s orientation for the two regions. The occurrence of simple shear textures has been observed in materials processed using AFSD [22], although the majority of the prior literature has focused on FCC metals and the shear components specific to those materials. These specific components have also been observed in the simple torsion of tantalum [57].

3.3. Physical Characterization

Figure 7 shows the tensile results for the AFSD material coupons alongside those for a reference sample, which was prepared from ASTM-B708-annealed wrought plate material [47]. The two successful deposits, 1 and 2 from trials 8 and 10, respectively, were each sectioned into three test coupons: A, B, and C. All the AFSD test coupons except for 2C, had higher yield strengths (an average of 372 MPa ± 28 MPa) when compared to that of the reference material, 276 MPa. The AFSD material demonstrated decreased ductility and lower failure strain compared to those of the wrought sample. Coupons 1A and 1C displayed very little necking and, thus, low elongations at failure of 6.5% and 3.9%, respectively. Coupons 1B, 2A, and 2B all displayed ductile necking behavior and had an average elongation at failure of 19.5%, approximately 25% lower than that of the reference material. Sample 2C is an outlier, failing within the elastic region of the loading, hence, showing both decreased yield strength and elongation at failure. Two main outliers from this testing are coupons 1B and 2C. The former displayed an irregular dip in loading, visible more clearly in Figure 7b. After re-examining the loading data and DIC videos, this was confirmed not to be slippage of the sample in the grips, and possible mechanisms for this loading shift are discussed later in this article. Coupon 2C failed in the elastic region of the loading curve, giving it a lower apparent yield strength and a lower elongation at failure. The mechanism for this failure can be traced to internal defects in the sample.
In addition to mechanical testing, each test coupon was non-destructively evaluated prior to testing, using XCT. Figure 8 shows representative XCT stack slices for each of the AFSD material coupons. Coupon 1A was revealed to contain a large pore structure, as shown in Figure 8a. The mechanical test showed no necking in this sample, and the failure occurred in the same region as the porosity. Coupon 1B had no visible evidence of defects but, having come from the same deposit as the imaged cross-section from Figure 2, Figure 3 and Figure 4, is expected to have multiple regions of distinct microstructures. Coupons 1C and 2A, Figure 8c and Figure 8d, respectively, both show similar longitudinally aligned boundaries within the gauge region of the samples. Interestingly, coupon 1C shows very little ductility, while 2A had one of the highest elongations at failure of any AFSD sample. Coupon 2B reveals one of the most substantial boundary-type features observed across the samples. The rounded nature of this boundary and prominence within the gauge region are particularly curious, given the very high performance, both in strength and ductility, of coupon 2B. Lastly, coupon 2C is labelled as a crack rather than a boundary. Coupon 2C failed in the elastic region, and its failure was accompanied by a loud auditory “pop”. The fracture surface is very smooth and follows the trace of the crack seen in Figure 8f. Overall, the non-destructive evaluation highlights the effectiveness of XCT at revealing defects in the AFSD-fabricated Ta2.5W material. Although the defects were not always indicative of the final mechanical performance, they were often an indicator of where failure would occur.

4. Discussion

This work presents some of the first accounts of refractory metal AFSD as well as the use of twin-rod feed and tool designs. Sustained deposition proved to be challenging with the Ta2.5W material; however, the resulting deposits from the trial showed promising mechanical properties and provided valuable insight into the operation of AFSD under these unique conditions.

4.1. Feed Material Heating during Twin-Rod AFSD

One of the most evident features of the twin-rod AFSD was the ability to rapidly heat and soften the feed rods. Intuitively, the radial spacing of the twin feed rods provides higher rotation rates and a greater capacity for heat generation via frictional work. Using modified analytical equations for heat generation during AFSD [33,58] and friction surfacing [46], we can compare the relative heat generation between single- and twin-rod-style AFSDs. Equation (1) defines the simplified heat generation (q) for a single, center-aligned feed rod as follows:
q = 2 f F r A × μ
where f is the tool rotation rate, F is the normal force applied to the feed rod, r is the radial position from the center of the rotating tool, A is the surface contact area of the feed rod, and μ is the friction coefficient for the feed rod contact. When considering the heat generation in the twin-rod configuration, the feed rods do not rotate about their center and instead follow a fixed path around the center-point of the tool. Equation (2) gives the equation for frictional heat generation based on material translation rather than rotation as follows:
q = v t r F r A × μ
where vtr is the translational velocity. For a point along a feed rod in the twin-rod configuration, this velocity can be defined as follows:
v t r = 2 π r × f
Thus, yielding a combined Equation (4) for the heat generation in a twin-rod AFSD startup, which assumes the force is evenly distributed across each rod as follows:
q = π f F r A × μ
Figure 9 compares the relative heat generation between a 12.7 mm diameter single-rod style and the 12.7 mm diameter twin-rod style used in this work. For operation on the same material and fixturing, μ is assumed to be similar between the two AFSD styles. At equivalent processing inputs of the rotation rate and feed-rod axial force, the heat generated in the twin-rod style is calculated to be 333% higher than that in the single-rod mode. Breaking this down further, the heat per feed rod in the twin-rod style is 116% higher than the heat generated in the single-rod approach. This makes it clear that the twin-rod approach has a higher potential for heat generation. To give more specific examples, in this study, deposition was achieved using the twin-rod approach with a tool rotation rate of 500 rpm and an axial load of 7 kN. Achieving equivalent heat generation on startup using a single 12.7 mm diameter rod would require either double the tool rotation rate or feed-rod axial load (1080 rpm or 15.1 kN), while matching the total system heat would require the equivalent of tripling the twin-rod values (2165 rpm or 30.3 kN). The reduced axial force necessary for rod heating is of particular interest for the application of twin-rod AFSD.

4.2. High-Temperature Twin-Rod AFSD Behavior

Figure 10 highlights the behaviors observed during the AFSD trials of the Ta2.5W. Despite the rapid heating and subsequent plasticization of the feed rods, sustained deposition of Ta2.5W was challenging to achieve. Although feed rod jamming and rotary motor overload would immediately halt a trial, the primary challenge was overcoming the skating behavior. To reiterate, this skating occurred after the feed material had softened and begun to fill the space between the tool and substrate, as shown in Figure 10a,b. The skating was essentially a “near-deposition” behavior, where the plasticized mass would move across the surface of the substrate without properly adhering. The authors have observed this behavior in other materials, including during single-rod AFSD; however, it has often gone unpublished or without description, as the behavior could be avoided or overcome by adjusting process variables, such as the material’s feed rate or the tool’s rotational velocity.
Under these skating conditions, AFSD is functionally operating as a combination of angular extrusion and friction surfacing. Given the high-friction heating, the continued extrusion of the feed material out of the tool produces a buildup of plasticized material beneath the tool, which expands outward, as shown in Figure 10a,b, and effectively operates in an angular-extrusion-processing regime, where the substrate is a rigid surface. Under the skating conditions, the extruded mass of the material beneath the tool effectively acts as a singular friction-surfacing feed rod [41,42,46], resulting in only a small amount of material being deposited as the tool travels across the substrate. These conditions and the friction-surfacing deposit can be seen in Figure 10c,d. As shown in the successful deposit in Figure 10d, these skating conditions could eventually be overcome, but the exact mechanisms that shifted the process from skating to deposition were not obvious. The consistent aspect of the extrusion behavior and friction-surfacing behavior is a lack of adhesion to the substrate, which itself is a sign of negligible co-deformation between the feed material and substrate. From the observed temperatures, incandescence in the feed material but not the substrate, this can be attributed to a lack of sufficient substrate heating. Despite the increased heating from twin-rod AFSD, the extremely high temperatures needed to plasticize the Ta2.5W were not consistently reached in the substrate. This is likely because of the enhanced conduction of heat away from the substrate into the surrounding metal of the machine. The two successful depositions, which bypassed this, were not under identical process conditions. The first, shown in Figure 10d, occurred after a long period of skating, and it is possible that the gradual buildup of the heat was sufficient to cause co-deformation with the substrate. The second successful deposit occurred much more quickly, happening in a trial where a high material feed rate and a higher traverse speed were used. In both cases, the immediate repeatability was low, and similarly operated trials were often impeded by motor overloads or tool jamming. These observations indicate that additional measures, beyond process input optimization, are necessary to improve the consistency and sustained AFSD of the Ta2.5W. Given that the substrate heating was a significant challenge, pre-heated or thermally insulated substrates are strong candidates for future studies [24,25].
Another feature noted about the twin-rod deposition was the bisected nature of the cross-section prepared for microscopy. Some heterogeneity could be expected given the brief, unsustained nature of the deposition that occurred; however, the microstructure was shown to vary across short distances on either side of the seam. We propose that these two regions are, in fact, the two feed rods, which have been plasticized separately during startup and then combined during the deposition process. Figure 11 provides a diagram for this proposed process. First, the feed rods soften because of frictional heating, mostly expanding toward their trailing edges because of frictional forces. This behavior is corroborated by Figure 10b, which shows the form of the Ta feed rods in a run that was halted immediately after the feed material heated and began to plasticize. Eventually, the heat generated by these rods and force applied are sufficient to cause co-deformation with the substrate, though this step is non-trivial given the skating behavior observed. Critically, this adhesion does not necessarily occur simultaneously with the two feed rods and, from the observed behavior, likely does not. When this co-deformation occurs, a large portion of the plasticized feed material from that rod is sheared away. In single-rod deposition, there is always new material nearby to continue the deposition process; however, in the twin-rod approach, once the first section of the deposition has begun, there can be a lapse before new material enters the interaction zone again, at which point it will impact the previously deposited material. In sustained depositions, new material continues to be added to this initial deposit while also maintaining a high temperature and continuing to deform the previously deposited material. Instead, with Ta2.5W, it was typically observed that after the jolts and possible halt of the motor, the deposit would rapidly cool because of increased conduction into the substrate and insufficient follow-up deformation. Both the initial co-deformation and shear-off of the material, as well as the subsequent impact of the second feed rod, are likely key contributors to the rotary torque spikes observed.

4.3. Microstructural Evolution during AFSD of Ta2.5W

The thermomechanical work during AFSD typically results in a wrought-like microstructure produced via dynamic recrystallization (DRX) [17,18,59,60]. The EBSD analysis shows refined grain structures characteristic of DRX. More specifically, the large fraction of LAGBs present in both the upper and lower regions of the sectioned piece are indicative of continuous dynamic recrystallization (CDRX) [22,49,59,60,61]. Further evidence of CDRX is found in the developed subgrains of the AFSD material. In the upper region, large elongated grains are surrounded by finer equiaxed grains and populated with subgrains and low-angle boundaries interior to the large grains. These formations are indicative of geometric dynamic recrystallization (GDRX), which is a specific subset of CDRX phenomena. The lower region of the cross-section shows a similar structure but lacks the presence of particularly elongated grains. In this region, the larger grains still show highly developed subgrains, and the boundaries of many of the larger grains appear heavily serrated. These structures are still associated with CDRX but are more indicative of progressive lattice rotation phenomena than of GDRX [22,59]. This observation of CDRX in the high-temperature deformation of Ta2.5W is consistent with other high-temperature, high-strain-rate literature on tantalum and tantalum refractory alloys [49,50,60,61].
The different microstructures, recrystallization mechanisms, textures, and orientations in the two regions of the material are presumably because of different thermomechanical conditions experienced by each feed rod during deposition. The position of the lower region suggests that this is the first rod to co-deform with the substrate and adhere. This event was marked by a large spike in the rotary torque on the machine and would impart significant stress to the feed rod, as the plasticized material is attached to both the substrate and the rotating tool. This intense stress resulted in stronger shear-textural components in the lower region as well as the smaller average grain size. Additionally, once the feed rod adheres to the substrate, conduction could rapidly reduce the rod temperature, imparting higher flow stresses with the ensuing deformation. By contrast, the second feed rod would remain primarily attached to the tool. Once the second rod impacts the first adhered one, it would deform to comply with any space or newly created space between the tool, substrate, and first-adhered rod. This compliant “ride-up” of the second plasticized rod could account for the different orientations of the shear textures observed. As evidenced by the incomplete boundary and porosity between the material regions, the two rods are not fully bonded during this deformation, and, thus, the second-rod deformation would likely occur at higher temperatures and a lower-stress state than the first-rod deformation. At the time of the preparation, there is no supporting literature on twin-rod AFSD, so it is unclear how impactful this sequential deformation of feed rods is on the microstructure of deposits produced using sustained deposition. Even in the case of the continued deformation, where the interfacial zone would coalesce into a complete bond, eliminating common porosity or crack defects, the microstructural variations may be retained and influence the consistency of the mechanical properties in larger deposits.

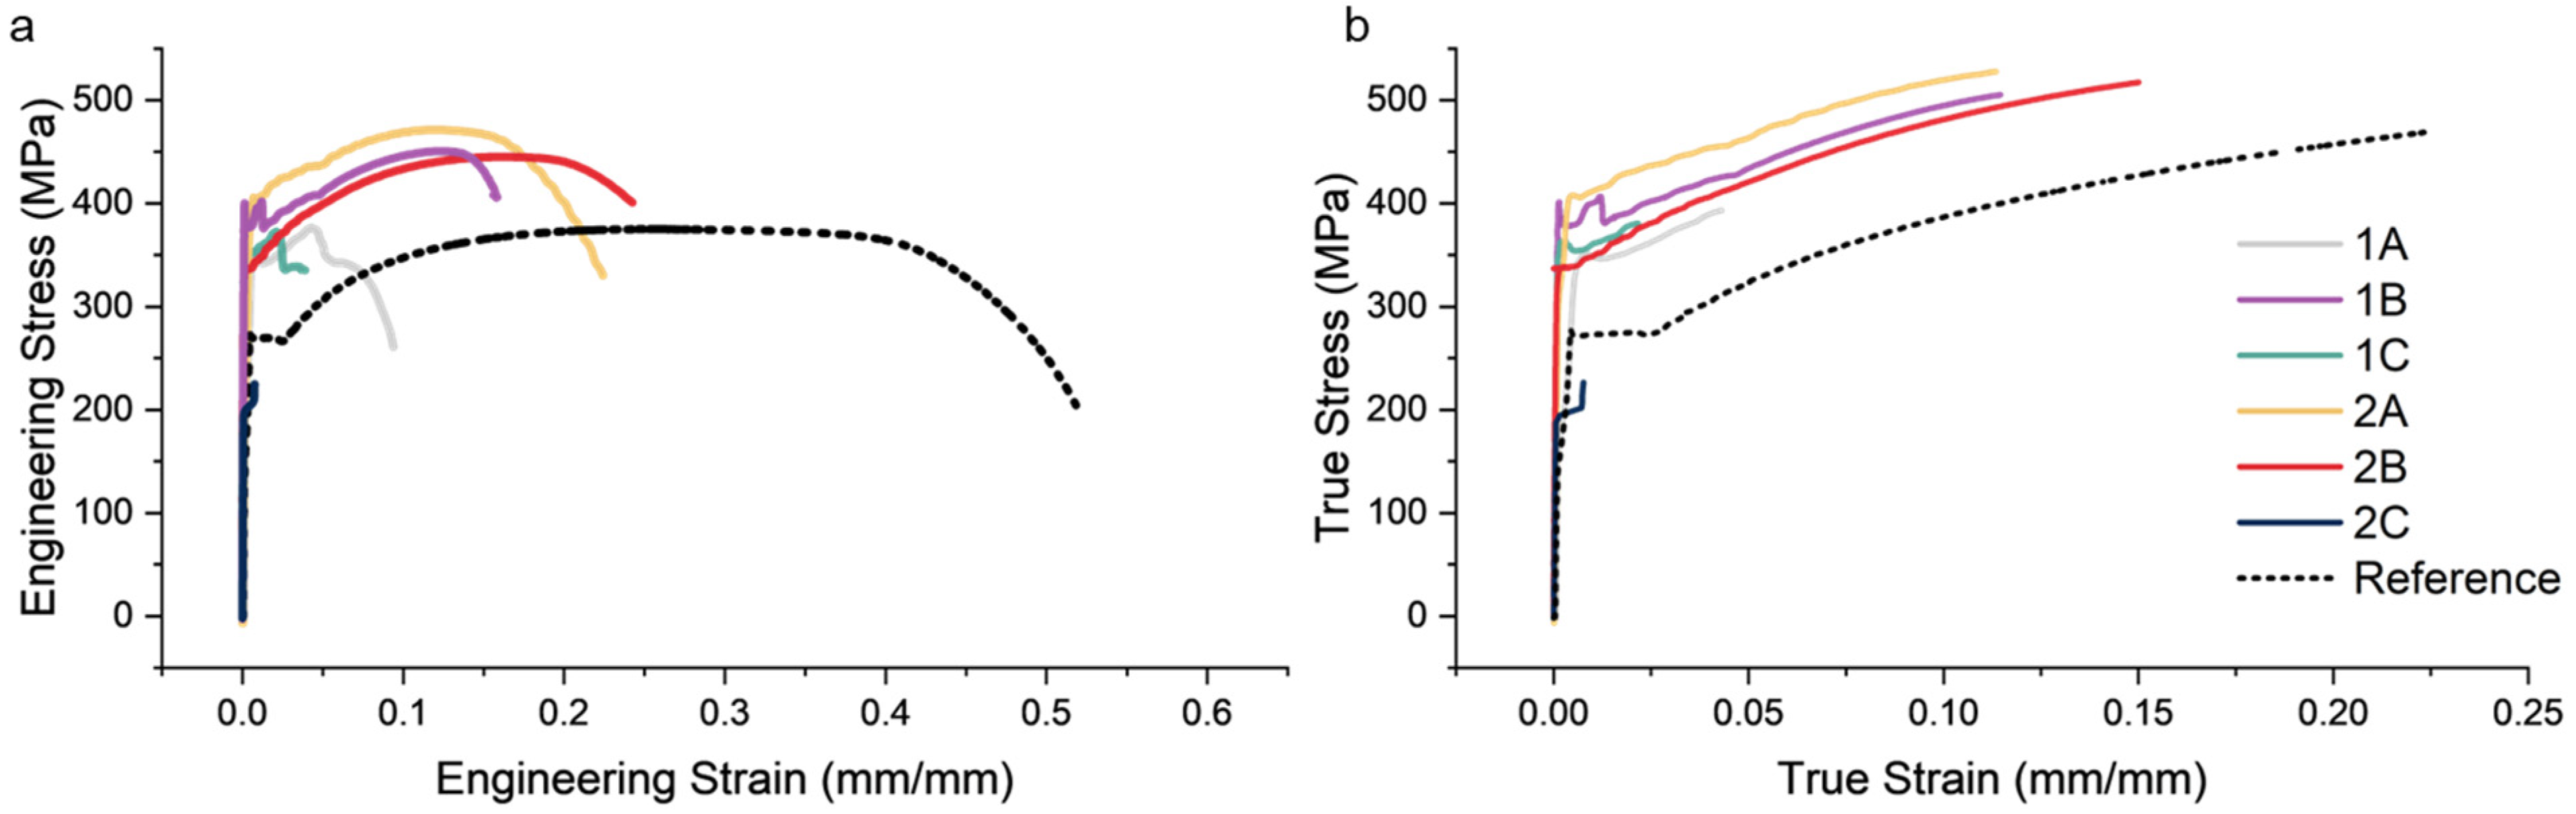
4.4. Mechanical Behavior of AFSD Ta2.5W

The majority of the AFSD samples tested displayed increased yield strengths and decreased elongations at failure as compared to those of the wrought material. Even in the samples that had particularly low elongations at failure, the yield strength of the material was at or above that of the wrought reference material, the exception being coupon 2C, which failed in the elastic region of the loading. The strengthening of the AFSD samples can be attributed to multiple microstructural features as summarized in Equation (5):
σ y = σ o + σ T + σ H P
where σ o is the lattice friction stress, σ T is the contribution of the dislocation forests, and σ H P is the contribution of the grain boundaries to the material’s yield strength. Using a lattice friction stress of 194 MPa takes into account the solid solution strengthening provided by the alloyed tungsten [62]. The dislocation contribution can be defined by the Taylor relation as follows:
σ T = M b α G   ρ a v
where M is the Taylor factor (with M = 2.9), b is the magnitude of the Burgers vector (0.289), α is a constant with a value of 0.18, and G is the shear modulus (taken to be 68.9 GPa) [62,63]. The average dislocation density of the material ( ρ a v ) is measured from the GND plots. The strengthening provided by grain boundaries is given by the Hall–Petch equation as follows [64]:
σ H P = k d
where k is the Hall–Petch coefficient, taken to be 230 MPa [65], and d is the grain size measured via EBSD. Table 4 summarizes the calculated values for these strengthening components in the upper and lower regions of the deposit alongside the measured strength for the AFSD coupons, excluding the values for coupon 2C. The calculated strengths for the upper and lower regions are similar and show good agreement with the observed average strengths in the tensile tests. This suggests the dislocation and grain boundary strengthening are correctly attributed as the primary strengthening mechanisms. A key consideration in these calculations is the tendency of EBSD measurements to overestimate the dislocation density [66]. Herein, we used a second-nearest neighbor to reduce noise and provide a more conservative estimate of the GND density. The strengthening observed can thus be attributed to the wrought microstructures of the AFSD deposits, and the variability in the elongation is primarily because of defects observed via XCT.
Some of the tensile tests also showed irregular behaviors at early strains, just after the initial yield point. This was the most evident in the coupons sectioned from deposit 1. In the case of 1A, the irregularity can be attributed to the porosity seen via XCT. In the case of sample 1B, the nature of the abrupt dip in the stress is much less clear. The XCT does not show any defects, and the DIC does not show a shift in the strain localization or grip slippage. A similar phenomenon in Ta was reported in work by Chen et al. [67] and hypothesized to be a result of dislocation unpinning, which results in transient loading conditions. Other work by Wright et al., on rolled sections of Ta, highlighted how regional textural variations in cross-sections of tantalum caused a similar double-yield drop because of shifts in the primary strain accommodation based on effective regional Schmid factors [68]. This explanation fits sample 1B because of the distinct microstructural regions observed in deposit 1 and, more specifically, the different orientations of the textures between the two regions. It is possible the double-yield behavior was not observed in the other coupons because of prevailing mechanical effects from the defects observed in XCT. Regardless of the specific phenomena, the samples tested in this study, excluding 2C, all show reasonably good mechanical performances. Comparing them to the ASTM B708 reference material, all still match or exceed the yield-strength requirements, and despite the reduced elongations at failure, two samples still meet the 20% elongation-at-failure requirement [47]. These findings are promising for structural applications of Ta2.5W, and we anticipate the enhanced thermomechanical working during sustained deposition will remedy many of the defects seen in this initial trial.

4.5. Opportunities and Challenges in Refractory Twin-Rod AFSD

Three major challenges were identified through this work: (1) the challenge in adhering the feed material to the substrate, (2) the difficulty in maintaining the deposition once adhesion occurred, and (3) the jamming of the feed material within the tool channels. The first two challenges are coupled and mostly stem from an inability to co-deform the feed material and substrate. One candidate strategy for future studies to mitigate this issue is the use of thermally controlled substrates [24,25]. With a heated substrate, the mechanical mismatch between the feed material and substrate can be reduced, and the conductive “freeze-off” that occurs upon adhesion can be mitigated. A downside of this substrate heating is that increasing the overall process temperature may make feed rod jamming even more of an issue. Rather than increasing the heat, some form of tool-cooling system aimed at reducing the temperature of the feed material still inside the tool channel could improve the material stiffness and decrease the propensity for buckling and jamming. This highlights one of the major opportunities for the twin-rod AFSD in this study. The substantially higher heat generation, identified in the twin-rod assembly, substantially reduces the required forces for feed rod heat generation. The lower force requirements for equivalent heating are desirable to reduce tool jamming or the need for feed material lubrication, although the heat generation would be higher if this could be counteracted with more targeted tool or feed material cooling. These characteristics make twin-rod AFSD an interesting topic for future investigation.

5. Conclusions

A tantalum–tungsten refractory alloy, Ta2.5W, was successfully deposited using AFSD. In addition to ultrahigh-temperature AFSD, this work provides some of the first insights into the behavior of twin-rod-style AFSD. On average, the mechanical testing of the deposited material revealed increases in strength and decreases in elongation at failure. This strengthening is attributed to the refined grain structure produced by AFSD and is found to form via continuous dynamic recrystallization in Ta2.5W. Outside of tool jamming and hardware overloading, the main impedance to the sustained deposition of the Ta2.5W was found to be a skating behavior, wherein the plasticized mass of the feed material moves across the substrate without properly adhering. This skating behavior, described herein for the first time in detail, was not able to be consistently overcome by adjusting the AFSD process variables. These findings highlight the need to adjust AFSD setups, specifically for ultrahigh-temperature materials, as well as showing the physical integrity of the deposited Ta2.5W. The findings from this work are summarized as follows:
  • Twin-rod AFSD was found to be very capable for heating and spreading the feed material; however, a skating behavior dominated the trials because of poor adhesion with the substrate. The skating behavior could not be reliably overcome by adjusting the AFSD process variables, implying modifications to the setup will be required to promote substrate adhesion in future research;
  • The microstructures of the deposits were found to consist of multiple distinct regions tied to the deformation and bonding of the two feed rods. Some porosity and interfaces existed where the two rods had not fully bonded together. The grain refinement of the material occurred via continuous dynamic recrystallization;
  • The refined microstructures of the AFSD deposits resulted in higher yield strengths (a 28% average increase) and typically lower elongations at failure. The strengthening is attributed to a refined grain structure and the presence of residual dislocations, while the inconsistent properties are attributed to sample defects, which are not expected to be as prevalent in deposits produced using more sustained depositions.

Author Contributions

Conceptualization, R.J.G. and A.A.M.; Formal analysis, R.J.G. and A.E.W.-H.; Funding acquisition, R.J.G. and A.A.M.; Investigation, R.J.G., A.E.W.-H., M.A.L., E.V.G., A.W. and A.A.M.; Methodology, R.J.G. and A.E.W.-H.; Project administration, A.A.M.; Supervision, A.A.M.; Visualization, R.J.G. and A.E.W.-H.; Writing—original draft, R.J.G.; Writing—review and editing, R.J.G., A.E.W.-H., M.A.L., E.V.G., A.W. and A.A.M. All authors have read and agreed to the published version of the manuscript.

Funding

This work was performed under the auspices of the U.S. Department of Energy (DOE) at Lawrence Livermore National Laboratory (LLNL) under Contract No. DE-AC52-07NA27344.

Data Availability Statement

The original contributions presented in this study are included in the article; further inquiries can be directed to the corresponding author/s.

Conflicts of Interest

A. Wright is an employee of Bond Technologies, a company that designs and constructs machinery for friction stir welding processes. All the other authors declare no conflicts of interest.

References

  1. Wadsworth, J.; Nieh, T.G.; Stephens, J.J. Recent advances in aerospace refractory metal alloys. Int. Mater. Rev. 1988, 33, 131–150. [Google Scholar] [CrossRef]
  2. Lambert, J.B. Refractory Metals and Alloys. In Properties and Selection: Nonferrous Alloys and Special-Purpose Materials; ASM International: Almere, The Netherlands, 1990; Volume 2, pp. 557–585. [Google Scholar] [CrossRef]
  3. Mireles, O. Additive Manufacture of Refractory Metals for Aerospace Applications. In Proceedings of the AIAA Propulsion and Energy 2021 Forum, American Institute of Aeronautics and Astronautics, Virtual Event, 9–11 August 2021. [Google Scholar] [CrossRef]
  4. Omole, S.; Lunt, A.; Kirk, S.; Shokrani, A. Advanced Processing and Machining of Tungsten and Its Alloys. J. Manuf. Mater. Process. 2022, 6, 15. [Google Scholar] [CrossRef]
  5. Chandler, H.E. Machining of Refractory Metals. In Machining; ASM International: Almere, The Netherlands, 1989; Volume 16, pp. 858–869. [Google Scholar] [CrossRef]
  6. Herzog, D.; Seyda, V.; Wycisk, E.; Emmelmann, C. Additive manufacturing of metals. Acta Mater. 2016, 117, 371–392. [Google Scholar] [CrossRef]
  7. Yu, H.Z.; Tuncer, N. Solid-State Metal Additive Manufacturing: Physics, Processes, Mechanical Properties, and Applications; Wiley: Hoboken, NJ, USA, 2024. [Google Scholar] [CrossRef]
  8. Talignani, A.; Seede, R.; Whitt, A.; Zheng, S.; Ye, J.; Karaman, I.; Kirka, M.M.; Katoh, Y.; Wang, Y.M. A review on additive manufacturing of refractory tungsten and tungsten alloys. Addit. Manuf. 2022, 58, 103009. [Google Scholar] [CrossRef]
  9. Sungail, C.; Abid, A.D. Additive manufacturing of tantalum—A study of chemical and physical properties of printed tantalum. Met. Powder Rep. 2020, 75, 28–33. [Google Scholar] [CrossRef]
  10. Mohsan, A.U.H.; Wei, D. Advancements in Additive Manufacturing of Tantalum via the Laser Powder Bed Fusion (PBF-LB/M): A Comprehensive Review. Materials 2023, 16, 6419. [Google Scholar] [CrossRef] [PubMed]
  11. Cotton, M.; Girling, B. Dynamic properties of additively manufactured tantalum. EPJ Web Conf. 2021, 250, 05011. [Google Scholar] [CrossRef]
  12. Yu, H.Z.; Mishra, R.S. Additive friction stir deposition: A deformation processing route to metal additive manufacturing. Mater. Res. Lett. 2021, 9, 71–83. [Google Scholar] [CrossRef]
  13. Yu, H.Z.; Jones, M.E.; Brady, G.W.; Griffiths, R.J.; Garcia, D.; Rauch, H.A.; Cox, C.D.; Hardwick, N. Non-beam-based metal additive manufacturing enabled by additive friction stir deposition. Scr. Mater. 2018, 153, 122–130. [Google Scholar] [CrossRef]
  14. Perry, M.E.J.; Rauch, H.A.; Griffiths, R.J.; Garcia, D.; Sietins, J.M.; Zhu, Y.; Zhu, Y.; Yu, H.Z. Tracing plastic deformation path and concurrent grain refinement during additive friction stir deposition. Materialia 2021, 18, 101159. [Google Scholar] [CrossRef]
  15. Perry, M.E.J.; Griffiths, R.J.; Garcia, D.; Sietins, J.M.; Zhu, Y.; Yu, H.Z. Morphological and microstructural investigation of the non-planar interface formed in solid-state metal additive manufacturing by additive friction stir deposition. Addit. Manuf. 2020, 35, 101293. [Google Scholar] [CrossRef]
  16. Stubblefield, G.G.; Frase, K.A.; Van Iderstine, D.; Mujahid, S.; Rhee, H.; Jordan, J.B.; Allison, P.G. Elucidating the influence of temperature and strain rate on the mechanics of AFS-D through a combined experimental and computational approach. J. Mater. Process. Technol. 2022, 305, 117593. [Google Scholar] [CrossRef]
  17. Valiev, R. Nanostructuring of metals by severe plastic deformation for advanced properties. Nat. Mater. 2004, 3, 511–516. [Google Scholar] [CrossRef] [PubMed]
  18. Azushima, A.; Kopp, R.; Korhonen, A.; Yang, D.Y.; Micari, F.; Lahoti, G.D.; Groche, P.; Yanagimoto, J.; Tsuji, N.; Rosochowski, A. Severe plastic deformation (SPD) processes for metals. CIRP Ann. 2008, 57, 716–735. [Google Scholar] [CrossRef]
  19. Yoder, J.K.; Hahn, G.D.; Zhao, N.; Brennan, R.E.; Cho, K.; Yu, H.Z. Additive friction stir deposition-enabled upcycling of automotive cast aluminum chips. Addit. Manuf. Lett. 2023, 4, 100108. [Google Scholar] [CrossRef]
  20. Agrawal, P.; Haridas, R.S.; Yadav, S.; Thapliyal, S.; Gaddam, S.; Verma, R.; Mishra, R.S. Processing-structure-property correlation in additive friction stir deposited Ti-6Al-4V alloy from recycled metal chips. Addit. Manuf. 2021, 47, 102259. [Google Scholar] [CrossRef]
  21. Chaudhary, B.; Jain, N.K.; Murugesan, J.; Patel, V. Exploring temperature-controlled friction stir powder additive manufacturing process for multi-layer deposition of aluminum alloys. J. Mater. Res. Technol. 2022, 20, 260–268. [Google Scholar] [CrossRef]
  22. Griffiths, R.J.; Garcia, D.; Song, J.; Vasudevan, V.K.; Steiner, M.A.; Cai, W.; Yu, H.Z. Solid-state additive manufacturing of aluminum and copper using additive friction stir deposition: Process-microstructure linkages. Materialia 2021, 15, 100967. [Google Scholar] [CrossRef]
  23. Zhang, M.; Ye, X.; Li, Y.; Wang, H.; Lai, R.; Li, Y. Effect of Heat Treatment States of Feedstock on the Microstructure and Mechanical Properties of AA2219 Layers Deposited by Additive Friction Stir Deposition. Materials 2023, 16, 7591. [Google Scholar] [CrossRef] [PubMed]
  24. Wang, H.; Li, Y.; Zhang, M.; Gong, W.; Lai, R.; Li, Y. Preheating-assisted solid-state friction stir repair of Al-Mg-Si alloy plate at different rotational speeds. Int. J. Miner. Metall. Mater. 2024, 31, 725–736. [Google Scholar] [CrossRef]
  25. Gong, W.; Li, Y.; Zhang, M.; Wang, H.; Liu, Q.; Zeng, Z.; Ma, K.; Yang, B.; Lai, R.; Li, Y. Influence of Preheating Temperature on the Microstructure and Mechanical Properties of 6061/TA1 Composite Plates Fabricated by AFSD. Materials 2023, 16, 6018. [Google Scholar] [CrossRef] [PubMed]
  26. Farabi, E.; Babaniaris, S.; Barnett, M.R.; Fabijanic, D.M. Microstructure and mechanical properties of Ti6Al4V alloys fabricated by additive friction stir deposition. Addit. Manuf. Lett. 2022, 2, 100034. [Google Scholar] [CrossRef]
  27. Metz, P.C.; Arwood, Z.; Franz, C.; Heikkenen, E.; Chawla, V.; Babu, S.S.; Penumadu, D.; Page, K. Non-uniform plastic deformation in additive friction stir deposited Ti-6Al-4V. Materialia 2023, 30, 101799. [Google Scholar] [CrossRef]
  28. Beladi, H.; Farabi, E.; Hodgson, P.D.; Barnett, M.R.; Rohrer, G.S.; Fabijanic, D. Microstructure evolution of 316L stainless steel during solid-state additive friction stir deposition. Philos. Mag. 2022, 102, 618–633. [Google Scholar] [CrossRef]
  29. Agrawal, P.; Shian, C.H.; Sharma, A.; Hu, Z.; Dubey, M.; Lu, Y.; Shao, L.; Prabhakaran, R.; Wu, Y.; Mishra, R.S. Ion irradiation and examination of Additive friction stir deposited 316 stainless steel. Mater. Des. 2024, 238, 112730. [Google Scholar] [CrossRef]
  30. Gor, M.; Barnett, M.; Fabijanic, D.; Bhattacharjee, P.P. Additive friction stir deposition of super duplex stainless steel: Microstructure and mechanical properties. Addit. Manuf. Lett. 2024, 9, 100204. [Google Scholar] [CrossRef]
  31. Roper, B.E.T.; Roper, C.M.; Rao, H.M.; Brewer, L.N.; Vasudevan, V.K.; Zhu, N.; Jordon, J.B. Microstructure Evolution in 304L Stainless Steel Cladding Produced by Additive Friction Stir Deposition. Metallogr. Microstruct. Anal. 2024, 13, 174–180. [Google Scholar] [CrossRef]
  32. Martin, L.P.; Luccitti, A.; Walluk, M. Evaluation of additive friction stir deposition of AISI 316L for repairing surface material loss in AISI 4340. Int. J. Adv. Manuf. Technol. 2022, 121, 2365–2381. [Google Scholar] [CrossRef]
  33. Patil, S.M.; Krishna, K.V.M.; Sharma, S.; Joshi, S.S.; Radhakrishnan, M.; Banerjee, R.; Dahotre, N.D. Thermo-mechanical process variables driven microstructure evolution during additive friction stir deposition of IN625. Addit. Manuf. 2024, 80, 103958. [Google Scholar] [CrossRef]
  34. Griffiths, R.J.; Gotawala, N.; Hanh, G.; Garcia, D.; Yu, H.Z. Towards underwater additive manufacturing via additive friction stir deposition. Mater. Des. 2022, 223, 111148. [Google Scholar] [CrossRef]
  35. Asiatico, P.M. The Applicability of Additive Friction Stir Deposition for Bridge Repair. Virginia Tech, 2021. Available online: http://hdl.handle.net/10919/103691 (accessed on 25 July 2024).
  36. Agrawal, P.; Haridas, R.S.; Agrawal, P.; Mishra, R.S. Deformation based additive manufacturing of a metastable high entropy alloy via Additive friction stir deposition. Addit. Manuf. 2022, 60, 103282. [Google Scholar] [CrossRef]
  37. Garcia, D.; Hartley, W.D.; Rauch, H.A.; Griffiths, R.J.; Wang, R.; Kong, Z.J.; Zhu, Y.; Yu, H.Z. In situ investigation into temperature evolution and heat generation during additive friction stir deposition: A comparative study of Cu and Al-Mg-Si. Addit. Manuf. 2020, 34, 101386. [Google Scholar] [CrossRef]
  38. Thomas, W.; Threadgill, P.; Nicholas, E. Feasibility of friction stir welding steel. Sci. Technol. Weld. Join. 1999, 4, 365–372. [Google Scholar] [CrossRef]
  39. Liu, F.C.; Hovanski, Y.; Miles, M.P.; Sorensen, C.D.; Nelson, T.W. A review of friction stir welding of steels: Tool, material flow, microstructure, and properties. J. Mater. Sci. Technol. 2018, 34, 39–57. [Google Scholar] [CrossRef]
  40. Fujii, H.; Cui, L.; Tsuji, N.; Maeda, M.; Nakata, K.; Nogi, K. Friction stir welding of carbon steels. Mater. Sci. Eng. A 2006, 429, 50–57. [Google Scholar] [CrossRef]
  41. Gandra, J.; Krohn, H.; Miranda, R.M.; Vilaça, P.; Quintino; Santos, J.F.D. Friction surfacing—A review. J. Mater. Process. Technol. 2014, 214, 1062–1093. [Google Scholar] [CrossRef]
  42. Dilip JJ, S.; Babu, S.; Rajan, S.V.; Rafi, K.H.; Ram GD, J.; Stucker, B.E. Use of Friction Surfacing for Additive Manufacturing. Mater. Manuf. Process. 2013, 28, 189–194. [Google Scholar] [CrossRef]
  43. Gotawala, N.; Mishra, N.K.; Shrivastava, A. Solid-state depositions of multilayer SS304 by friction stir metal deposition. Mater. Lett. 2022, 314, 131881. [Google Scholar] [CrossRef]
  44. Rafi, H.; Ram, G.D.; Phanikumar, G.; Kalvala, P. Microstructural evolution during friction surfacing of tool steel H13. Mater. Des. 2011, 32, 82–87. [Google Scholar] [CrossRef]
  45. Pereira, D.; Gadra, J.; Teixeira, J.; Mirand, R.; Vilaca, P. Wear behaviour of steel coatings produced by friction surfacing. J. Mater. Process. Technol. 2014, 214, 2858–2868. [Google Scholar] [CrossRef]
  46. Kallien, Z.; Klusemann, B. Combined experimental-numerical analysis of the temperature evolution and distribution during friction surfacing. Surf. Coat. Technol. 2022, 437, 128350. [Google Scholar] [CrossRef]
  47. ASTM B708-12(2019); Standard Specification for Tantalum and Tantalum Alloy Plate, Sheet, and Strip. ASTM International: West Conshohocken, PA, USA, 2019. [CrossRef]
  48. Wang, Z.; Yuan, Y.; Arshad, K.; Wang, J.; Zhou, Z.; Tang, J.; Lu, G.-H. Effects of tantalum concentration on the microstructures and mechanical properties of tungsten-tantalum alloys. Fusion Eng. Des. 2017, 125, 496–502. [Google Scholar] [CrossRef]
  49. Gourdin, W.; Lassila, D.; Leblanc, M.; Shields, A. The influence of tungsten alloying on the mechanical properties of tantalum. J. Phys. IV 1994, 4, C8207–C8212. [Google Scholar] [CrossRef]
  50. Ma, G.; Wei, Z.; Wu, G.; Mao, X. The microstructure and strength of a tantalum alloy: Influence of temperature. Mater. Sci. Eng. A 2023, 880, 145312. [Google Scholar] [CrossRef]
  51. Gray, G.T., III; Bingert, S.R.; Wright, S.I.; Chen, S.R. Influence of Tungsten Alloying Additions on the Mechanical Properties and texture of Tantalum. MRS Online Proc. Libr. 1993, 322, 407–412. [Google Scholar] [CrossRef]
  52. Schindelin, J.; Arganda-Carreras, I.; Frise, E.; Kaynig, V.; Longair, M.; Pietzsch, T.; Preibisch, S.; Rueden, C.; Saalfeld, S.; Schmid, B.; et al. Fiji: An open-source platform for biological-image analysis. Nat. Methods 2012, 9, 676–682. [Google Scholar] [CrossRef] [PubMed]
  53. Fonda, R.W.; Knipling, K.E. Texture development in friction stir welds. Sci. Technol. Weld. Join. 2011, 16, 288–294. [Google Scholar] [CrossRef]
  54. Baczynski, J.; Jonas, J.J. Texture development during the torsion testing of α-iron and two if steels. Acta Mater. 1996, 44, 4273–4288. [Google Scholar] [CrossRef]
  55. Li, S.; Beyerlein, I.J.; Bourke, M.A. Texture formation during equal channel angular extrusion of fcc and bcc materials: Comparison with simple shear. Mater. Sci. Eng. A 2005, 394, 66–77. [Google Scholar] [CrossRef]
  56. Rahimi, S.; Wynne, B.P.; Baker, T.N. Development of Microstructure and Crystallographic Texture in a Double-Sided Friction Stir Welded Microalloyed Steel. Metall. Mater. Trans. A 2017, 48, 362–378. [Google Scholar] [CrossRef]
  57. Kocks, F.; Tomé, C.; Wenk, H.-R. Texture and Anisotropy. Preferred Orientations in Polycrystals and Their Effect on Material Properties; Cambridge University Press: Cambridge, UK, 2000. [Google Scholar]
  58. Sharma, S.; Krishna, K.V.M.; Radhakrishnan, M.; Pantawane, M.V.; Patil, S.M.; Joshi, S.S.; Scholar, R.B.; Dahotre, N.B. A pseudo thermo-mechanical model linking process parameters to microstructural evolution in multilayer additive friction stir deposition of magnesium alloy. Mater. Des. 2022, 224, 111412. [Google Scholar] [CrossRef]
  59. Humphreys, F.J.; Hatherly, M. Recrystallization and Related Annealing Phenomena; Elsevier: Amsterdam, The Netherlands, 2012. [Google Scholar]
  60. Nesterenko, V.F.; Meyers, M.A.; LaSalvia, J.C.; Bondar, M.P.; Chen, Y.J.; Lukyanov, Y.L. Shear localization and recrystallization in high-strain, high-strain-rate deformation of tantalum. Mater. Sci. Eng. A 1997, 229, 23–41. [Google Scholar] [CrossRef]
  61. Tang, Y.; Liu, Y.; Peng, Y.; Xiong, W.; Long, J.; Tan, D. Dynamic restoration and texture evolution of pure tantalum during warm deformation. Int. J. Refract. Met. Hard Mater. 2023, 115, 106279. [Google Scholar] [CrossRef]
  62. Ma, G.; Hughes, D.A.; Godfrey, A.W.; Chen, Q.; Hansen, N.; Wu, G. Microstructure and strength of a tantalum-tungsten alloy after cold rolling from small to large strains. J. Mater. Sci. Technol. 2021, 83, 34–48. [Google Scholar] [CrossRef]
  63. Lassila, D.H.; Goldberg, A.; Becker, R. The effect of grain boundaries on the athermal stress of tantalum and tantalum-tungsten alloys. Metall. Mater. Trans. A 2002, 33, 3457–3464. [Google Scholar] [CrossRef]
  64. Hansen, N. Hall–Petch relation and boundary strengthening. Scr. Mater. 2004, 51, 801–806. [Google Scholar] [CrossRef]
  65. Koo, R.C. Grain-size effects on the deformation of tantalum at low temperatures. J. Common Met. 1962, 4, 138–144. [Google Scholar] [CrossRef]
  66. Hansen, L.T.; Fullwood, D.T.; Homer, E.R.; Wagoner, R.H.; Lim, H.; Carroll, J.D.; Zhou, G.; Bong, H.J. An investigation of geometrically necessary dislocations and back stress in large grained tantalum via EBSD and CPFEM. Mater. Sci. Eng. A 2020, 772, 138704. [Google Scholar] [CrossRef]
  67. Chen, S.R.; Gray, G.T., III; Bingert, S.R. Mechanical Properties and Constitutive Relations for Tantalum and Tantalum Alloys under High-Rate Deformation; LANL: Los Alamos, NM, USA, 1996. [Google Scholar] [CrossRef]
  68. Wright, S.I.; Gray, G.T., III; Rollett, A.D. Textural and microstructural gradient effects on the mechanical behavior of a tantalum plate. Metall. Mater. Trans. A 1994, 25, 1025–1031. [Google Scholar] [CrossRef]
Figure 1. (a) Side-view diagram of the twin-rod AFSD process. (b) Top-down-view diagram of the AFSD process. The tool is moving from left to right and rotating in a clockwise direction.
Jmmp 08 00177 g001
Figure 2. (a) A single camera frame highlighting the intense heat and vibration encountered during the AFSD of Ta2.5W. (b) The resulting Ta2.5W deposit, after sectioning from the build plate, alongside three tensile bars cut from the center of the deposit. The annotation highlights the imaging surface used for microscopy. (c) Optical micrograph of the Ta2.5W deposit cross-section, with evidence of porosity defects and a bisecting interface; EBSD scan locations for 3c and 3d are annotated. (d) Diagram corresponding to (c), identifying the cross-section features, as well as providing sample reference orientations for orientation dependent microstructure features.
Jmmp 08 00177 g002
Figure 3. (a) Grain size distributions for the feed material, upper region, and lower region of the deposit. The average grain size of the feed material is annotated by a dashed line to highlight grain refinement in the deposited material. (bd) Inverse pole figure maps gathered via EBSD for the feed rod material, upper region, and lower region of the deposit, respectively.
Jmmp 08 00177 g003
Figure 4. (a) High-magnification IPF map, (b) grain-boundary-type plot, and (c) GND map of the upper region. (d) High-magnification IPF map, (e) grain-boundary-type plot, and (f) GND map of the lower region.
Jmmp 08 00177 g004
Figure 5. (a) Optical micrograph of the interfacial region. (b) EBSD map of the interfacial region. (c) EBSD scan data colored based on grain size.
Jmmp 08 00177 g005
Figure 6. Pole figures and orientation distribution functions for the (a,b) upper region of the deposit and the (c,d) lower region of the deposit. Specified xRandom scales apply to both the PF and ODF for the region.
Jmmp 08 00177 g006
Figure 7. (a) Engineering stress–strain plots and (b) true stress–strain plots for the AFSD-deposited Ta2.5W alongside those for a reference sample sectioned from the annealed Ta2.5W plate material.
Jmmp 08 00177 g007
Figure 8. (af) XCT slices highlighting observed defects and physical features for coupons 1A, 1B, 1C, 2A, 2B, and 2C, respectively.
Jmmp 08 00177 g008
Figure 9. Nominal heat generation calculated as a function of the radial position from the center of the tool for (a) single-rod AFSD and (b) twin-rod-style AFSD.
Jmmp 08 00177 g009
Figure 10. (a) Diagram showing the material flow within the extrusion aspect of the AFSD. (b) Photograph showing feed rod softening and expansion on the bottom face of the tool after a halted trial deposition of Ta2.5W. (c) A diagram showing the different phenomena that inhibit sustained material deposition. (d) Photograph of a Ta2.5W deposit, showing the extended skating region, with friction surfacing that precluded the actual deposition.
Jmmp 08 00177 g010
Figure 11. (ad) Proposed sequence of feed rod softening, substrate adhesion, and buildup of material during twin-rod-style AFSD.
Jmmp 08 00177 g011
Table 1. XCT scan parameters.
Voxel Size (µm)VoltageCurrentPowerFilter Material and Thickness (mm)X-ray Source-to-Detector Distance (mm)Exposure Time (ms)Number of ProjectionsNumber of Frames Averaged
2222010022Sn, 11180400011202
Table 2. Twin-rod AFSD trial conditions and results for Ta2.5W.
Trial No.12345678910
Tool Rotation Rate (rev/min)500500800500500500500450450500
Tool Traverse Rate (mm/min)100100500012.512.512.51824
Material Feed Rate (mm/min)3838190022333
Average Spindle Torque (Nm)n/an/a60202050758575100
Peak Spindle Torque (Nm)380*270250304273100300 *100300 *
Average Actuator Load (kN)n/a **n/a **2012.5544.857
Peak Actuator Load (kN)16143064.8710.514818
OutcomeRapid Overload No AdhesionRapid Overload No AdhesionPartial Deposition and Tool JamNo AdhesionNo AdhesionSkating and Tool JamSkatingSkating and DepositionSkatingSkating, Deposition, and Tool Jam
* Indicates trials in which motor torque spiked and stalled the machine, potentially running higher than the measured value. ** Trials were too rapid for any load average to develop.
Table 3. Scan data rotations for identified textural components. Sample axes are defined in Figure 1.
Upper RegionLower Region
S1S2S3S1S2S3
45° ± 120°/240°8° ± 120°/240°15°
Table 4. Yield strength calculations and measurements (all units are in MPa).
Region σ o σ T σ H P σ Y Average Measured
σ Y
Upper19499.763.1356.8371.5
Lower194115.264.8374.0
Disclaimer/Publisher’s Note: The statements, opinions and data contained in all publications are solely those of the individual author(s) and contributor(s) and not of MDPI and/or the editor(s). MDPI and/or the editor(s) disclaim responsibility for any injury to people or property resulting from any ideas, methods, instructions or products referred to in the content.

