Article

The Influence of the Rolling Direction on the Mechanical Properties of the Al-Alloy EN AW-5454-D

1
Faculty of Mechanical Engineering, University of Maribor, Smetanova ulica 17, 2000 Maribor, Slovenia
2
Zlatarna Celje d.o.o., Kersnikova ulica 19, 3000 Celje, Slovenia
3
Pomurje Science and Innovation Centre, Rakičan, Lendavska ulica 28, 9000 Murska Sobota, Slovenia
*
Author to whom correspondence should be addressed.
J. Manuf. Mater. Process. 2024, 8(5), 217; https://doi.org/10.3390/jmmp8050217
Submission received: 23 August 2024 / Revised: 22 September 2024 / Accepted: 23 September 2024 / Published: 30 September 2024

Abstract

:
A complementary characterisation of the Al-alloy EN AW-5454 was carried out, intended for obtaining the laser hybrid welding parameters of subassemblies in the automotive industry. The investigation included a microstructural examination and the determination of the alloy’s properties using several analytical methods (HV5 hardness measurement, tensile test, Charpy impact toughness, fracture mechanics analysis). Samples were prepared in the longitudinal and transverse directions of a cold-rolled sheet of EN AW-5454 with thicknesses of 3.5 mm and 4 mm. The measured hardness on the thinner sheet was 5% higher than on the thicker sheet. The tensile and yield strength were nominal, while the elongations were smaller by 2.2–3.2% for the longitudinal samples and by 2.7–13.7% for the transverse samples. The smaller deviations from the nominal values are for the thinner sheet metal. A precise topographical analysis showed the brittle fractures of the samples. The Charpy impact toughness results on the thicker plate showed a 20% greater work needed to break it in the longitudinal direction than in the transverse direction. With the thinner sheet metal, 40% greater work was needed. SEM (scanning electron microscope) analysis has shown that the intermetallic Al6(Mn,Fe) particles in the longitudinal samples were mostly intact, with evidence of tough areas on the upper part of the fracture, indicating a better toughness than the specimens in the transverse direction. More crushed intermetallic particles were observed at the fractures of the transverse samples, and their distribution appeared to be more oriented in the direction of rolling. Fracture mechanics SENB (single edge notch bending) tests and their analysis showed that the resistance of the material to crack propagation in the longitudinal sample was about 50% greater than that in the transverse sample. SEM analysis of the fractures showed that the state of the intermetallic particles in the fracture mechanics testing and the fracture mechanism differed from the one in the Charpy fractures.

1. Introduction

It is known from the literature that the most important properties of the Al-alloy EN AW-5454 are its excellent corrosion resistance, good formability [1], and weldability [2]. The Al-alloy EN AW-5454 also has a good ratio of density and load-bearing capacity [3,4] and excellent deformation properties [5,6,7] and is, therefore, very suitable for use in the automotive industry. This is particularly important for reducing the weight of the product, which affects its LCA (Life Cycle Assessment) significantly, thereby improving the environmental footprint [8] of the product, as it results in a lower energy consumption for vehicle engines [9]. This alloy is expected to be used in the automotive industry for chassis parts that are heavily dynamically loaded and require a good ratio of strength, toughness, and resistance of the material to crack propagation. Due to the shape of the subassemblies, it is assumed that the material will need to be welded. Since the material is sensitive to heat input during welding, it will be necessary to use such welding processes as, for example, laser welding or laser hybrid welding. However, since the direction of rolling affects the shape and orientation of the intermetallic Al6(Mn,Fe) inclusions in the alloy, this certainly affects the mechanical properties and resistance of the material to the expansion of cracks transversely and longitudinally depending on the direction of rolling. The influence of the rolling direction on the mechanical properties of EN AW-5454-D on two thicknesses of rolled sheet was analysed in detail. In the event of large deviations in the results of the analysis of mechanical properties according to the direction of rolling, in laser or laser hybrid welding, it will certainly be necessary to pay attention to the appropriate orientation of the sheet metal during welding to ensure the integrity of the welded subassembly throughout its lifespan. The results of this research will be considered in future research on laser or laser hybrid welded subassemblies.
We are interested in the mechanical properties regarding the thickness of the sheet metal and the orientation of the sheet regarding the direction of rolling, to minimize the differences between the welded joint and the base material. The deterioration of the mechanical properties of the welded joint relative to the mechanical properties of the base material will be analysed in future research. Excessive differences in properties between the welded joint and the base material cause the crack in the welded joint to spread faster. The properties of the Al-alloy EN AW-5454 depend on the basic microstructure, so it is very important to evaluate the microstructure and all the key microstructural elements that affect the properties of the final assembly during the subsequent processing, finishing, or joining of the Al-product with other subassemblies first. When welding Al-alloys, we aim to minimize the impact of the strength mismatch on the mechanical performance of the weld joint. This includes considering crack growth in a mismatched specimen, the effects of yield strength mismatch, and the thickness of the weld metal on fracture resistance and load-deformation for under-matched specimens [10,11,12,13,14]. Additionally, weld mismatch with the base metal is also a critical factor. Laser hybrid welding is recognised as a promising joining process [15], as it compensates for the shortcomings of the laser and arc welding processes when used properly. It is introduced in the field of Al-alloy welding, where the practices and optimal technological parameters are unknown. The development is in the experimental phase of determining the optimal conditions for each structural element and for each Al-alloy separately. When choosing optimal parameters, laser hybrid welding offers many advantages [16], as it is much faster and more productive than classical arc welding [17]; ensures a lower energy input [18,19,20] into the weld joint, and thus a lower impact on the microstructure in the HAZ (heat-affected zone) [21,22,23], predominantly due to a crystalline grain growth, residual internal stresses [24], and related deformations, since Al-alloys have high-temperature expansions and contractions [25]; enables a wider tolerance of the welding gap [26]; ensures a better appearance of the welded joints; and reduces the welding defects [27,28]. The above-mentioned characteristics of laser hybrid welding also make it a good selection for minimizing the weld joint materials’ mismatch.
The purpose of the research task was to characterise the delivered sheet metal of two thicknesses made from the Al-alloy EN AW-5454 and to determine in detail whether the mechanical properties are affected by the microstructural elements discovered in the previous research [29]. Thinner sheet metal is more kneaded during rolling, and since this Al-alloy hardens by kneading, thinner sheet metal is expected to have better mechanical properties. Thinner materials also behave more toughly and offer greater resistance to crack propagation due to the more biaxial stress state and a smaller biaxial strain state in the middle of the material, which means greater resistance of the material due to a possible larger plastic zone [30,31]. When designing products, it will be necessary to further consider the choice of sheet thickness. This is because thinner sheet metal offers better resistance of the material to crack propagation than thicker sheet metal, due to the lower constraint. Thicker sheet metal is less stressed in terms of strength due to a larger load-bearing cross-section. Due to the above-mentioned reasons, two sheet thicknesses were analysed. The results of this research have shown that the direction of rolling is very important and can later affect the mechanical properties of the entire welded joint. As the alloy hardens by kneading, better rolling properties are expected, which is also confirmed by the results of investigations, and it will be necessary to take this into account in the design of welding products, with the appropriate orientation of the sheet metal during welding in order to achieve better mechanical properties and greater resistance of the material to the spread of possible defects and a longer service life of the product.

2. Materials and Methods

2.1. Materials

For the investigation, we used materials supplied by the manufacturer Speira GmbH (Grevenbroich, Germany). Sheet strips made of cold-rolled Al-sheets of two thicknesses (3.5 mm and 4 mm), and a width of 856 mm, were supplied, which were cut to a length of 1000 mm in the supplied condition O (soft) [32].
The nominal chemical composition of the supplied Al-alloy EN AW-5454-D used for the tests and analyses is listed in Table 1. Chemical composition was determined with spark spectrometry (spark OES).

2.2. Sample Preparation, Performing of Analyses, and Testing

All the samples for the conducted investigation were taken from the central parts of the delivered sheet metal at a width of 300 mm, as shown in the sampling scheme in Figure 1. According to the same scheme, the samples were taken from both sheet thicknesses. The samples were labelled according to Table 2.

Metallographic Sample Preparation

For the microstructural characterisation, three samples with dimensions of 15 × 30 mm were prepared, taken in the longitudinal direction for each sheet thickness. The samples were embedded with Bakelite mass and prepared according to the procedure described in Table 3. The naming of the samples is defined in Table 2 (the samples for hardness measurements): AH1, AH2, AH3, BH1, BH2, BH3.
After completion of the individual grinding/polishing steps, the sample was washed with running water. This was followed by cleaning in an ultrasonic bath in ethanol for 5 min and drying with dry air. After the final polishing with colloidal silica, the sample was cleaned in an ultrasonic bath for 20 min. This was followed by a process of chemical etching of the polished surface of the sample, which was carried out with an etchant (H2O: HF = 10:1). The etching times varied from ten seconds to several minutes.

2.3. Microstructural Analysis

The microstructure of the selected sample was investigated with an optical metallographic microscope, NIKON Epiphot 300 (Nikon Solutions Corporation, 1-6-3 Nishi-Oi, Shinagawa-ku, Tokio 140-0015, Japan), with an Olympus DP12 camera (Boston Industries, Inc., 12 Channel Street, Suite 804, Boston, MA 02210, USA). A scanning electron microscope (SEM), Sirion 400NC (Thermo Fisher Scientific (FEI Company), 5350 NE Dawson Creek Drive, Hillsboro, OR 97124, USA1.), with an energy dispersive X-ray spectroscope INCA 350 (Oxford Instruments NanoAnalysis, Tubney Woods.
Abingdon, Oxfordshire, OX13 5QX, United Kingdom), was used for the detailed microstructure observation and microchemical analyses of the different metallic phases found in the samples. The samples were analysed from secondary and backscattered electron images at magnifications of 500×–10,000×, with an acceleration voltage of 20 kV and an electron beam spot size of 3.0–4.0. The EDX analysis was conducted in a range of 0–20 keV, for elemental determination of the analysed sites, with normalized results.

2.3.1. Sample Preparation and Performance of the Hardness Measurements HV5

The samples prepared for microstructure analysis were later used to measure the hardness of HV5. The naming of the samples was in accordance with Table 2: AH1, AH2, AH3, BH1, BH2, BH3.
The hardness of the samples was examined with Vickers hardness measurements HV5 on a ZWICK 3212 machine (Ulm, Germany), in accordance with EN ISO 6507-1 [33]. The measurement load of 5 kg was selected for the given sample dimensions, with a loading time of 15 s.

2.3.2. Sample Preparation and Performance of the Tensile Testing

Three test specimens were produced for each testing, in accordance with the recommendations of the EN ISO 6892-1 standard [34]. The dimensions of the test specimens are shown in Figure 2. They were taken as shown in Figure 1. The naming of the samples was in accordance with Table 2: ALT1, ALT2, ALT3, ATT1, ATT2, ATT3, BLT1, BLT2, BLT3, BTT1, BTT2, BTT3.

2.4. Tensile Testing

The tensile tests were performed on a ZwickRoell Vibrophore 100 (ZwickRoell GmbH & Co. KG, August-Nagel-Straße 11, 89079 Ulm, Germany) tensile testing machine at room temperature in accordance with EN ISO 6892-1, Method B [34]. The elastic modulus E [GPa], tensile strength Rm [MPa], yield strength Rp0.2 [MPa], and elongation Ag [%] were measured using a quasi-static process without prestressing force. The mean values and standard deviation were calculated for each specimen. The test specimens were previously settled at room temperature (20 °C), where the tests were performed.

Sample Preparation and Performance of the Charpy Impact Toughness Tests

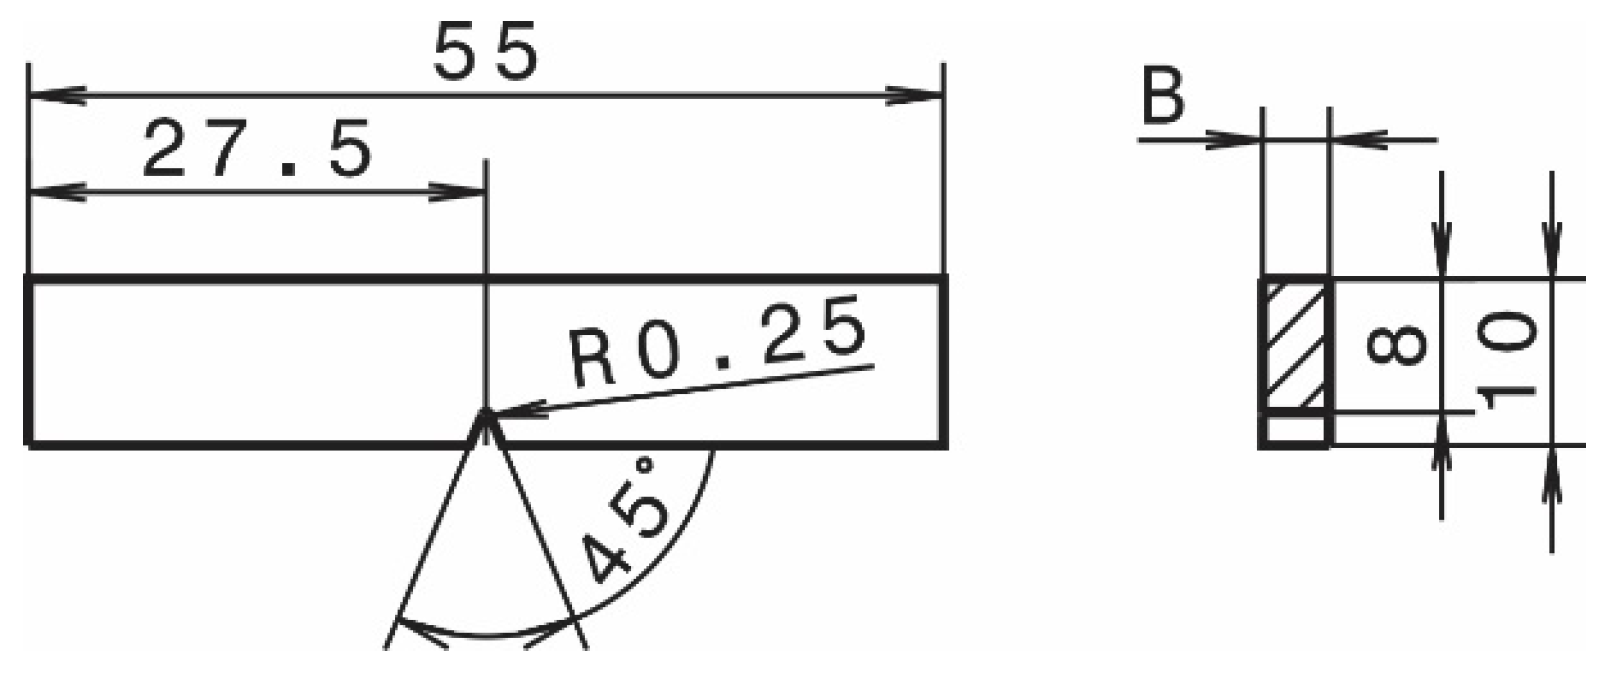
The geometry of the Charpy test specimens was adapted to the thickness of the material and is shown in Figure 3. The test specimens were produced with an ISO–V notch across the entire thickness of the material in accordance with EN ISO 148-1 [35]. The ISO-V notch depth was 2 mm. The samples were taken from both sheet thicknesses, as shown in Figure 1, and named according to Table 2: ALC1, ALC2, ALC3, ATC1, ATC2, ATC3, BLC1, BLC2, BLC3, BTC1, BTC2, BTC3.

2.5. Instrumented Charpy Test

The instrumented Charpy test was performed according to the EN ISO 14556 standard [36], at room temperature on an AMSLER RPK 300 Charpy hammer (ZwickRoell GmbH & Co. KG, August-Nagel-Straße 11, 89079 Ulm, Germany) with the computerised results recorded in an Excel file. During the impact test, time t [s], force F [N], displacement s [mm], and velocity v [m/s] of the impact hammer were recorded and stored digitally. The total energy for fracture E [J] was calculated, which was divided into the energy for crack initialisation Ei [J] and the energy for crack propagation Ep [J]. The average impact work was calculated for the fracture of the test piece with a V notch KVpov [J/cm2].

Sample Preparation and Performance of the Testing of Fracture Mechanics

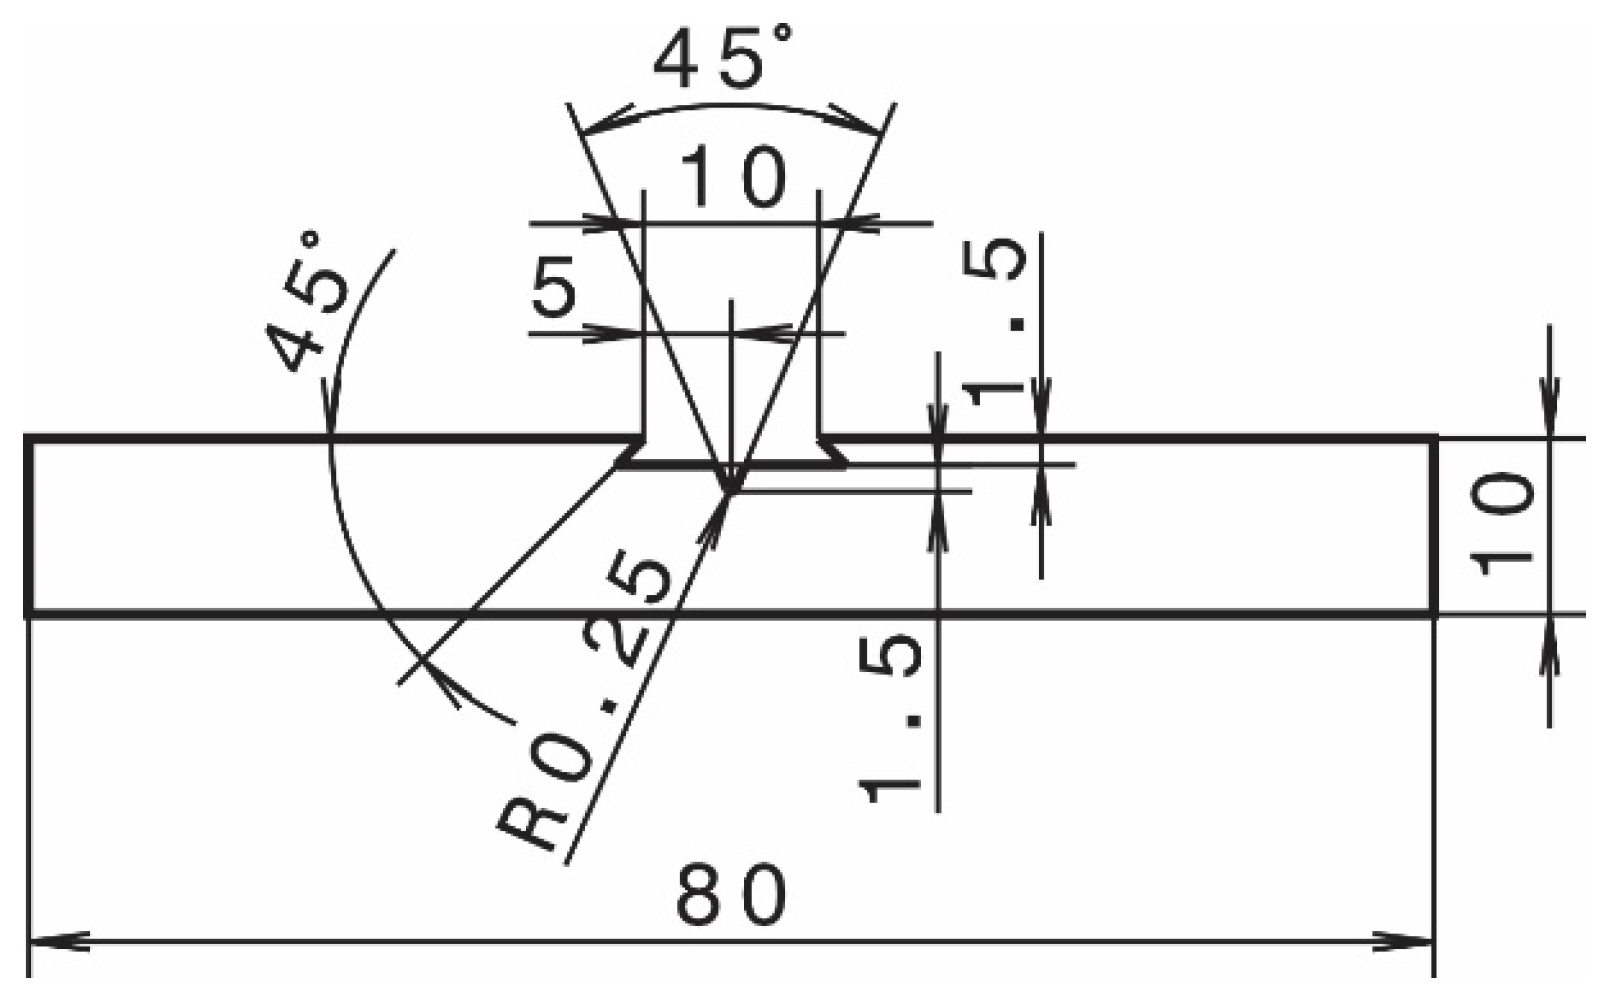
The test pieces were made in two directions with respect to the rolling direction: longitudinal and transverse. The geometry of the fracture mechanics test specimens is shown in Figure 4. Laterally, along the wider side, the test specimens were sanded finely with 600 grit sandpaper. Lines were marked on both surfaces of the test specimens with a height marker, to monitor the controlled growth of the crack. In the middle of the test piece, there was a groove for the CMOD sensor and a V notch. Three samples were made from each rolling direction, as follows (see the table of all of the material samples, Table 2): ALF1, ALF2, ALF3, ATF1, ATF2, ATF3, BLF1, BLF2, BLF3, BTF1, BTF2, BTF3.

2.6. Fracture Mechanics

The fracture mechanics tests were performed using the method in accordance with the ASTM E1820 standard [37]. The tests were carried out in three steps:
Step 1: Initiating the pre-crack to the desired length by bending on a 160 Nm RUMUL Cractronic machine (Russenberger Prüfmaschinen AG, Gewerbestrasse 10, CH-8212 Neuhausen am Rheinfall, Switzerland) (for pre-fatigue).
Step 2: Propagating a crack by bending in a tensile testing machine—Smitweld 1405 tensile machine (Smitweld b.v. (now Lincoln Smitweld b.v.), Nijmegen, The Netherlands)
Step 3: Post-fatigue 160 Nm RUMUL Cractronic machine (Russenberger Prüfmaschinen AG, Gewerbestrasse 10, CH-8212 Neuhausen am Rheinfall, Switzerland) (for post-fatigue) and final breakage of the specimen.
A CMOD sensor was placed in the groove of the SENB specimens to measure the displacement of the crack tip opening. During the test itself, the force was measured in a three-point bending test, where the mechanical notch was on the bottom side and the SENB test specimen was supported by two supports with a distance of 64 mm between them. During the test, the data were recorded and force F [N]–CMOD [mm] diagrams were drawn.
After the test, post-fatigue examinations were performed to mark the stable crack growths after the SENB tests, which were followed until the SENB specimen’s final fractures. The normalisation method according to the ASTM E1820 standard [29] was used to evaluate the SENB fracture mechanics test and to determine the resistance curve (J integral—∆a).

2.7. Analysis of the Fracture Surfaces

Examination of the fracture surfaces was performed with a Leica WILD M10 optical microscope with a Leica MC170 HD digital camera (Leica Microsystems GmbH, Germany). The fracture surfaces of the samples were examined:
  • Tensile testing: ALT3, ATT2, BLT2, and BTT1;
  • Charpy testing with labels: ALC1, ATC1, BLC1, and BTC1;
  • Fracture mechanics with labels: ALF1, ALF2, ATF1, and ATF2, at the sites where the crack was initiated from the notch, and at fractures that were about 1 mm away from the notch.

3. Results and Discussion

3.1. Microstructure

The microstructure of the Al-alloy had already been analysed in a previous study [29], which showed that it consists of the main α-Al phase with dissolved Mg and Si, and, in some places, there is also the presence of a very fine eutectic Mg2Si phase and an intermetallic phase Al6(Mn,Fe).

3.2. Hardness Measurements

The HV5 hardness was measured on the previously metallographically prepared samples [38]. Several measurements were performed on each sample, and the average results from each sample are written in Table 4. The averages of all three samples on the same plate are shown lines “Average of the samples” in Table 4. From the HV5 results shown in Table 4, it can be seen that the HV5 average differed by approximately 5%, which indicates the probable strengthening of the Al-alloy due to the rolling process [39] and subsequent cold forming. It is known that the AW 5454 alloy can only be hardened by kneading [40,41].

3.3. Tensile Testing

The tensile tests yielded the results shown in Figure 5 and summarised in Table 5. The discontinuous behaviour in the elastoplastic part of the tensile test is most likely related to the slippage of dislocations in certain planes in the tensile test on Portevin–Le Châtelier effect strain bands of Al–Mg alloys, which was discussed in more detail in the article by Curtin et al. [42] and other articles [43,44,45,46,47].
The nominal mechanical properties of the materials for both delivered and used thicknesses defined from the manufacturer are listed in Table 5.
When comparing the nominal values with the measured values, it can be seen that the measured values for tensile and yield strength are in the area between the upper and lower nominal values, while the average measured elongations are smaller by 2.2–3.2% for the longitudinal samples and by 2.7–13.7% for the transverse samples. Smaller deviations from the nominal are noted for the thinner sheet metal. From the results of the performed tensile tests in Figure 5 and Table 6, we can understand the influence of the rolling direction of the material on the elongation and tensile strength of the material. In the case of longitudinal samples with thicker sheet metal, the elongation achieved was 11.5% higher than in the case of the transverse samples. With the thinner sheet metal, the elongation was only 0.7% greater. This is a consequence of the isotropy of the material due to rolling and the texture development [48,49,50,51,52,53,54,55]. The fracture surface analysis and 3D fracture topography were included to clarify Table 6 further.
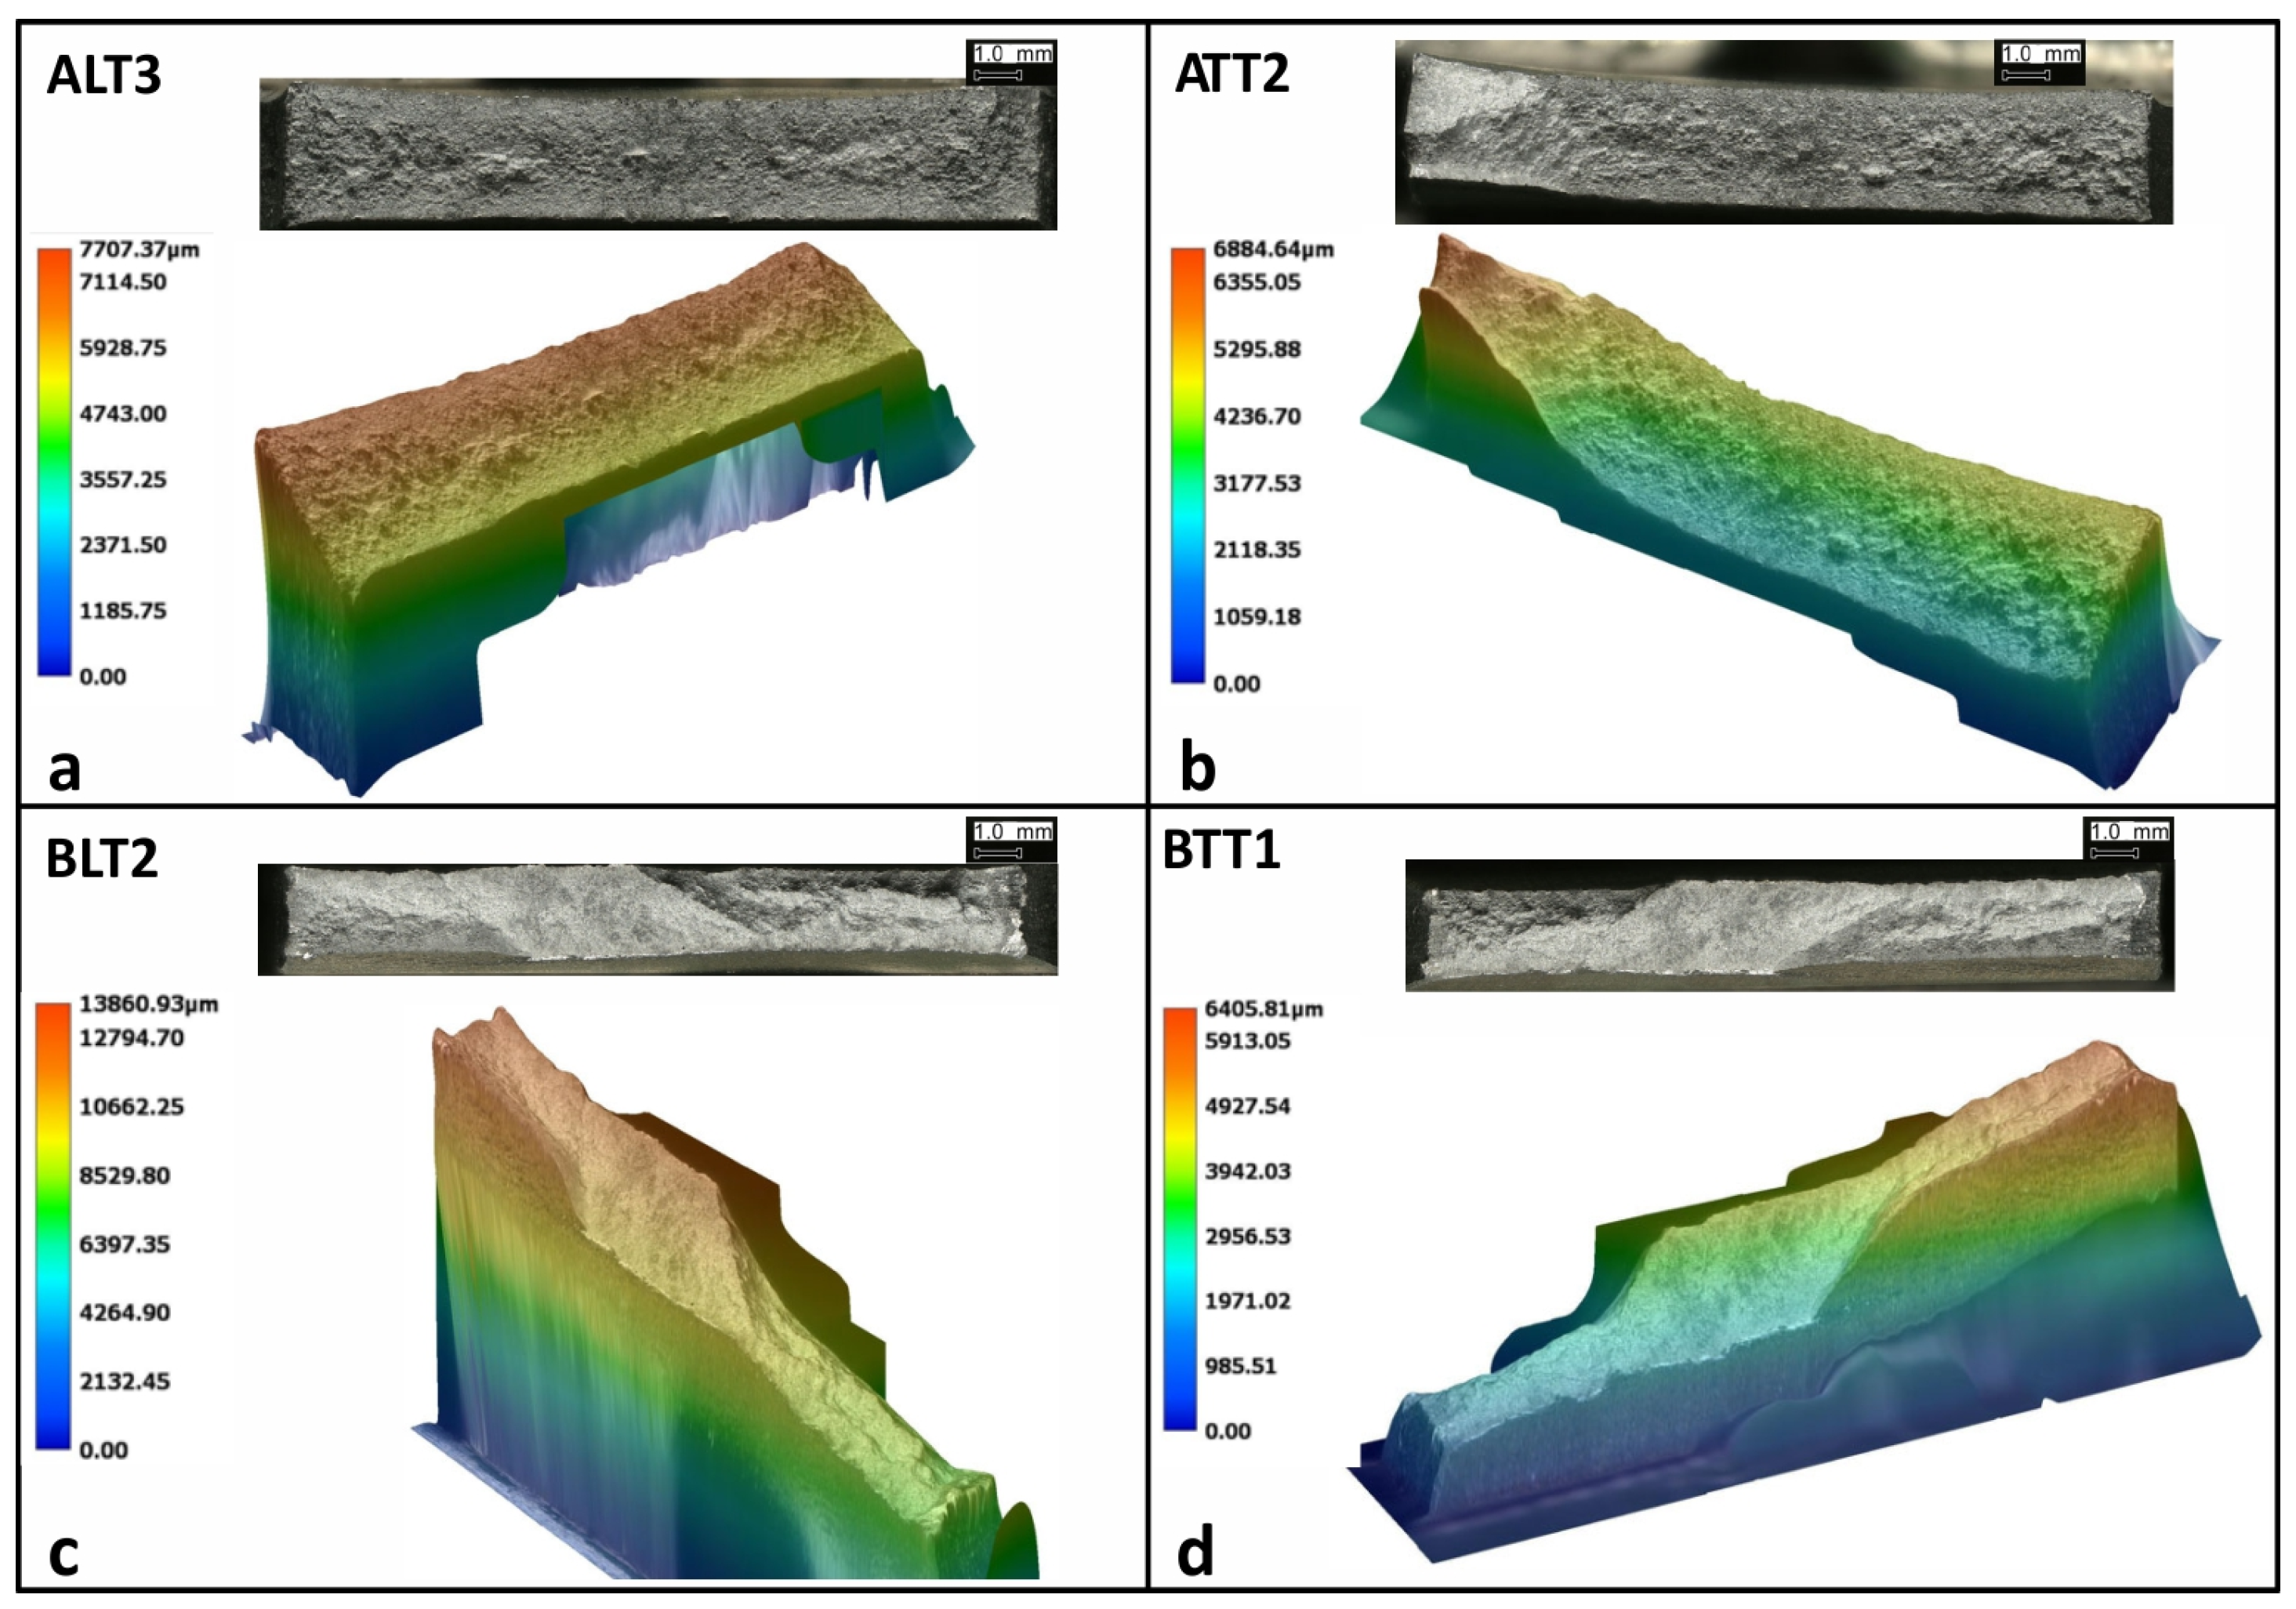
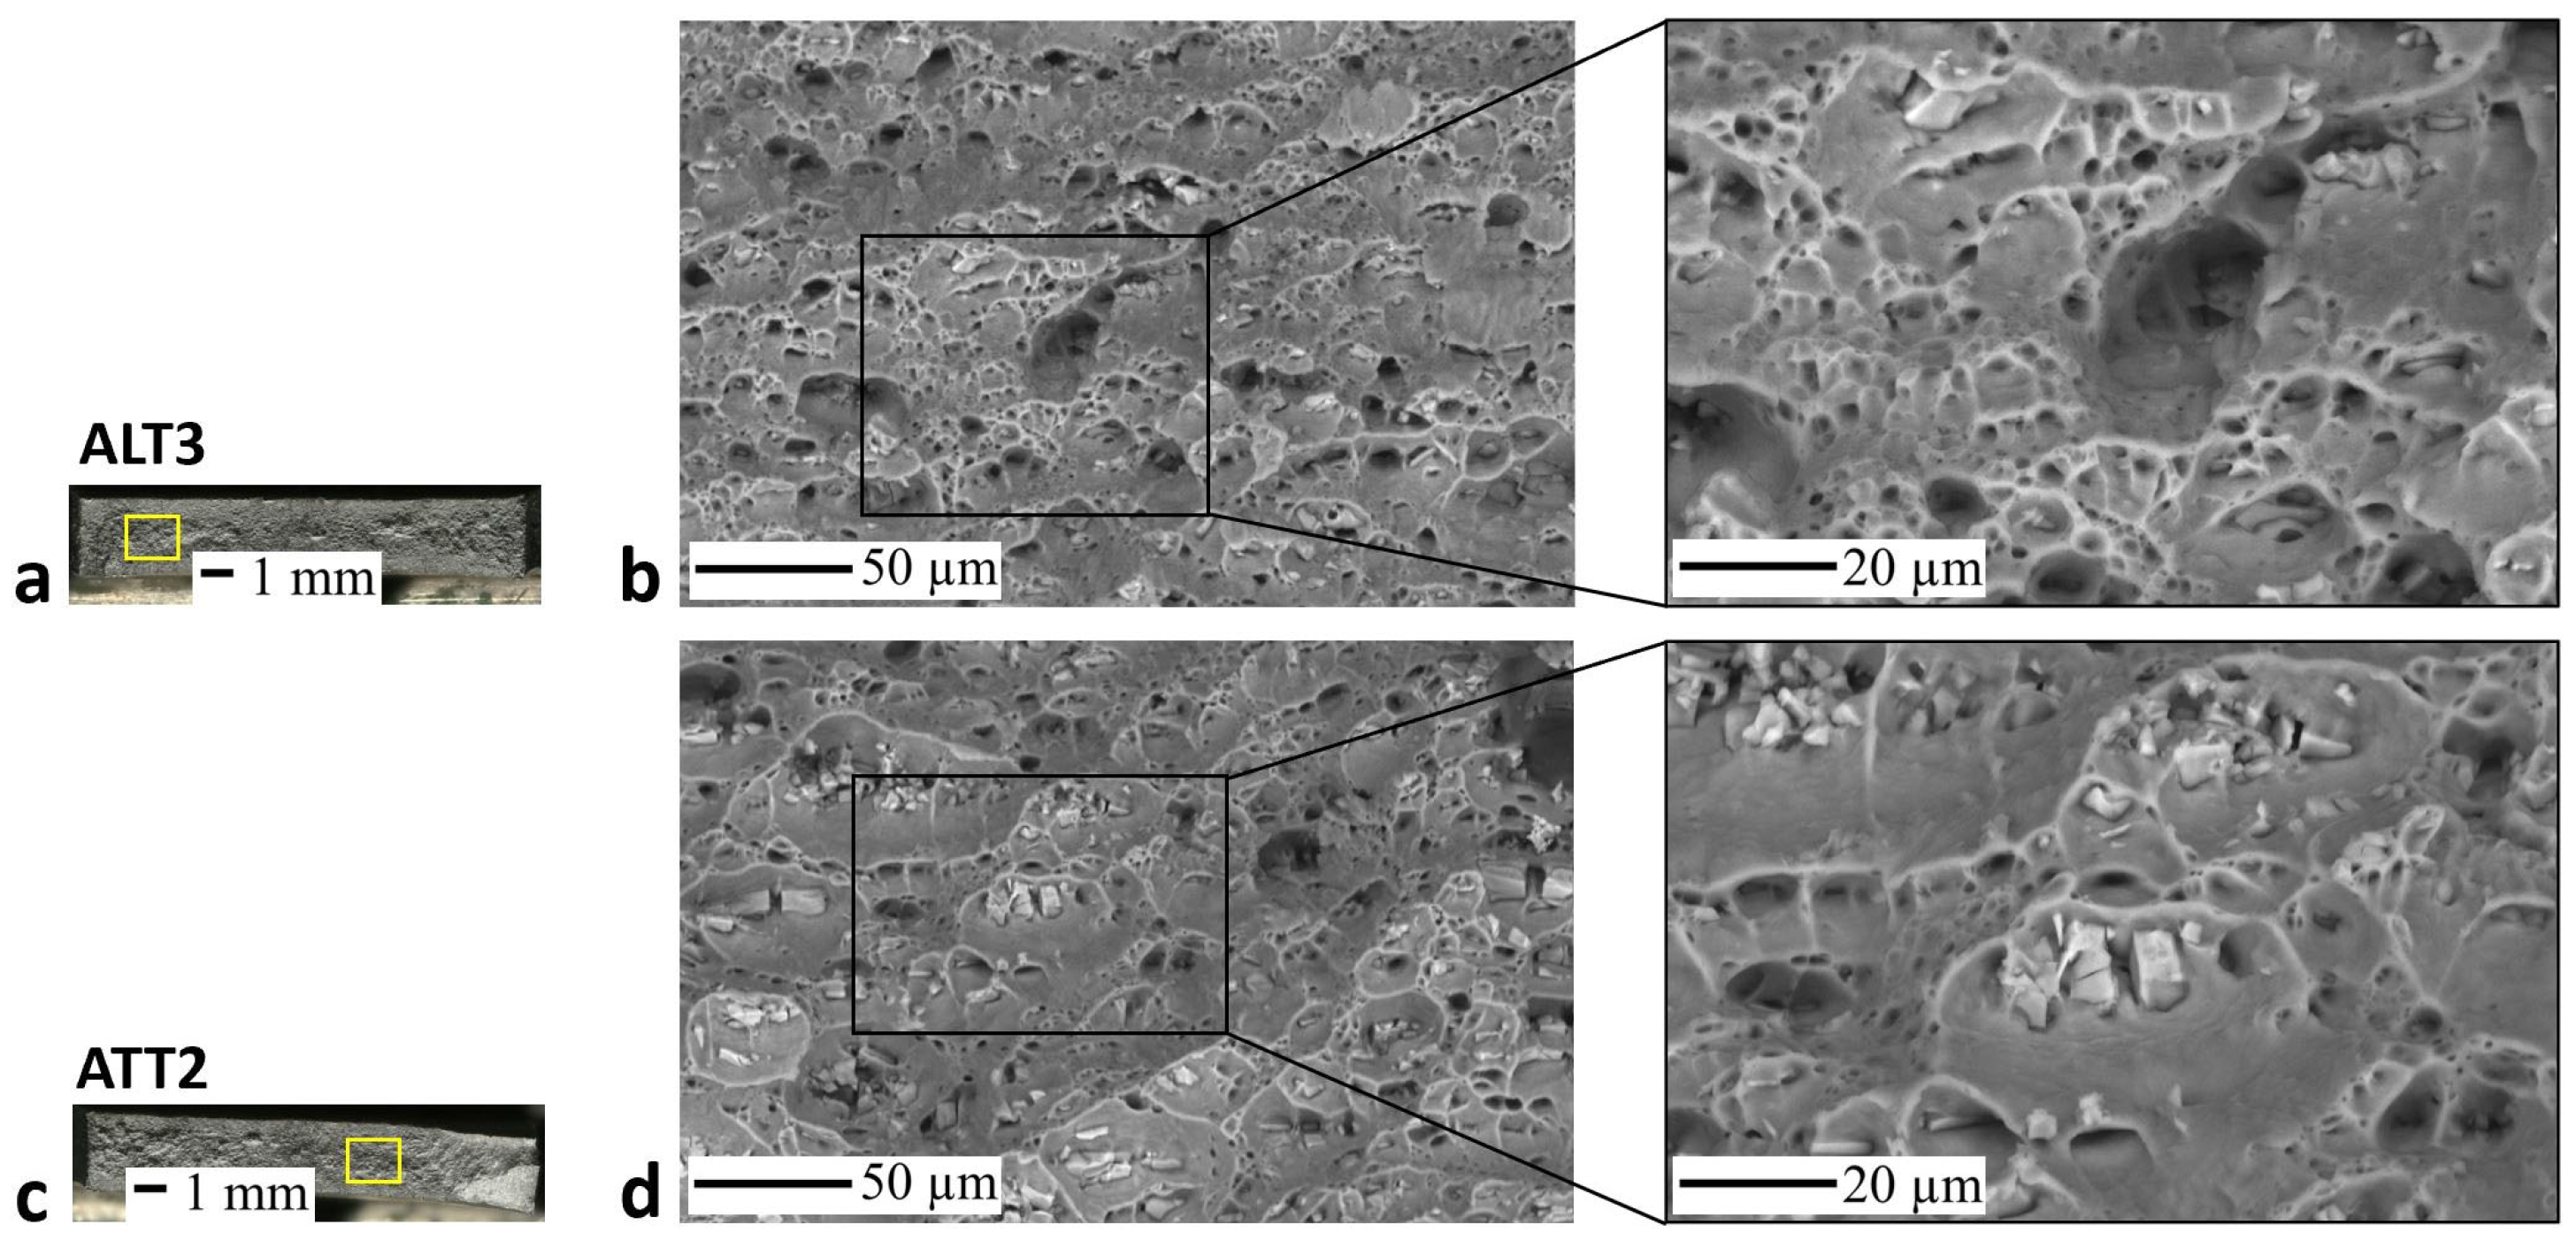
The appearance of the fracture surface depends on the mechanism of the formation, growth, and merging of microcavities. In the case of a ductile fracture, the surface relief is a set of small pits in which the particle where the pit formation begins is clearly visible. Micropits are formed in areas of localised interruption of the stress propagation, such as, e.g., a second phase particle, inclusion, grain boundary, or dislocation pile-up [56]. In the case of a brittle fracture, lamellae or steps are visible on the fracture surface, and the surface is smoother with less presence of pits or the absence of pits. A brittle fracture is a low-energy failure that propagates along well-defined low-index crystallographic planes known as cleavage planes. Al-alloys are polycrystalline and contain grain boundaries, inclusions, and dislocations. These defects affect fracture propagation and change the fracture surface to some extent. Sometimes, microconstituents present in the crack path can cause the alloy specimen to exhibit a mixed fracture mode [56]. Additionally, we wanted to determine in detail whether the mechanical properties identified by the tensile test are affected by microstructural elements. Therefore, we performed a detailed topographical analysis of the fractures. Figure 6 shows the optical microscope macro images and 3D topographies of the tensile test fracture surfaces. From the investigation of the fractures, it is clear that fracture is predominantly ductile but includes some local brittle zones that were examined in detail by further SEM analysis. Minimal differences in the longitudinal and transverse directions are visible. In addition, the fracture surfaces of the samples ALT3 and ATT2 were examined by SEM and are shown in Figure 7. Figure 7a,c show the locations of the fractures examined on the samples by SEM. There is a visible difference between longitudinally and transversely rolled specimens. In the longitudinally rolled specimen in Figure 7b, a more ductile fracture was seen, which appears as smaller pits, in contrast to the transversely rolled specimen in Figure 7d, where a less ductile fracture is visible. At the fracture of the longitudinal sample ALT3, the particles of the intermetallic phase were more oriented, with fewer crushed particles. More ductile areas are visible, which indicates a more ductile fracture, and this is also confirmed by the higher elongation values. Mixed shear-tension areas were seen (darker areas), where the ductile structure of the surface was discernible. At the fracture of the transverse sample ATT2, the particles of the intermetallic phase were not oriented clearly and looked like they were inserted into the surface, with more crushed particles than in the longitudinal samples. Fewer ductile regions are visible, indicating a more brittle fracture, and this is also confirmed by the lower elongation values. Particles of the intermetallic phase on which the fracture was initiated are present on all the fracture surfaces.

3.4. Charpy Testing Results

The results of the instrumented Charpy test are shown in Figure 8a–d, where the diagrams of the force are plotted as a function of time F–t and the total energy used for fracture as a function of time E–t. The left side of Figure 8a,c shows the results of the instrumented Charpy test on the 4 mm-thick sheet, while the right side of Figure 8b,d shows the test results on the 3.5 mm-thick sheet. The upper diagrams in Figure 8a,b show the test results on samples with a notch in the longitudinal direction of sheet metal rolling, and the lower diagrams in Figure 8c,d with a notch in the transverse direction of sheet metal rolling. It can be seen from the diagrams that the total energy required for the fracture of samples with a notch in the longitudinal direction (red lines) is greater than for the fracture of samples with a notch in the transverse direction. This is confirmed by the results in Table 7, where it can be seen that the average work required for a break in a thicker sheet in the longitudinal direction is more than 20% greater than the work required for a break in the transverse direction. An even bigger difference is noticeable with the thinner sheet metal, where the work required to break in the longitudinal direction is more than 40% greater than the work needed to break the specimen in the transverse direction. This is the result of the pre-treatment of the metal sheet [39,48,49,50,51,52,53,54,55]. More precise results, where the total energy for fracture is also divided into the energy for initiation (Ei) and energy for propagation (Ep), are given in Table 7.
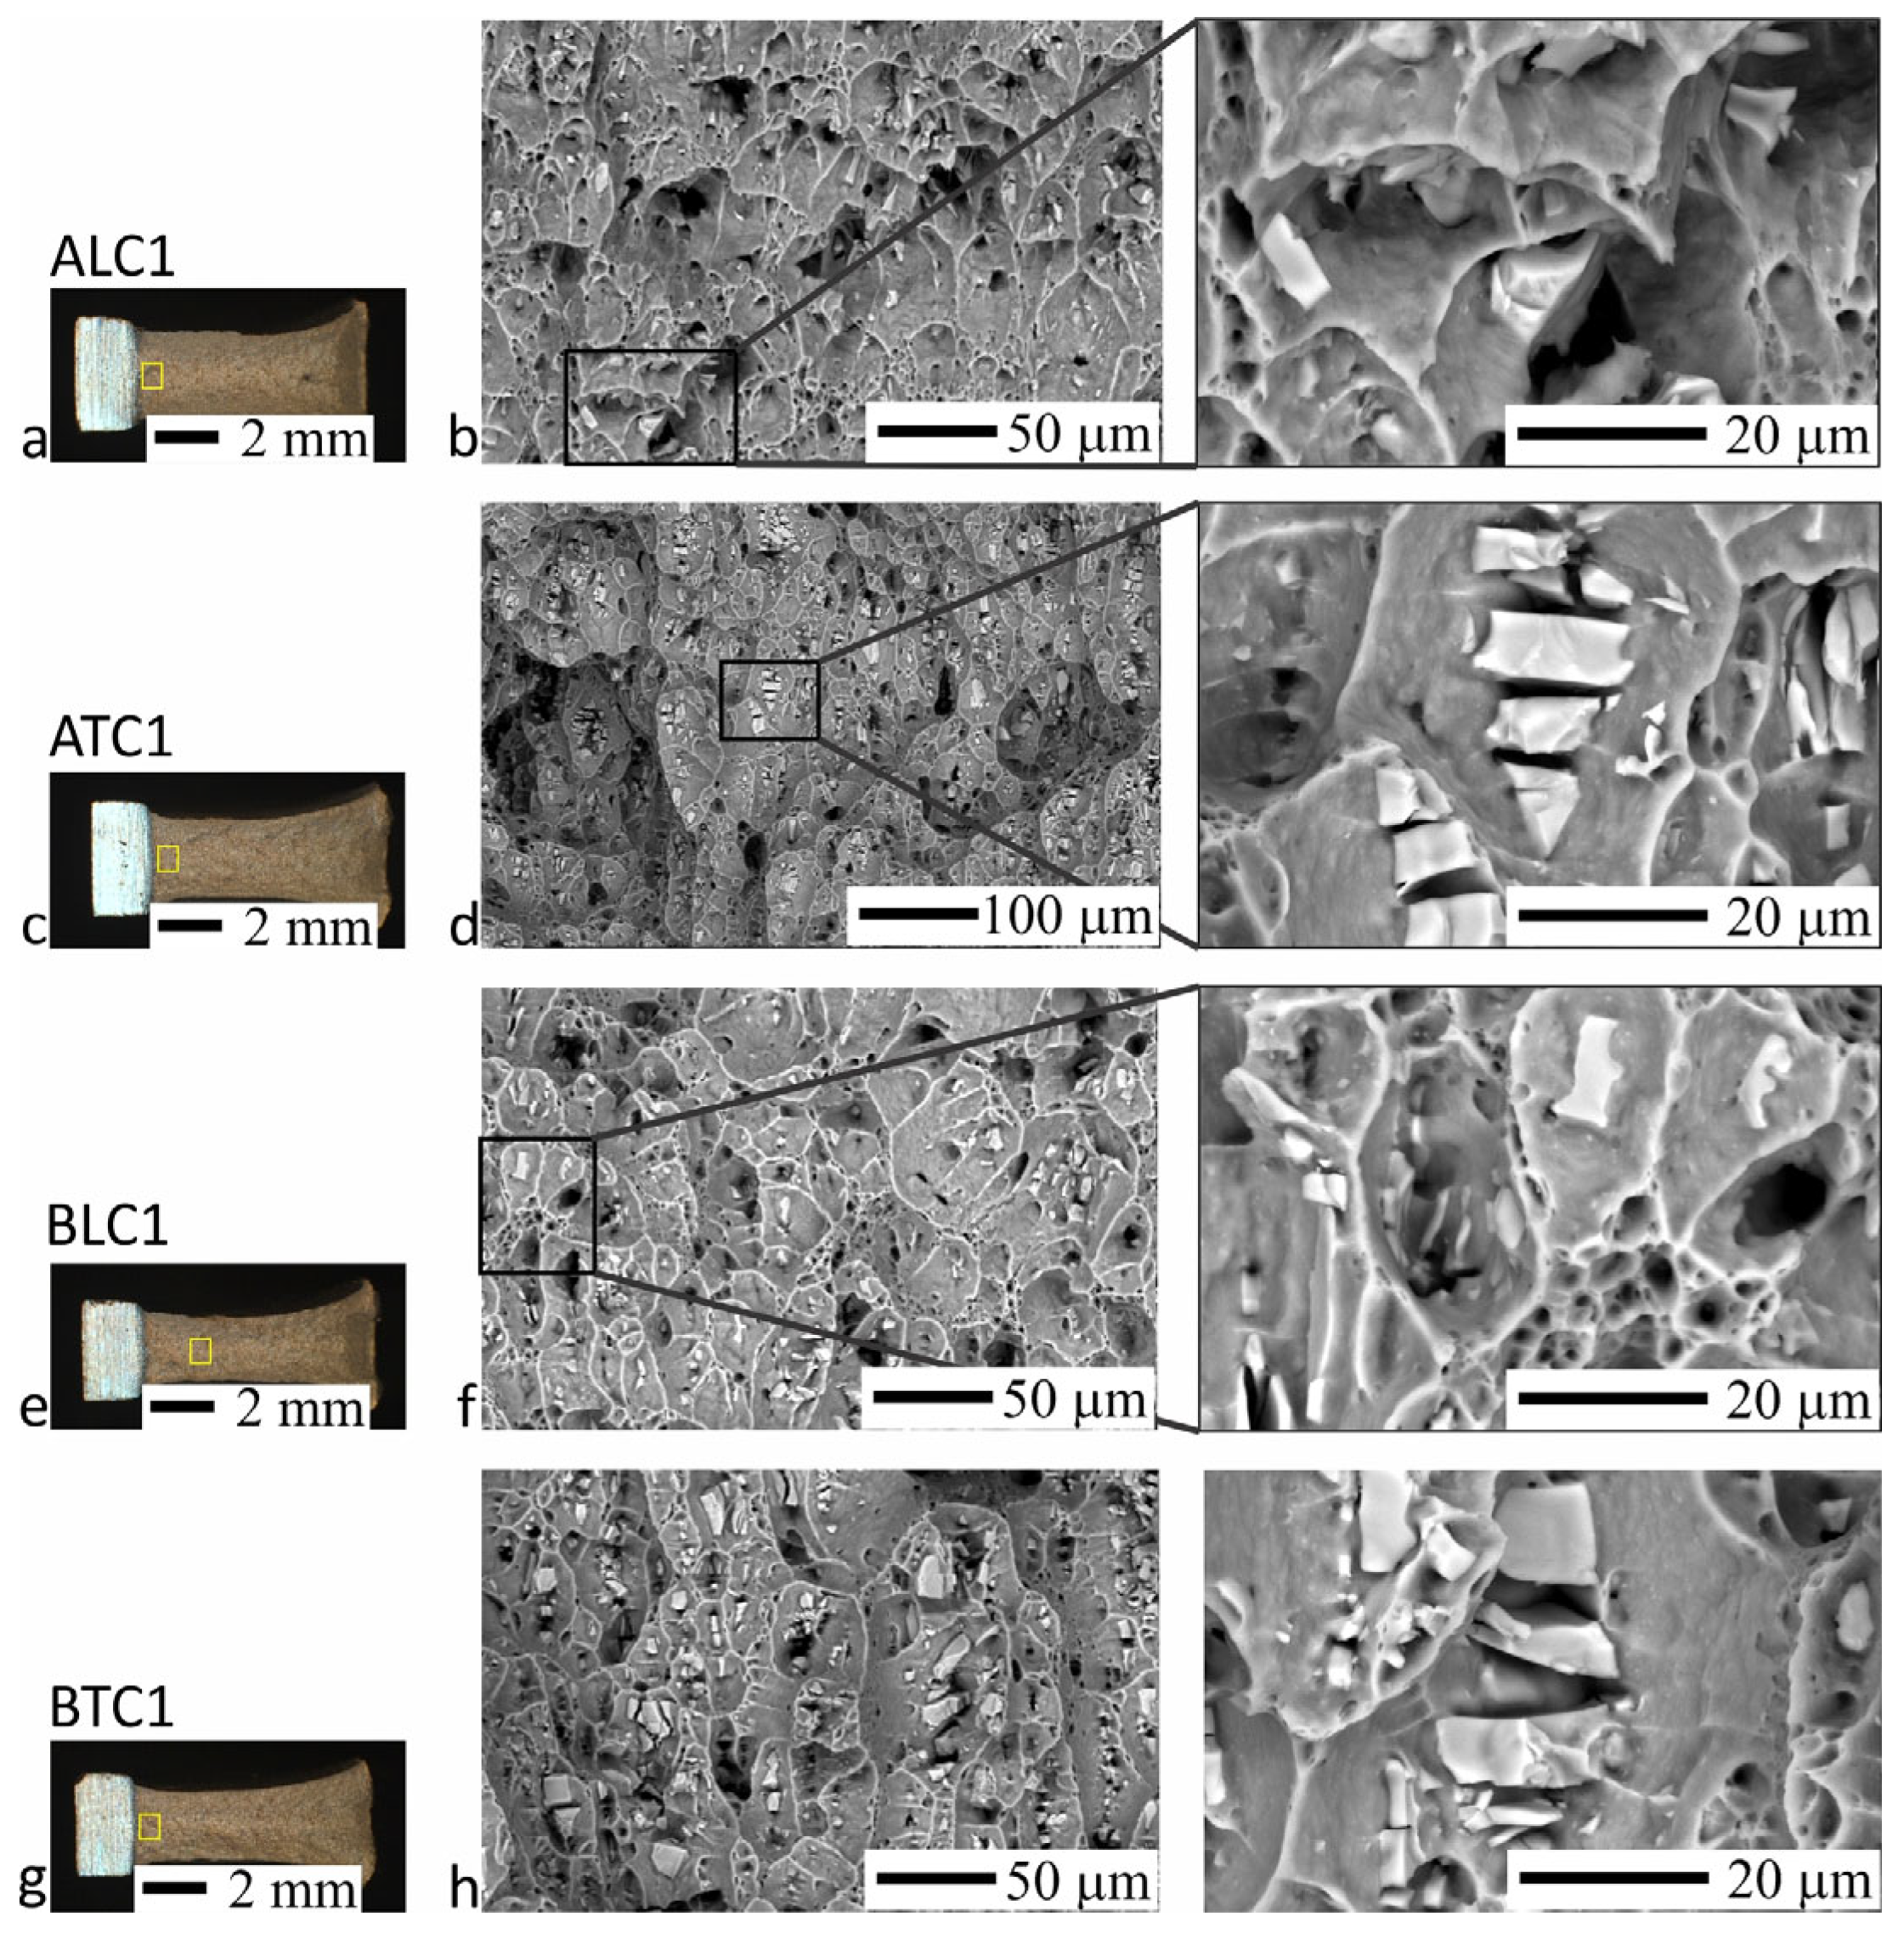
The fractures where the crack started from the notches and the fractures that are about 1 mm away from the notches were inspected carefully. In the fractures of the longitudinal samples, it was observed that the intermetallic particles were mostly intact, but their distribution appeared random—non-oriented, due to the crosswise fracture with respect to the direction of rolling. On the upper part of the fracture (Figure 9a–f), ductile areas can be seen along the edges of the pits, which indicates a better toughness than the samples in the transverse direction. More crushed intermetallic particles were observed at the fractures of the transverse samples, and their distribution appeared to be more oriented in the direction of rolling. On the thinner material (3.5 mm), a linear orientation of the intermetallic phase particles was observed, due to the deeper rolling of the material. On the upper side of the fracture, where the fracture was initiated, larger intermetallic particles can be seen, while lower down, these particles are smaller and more fragmented. In some places, tough areas can be seen between the larger pits. The particles of the intermetallic phase are of different sizes.

3.5. Results of the Fracture Mechanics

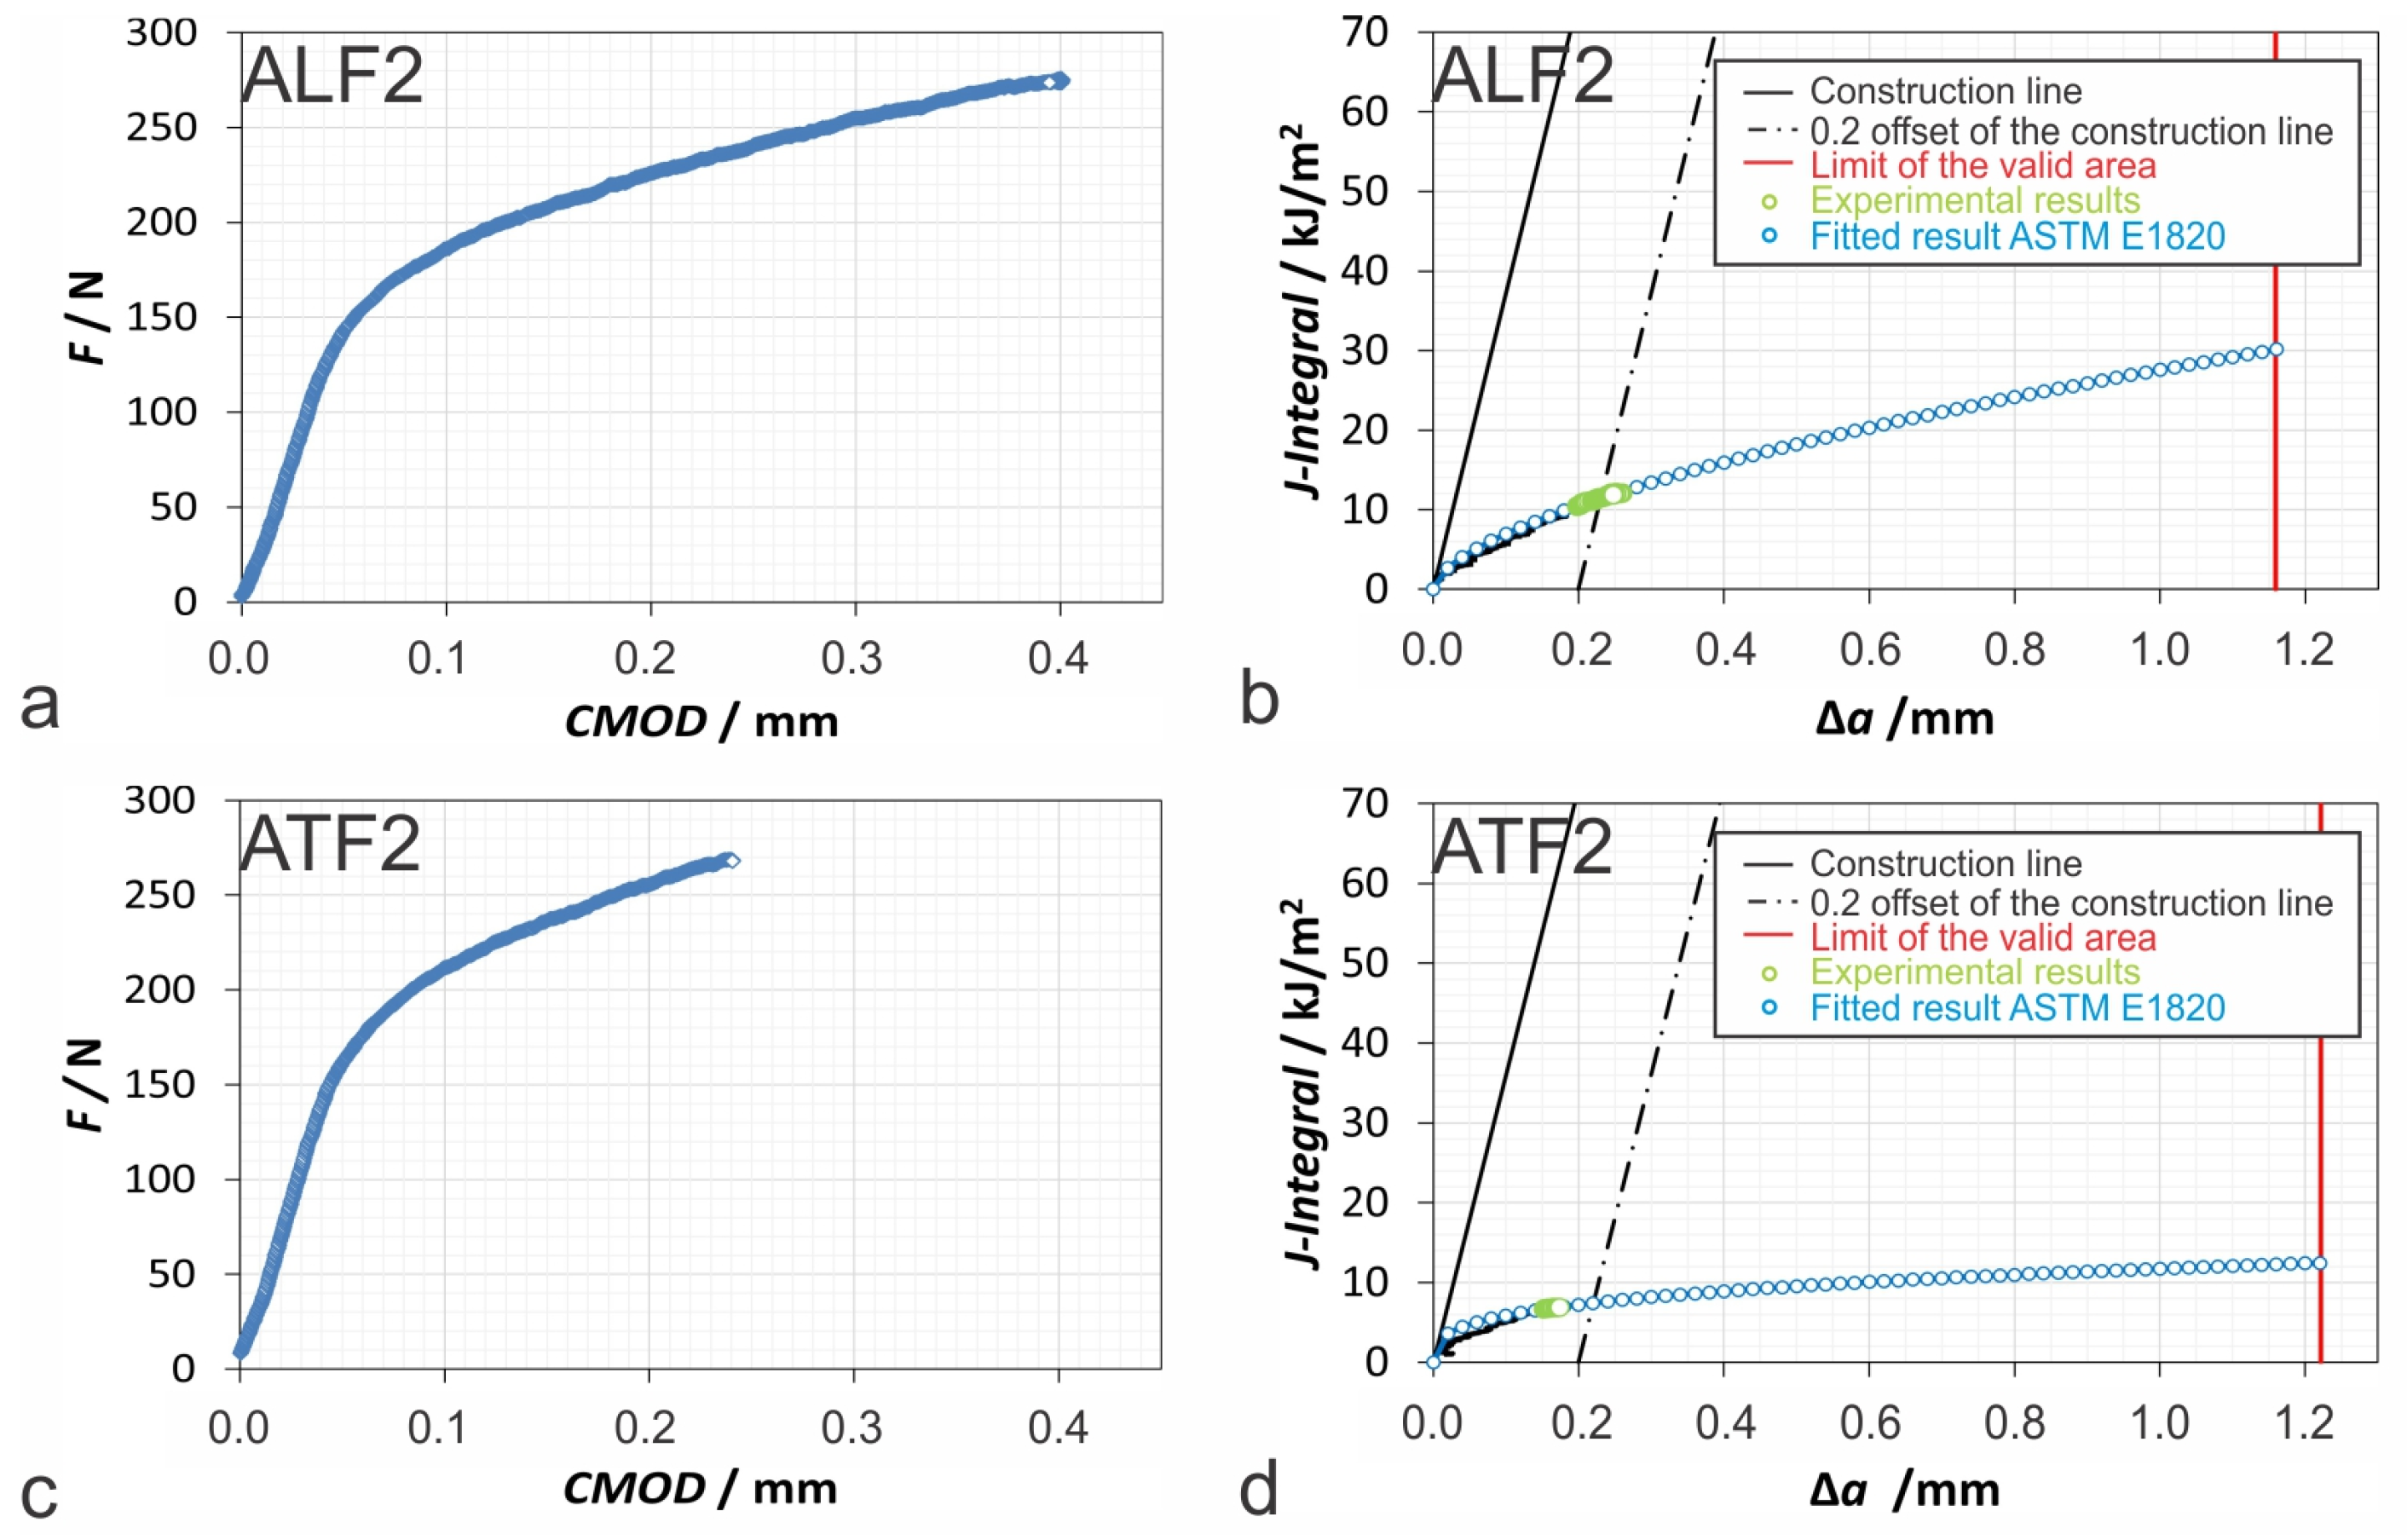
The force/CMOD (crack opening displacement) and resistance curves J∆a were drawn, and these are shown in Figure 10. In Figure 10a, b, the diagrams show the results for the longitudinally rolled specimen, while Figure 10c,d show the results for a transversely rolled specimen. The green marks on the graphs b and d are the experimental results, continued by a fitted curve according to the normalisation method.
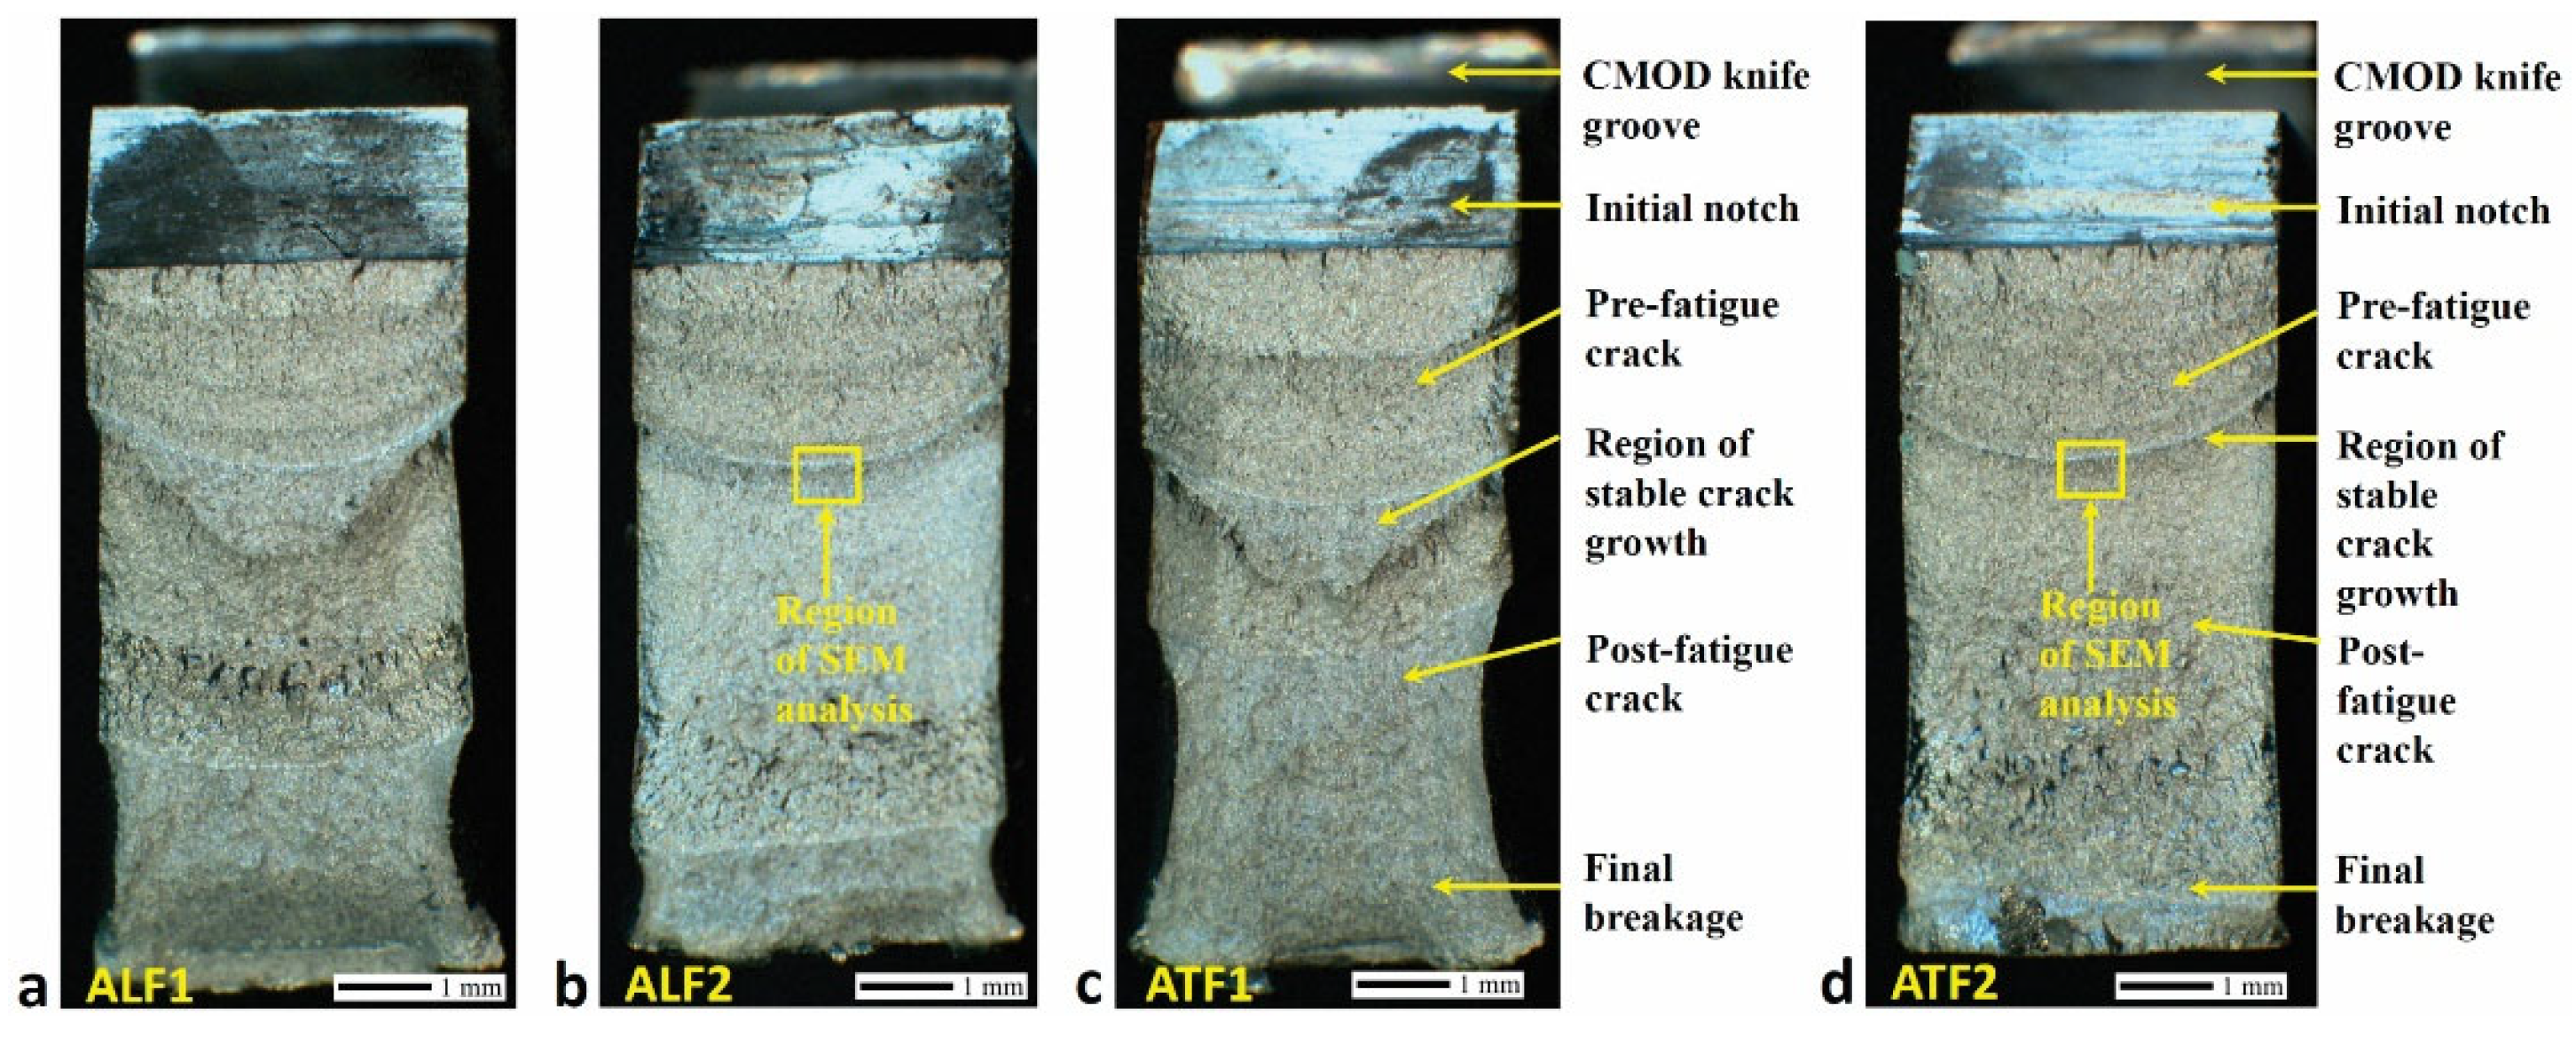
All the SENB fractures of the test specimens are shown in Figure 11a,b, where the morphology of the fracture is indicated with marked initial cracks, stable crack growth, and the final fracture. All of the surfaces were analysed carefully by SEM. The images of the SEM analysis are shown in Figure 12a–f.
The critical value of the J integral (fracture toughness) JIC was defined according to the ASTM E1820 standard [37] as the intersection of the resistance curve J–∆a and the parallel of the construction line that intersects the x axis as the crack dulls; ∆a was 0.2 mm [37,56,57,58,59,60]. Then, it was extended and closed simultaneously. From the diagrams in Figure 10b,d, we can see that the fracture toughness of the material n was about 50% higher in the longitudinally rolled sample.
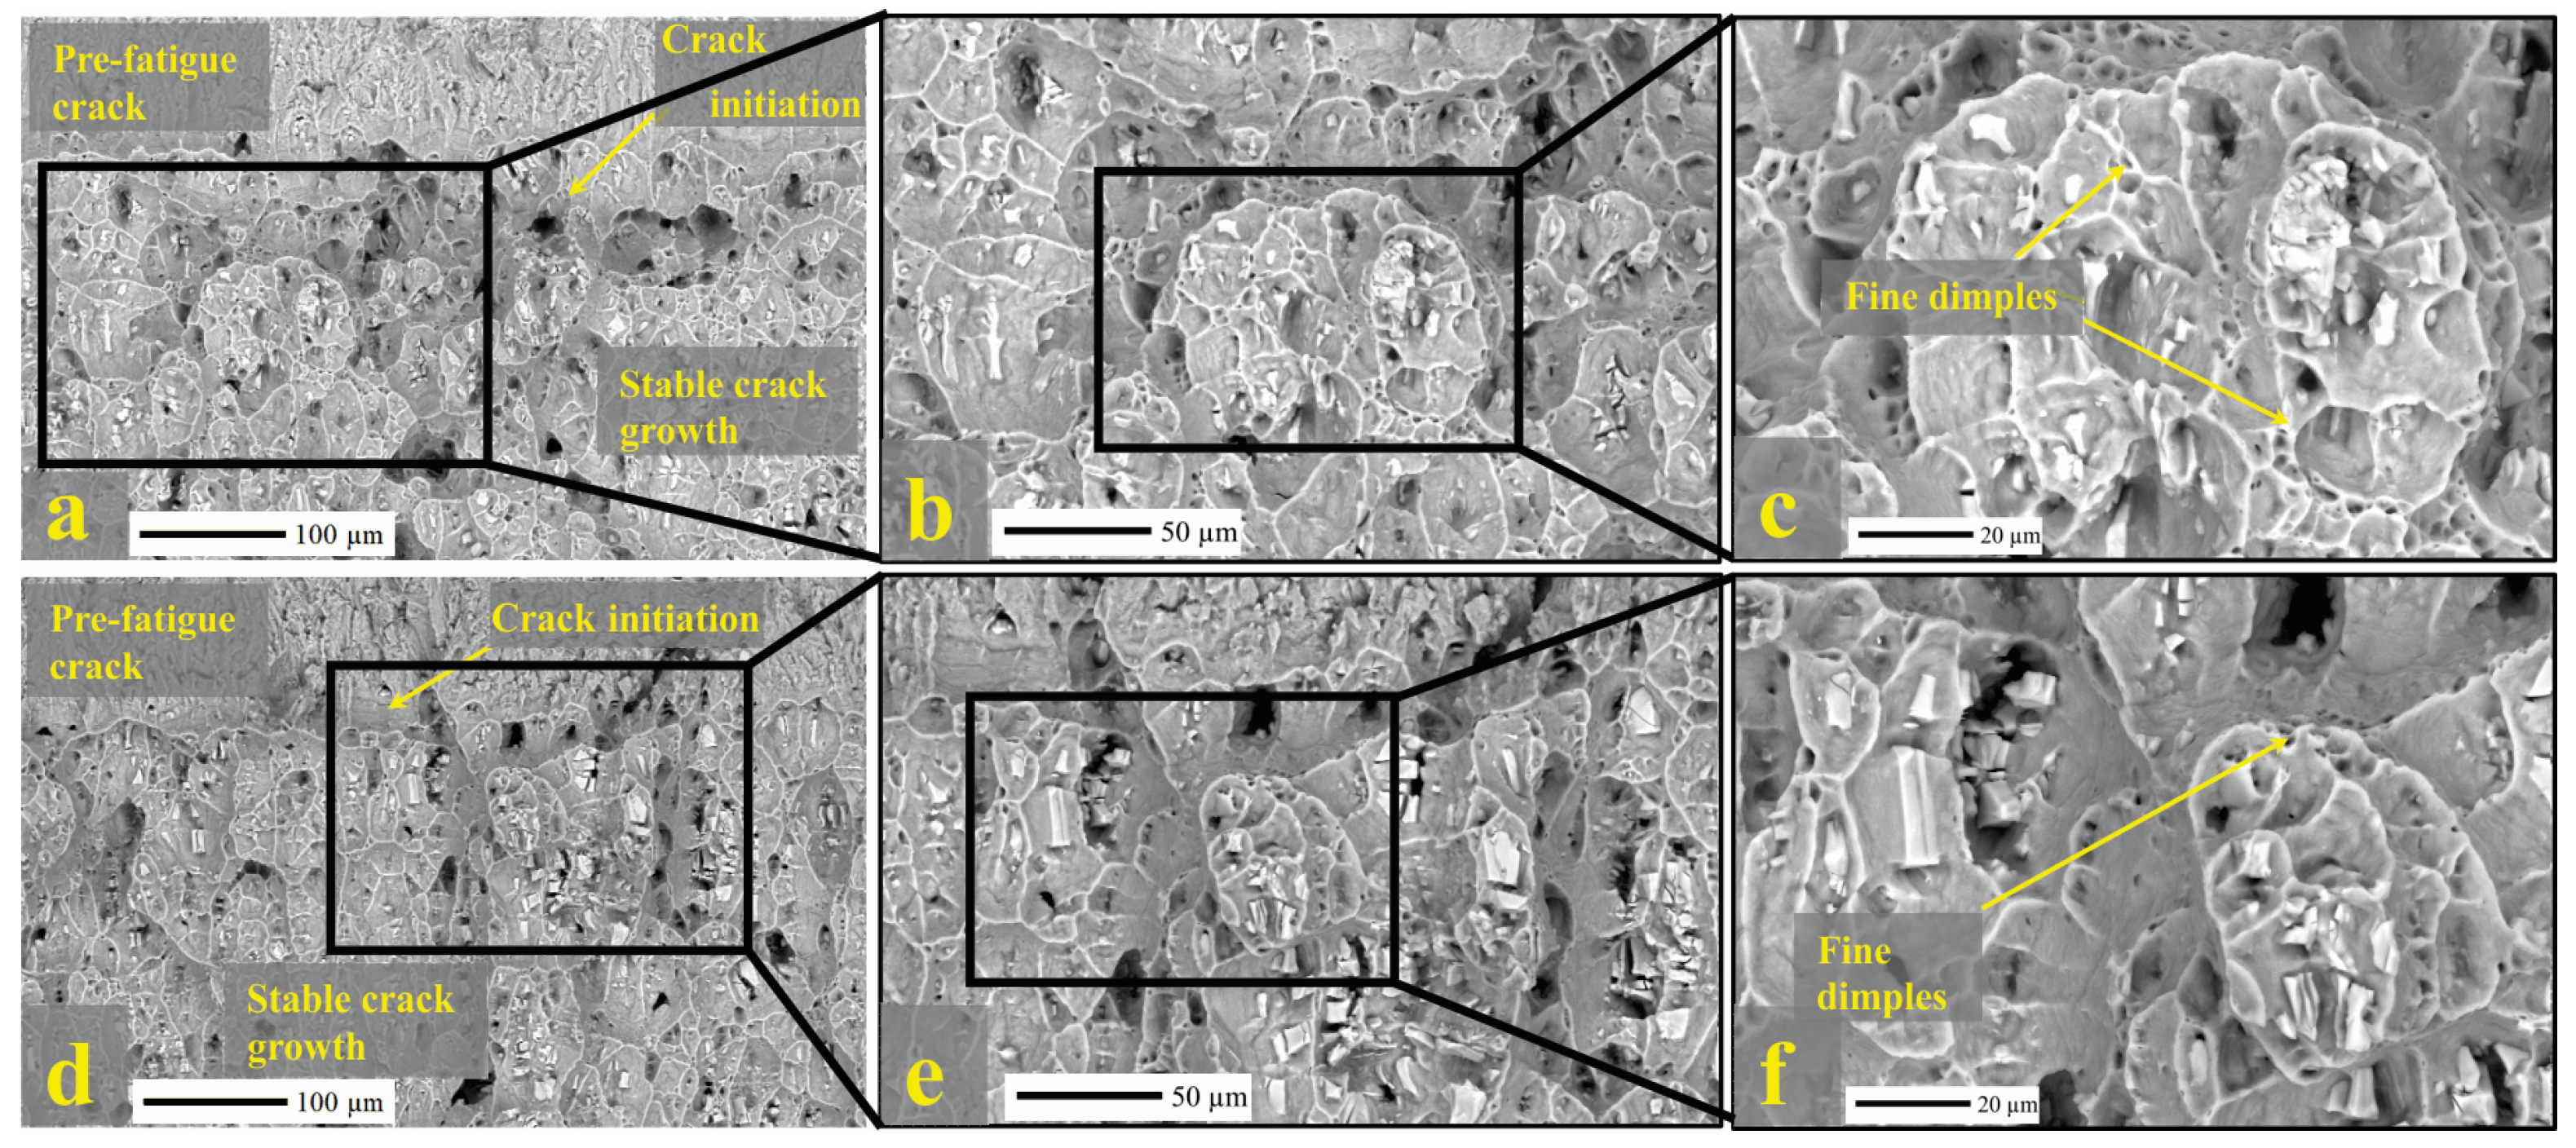
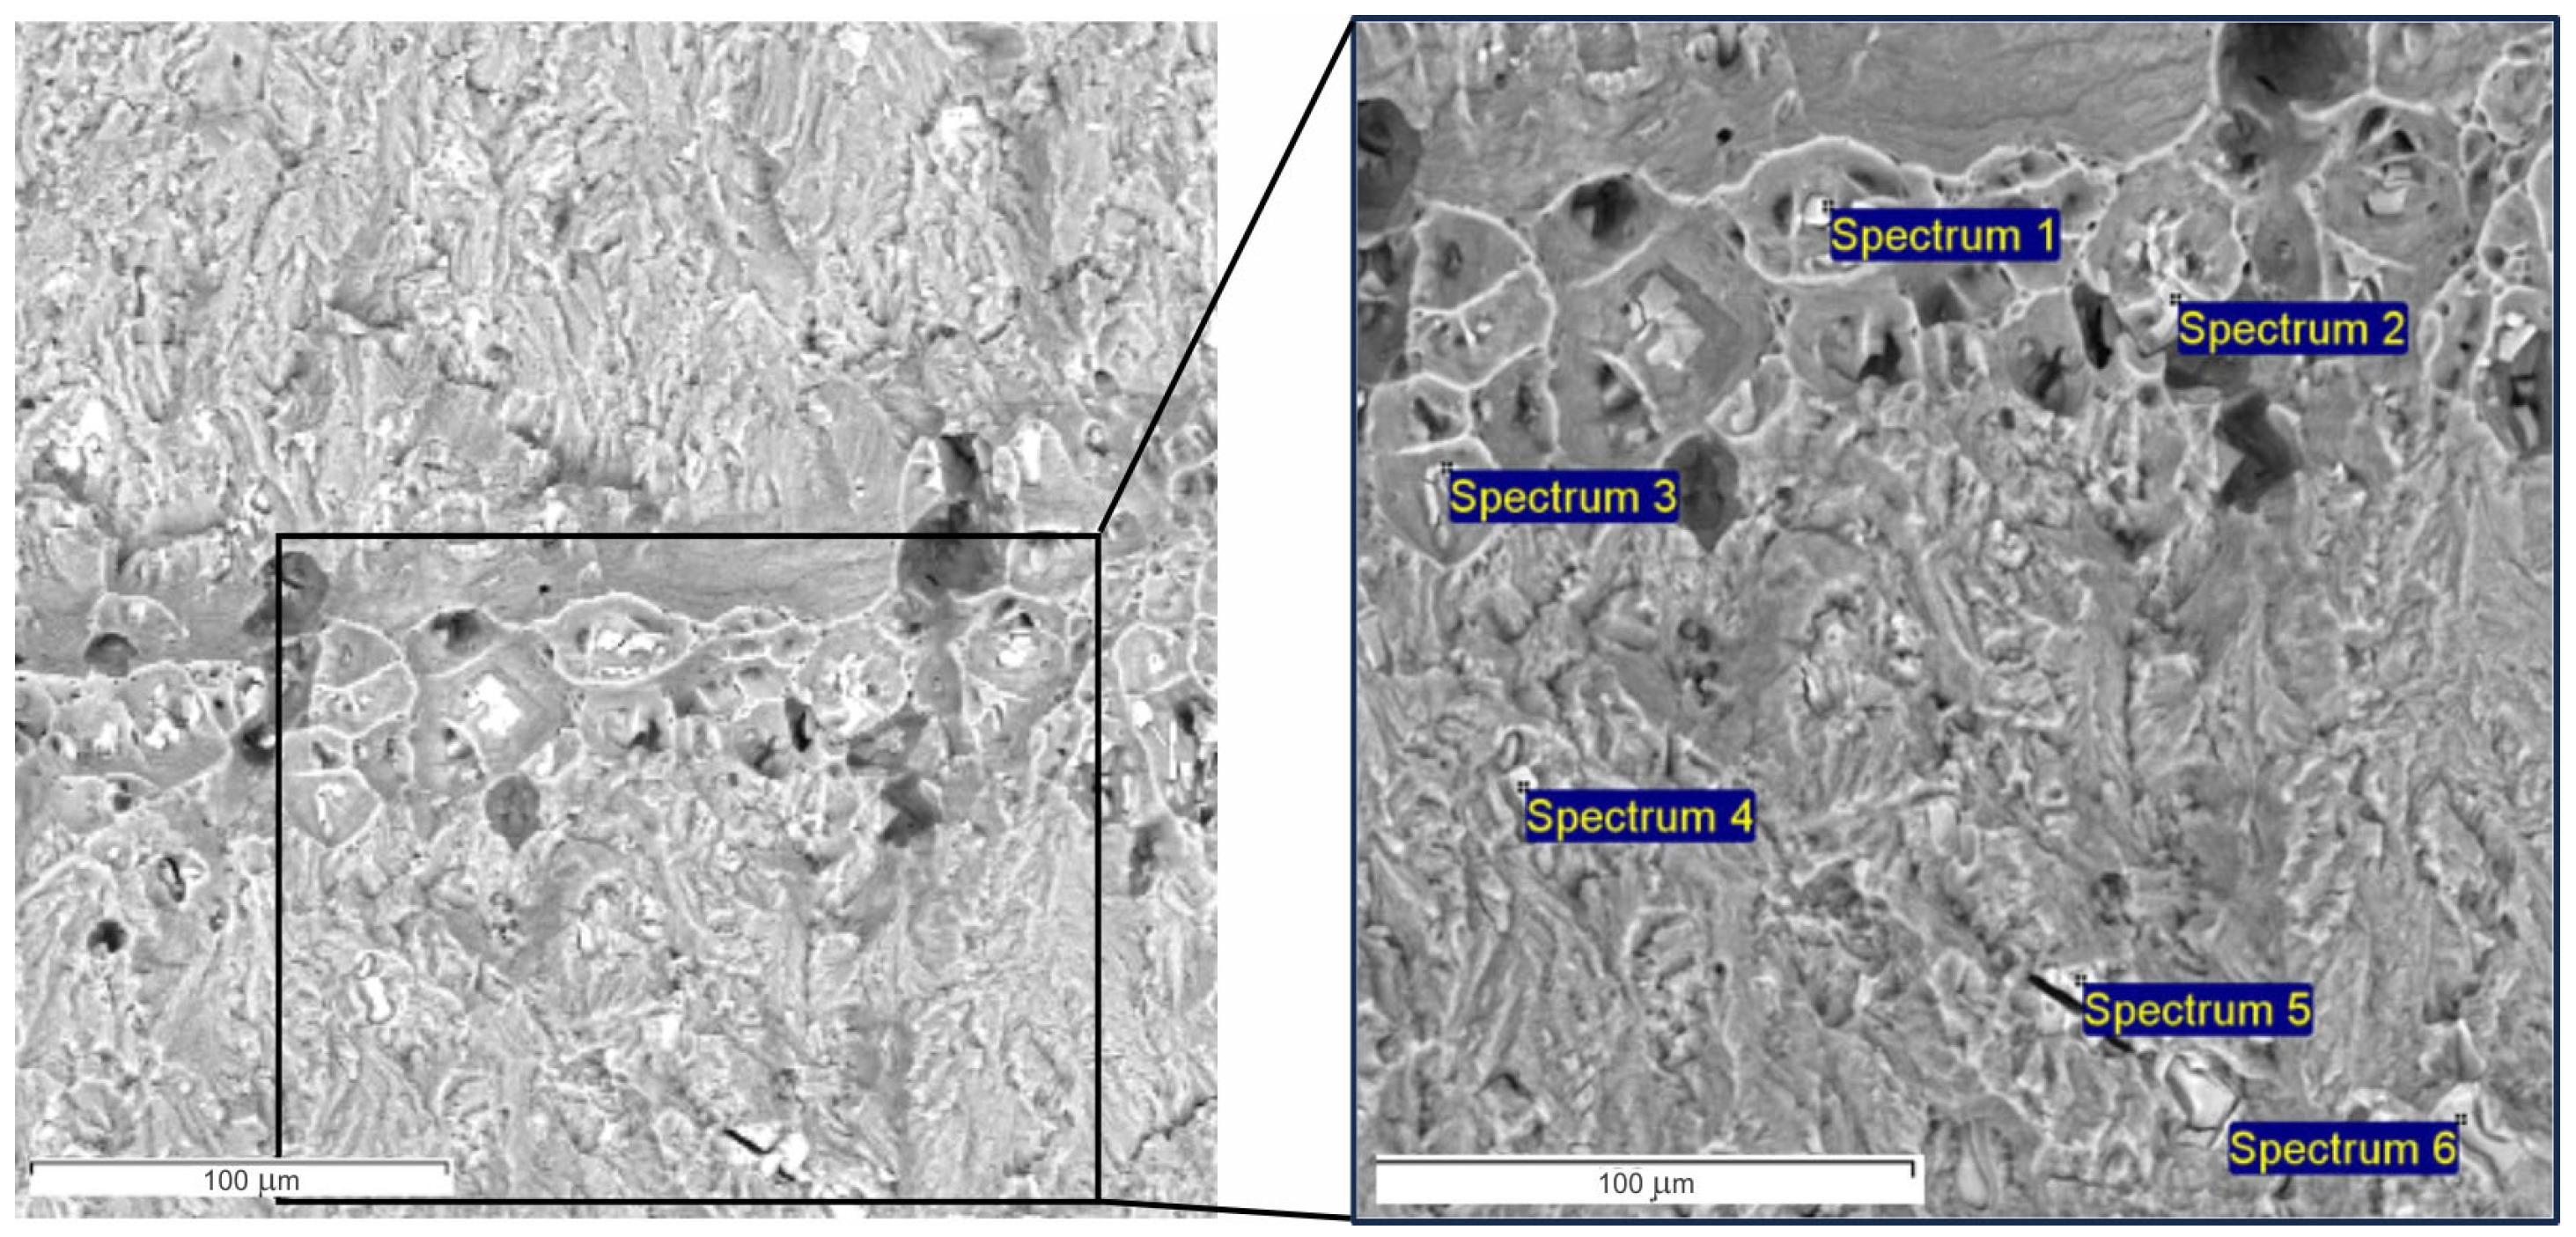
Figure 11 shows different areas of crack growth, which are mutually delimited by the crack growth fronts. In Figure 11c,d, the arrows indicate the different areas of fractures caused by different load regimes from the initial notch: a crack caused by pre-fatigue, where different fatigue parameters are used; a stable crack growth caused by a quasi-stationary force loading test; and a crack which was formed by fatigue after the experiment with the purpose of marking the crack. At the end, there was the final break of the sample. Crack initiation started in the middle of the specimen from a pre-fatigue crack. The crack progressed symmetrically with respect to the middle of the specimens. In the specimens in Figure 11a,c, the length of stable crack growth is greater than in the specimens in Figure 11b,d. The places of crack initiation were analysed with SEM in more detail, which are shown in Figure 12. Figure 12a–c show the place of crack initiation on the ALF2 sample, and Figure 12d–f show the place of crack initiation on the ATF2 sample at different magnifications. As in the fractures with the Charpy hammer, particles of the intermetallic phases Al6(Mn,Fe) were also noticeable on these fractures. EDX analysis was performed, to confirm the intermetallic phase, presented below.
Zhu et al. [61] investigated the formation mechanism of the intermetallic phase Al6(Mn,Fe) in the casting of Al–Mg alloys, where it was indicated that Al6(Mn,Fe) is the dominant metastable phase in contrast to the stable phase Al13(Mn,Fe)4. The experimental data of their research confirmed that the addition of Mn in the alloy inhibits the transformation of the metastable phase Al6(Mn,Fe) into the stable phase Al13(Mn,Fe)4 under non-equilibrium solidification conditions. Using EDS analysis of the precipitated particles, they discovered that the average Mn/Fe atomic ratio in the Al6(Mn,Fe) phase decreases as the Mn/Fe atomic ratio decreases in the melt. They also discovered that the Al6(Mn,Fe) phase grows to form two elongated prismatic morphologies: a rhombic prism and a rectangular prism. The primary phase, Al6(Mn,Fe), shows a hollow structure, and the eutectic phase is in the form of fine solid particles.
The presence of the intermetallic phase Al6(Mn,Fe) was also demonstrated in the research and simulations by Engler et al. [7]. The calculated composition of a typical Al-alloy AA5454 is shown in the Al-rich corner of the Al–Fe–Mn–Si–Mg phase diagram as a function of Mg.
The condition of the intermetallic particles at the fractures of the mechanical SENB test specimens differs from the previously described intermetallic particles of the Charpy hammer fractures. As we assumed that the properties of the material differ in different directions due to the anisotropy of the material, tests were carried out on specimens in the longitudinal and transverse directions with respect to the direction of rolling [62]. On the longitudinal samples, crushed particles of the second phase were visible, while, on the samples in the transverse direction, the particles of the second phase were mostly intact. Rolling during material fabrication created a stretched texture of oriented [48,49,50,51,52,53,54], compressed intermetallic particles, which were reduced by rolling [55]. The additional resistance of the intermetallic particles to crack growth in a longitudinally oriented pattern contributes energy that inhibits the crack effectively. In the cross-oriented sample with respect to the rolling, however, the crack mostly bypasses the intermetallic particles, and, therefore, this structure is more fragile.
The SEM fracture images of the sample in the longitudinal direction are shown in Figure 12a–c. Figure 12d–f show the SEM fracture images of the sample in the transverse direction. The left of Figure 12a,d shows the areas of initial crack, crack initiation, and stable crack growth. It can be seen from the images that there are more fine pits on the longitudinal samples, which indicates a tougher fracture and higher ductility than the samples in the transverse direction of rolling.

3.6. EDX Analysis of Sample Fracture Surfaces for Fracture Mechanics

EDX chemical analysis was performed on two samples, namely, on the ALF2 sample in the longitudinal direction and on the ATF2 sample in the transverse direction. Figure 13 shows the locations of the EDX analysis of the ALF2 sample (the SEM image capture location is marked in Figure 11b), and Figure 14 shows the locations of the EDX analysis of the ATF2 sample (the SEM image capture location is marked in Figure 11d). The normalised results of the EDX point analysis of selected sites or particles of the second phase are shown in Table 8 for the ALF2 sample and Table 9 for the ATF2 sample. Due to the surrounding Al-matrix, the size of the analysed particles and the nature of the analysis performed, the Al values are higher than the actual chemical composition of these particles [7]. In all the analysed sites of both samples, the content of Mn and Fe is increased which indicates particles of the intermetallic phase Al6(Mn,Fe) [1,5,61].
The revealed microstructure is practically single-phase as α-aluminium with more than 97.4 surface area, and Al6(Mn, Fe) and Mg2Si phases are also present [29]. In this research, no Mg2Si phase inclusions were detected on the fracture surfaces because only SEM fractography analysis and point EDX analysis were performed. Because of this, the presence of a Mg2Si phase was not detected. Further research on a TEM microscope would be needed to confirm this phase.
The results of HV5 indicate that the Al-alloy surface is different in hardness, depending on the conditions of the previous mechanical processing. Research by Xiangzhen Zhu et al. showed that the Al6(Mn,Fe) phase has different morphologies and sizes, which is a consequence of the Fe content [61]. Through tests and analyses, it was established that the orientation and distribution of the intermetallic phases affect the properties of the material significantly in relation to the direction of rolling. The thickness of the material also has an influence on the individual properties of the material. From the different modes of fracture (the tensile test compared to the Charpy impact test) and crack propagation, it can be seen that the intermetallic particles behave differently in terms of the mode and rate of deformation or the failure of the test specimens. In the tensile tests, crushed intermetallic particles were seen, while in the Charpy test these particles were crushed to a lesser extent, but mostly the intermetallic particles remained intact, due to the high rate of collapse. In the fracture mechanical SENB tests, the intermetallic particles were crushed, due to the long impact on the material and resistance to crack growth. All the results of the performed tests indicate that the influence of the time of application of the external force is not negligible. Due to the different temporal action of the external force, the correct orientation of the particles of the intermetallic phase with respect to the direction of rolling is important.
The intermetallic phases listed above have an evident effect on the mechanical properties of the base material, depending on their orientation, so it is important to take this into account in the construction and production of transformed and welded parts [18], as this affects the properties of the final product. The aluminium alloy EN AW-5454 belongs to the alloys that are hardened by kneading. With the input of energy during welding, the structure of the material loosens in the heat-affected area [5,7]. During the welding itself, it will be necessary to pay attention to the lowest possible energy input [19,63] in order to preserve the properties of the base material, but still sufficient to meet the load-bearing requirements of the welded joint. In further research, it will be necessary to pay attention to the heat-affected zone [23], the area of joining the filler and basic material [25], and the equiaxed grain zone (EGZ) [21]. It will also be important to avoid the occurrence of welding defects, as these have a significant impact on the load-bearing capacity and safety of welded joints [27].

4. Summary and Conclusions

A precise characterisation was performed of two Al-alloy EN AW-5454 metal sheets with thicknesses of 3.5 mm and 4 mm. The key findings of this characterisation are as follows.
  • On average, the measured hardness on the thinner sheet was 5% higher than the measured hardness on the thicker sheet.
  • In the tensile testing, the longitudinal elongation of the thicker sheet was 11.5% greater than the transverse, and the longitudinal elongation of the thinner sheet was 0.7% greater than the transverse.
  • Examined fracture surfaces show that the fractures are predominantly ductile but include some small local brittle zones.
  • In the Charpy tests, the average work needed to break a thicker plate in the longitudinal direction was more than 20% greater than the work needed to break it in the transverse direction. In the case of the thinner sheet metal, the work required to break the specimen in the longitudinal direction was more than 40% greater than the work required to break the specimen in the transverse direction.
  • In the Charpy tests, the intermetallic particles in the longitudinal samples were mostly intact, their distribution appeared random, and the upper part of the fracture showed tough areas along the edges of the pits, which indicates a better toughness than the tests in the transverse direction. More crushed intermetallic particles were observed at the fractures of the transverse samples, and their distribution appeared to be more oriented in the direction of rolling. This is reflected in the higher energy required for fracturing, which will be used in the future by the appropriate orientation of the sheet metal according to the direction of rolling in laser hybrid welding of subassemblies.
  • The critical size of the JIC integral, as well as the fracture toughness of the longitudinally rolled SENB specimen, was about 50% greater than that of the transverse specimen. This was also confirmed by the higher resistance curve J–∆a.
  • The state of the intermetallic particles on the mechanical SENB fractured surfaces was different from the intermetallic particles in the Charpy hammer fractures. On the longitudinal samples, the particles of the second phase were crushed, while the particles of the second phase on the samples in the transverse direction were mostly whole. The texture on the thinner sheet was stretched and oriented with more compressed intermetallic particles, which were smaller than on the thicker sheet.
  • Particle resistance to crack growth in the longitudinal SENB specimen contributed to the energy that inhibited the crack. We will try to take advantage of this by properly orienting the sheet metal according to the direction of rolling in the preparation of welded joints.
  • The performed EDX analysis showed an increased content of Mn and Fe at all the analysed points of the sample fracture surfaces, indicative of the intermetallic phase particles Al6(Mn,Fe). The analysed microstructure was a single-phase α-alumina with present phases of Al6(Mn, Fe) and Mg2Si.
From the above findings, we can conclude that the thickness of the material and the direction of rolling affect the material properties of the Al-alloy significantly, due mainly to the size, shape, orientation, and arrangement of the Al6(Mn,Fe) intermetallic phase particles.

Author Contributions

Conceptualisation, M.B., T.V. and R.R.; methodology, M.B., T.V. and R.R.; software, P.M.; validation, T.V. and R.R.; formal analysis, T.V. and P.M.; investigation, M.B., T.V., P.M. and R.R.; resources, R.R.; data curation, P.M.; writing—original draft preparation, M.B., T.V., P.M. and R.R.; writing—review and editing, T.V. and R.R.; visualisation, P.M.; supervision, R.R.; project administration, R.R.; funding acquisition, R.R. All authors have read and agreed to the published version of the manuscript.

Funding

The APC was funded by the Slovenian Research Agency (P2-0120 Research Programme).

Data Availability Statements

The raw data supporting the conclusions of this article will be made available by the authors on request.

Conflicts of Interest

The authors declare no conflicts of interest.

References

  1. Salej Lah, A.; Vončina, M.; Paulin, I.; Medved, J.; Fajfar, P.; Volšak, D. The influence of chemical composition and heat treatment on the mechanical properties and workability of the aluminium alloy EN AW 5454. Mater. Tehnol. 2021, 55, 709–716. [Google Scholar] [CrossRef]
  2. Volpone, L.M.; Mueller, S. Joints in light alloys today: The boundaries of possibility. Weld. Int. 2008, 22, 597–609. [Google Scholar] [CrossRef]
  3. Sheng, K.; Lu, L.; Xiang, Y.; Ma, M.; Wu, Z. Crack behavior in Mg/Al alloy thin sheet during hot compound extrusion. J. Magnes. Alloys 2019, 7, 717–724. [Google Scholar] [CrossRef]
  4. Mikhaylovskaya, A.V.; Portnoy, V.K.; Mochugovskiy, A.G.; Zadorozhnyy, M.Y.; Tabachkova, N.Y.; Golovin, I.S. Effect of homogenisation treatment on precipitation, recrystallisation and properties of Al–3% Mg–TM alloys (TM = Mn, Cr, Zr). Mater. Des. 2016, 109, 197–208. [Google Scholar] [CrossRef]
  5. Engler, O.; Kuhnke, K.; Hasenclever, J. Development of intermetallic particles during solidification and homogenization of two AA 5xxx series Al-Mg alloys with different Mg contents. J. Alloys Compd. 2017, 728, 669–681. [Google Scholar] [CrossRef]
  6. Hirsch, J. Aluminium Alloys for Automotive Application. Mater. Sci. Forum 1997, 242, 33–50. [Google Scholar] [CrossRef]
  7. Engler, O.; Liu, Z.; Kuhnke, K. Impact of homogenization on particles in the Al–Mg–Mn alloy AA 5454—Experiment and simulation. J. Alloys Compd. 2013, 560, 111–122. [Google Scholar] [CrossRef]
  8. Hirsch, J.; Al-Samman, T. Superior light metals by texture engineering: Optimized aluminum and magnesium alloys for automotive applications. Acta Mater. 2013, 61, 818–843. [Google Scholar] [CrossRef]
  9. García Gutiérrez, I.; Elduque, D.; Pina, C.; Tobajas, R.; Javierre, C. Influence of the Composition on the Environmental Impact of a Casting Magnesium Alloy. Sustainability 2020, 12, 10494. [Google Scholar] [CrossRef]
  10. Kotsikos, G.; Robinson, M.; Zangani, D.; Roberts, J. Investigation of the Weld Unzipping Failure Mode during Collisions of Welded Aluminium Rail Vehicles. Proc. Inst. Mech. Eng. Part F J. Rail Rapid Transit 2008, 222, 59–68. [Google Scholar] [CrossRef]
  11. Parente, M.; Safdarian, R.; Santos, A.D.; Loureiro, A.; Vilaca, P.; Jorge, R.M.N. A Study on the Formability of Aluminum Tailor Welded Blanks Produced by Friction Stir Welding. Int. J. Adv. Manuf. Technol. 2016, 83, 2129–2141. [Google Scholar] [CrossRef]
  12. Leitao, C.; Zhang, B.K.; Padmanabhan, R.; Rodrigues, D.M. Influence of Weld Geometry and Mismatch on Formability of Aluminium Tailor Welded Blanks: Numerical and Experimental Analysis. Sci. Technol. Weld. Join. 2011, 16, 662–668. [Google Scholar] [CrossRef]
  13. Xiao, J.; Wang, G.; Xuan, F.; Tu, S. Correlation between Fracture Toughness and Constraint of Bi-material Interfaces with Different Mechanical Mismatches. Fatigue Fract. Eng. Mater. Struct. 2023, 46, 452–470. [Google Scholar] [CrossRef]
  14. Lin, G.; Meng, X.G.; Cornec, A.; Schwalbe, K.H. The Effect of Strength Mis-Match on Mechanical Performance of Weld Joints. Int. J. Fract. 1999, 96, 37–54. [Google Scholar] [CrossRef]
  15. Casalino, G.; Maso, U.; Angelastro, A.; Campanelli, S.L. Hybrid Laser Welding: A Review. In DAAAM International Scientific Book; Katalinic, B., Ed.; DAAAM International Vienna: Vienna, Austria, 2010; pp. 413–430. [Google Scholar] [CrossRef]
  16. Paul, C.; Nicolae, J. Industrial applications for MSG—Laserhybrid welding process. Rev. Tehnol. Neconv. 2011, 15, 63. [Google Scholar]
  17. Staufer, H. LaserHybrid welding for industrial applications. In Proceedings of the SPIE—The International Society for Optical Engineering, Let. 6346 PART, Gmunden, Austria, 4–8 September 2006. [Google Scholar]
  18. ISO/TR 18491:2015 (E); Welding and Allied Processes—Guidelines for Measurement of Welding Energies. ISO—International Organization for Standardization: Geneva, Switzerland, 2015; pp. 1–7.
  19. Deutsche Fassung EN 1011-1; Schweißen–Empfehlungen zum Schweißen Metallischer Werkstoffe—Teil 1: Allgemeine Anleitungen für das Lichtbogenschweißen. European Committee for Standardization (CEN): Brussels, Belgium, 2009; pp. 1–18.
  20. Leo, P.; Renna, G.; Casalino, G.; Olabi, A.G. Effect of power distribution on the weld quality during hybrid laser welding of an Al–Mg alloy. Opt. Laser Technol. 2015, 73, 118–126. [Google Scholar] [CrossRef]
  21. Kostrivas, A.; Lippold, J.C. Fusion boundary microstructure evolution in aluminium alloys. Weld. World 2006, 50, 24–34. [Google Scholar] [CrossRef]
  22. Leo, P.; D’Ostuni, S.; Casalino, G. Hybrid welding of AA5754 annealed alloy: Role of post weld heat treatment on microstructure and mechanical properties. Mater. Des. 2016, 90, 777–786. [Google Scholar] [CrossRef]
  23. Aleo, V. Effect of Welding on the Width of the Heat-Affected Zone of Aluminum Alloys; ProQuest Dissertations Publishing: Ann Arbor, MI, USA, 2004. [Google Scholar]
  24. Çevik, B.; Gülenç, B. The effect of welding speed on mechanical and microstructural properties of 5754 Al (AlMg3) alloy joined by laser welding. Mater. Res. Express 2018, 5, 86520. [Google Scholar] [CrossRef]
  25. Courbière, M. Welding Aluminum Alloys. V Metallurgy and Mechanics of Welding: Processes and Industrial Applications; Elsevier Scopus: Amsterdam, The Netherlands, 2010; pp. 433–471. ISBN 9781848210387. [Google Scholar]
  26. Aalderink, B.J.; Pathiraj, B.; Aarts, R.G.K.M. Seam Gap Bridging of Laser Based Processes for the Welding of Aluminium Sheets for Industrial Applications. Int. J. Adv. Manuf. Technol. 2010, 48, 143–154. [Google Scholar] [CrossRef]
  27. Katayama, S. Fundamentals and Details of Laser Welding; Springer: Singapore, 2020. [Google Scholar]
  28. Ma, Y.R.; Cai, C.; Liu, Z.J.; Xie, J.; Yang, C. Plasma Monitoring during Laser-MIG Hybrid Welding Process Based on LabVIEW. Chin. J. Lasers-Zhongguo Jiguang 2022, 49, 0202014. [Google Scholar] [CrossRef]
  29. Balant, M.; Rudolf, R. Microstructure Characterization of Al-Alloy AW 5454 Intended for Ecological Laser Hybrid Welding. Metall. Mater. Data 2024, 2, 59–64. [Google Scholar] [CrossRef]
  30. Vuherer, T.; Kramberger, J.; Milčić, D.; Milčić, M.; Glodež, S. Fatigue Behaviour of Friction Stir Welded AA-2024 Aluminium Alloy Sheets. IOP Conf. Ser. Mater. Sci. Eng. 2019, 659, 12032–12040. [Google Scholar] [CrossRef]
  31. Sorochak, A.P.; Maruschak, P.O.; Yasniy, O.P.; Vuherer, T.; Panin, S. V Evaluation of Dynamic Fracture Toughness Parameters of Locomotive Axle Steel by Instrumented Charpy Impact Test. Fatigue Fract. Eng. Mater. Struct. 2017, 40, 512–522. [Google Scholar] [CrossRef]
  32. EN 515:2017; Aluminium and Aluminium Alloys—Wrought Products—Temper Designations. European Committee for Standardization (CEN): Brussels, Belgium, 2017; pp. 1–25.
  33. EN ISO 6507 1:2023; Metallic Materials—Vickers Hardness Test—Part 1: Test Method. European Committee for Standardization (CEN): Brussels, Belgium, 2023; pp. 1–39.
  34. EN ISO 6892 1:2019 (E); Metallic Materials—Tensile Testing—Part 1: Method of Test at Room Temperature. European Committee for Standardization (CEN): Brussels, Belgium, 2019; pp. 1–84.
  35. EN ISO 148-1; Metallic Materials—Charpy Pendulum Impact Test—Part 1: Test Method. European Committee for Standardization (CEN): Brussels, Belgium, 2016; pp. 1–33.
  36. EN ISO 14556:2023; Metallic Materials—Charpy V Notch Pendulum Impact Test—Instrumented Test Method. European Committee for Standardization (CEN): Brussels, Belgium, 2023; pp. 1–28.
  37. ASTM E1820; Standard Test Method for Measurement of Fracture Toughness. ASTM: West Conshohocken, PA, USA, 2015; pp. 1–54.
  38. Broitman, E. Indentation Hardness Measurements at Macro-, Micro-, and Nanoscale: A Critical Overview. Tribol. Lett. 2016, 65, 23. [Google Scholar] [CrossRef]
  39. Mohammed, A.-J.; Maher, I.; Nakai, M.; Gepreel, M.A.H. Effects of cold rolling and heat treatment on the microstructure and hardness of pure aluminium. Mater. Today Proc. 2023; in press. [Google Scholar] [CrossRef]
  40. Conserva, M.; Donzelli, G.; Trippodo, R. Aluminium and Its Applications; University of Pennsylvania State-Edimet: Edimet, PA, USA, 1992; p. 408. ISBN 9788886259019. [Google Scholar]
  41. Davis, J.R. Alloying: Understanding the Basics; ASM international: Tokyo, Japan, 2001; ISBN 1615030638. [Google Scholar]
  42. Curtin, W.A.; Olmsted, D.L.; Hector Jr, L.G. A predictive mechanism for dynamic strain ageing in aluminium–magnesium alloys. Nat. Mater. 2006, 5, 875–880. [Google Scholar] [CrossRef] [PubMed]
  43. Louat, N. On the theory of the Portevin-Le Chatelier effect. Scr. Metall. 1981, 15, 1167–1170. [Google Scholar] [CrossRef]
  44. McCormigk, P.G. A model for the Portevin-Le Chatelier effect in substitutional alloys. Acta Metall. 1972, 20, 351–354. [Google Scholar] [CrossRef]
  45. Estrin, Y.; Kubin, L.P. Collective dislocation behaviour in dilute alloys and the Portevin—Le Chatelier effect. J. Mech. Behav. Mater. 1989, 2, 255–292. [Google Scholar] [CrossRef]
  46. Kubin, L.P.; Estrin, Y. Evolution of dislocation densities and the critical conditions for the Portevin-Le Chatelier effect. Acta Metall. Mater. 1990, 38, 697–708. [Google Scholar] [CrossRef]
  47. Klose, F.B.; Ziegenbein, A.; Hagemann, F.; Neuhäuser, H.; Hähner, P.; Abbadi, M.; Zeghloul, A. Analysis of portevin-le chatelier serrations of type bin Al–Mg. Mater. Sci. Eng. A 2004, 369, 76–81. [Google Scholar] [CrossRef]
  48. Uscinowicz, R. The Effect of Rolling Direction on the Creep Process of Al–Cu Bimetallic Sheet. Mater. Des. 2013, 49, 693–700. [Google Scholar] [CrossRef]
  49. Medjahed, A.; Moula, H.; Zegaoui, A.; Derradji, M.; Henniche, A.; Wu, R.; Hou, L.; Zhang, J.; Zhang, M. Influence of the Rolling Direction on the Microstructure, Mechanical, Anisotropy and Gamma Rays Shielding Properties of an Al-Cu-Li-Mg-X Alloy. Mater. Sci. Eng. A. Struct. Mater. 2018, 732, 129–137. [Google Scholar] [CrossRef]
  50. İriç, S.; Ayhan, A.O. Dependence of Fracture Toughness on Rolling Direction in Aluminium 7075 Alloys. Acta Phys. Pol. A 2017, 132, 892–895. [Google Scholar] [CrossRef]
  51. Sakin, R. Investigation of bending fatigue-life of aluminum sheets based on rolling direction. Alex. Eng. J. 2018, 57, 35–47. [Google Scholar] [CrossRef]
  52. Wang, H. Effect of Rolling Direction to Texture Evolution in an Aluminium Single Crystal (011)[100]: A Crystal Plasticity FEM Investigation. Mater. Res. Express 2019, 6, 1265k8. [Google Scholar] [CrossRef]
  53. Lv, F.; Yang, F.; Duan, Q.Q.; Luo, T.J.; Yang, Y.S.; Li, S.X.; Zhang, Z.F. Tensile and Low-Cycle Fatigue Properties of Mg–2.8% Al–1.1% Zn–0.4% Mn Alloy along the Transverse and Rolling Directions. Scr. Mater. 2009, 61, 887–890. [Google Scholar] [CrossRef]
  54. Topic, I.; Höppel, H.W.; Göken, M. Influence of Rolling Direction on Strength and Ductility of Aluminium and Aluminium Alloys Produced by Accumulative Roll Bonding. J. Mater. Sci. 2008, 43, 7320–7325. [Google Scholar] [CrossRef]
  55. Kazemi-Navaee, A.; Jamaati, R.; Aval, H.J. Asymmetric Cold Rolling of AA7075 Alloy: The Evolution of Microstructure, Crystallographic Texture, and Mechanical Properties. Mater. Sci. Eng. A Struct. Mater. 2021, 824, 141801. [Google Scholar] [CrossRef]
  56. Alves, L.M. Fracture Mechanics. In Properties, Patterns and Behaviours; Alves, L.M., Ed.; IntechOpen: London, UK, 2016; pp. 1–332. [Google Scholar]
  57. Anderson, T.L.; Anderson, T.L. Fracture Mechanics: Fundamentals and Applications; CRC Press: Boca Raton, FL, USA, 2005; ISBN 0429125674. [Google Scholar]
  58. Jones, R.; Singh Raman, R.K.; McMillan, A.J. Crack growth: Does microstructure play a role? Eng. Fract. Mech. 2018, 187, 190–210. [Google Scholar] [CrossRef]
  59. Skallerud, B.; Iveland, T.; Härkegård, G. Fatigue life assessment of aluminum alloys with casting defects. Eng. Fract. Mech. 1993, 44, 857–874. [Google Scholar] [CrossRef]
  60. Zhu, X.-K.; Joyce, J.A. Review of fracture toughness (G, K, J, CTOD, CTOA) testing and standardization. Eng. Fract. Mech. 2012, 85, 1–46. [Google Scholar] [CrossRef]
  61. Zhu, X.; Blake, P. The formation mechanism of Al6(Fe, Mn) phase in die-cast Al-Mg alloys. CrystEngComm 2018, 20, 3839–3848. [Google Scholar] [CrossRef]
  62. Abu bakar, I. The Effect of Rolling Direction to the Tensile Properties of AA5083 Specimen. V; Springer: Singapore, 2015; pp. 779–787. ISBN 978-981-287-289-0. [Google Scholar]
  63. Nazemi, N. Identification of the Mechanical Properties in the Heat-Affected Zone of Aluminum Welded Structures; ProQuest Dissertations Publishing: Ann Arbor, MI, USA, 2015. [Google Scholar]
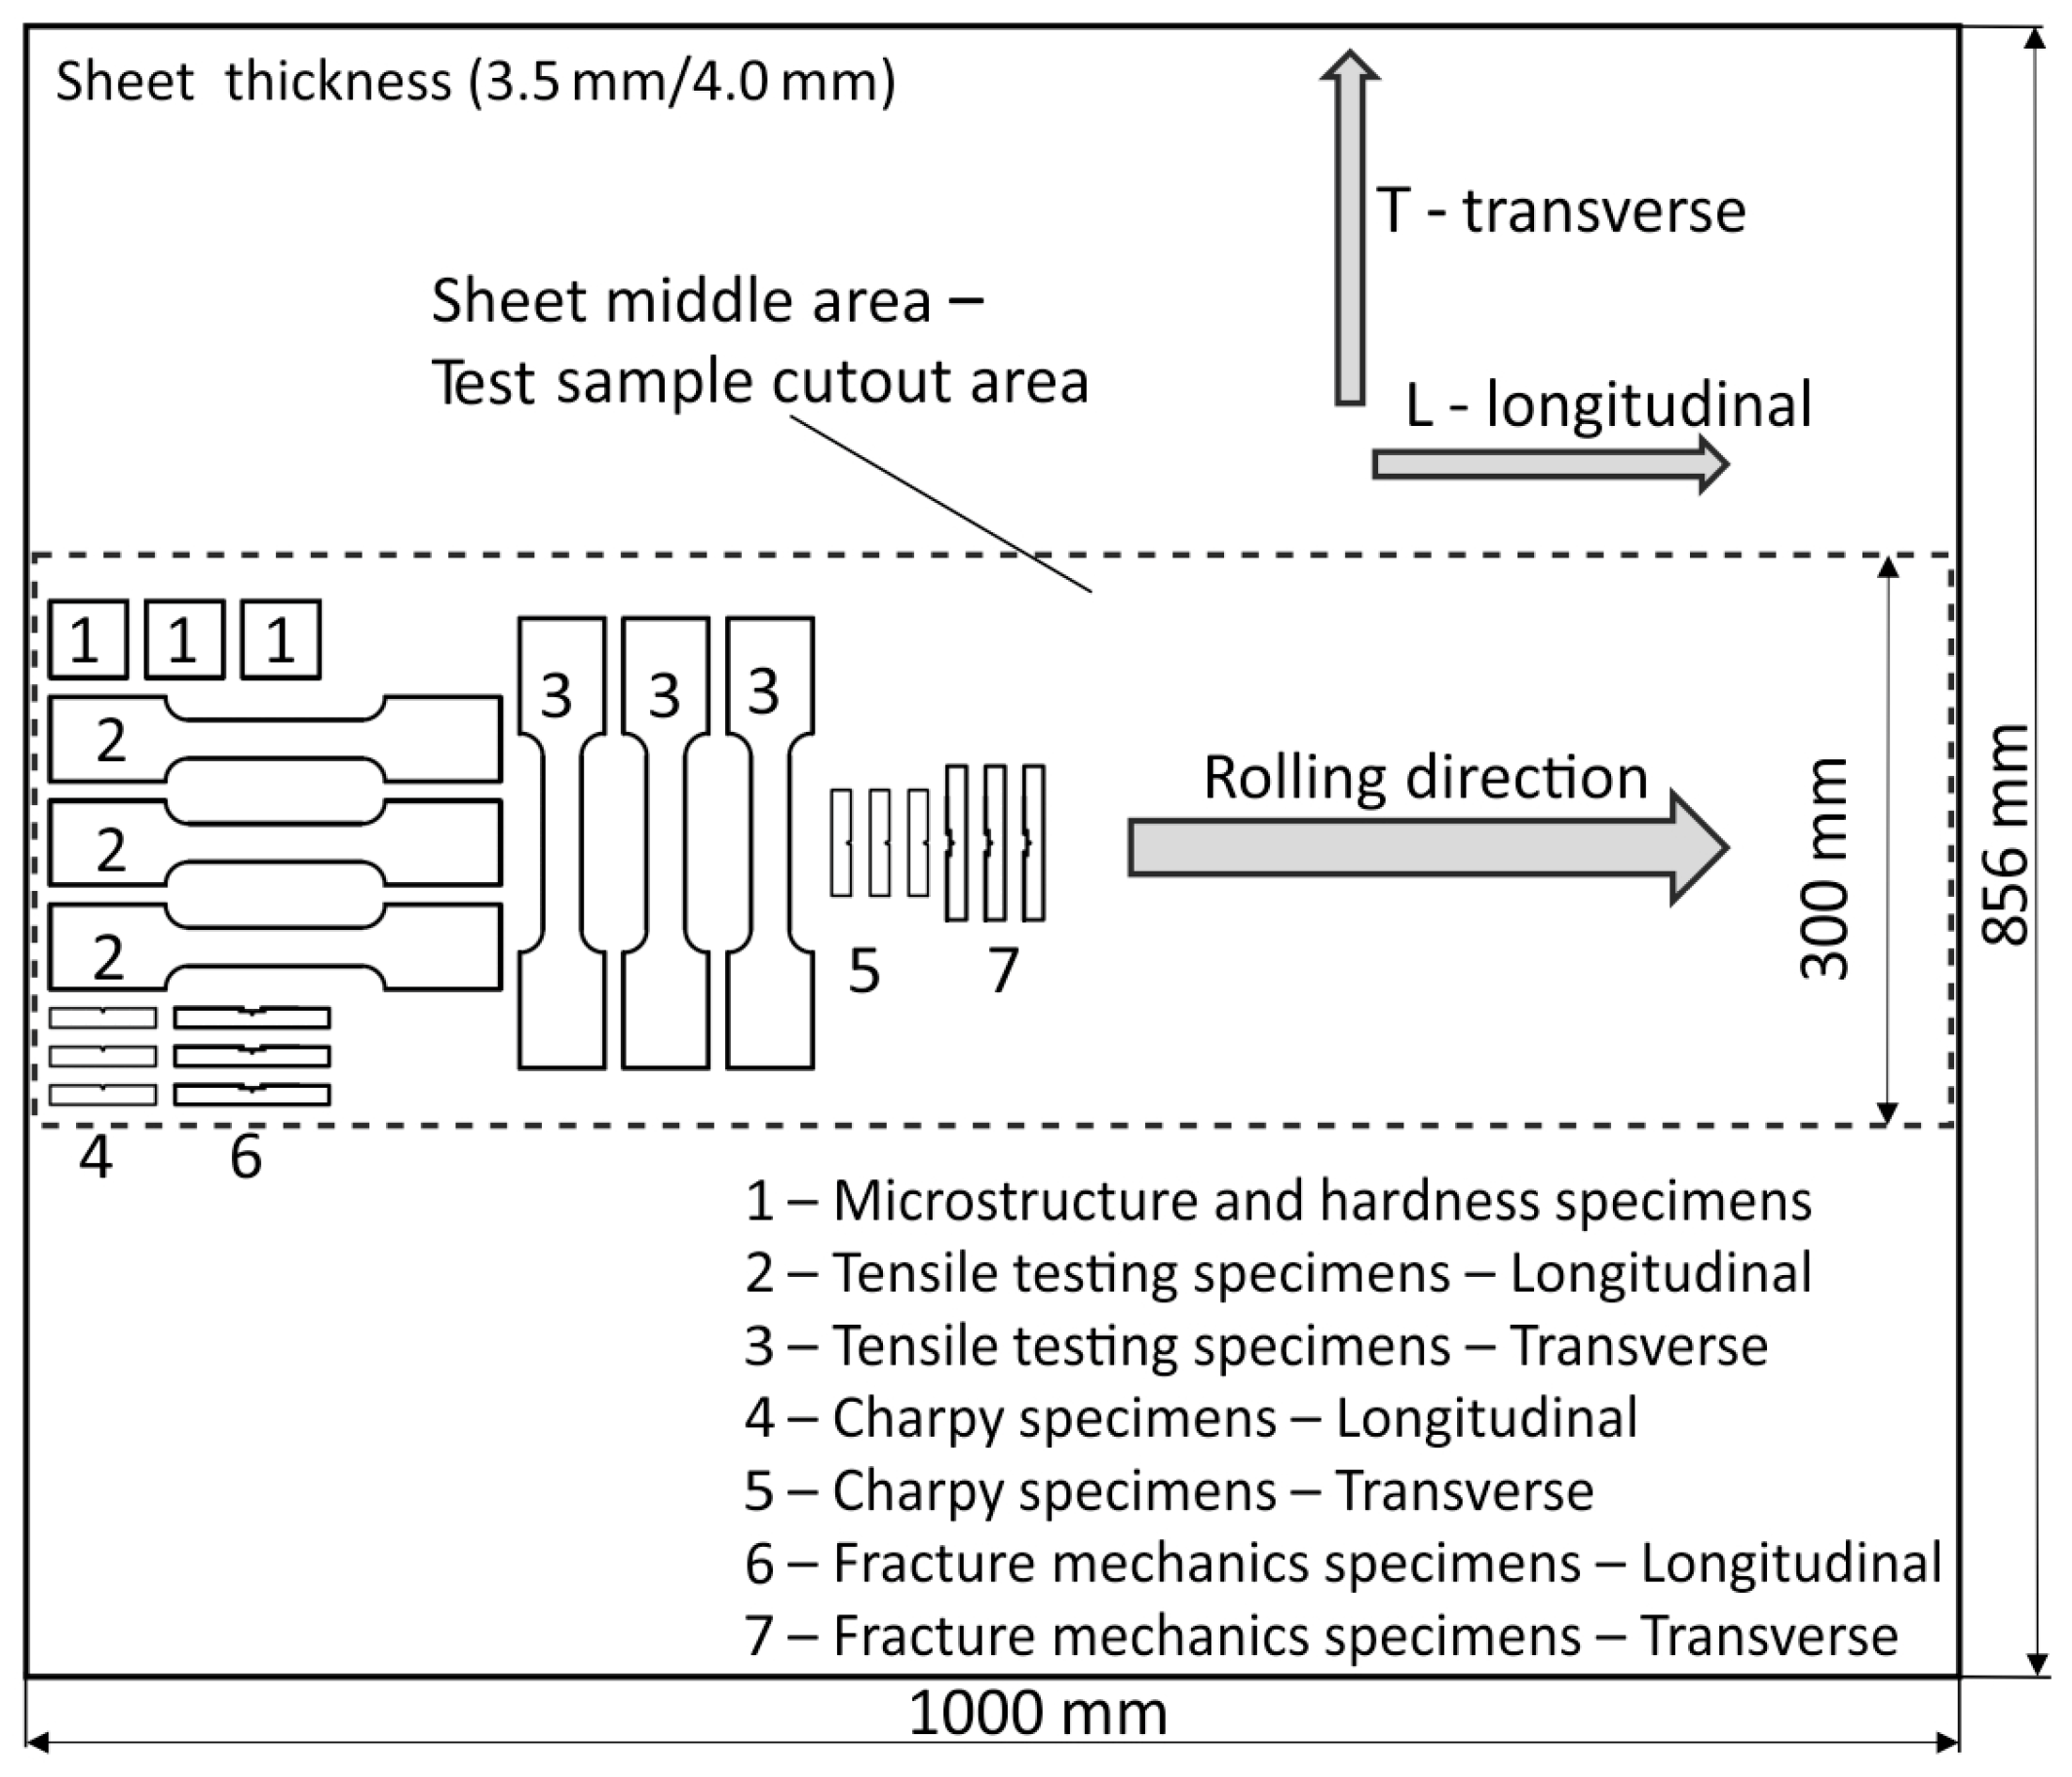
Figure 1. The scheme of taking samples from the delivered sheet metal.
Jmmp 08 00217 g001
Figure 2. Specimen dimensions for tensile testing.
Jmmp 08 00217 g002
Figure 3. Specimen dimensions for the Charpy instrumental testing.
Jmmp 08 00217 g003
Figure 4. Specimen dimensions for the fracture mechanics tests.
Jmmp 08 00217 g004
Figure 5. Diagrams of the tensile testing of the specimens ALT1 (black line); ATT1 (red line); BLT1 (green line); BTT1 (blue line).
Jmmp 08 00217 g005
Figure 6. Fracture surface of the tensile testing—macro-optical picture and 3D topography: (a) Specimen ALT3; (b) Specimen ATT2; (c) Specimen BLT2; (d) Specimen BTT1.
Jmmp 08 00217 g006
Figure 7. Fracture surface of the tensile testing—macro-optical picture and SEM pictures: (a,b) Specimen ALT3; (c,d) Specimen ATT2; yellow and black rectangles are places of further examination at higher magnifications.
Jmmp 08 00217 g007
Figure 8. Results of the instrumented Charpy tests: (a) Specimen ALC1; (b) Specimen ATC1; (c) Specimen BLC1; (d) Specimen BTC1.
Jmmp 08 00217 g008
Figure 9. Fractured surfaces of the instrumented Charpy tests: (a) Macro picture of the specimen ALC1; (b) SEM of the specimen ALC1; (c) Macro picture of the specimen ATC1; (d) SEM of the specimen ATC1; (e) Macro picture of the specimen BLC1; (f) SEM of the specimen BLC1; (g) Macro picture of the specimen BTC1; (h) SEM of the specimen BTC1; yellow and black rectangles are magnified areas.
Jmmp 08 00217 g009
Figure 10. Force/CMOD (crack mouth opening displacement) plot of the test sample: (a) ALF2, (c) ATF2; J integral resistance curve of the test sample: (b) ALF2 and (d) ATF2.
Jmmp 08 00217 g010
Figure 11. Fractured toughness specimen surfaces with fractographic detail—macro pictures: (a) Specimen ALF1; (b) Specimen ALF2; (c) Specimen ATF1; (d) Specimen ATF2; yellow rectangles are regions of further SEM analysis.
Jmmp 08 00217 g011
Figure 12. Fractured toughness specimen surfaces—SEM of the specimens (ac) ALF2 and (df) ATF2.
Jmmp 08 00217 g012
Figure 13. Marked areas of the EDX analysis of the specimen ALF2.
Jmmp 08 00217 g013
Figure 14. Marked areas of the EDX analysis of the specimen ATF2.
Jmmp 08 00217 g014
Table 1. The nominal chemical composition of the Al-alloy EN AW-5454-D (in wt.%), declared by the alloy manufacturer.
Thickness
[mm]
ElementSiFeCuMnMgCrZnTiAl
Minimum---0.52.60.05--Rest
Maximum0.250.40.11.03.00.20.20.05
3.5 0.160.310.060.792.860.070.030.0295.70
4.0 0.180.320.050.762.850.050.040.0295.73
Table 2. Specimen naming for different tests.
TestThickness
[mm]
DirectionSpecimenThickness
[mm]
DirectionSpecimen
Hardness testing4.0 AH1, AH2, AH33.5 BH1, BH2, BH3
Tensile testing4.0LALT1, ALT2, ALT33.5LBLT1, BLT2, BLT3
4.0TATT1, ATT2, ATT23.5TBTT1, BTT2, BTT3
Charpy4.0LALC1, ALC2, ALC33.5LBLC1, BLC2, BLC3
4.0TATC1, ATC2, ATC33.5TBTC1, BTC2, BTC3
Fracture
mechanics
4.0LALF1, ALF2, ALF33.5LBLF1, BLF2, BLF3
4.0TATF1, ATF2, ATF33.5TBTF1, BTF2, BTF3
The designation of the specimens is as follows. First letter: A—thickness 4 mm, B—thickness 3.5 mm; Second letter: L—longitudinal, T—transversal; Third letter: H—hardness t., T—tensile t., C—Charpy, F—fracture mech.; Number—specimen number.
Table 3. Technological parameters of polishing.
Polishing AgentLoad
[N]
Rotational
Speed [rpm]
Direction of
Rotation
Time
[min:s]
P600
sandpaper
20300/30Same
direction
5:00
9 μm diamond
suspension
+ lubricant
20150/30Opposite
direction
5:00
3 μm diamond
suspension
+ lubricant
20150/30Same
direction
4:00
1 μm diamond
suspension
+ lubricant
20150/30Same
direction
2:30
0.06 μm
colloidal silica
+ lubricant
20150/30Opposite
direction
2:00
Table 4. The average of the HV5 hardness measurements on the cross-sections of the samples ALH and BLH.
Specimen Thickness [mm]SpecimenNo. of
Measurements
Average Sample HardnessStd.
Deviation
4.0ALH11481.45.9
ALH21384.05.1
ALH31085.23.3
Average of all AH samples3783.35.2
3.5BLH11287.65.6
BLH21685.95.9
BLH31688.45.9
Average of all BH samples3787.25.9
Table 5. Mechanical properties of the 3.5 mm- and 4.0 mm-thick Al sheets.
Nominal Thickness
[mm]
Thickness
[mm]
Rm
[MPa]
Rp0.2
[MPa]
A80
[%]
4.0Min.
Max.
3.94.1220
260
90
130
18
Meas.3.9624010520.3
3.5Min.
Max.
3.4
3.6
220
260
90
130
18
Meas.3.4724010520.2
Table 6. Tensile testing results.
Specimen Thickness [mm]DirectionSpecimenE
[GPa]
Rm
[MPa]
Rp0.2
[MPa]
Ag [%]
4.0LALT170.42250.2118.616.26
ALT271.99250.5117.917.02
ALT371.22249.6117.819.02
Average71.21250.1118.117.43
STD0.640.370.361.16
TATT170.01243.6116.914.73
ATT270.99243.5116.715.89
ATT370.01243.2115.315.97
Average70.34243.4116.315.53
STD0.460.170.710.57
3.5LBLT171.91251.2118.116.06
BLT269.66252.9118.618.02
BLT370.15254.7118.517.64
Average70.57252.9118.417.59
STD0.971.430.220.85
TBTT170.02244.2116,916.27
BTT268.36245.8115.715.03
BTT368.85245.0115.615.25
Average69.08245.0116.115.52
STD0.700.650.590.54
Table 7. Instrumental Charpy test results.
Specimen Thickness [mm]DirectionSampleImpact Energy E [J]Ei
[J]
Ep
[J]
KVpov
[J/cm2]
4.0LALC111.105.076.0336.22
ALC211.665.296.37
TATC19.373.885.4930.16
ATC29.513.246.27
3.5LBLC110.663.876.7938.73
BLC210.544.466.08
TBTC17.683.064.6227.64
BTC27.382.245.14
Table 8. EDX analysis results of the specimen ALF2 (in wt.%).
SpectrumMgAlMnFeTotal
Spectrum 11.3781.296.8610.48100
Spectrum 20.9879.909.949.18100
Spectrum 31.4579.827.1611.57100
Spectrum 40.2976.3110.4712.93100
Spectrum 50.3677.919.1812.55100
Spectrum 60.4379.078.0612.44100
Mean0.8179.068.6111.52100
Std. Dev.0.521.741.491.44
Max.1.4581.2910.4712.93
Min.0.2976.316.869.18
Table 9. EDX analysis results of the specimen ATF2 (in wt.%).
SpectrumMgAlMnFeTotal
Spectrum 10.6177.908.7012.79100
Spectrum 20.4973.629.3216.57100
Spectrum 30.3079.157.9312.62100
Spectrum 40.3368.6313.9217.12100
Spectrum 50.6674.529.5415.28100
Spectrum 61.4553.5418.1026.91100
Mean0.6471.2311.2516.88100
Std. Dev.0.429.413.955.26
Max.1.4579.1518.1026.91
Min.0.6471.2311.2516.88
Disclaimer/Publisher’s Note: The statements, opinions and data contained in all publications are solely those of the individual author(s) and contributor(s) and not of MDPI and/or the editor(s). MDPI and/or the editor(s) disclaim responsibility for any injury to people or property resulting from any ideas, methods, instructions or products referred to in the content.