
Mechanical and Microstructural Characterization of Class 800 Complex Phase Steel before and after the Laser Welding Process

 ,
,
Abstract
1. Introduction
1.1. Laser Welding Process
1.2. Laser Welding of Advanced High-Strength Steels (AHSS)
1.3. Non-Parametric Test: Laser Welding
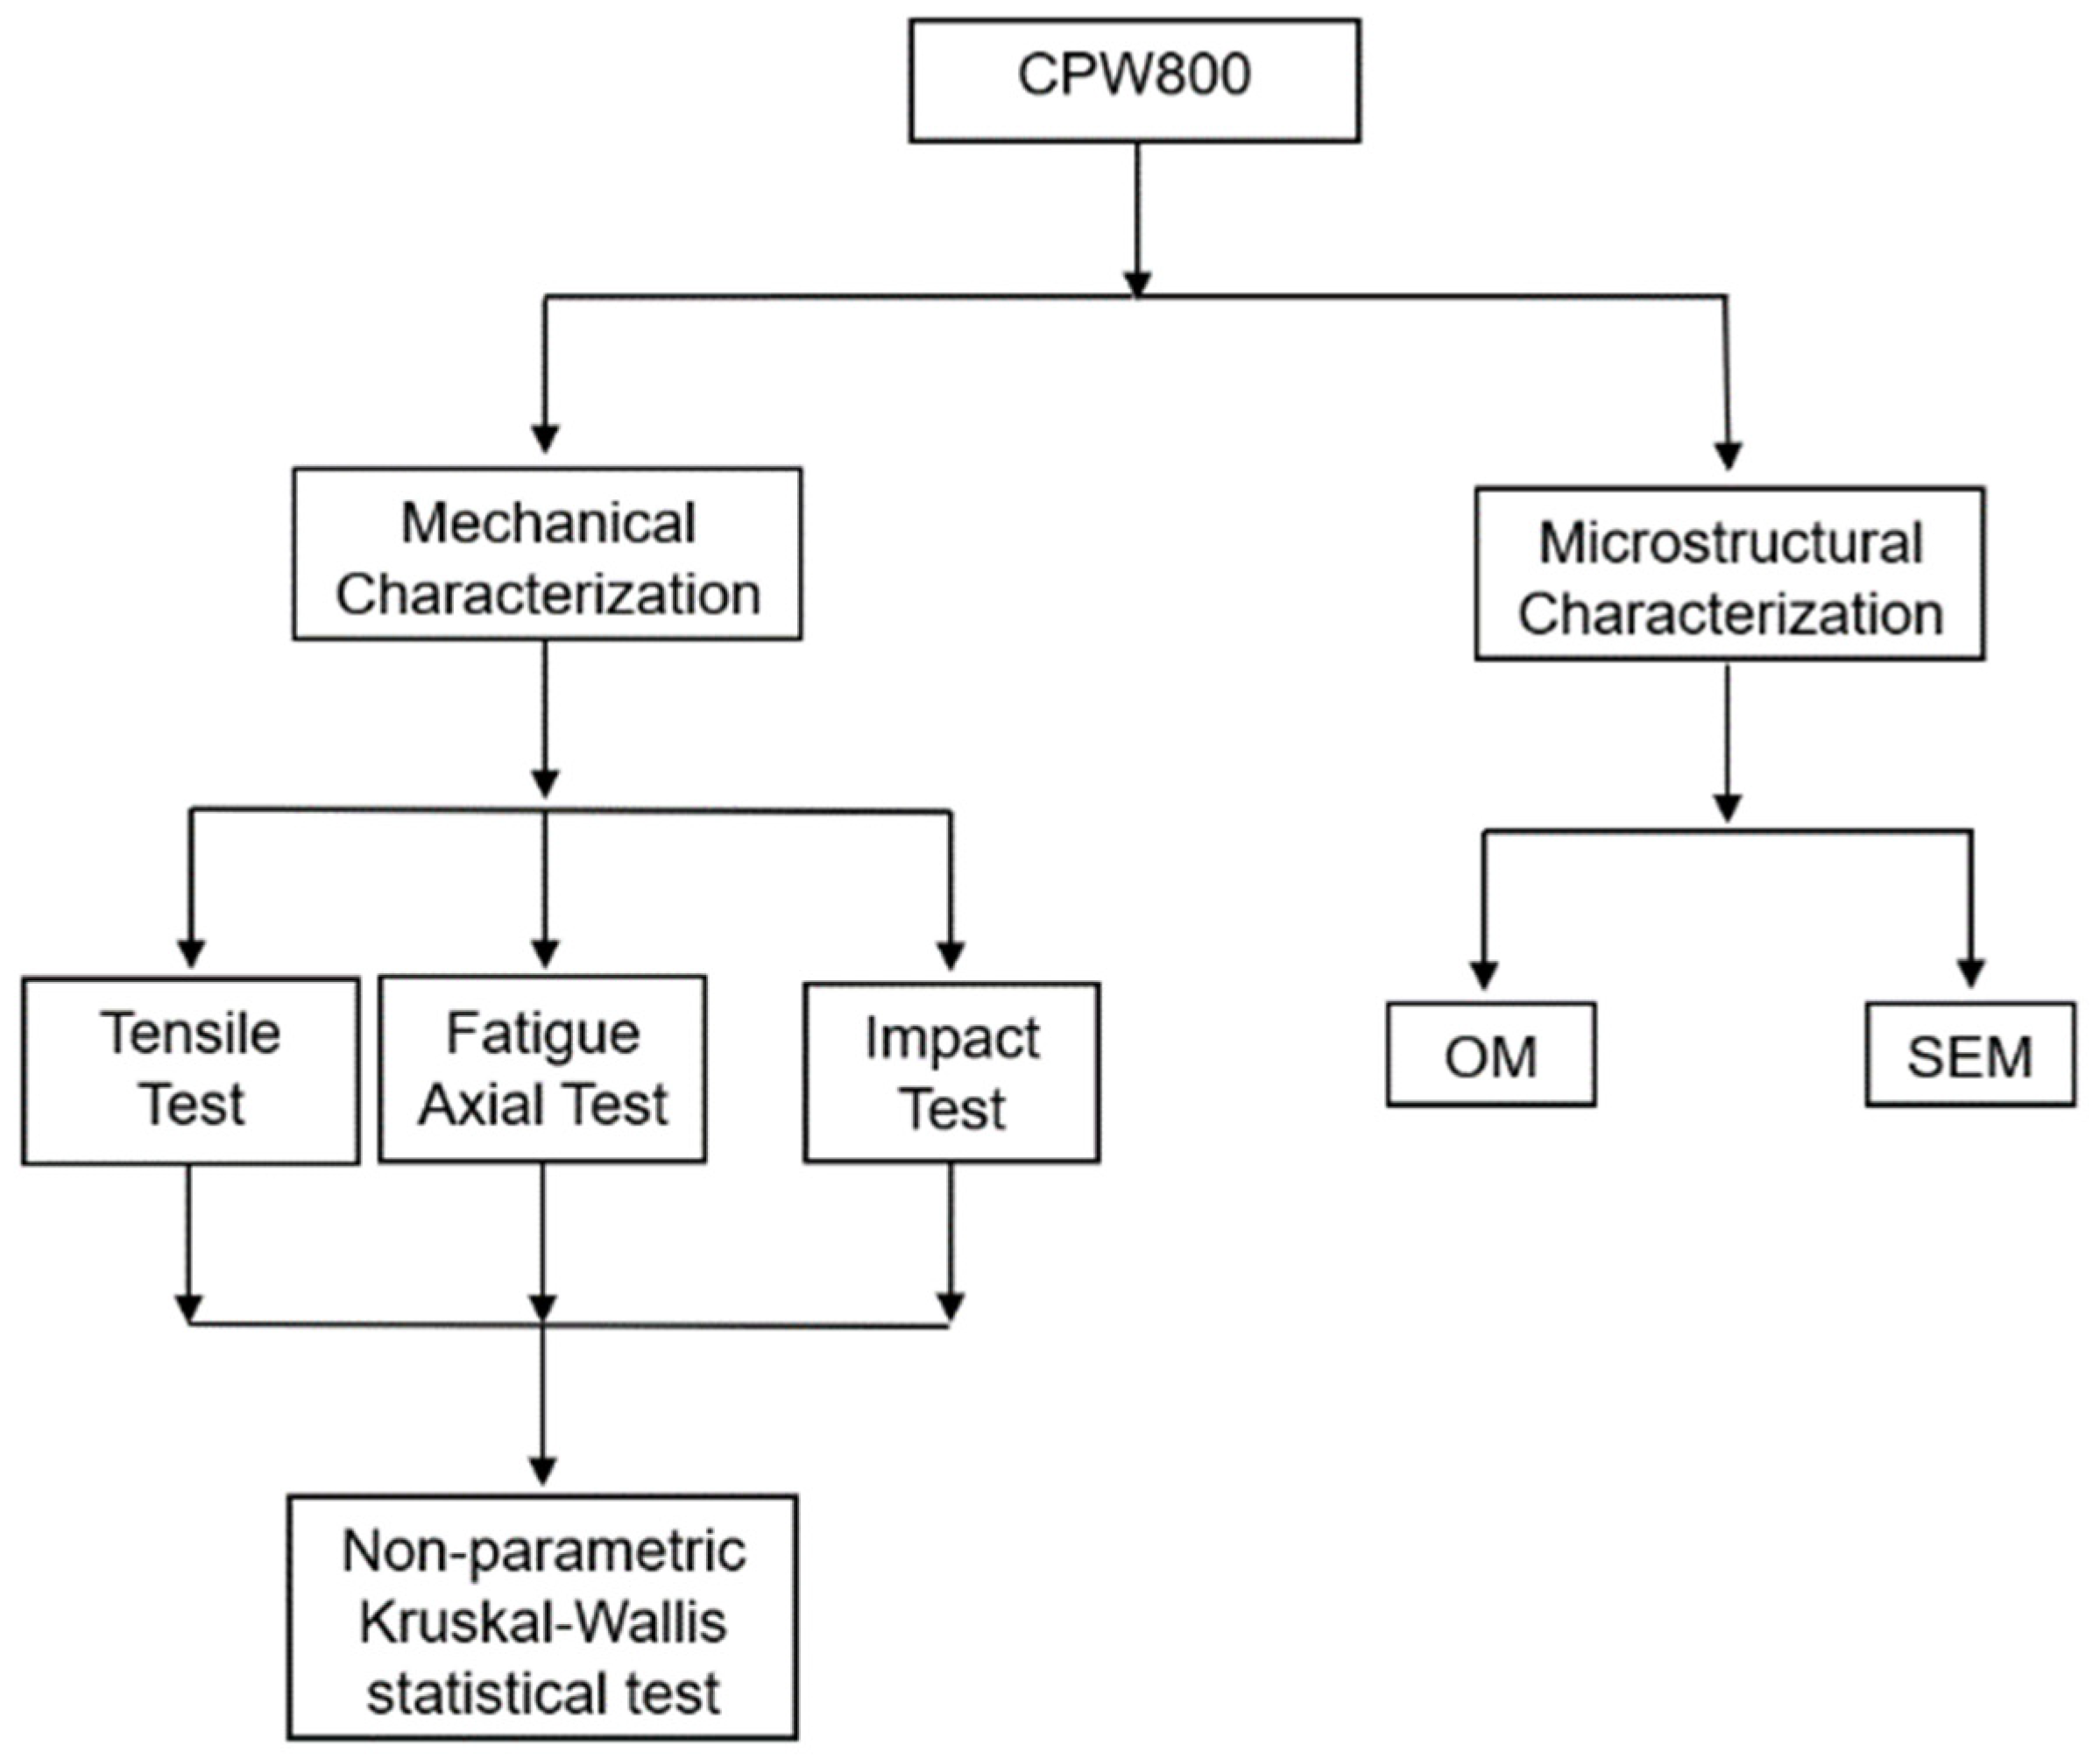
2. Materials and Methods
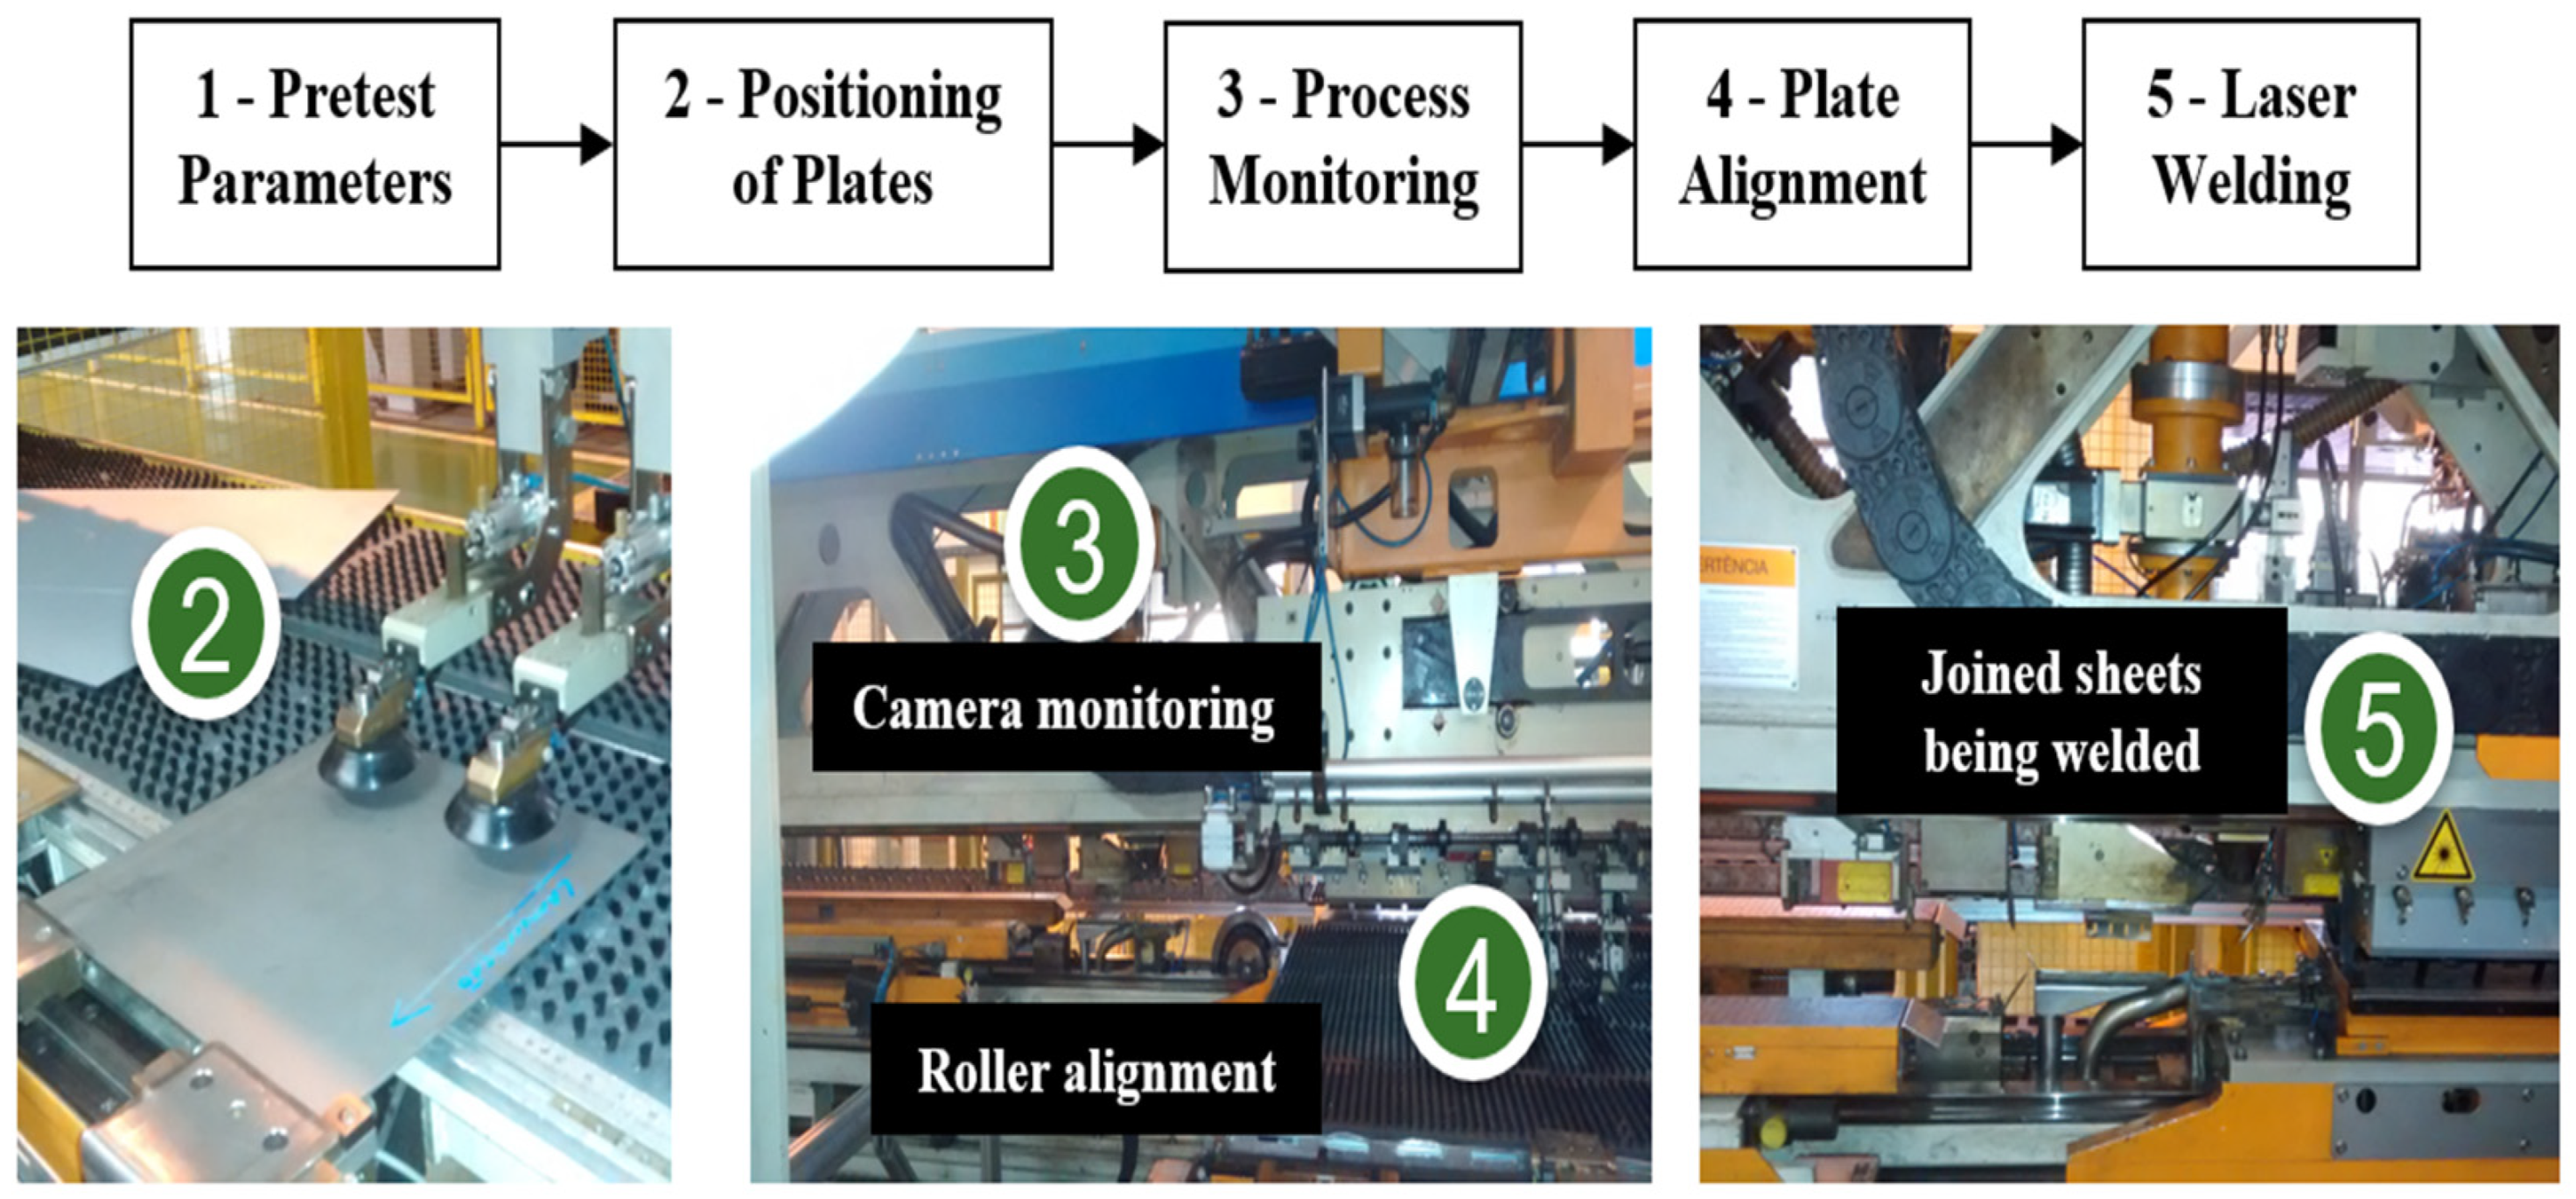
2.1. Laser Welding
2.2. Mechanical Tests
2.3. Non-Parametric Kruskal–Wallis Statistical Test
2.4. Microstructural Analysis
2.4.1. Optical Microscopy
2.4.2. Scanning Electron Microscopy
3. Results and Discussion
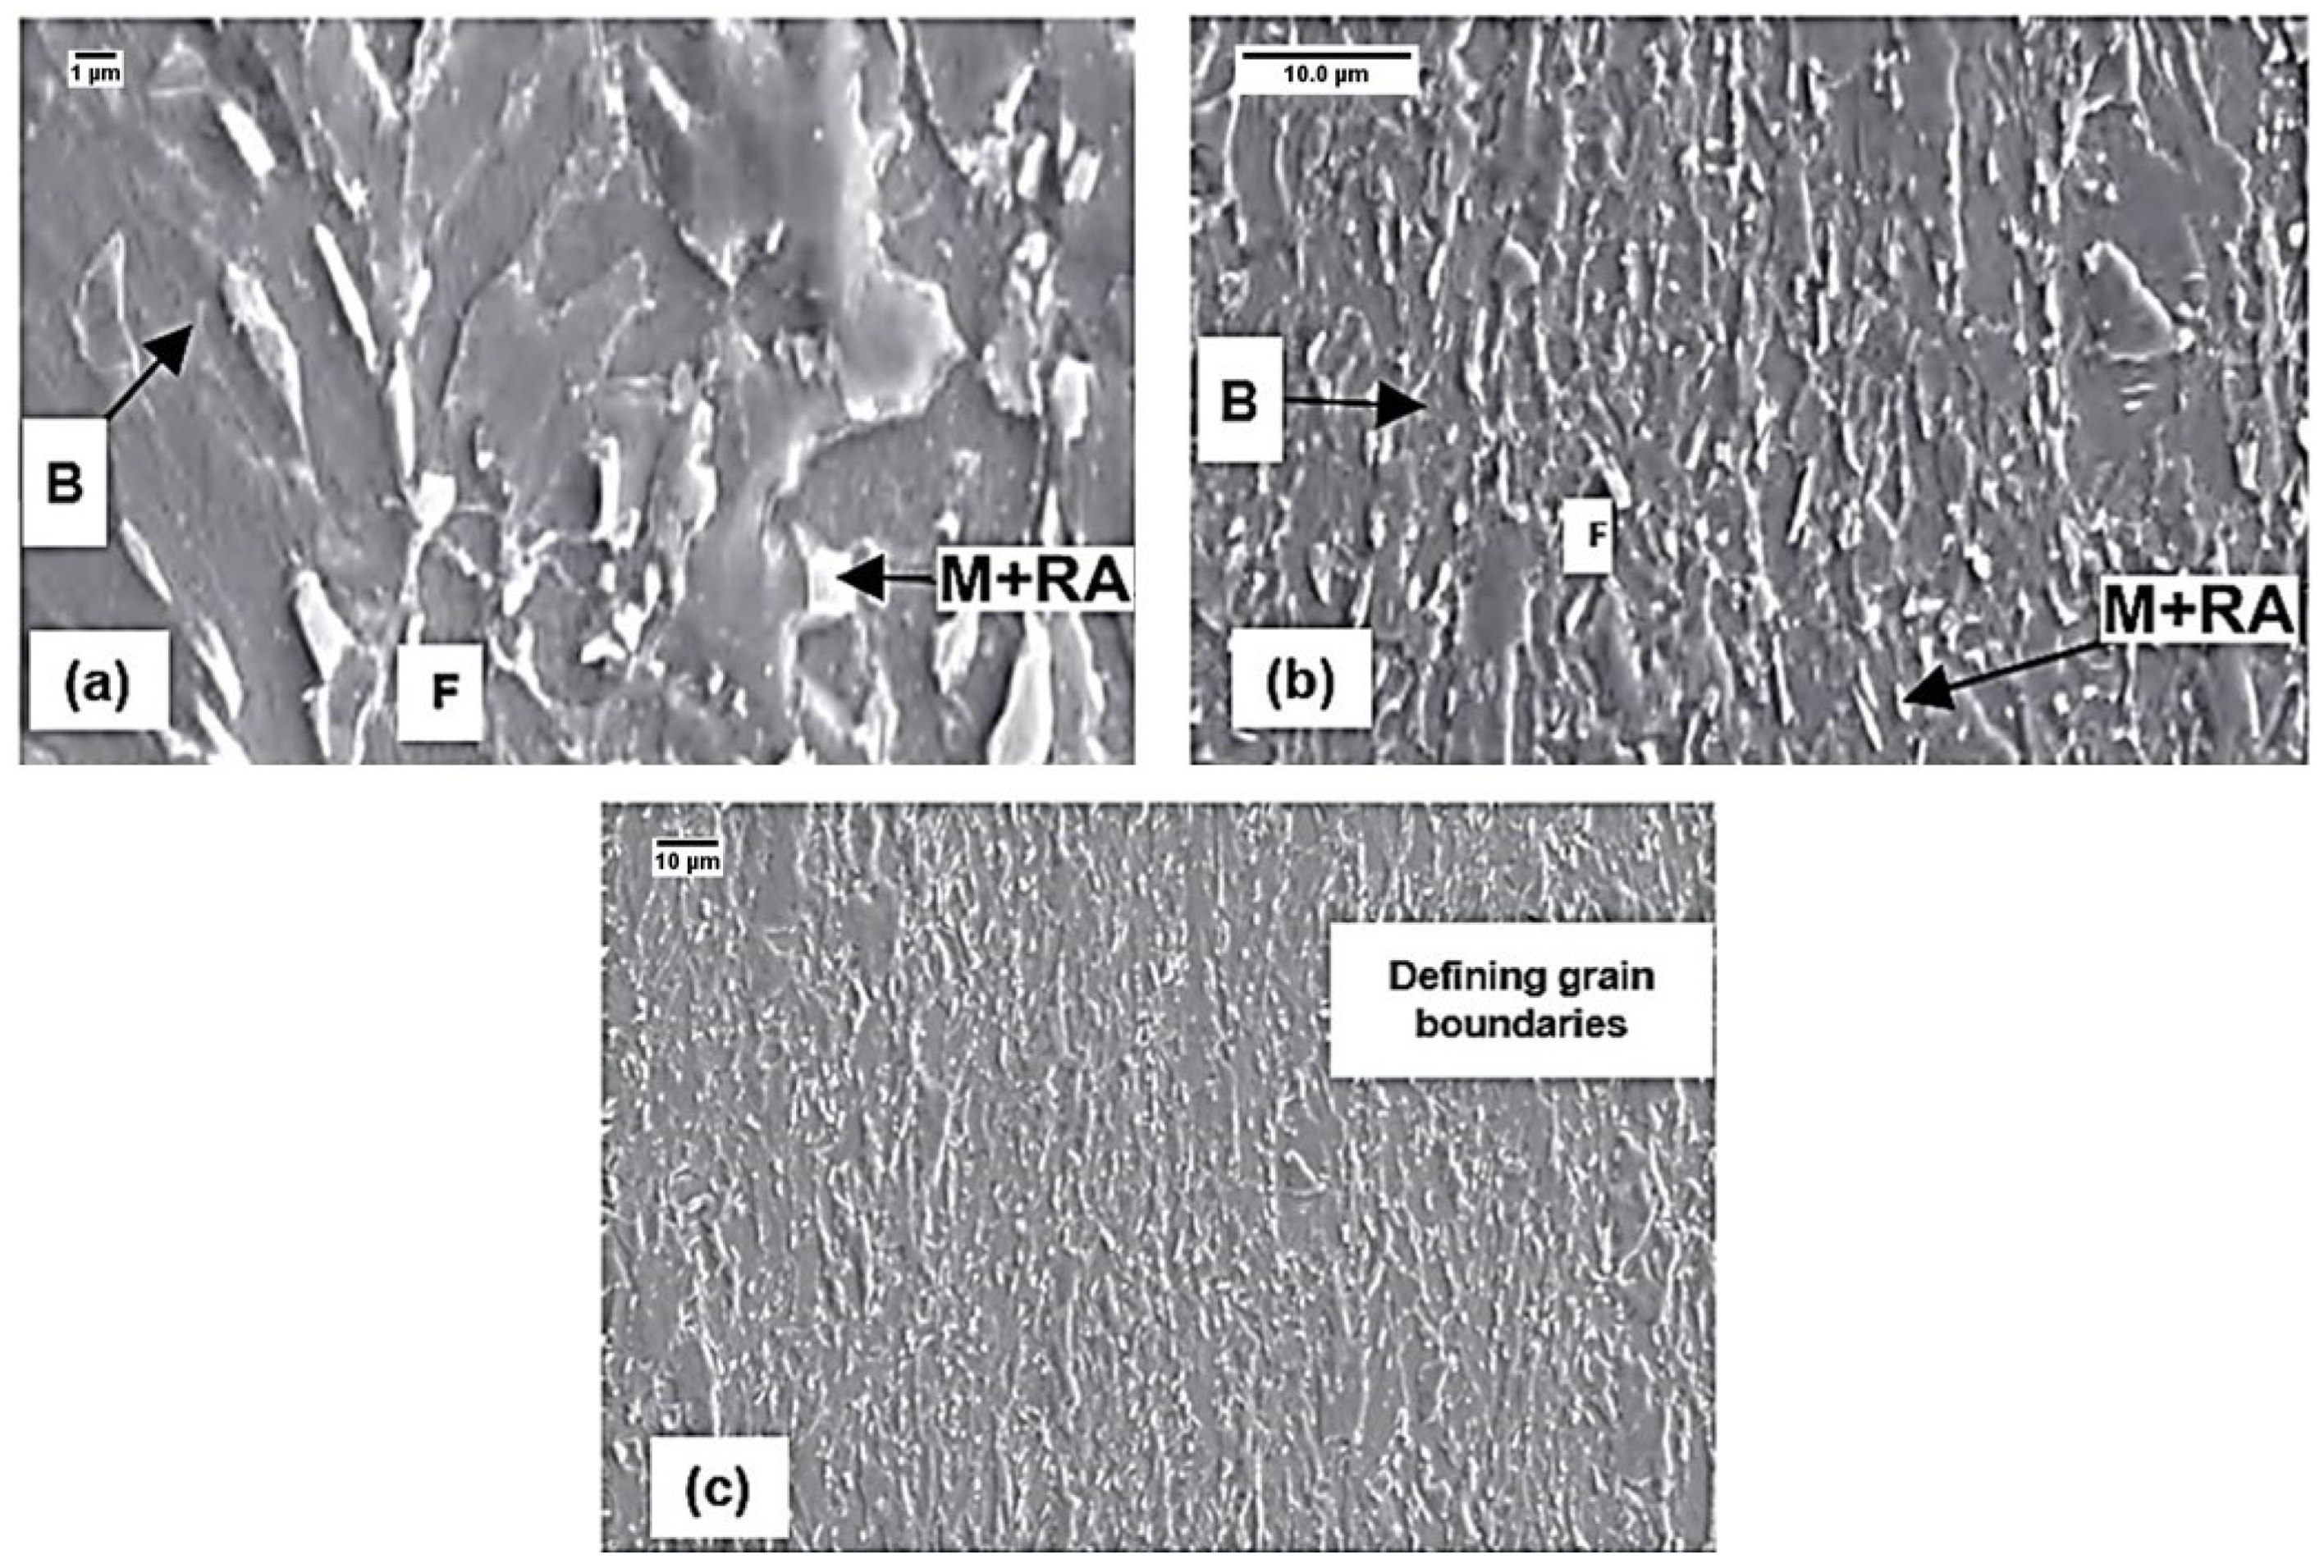
3.1. Microstructural Characterization of CPW 800 Steel: Base Metal and Welded Region
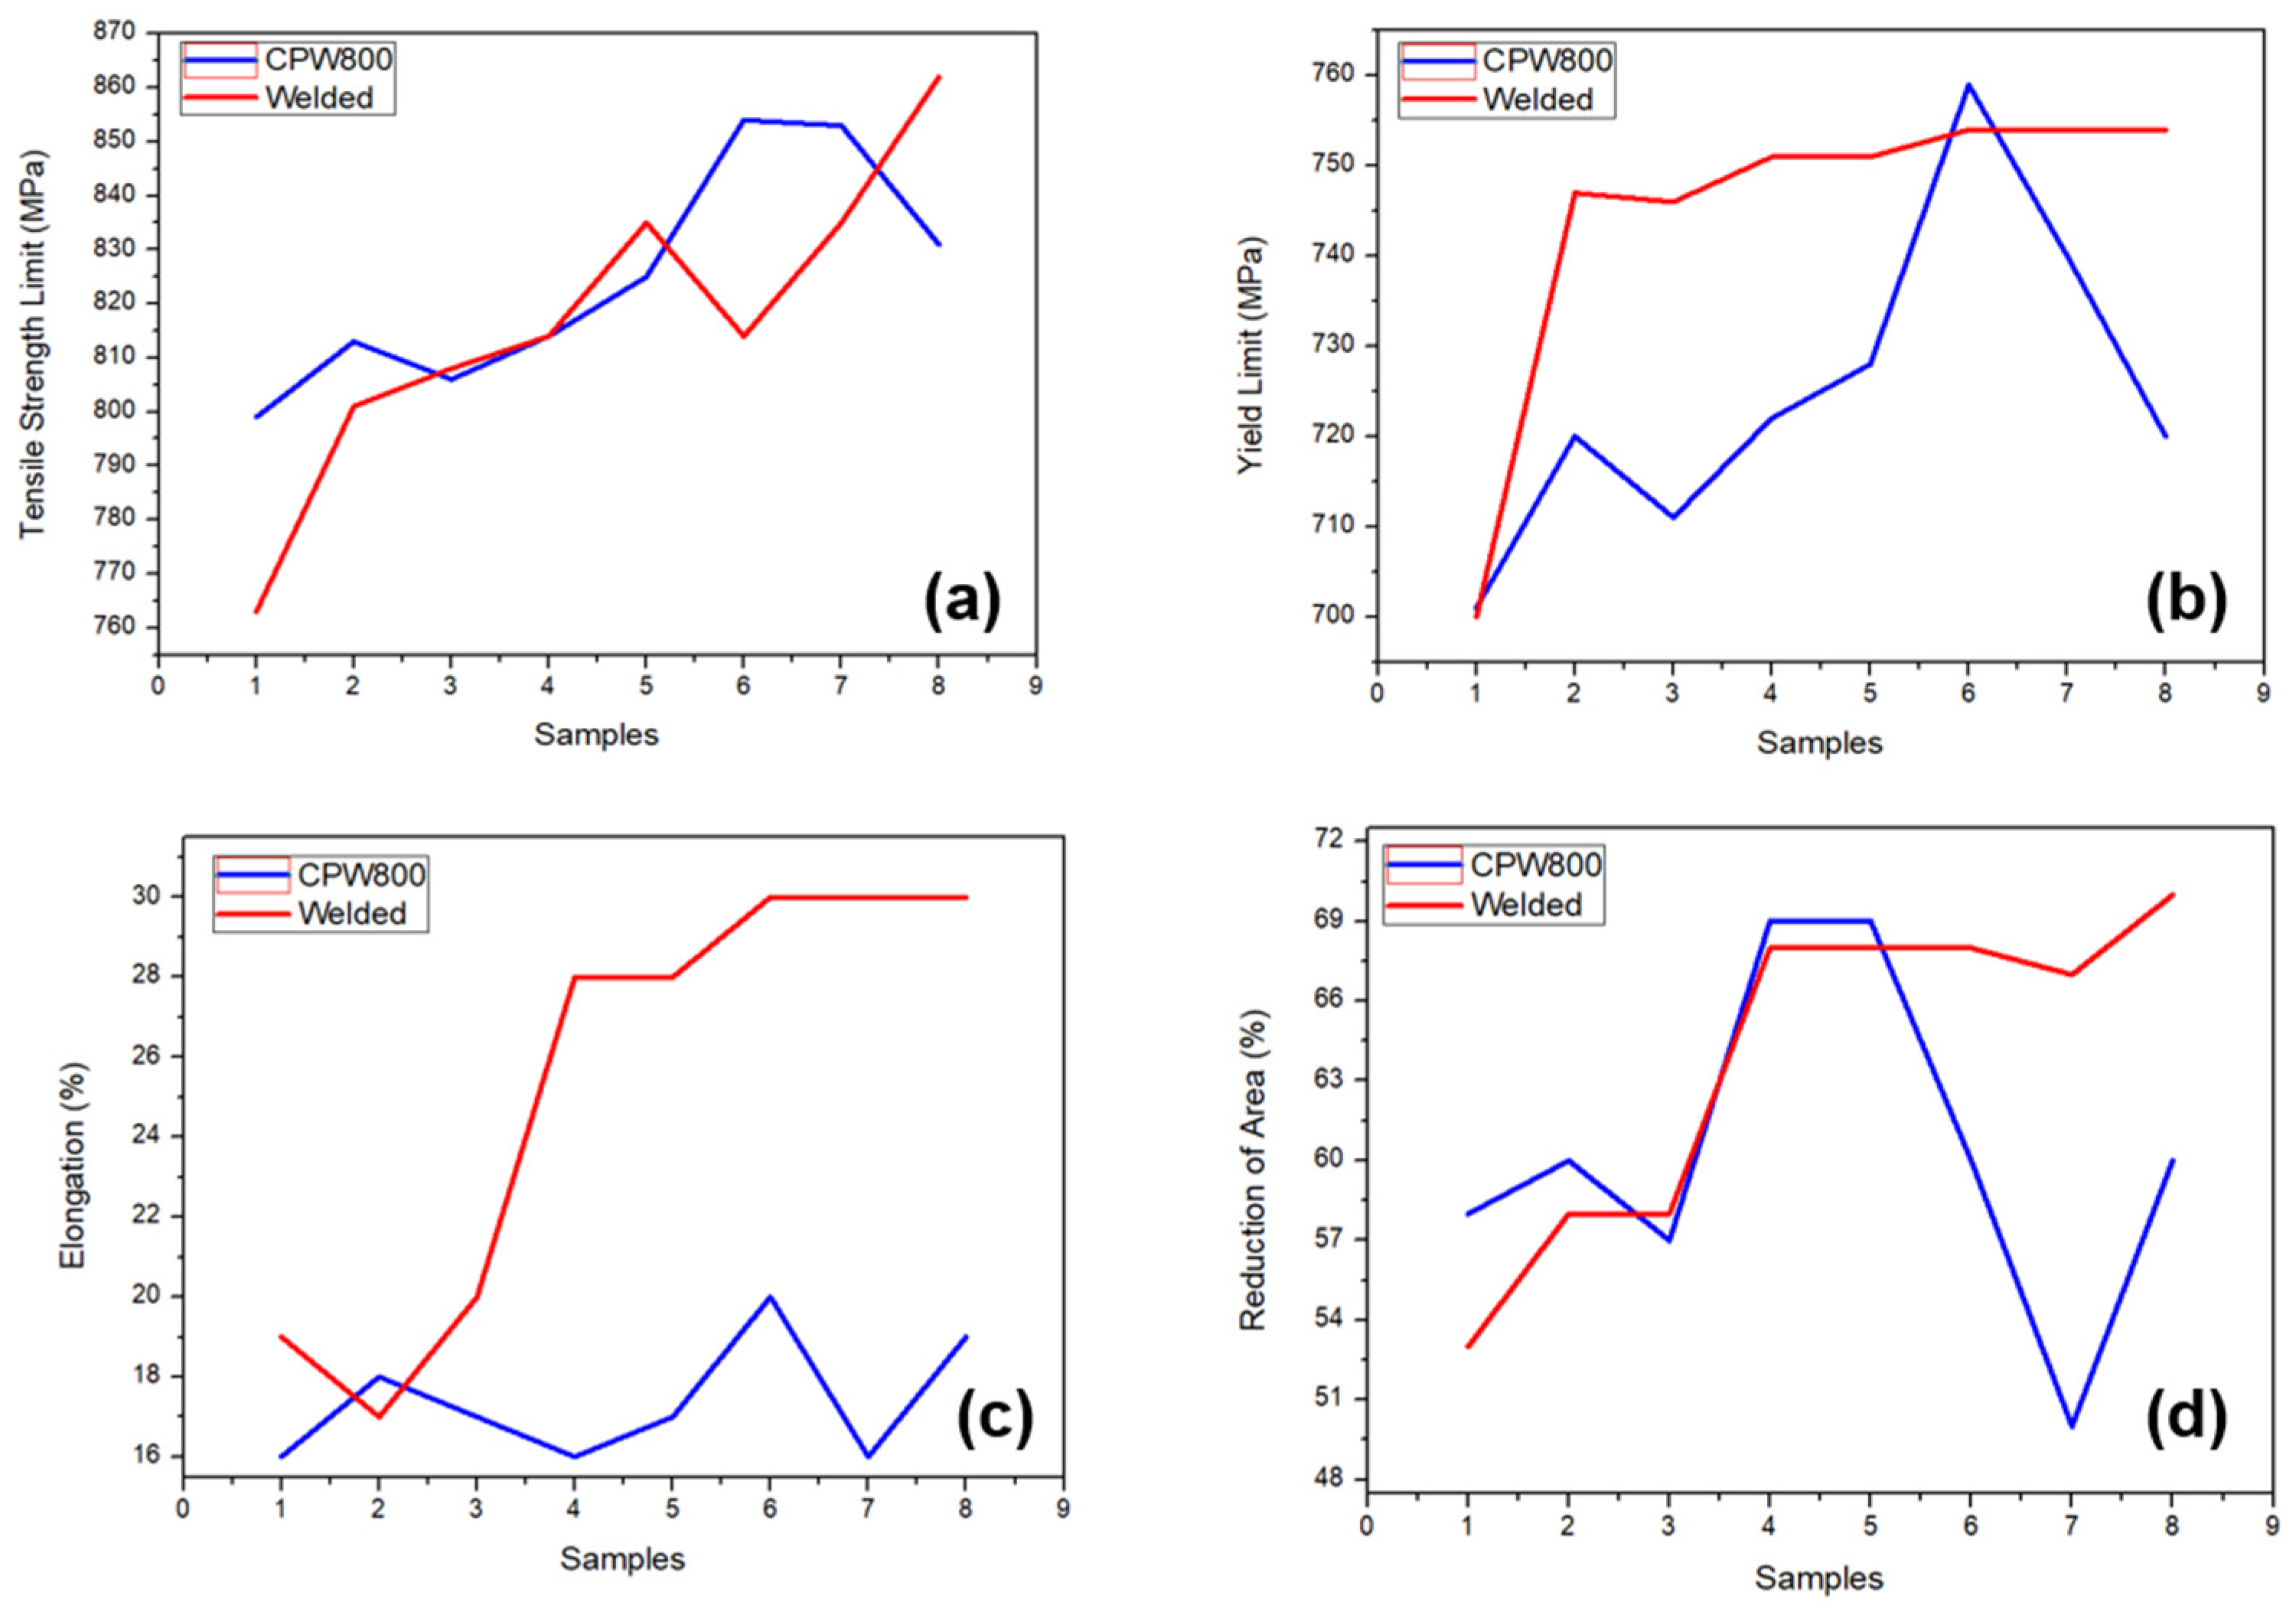
3.2. Tensile Test
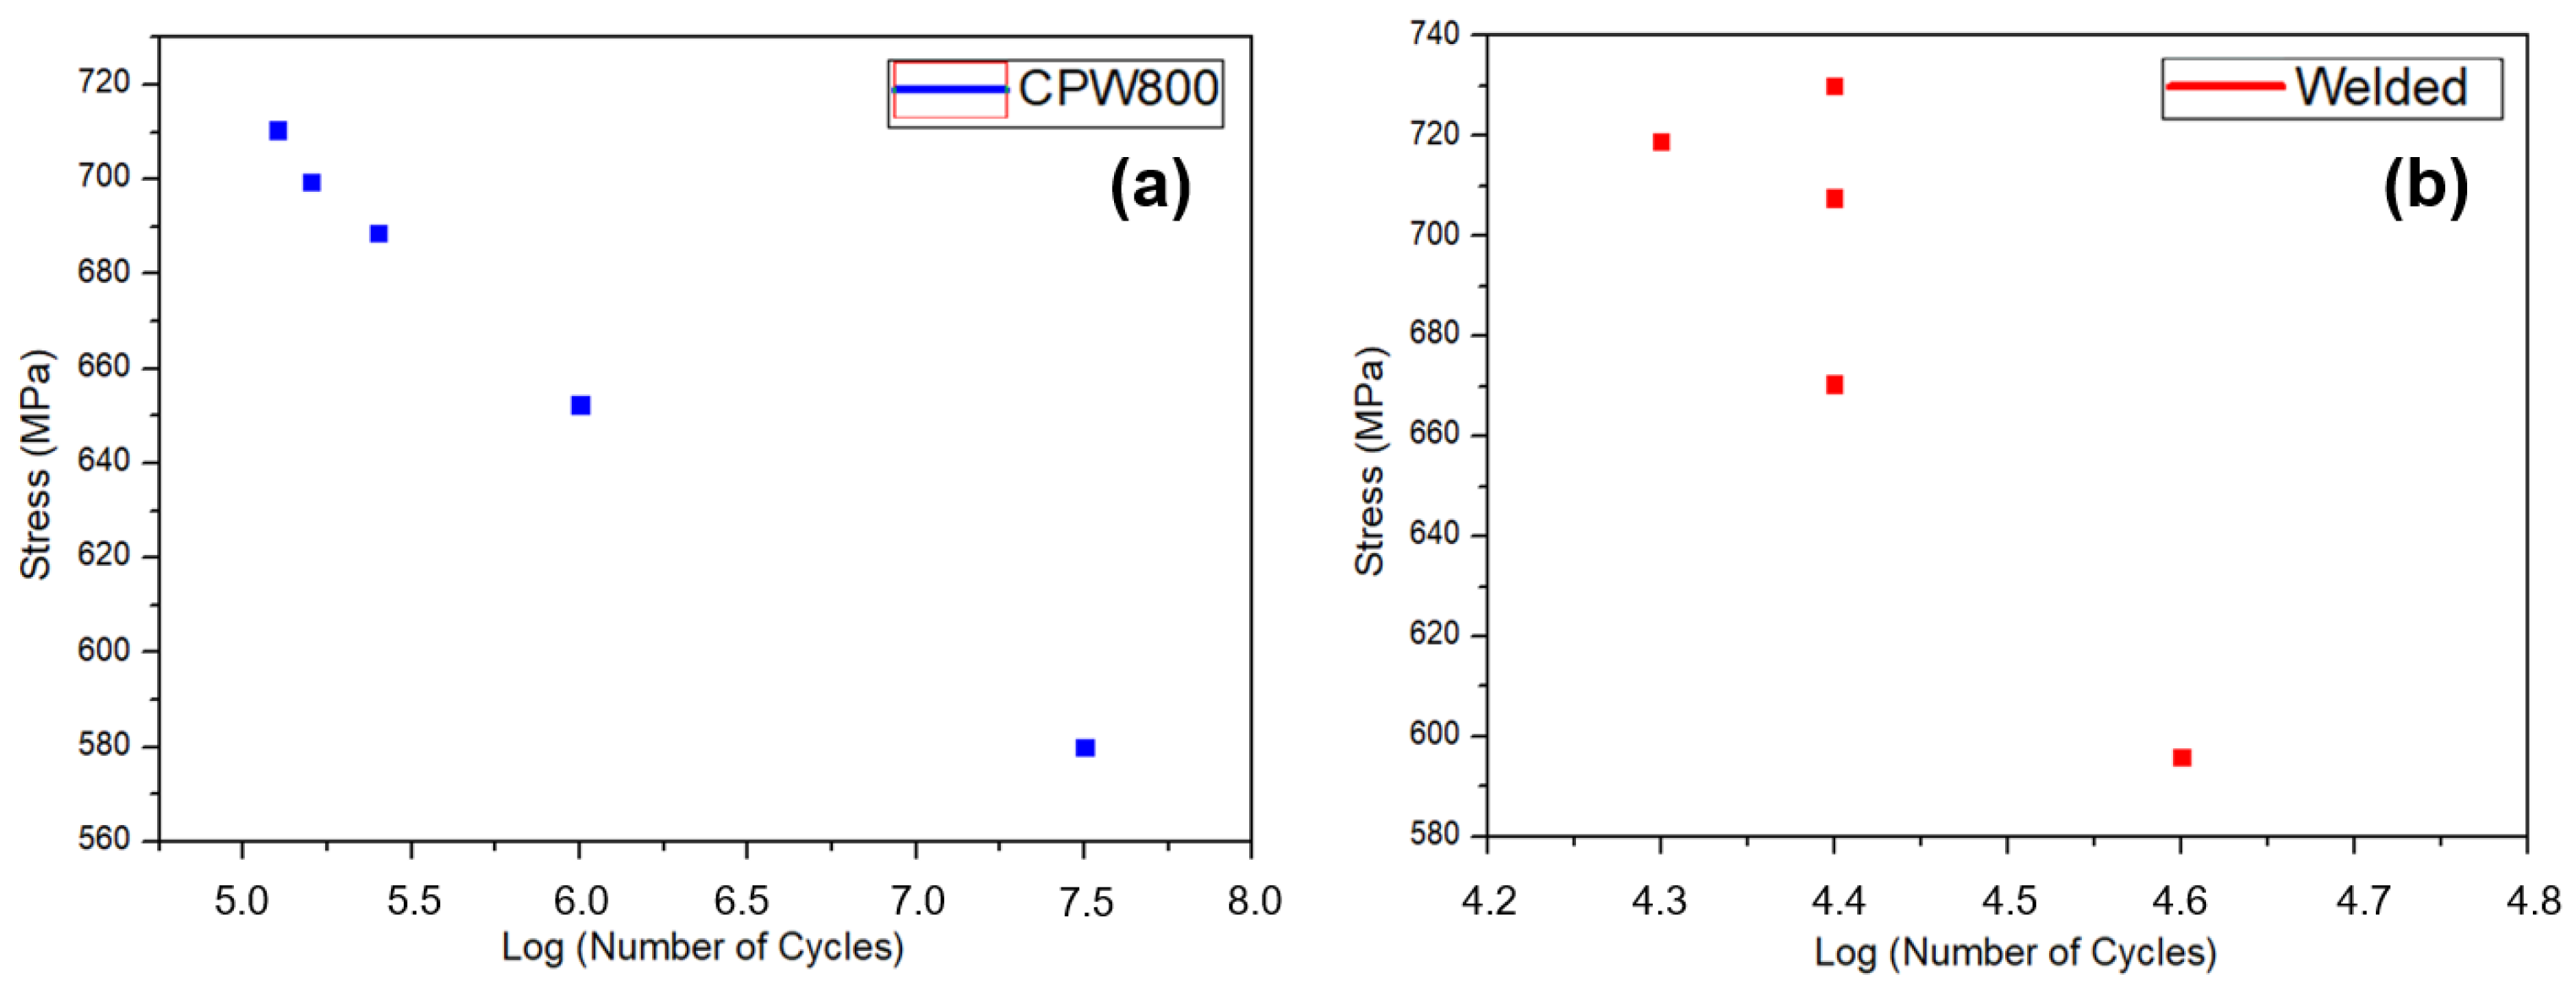
3.3. Fatigue Test
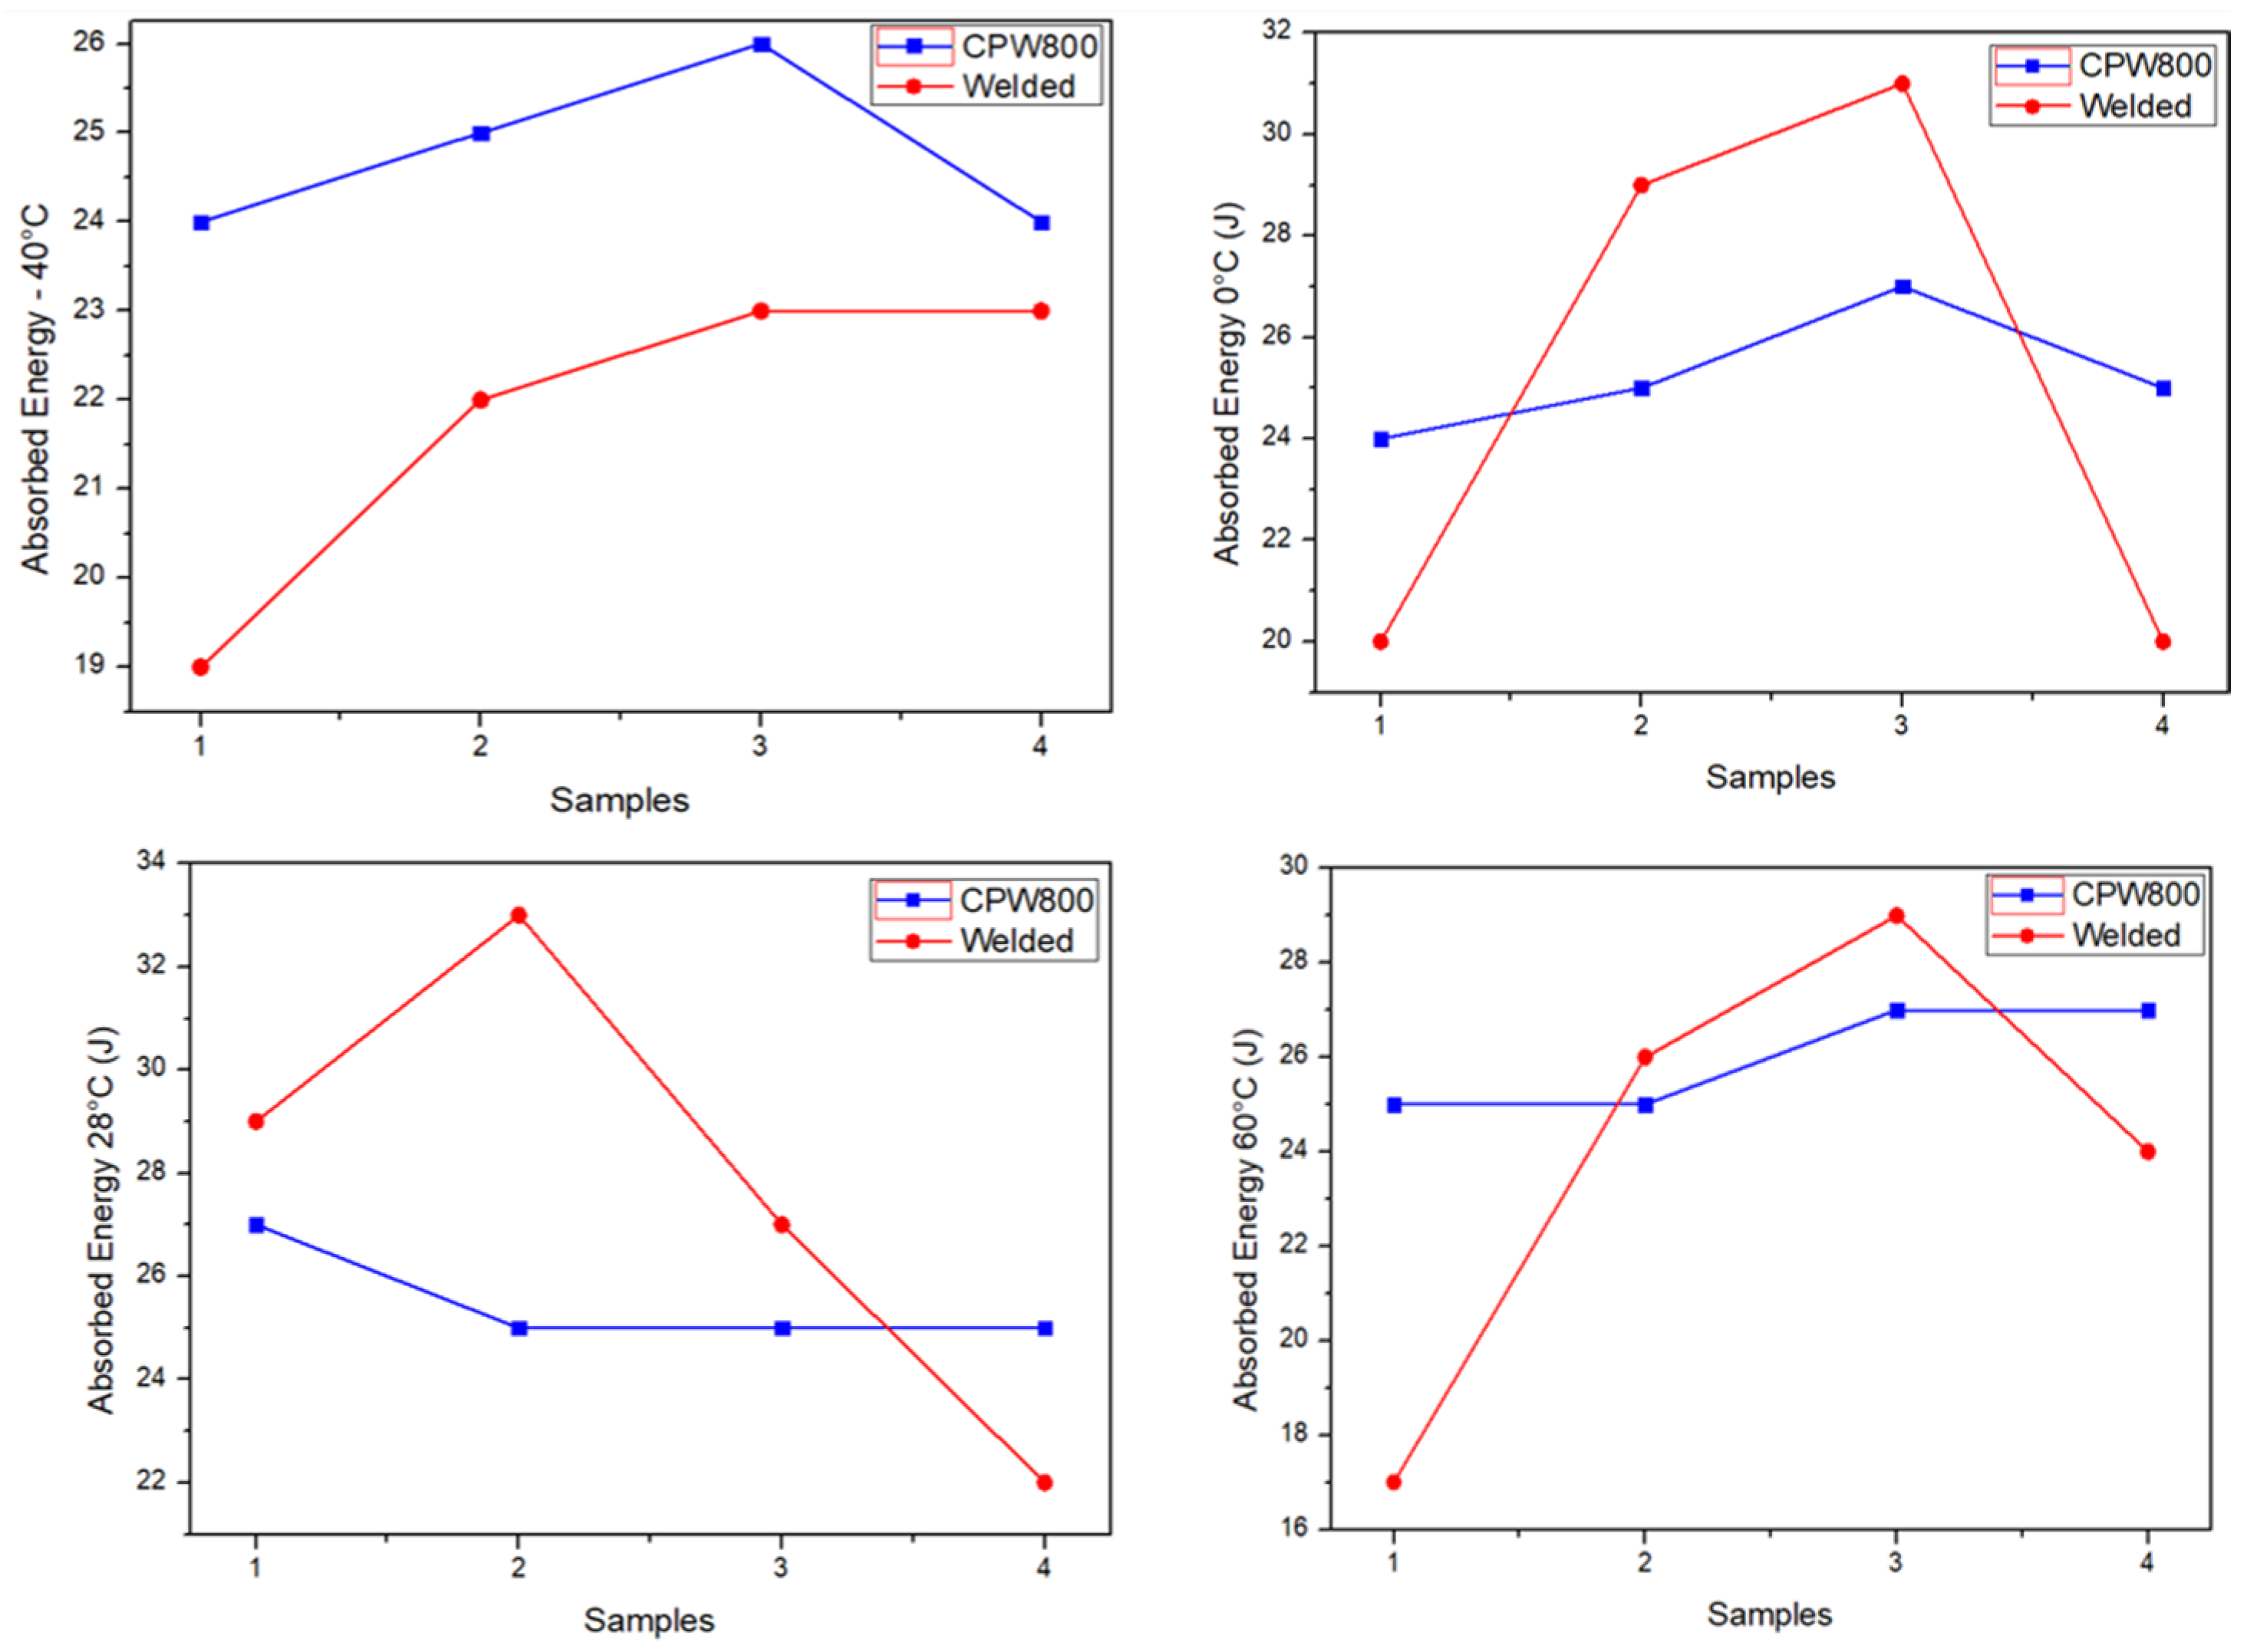
3.4. Impact Test
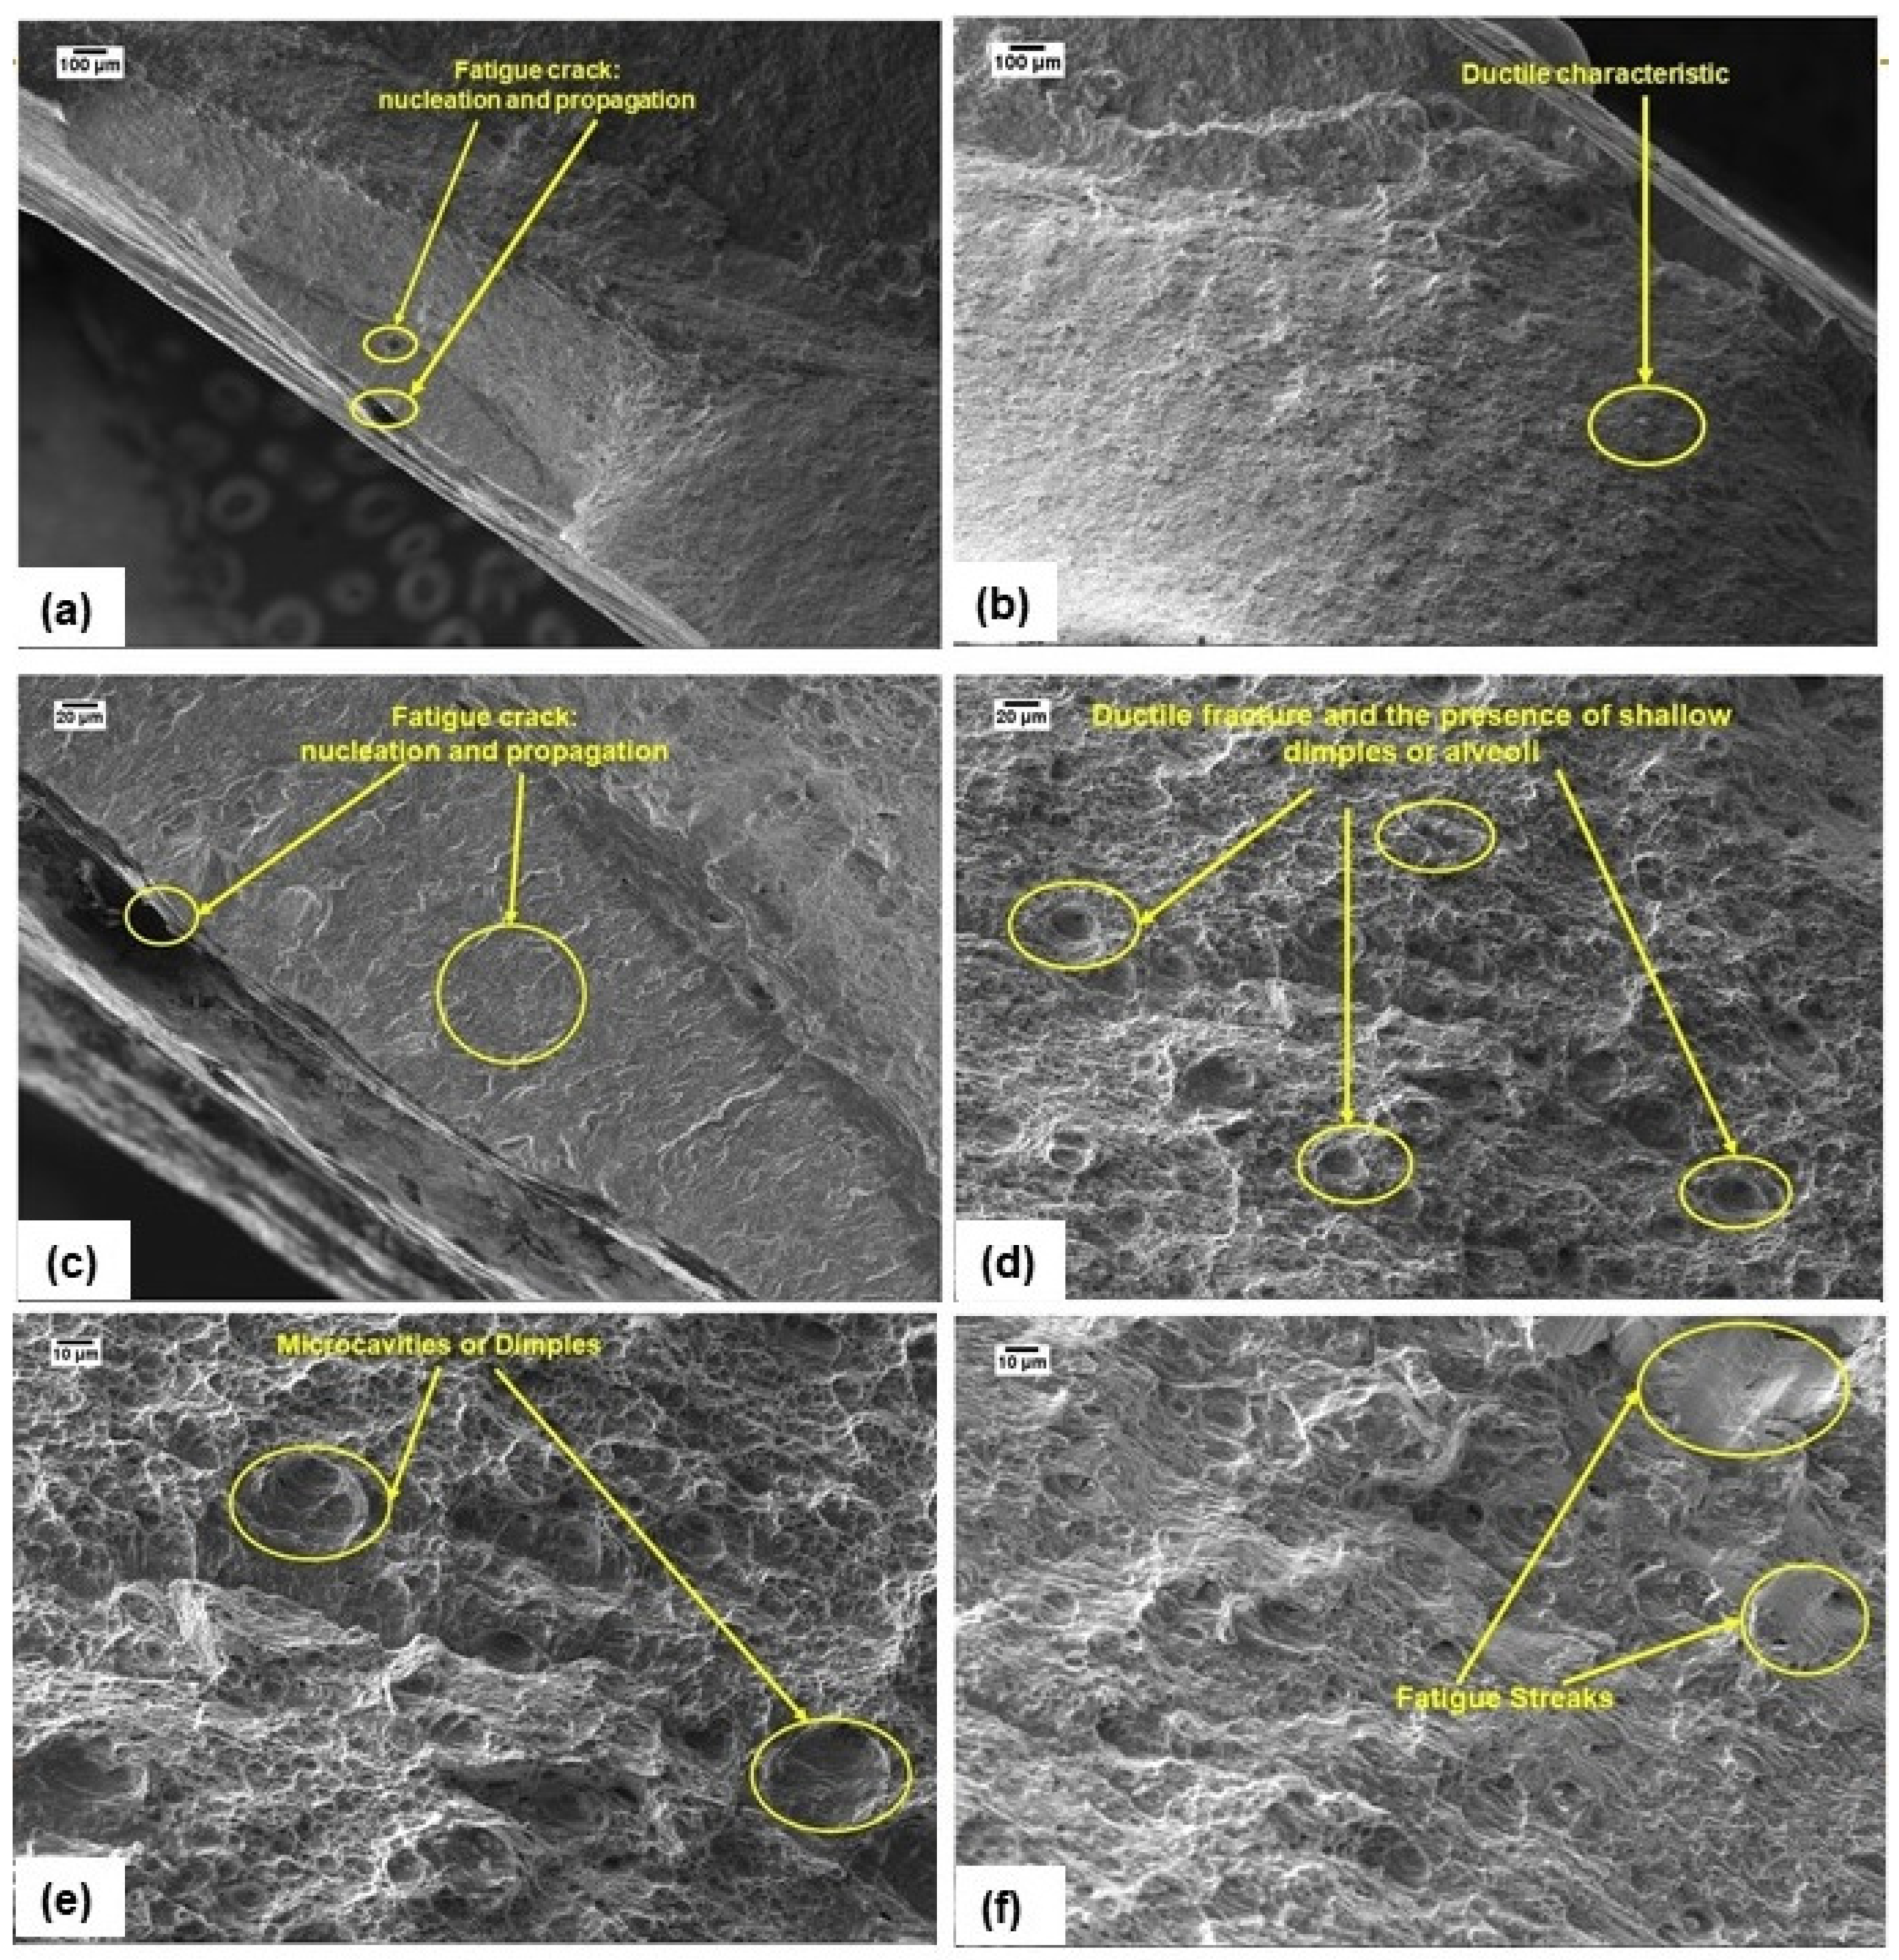
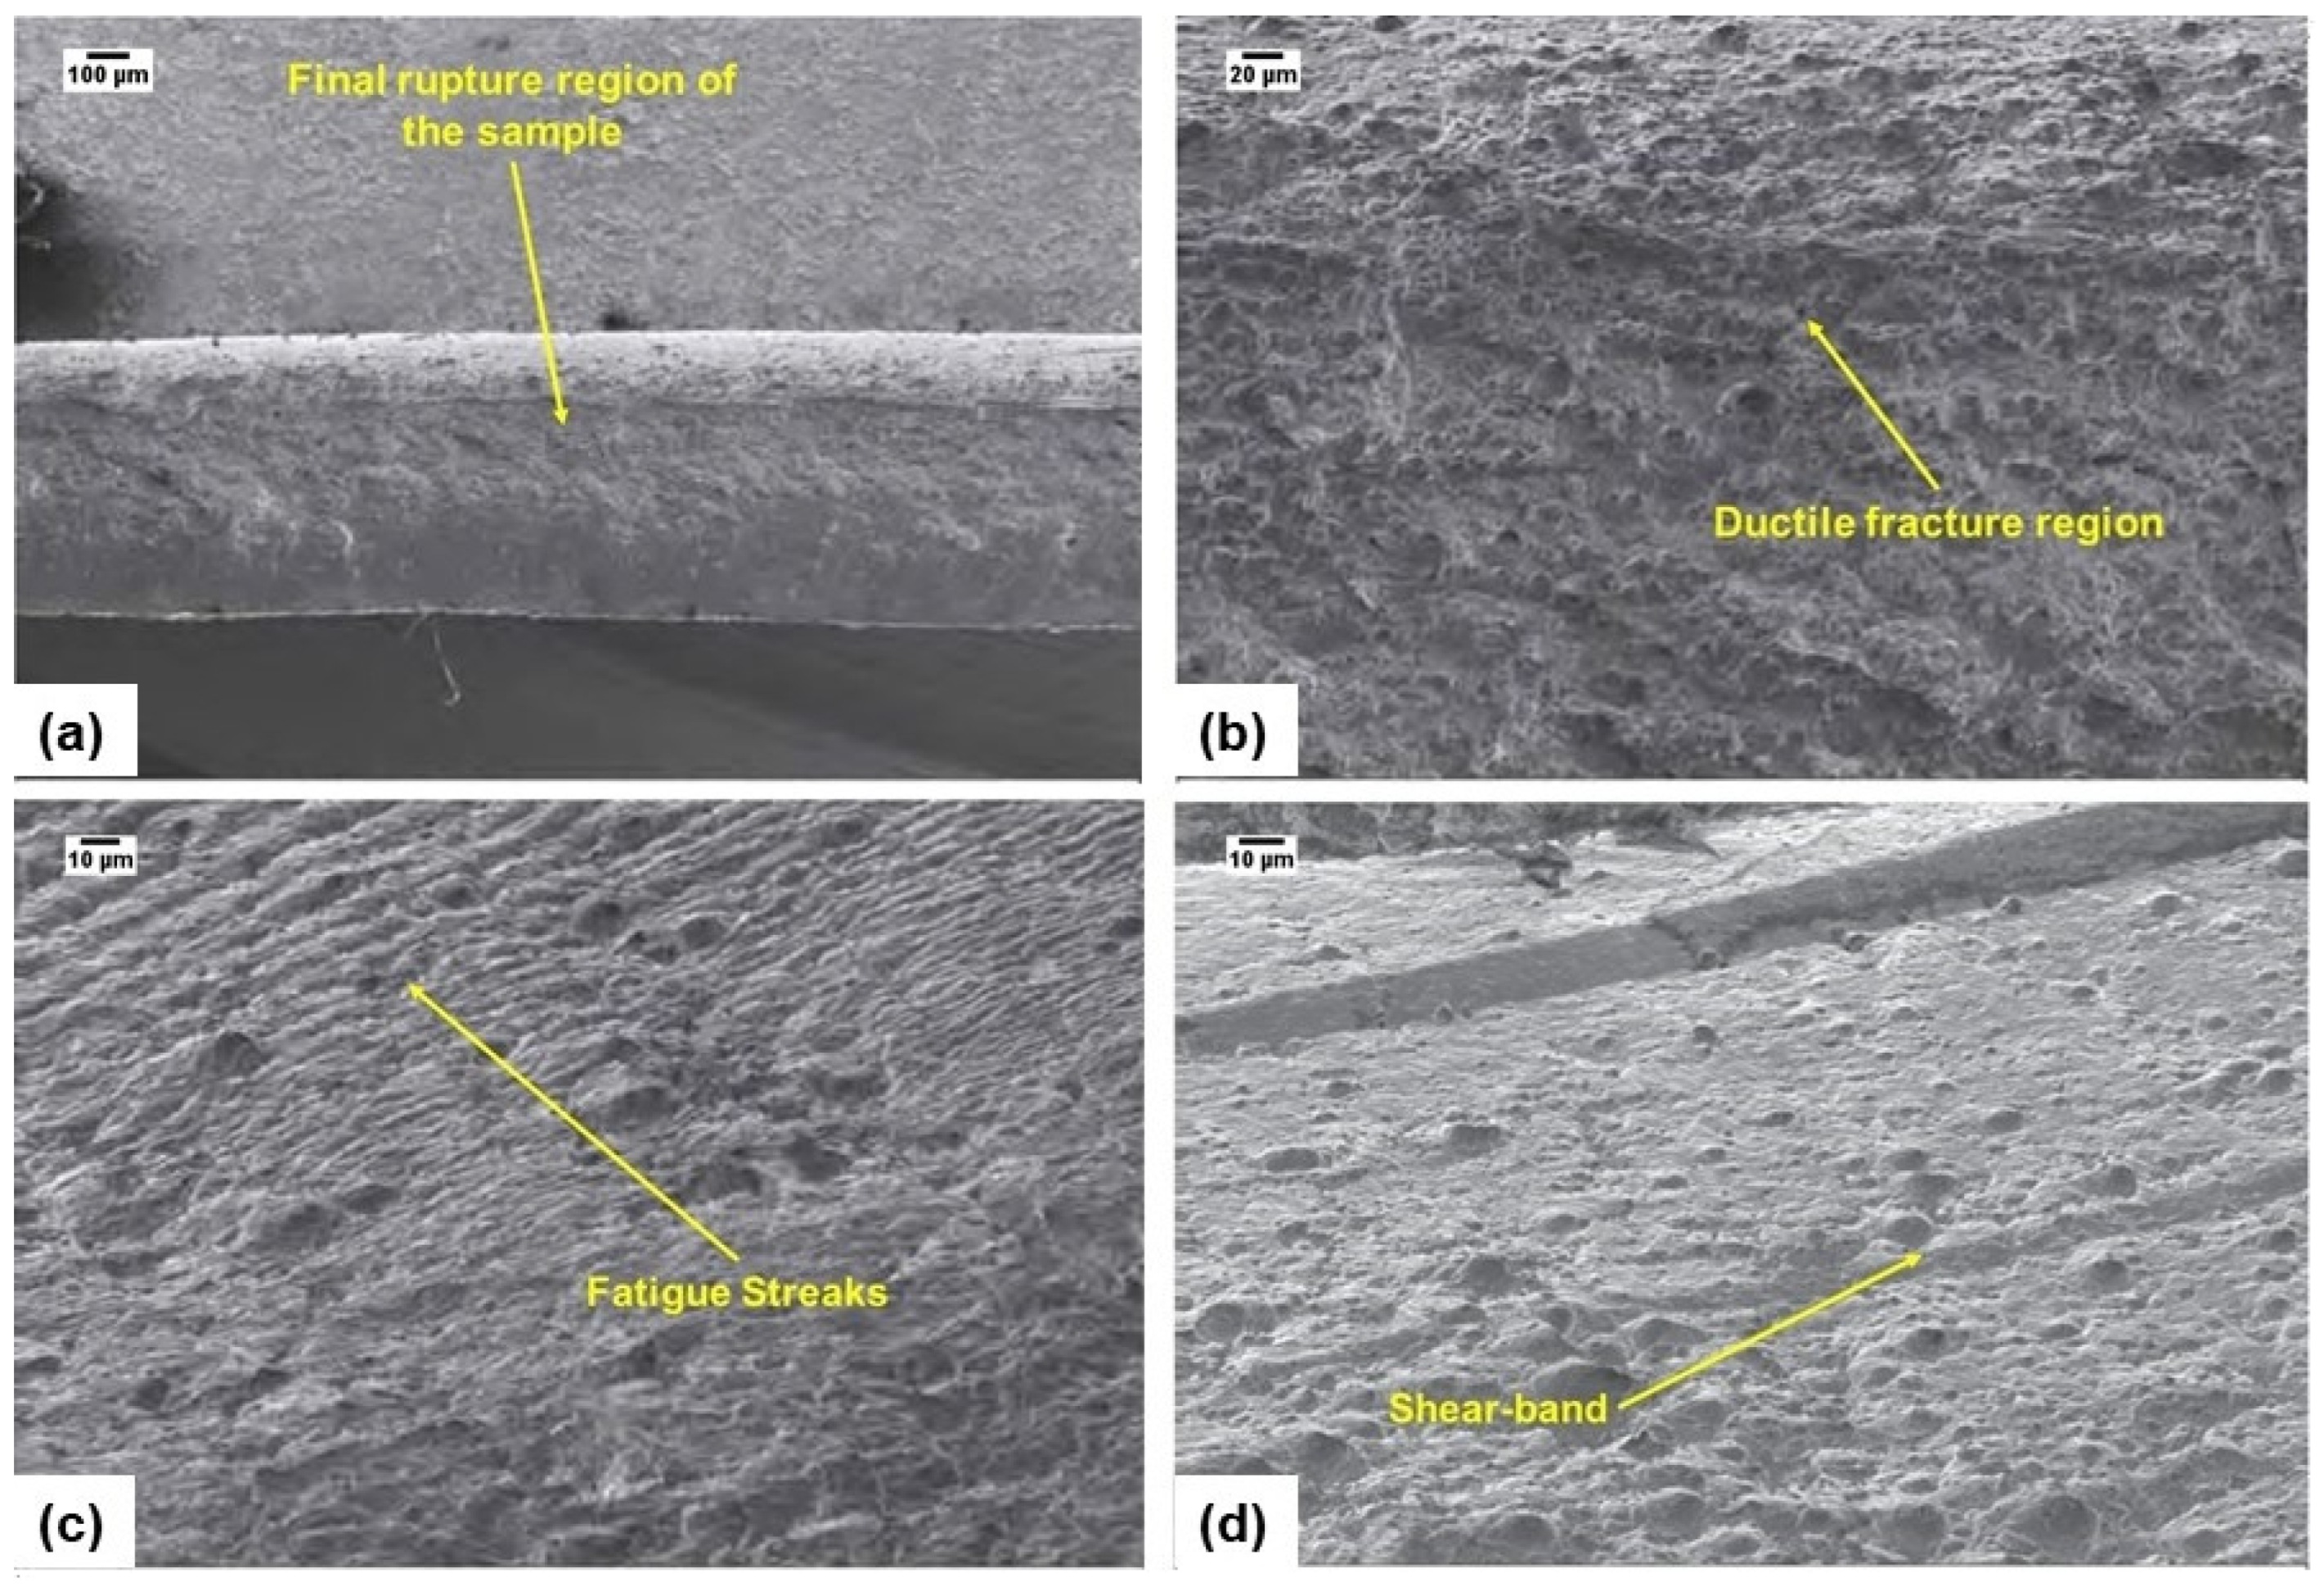
3.5. Fractographic Analysis of Fractured Samples from the Fatigue Test by Scanning Electron Microscopy
4. Conclusions
- Tensile test: Considering Tensile Strength Limit, Yield Limit, and Reduction of Area, the results with and without welding are statistically the same.
- Tensile test: Considering Elongation, the results with and without welding are statistically different.
- Axial fatigue test: Considering the number of cycles, the results with and without welding are statistically different.
- Impact test: Considering absorbed energy, the results with and without welding are statistically the same.
Author Contributions
Funding
Data Availability Statement
Acknowledgments
Conflicts of Interest
References
- Švec, P.; Schrek, A.; Dománková, M. Microstructure evolution of fibre laser welded TRIP and HSLA steel sheets with different thicknesses. Kov. Mater. Met. Mater. 2019, 57, 219–227. [Google Scholar]
- Cho, W.I.; Na, S.J.; Thomy, C.; Vollertsen, F. Numerical simulation of molten pool dynamics in high power disk laser welding. J. Mater. Process. Technol. 2012, 212, 262–275. [Google Scholar] [CrossRef]
- Lü, Y.; Bruhis, M.; Mcdermid, J. Effect of Strain Path on the Microstructural Evolution of a Fe-22Mn-0.6C Alloy. In Proceedings of the AIST International Symposium on New Developments in AHSS, Vail, CO, USA, 23–27 June 2013. [Google Scholar]
- Anbarlooie, B.; Hosseini-Toudeshky, H.; Kadkhodapour, J. High cycle fatigue micromechanical behavior of dual phase steel: Damage initiation, propagation and final failure. Mech. Mater. 2017, 106, 8–19. [Google Scholar] [CrossRef]
- Zheng, Z.B.; Long, J.; Zheng, K.H.; Zhou, H.L.; Li, H.; Zhang, Q.L. Study on the microstructure and impact fracture behavior of martensitic alloy steels. Kov. Mater. Met. Mater. 2019, 57, 189–197. [Google Scholar] [CrossRef]
- Dykeman, J. Advanced High Strength Steel—Recent Progress, Ongoing Challenges, and Future Opportunities. In Proceedings of the International Symposium on New Developments in Advanced High-Strength Sheet Steels, Vail, CO, USA, 19–22 June 2013. [Google Scholar]
- Darabi, A.C.; Chamani, H.R.; Kadkhodapour, J.; Anaraki, A.P.; Alaie, A.; Ayatollahi, M.R. Micromechanical analysis of two heat-treated dual phase steels: DP800 and DP980. Mech. Mater. 2017, 110, 68–83. [Google Scholar] [CrossRef]
- Fonstein, N. Evolution of Advanced High Strength Steels (AHSS) to Meet Automotive Challenges. In Proceedings of the 50th Rolling Seminar—Processes, Rolled and Coated Products, Ouro Preto, MG, Brazil, 18–21 November 2013. [Google Scholar]
- Johnson, R.J.; Moor, E.; Fonstein, N.; Hanlon, D.N.; Pichler, A. Retained Austenite Effects on Hole Expansion of Ultra-High Strength Steels. In Proceedings of the International Symposium on New Developments in Advanced High-Strength Sheet Steels, Vail, CO, USA, 19–22 June 2013. [Google Scholar]
- Dong, D.; Liu, Y.; Yang, Y.; Li, J.; Ma, M.; Jiang, T. Microstructure and dynamic tensile behavior of DP600 dual phase steel joint by laser welding. Mater. Sci. Eng. A 2014, 594, 17–25. [Google Scholar] [CrossRef]
- Kahoul, K. The Path to Industrial Processing of Advanced High-Strength Steel in Continuous Galvanizing Lines. Iron Steel Technol. 2014, 63, 313–318. [Google Scholar]
- Bhargava, M.; Tewari, A.; Mishra, S.K. Forming limit diagram of Advanced High Strength Steels (AHSS) based on strain-path diagram. Mater. Des. 2015, 85, 149–155. [Google Scholar] [CrossRef]
- Kolodziej, S.; Weber, G.; Czulak, A.; Ozgowicz, W. Thermographic analysis of dual-phase steel under quasi-static and dynamic tension. Kov. Mater. Met. Mater. 2019, 57, 45–54. [Google Scholar] [CrossRef]
- Liu, Y.; Dong, D.; Wang, L.; Chu, X.; Wang, P.; Jin, M. Strain rate dependent deformation and failure behavior of laser welded DP780 steel joint under dynamic tensile loading. Mater. Sci. Eng. A 2015, 627, 296–305. [Google Scholar] [CrossRef]
- Squillace, A.; Prisco, U.; Ciliberto, S.; Astarita, A. Effect of welding parameters on morphology and mechanical properties of Ti-6Al-4V laser beam welded butt joints. J. Mater. Process. Technol. 2012, 212, 427–436. [Google Scholar] [CrossRef]
- Han, T.K.; Park, B.G.; Kang, C.Y. Hardening characteristics of CO2 laser welds in advanced high strength steel. Met. Mater. Int. 2012, 18, 473–479. [Google Scholar] [CrossRef]
- Lee, J.H.; Park, S.H.; Kwon, H.S.; Kim, G.S.; Lee, C.S. Laser, tungsten inert gas, and metal active gas welding of DP780 steel: Comparison of hardness, tensile properties and fatigue resistance. Mater. Des. 2014, 64, 559–565. [Google Scholar] [CrossRef]
- Louthan, M.R.; Caskey, G.R.; Donovan, J.A.; Rawl, D.E. Hydrogen embrittlement of metals. Mater. Sci. Eng. 1972, 10, 357–368. [Google Scholar] [CrossRef]
- Wu, T.; Ma, Y.; Xia, H.; Geng, P.; Niendorf, T.; Ma, N. Measurement and simulation of residual stresses in laser welded CFRP/steel lap joints. Compos. Struct. 2022, 292, 15687. [Google Scholar] [CrossRef]
- Schwedler, O.; Zinke, M.; Jüttner, S. Determination of hydrogen input in welded joints of press-hardened 22MnB5 steel. Weld. World 2014, 58, 339–346. [Google Scholar] [CrossRef]
- Reisgen, U.; Schleser, M.; Mokrov, O.; Ahmed, E. Statistical modeling of laser welding of DP/TRIP steel sheets. Opt. Laser Technol. 2012, 44, 92–101. [Google Scholar] [CrossRef]
- Lun, N.; Saha, D.C.; Macwan, A.; Pan, H.; Wang, L.; Goodwin, F.; Zhou, Y. Microstructure and mechanical properties of fibre laser welded medium manganese TRIP steel. Mater. Des. 2017, 131, 450–459. [Google Scholar] [CrossRef]
- Farabi, N.; Chen, D.L.; Zhou, Y. Microstructure and mechanical properties of laser welded dissimilar DP600/DP980 dual-phase steel joints. J. Alloys Compd. 2011, 509, 982–989. [Google Scholar] [CrossRef]
- Paveebunvipak, K.; Uthaisangsuk, V. Microstructure based modeling of deformation and failure of spot-welded advanced high strength steels sheets. Mater. Des. 2018, 160, 731–751. [Google Scholar] [CrossRef]
- Farabi, N.; Chen, D.L.; Li, J.; Zhou, Y.; Dong, S.J. Microstructure and mechanical properties of laser welded DP600 steel joints. Mater. Sci. Eng. A 2010, 527, 1215–1222. [Google Scholar] [CrossRef]
- Kašpar, J.; Němeček, S. Laser welding of high-strength CP steels: Dissimilar welds. Key Eng. Mater. 2015, 647, 141–146. [Google Scholar] [CrossRef]
- Montgomery, D.C.; Runger, G.C. Applied Statistics and Probability for Engineers, 2nd ed.; Wiley: New York, NY, USA, 2009; pp. 312–320. [Google Scholar]
- Refaee, A.; Ataya, S.; Ibrahim, S. Effect of Dual Phase Steel Processing Conditions on the Microstructure and Mechanical Properties. J. Pet. Min. Eng. 2016, 18, 20–26. [Google Scholar] [CrossRef]
- Chao, Y.J.; Ward, J.D., Jr.; Sands, R.G. Charpy impact energy, fracture toughness and ductile–brittle transition temperature of dual-phase 590 Steel. Mater. Des. 2007, 28, 551–557. [Google Scholar] [CrossRef]
- Rosenberg, G.; Sinaiová, I.; Juhar, Ľ. Effect of microstructure on mechanical properties of dual phase steels in the presence of stress concentrators. Mater. Sci. Eng. A 2013, 582, 347–358. [Google Scholar] [CrossRef]
- Du, C.; Wang, X.; Luo, C. Effect of post-weld heat treatment on the microstructure and mechanical properties of the 2205DSS/Q235 laser beam welding joint. J. Mater. Process. Technol. 2019, 263, 138–150. [Google Scholar] [CrossRef]
- Pathak, N.; Butcher, C.; Worswick, M.J.; Belhouse, E.; Gao, J. Damage evolution in complex-phase and dual-phase steels during edge stretching. Materials 2017, 10, 346. [Google Scholar] [CrossRef] [PubMed]
- Mandal, G.; Ghosh, S.K.; Chakrabarti, D.; Chatterjee, S. Correlation Between Structure and Properties of Low-Carbon Cu-Ni-Mo-Ti-Nb Ultrahigh-Strength Steel. J. Mater. Eng. Perform. 2018, 27, 6516–6528. [Google Scholar] [CrossRef]
- Kuril, A.A.; Janaki Ram, G.D.; Bakshi, S.R. Microstructure and mechanical properties of keyhole plasma arc welded dual phase steel DP600. J. Mater. Process. Technol. 2019, 270, 28–36. [Google Scholar] [CrossRef]
- Hance, B.M.; Link, T.M. Effects of fracture area measurement method and tension test specimen type on fracture strain values of 980 class AHSS. In IOP Conference Series: Materials Science and Engineering; IOP Publishing: Wuhan, China, 2019. [Google Scholar]
- Chan, K. Changes in fatigue life mechanism due to soft grains and hard particles. Int. J. Fatigue 2010, 32, 526–534. [Google Scholar] [CrossRef]
- Faria Neto, A.R.; Fukugauchi, C.S.; Pereria, M.S. Using design of experiments in the evaluation of the microstructural characterization parameters with the LePera reagent in a multiphase steel. Mater. Res. Express 2021, 8, 086522. [Google Scholar] [CrossRef]
- Fukugauchi, C.S.; Faria Neto, A.R.; Ribeiro, R.B.; Pereira, M.S. Microstructural Characterization of Dual and Multiphase Steels Applied to Automotive Industry. Mater. Sci. Forum 2014, 775–776, 146–150. [Google Scholar] [CrossRef]
- Dias, E.; Horimoto, L.; Pereira, M.S. Microstructural Characterization of CP Steel Used in Automotive Industry. Mater. Sci. Forum 2014, 775–776, 141–145. [Google Scholar] [CrossRef]
- Elisei, C.C.A. Caracterização Mecânica e Microestrutural de um aço de Baixo Carbono. Ph.D. Thesis, UNESP, São Paulo, Spain, 2008. [Google Scholar]
- Duarte, L.C.; Juchem, P.L.; Pulz, G.M.; Brum, T.M.M.; Chodur, N.; Liccardo, A.; Fischer, A.C.; Acauan, R.B. Aplicações de Microscopia Eletrônica de Varredura (MEV) e Sistema de Energia Dispersiva (EDS) no Estudo de Gemas: Exemplos brasileiros. Pesqui. Em Geociências 2003, 30, 3–15. [Google Scholar] [CrossRef]
- Sierra, G.; Peyre, P.; Deschaux-Beaume, F.; Stuart, D.; Fras, G. Steel to aluminium key-hole laser welding. Mater. Sci. Eng. A 2007, 447, 197–208. [Google Scholar] [CrossRef]
- Wanh, P.; Chen, X.; Pan, Q.; Madigan, B.; Long, J. Laser welding dissimilar materials of aluminum to steel: An overview. Int. J. Adv. Manuf. Technol. 2016, 87, 3081–3090. [Google Scholar]
- Wang, T.; Zhang, Y.; Li, X.; Zhang, B.; Feng, J. Influence of beam current on microstructures and mechanical properties of electron beam welding-brazed aluminum-steel joints with an Al5Si filler wire. Vacuum 2017, 141, 281–287. [Google Scholar] [CrossRef]
- Zhou, D.W.; Liu, J.S.; Lu, Y.Z.; Xu, S.H. Effect of adding powder on joint properties of laser penetration welding for dual phase steel and aluminum alloy. Opt. Laser Technol. 2017, 94, 171–179. [Google Scholar] [CrossRef]
- Seffer, O.; Pfeifer, R.; Springer, A.; Kaierle, S. Investigations on laser beam welding of different dissimilar joints of steel and aluminum alloys for automotive lightweight construction. Phys. Procedia 2016, 83, 383–395. [Google Scholar] [CrossRef]
- Meco, S.; Cozzolino, L.; Ganguly, S.; Williams, S.; Mcpherson, N. Laser welding of steel to aluminium: Thermal modeling and joint strength analysis. J. Mater. Process. Technol. 2017, 247, 121–133. [Google Scholar] [CrossRef]
- Perka, A.K.; John, M.; Kuruveri, U.B.; Menezes, P.L. Advanced high-strength steels for automotive applications: Arc and laser welding process, properties, and challenges. Metals 2022, 6, 1051. [Google Scholar] [CrossRef]
- Biro, E.; McDermid, J.R.; Embury, J.D.; Zhou, T. Softening kinetics in the subcritical heat-affected zone of dual-phase steel welds. Metall. Mater. Trans. A 2010, 41, 2348–2356. [Google Scholar] [CrossRef]
- Morawiec, M.; Ròzanski, M.; Grajcar, A.; Stano, S. Effect of dual beam laser welding on microstructure-property relationships of hot-rolled complex phase steel sheets. Arch. Civ. Mech. Eng. 2017, 17, 145–153. [Google Scholar] [CrossRef]
- Park, T.J.; Yu, J.W.; Kang, J.I.; Han, T.K.; Chin, K.K.; Kang, C.Y. Effect of B contents on hardness characteristics of disc laser beam welded CP steels. J. Korean Weld. Soc. 2011, 29, 107–114. [Google Scholar]
- Kong, J.P.; Han, T.K.; Chin, K.G.; Park, B.G.; Kang, C.Y. Effect of boron content and welding current on the mechanical properties of electrical resistance spot welds in complexphase steels. Mater. Des. 2014, 54, 598–609. [Google Scholar] [CrossRef]
- Yushchenko, K.A.; Romanova, V.A.; Balokhonov, R.R.; Savchenko, V.S.; Chervyakov, N.O.; Zvyagintseva, A.V. Experimental study and modelling of thermal-deformation processes occurring in welded joints on nickel superalloys. Paton Weld. J. 2012, 10, 2–9. [Google Scholar]
- Lambert-Perlade, A.; Gourgues, A.F.; Pineau, A. Austenite to Bainite Phase Transformation in the Heat-Affected Zone of a High Strength Low Alloy Steel. Acta Mater. 2004, 52, 2337–2348. [Google Scholar] [CrossRef]
- Lan, L.Y.; Qiu, C.L.; Zhao, D.W.; Gao, X.H.; Du, L.X. Microstructural Characteristics and Toughness of the Simulated Coarse Grained Heat Affected Zone of High Strength Low Carbon Bainitic Steel. Mater. Sci. Eng. A 2011, 529, 192–200. [Google Scholar] [CrossRef]
- MENG, W.; Li, Z.; Huang, J.; Wu, Y.; Katayama, S. Microstructure and Softening of Laser-Welded 960áMPa Grade High Strength Stee61Joints. J. Mater. Eng. Perform. 2014, 23, 538–544. [Google Scholar] [CrossRef]
- Różański, M.; Morawiek, M.; Grajcar, A. Modified twin-spot laser welding of complex phase steel. Arch. Metall. Mater. 2016, 61, 1999–2008. [Google Scholar] [CrossRef]
- Sun, H.; Wei, K.; Yang, X.; Wu, Y. Effects of pre-strain and annealing on the fatigue properties of complex phase steel CP800. Int. J. Fatigue 2020, 131, 105364. [Google Scholar] [CrossRef]
- Karelova, A.; Krempaszky, C.; Werner, E.; Tsipouridis, P.; Hebesberger, T.; Pichler, A. A Hole Expansion of Dual-phase and Complex-phase Steel. Steel Res. Int. 2010, 80, 71–77. [Google Scholar]
- Kuziak, R.; Kawalla, R. Advanced high strength steels for automotive industry. Arch. Civ. Mech. Eng. 2008, 8, 103–117. [Google Scholar] [CrossRef]
- The Fabricator. Available online: https://www.thefabricator.com/thefabricator/article/metalsmaterials/introduction-to-advanced-high-strength-steels---part-i (accessed on 2 July 2024).
- Arcelormittal Europe Communications. Complex Phase Steel—Automotive Worldwide, European ed.; ArcelorMittal SSC Deutschland GmbH: Burg, Germany, 2024. [Google Scholar]
- Zhou, W.; Wang, H.B.; Huo, Q.H.; Cui, H.C. Investigation into Microstructure and Fatigue Properties of Complex Phase Steel. J. Mater. Eng. Perform. 2024, 33, 4482–4491. [Google Scholar] [CrossRef]
- Ma, N.; Park, T.; Kim, D.; Seok, D.Y.; Kim, C.; Chung, K. Evaluation of charpy impact test performance for advanced high-strength steel sheets based on a damage model. Int. J. Mater. Form. 2010, 3, 183–186. [Google Scholar] [CrossRef]
- Grajcar, A.; Różański, M.; Kamińska, M.; Grzegorczyk, B. Study on Non-Metallic Inclusions in Laser-Welded TRIP-Aided Nb-Microalloyed Steel. Arch. Metall. Mater. 2014, 59, 1163–1169. [Google Scholar] [CrossRef]
- Aghaie-Khafri, M. Hot deformation of 15-5 PH stainless steel. Mater. Sci. Eng. A 2010, 527, 1052–1057. [Google Scholar] [CrossRef]
- Miyaura, E.H. Effect of Residual Stress on Crack Propagation in Welded Joints by FSW. Master’s Thesis, UNICAMP, Campinas, Spain, 2012. [Google Scholar]
- Bathias, C.; Drouillac, L.; Le François, P. How and why the fatigue s-n curve does not approach a horizontal asymptote. Int. J. Fatigue 2001, 23, 143–151. [Google Scholar] [CrossRef]
- Lin, T.H.; Ito, Y.M. Mechanics of a fatigue crack nucleation mechanism. J. Mech. Phys. Solids 1969, 17, 511–523. [Google Scholar] [CrossRef]
- Lo, K.H.; Shek, C.H.; Lai, J.K.L. Recent developments in stainless steels. Mater. Sci. Eng. 2009, 65, 39–104. [Google Scholar] [CrossRef]
- Schijve, J. Fatigue of structures and materials in the 20th century and the state of the art. Int. J. Fatigue 2003, 25, 679–702. [Google Scholar] [CrossRef]
- Hertzberg, R.W. Deformation and Fracture Mechanics of Engineering Materials, 6th ed.; John Wiley & Sons: New York, NY, USA, 2012. [Google Scholar]
- Calliste, W.D., Jr.; Rethwisch, D.G. Materials Science and Engineering an Introduction, 6th ed.; John Wiley & Sons: New York, NY, USA, 2003. [Google Scholar]


| Tensile Strength Limit (MPa) | Yield Limit (MPa) | Elongation (%) | Reduction of Area (%) | |||||
|---|---|---|---|---|---|---|---|---|
| CPW800 | Welded | CPW800 | Welded | CPW800 | Welded | CPW800 | Welded | |
| Mean | 824 ± 21 | 817 ± 27 | 725 ± 18 | 745 ± 18 | 17 ± 1 | 25 ± 5 | 60 ± 6 | 64 ± 6 |
| Parameter | Median | p-Value | ||
|---|---|---|---|---|
| CPW800 | Welded | CPW800 | Welded | |
| Tensile Strength Limit (MPa) | 820 | 814 | 0.834 | 0.834 |
| Yield Limit (MPa) | 721 | 743 | 0.140 | 0.141 |
| Elongation (%) | 17 | 28 | 0.003 | 0.003 |
| Reduction of Area (%) | 60 | 67 | 0.598 | 0.600 |
| 98% | 96.5% | 95% | 90% | 80% | |
|---|---|---|---|---|---|
| CPW 800 | 95,159 | 216,378 | 168,138 | 1,000,000 | >1,000,000 |
| 112,521 | 126,967 | 291,583 | 1,000,000 | >1,000,000 | |
| 131,117 | 136,155 | 214,850 | 1,000,000 | >1,000,000 | |
| Mean | 112,932 | 159,833 | 224,857 | 1,000,000 | >1,000,000 |
| SD | 17,982 | 49,184 | 62,328 | 0 | 0 |
| Welded | 17,143 | 27,744 | 28,284 | 21,346 | 42,016 |
| 17,383 | 16,223 | 25,303 | 19,223 | 46,720 | |
| 32,778 | 19,246 | 16,035 | 31,192 | 42,148 | |
| Mean | 22,435 | 21,071 | 23,207 | 23,920 | 43,628 |
| SD | 8958 | 5973 | 6388 | 6386 | 2679 |
| Parameter | Median | p-Value | ||
|---|---|---|---|---|
| CPW800 | Welded | CPW800 | Welded | |
| Number of Cycles | 216,378 | 25,303 | 0.000 | 0.000 |
| Temperature | −40 °C | 0 °C | 28 °C | 60 °C | |
|---|---|---|---|---|---|
| Absorbed Energy (J) | CPW 800 | 24 | 24 | 27 | 25 |
| 25 | 25 | 25 | 25 | ||
| 26 | 27 | 25 | 27 | ||
| 24 | 25 | 25 | 27 | ||
| Mean | 25 | 25 | 26 | 26 | |
| ST | 1 | 1 | 1 | 1 | |
| Absorbed Energy (J) | Welded | 19 | 20 | 29 | 17 |
| 22 | 29 | 33 | 26 | ||
| 23 | 31 | 27 | 29 | ||
| 23 | 20 | 22 | 24 | ||
| Mean | 22 | 25 | 28 | 24 | |
| ST | 2 | 6 | 5 | 5 | |
| Absorbed Energy (J) | CPW800 | Welded | ||
|---|---|---|---|---|
| Median | p-Value | Median | p-Value | |
| −40 °C | 25 | 0.019 | 23 | 0.021 |
| 0 °C | 25 | 1.000 | 25 | 1.000 |
| 28 °C | 25 | 0.297 | 28 | 0.312 |
| 60 °C | 26 | 0.559 | 25 | 0.564 |
Disclaimer/Publisher’s Note: The statements, opinions and data contained in all publications are solely those of the individual author(s) and contributor(s) and not of MDPI and/or the editor(s). MDPI and/or the editor(s) disclaim responsibility for any injury to people or property resulting from any ideas, methods, instructions or products referred to in the content. |
© 2024 by the authors. Licensee MDPI, Basel, Switzerland. This article is an open access article distributed under the terms and conditions of the Creative Commons Attribution (CC BY) license (https://creativecommons.org/licenses/by/4.0/).
Share and Cite
Neto, A.d.R.d.F.; Dias, E.X.; Fukugauchi, C.S.; Martins, M.S.; Pereira, M.d.S. Mechanical and Microstructural Characterization of Class 800 Complex Phase Steel before and after the Laser Welding Process. J. Manuf. Mater. Process. 2024, 8, 232. https://doi.org/10.3390/jmmp8050232
Neto AdRdF, Dias EX, Fukugauchi CS, Martins MS, Pereira MdS. Mechanical and Microstructural Characterization of Class 800 Complex Phase Steel before and after the Laser Welding Process. Journal of Manufacturing and Materials Processing. 2024; 8(5):232. https://doi.org/10.3390/jmmp8050232
Chicago/Turabian StyleNeto, Antonio dos Reis de Faria, Erica Ximenes Dias, Cristina Sayuri Fukugauchi, Marcelo Sampaio Martins, and Marcelo dos Santos Pereira. 2024. "Mechanical and Microstructural Characterization of Class 800 Complex Phase Steel before and after the Laser Welding Process" Journal of Manufacturing and Materials Processing 8, no. 5: 232. https://doi.org/10.3390/jmmp8050232
APA StyleNeto, A. d. R. d. F., Dias, E. X., Fukugauchi, C. S., Martins, M. S., & Pereira, M. d. S. (2024). Mechanical and Microstructural Characterization of Class 800 Complex Phase Steel before and after the Laser Welding Process. Journal of Manufacturing and Materials Processing, 8(5), 232. https://doi.org/10.3390/jmmp8050232