

Synchronized Multi-Laser Powder Bed Fusion (M-LPBF) Additive Manufacturing: A Technique for Controlling the Microstructure of Ti–6Al–4V

Abstract

1. Introduction
2. Governing Equations and Model Verification
3. Results and Discussion
4. Conclusions
Supplementary Materials
Author Contributions
Funding
Institutional Review Board Statement
Informed Consent Statement
Data Availability Statement
Acknowledgments
Conflicts of Interest
References
- Leung, C.L.A.; Marussi, S.; Atwood, R.C.; Towrie, M.; Withers, P.J.; Lee, P.D. In situ X-ray imaging of defect and molten pool dynamics in laser additive manufacturing. Nat. Commun. 2018, 9, 1355. [Google Scholar] [CrossRef] [PubMed]
- MacDonald, E.; Wicker, R. Multiprocess 3D printing for increasing component functionality. Science 2016, 353, aaf2093. [Google Scholar] [CrossRef] [PubMed]
- Lewandowski, J.J.; Seifi, M. Metal Additive Manufacturing: A Review of Mechanical Properties. Annu. Rev. Mater. Res. 2016, 46, 151–186. [Google Scholar] [CrossRef]
- Wu, X.; Liang, J.; Mei, J.; Mitchell, C.; Goodwin, P.; Voice, W. Microstructures of laser-deposited Ti–6Al–4V. Mater. Des. 2004, 25, 137–144. [Google Scholar] [CrossRef]
- Gu, X.-H.; Lu, T.; Zhang, T.; Guo, W.; Pan, Y.; Dai, T. Anisotropy of microstructures and mechanical properties in FeCoNiCr0.5 high-entropy alloy prepared via selective laser melting. Rare Met. 2022, 41, 2047–2054. [Google Scholar] [CrossRef]
- Best, J.P.; Maeder, X.; Michler, J.; Spierings, A.B. Mechanical Anisotropy Investigated in the Complex SLM-Processed Sc- and Zr-Modified Al–Mg Alloy Microstructure. Adv. Eng. Mater. 2019, 21, 1801113. [Google Scholar] [CrossRef]
- Kaya, A.C.; Salamci, M.U.; Fleck, C. Influence of anisotropy on the deformation behaviour in microtensile 316L steel specimens fabricated by laser powder bed fusion (PBF-LB/M). Mater. Sci. Eng. A 2023, 863, 144521. [Google Scholar] [CrossRef]
- Huang, G.; He, G.; Liu, Y.; Huang, K. Anisotropy of microstructure, mechanical properties and thermal expansion in Invar 36 alloy fabricated via laser powder bed fusion. Addit. Manuf. 2024, 82, 104025. [Google Scholar] [CrossRef]
- Prost, M.; Köster, A.; Missoum-Benziane, D.; Dépinoy, S.; Ferhat, L.; Rambaudon, M.; Maurel, V. Anisotropy in cyclic behavior and fatigue crack growth of IN718 processed by laser powder bed fusion. Addit. Manuf. 2023, 61, 103301. [Google Scholar] [CrossRef]
- Yin, J.; Peng, G.; Chen, C.; Yang, J.; Zhu, H.; Ke, L.; Wang, Z.; Wang, D.; Ma, M.; Wang, G.; et al. Thermal behavior and grain growth orientation during selective laser melting of Ti-6Al-4V alloy. J. Mech. Work. Technol. 2018, 260, 57–65. [Google Scholar] [CrossRef]
- Bontha, S.; Klingbeil, N.W.; Kobryn, P.A.; Fraser, H.L. Effects of process variables and size-scale on solidification microstructure in beam-based fabrication of bulky 3D structures. Mater. Sci. Eng. A 2009, 513–514, 311–318. [Google Scholar] [CrossRef]
- Cloots, M.; Uggowitzer, P.J.; Wegener, K. Investigations on the microstructure and crack formation of IN738LC samples processed by selective laser melting using Gaussian and doughnut profiles. Mater. Des. 2016, 89, 770–784. [Google Scholar] [CrossRef]
- Hadibeik, S.; Ghasemi-Tabasi, H.; Burn, A.; Lani, S.; Spieckermann, F.; Eckert, J. Controlling the Glassy State toward Structural and Mechanical Enhancement: Additive Manufacturing of Bulk Metallic Glass Using Advanced Laser Beam Shaping Technology. Adv. Funct. Mater. 2024, 34, 2311118. [Google Scholar] [CrossRef]
- Bayat, M.; Rothfelder, R.; Schwarzkopf, K.; Zinoviev, A.; Zinovieva, O.; Spurk, C.; Hummel, M.; Olowinsky, A.; Beckmann, F.; Moosmann, J.; et al. Exploring spatial beam shaping in laser powder bed fusion: High-fidelity simulation and in-situ monitoring. Addit. Manuf. 2024, 93, 104420. [Google Scholar] [CrossRef]
- Roehling, T.T.; Shi, R.; Khairallah, S.A.; Roehling, J.D.; Guss, G.M.; McKeown, J.T.; Matthews, M.J. Controlling grain nucleation and morphology by laser beam shaping in metal additive manufacturing. Mater. Des. 2020, 195, 109071. [Google Scholar] [CrossRef]
- Attariani, H.; Petitjean, S.R.; Dousti, M. A digital twin of synchronized circular laser array for powder bed fusion additive manufacturing. Int. J. Adv. Manuf. Technol. 2022, 123, 1433–1440. [Google Scholar] [CrossRef]
- Vorontsov, M.A. Additive Manufacturing in Metals with a Fiber Array Laser Source and Adaptive Multi-Beam Shaping. U.S. Patent No. 11117218B2, 18 May 2024. Available online: https://patents.google.com/patent/US11117218B2/en (accessed on 18 October 2024).
- Evans, R.; Gockel, J. Modeling the effects of coordinated multi-beam additive manufacturing. Int. J. Adv. Manuf. Technol. 2021, 115, 1075–1087. [Google Scholar] [CrossRef]
- Lewandowski, G. Engineering of Temperature Profiles for Location-Specific Control of Material Micro-Structure in Laser Powder Bed Fusion Additive Manufacturing. Master’s Thesis, University of Dayton, Dayton, OH, USA, 2020. [Google Scholar]
- Promoppatum, P.; Yao, S.-C.; Pistorius, P.C.; Rollett, A.D. A Comprehensive Comparison of the Analytical and Numerical Prediction of the Thermal History and Solidification Microstructure of Inconel 718 Products Made by Laser Powder-Bed Fusion. Engineering 2017, 3, 685–694. [Google Scholar] [CrossRef]
- Dezfoli, A.R.A.; Hwang, W.-S.; Huang, W.-C.; Tsai, T.-W. Determination and controlling of grain structure of metals after laser incidence: Theoretical approach. Sci. Rep. 2017, 7, srep41527. [Google Scholar] [CrossRef]
- Heeling, T.; Wegener, K. The effect of multi-beam strategies on selective laser melting of stainless steel 316L. Addit. Manuf. 2018, 22, 334–342. [Google Scholar] [CrossRef]
- Heeling, T.; Wegener, K. Computational Investigation of Synchronized Multibeam Strategies for the Selective Laser Melting Process. Phys. Procedia 2016, 83, 899–908. [Google Scholar] [CrossRef]
- Wilkes, J.; Hagedorn, Y.; Meiners, W.; Wissenbach, K. Additive manufacturing of ZrO2-Al2O3 ceramic components by selective laser melting. Rapid Prototyp. J. 2013, 19, 51–57. [Google Scholar] [CrossRef]
- Abe, F.; Osakada, K.; Shiomi, M.; Uematsu, K.; Matsumoto, M. The manufacturing of hard tools from metallic powders by selective laser melting. J. Mech. Work. Technol. 2001, 111, 210–213. [Google Scholar] [CrossRef]
- Zhang, W.; Tong, M.; Harrison, N.M. Scanning strategies effect on temperature, residual stress and deformation by multi-laser beam powder bed fusion manufacturing. Addit. Manuf. 2020, 36, 101507. [Google Scholar] [CrossRef]
- Gerstgrasser, M.; Cloots, M.; Stirnimann, J.; Wegener, K. Residual stress reduction of LPBF-processed CM247LC samples via multi laser beam strategies. Int. J. Adv. Manuf. Technol. 2021, 117, 2093–2103. [Google Scholar] [CrossRef]
- Tsai, C.-Y.; Cheng, C.-W.; Lee, A.-C.; Tsai, M.-C. Synchronized multi-spot scanning strategies for the laser powder bed fusion process. Addit. Manuf. 2019, 27, 1–7. [Google Scholar] [CrossRef]
- Li, Z.; Kuai, Z.; Bai, P.; Nie, Y.; Fu, G.; Liu, W.; Yang, S. Microstructure and Tensile Properties of AlSi10Mg Alloy Manufactured by Multi-Laser Beam Selective Laser Melting (SLM). Metals 2019, 9, 1337. [Google Scholar] [CrossRef]
- Zhang, C.; Zhu, H.; Hu, Z.; Zhang, L.; Zeng, X. A comparative study on single-laser and multi-laser selective laser melting AlSi10Mg: Defects, microstructure and mechanical properties. Mater. Sci. Eng. A 2019, 746, 416–423. [Google Scholar] [CrossRef]
- Graf, G.; Nouri, N.; Dietrich, S.; Zanger, F.; Schulze, V. Dual-Laser PBF-LB Processing of a High-Performance Maraging Tool Steel FeNiCoMoVTiAl. Materials 2021, 14, 4251. [Google Scholar] [CrossRef]
- Wang, L.; Song, Z.; Zhang, X.; Park, J.-S.; Almer, J.; Zhu, G.; Chen, Y.; Li, Q.; Zeng, X.; Li, Y. Developing ductile and isotropic Ti alloy with tailored composition for laser powder bed fusion. Addit. Manuf. 2022, 52, 102656. [Google Scholar] [CrossRef]
- Jimenez, E.H.; Kreitcberg, A.; Moquin, E.; Brailovski, V. Influence of Post-Processing Conditions on the Microstructure, Static, and Fatigue Resistance of Laser Powder Bed Fused Ti-6Al-4V Components. J. Manuf. Mater. Process. 2022, 6, 85. [Google Scholar] [CrossRef]
- Farhang, B.; Tanrikulu, A.A.; Ganesh-Ram, A.; Durlov, S.H.; Moghaddam, N.S. Innovative Fabrication Design for In Situ Martensite Decomposition and Enhanced Mechanical Properties in Laser Powder Bed Fused Ti6Al4V Alloy. J. Manuf. Mater. Process. 2023, 7, 226. [Google Scholar] [CrossRef]
- Pal, S.; Bončina, T.; Lojen, G.; Brajlih, T.; Fabjan, E.; Gubeljak, N.; Finšgar, M.; Drstvenšek, I. Fine martensite and beta-grain variational effects on mechanical properties of Ti–6Al–4V while laser parameters change in laser powder bed fusion. Mater. Sci. Eng. A 2024, 892, 146052. [Google Scholar] [CrossRef]
- Lu, W.; Liu, Y.; Wu, X.; Liu, X.; Wang, J. Corrosion and passivation behavior of Ti-6Al-4V surfaces treated with high-energy pulsed laser: A comparative study of cast and 3D-printed specimens in a NaCl solution. Surf. Coat. Technol. 2023, 470, 129849. [Google Scholar] [CrossRef]
- Zhang, L.C.; Wang, J. Stabilizing 3D-printed metal alloys A design strategy overcomes the strength-ductility trade-off in alloy manufacturing. Science 2024, 383, 586–587. [Google Scholar] [CrossRef]
- Wang, J.; Zhu, R.; Liu, Y.; Zhang, L. Understanding melt pool characteristics in laser powder bed fusion: An overview of single- and multi-track melt pools for process optimization. Adv. Powder Mater. 2023, 2, 100137. [Google Scholar] [CrossRef]
- Ye, J.; Khairallah, S.A.; Rubenchik, A.M.; Crumb, M.F.; Guss, G.; Belak, J.; Matthews, M.J. Energy Coupling Mechanisms and Scaling Behavior Associated with Laser Powder Bed Fusion Additive Manufacturing. Adv. Eng. Mater. 2019, 21, 1900185. [Google Scholar] [CrossRef]
- Patel, S.; Vlasea, M. Melting modes in laser powder bed fusion. Materialia 2020, 9, 100591. [Google Scholar] [CrossRef]
- Touloukian, Y.S. Thermal conductivity, Nonmetallic Solids, Thermophys. Prop. Matter 1970, 2, 183–193. Available online: https://ci.nii.ac.jp/naid/10005748060 (accessed on 23 October 2021).
- Yang, J.; Sun, S.; Brandt, M.; Yan, W. Experimental investigation and 3D finite element prediction of the heat affected zone during laser assisted machining of Ti6Al4V alloy. J. Mech. Work. Technol. 2010, 210, 2215–2222. [Google Scholar] [CrossRef]
- Unni, A.K.; Vasudevan, M. Determination of heat source model for simulating full penetration laser welding of 316 LN stainless steel by computational fluid dynamics. Mater. Today Proc. 2021, 45, 4465–4471. [Google Scholar] [CrossRef]
- Zhang, Z.; Huang, Y.; Kasinathan, A.R.; Shahabad, S.I.; Ali, U.; Mahmoodkhani, Y.; Toyserkani, E. 3-Dimensional heat transfer modeling for laser powder-bed fusion additive manufacturing with volumetric heat sources based on varied thermal conductivity and absorptivity. Opt. Laser Technol. 2019, 109, 297–312. [Google Scholar] [CrossRef]
- Roberts, I.; Wang, C.; Esterlein, R.; Stanford, M.; Mynors, D. A three-dimensional finite element analysis of the temperature field during laser melting of metal powders in additive layer manufacturing. Int. J. Mach. Tools Manuf. 2009, 49, 916–923. [Google Scholar] [CrossRef]
- Chen, Q.; Guillemot, G.; Gandin, C.-A.; Bellet, M. Numerical modelling of the impact of energy distribution and Marangoni surface tension on track shape in selective laser melting of ceramic material. Addit. Manuf. 2018, 21, 713–723. [Google Scholar] [CrossRef]
- Fu, C.H.; Guo, Y.B. Three-Dimensional Temperature Gradient Mechanism in Selective Laser Melting of Ti-6Al-4V. J. Manuf. Sci. Eng. Trans. ASME 2014, 136, 061004. [Google Scholar] [CrossRef]
- Kobryn, P.; Semiatin, S. Microstructure and texture evolution during solidification processing of Ti–6Al–4V. J. Mech. Work. Technol. 2003, 135, 330–339. [Google Scholar] [CrossRef]
- He, Y.; Zhong, M.; Jones, N.; Beuth, J.; Webler, B. The Columnar-to-Equiaxed Transition in Melt Pools During Laser Powder Bed Fusion of M2 Steel. Met. Mater. Trans. A Phys. Metall. Mater. Sci. 2021, 52, 4206–4221. [Google Scholar] [CrossRef]
- Mills, K.C. Recommended Values of Thermophysical Properties for Selected Commercial Alloys; Woodhead Publishing: Sawston, UK, 2002. [Google Scholar]


| Parameter | Notation | Value |
|---|---|---|
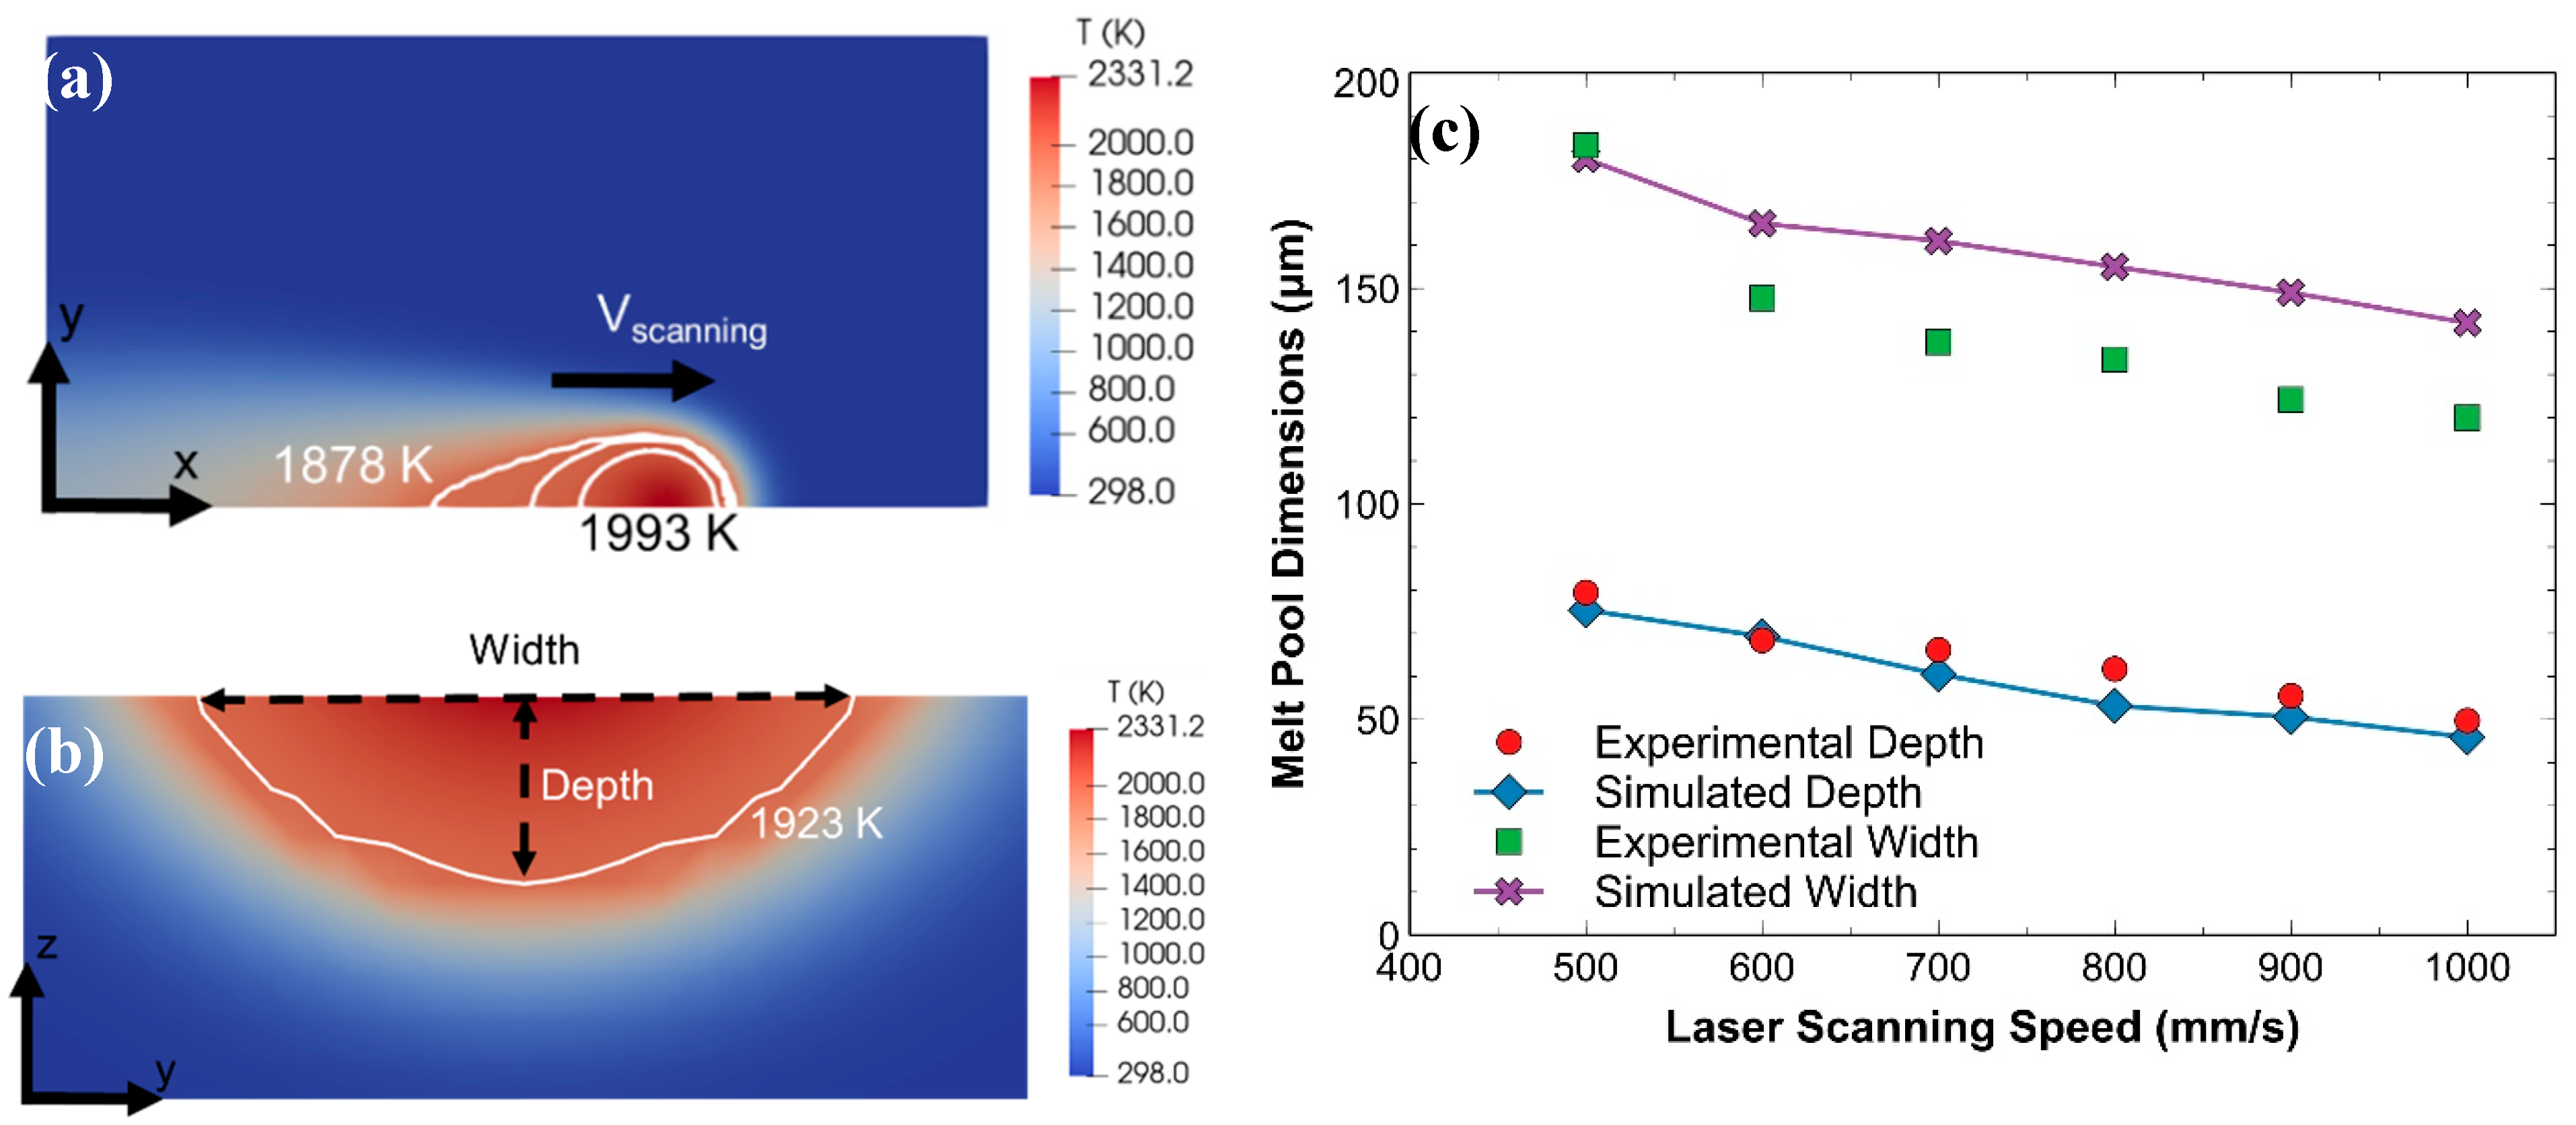
| Solidus temperature (K) | TS | 1878 |
| Liquidus temperature (K) | TL | 1993 |
| Melting temperature (K) | Tm | 1923 |
| Absorption coefficient | A | 0.25 |
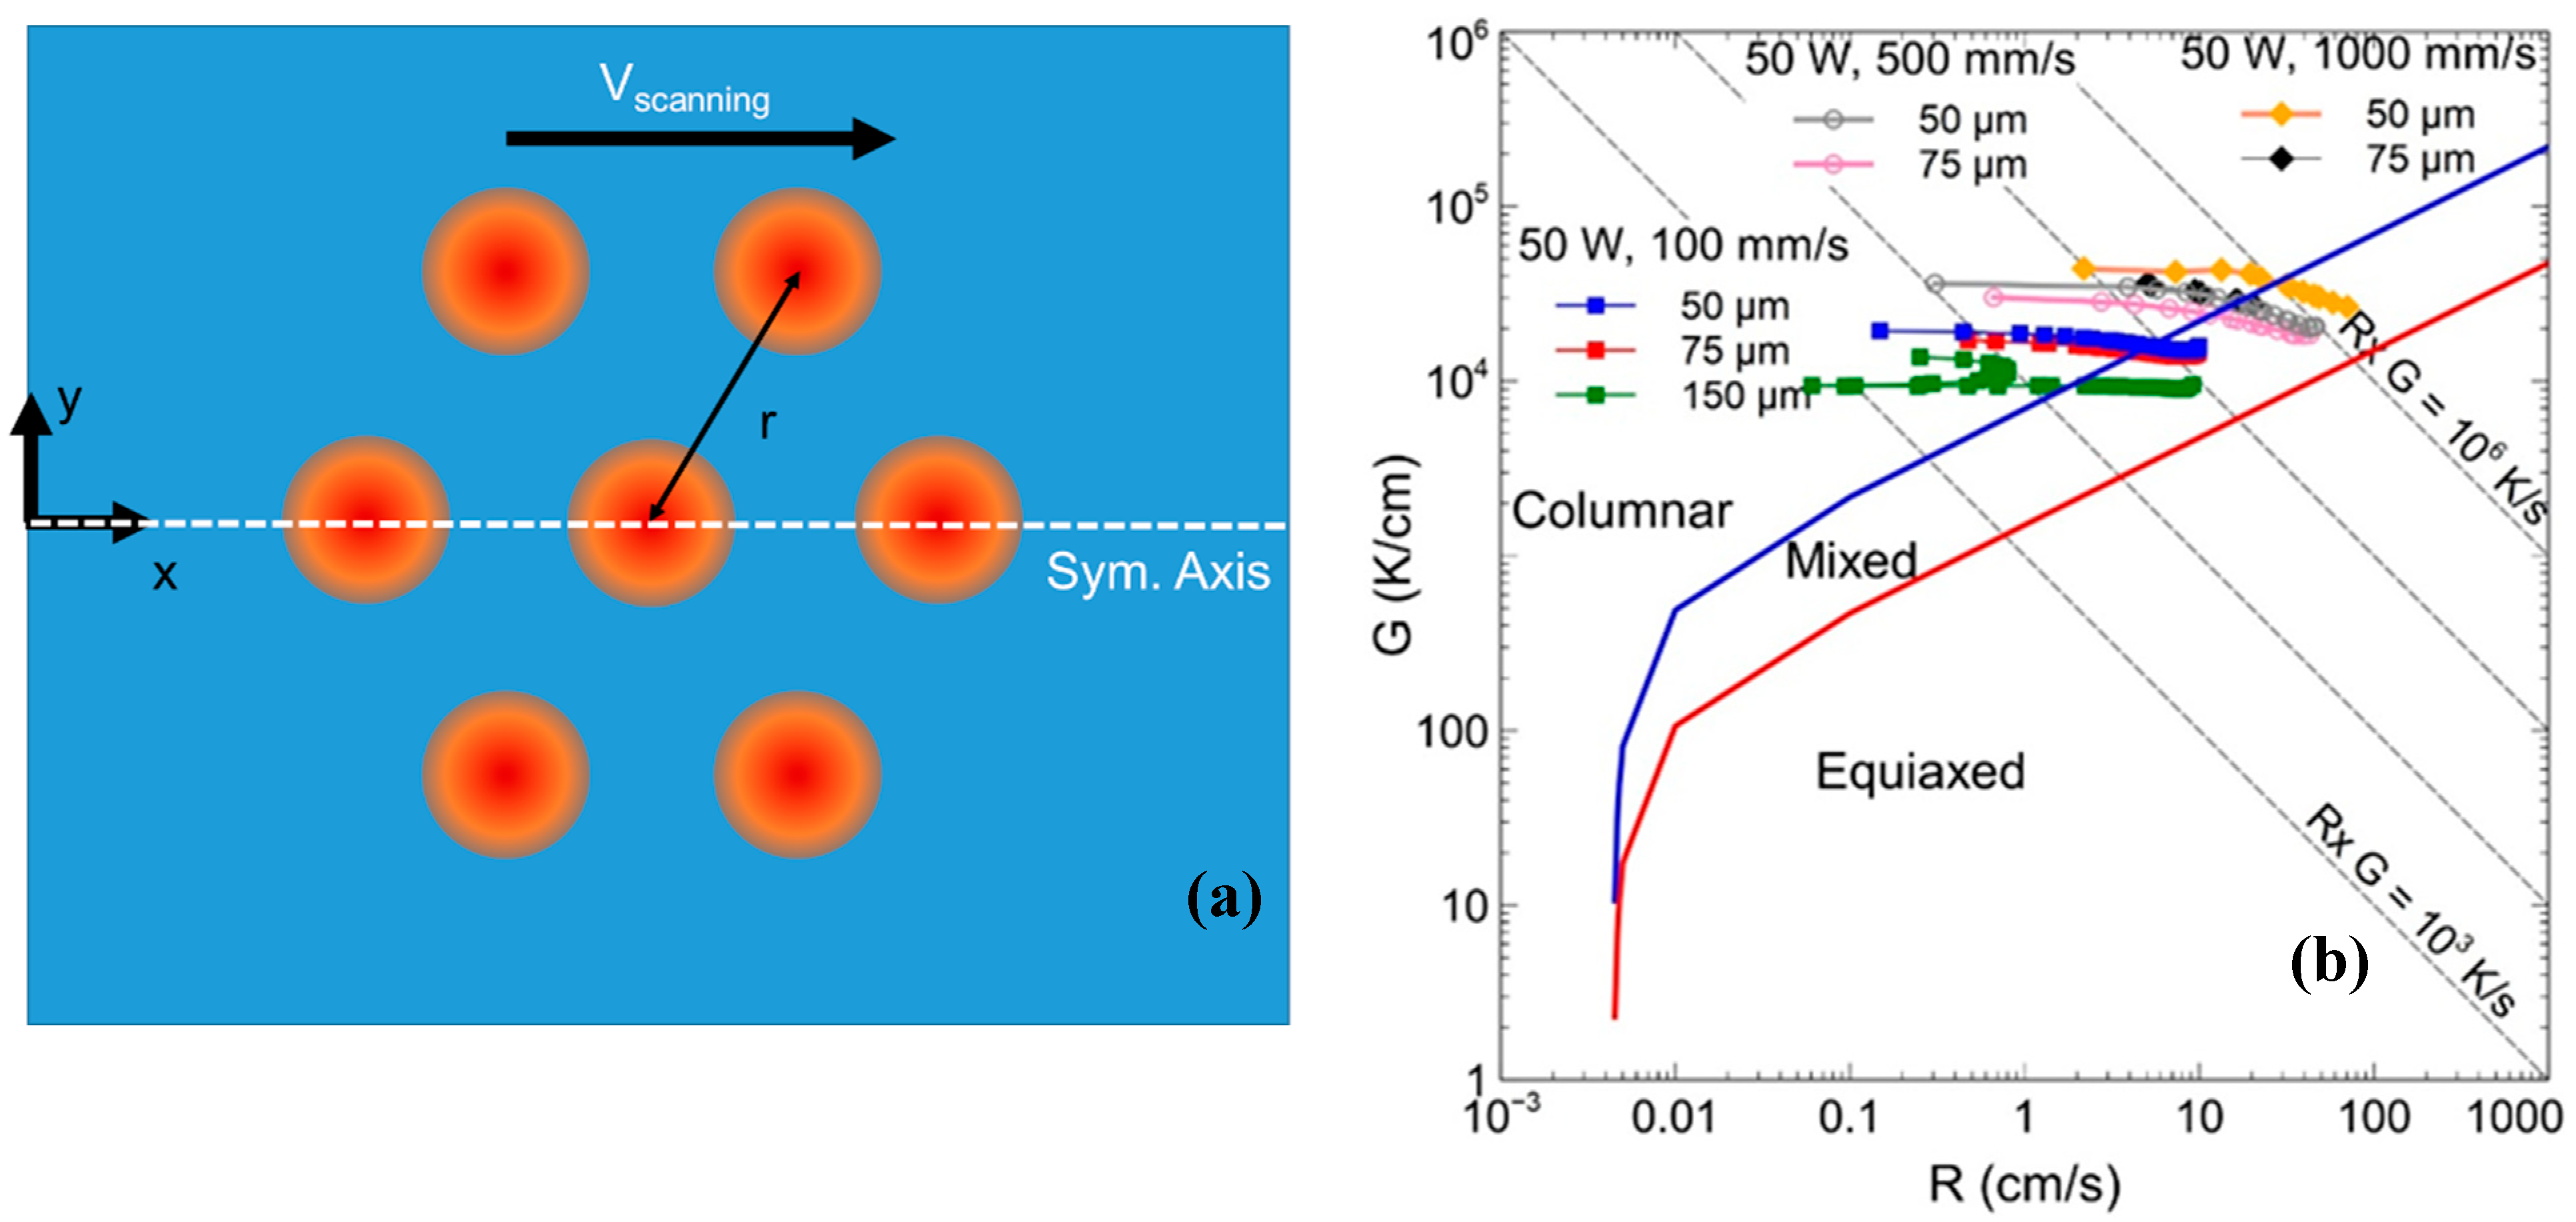
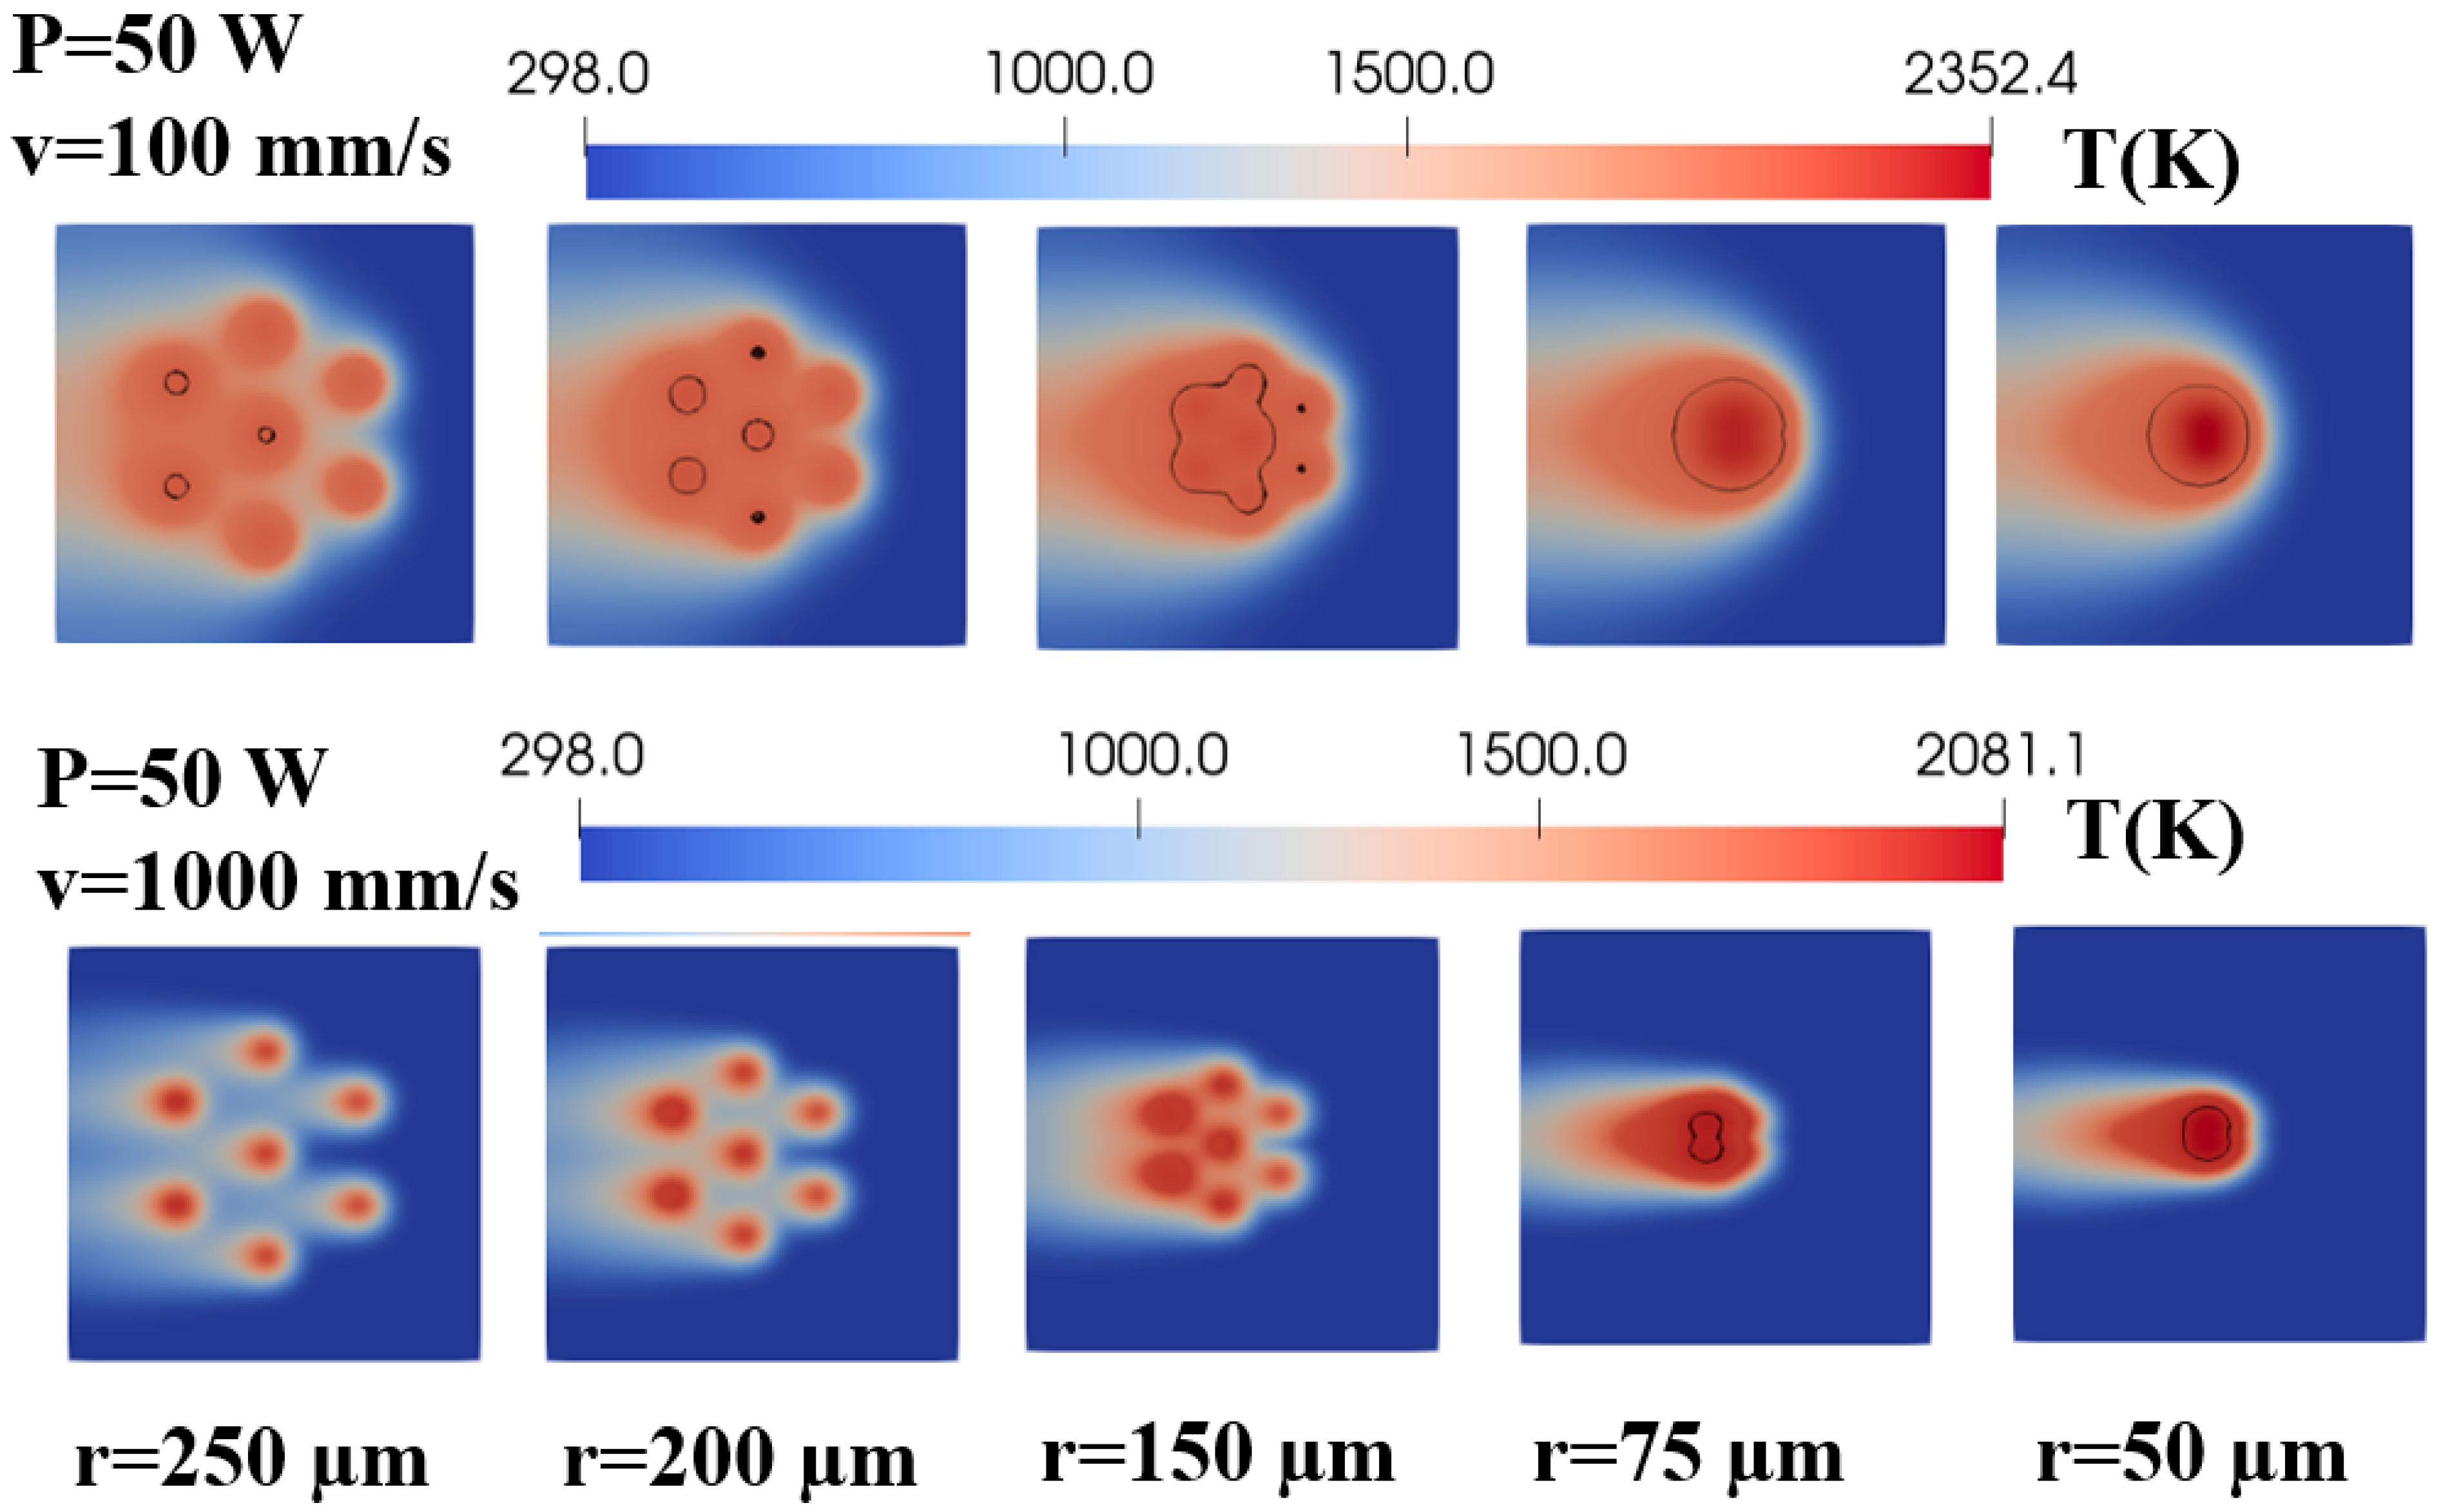
| Laser beam radius (µm) | ro | 75 |
| Laser power (W) | P | 50, 300, 500 |
| Laser speed (mm/s) | v | 100–1000 |
| Melting enthalpy (kJ/kg) | Hf | 370 |
| Thermal conductivity enhancement factors | λx, λy, λz | 10, 10, 15 |
| Heat transfer convection (W/m2K) | hc | 50 |
| Heat transfer radiation (W/m2K) | hr | 1 |
Disclaimer/Publisher’s Note: The statements, opinions and data contained in all publications are solely those of the individual author(s) and contributor(s) and not of MDPI and/or the editor(s). MDPI and/or the editor(s) disclaim responsibility for any injury to people or property resulting from any ideas, methods, instructions or products referred to in the content. |
© 2024 by the authors. Licensee MDPI, Basel, Switzerland. This article is an open access article distributed under the terms and conditions of the Creative Commons Attribution (CC BY) license (https://creativecommons.org/licenses/by/4.0/).
Share and Cite
Attariani, H.; Petitjean, S.R.; Niekamp, A.M. Synchronized Multi-Laser Powder Bed Fusion (M-LPBF) Additive Manufacturing: A Technique for Controlling the Microstructure of Ti–6Al–4V. J. Manuf. Mater. Process. 2024, 8, 242. https://doi.org/10.3390/jmmp8060242
Attariani H, Petitjean SR, Niekamp AM. Synchronized Multi-Laser Powder Bed Fusion (M-LPBF) Additive Manufacturing: A Technique for Controlling the Microstructure of Ti–6Al–4V. Journal of Manufacturing and Materials Processing. 2024; 8(6):242. https://doi.org/10.3390/jmmp8060242
Chicago/Turabian StyleAttariani, Hamed, Shayna Renay Petitjean, and Aaron Michael Niekamp. 2024. "Synchronized Multi-Laser Powder Bed Fusion (M-LPBF) Additive Manufacturing: A Technique for Controlling the Microstructure of Ti–6Al–4V" Journal of Manufacturing and Materials Processing 8, no. 6: 242. https://doi.org/10.3390/jmmp8060242
APA StyleAttariani, H., Petitjean, S. R., & Niekamp, A. M. (2024). Synchronized Multi-Laser Powder Bed Fusion (M-LPBF) Additive Manufacturing: A Technique for Controlling the Microstructure of Ti–6Al–4V. Journal of Manufacturing and Materials Processing, 8(6), 242. https://doi.org/10.3390/jmmp8060242