Abstract
The growing production of plastic waste and its recycling, from a circular economy perspective, faces challenges in finding solutions that are easy to implement, cheap in labor and energy during recycling, and locally implementable to avoid transportation. This work developed and validated a methodology to address these challenges. Designed for small-scale use at home or in schools following a Do It Yourself (DIY) approach, it transforms water bottles into plastic strips, which, after passing through an extruder nozzle, become filaments with a diameter of 1.75 mm. These can replace commercially available thermoplastic filaments. Specimens produced by additive manufacturing with recycled PET (rPET) and commercial PETG showed similar mechanical properties and can serve as alternatives to commercial PETG. PETG shows higher strength (30 MPa) compared to rPET (24 MPa), a slightly higher Young’s modulus of 1.44 GPa versus 1.43 GPa, and greater strain at failure with 0.03 mm/mm against 0.02 mm/mm, making it stiffer and more ductile. This simple and widely applicable local solution may absorb a considerable amount of bottle waste, offering an economical, sustainable alternative to commercial filaments.
1. Introduction
1.1. From Production to Plastic Pollution
In the early 20th century, new types of materials were developed. Plastics, which began to gain importance and find applications across various industries, reached global production of 2 million tonnes by 1950. According to [1], it is predicted that this number will increase. The mass production of plastics has resulted in an alarming amount of waste. According to [2], global plastic production reached 400.3 million tonnes in 2022. The production of circular plastics grew 16 times faster than that of fossil-based plastics, accounting for approximately 10% of global production [2].
With high production volumes, waste generation is equally significant. Nearly 26 million tonnes of plastic waste are generated annually in Europe [3]. The solution to this problem does not lie in halting plastic production but rather in implementing more effective management and reintegrating this material into new usage cycles whenever possible. One of the greatest challenges with plastic products is their end-of-life, as a significant amount ends up in landfill or released into the environment. Each year, approximately 1 to 2 million tonnes of plastics enter the oceans, directly impacting wildlife and marine ecosystems [1]. Strategies to mitigate the environmental damage caused by plastics focus on preventing their entry into natural environments. This involves measures to reuse and recover the resources that plastics can still provide. The solution lies in adopting a circular economy model [4].
After analyzing the general issues related to plastics, it is important to acknowledge the diversity of products made from this material and identify those contributing most to pollution. According to [5], excluding cigarette filters, the ten most common types of plastic products found in the oceans are bags, plastic bottles, food containers and cutlery, wrappers, synthetic ropes, fishing-related items, plastic caps and lids, industrial packaging, glass bottles, and beverage cans. These items account for three-quarters of all globally identified waste [5]. They also highlighted that plastic bags and bottles occupy the top two positions. Both share a common characteristic: they are low-cost single-use plastic packages, frequently discarded within just a few minutes of use [6]. This underscores the need to implement recycling methods targeted at such items.
Within this context, this study focuses on plastic bottles. In 2016, 480 billion plastic bottles were sold, compared to 300 billion over a decade earlier. It was estimated by [7] that this figure would rise to 583.3 billion by 2021. The production of plastic bottles is vast, but, when expressed through data and statistics, the scale of the problem appears to grow exponentially. The global consumption of plastic bottles stands at one million per minute, posing a threat as serious as climate change [7]. Most bottles used for soft drinks and water are made from PET, a highly recyclable plastic, which provides a significant advantage in such a concerning scenario. Therefore, given the requirement for the diversity of recyclable polymers, and the significance of PET bottles among discarded plastics, this study will focus exclusively on PET bottles.
1.2. rPET Filament for 3D Printing
Although various additive manufacturing techniques exist, each producing different types of products, material extrusion (MEX), which includes fused filament fabrication (FFF), remains the most common and accessible method in 3D printing. This study focuses exclusively on the production of the filament used as feedstock for this technology. Thus, any reference to additive manufacturing will specifically pertain to FFF.
FFF printers can use a wide range of filaments, from rigid to flexible materials. However, to promote sustainability, it is essential to prioritize eco-friendly filaments whenever possible. Among these, PET—although not a biopolymer, such as PLA—is a viable option due to its high recyclability.
Recycled PET (rPET), derived from PET recycling, offers characteristics that make it a sustainable and appealing choice for various applications, especially when compared to PET and PETG filaments. Research indicates that using recycled polymers can reduce energy consumption by up to 84% and greenhouse gas emissions by up to 74% [8].
Several studies have explored the potential of recycled filaments in 3D printing, with promising results. Recycled filaments exhibit mechanical properties comparable to virgin filaments, making them a viable alternative [9,10]. However, it is important to assess the environmental impact of the entire recycling process, from plastic waste collection to final product delivery. In some cases, the approach used may inadvertently contradict the primary goal of reducing CO2 emissions.
The most common process for the manufacturing of recycled filament begins with transporting plastic waste to a recycling facility, where it is washed to remove impurities. The material is then shredded into smaller pieces, melted, and converted into pellets. These recycled pellets serve as raw material for the production of new products, such as filaments for FFF machines. This process can either occur within a single facility or be distributed across multiple locations [11].
There are two main ways to obtain recycled filaments. The first is to purchase them from specialized retailers offering commercial recycled filaments. These products undergo testing and quality control, ensuring that they perform comparably to virgin material filaments, although they are often of a higher price. The second option, suitable for those willing to invest time, involves manufacturing filaments at home using machines like the one developed in this study. While this approach requires setup time, it can significantly reduce the cost of 3D printing materials [12]. Additionally, it helps to address the issue of centralized recycling facilities.
Producing filaments at home requires specific equipment. Various approaches are available, ranging from purchasing kits to building the equipment entirely from scratch.
For this study, a machine was constructed, which will be briefly described in the next section. This machine produces rPET filaments from PET bottles or jugs by first cutting the bottles into adjustable-width strips. These strips are then wound and fed through an extrusion nozzle.
The primary objective of this research was to demonstrate the potential application of an rPET filament by comparing the tensile test results of specimens produced with this filament to those made with commercially available filaments that are more commonly used, such as PETG.
2. Materials and Methods
2.1. rPET Filament Production
From the research conducted on various DIY models available online, it was possible to observe their nuances and identify specific contributions to each stage of the process, such as bottle cutting, strip storage, filament cooling, filament storage, and the control system. In particular, the machine developed in this study shares similarities with the models used in these studies [13,14,15].
To produce a uniform strip, a cutting mechanism is essential. In this case, since testing different strip widths was important to determine the most effective option, a cutter with an adjustable width was chosen. Inspired by the idea of [16], the mechanism was adapted for this material with the parts available. The cutter is shown in Figure 1.
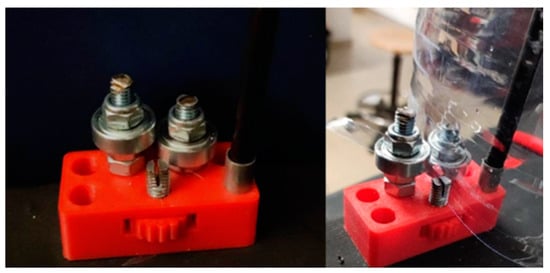
Figure 1.
Plastic strip cutter.
To simplify the storage of the plastic strips, a spool was 3D-printed, as shown in Figure 2i. This spool allows the strips to be quickly wound and later placed into the machine, which unwinds them as the motor pulls the strip through the extrusion nozzle.
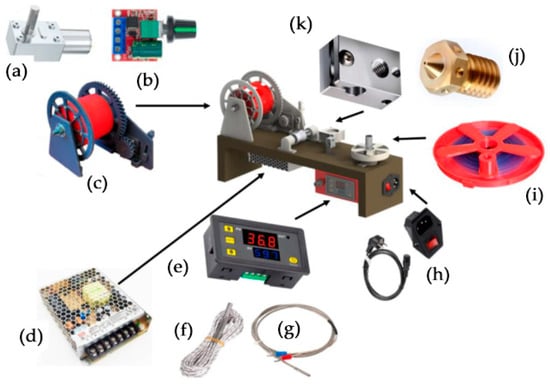
Figure 2.
Machine CAD model and assembled components: (a) JGY370 motor; (b) PWM controller; (c) gear system; (d) Mean Well LRS-100-24 source; (e) W3230; (f) heating cartridge; (g) k-type thermocouple sensor; (h) AC power socket; (i) spool for storage of plastic strip; (j) extrusion nozzle (k) heating block.
For filament extrusion, an extrusion nozzle (Figure 2j) and a heating block (Figure 2k) were used. The nozzle hole was enlarged with a 1.6 mm drill bit and then filed to 1.75 mm. The diameter calibration was performed until a commercial filament could pass through with slight resistance, accounting for the tendency of plastic to expand slightly after cooling. This adjustment resulted in an approximate diameter of 1.75 mm. Since FFF 3D printers tolerate small variations in the filament diameter, these adjustments do not pose issues.
The block’s temperature is controlled by a W3230 temperature controller (Figure 2e), connected to a heating cartridge (Figure 2f) and a type-K thermocouple sensor (Figure 2g). This setup allows the desired temperature of the heating block to be adjusted as needed.
To determine the required torque to pull the filament through the extrusion nozzle, the mechanism described in [17] was used, which has proven effective in similar systems. A 24-volt geared motor operating at 10 rpm (Figure 2a) was identified as ideal. This motor was paired with a system of helical gears and supports, manufactured from PETG via 3D printing to ensure durability and robustness.
Additionally, a system was implemented to allow the motor and driving gear to slide relative to the driven gear. This design enables the spool, where the filament is wound, to move freely even when the motor is locked. Motor control is achieved through a PWM system with a potentiometer (Figure 2b). The complete filament traction system is illustrated in Figure 2c.
A Mean Well LRS-100-24 (MeanWell, New Taipei City, Taiwan) power supply, rated at 24 V and 100 W, shown in Figure 2d, was selected and connected to the electrical grid via an AC power socket (Figure 2h).
The SolidWorks model of the machine is shown in Figure 2, with all the described components assembled.
In the filament manufacturing process, the first step was the selection of a bottle in good condition. Although any brand can be used, bottles from a single brand were chosen to minimize the variability in the test results due to slightly different PET chemical formulas. The first stage involved washing the bottle with water to remove visible contaminants, followed by drying.
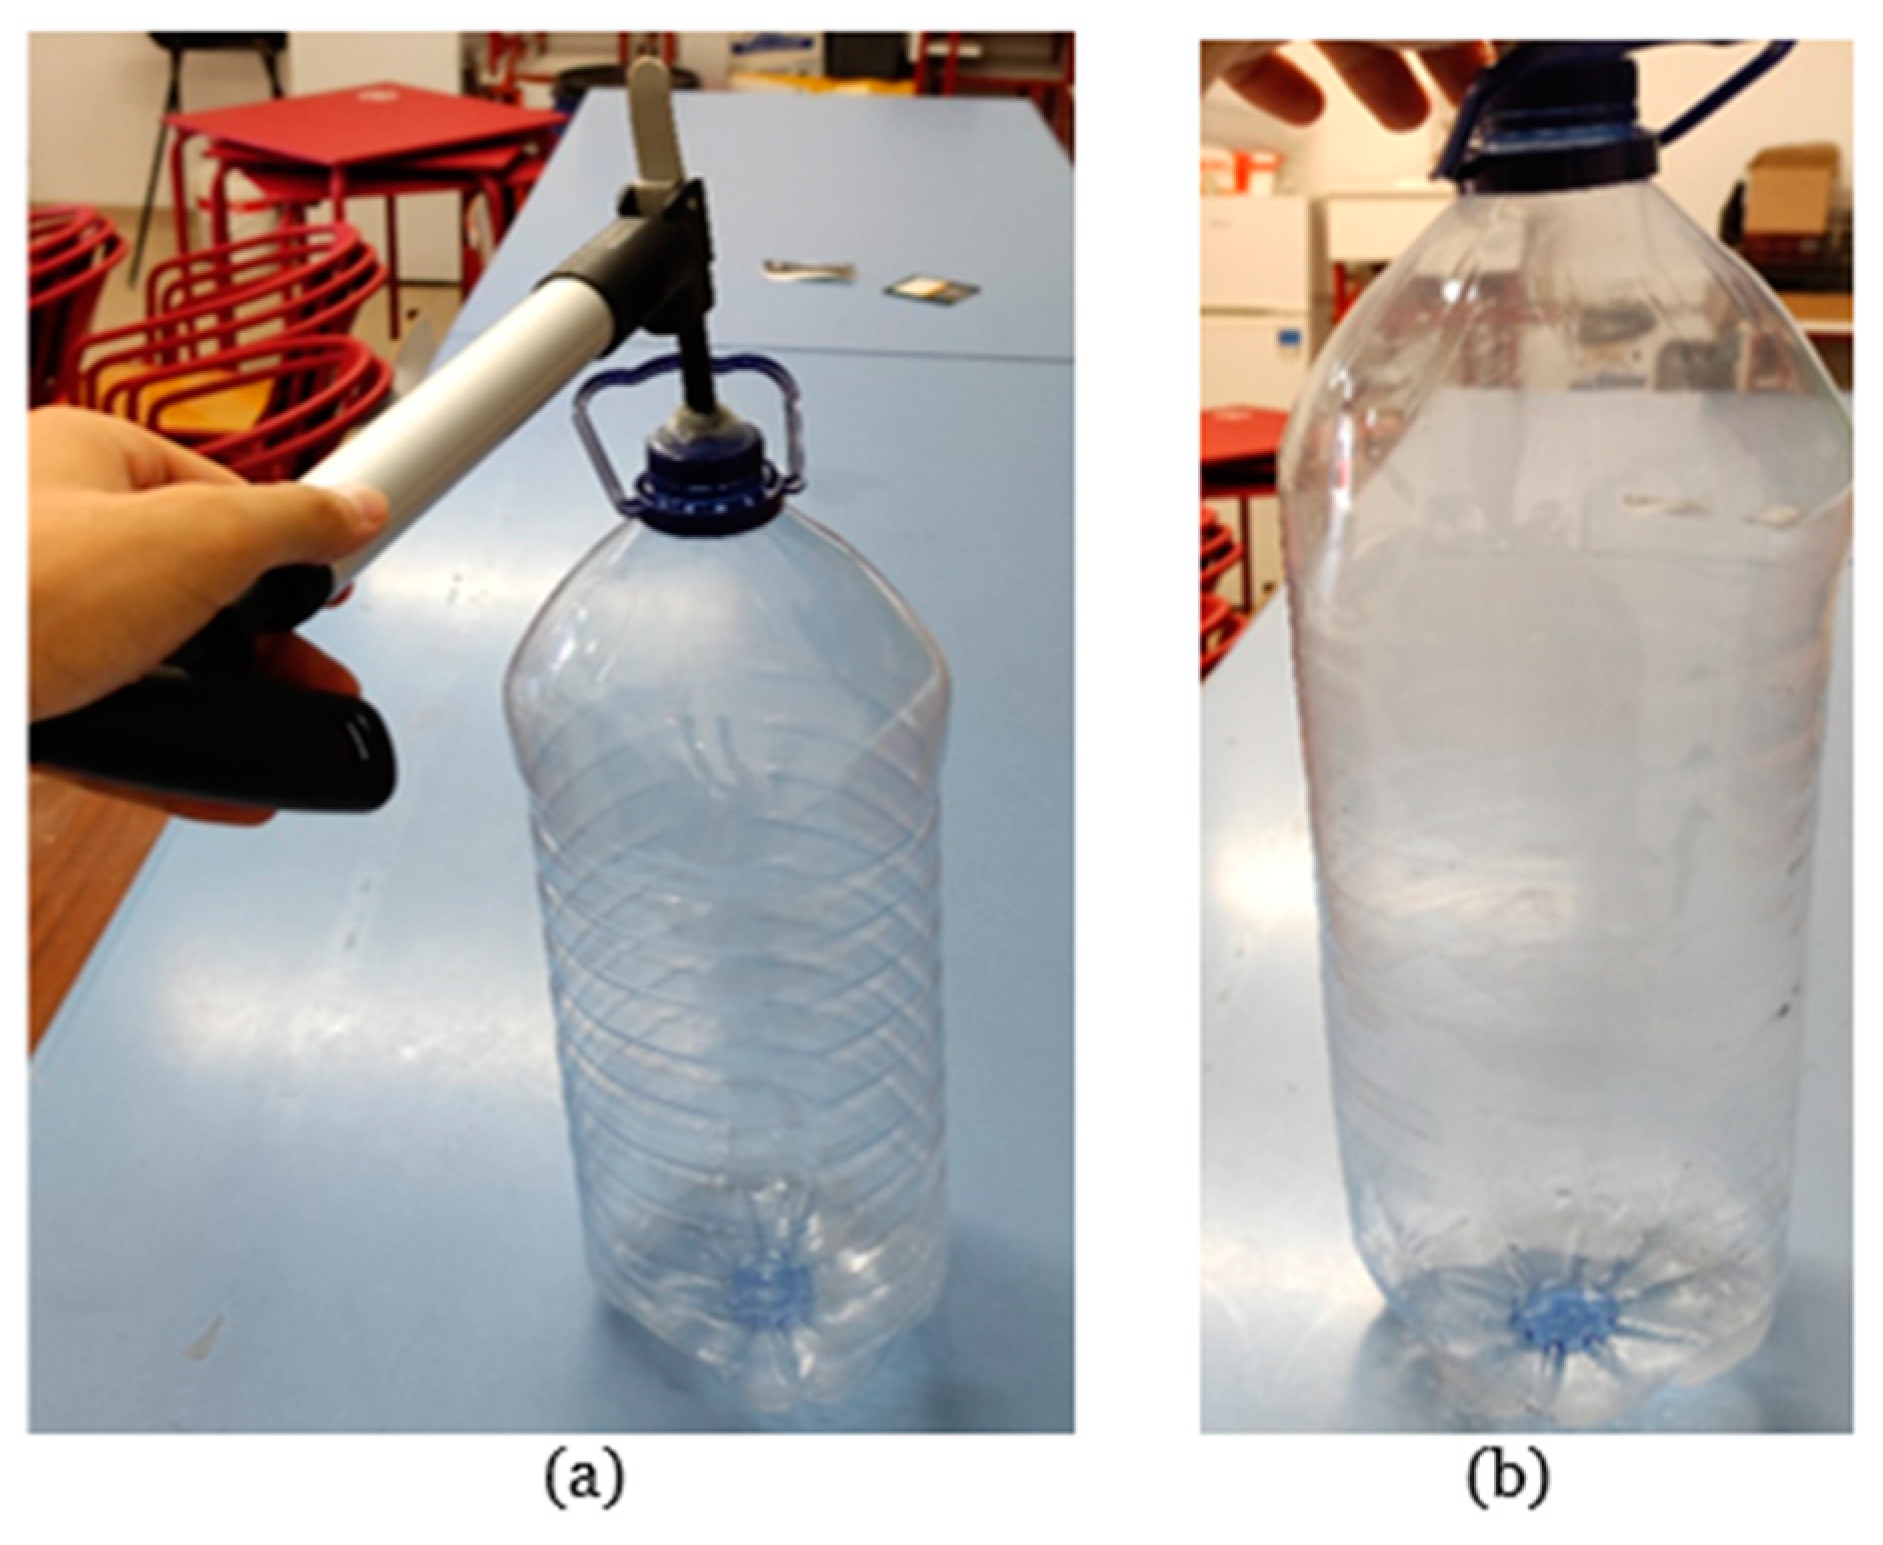
Since many bottles have surface deformations and irregularities, these need to be eliminated. A hand pump was used to pressurize the interior of the bottle by introducing air through the valve, as shown in Figure 3a. Next, the bottle was evenly heated using a heat source while rotating it, keeping the cap in place, until the bottle ridges disappeared. After this procedure, the bottle had a smooth and regular surface, as shown in Figure 3b.

Figure 3.
Preparation of the bottle: (a) before; (b) after.
Once this stage is complete, residual glue is removed from the bottle. A strip is then cut and passed through the cutter groove. As shown in Figure 1, a component at the base of the cutter allows for control of the strip’s width when the plastic strip is inserted into the slot previously created on the threaded rod.
The strip’s width affects the amount of material in the filament cross-section. To determine the optimal width, a preliminary investigation was conducted on the widths used in similar machines. These studies showed widths ranging between 7.5 mm and 9.5 mm. The average thickness of the bottle used was 0.25 mm. Therefore, plastic strips with widths in increasing steps of 0.5 mm, starting from 6.5 mm until 11 mm, were prepared. After testing the different strip widths, our observations and conclusions were recorded, as shown in Table 1.

Table 1.
Various measurements for the plastic strip and the results obtained.
As recorded in the table, the strip must have a minimum width to ensure that the plastic forms a fully enclosed tube when shaped into a filament. At 7 mm, there is still insufficient material in certain areas due to small variations in the strip’s width during the cutting process. Conversely, if the strip is too wide, excess material causes issues when extruding through the 1.75 mm nozzle, leading to filament breakage in the heating block.
It was observed that, with widths exceeding 11.5 mm, the motor began to stall due to insufficient torque to pull the excess material. This is due to material stretching. When the motor stalls, the filament melts in certain sections, causing irregularities. Given that the commercial filament diameter is approximately 1.75 mm, and this diameter corresponds to strip widths of 8.5 mm and 9 mm in the table (marked in bold), an intermediate value was selected as a starting point.
A strip with a width of 8.75 mm was cut and wound onto the spool for use in the machine. The machine’s controller was set to the desired temperature. PET melts between 255 °C and 265 °C, so the extrusion temperature should not exceed this range, with the molding temperature at 240 °C [18]. It was determined that the filament reached the optimal consistency at temperatures between 205 °C and 220 °C. Therefore, the extrusion process temperature was set at 215 °C.
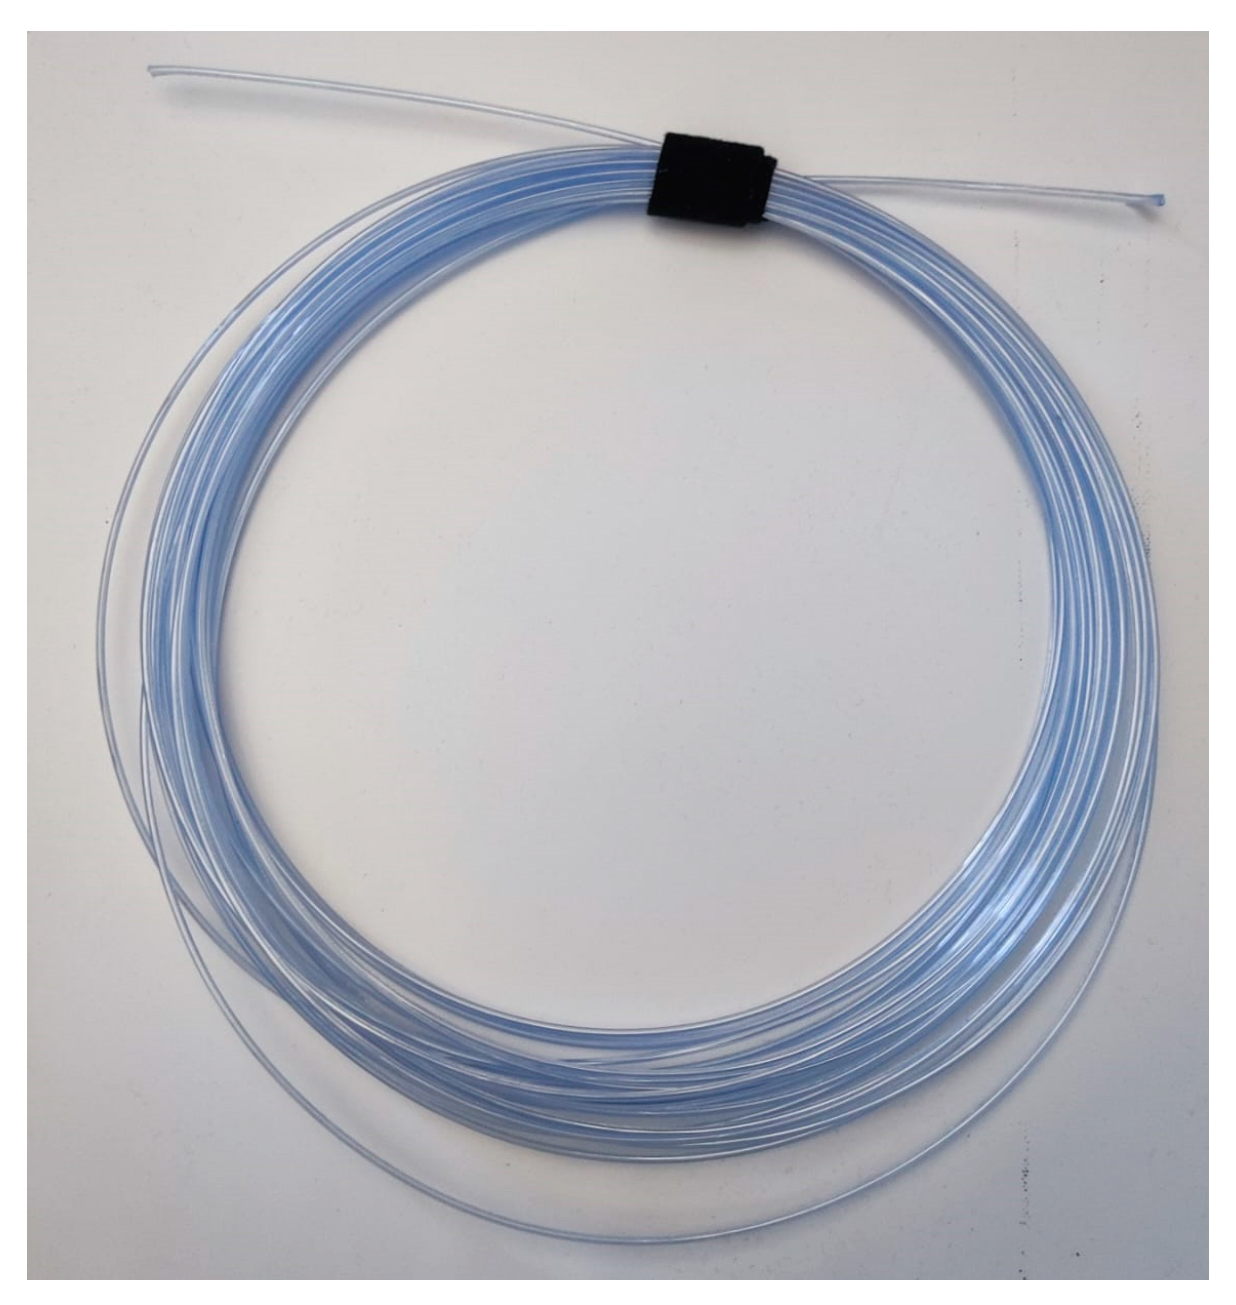
After 30 min, the bottle, previously considered waste, was transformed into approximately 10.5 m of filament, weighing 32 g, as shown in Figure 4.
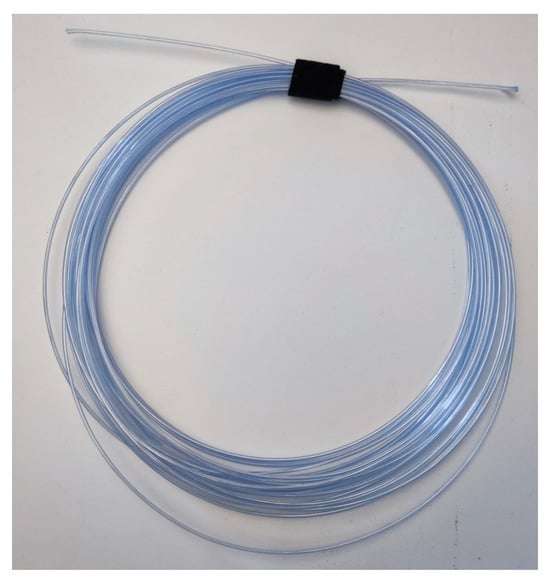
Figure 4.
rPET filament ready to use.
2.2. 3D Printing of Test Specimens
With the filament prepared, the process moved on to FFF printing. The slicer settings are crucial, as suboptimal configurations may lead to unsatisfactory results. However, the available information in scientific articles or online about rPET printing typically pertains to commercial filaments, which often have different properties. Nonetheless, this served as a starting point.
The printing temperature for rPET should range between 225 °C and 245 °C, with the bed temperature between 65 °C and 85 °C [19]. Regarding the print speed, values between 5 mm/s and 50 mm/s are suggested, with an optimal range of 20–30 mm/s [20]. Additionally, it is recommended that the printer fan operates between 0% and 30% [21].
The initial printing parameters used were as follows:
- Bed temperature: 70 °C;
- Fan speed: 30%;
- Print speed: 30 mm/s.
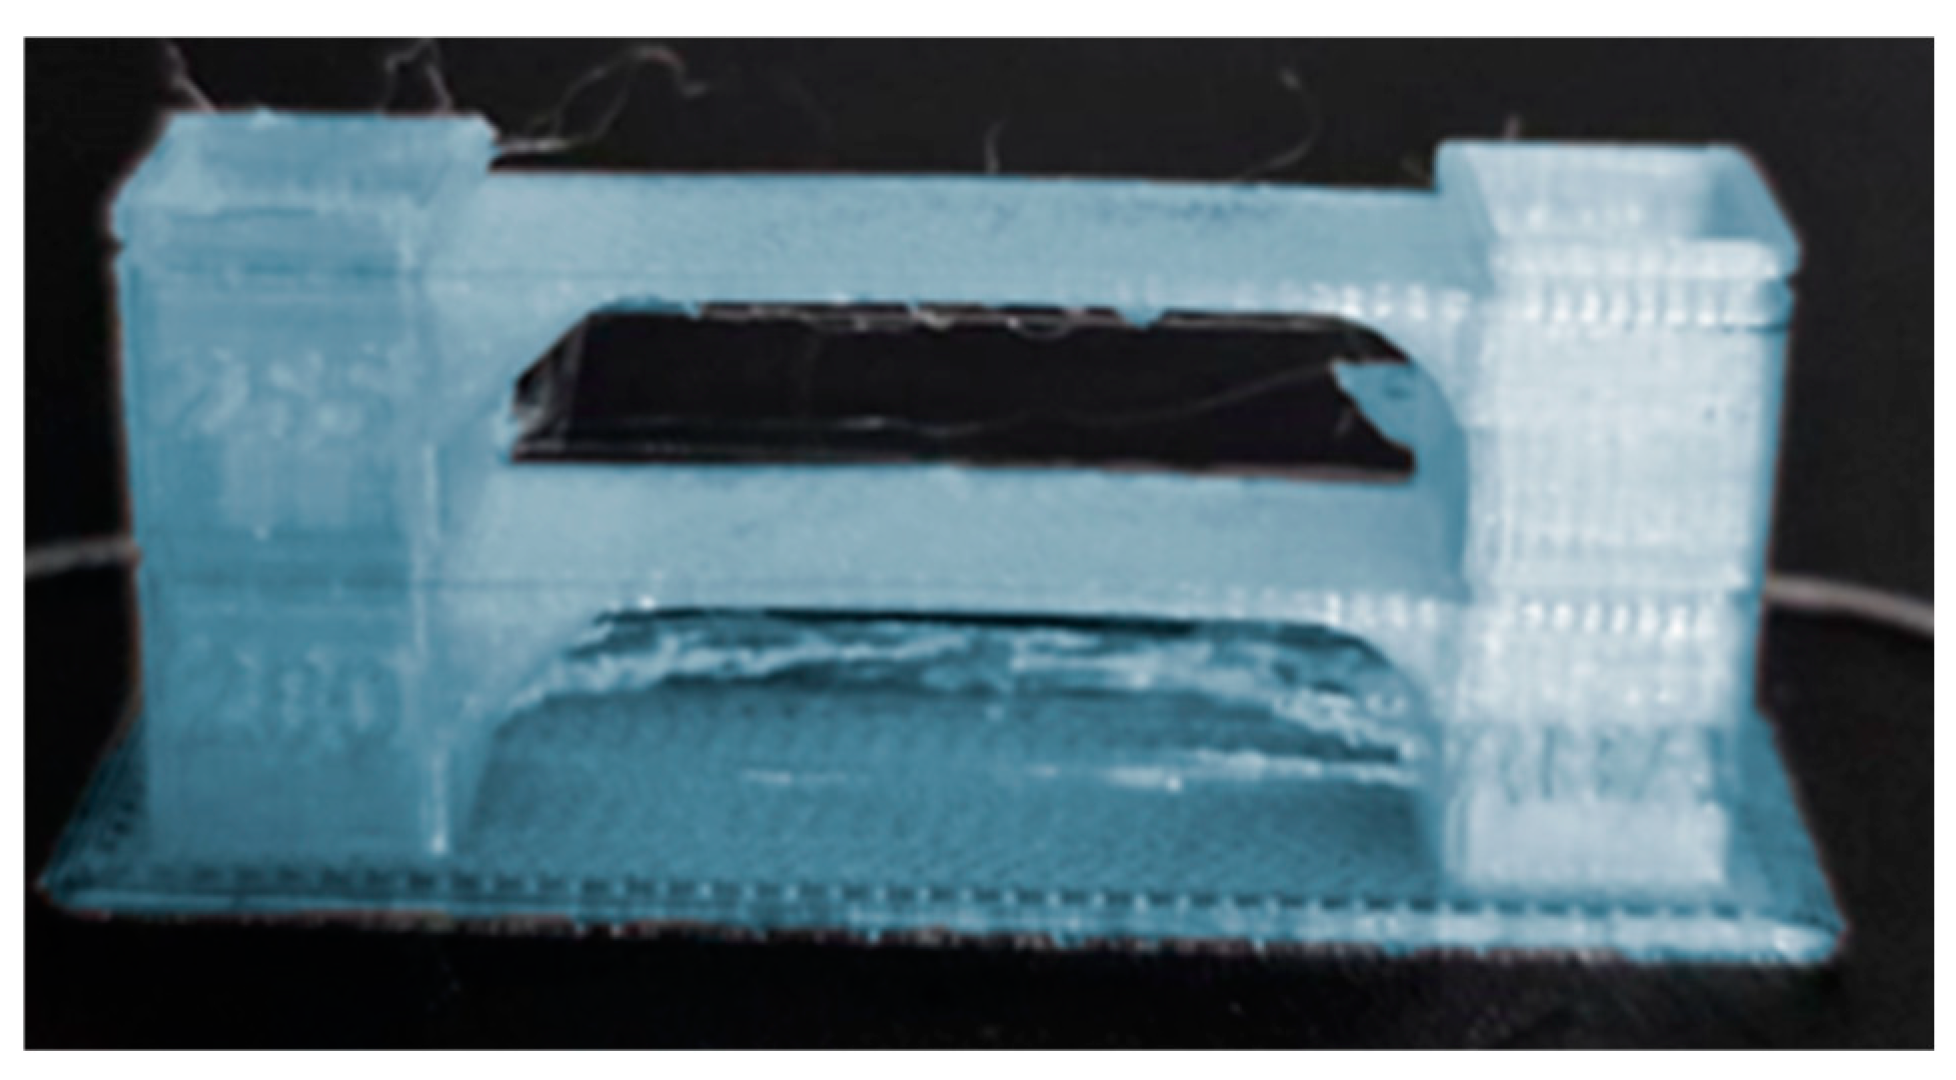
To determine the optimal printing temperature, a temperature tower test was conducted. The printing started with a melting temperature of 260 °C, decreasing by 5 °C at every 10 mm level up to 240 °C. The file was transferred to the printer (Ender 3 V3 SE Creality, Shenzhen, China), and the tower was printed.
As evidenced in Figure 5, the print progressed well at temperatures up to 255 °C. However, when the temperature dropped to 250 °C, the extruder nozzle failed to melt the material sufficiently. At 260 °C, stringing occurred, a defect caused by excessive filament deposition where it was not intended. This stringing indicated an excessively high temperature, as the filament melted too readily and leaked from the nozzle during movement.

Figure 5.
Printed temperature tower.
Thus, the optimal printing temperature for this filament was determined to be 255 °C. The other pre-selected parameters were deemed appropriate based on the results of this initial test.
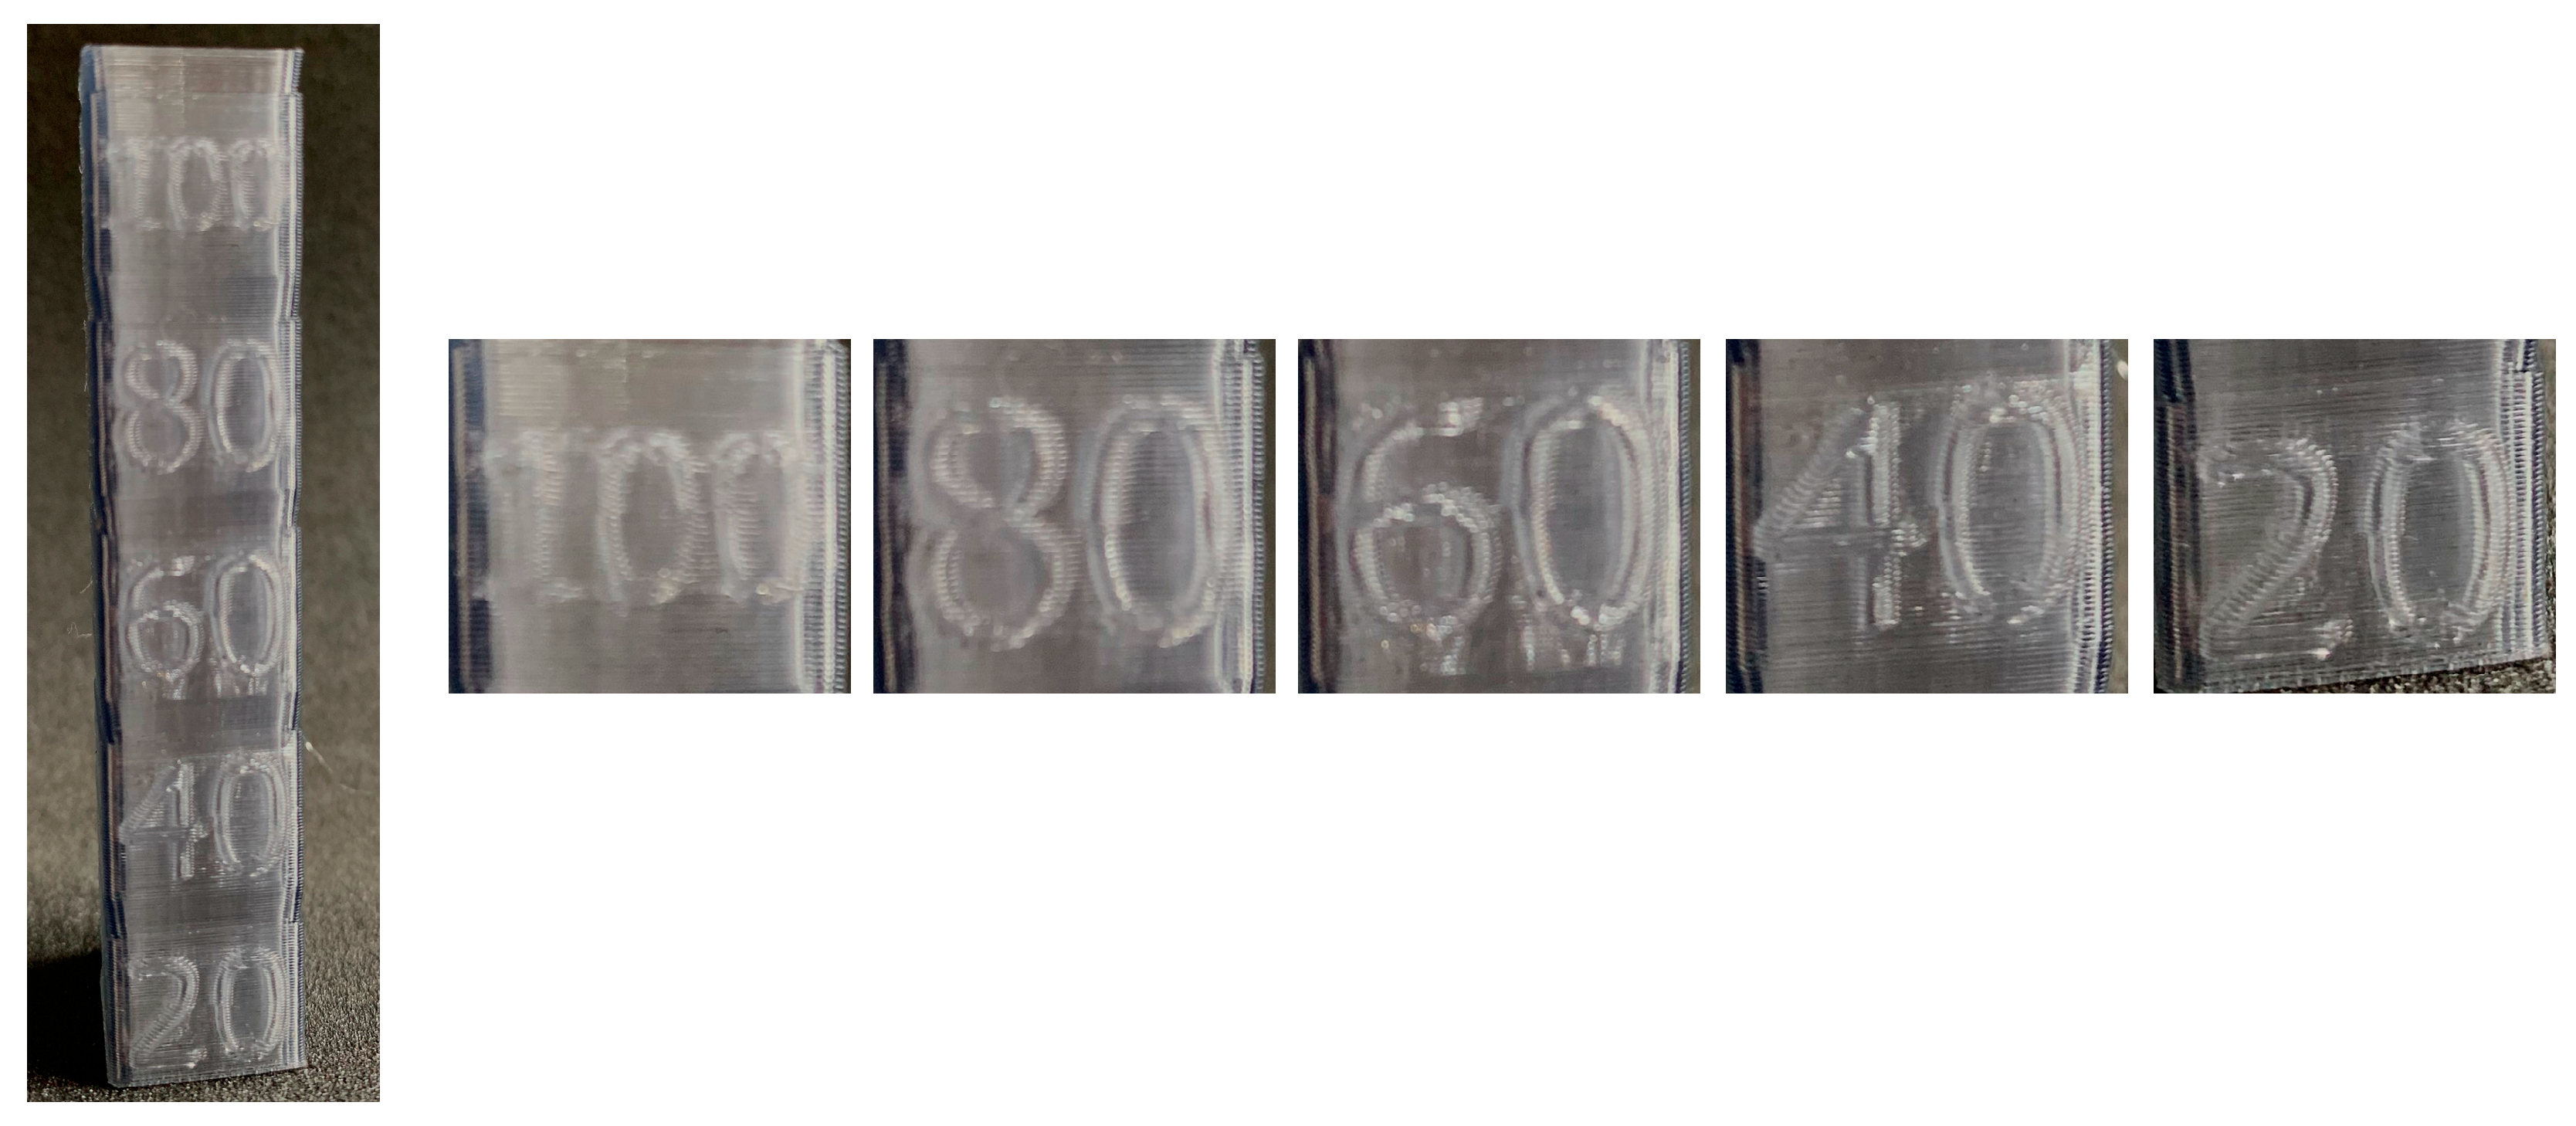
Regarding the print speed, calibration towers were also used. The tower starts at a minimum speed of 20 mm/s and increases by 20 mm/s increments at every 10 mm level, reaching a maximum of 100 mm/s.
Once again, the piece was printed using the Ender 3 V3 SE, and the results are shown in Figure 6. It was observed that the material was capable of printing even at the maximum speed of 100 mm/s. However, some layer defects were visible at this speed. At 60 mm/s, the layers exhibited the best print quality.
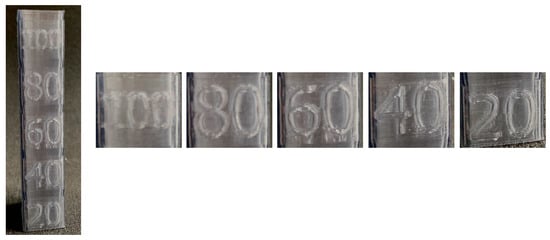
Figure 6.
Printed speed tower.
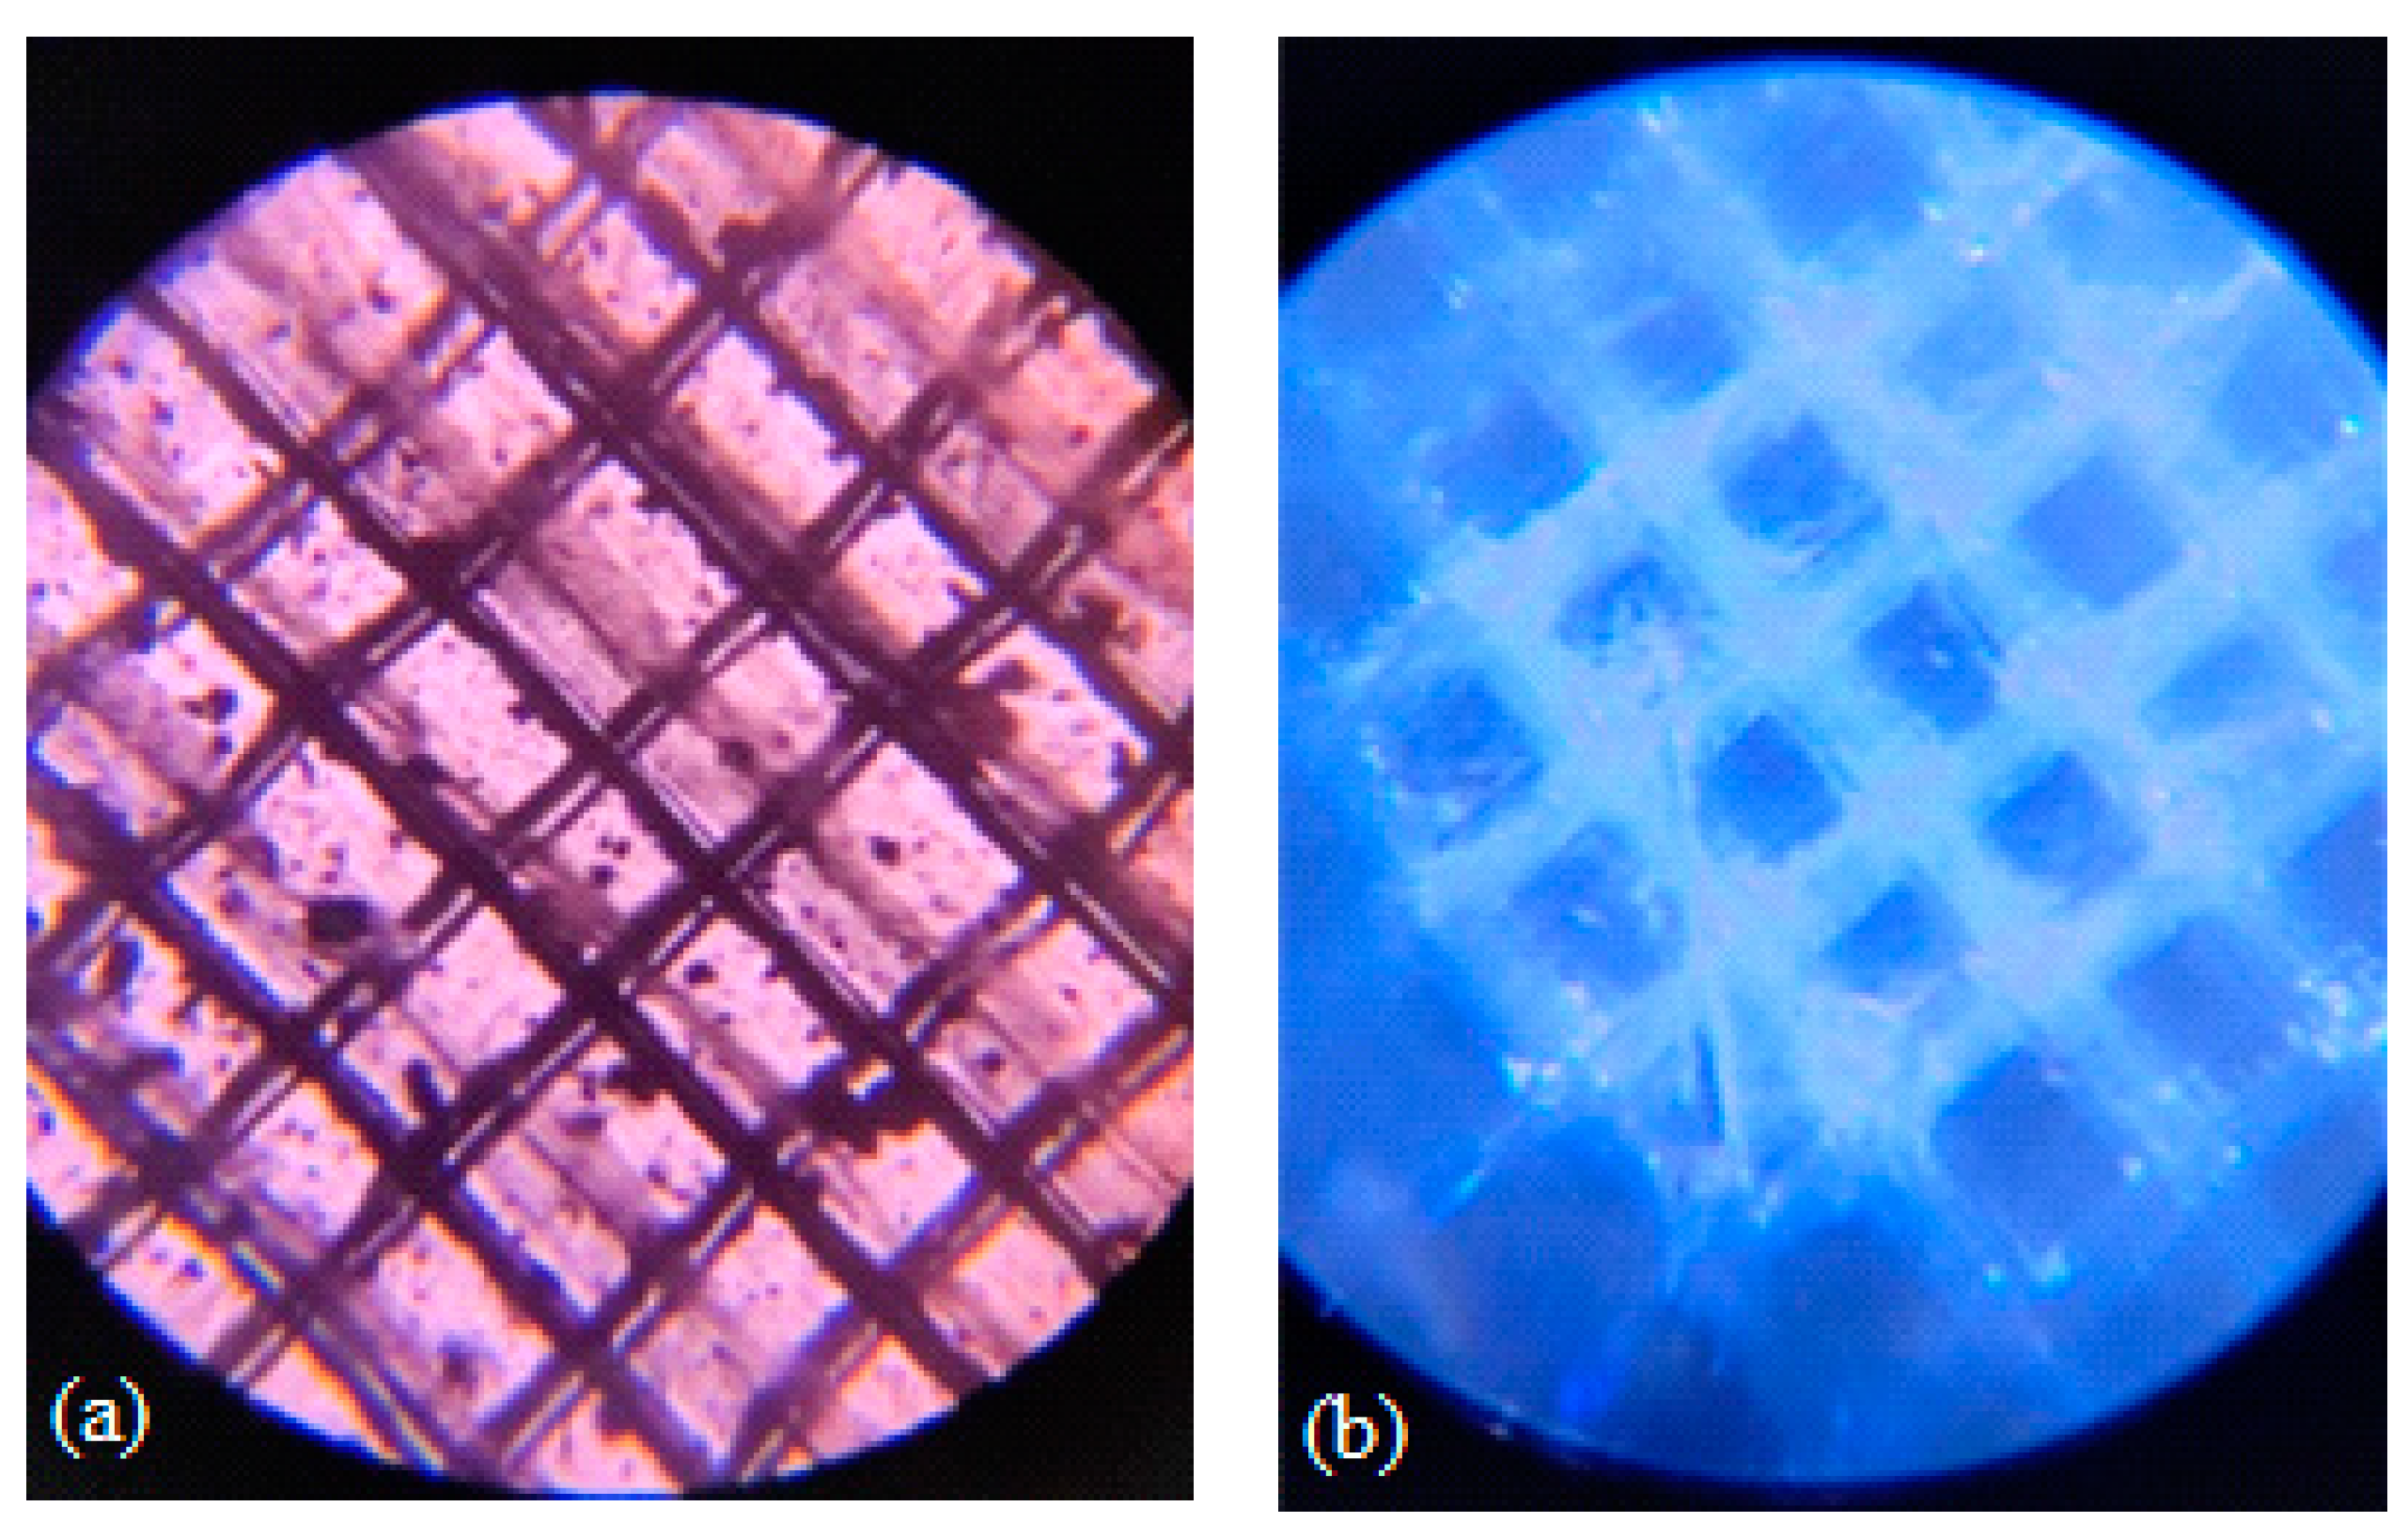
Upon close analysis of the base of the temperature tower, material inconsistencies were identified. Figure 7 shows images of these material inconsistencies obtained by an optical microscope. The left side displays the top layer of a part printed with the commercial filament, while the right side shows the top layer of the rPET temperature tower’s base. A distinct difference is evident between the two materials, with the rPET piece showing clear signs of insufficient material.
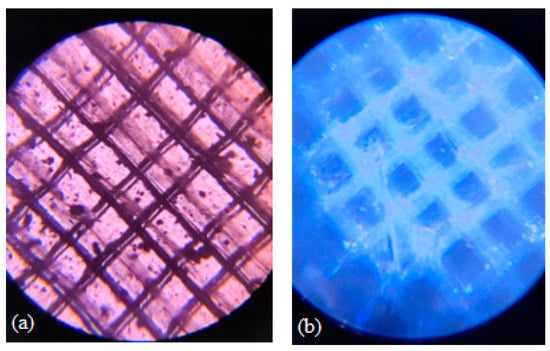
Figure 7.
Top layers: commercial filament (a) vs. rPET (b).
It was found that the recycled filament exhibited material deficiencies. Unlike the commercial filament, the recycled filament was a central hollow, which may have been the cause of this issue. Figure 8 presents a magnified image of the filament’s cross-section.
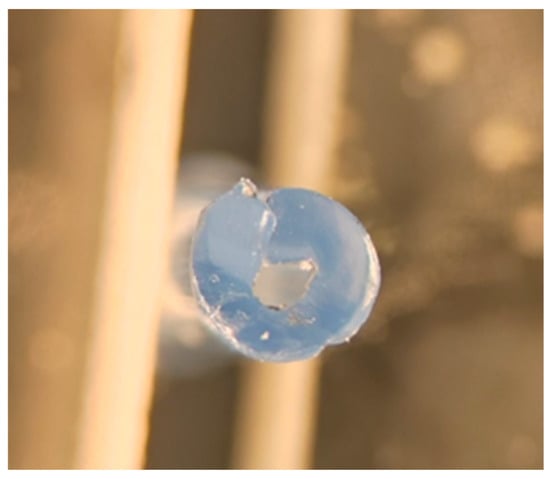
Figure 8.
Cross-section of rPET filament.
Even when using a wider plastic strip, the resulting filament remained hollow. To investigate this issue further, another sample was printed using a filament produced from a 10-mm-wide strip. This resulted in a visibly smaller hollow section, as seen with the naked eye. However, during the printing of the first layer, the printer nozzle was clogged. Using a printer capable of operating at temperatures above 260 °C might produce better results. However, since this was not the case, and to ensure compatibility with standard printers, this issue was addressed differently by increasing the extrusion flow rate to compensate for the lack of material.
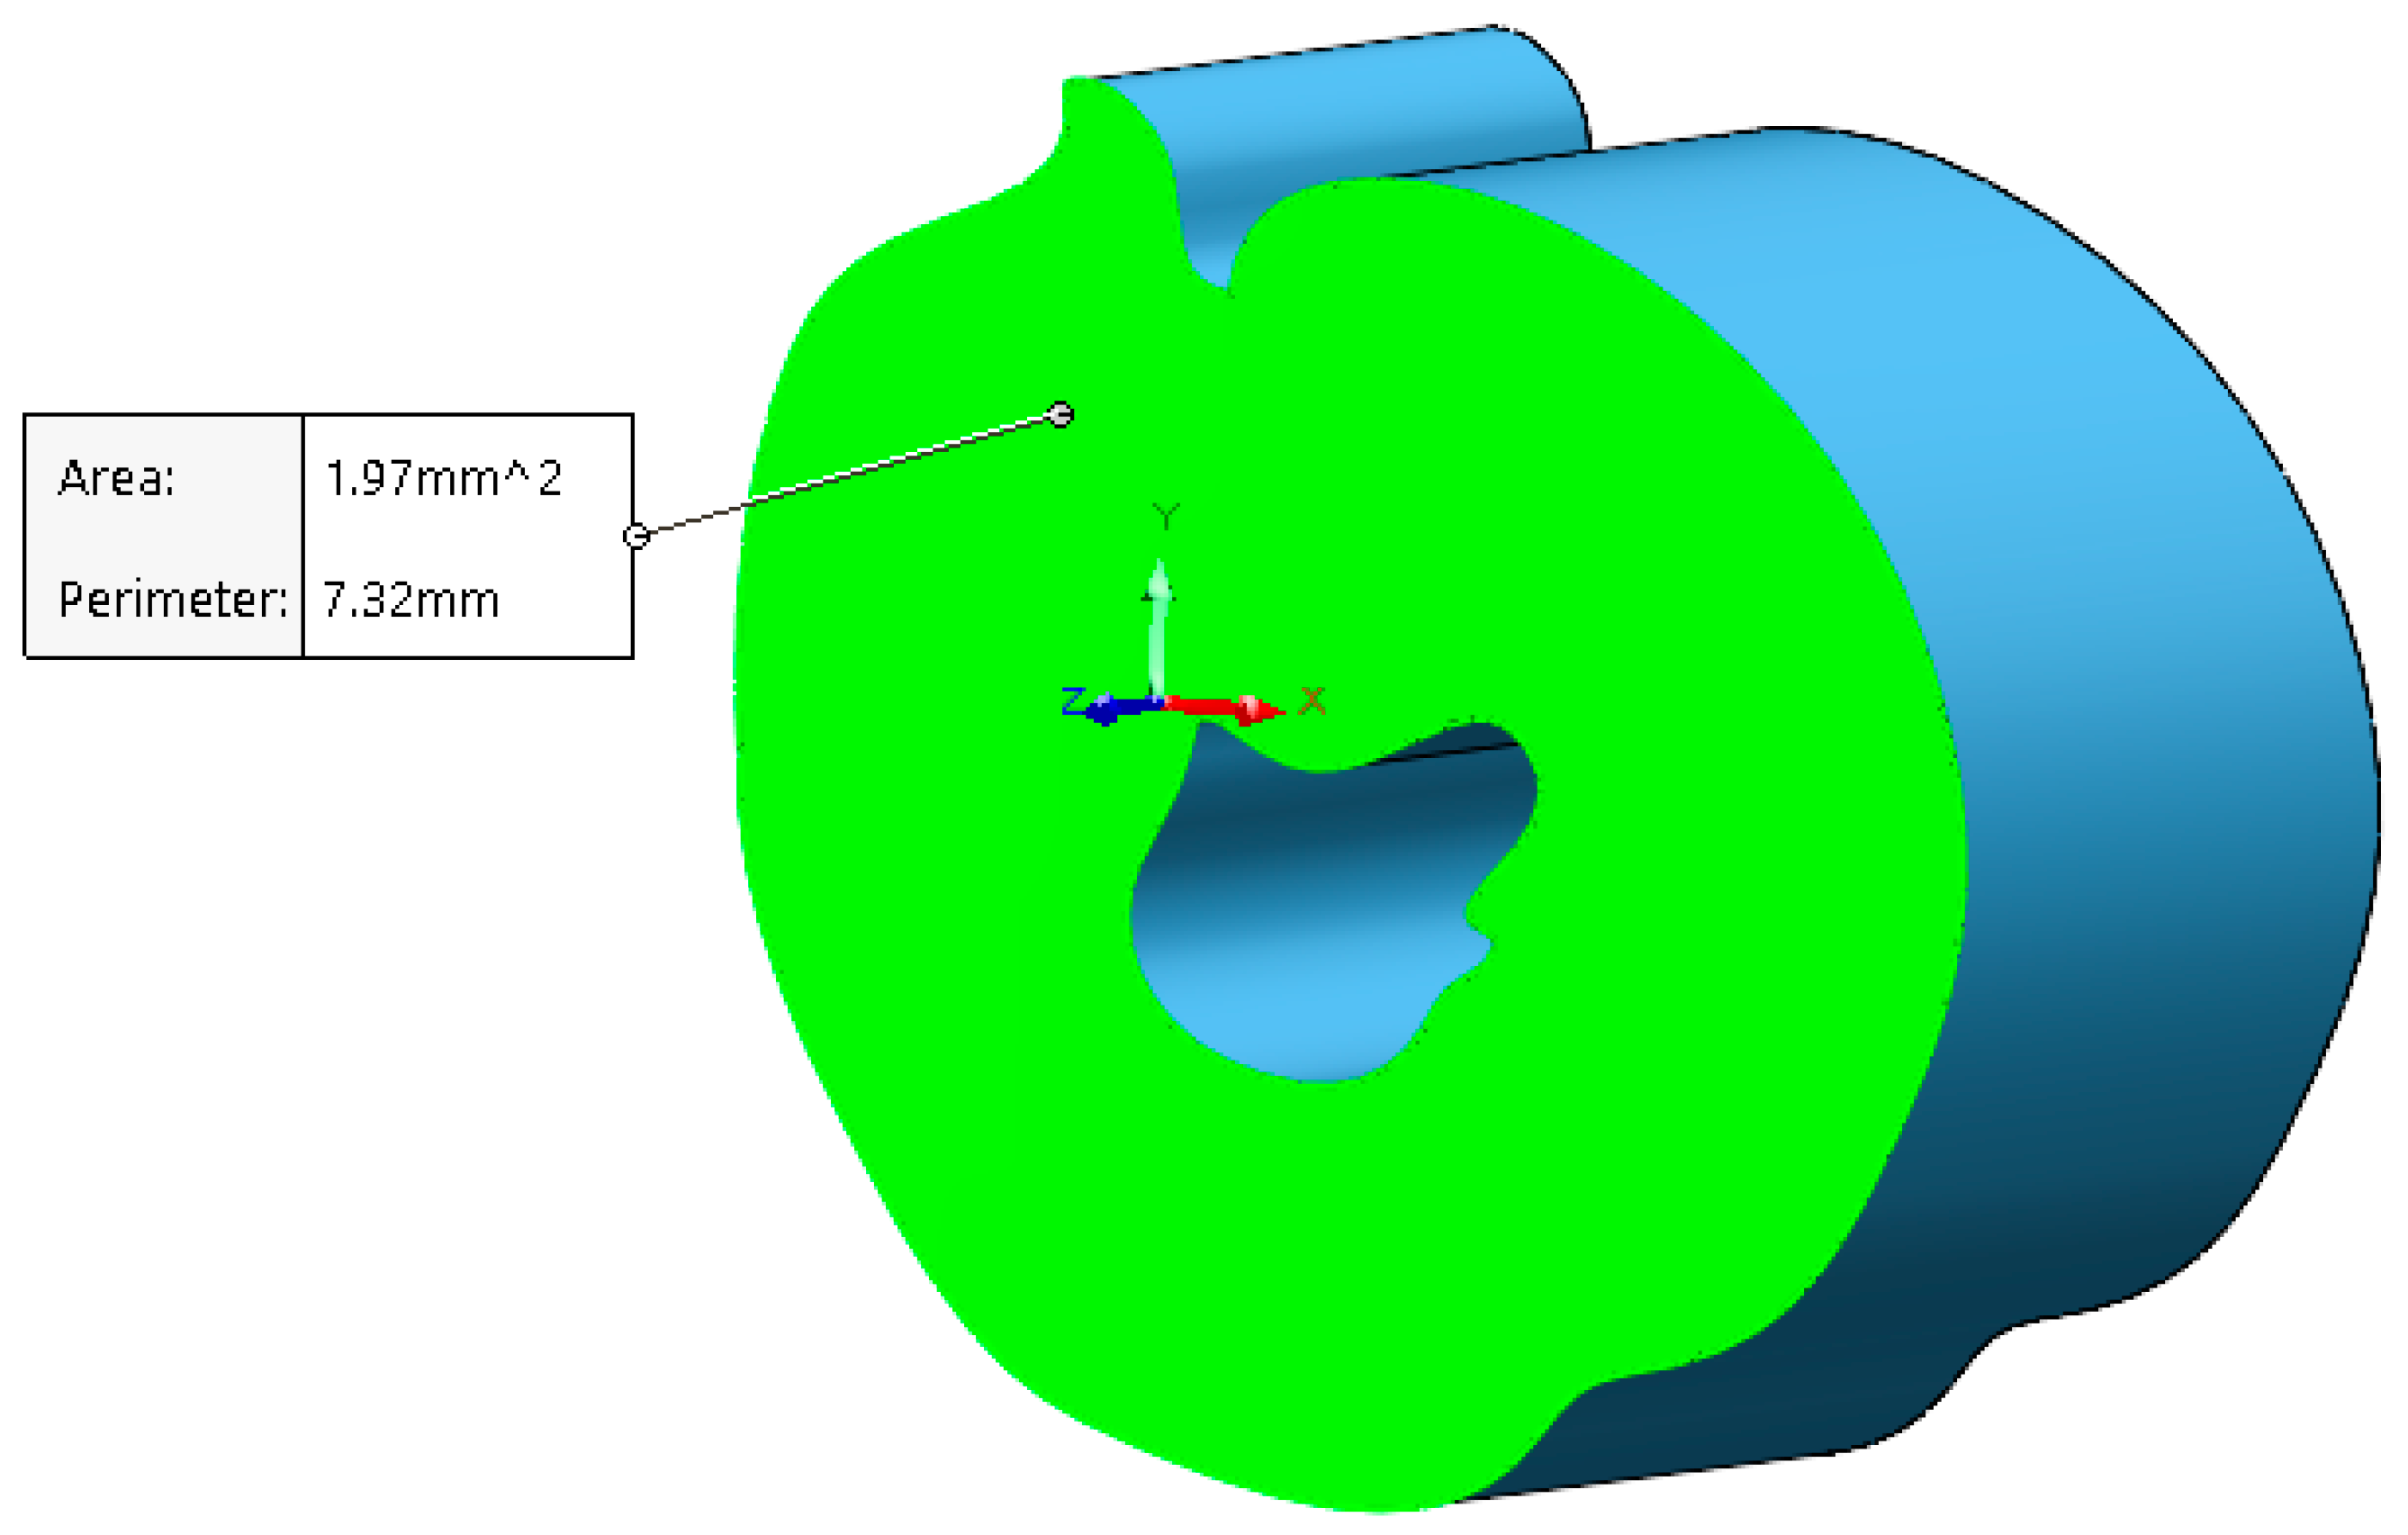
It was therefore necessary to quantify the material deficiency in the recycled filament due to the hollow section to calculate the required flow rate adjustment. Using SolidWorks to draw over the filament’s cross-sectional area, an estimation was calculated, as shown in Figure 9.
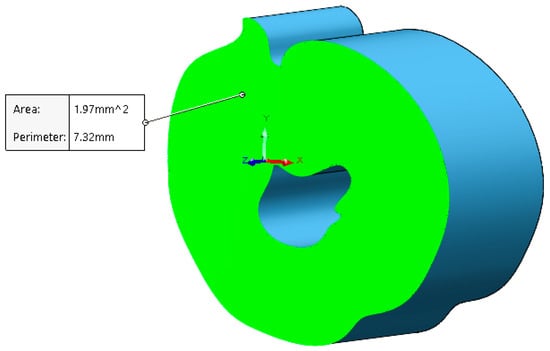
Figure 9.
Filament section area estimation in SolidWorks.
After determining that the approximate cross-sectional area of the filament created earlier was 1.97 mm2, the cross-sectional area of the commercial filament was calculated using the following equation:
where
- represents the section area of the commercial filament;
- denotes the section radius of the commercial filament.
Considering the 8.75 × 025 = 2.2 mm2 cross-section of the original strip, one can conclude that stretching occurred during filament production.
Knowing the area that the recycled filament should have, the necessary flow compensation could be calculated:
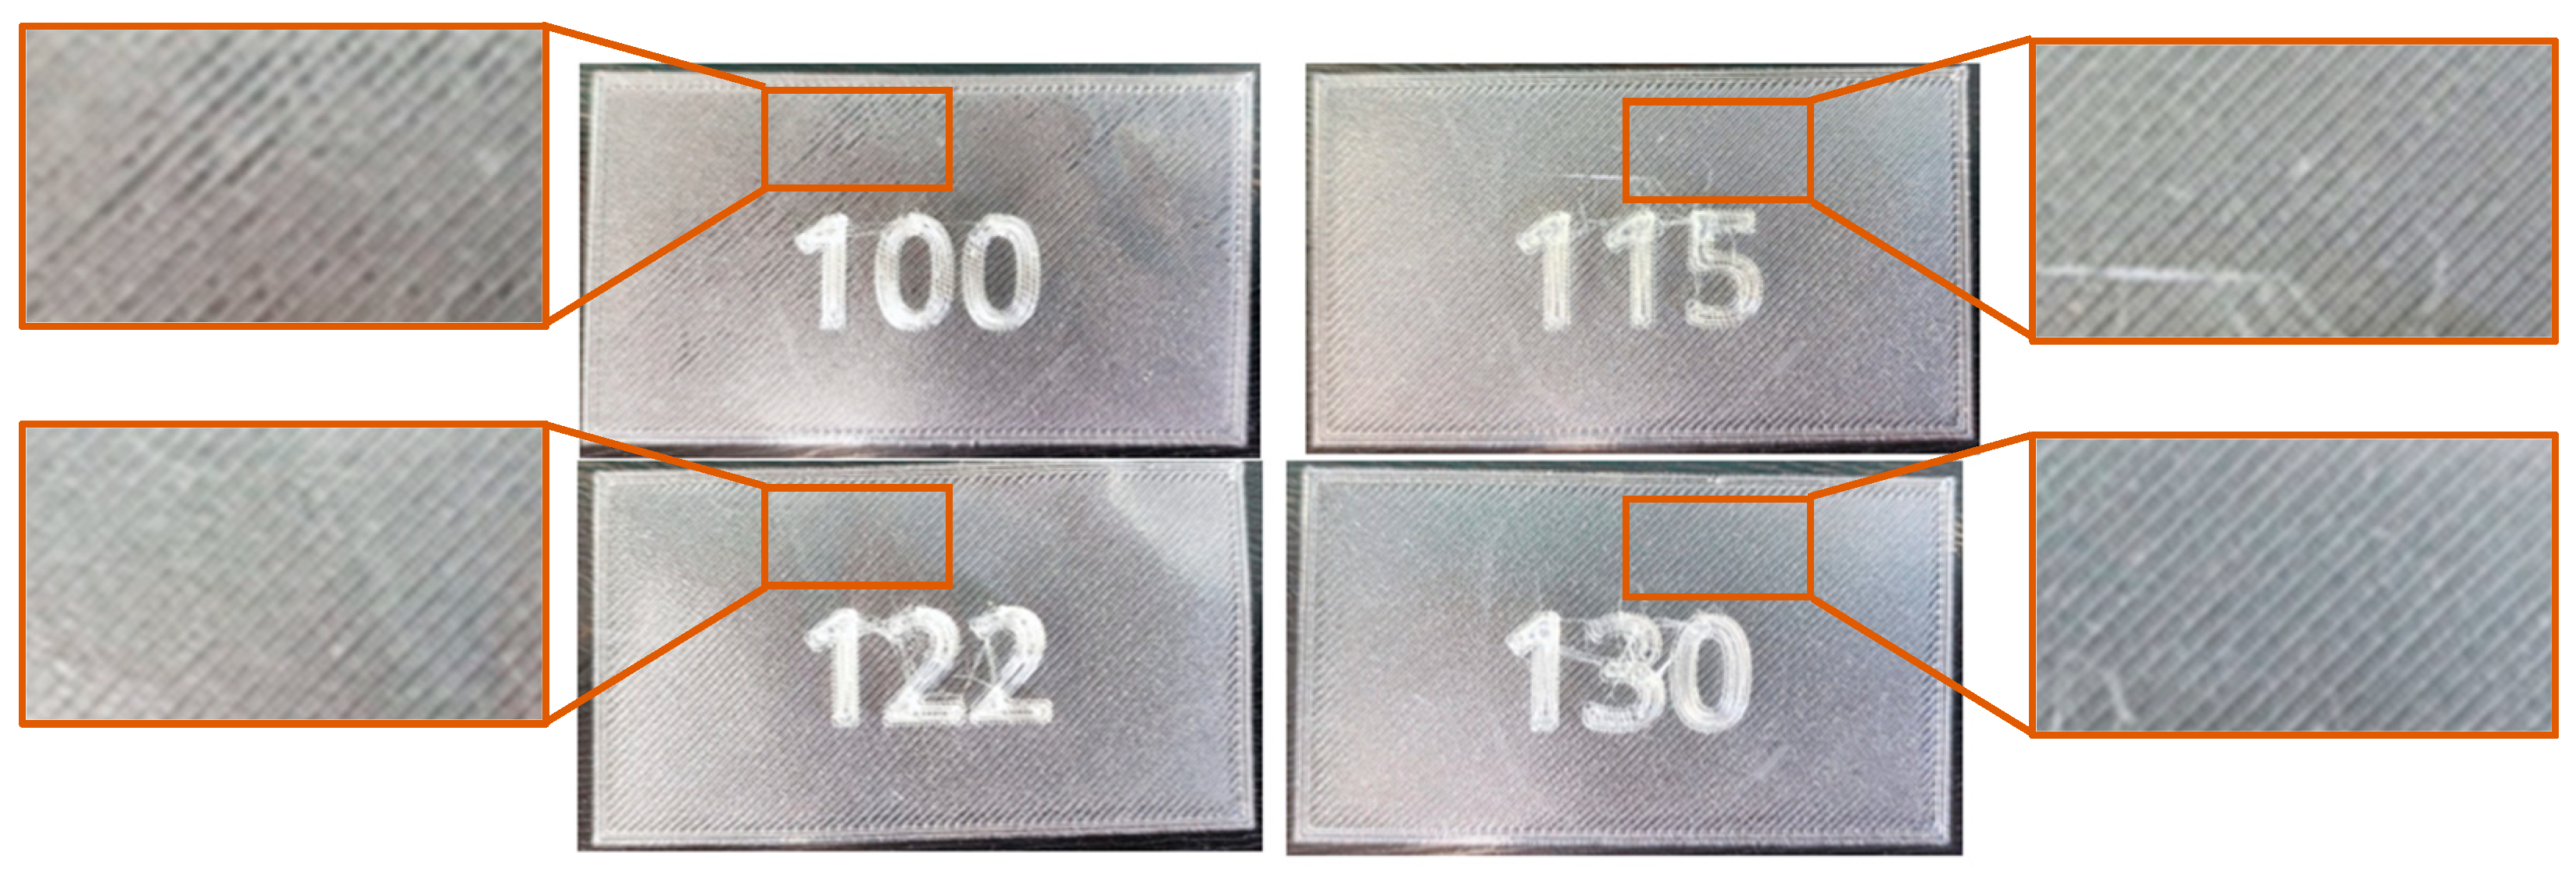
To observe the difference in the first layer, some tests were carried out, using a normal flow rate of 100%, 115%, 122%, and 130%, which is the theoretical value to compensate for the hollow nature of the filament with upper and lower tolerances. The differences between the first layers in the different samples can be seen in Figure 10.
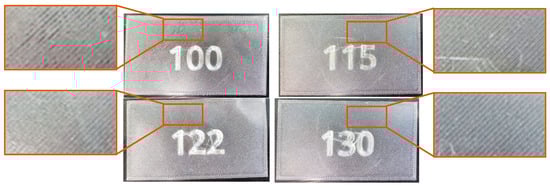
Figure 10.
Samples with different flow values.
From Figure 10, the printing created with the standard flow rate of 100% shows defects in the first layer, indicating that the material was not being extruded in the required quantity to form a complete, flawless layer. Increasing the flow rate to 115% led to a significant improvement, eliminating the defects and creating a consistent layer. At 122%, the theoretical optimal flow rate for this filament, the layer became even more uniform. Increasing the flow rate to 130% did not provide any significant visible improvement, so 122% was chosen as the optimal value for the flow rate.
2.3. Tensile Tests
To evaluate the mechanical properties of the produced rPET filament, tensile tests were conducted. These tests enable us to determine material parameters such as the strength, strain at failure, and Young’s modulus, offering detailed insights into the material’s behavior under tensile stress.
The National Institute of Standards and Testing indicates that the [22,23] standards can give approximate results for parts produced via additive manufacturing; however, caution is needed as these standards are intended for solid, homogeneous materials. In additive manufacturing, the material properties depend on the complex mesostructure created by the slicing software and the chosen printing parameters. This mesostructure includes factors such as the fill percentage and pattern, layer height, and wall count, among others [24]. To approximate printed samples to solid materials, a 100% infill was used, with the top and bottom layers and the walls removed.
For these tests, an adapted method from the [23] standard, using a Type IV sample, was used. Three samples were used for each material and orientation. All samples, regardless of the material used, had the same dimensions and printing parameters and were printed on the same printer to minimize potential variables.
The samples’ dimensions are shown in Figure 11.
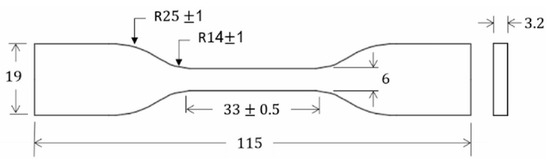
Figure 11.
Test piece dimensions in millimeters.
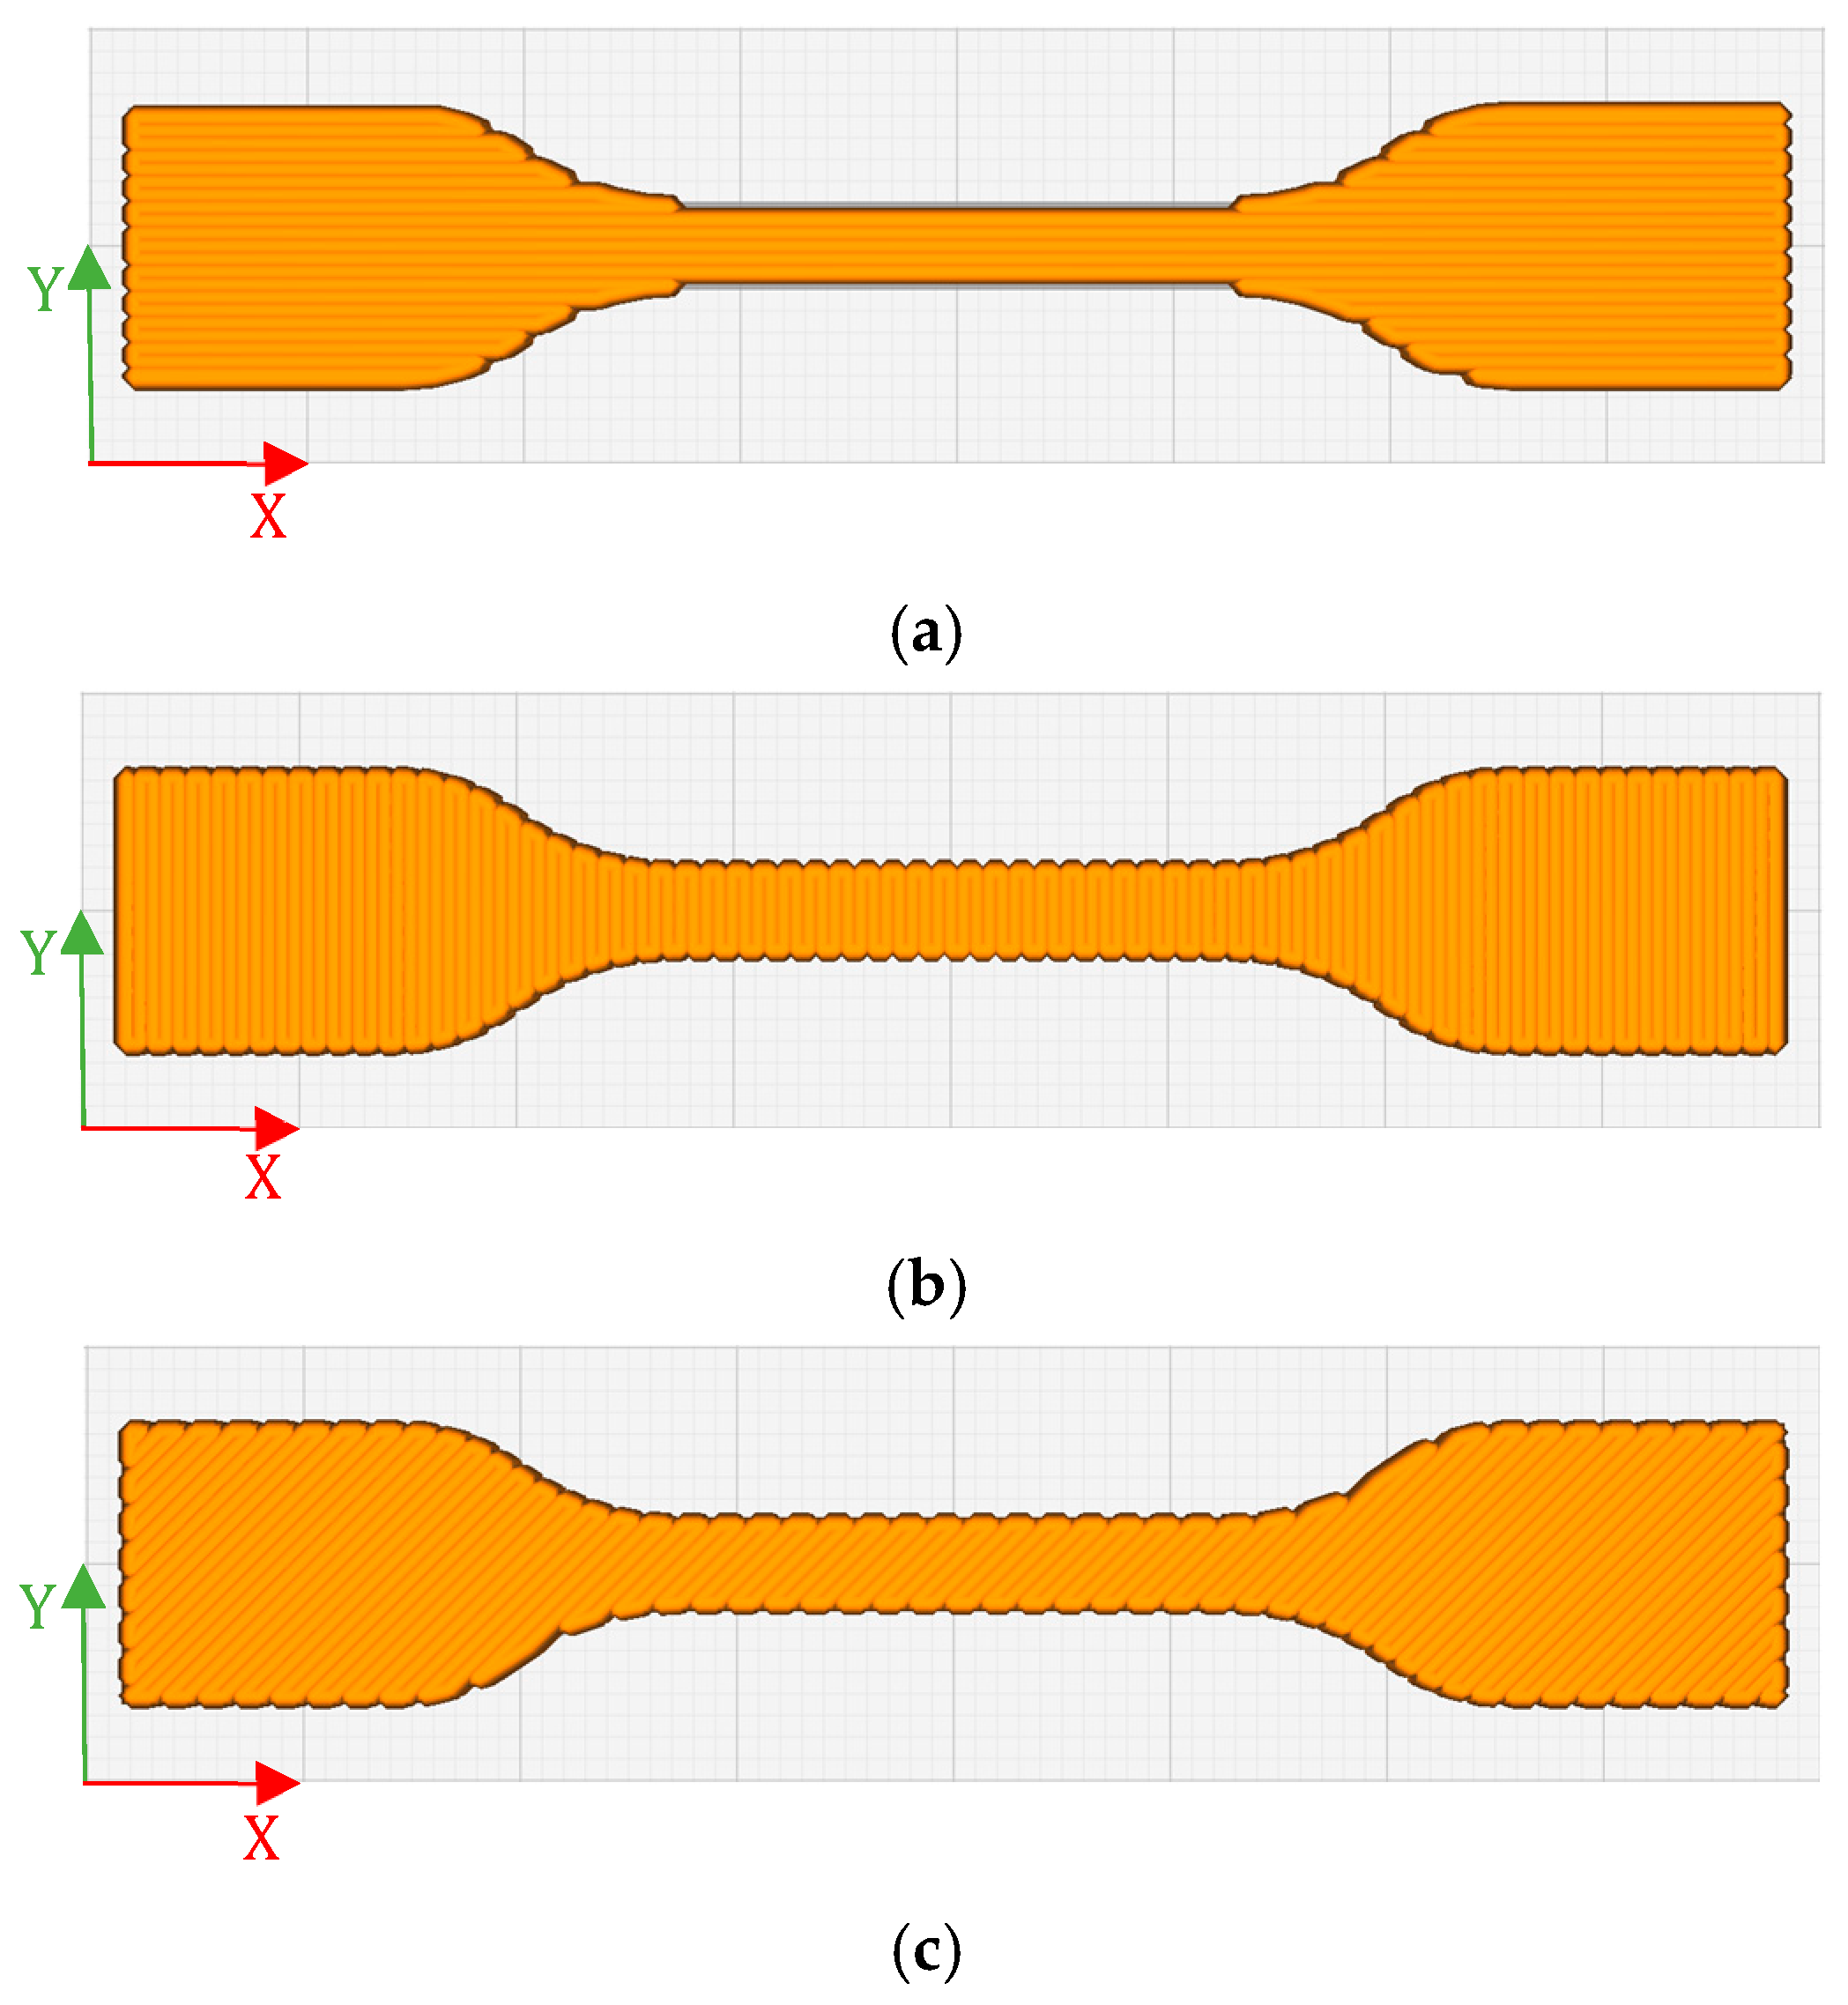
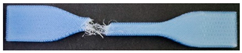
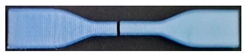
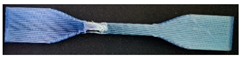
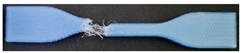
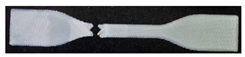
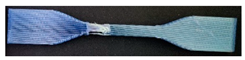
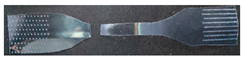
Tensile tests samples were produced, each with all its layers in the same printing orientation. The procedure for the testing of samples from [24] was followed, and three different test samples with printing orientations of 90°, 45°, and 0° relative to the load direction were tested, as shown in Figure 12. The goal was to assess the impact of the layer orientation on the mechanical properties of the recycled material. This approach provided a more detailed analysis of the anisotropic behavior of the printed samples, as FFF additive manufacturing results in mechanical properties that change with the layer orientation. The mechanical behavior of specimens with a 90° printing orientation is primarily influenced by the adhesion between layers, whereas the 0° layer orientation depends largely on the properties of the extruded material itself. For specimens with a 45° crossed orientation (intercalated layers of +45° and −45°), the mechanical behavior reflects a combination of both layer adhesion and material properties. In [15], a recycled PET filament obtained through a similar procedure as in the present study was used to print a sample using this printing orientation. This sample was later tested, which allows for a direct comparison with the results in the present study.

Figure 12.
Printing orientations of the three different samples tested, adapted from [24]. (a) Samples at 0° printing orientation; (b) samples at 90° printing orientation; (c) samples at 45° printing orientation.
As rPET is a recycled material, understanding how these variations affect its mechanical properties compared to a virgin material is important. Therefore, these samples and orientations were compared with the commercial PETG from the brand eSUN to examine the similarities and differences in the mechanical behavior between the two materials.
At the standard 45° angle, samples from two different brands of bottles but with the same thickness were also compared in this study, to determine if significant variations in the mechanical properties existed in rPET obtained from different bottle suppliers, while keeping the entire filament production and part printing process constant.
Finally, a test was conducted on samples cut directly from the PET bottle used to produce the filament, to understand how the recycling and printing processes affected the material’s mechanical properties.
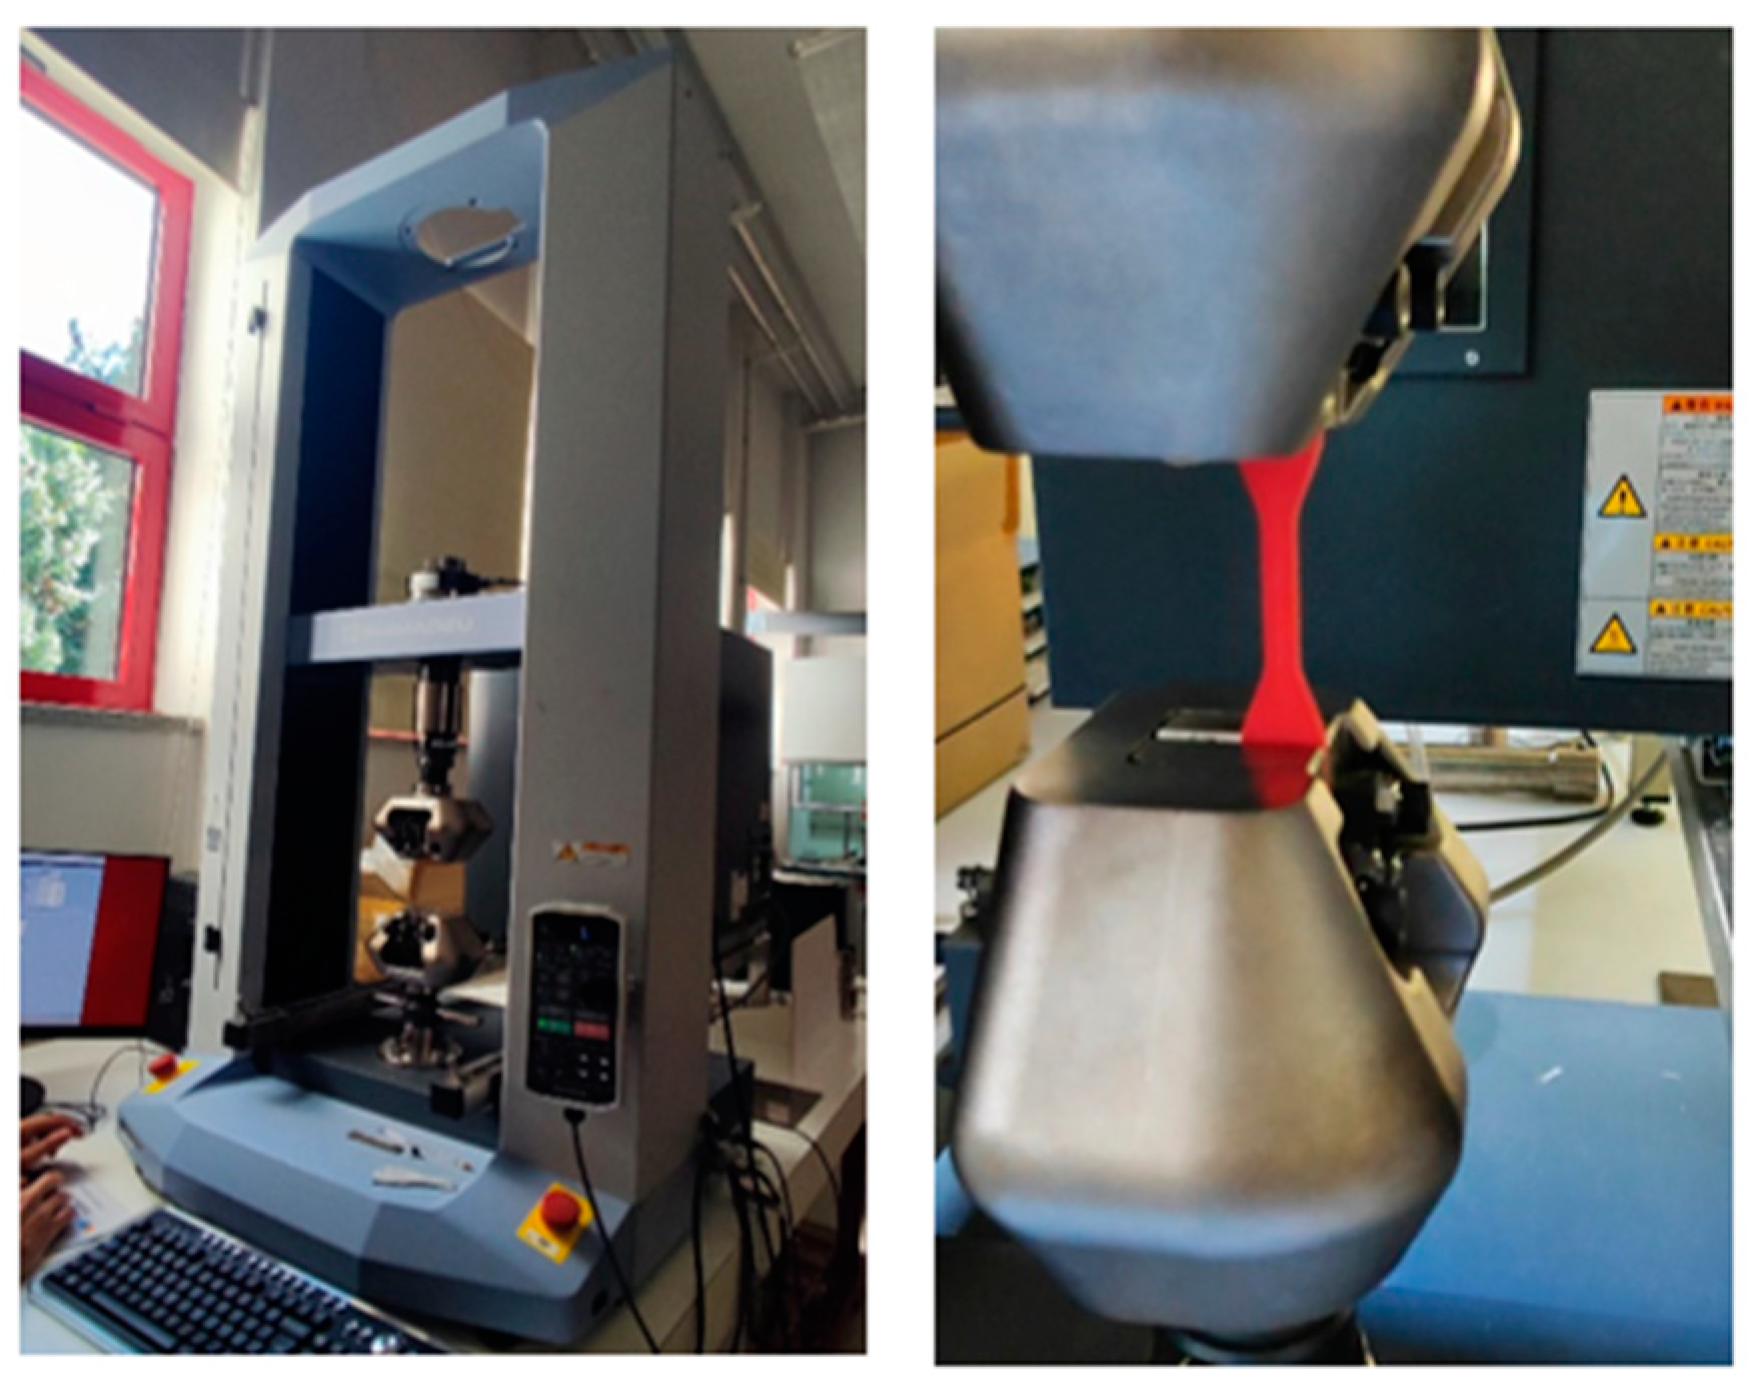
The tensile tests were performed using the Shimadzu AGS-50 kN universal testing machine, shown in Figure 13, with a test speed of 10 mm/min and an initial gauge length of 65 mm.
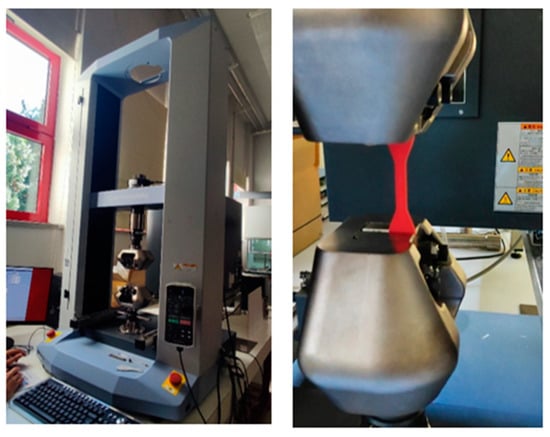
Figure 13.
Shimadzu AGS-50 kN universal testing machine.
3. Results
3.1. Comparison Between rPET and PETG
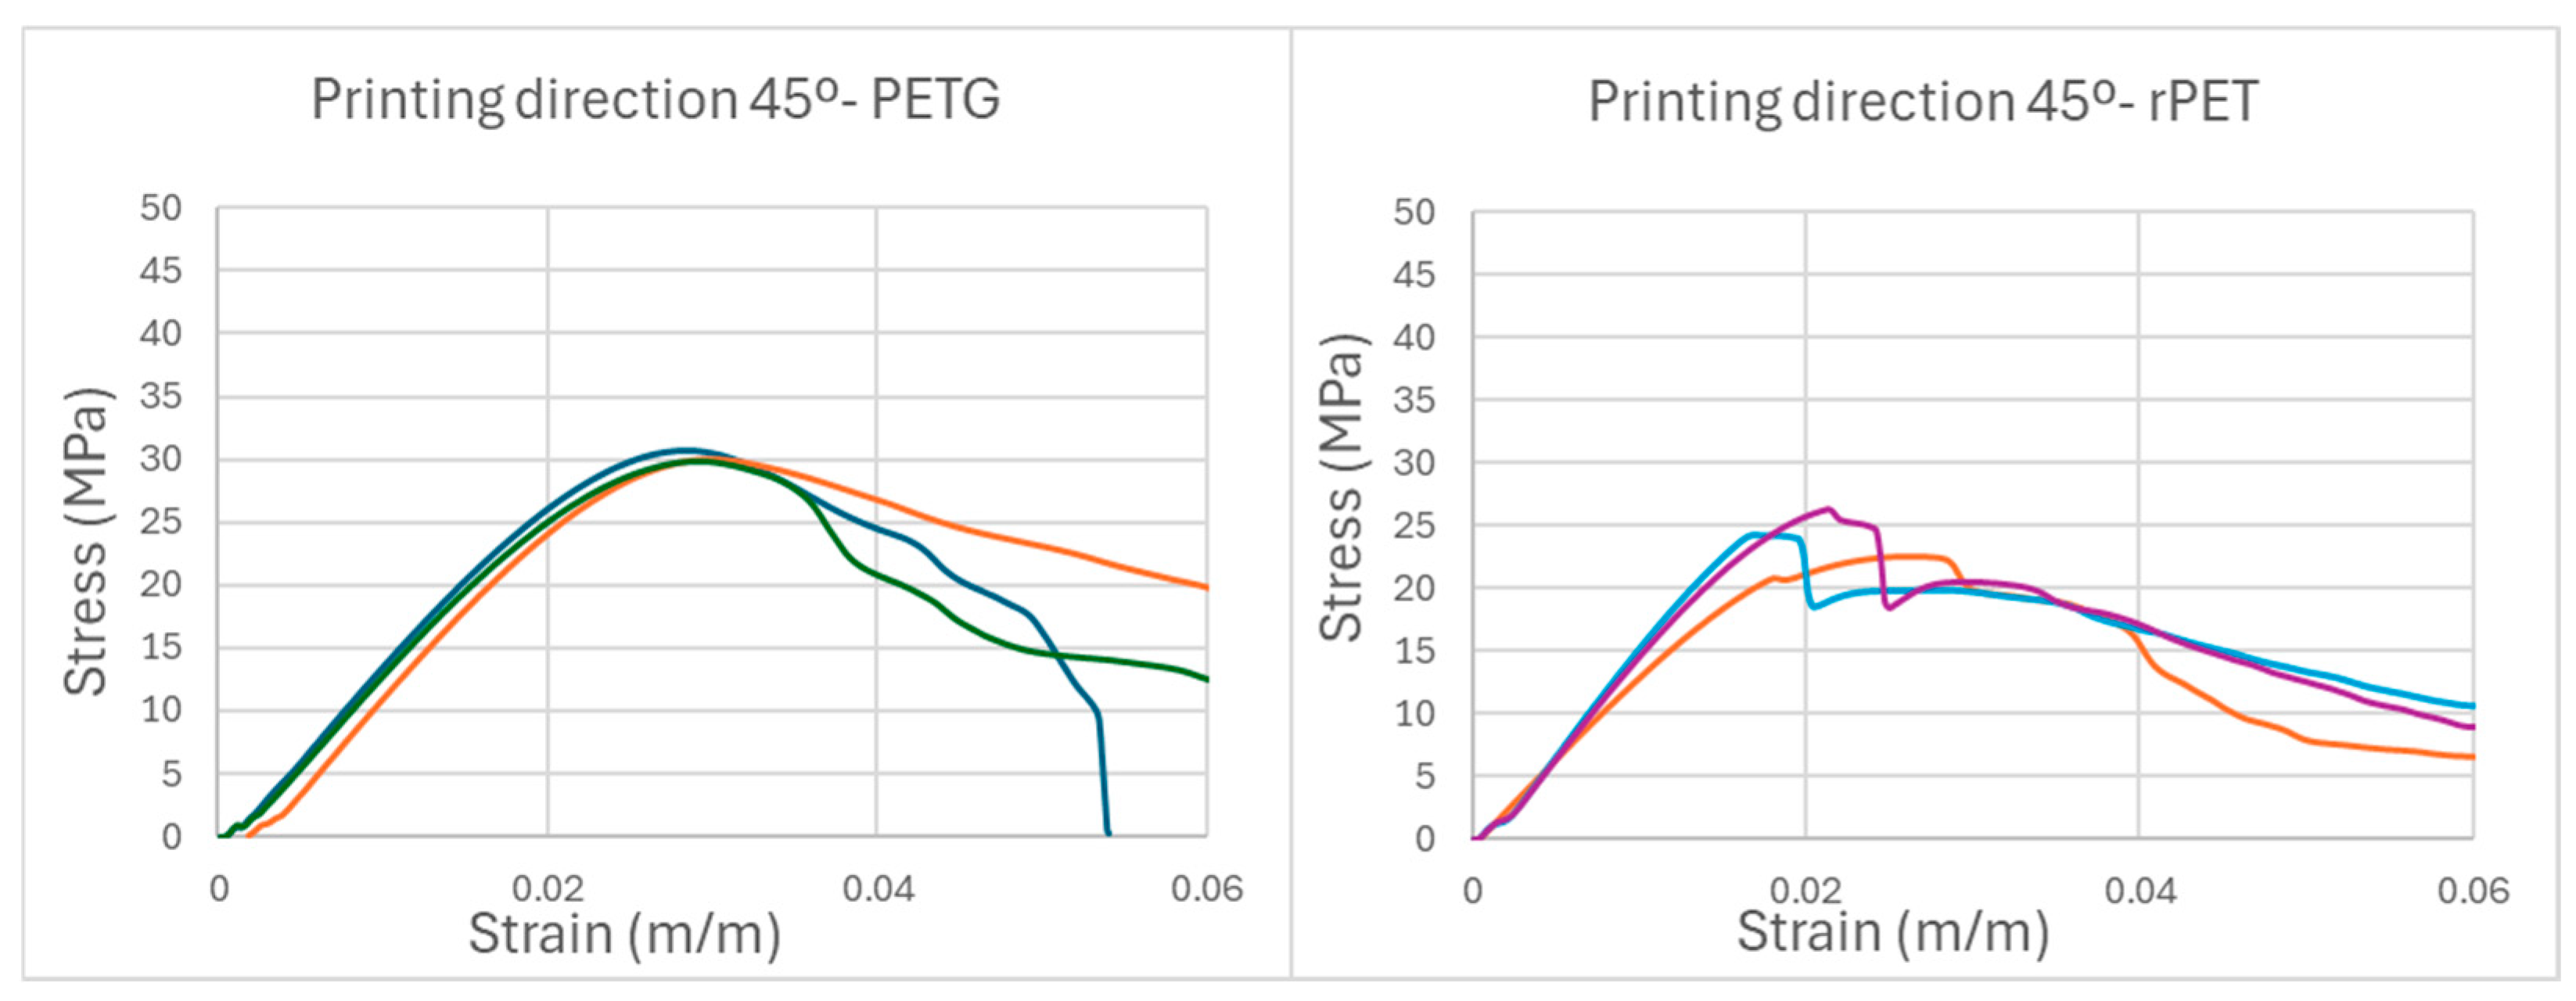
In Figure 14 and Table 2, one can compare the tensile mechanical behaviors of PETG and rPET at 45° by analyzing the stress–strain curves.
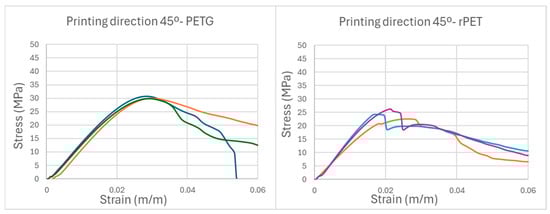
Figure 14.
Representative stress × strain graph of PETG and rPET at 45°.
Table 2.
Comparison of the mechanical properties of PETG and rPET at 45°.
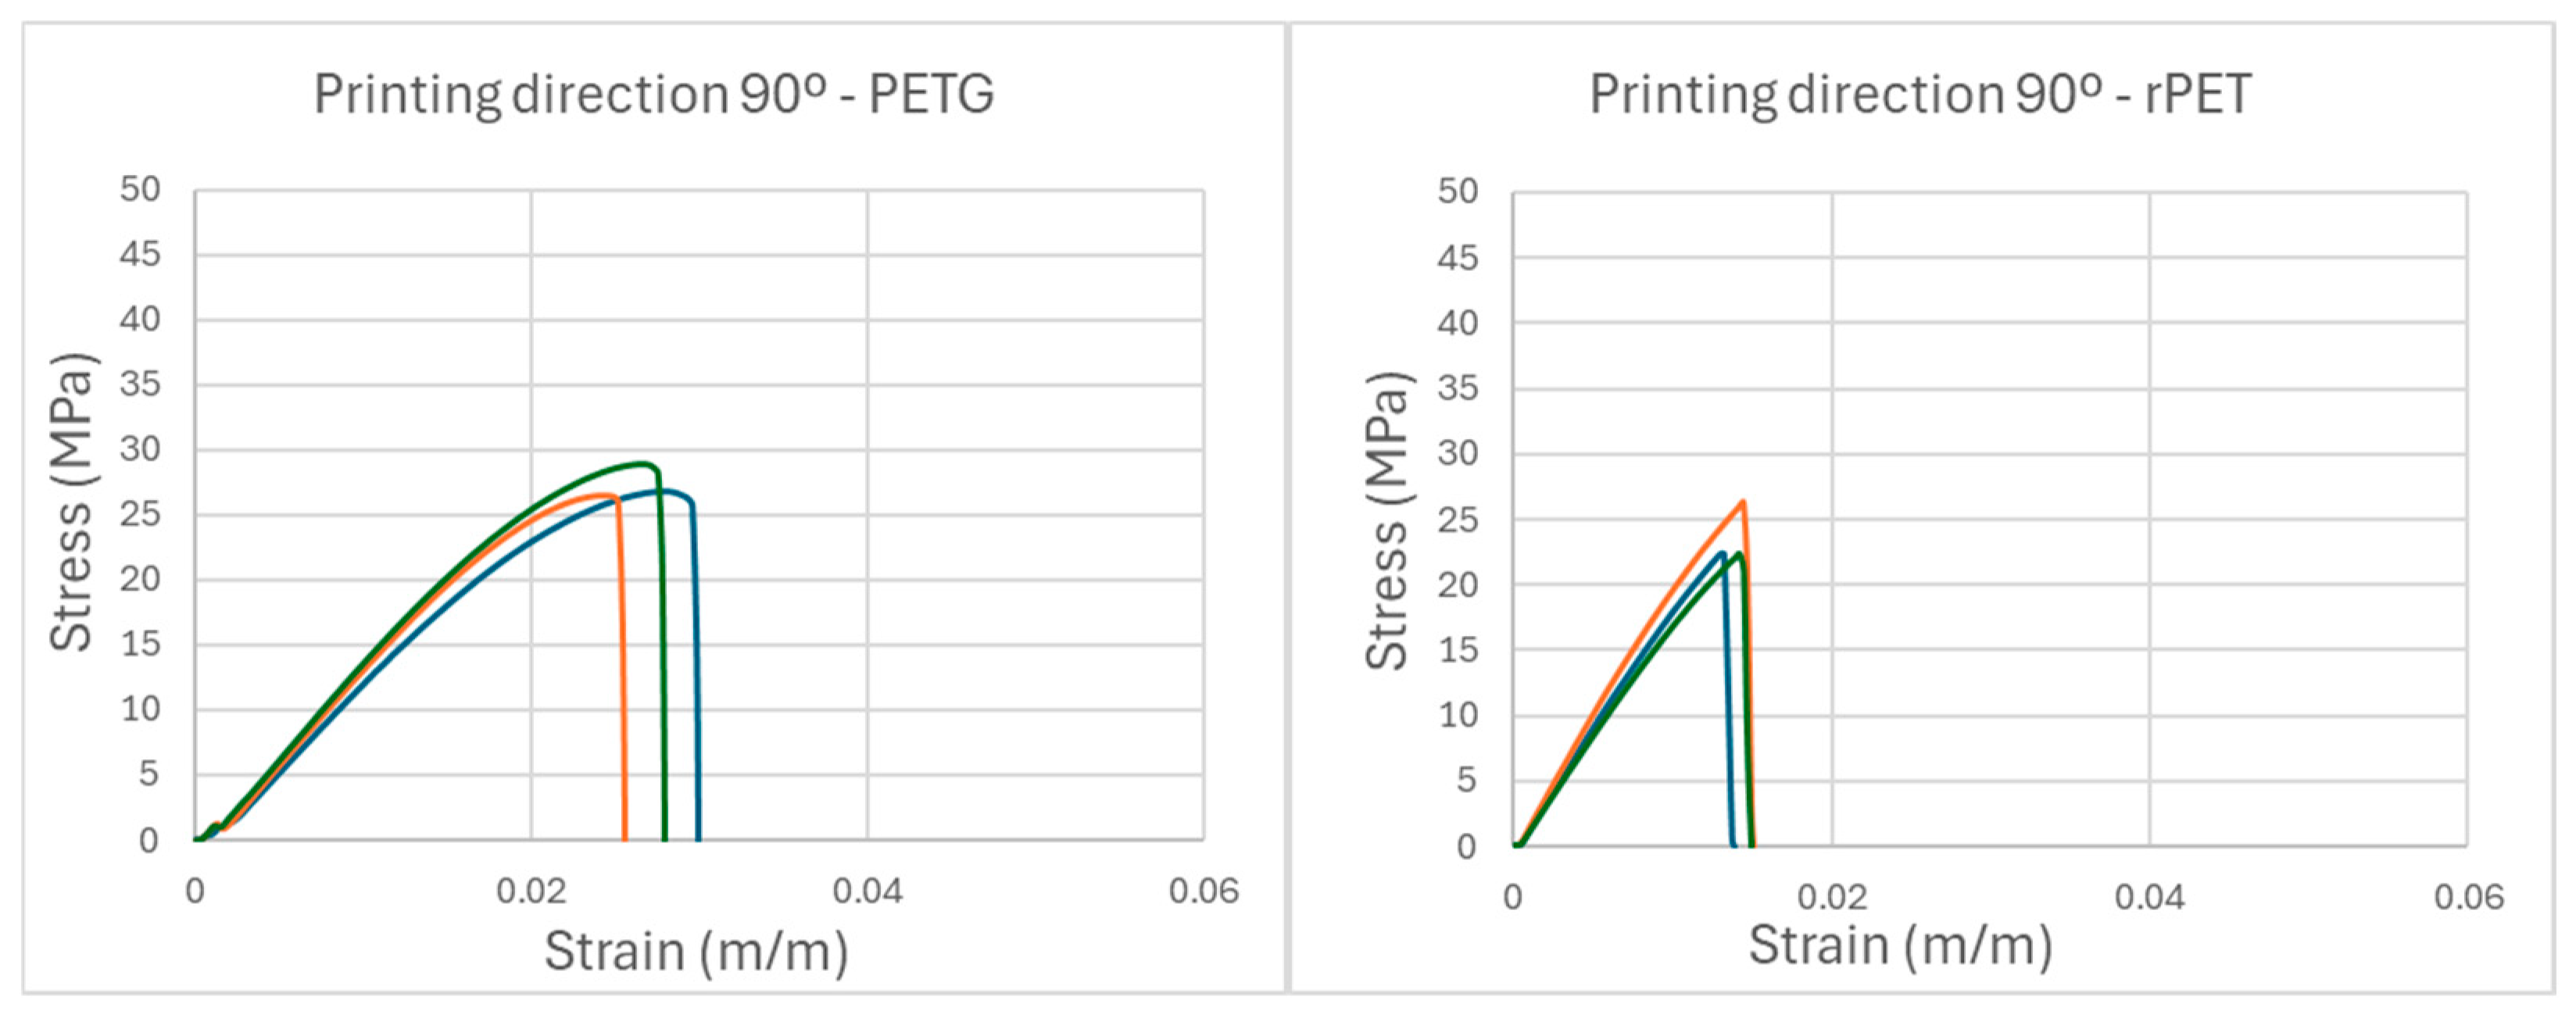
In Figure 15 and Table 3, one can compare the tensile mechanical behaviors of PETG and rPET at 90°, by analyzing the stress–strain curves.
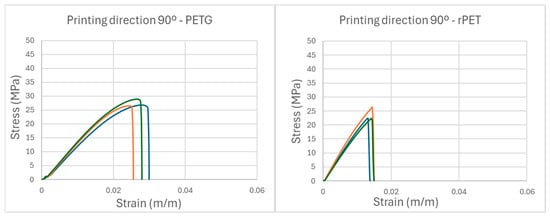
Figure 15.
Stress × strain graph of PETG and rPET at 90°.
Table 3.
Comparison of the mechanical properties of PETG and rPET at 90°.
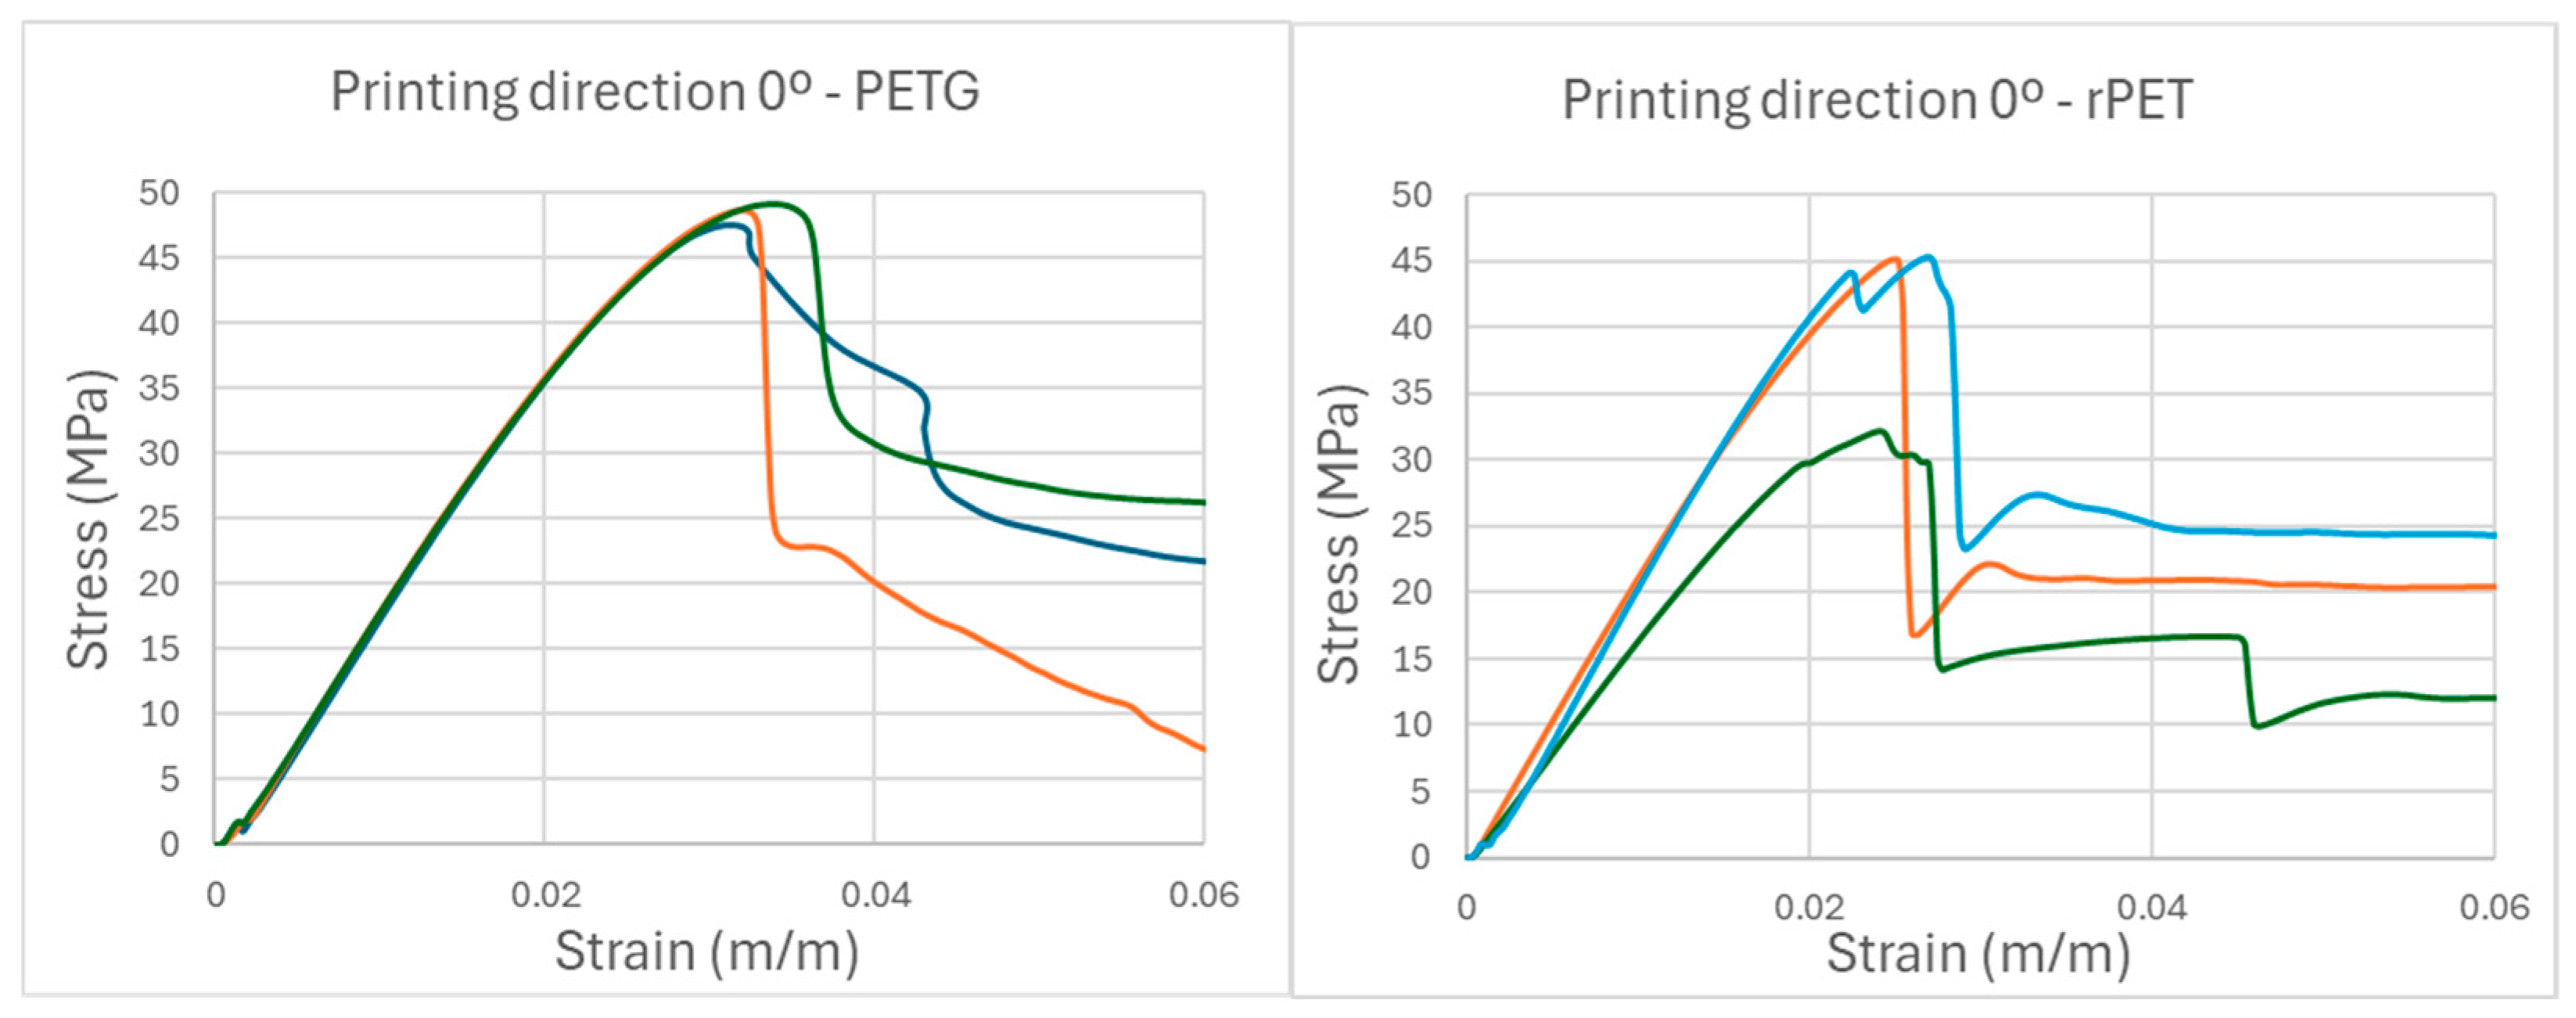
In Figure 16 and Table 4, we can compare the tensile mechanical behaviors of PETG and rPET at 0° by analyzing the stress–strain curves.
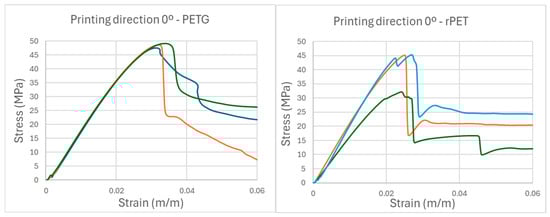
Figure 16.
Stress × strain graph of PETG and rPET at 0°.
Table 4.
Comparison of the mechanical properties of PETG and rPET at 0°.
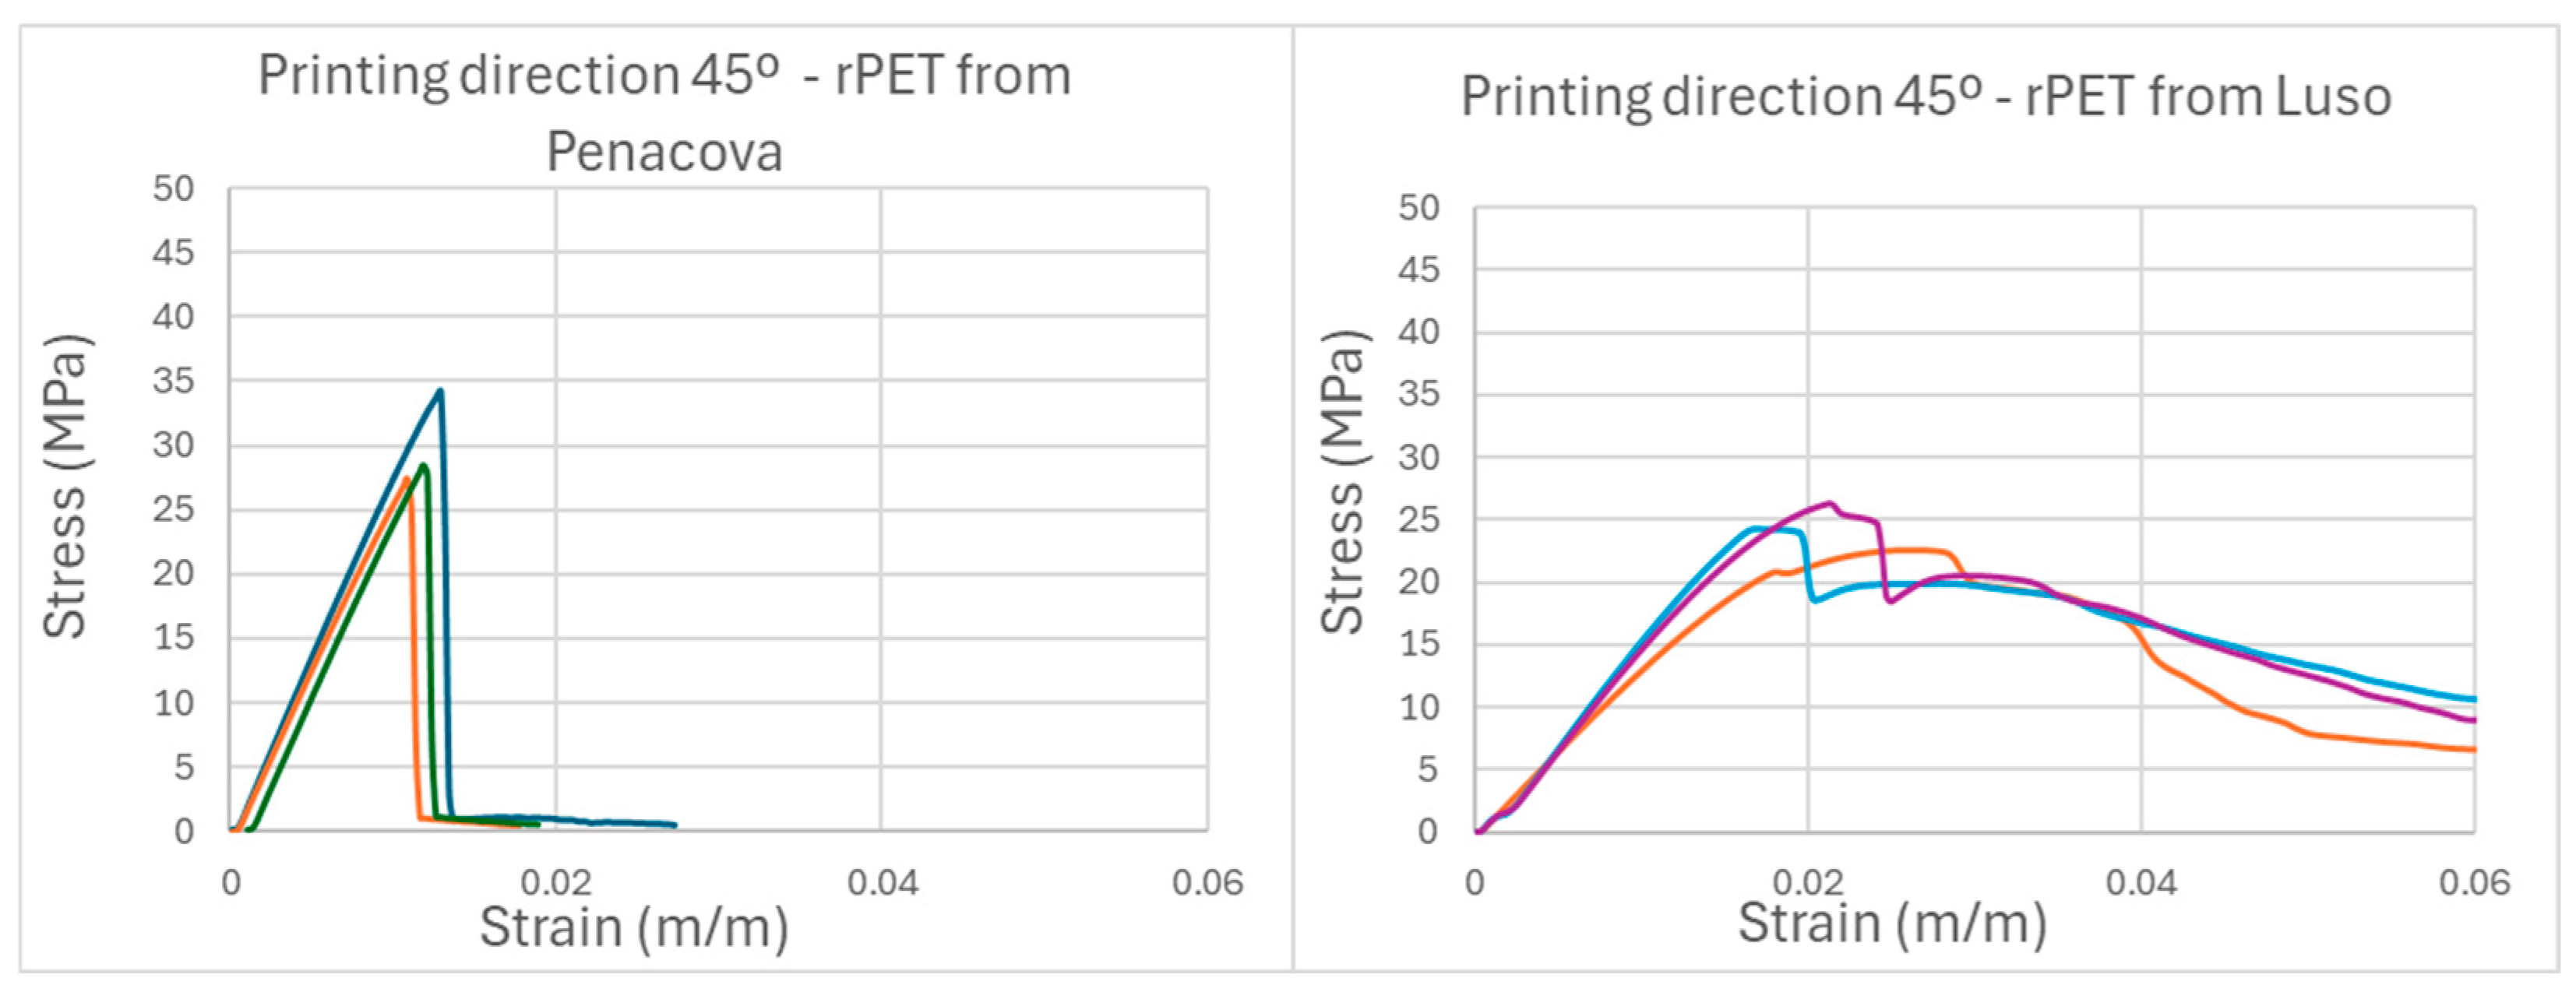
3.2. Comparison of rPET Obtained from Different Brands of Water Bottles
To test how the material properties change when using different PET suppliers, a Penacova brand water bottle, with the same thickness as the Luso water bottles, was selected for testing with the standard printing angle. The results are shown in Figure 17 and Table 5.
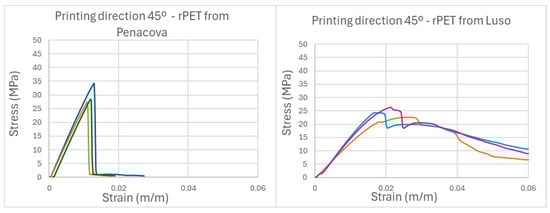
Figure 17.
Stress × deformation graph of rPET from different brands.
Table 5.
Comparison of the mechanical properties of rPET from different brands.
3.3. Comparison Between the Strips Obtained from the Bottle and the Specimens Obtained from These Strips After Transforming Them into a Filament and Using Them in FFF Additive Manufacturing
The results of the mechanical tests performed on the original strip, from which the rPET samples were produced, as well as the PET sample cut directly from the water bottle, are presented and compared with the results of the rPET samples produced at 0°. These results can be seen in Figure 18 and Table 6.
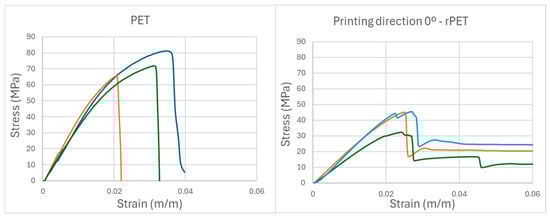
Figure 18.
Stress × deformation graph of rPET and PET.
Table 6.
Comparison of the mechanical properties of rPET and PET.
4. Discussion
4.1. Comparison Between rPET and PETG
Analyzing the tensile test results of the 3D-printed specimens with a ±45° layer orientation using rPET and PETG, presented in Figure 14 and Table 2, both samples exhibit similar stress–strain curves, characterized by an initial increase in stress until a peak, followed by a gradual decline. This pattern suggests that both polymers share similar mechanical behavior. However, PETG exhibits a more pronounced drop after the peak load, compared to rPET, whose decay curve is smoother and more prolonged. The PETG’s strength was 24% higher than the rPET’s strength, but the Young’s modulus was nearly the same (PETG was 1% higher than rPET). This is evidenced by the steeper stress curve in the initial deformation phase for PETG. PETG also shows slightly greater strain at failure, with 0.03 mm/mm, compared to rPET’s 0.02 mm/mm, indicating that PETG is slightly more ductile before reaching complete failure, as it can withstand greater deformation. This difference is visible in the curve shapes, with PETG presenting a larger plasticity region. It can also be observed in Figure 14 that the area below the stress–strain curve util rupture was higher for PETG, meaning that it can withstand more energy until failure or that it exhibits greater tenacity. Both materials exhibited a partially ductile fracture, meaning that the rupture occurred similarly in both cases, with behavior between brittle and ductile fracture. The fracture images show this characteristic, although PETG presents a more localized failure, while rPET shows a more distributed fracture.
The results obtained for rPET in this study were compared with the values presented for the recycled filament from [15]. Despite the differences in the specimen dimensions, the tensile results allow for a direct comparison. The Young’s modulus of rPET was significantly higher than that of the recycled filament from [15], which had a value of 0.133 GPa. In terms of tensile strength, the materials showed similar values, with the [15] recycled filament reaching 26.2 MPa, slightly higher than the 24.23 MPa obtained for the rPET produced in this study. On the other hand, the recycled filament from [15] exhibited greater ductility, with a strain at failure of 5.5%, compared to 2% for the rPET examined in this study.
Analyzing the tensile test results of the 3D-printed specimens with a 90° layer orientation using rPET and PETG, presented in Figure 15 and Table 3, both samples exhibit similar stress–strain curves, characterized by an initial increase in stress until reaching a peak, followed by a sharp drop, indicating a brittle fracture with almost no plasticization plateau. Additionally, due to the similarity in the mechanical behaviors between the two materials, the rPET specimen shows similar layer adhesion. Despite the similar curve shapes, PETG reaches higher maximum stress, around 27 MPa, while rPET reaches approximately 22 MPa, indicating that PETG has 23% greater tensile strength before rupture. On the other hand, rPET shows a Young’s modulus that is 36% higher than that of PETG, justifying the greater deformation at failure of PETG. Moreover, PETG presents slightly higher strain at failure, 0.03 mm/mm, while rPET fails with a lower strain of 0.01 mm/mm. The images further confirm that, with a 90° printing angle, both PETG and rPET exhibit predominantly brittle behavior, with ruptures occurring abruptly and without visible signs of plastic deformation.
Analyzing the tensile test results of the 3D-printed specimens with a 0° layer orientation using rPET and PETG, presented in Figure 16 and Table 4, both samples follow a similar pattern to the 45° tests, with an increase in stress until reaching a peak, followed by a decline. However, compared to the 45° graphs, more pronounced differences in behavior are observed after the peak. In the case of rPET, the curve is more irregular, showing fluctuations, indicating greater variability in mechanical failure related to the material and its orientation. Nonetheless, with this orientation, the strength is higher compared to the other orientations. PETG shows 9% higher strength (49 MPa compared to 45 MPa for rPET). As in other directions, rPET presents a 15% higher Young’s modulus. The curves indicate that PETG deforms more before failure, showing a maximum strain of 0.03 mm/mm, while rPET tends to fail with a strain of around 0.02 mm/mm. This suggests that PETG is slightly more ductile, as observed in the other graphs. Ductile failure is clearly visible in both samples, with the two parts of the specimen never fully separating after the peak stress at the end of the tests.
4.2. Comparison of rPET Obtained from Different Brands of Water Bottles
At first glance, it seems that the rPET specimen from Penacova has a printing orientation of 90°, as the curve presented is similar to those previously analyzed with the same orientation. As shown in Figure 17, and after the maximum stress peak, the material exhibits brittle failure. Although it showed a strength value close to that of the initial rPET (27 MPa), the specimen split into two parts immediately after the stress peak, unlike the tests conducted at 45°, where the material showed greater deformation after the peak. This difference indicates that the material from the other brand (Penacova) is considerably stiffer, which is reflected in its stress–strain curves.
4.3. Comparison Between the Strips Obtained from the Bottle and the Specimens Obtained from These Strips After Transforming Them into Filaments and Using Them in 3D Printing
In the graph shown in Figure 18, one can observe that the original PET displays typical polymeric mechanical behavior, with a gradual increase in stress up to a peak, followed by a sharp drop. The maximum strength achieved by the original PET is around 72 MPa, with a high standard deviation, indicating significant variations between specimens due to manual cutting. However, despite these variations, it is clear that 3D printing with rPET introduces layers that weaken the internal cohesion.
The original PET has an elastic modulus of 3.64 GPa, 66% higher than that of the rPET specimens oriented at 0°. This demonstrates a significant reduction in material stiffness after recycling and printing processes. On one hand, molecular weight loss may occur during the filament transformation and printing processes. On the other hand, the printed structure will contain voids, which reduce the actual cross-sectional area compared to the measured area. Another important factor to consider is the blow molding process used in bottle production. This process causes strain hardening due to the alignment of the polymer chains in the direction of viscoplastic flow. This explains the high strength and relatively brittle behavior.
The strain at failure for PET is 0.03 mm/mm, which shows that, despite being rigid, the material retains some ductility.
5. Conclusions
This study demonstrates the feasibility of producing 3D-printed parts using filaments created at home or in schools, universities, clubs, etc. The construction of a DIY machine for the production of recycled filaments from PET bottles was described, aiming to explore a more sustainable and economical alternative to commercial filaments for FFF 3D printers.
Regarding the comparison of the mechanical tensile behavior, the main difference between the two materials, PETG and rPET, lies in the predictability and consistency of the results for specimens with the same printing orientation. rPET specimens exhibit more irregularities and variations compared to PETG. These irregularities are particularly evident in the strength values, where rPET specimens consistently show a relatively higher standard deviation. Potential causes for these include the following.
- Material inconsistencies: During the plastic strip cutting process, minor variations in the strip width can lead to larger hollow cores in the filament, affecting the printing quality.
- Temperature fluctuations in drawing: Small temperature variations during drawing can alter the filament’s quality and consistency, impacting the final properties of rPET.
However, the shape of the stress–strain curves for PETG and rPET is quite similar, although the range of values varies. Both materials show similar behavior in terms of the strength, Young’s modulus, strain at failure, and even failure modes, with PETG generally achieving higher strength values than rPET, but a lower Young’s modulus. At the 0° orientation, as expected, the highest maximum stress values were observed, confirming the significant influence of the printing direction on the specimens’ mechanical behavior.
Even with similar tensile strengths, the higher stiffness of the filament developed in the present study compared to the filament from [15] can be explained by the manufacturing process that favored a more organized structure, resulting in a stiffer material.
Regarding the rPET specimens from a different brand, it was concluded that PET from different sources can result in significantly different mechanical properties and behavior, warranting further analysis to understand the causes of these variations.
The comparative analysis between PET and rPET highlights significant differences in their mechanical properties, reflecting the impact of recycling and 3D printing processes. The layering introduced during 3D printing creates structural weak points and reduces the internal cohesion, resulting in lower strength and stiffness. However, it is important to note that this performance reduction is not solely due to the material being recycled. The 3D printing process itself contributes, as evidenced by the similar performance values between rPET and PETG, the latter being a non-recycled material but also produced through 3D printing.
Tests on the recycled rPET filament revealed that, despite the slightly inferior mechanical properties compared to commercial PETG, the recycled filament offers a viable solution for 3D printing. For more demanding applications, commercial filaments may be necessary due to their stricter quality control. This result is unsurprising, as the developed machine lacks the rigorous quality control applied to commercial filaments, leading to higher impurity levels and less uniformity in the filament.
Nevertheless, the main advantage of rPET filaments lies in their ability to transform plastic waste into a value-added product, promoting local recycling and reducing plastic waste. The described machine allowed the production of filaments from PET bottles with relatively low investment, offering an economical alternative to commercial options. This filament can be used in basic 3D printers, enabling the creation of parts with good performance and appearances.
Future work will focus on optimizing the 3D printing parameters to enhance the mechanical properties of the obtained rPET filament. This includes fine-tuning the printing settings to achieve better performance and consistency in the printed parts. Additionally, further characterizations will be conducted to assess the thermal and viscoelastic properties of the recycled material. Expanding the analysis to these properties will provide a more comprehensive understanding of how recycling and 3D printing processes affect the material.
The presented solution is not only viable but also promotes sustainability while providing a practical and economical alternative for 3D printing and centralized recycling. This approach represents a significant step towards increasing the independence of 3D printer users while contributing to the reduction of plastic waste.
Author Contributions
P.P., samples and machine production, data acquisition and curation, investigation, writing—original draft, and writing—review and editing; M.L.d.A., samples and machine production, materials acquisition, supervision, and writing—review and editing; A.C.V., mechanical test support, supervision, writing—original draft, and writing—review and editing. All authors have read and agreed to the published version of the manuscript.
Funding
The authors are very grateful for the support granted by the Center for Mechanical and Aerospace Science and Technologies (C-MAST-UBI), through the project reference UIDB/00151/2020, funded by the Fundação para a Ciência e a Tecnologia, IP/MCTES through national funds (PIDDAC), and DOI 10.54499/UIDB/00151/2020.
Data Availability Statement
Data are contained within the article.
Acknowledgments
The authors acknowledge the materials, access to equipment, and installations, as well as all the general support, given by the Department of Electromechanical Engineering and the Composite Laboratory of the Universidade da Beira Interior.
Conflicts of Interest
The authors declare no conflicts of interest. The funders had no role in the design of the study; in the collection, analyses, or interpretation of the data; in the writing of the manuscript; or in the decision to publish the results.
References
- Ritchie, H.; Samborska, V.; Roser, M. Plastic Pollution. Our World in Data. 2023. Available online: https://ourworldindata.org/plastic-pollution (accessed on 12 January 2025).
- Plastics. European Commission. 2023. Available online: https://environment.ec.europa.eu/topics/plastics_en (accessed on 12 January 2025).
- Plastics Europe. European Plastics Manufacturers Quarterly Report; Plastics Europe: Brussels, Belgium, 2023; pp. 1–8. Available online: https://plasticseurope.org/knowledge-hub/quarterly-report-q1-2023/ (accessed on 12 January 2025).
- Woolven, J. This Article is Not About Plastic Pollution. Ellen MacArthur Foundation. 2021. Available online: https://www.ellenmacarthurfoundation.org/pt/artigos/este-nao-e-um-artigo-sobre-poluicao-por-plasticos (accessed on 12 January 2025).
- Morales-Caselles, C.; Viejo, J.; Martí, E.; González-Fernández, D.; Pragnell-Raasch, H.; González-Gordillo, J.I.; Montero, E.; Arroyo, G.M.; Hanke, G.; Salvo, V.S.; et al. An inshore–offshore sorting system revealed from global classification of ocean litter. Nat. Sustain. 2021, 4, 484–493. [Google Scholar] [CrossRef]
- Ocean Care. Plastic: Harmful Throughout Its Entire Life Cycle. 2022. Available online: https://www.oceancare.org/en/stories_and_news/plastic-harmful-throughout-its-entire-life-cycle/ (accessed on 12 January 2025).
- Laville, S.; Taylor, M. A Million Bottles a Minute: World’s Plastic Binge “as Dangerous as Climate Chang”. The Guardian. 2017. Available online: https://www.theguardian.com/environment/2017/jun/28/a-million-a-minute-worlds-plastic-bottle-binge-as-dangerous-as-climate-change (accessed on 12 January 2025).
- Rashwan, O.; Koroneos, Z.; Townsend, T.G.; Caputo, M.P.; Bylone, R.J.; Wodrig, B.; Cantor, K. Extrusion and characterization of recycled polyethylene terephthalate (rPET) filaments compounded with chain extender and impact modifiers for material-extrusion additive manufacturing. Sci. Rep. 2023, 13, 16041. [Google Scholar] [CrossRef] [PubMed]
- Shen, L.; Pu, X.; Sun, Y.; Chen, J. A study on thermoelectric technology application in net zero energy buildings. Energy 2016, 113, 9–24. [Google Scholar] [CrossRef]
- Sadhukhan, J. Net zero electricity systems in global economies by life cycle assessment (LCA) considering ecosystem, health, monetization, and soil CO2 sequestration impacts. Renew. Energy 2022, 184, 960–974. [Google Scholar] [CrossRef]
- Jones, M. PETG/PLA Recycling: How to Recycle 3D Printer Waste. All3DP. 2023. Available online: https://all3dp.com/2/3d-printer-recycled-plastic-tips-for-your-waste-plastic/ (accessed on 12 January 2025).
- Boyd, G.; Burr, E. 3D Printers & Recycled Plastic: Can They Print Recycled Plastic? All3DP. 2023. Available online: https://all3dp.com/2/3d-printers-recycled-plastic/ (accessed on 12 January 2025).
- Méndez, G.M.; Del Cerro Pérez, A.; Del Cerro Velázquez, F. Prototype Pultrusion of Recycled Polyethylene Terephthalate Plastic Bottles into Filament for 3D Eco-Printing: Education for a Sustainable Development Project. Sustainability 2024, 16, 8347. [Google Scholar] [CrossRef]
- Yauri, R.; Bermeo, H.; León, A.; Llerena, O. Processing System for Plastic Bottle to Obtain Polyethylene Terephthalate Filament in 3D Printers. WSEAS Trans. Syst. Control. 2024, 19, 1–9. [Google Scholar] [CrossRef]
- Tylman, I.; Dzierżek, K. Filament for a 3D Printer from Pet Bottles- Simple Machine. Int. J. Mech. Eng. Robot. Res. 2020, 9, 1386–1392. [Google Scholar] [CrossRef]
- Bearing PET Bottle Cutter Using 8 × 22 × 7 mm Roller Skate Bearings. By Jattie|Download Free STL Model|Printables.com. Available online: https://www.printables.com/model/685409-bearing-pet-bottle-cutter-using-8x22x7mm-roller-sk (accessed on 12 January 2025).
- Compact PET Filament Machine by Mirabatek|Download Free STL Model|Printables.com. Available online: https://www.printables.com/model/460950-compact-pet-filament-machine (accessed on 12 January 2025).
- Kong, Y.; Hay, J. Multiple melting behaviour of poly(ethylene terephthalate). Polymer 2003, 44, 623–633. [Google Scholar] [CrossRef]
- Forward. Ultrafuse® rPET. 2024. Available online: https://forward-am.com/material-portfolio/ultrafuse-filaments-for-fused-filaments-fabrication-fff/standard-filaments/ultrafuse-rpet/ (accessed on 12 January 2025).
- Woern, A.L.; McCaslin, J.R.; Pringle, A.M.; Pearce, J.M. RepRapable Recyclebot: Open source 3-D printable extruder for converting plastic to 3-D printing filament. HardwareX 2018, 4, e00026. [Google Scholar] [CrossRef]
- Form Futura. ReForm—rPET. 2024. Available online: https://formfutura.com/product/reform-rpet/ (accessed on 12 January 2025).
- ISO 527-2; Plastics—Determination of Tensile Properties—Part 2: Test Conditions for Moulding and Extrusion Plastics. International Organization for Standardization: Geneva, Switzerland, 2012.
- ASTM D638; Standard Test Method for Tensile Properties of Plastics. ASTM International: West Conshohocken, PA, USA, 2020.
- Lang, L.; Antunes, R.; Dutra, T.A.; Aguiar, M.L.; Pereira, N.; Gaspar, P.D. Gaspar Mechanical Characterization and Performance Analysis of TPU 60A for Soft Robotic Grippers: Experimental Testing and Computational Simulation. Materials 2025, 18, 240. [Google Scholar] [CrossRef]


Disclaimer/Publisher’s Note: The statements, opinions and data contained in all publications are solely those of the individual author(s) and contributor(s) and not of MDPI and/or the editor(s). MDPI and/or the editor(s) disclaim responsibility for any injury to people or property resulting from any ideas, methods, instructions or products referred to in the content. |
© 2025 by the authors. Licensee MDPI, Basel, Switzerland. This article is an open access article distributed under the terms and conditions of the Creative Commons Attribution (CC BY) license (https://creativecommons.org/licenses/by/4.0/).