Article

Prediction of Wear Rate by a New Direct Method Using the Friction Coefficient Curve

1
Metal Processing Platform, TECNALIA, Basque Research and Technology Alliance (BRTA), E48160 Derio, Spain
2
Faculty of Engineering of Bilbao (UPV/EHU), University of the Basque Country (UPV/EHU), E48013 Bilbao, Spain
*
Author to whom correspondence should be addressed.
J. Manuf. Mater. Process. 2025, 9(1), 6; https://doi.org/10.3390/jmmp9010006
Submission received: 13 November 2024 / Revised: 20 December 2024 / Accepted: 26 December 2024 / Published: 28 December 2024

Abstract

:
This work aims to introduce a new method to predict the wear rate accurately and quickly. Using techniques such as laser scanning confocal microscopy can take a long time to estimate the wear of the experimental alloys in situ. Developing a new method based on calculating the area under the early stages of the friction curve can be a useful and quick tool for estimating wear rate values and comparing wear between different alloys and conditions. The results validated the application of this new method with a regression coefficient of 0.98. This work also demonstrates that wear in the early stages accounts for the highest wear, indicating that the friction coefficient in the steady-state is not always a reliable indicator of the total wear rate. Hardness can be a more influencing parameter on wear rate than steady-state friction coefficient. Using the new method can help reduce time and predict wear more accurately of different alloys.

1. Introduction

Determining the tribological properties of engineering materials is crucial for identifying their optimal applications. Tribology studies include wear, friction, and lubrication of interacting surfaces in relative motion [1]. Wear refers to the gradual removal of material from a solid surface and/or deformation, resulting in observable changes to the surface geometry [2]. Wear reduces operational efficiency by causing loss of equipment power, increasing lubricant oil consumption, and necessitating component replacements to maintain product quality [3]. In the automotive sector, mechanical components such as brakes, clutches, piston rings, and rotors are typically related to frictional wear [4]. These phenomena can be caused by various mechanisms such as abrasion, adhesion, fatigue, or tribochemical reactions [5,6]. A comprehensive examination of wear behavior involves evaluating the friction coefficient, wear rate, and worn morphologies and analyzing the mechanical properties and microstructure [7].
The coefficient of friction (COF) is used to analyze the friction properties. The COF is a dimensionless ratio of two forces, calculated using the formula: µ = Ff/FN, where µ is the coefficient of friction, Ff is the force of friction, which is the tangential force that opposes relative motion when one body slides over another, and FN is the applied normal load, which is the force pressing the two surfaces together [8]. The COF testing involves applying a known load to two materials and measuring the force required to initiate or maintain motion.
On the other hand, the wear rate is measured by the coefficient of specific wear rate (K), which is used to evaluate the wear resistance of a surface [9].
The reduction in COF during the running-in phase is mainly attributed to the boundary layer and surface smoothing from mechanical wear [10]. Also, it has been observed that steady-state friction is reached in both the mixed elasto-hydrodynamic and boundary lubrication regions. In particular, the boundary lubrication region is characterized by relatively high friction coefficients and wear rates. In this region, large wear particles are generated due to delamination of the contacting surfaces [11].
Other studies [12] have investigated the effects of a variable COF, finding that total wear volume (K) at the steady-state stage showed little difference between constant and variable COF models. A variable COF model is more accurate for precise predictions under specific conditions as it accounts for factors like tribofilm formation and debris accumulation. However, a constant COF model is often sufficient for total wear over complete cycles without significant errors. In [13], the wear model developed confirmed that variable COF improves accuracy in partial sliding scenarios, though differences diminish under full slip conditions.
COF is an important parameter to evaluate the wear resistance of the materials [13,14]. The most effective way to prevent unnecessary wear is usually by ensuring a low friction coefficient between their surfaces [15].
In aluminum alloys, friction, and wear rates generally increase with load due to greater contact and deformation. This leads to higher wear of the material. However, within specific load ranges, a tribolayer may temporarily reduce friction until it breaks down under higher loads, causing both friction and wear to rise again [16,17]. However, some metals can experience an inverse correlation between the coefficient of friction and wear rate, where higher friction leads to lower wear. This was the case for the aluminum alloy processed by ECAP, with wear reduction due to material hardening but an increase in COF due to delamination transitioning to an abrasive mechanism resulting in more direct contact and higher friction [18].
In general, it is not easy to correlate the COF with the wear rate, even by applying mathematical analysis [19]. Machine learning techniques are also being studied to predict wear rate, although they are rarely reported focusing on aluminum alloys [19,20,21].
Related to mechanical properties, hardness influences the friction and wear rate properties. The classical Archard theory [22] proposes that wear is inversely proportional to hardness [23]. Some works have confirmed that wear rate decreases with hardness [24], while COF is lower in harder metals [25], as in some high-entropy aluminum alloys [26].
Other works have demonstrated that the COF in AlCu alloys was constant with hardness [27], and this is because there does not always have to be a correlation between the mechanical properties and the specific wear rate [28]. Although hardness may have a small influence on the wear rate, other parameters have a greater impact, influencing the evolution of the different wear mechanisms. In certain studies on aluminum alloys, a strong correlation between abrasive wear and hardness has been observed for coarse grains. However, this correlation does not hold for finer grain sizes [29]. Also, attempts to correlate density with wear have been made [30]. It is noted that, up to this point, the wear rate cannot be directly determined from the friction curve [31]; instead, it is determined after completing the friction or tribological tests [32].
There are numerous tribological tests [33]. Process tests involve applying typical machining operations without altering the fundamental process kinematics, and simulative tests utilize laboratory apparatus based on various testing standards [34].
One of the most common methods is the pin-on-disc method [35]. A stationary pin is pressed against a rotating disk at a set distance from the disk center, with a specified load applied to the pin. The disk is driven by a servo motor at a defined rotational speed (rpm) [36]. The operational principles of the pin-on-disk (POD) and ball-on-disk (BOD) configurations are quite similar. While in POD cylindrical ends are used, in a BOD a spherical cap end, or ball, is substituted. Aluminum alloy bearings are particularly used for wear applications because of their lightweight, low cost, and high resistance to corrosive agents in lubricants [37,38]. POD and BOD tests have been applied to cast aluminum alloys [39,40,41,42,43,44]. In [45,46], the COF was determined through four distinct stages on the friction curve.
At room temperature, COF for aluminum alloys is usually characterized by a first stage, stage 0, or previous stage, where the COF remains with low values and is stable, related to the settling of the materials and some surface abrasion by asperities [47]. Then, the values increase with the distance run as a consequence of the conversion from static friction (when the acting force is sufficiently small and is characterized by the phase of detachment and moving begins [48]) to dynamic friction (when frictional force is created between any two surfaces that are in a moving position at a stable velocity [49]). Subsequently, the values reach a maximum, related to the maximum adhesion, with the deformation of the asperities and an increase in the number of residual particles that increase the wear rate. Because of deformed and fragmented asperities, the abrasion also increases [50]. When a sharp increase in the COF is observed during the initial stages, it is due to the wear of the oxide layer on the test material and the accumulation of hard oxide debris [51]. In stage 2, the values decrease gradually, corresponding to the transition period. This reduction has been attributed to the combined effect of the adsorbed boundary layer (typically formed by trapped particles, lubricant, or debris generated during sliding) and the smoothing of surface irregularities [10]. Finally, the steady-state [52] is reached in stage 3, in which the presence of debris from the worn surface decreases. In cases of fluctuations, localized fracture of the surface layer in addition to accumulation and elimination of debris are presented [53].
From the friction curve, the determination of the equilibrium friction coefficient during the steady state, or stage 3, after running in the period [54] has been reported [55,56].
Once BOD tests are completed, several methods can be used to measure worn area or volume; however, they present limitations in terms of scalability, efficiency, or the ability to measure complex wear geometries with full accuracy [57,58,59,60,61]. Gravimetric methods require high-precision balances to detect small changes in mass [57]. Lineal dimensional change methods are suitable for components with well-defined and accessible wear surfaces; they are not suitable for low wear rates and are more sensitive to errors. Profilometry can scan a sample’s surface using either a contact or non-contact sensor, producing a 3D profile. However, it may not be able to resolve features at the micrometer or nanometer scale with high accuracy [58]. A laser confocal microscope is probably the most accurate option, providing a balanced solution [59] and delivering high-resolution imaging across various surface types without environmental sensitivity or area limitations. However, they tend to be more expensive, require more specialized equipment, and can be slower [60].
White Light Interferometry employs white light interference to measure the surface topography with high precision. It requires a controlled environment to minimize the effects of external light interference. Additionally, it is less effective for analyzing rough or highly uneven surfaces [61]. Atomic Force Microscopy uses a fine probe to scan the sample’s surface at the nanoscale, making it highly effective for detecting small variations in topography due to wear. However, it is more suitable for smooth surfaces and can be time-consuming when scanning large areas [62]. These limitations suggest that these methods still face challenges in terms of scalability, efficiency, and the ability to measure complex wear geometries with full accuracy.
Some works have determined parameters, such as the wear index by simulation, but they cannot define the real wear rate of some determined systems [63].
In this study, the prediction of the wear rate is developed by measuring the area under the friction coefficient curve. This method can be useful for comparing the wear rate of materials without the need to apply complementary techniques. Thus, production costs and man-hours could be saved with automation, offering the potential for more efficient and reliable wear rate estimation.
Two different cast aluminum alloys produced by High-Pressure Die Casting (HPDC) have been studied, including a new multi-component alloy [64]. HPDC makes it essential in modern automotive manufacturing, especially for developing more sustainable and energy-efficient vehicle designs [65]. High Entropy Alloys (HEA) have been demonstrated to have excellent physical and mechanical properties, in contrast to single-phase alloys [66].

2. Materials and Methods

Test samples were manufactured by HPDC. The first was based on a new multi-component alloy within the Al80Mg10Si5Cu5 system. The second alloy, based on the commercial casting AlSi9Cu3 according to EN 1706:2020 standard [67], is the most used in HPDC, selected here for comparative purposes. Their relevance and applications have been explored in previous studies [65]. The chemical composition is collected in the following Table 1.
Remarkably, the HPDC process produces a surface layer with a finer microstructure and is nearly defect-free, leading to enhanced mechanical properties [68]. To evaluate the effect of the surface layer on the friction coefficient curve, tribological tests were applied in the two different areas, analyzing samples with the surface layer and samples without the surface layer with the ASTM G99-17 standard [67,69]. Al80Mg10Si5Cu5 alloy test samples were also subjected to a specified heat treatment, involving a solution process at 440 °C for 72 h, followed by water quenching at 75 °C, and natural aging.
In total, 6 samples were investigated: as-cast Al80Mg10Si5Cu5 with surface layer, as-cast Al80Mg10Si5Cu5 without layer, thermal-treated (HT) Al80Mg10Si5Cu5 with surface layer, HT-Al80Mg10Si5Cu5 without layer, as-cast AlSi9Cu3 with layer, and as-cast AlSi9Cu3 without layer.
A BOD tribometer study was performed at room temperature (RT) according to the ASTM G99-05 standard, operating without lubrication. The BOD parameters are presented in Table 2. These parameters were selected to compare the wear rate of the Al80Mg10Si5Cu5 with the bibliographic values of the AlSi9Cu3 alloy [70]. Considering the effect of load, sliding speed, and sliding distance [16,17], these parameters were kept constant across all the tests to ensure comparability of the results.
The samples were extracted from plate-shaped casting parts and subsequently machined to produce test coupons with approximate dimensions of 50 mm in length, 50 mm in width, and 5 mm in thickness. Samples without the surface layer were polished using 3 µm diamond particles, achieving a roughness value below the maximum recommended by the Standard Test Method. The roughness of all samples was measured with a portable device (Rugosurf, TESA), taking at least 10 measurements per sample. The experimental samples with the surface layer exhibited a roughness value <1.0 µm, whereas samples without the surface layer had values below 0.1 µm. As a counterface, alumina balls were selected because they do not promote the formation of an MML [71]. Therefore, determining the effect of wear properties on the aluminum alloys is easier and more reliable. The alumina balls had a diameter of 6 mm and a hardness of 1250–1700 HV. Each combination was run three times. The data acquisition and control of COF during the test was conducted through the MT 4002 V12.0 (MT 4002, Microtest S.A.) software connected to the tribometer, as shown in Figure 1.
Once BOD tests were finished, measurements of the wear depth and width were taken with a 3D confocal laser scanning microscope (DCM 3D, Leica). The wear rate (k) was calculated using the Equation (1) [72]:
K = V w e a r L D
where Vwear is the wear volume in mm3, L is the normal load in Newton, and D is the total sliding distance in meters.
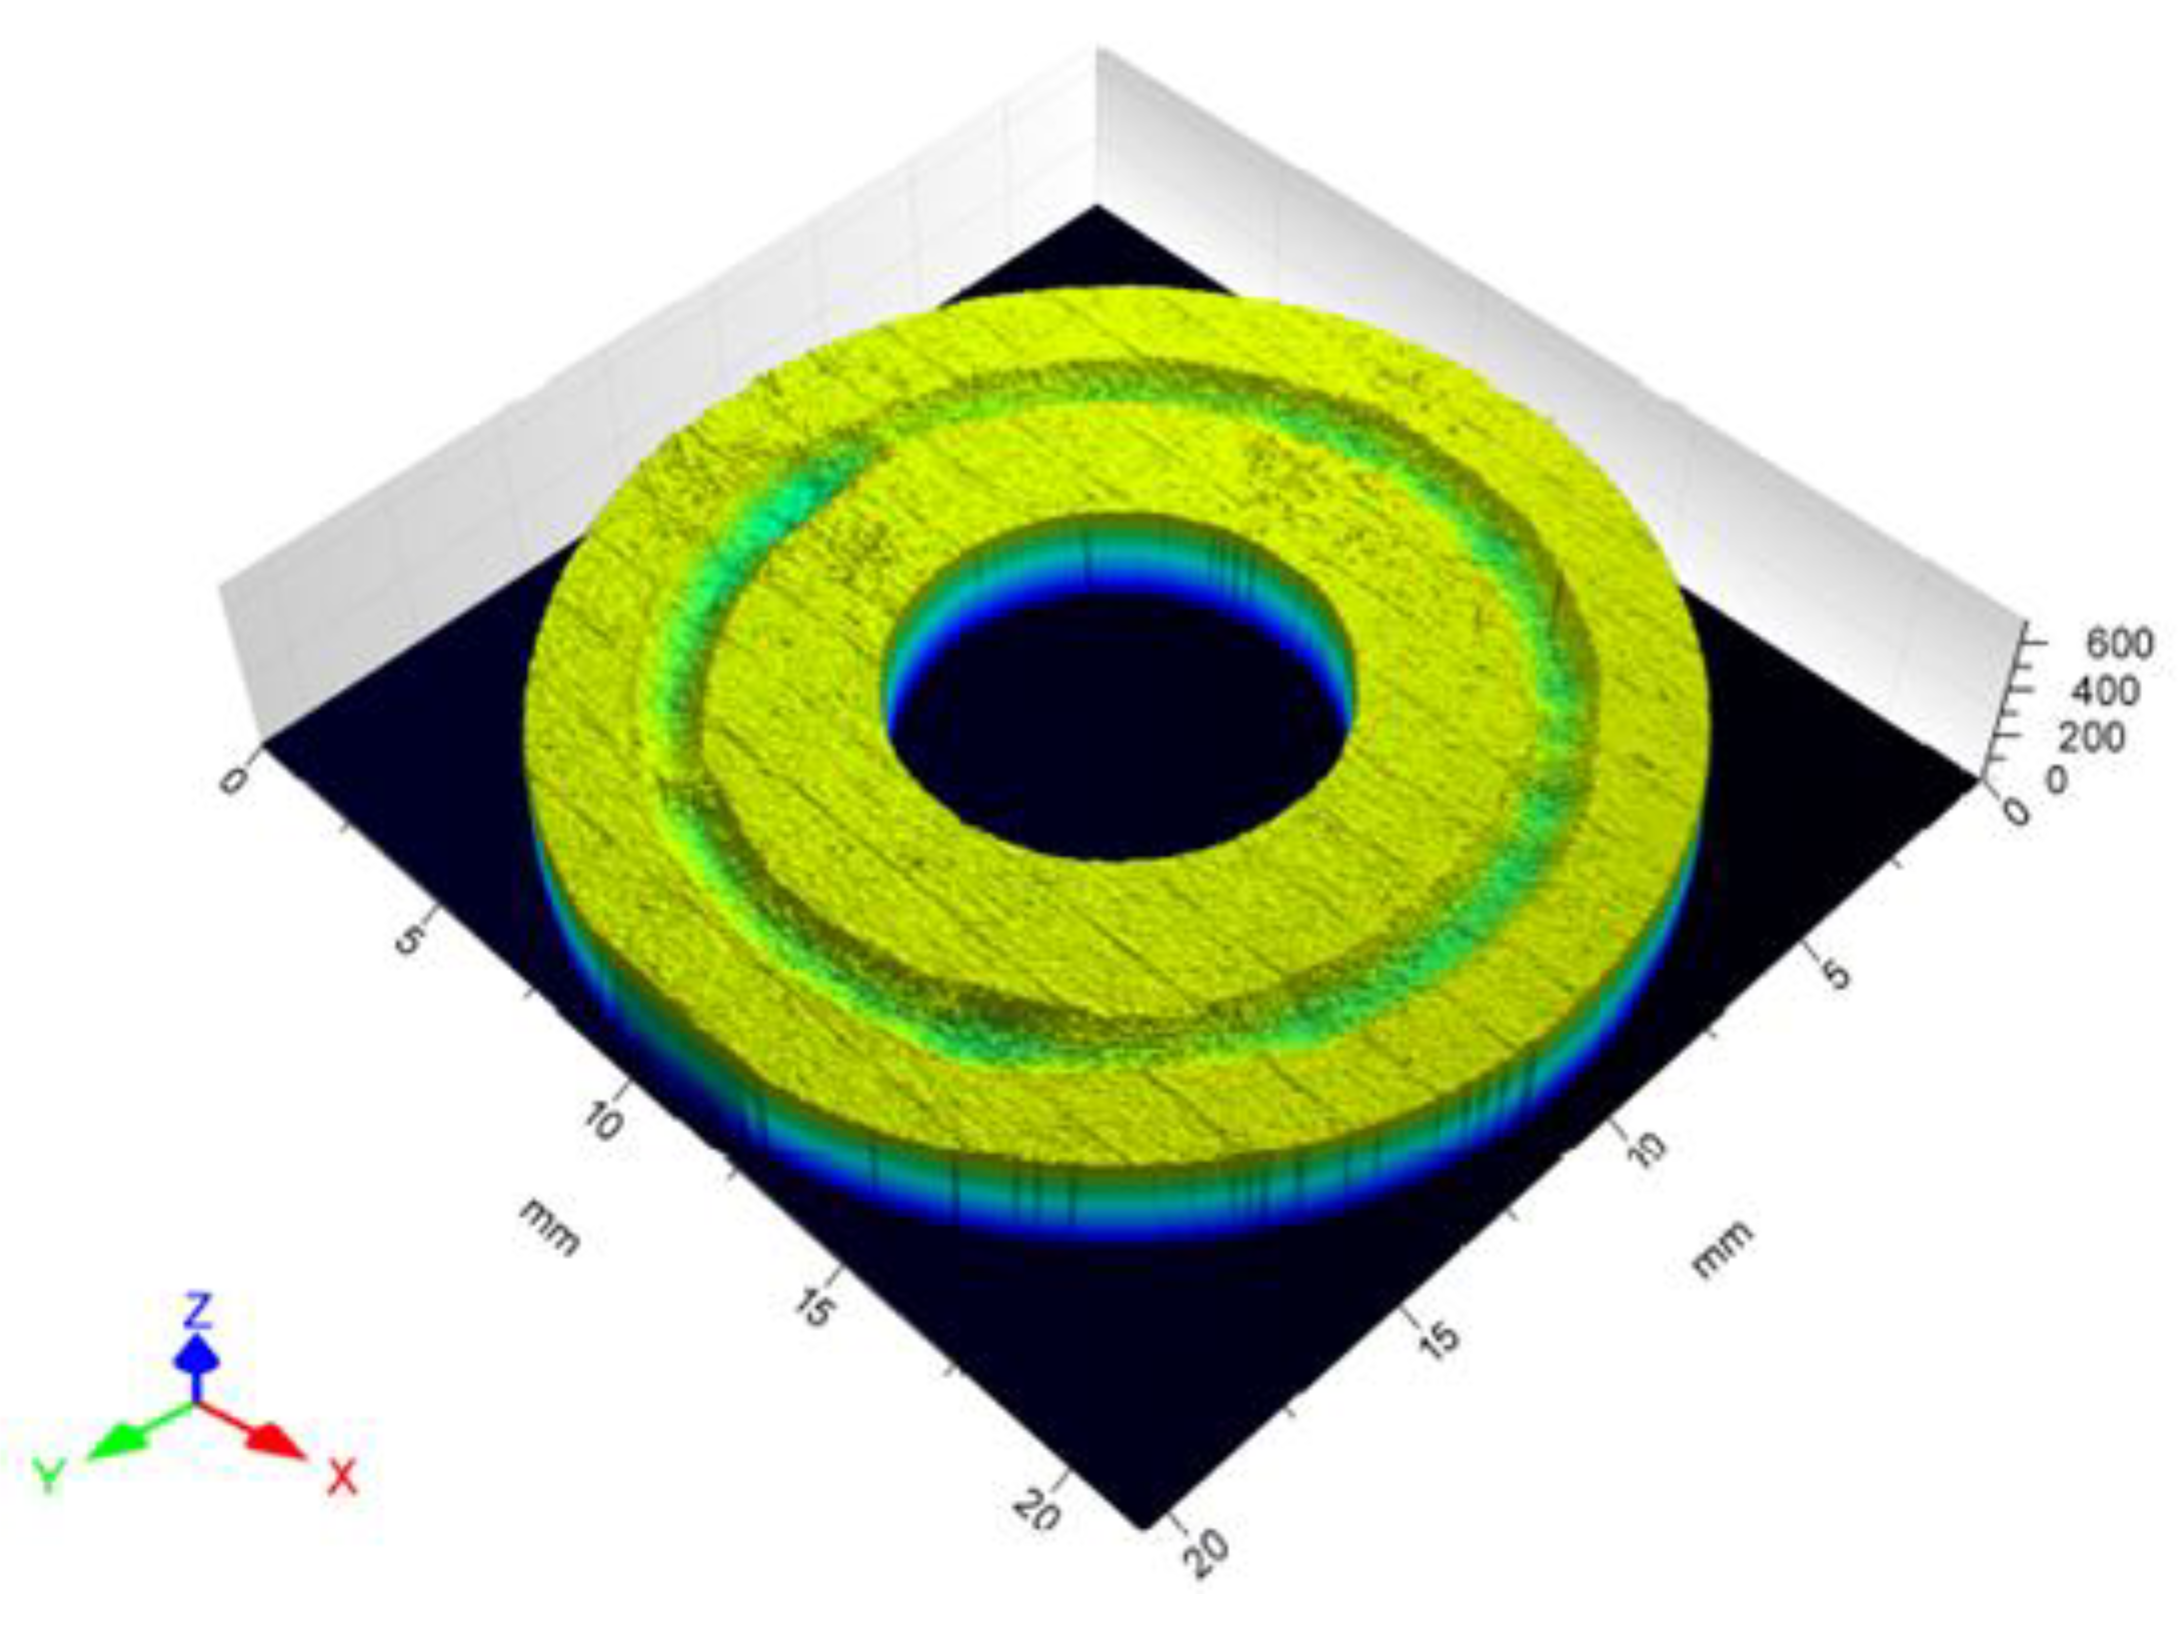
Figure 2 shows a surface topography image obtained of the wear track. For each sample, at least 16 3D profiles were measured using Leica Map software version 3.2 with DCM 3D support. Then, the total loss volume was calculated, and wear coefficients were obtained in mm3/N.m.
Finally, the wear coefficient was correlated with the values obtained from the areas measured under the friction curves using the new method.

3. Results

3.1. Hardness

Vickers hardness values were obtained by taking 10 measurements from the surface layer to the inner structure of each sample. The hardness values (mean and deviations) for each sample, or alloy in its different conditions, are provided in Table 3.
The Al80Mg10Si5Cu5 alloy exhibited higher hardness values than the AlSi9Cu3 alloy. The presence of the surface layer slightly increased the hardness, with improvements between 5% and 10% for the as-cast and HT-Al80Mg10Si5Cu5 alloys and around 10% for the AlSi9Cu3 alloys. Heat treatment of the Al80Mg10Si5Cu5 alloy reduced its hardness by approximately 15% compared to the as-cast condition. The AlSi9Cu3 alloy without the surface layer exhibited the lowest hardness values, approximately 30% lower than those of the as-cast Al80Mg10Si5Cu5 alloy. The higher hardness values for samples with the surface layer follow the literature [73]. Figure 3 shows the microstructure of the Al80Mg10Si5Cu5 alloy produced by HPDC, highlighting distinct differences between the surface layer and the interior. The surface layer exhibited much smaller intermetallic primary Mg2Si phases and a smaller amount of eutectic Mg2Si, resulting in a noticeably finer structure. Additionally, gas porosity was identified, especially in the interior.

3.2. Friction Coefficient Curves

The friction curves of the experimental alloys are shown below. To reduce the noise, friction curves were smoothed. For smoothing the data, a moving average trend line was applied by grouping 30 points, allowing for the calculation of representative values with reduced noise.
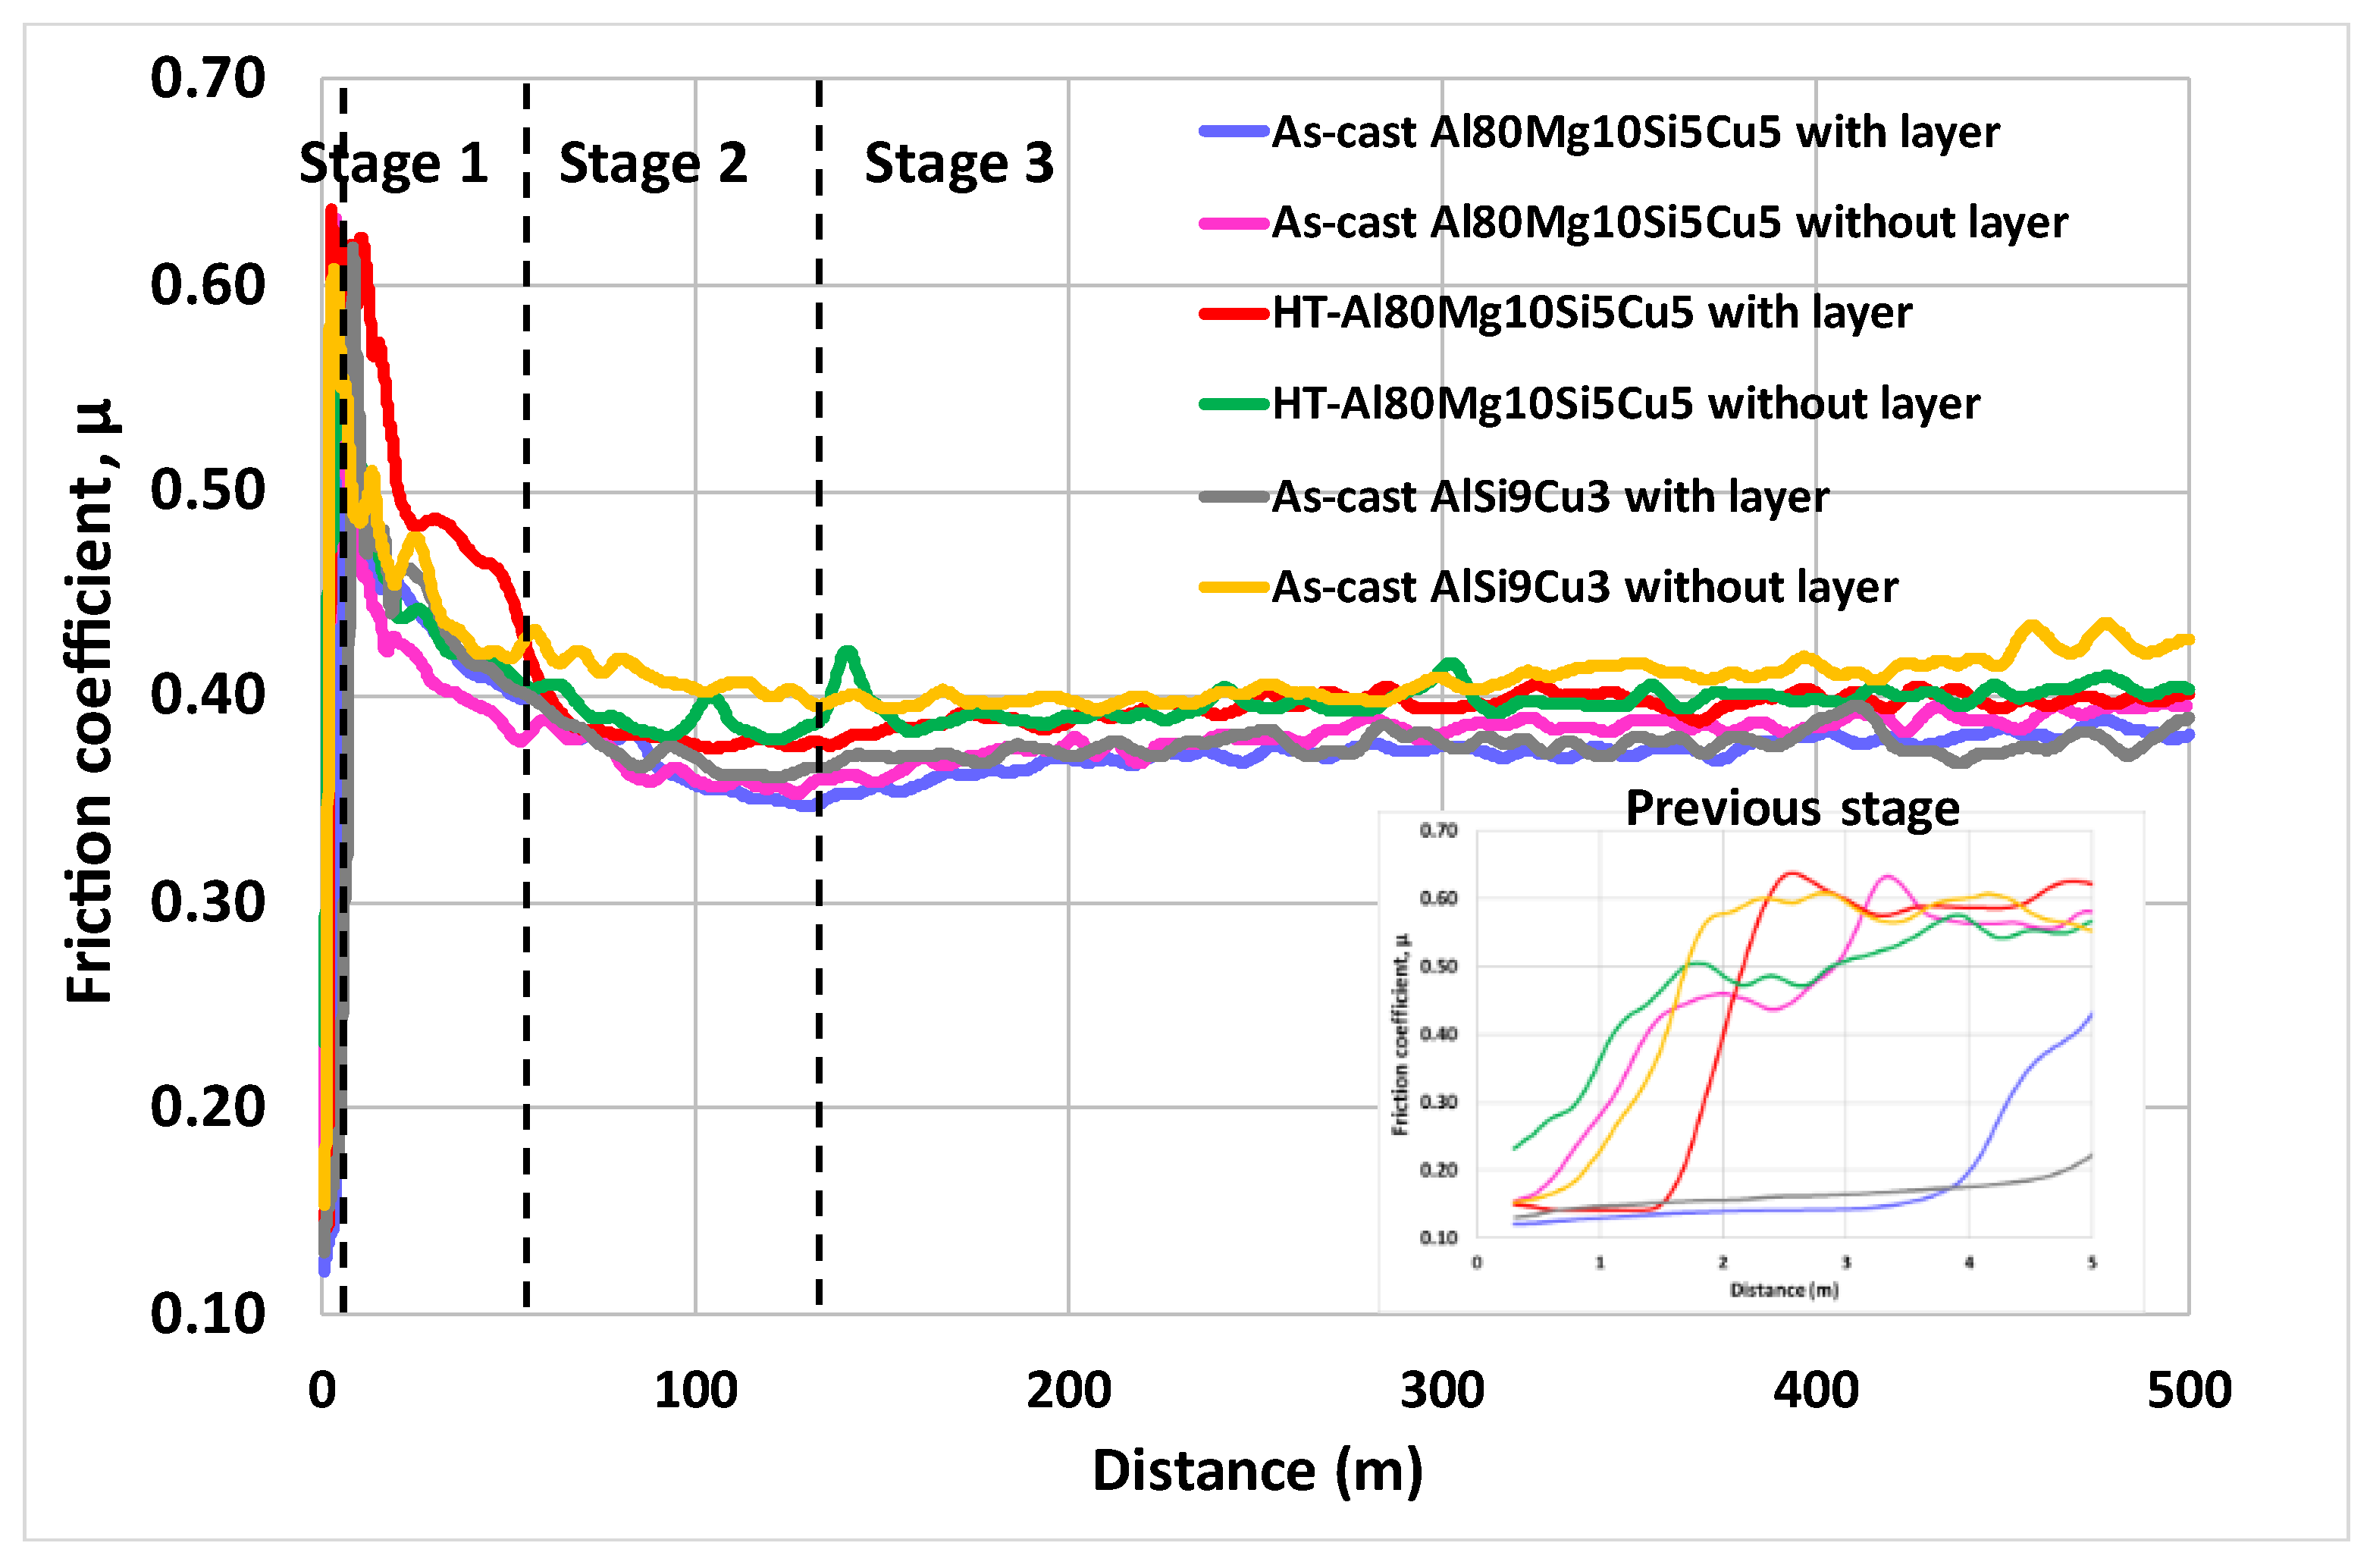
In Figure 4, the general friction curves are shown as a function of distance for the experimental alloys. The shape of the friction curve may suggest qualitatively the main wear mechanism [74]. In this case, being abrasion.
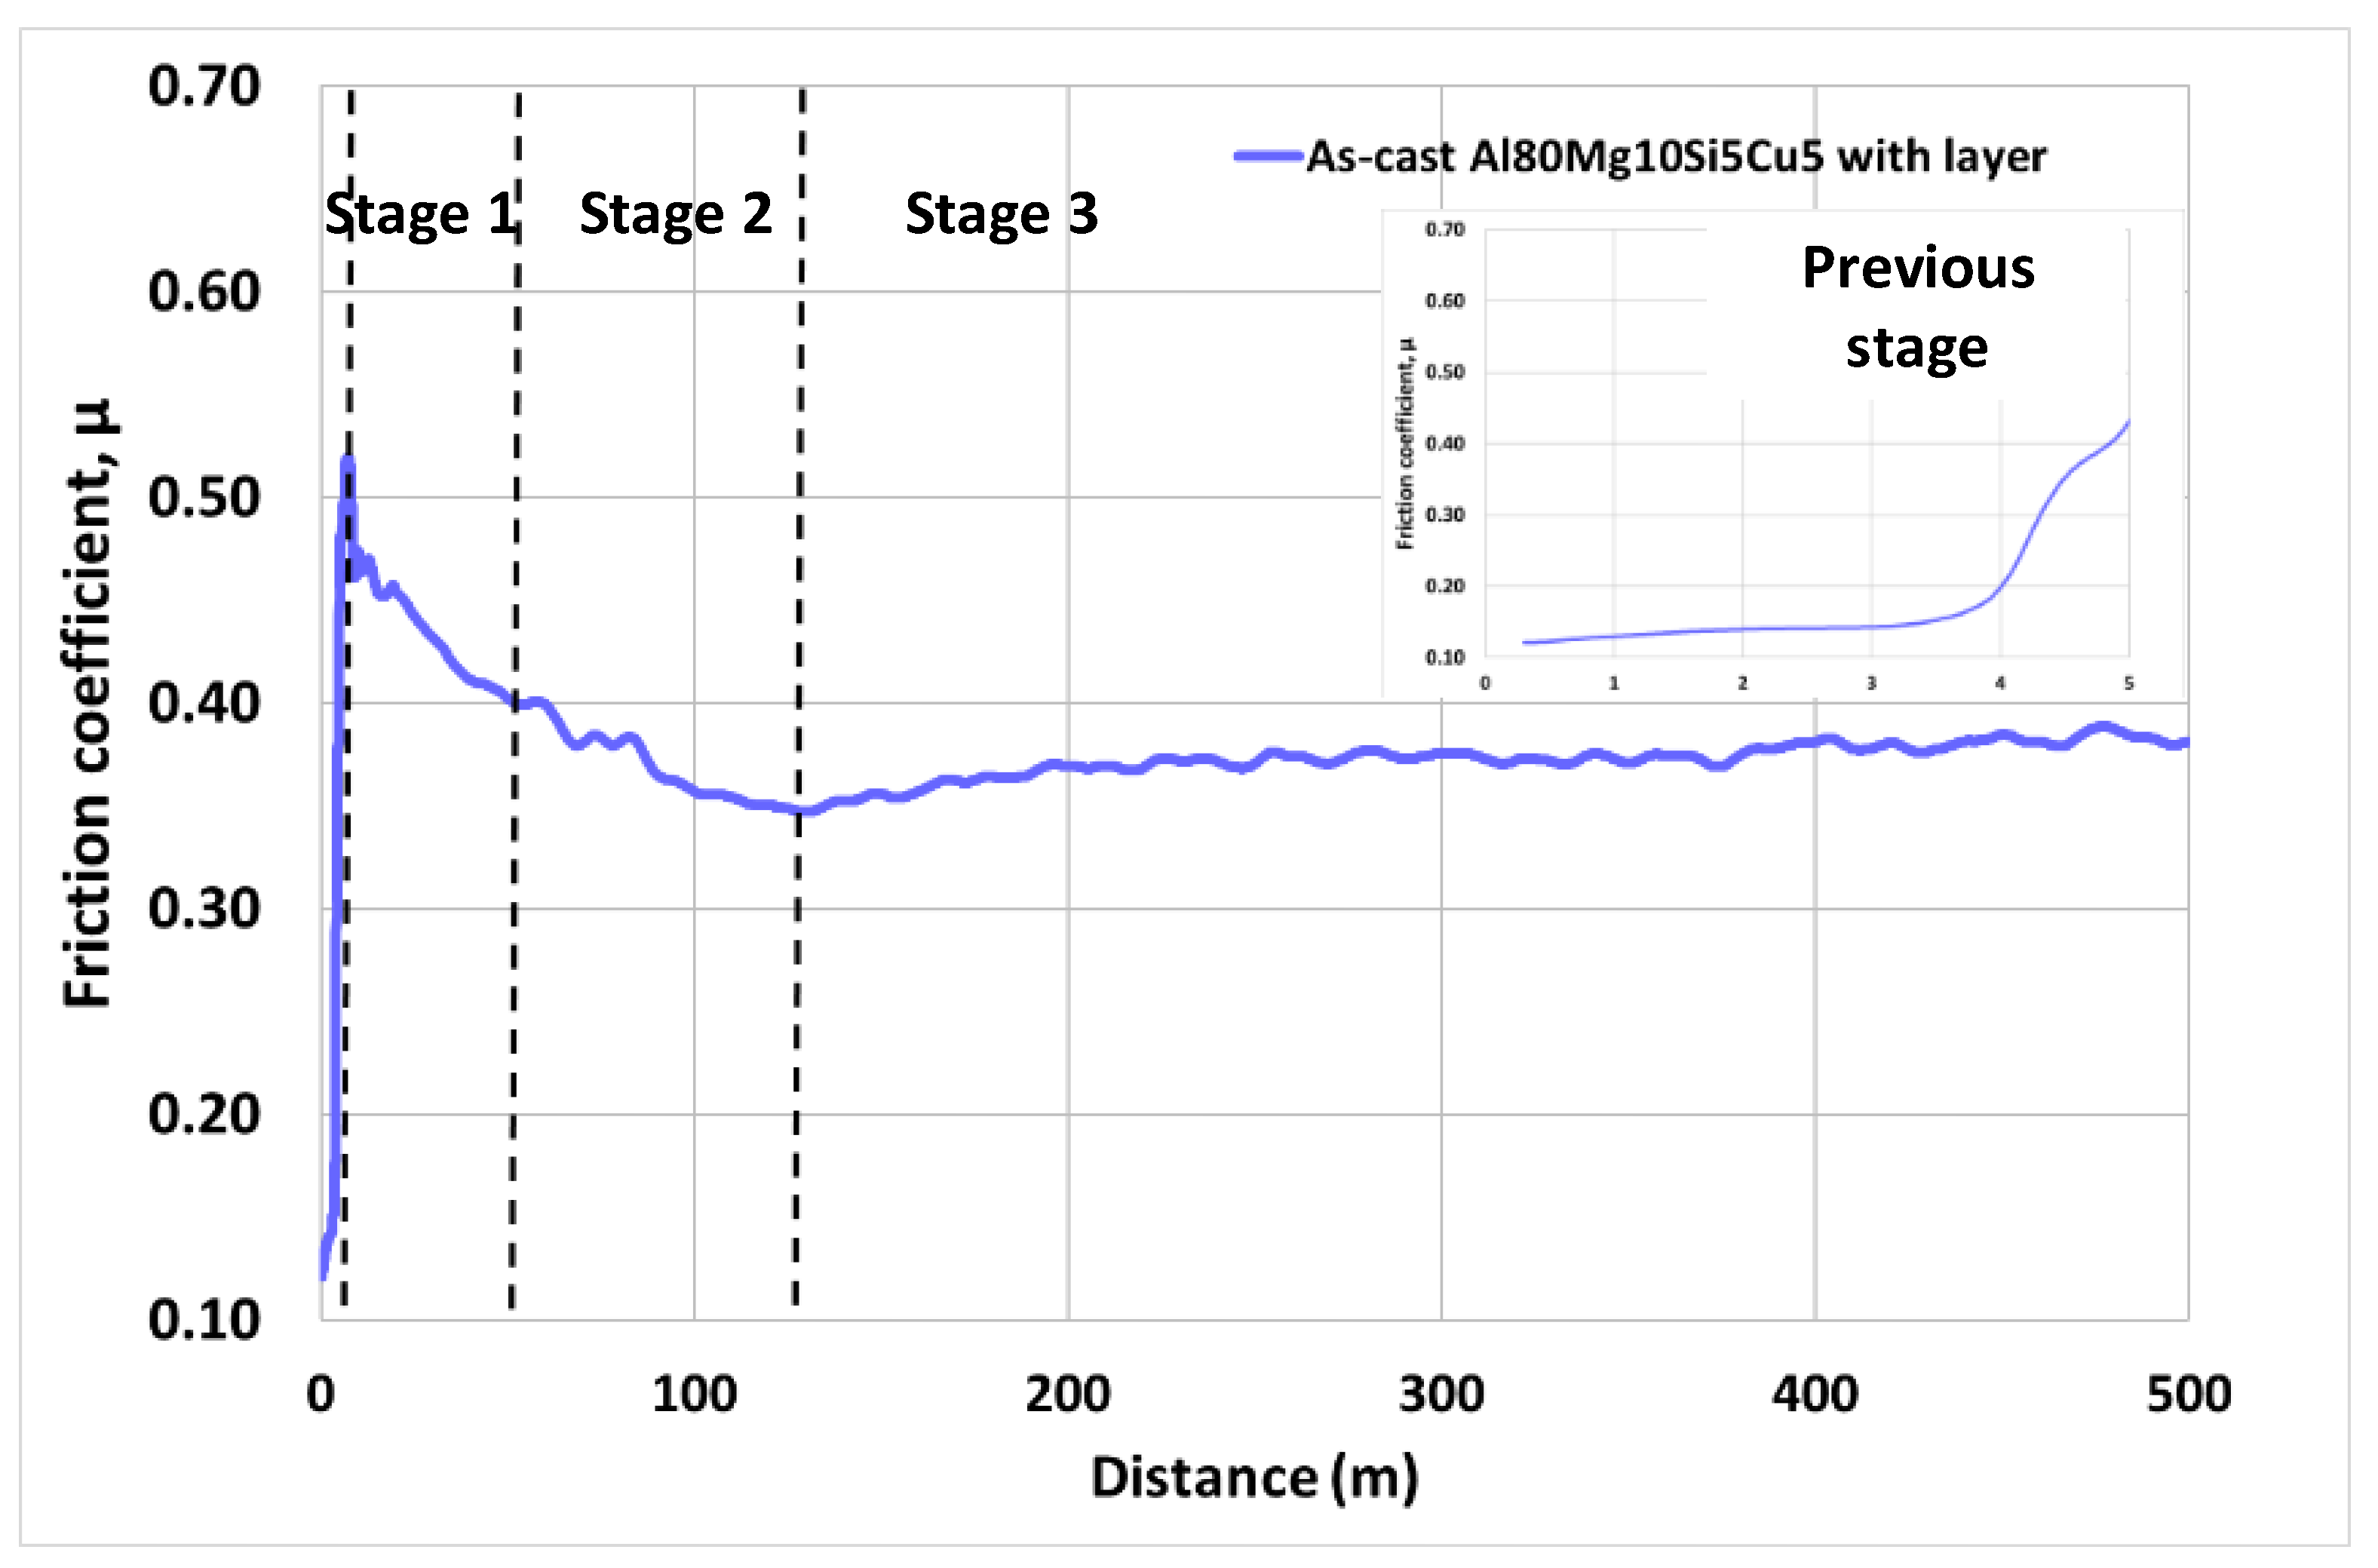
Figure 5 shows the different stages estimated based on friction data [46,47] for the as-cast Al80Mg10Si5Cu5 alloy with a surface layer. These studies have identified three or four stages in the friction curve for aluminum alloys. However, accurately determining the duration of each stage is complicated due to measurement oscillations, noise in the friction curve, and the various mechanisms involved in each stage. To date, these stages are not directly determined experimentally but are estimated based on microscopic observations and trends in friction data. Some studies use Matlab software to reduce the noise in the friction curve and establish estimated limits for the stages [75].
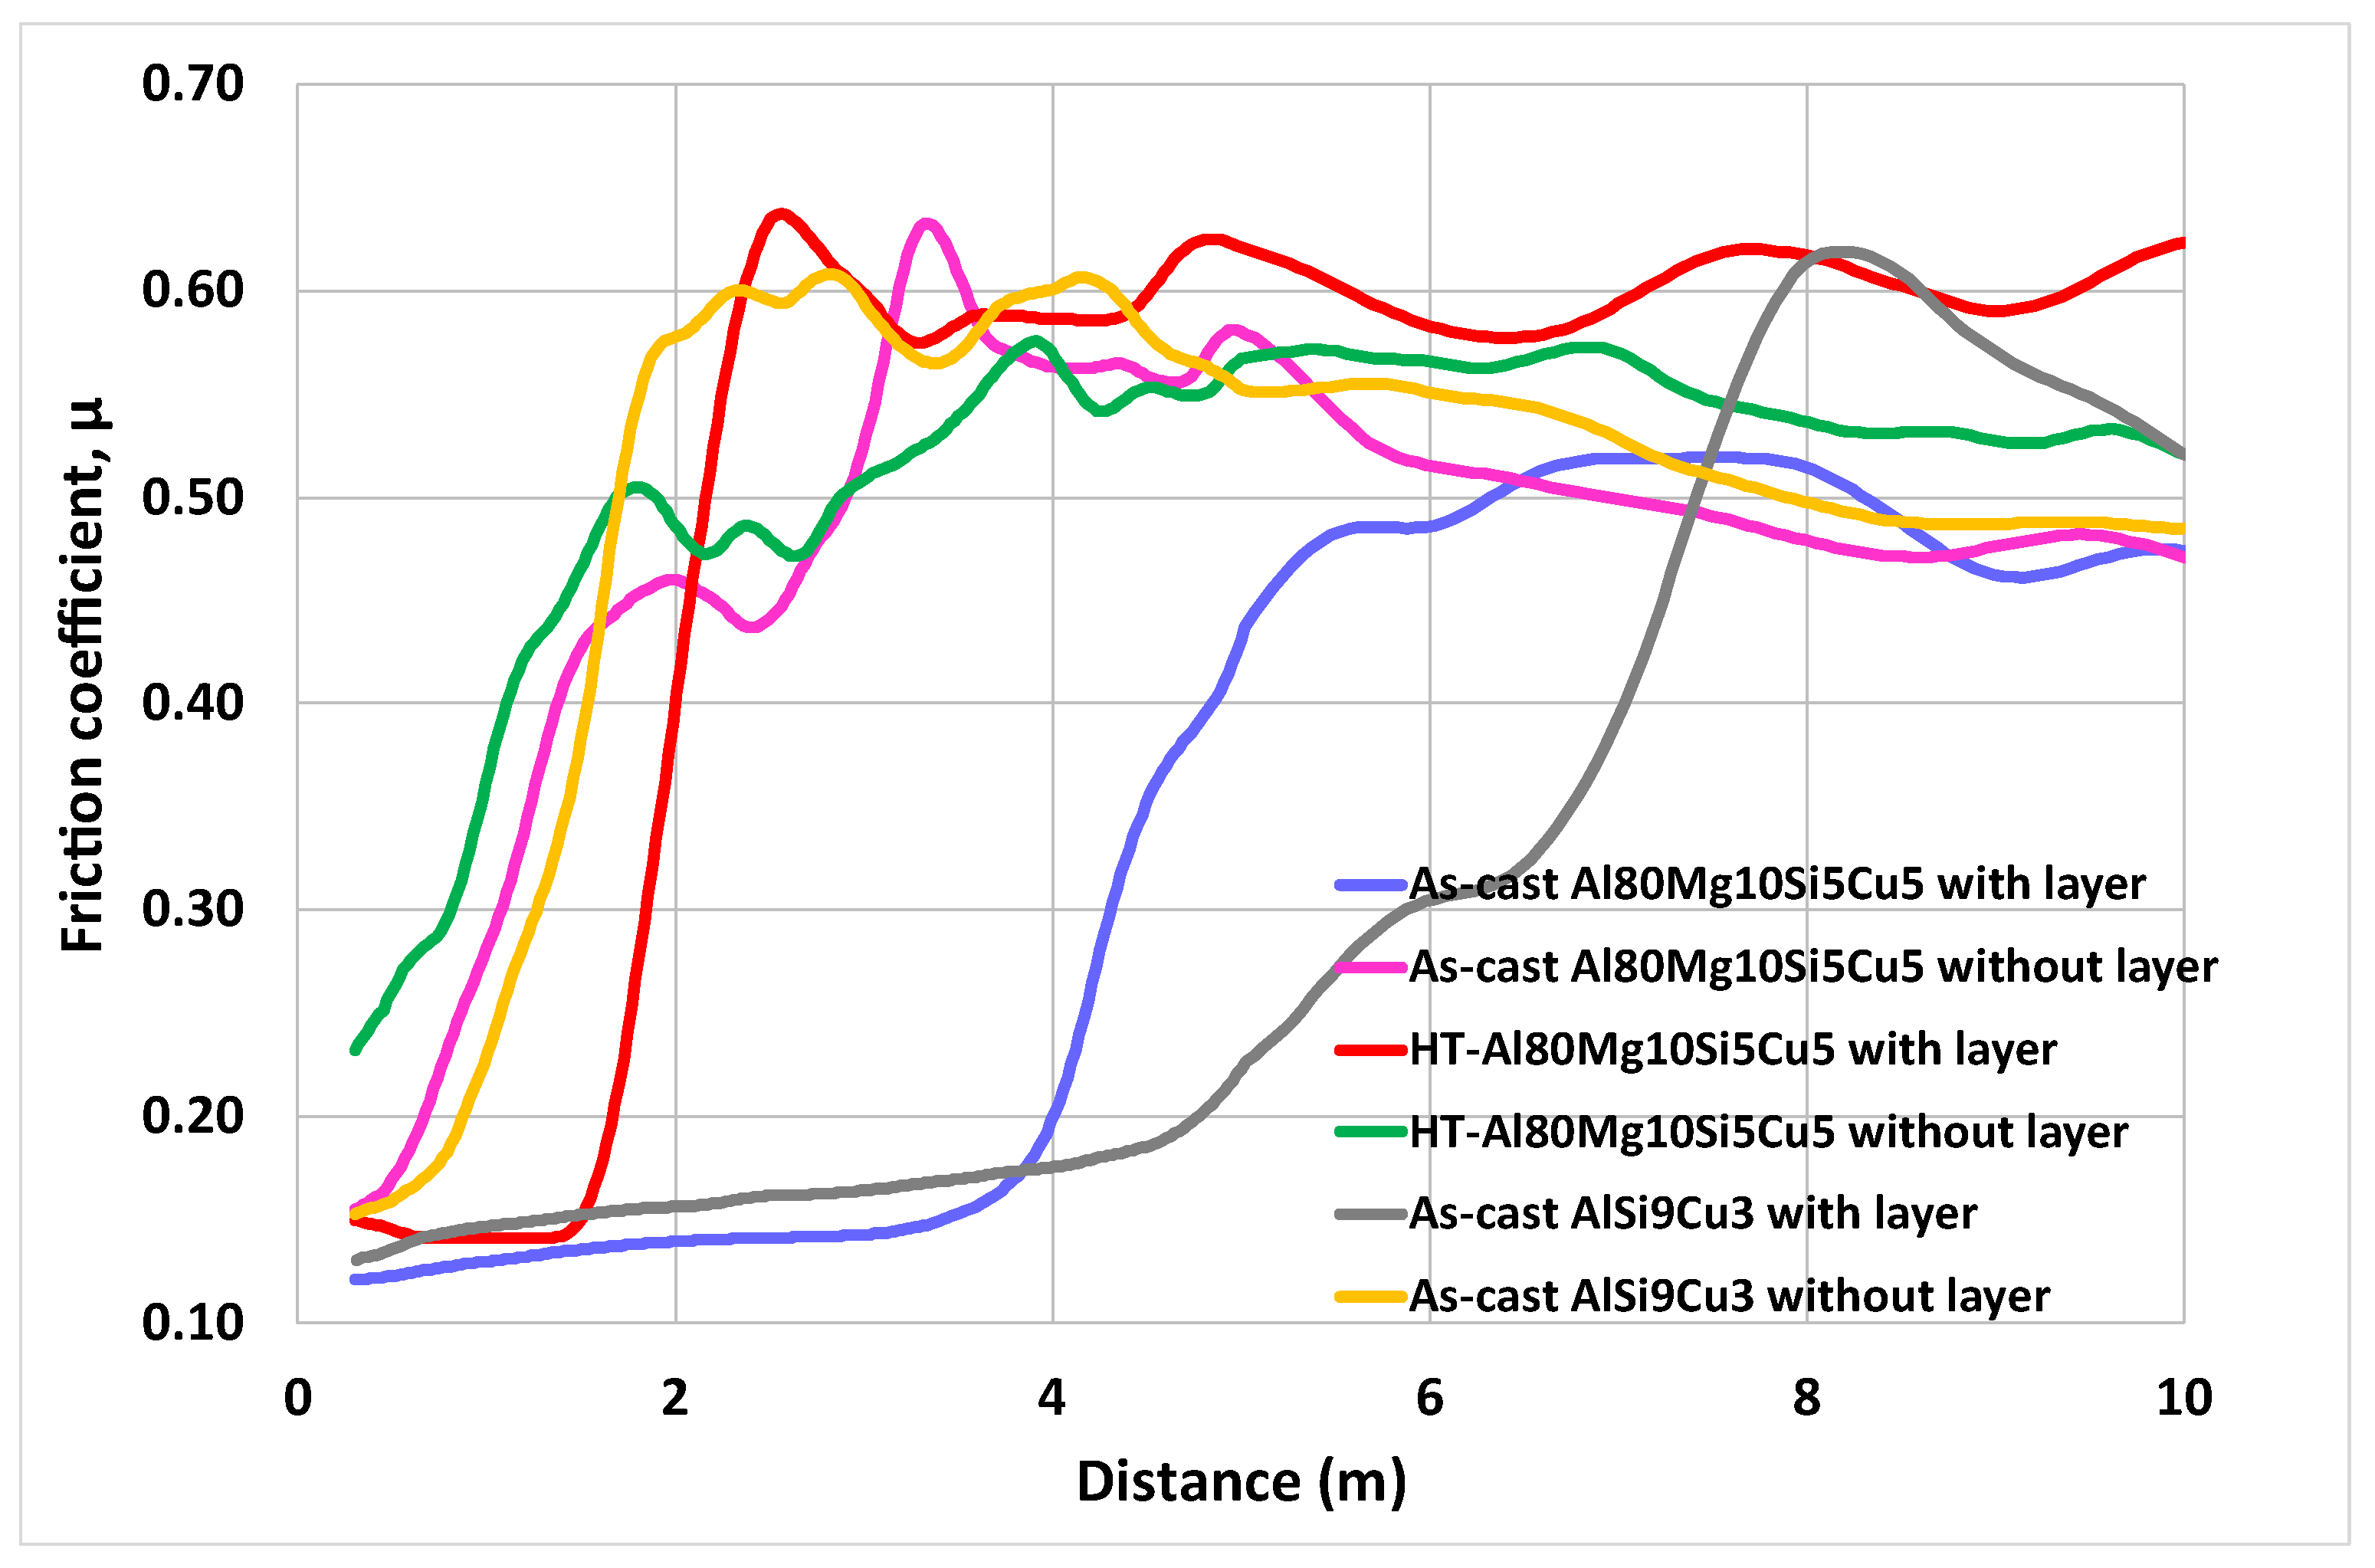
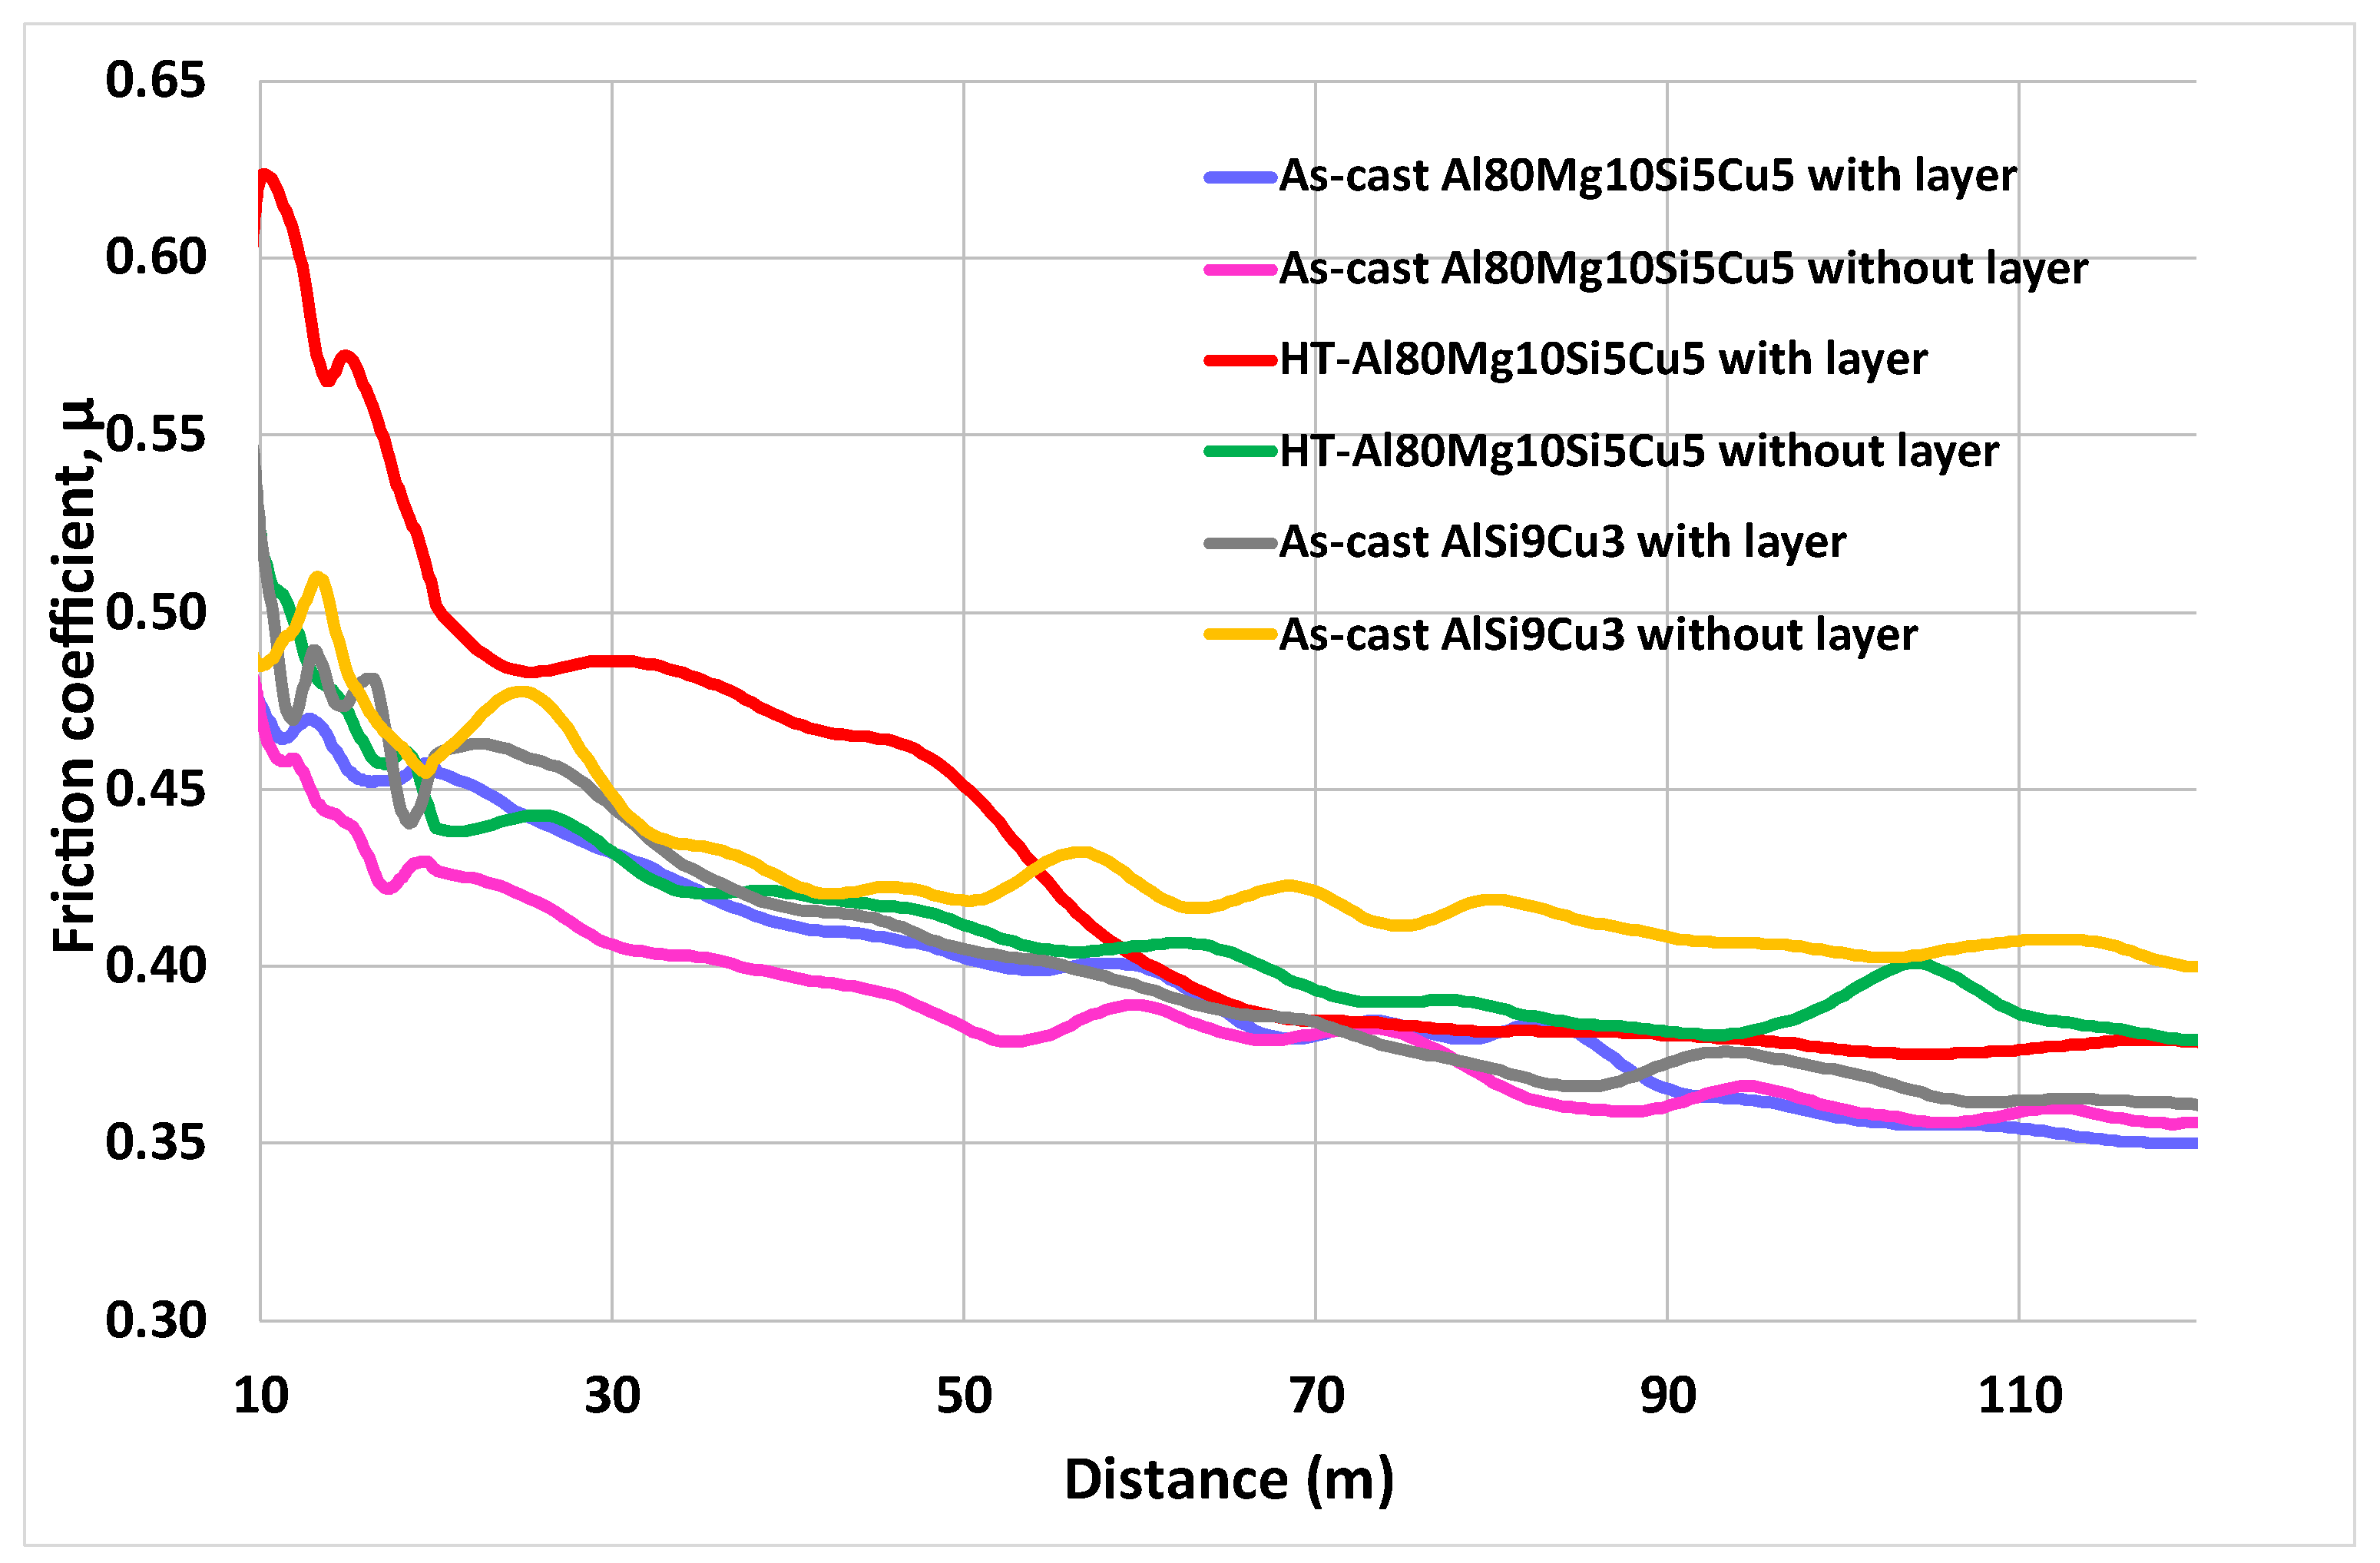
Figure 6 displays the friction coefficient curves during the early stages. Although the friction coefficient curves of experimental alloys seem to be very similar, they exhibit variations in values across the different stages.
During the previous stage, the samples with surface layers exhibited lower friction coefficient values over a specific duration, and the samples without the layer showed a rapid increase, reaching the maximum peak quickly. The as-cast AlSi9Cu3 alloy (the curve represented in gray color in) showed low values over a longer duration (around 5 m), and the HT-Al80Mg10Si5Cu5 alloy (red color in) displayed low values over a shorter duration (1.5 m). The microstructure characteristics on the surface are known to improve mechanical properties, such as hardness [76,77] and thus appear to reduce the overall impact of wear mechanisms.
Once stage 1 was reached, the alloy Al80Mg10Si5Cu5 with the surface layer had the lowest value for the maximum friction coefficient. On the contrary, HT-Al80Mg10Si5Cu5 and as-cast AlSi9Cu3 alloys without surface layer presented the highest values.
Figure 7 displays the friction coefficient curves during the Stage 2. During this stage, the HT-Al80Mg10Si5Cu5 alloy with the surface layer exhibited slightly higher values for the friction coefficient. However, this sample reached the minimum friction coefficient value and entered Stage 3 or steady-state much earlier than the other samples. In terms of minimum friction values, the as-cast Al80Mg10Si5Cu5 alloy with the surface layer presented the lowest values, which were closely comparable to those of the as-cast Al80Mg10Si5Cu5 without the layer and the as-cast AlSi9Cu3 with the surface layer.
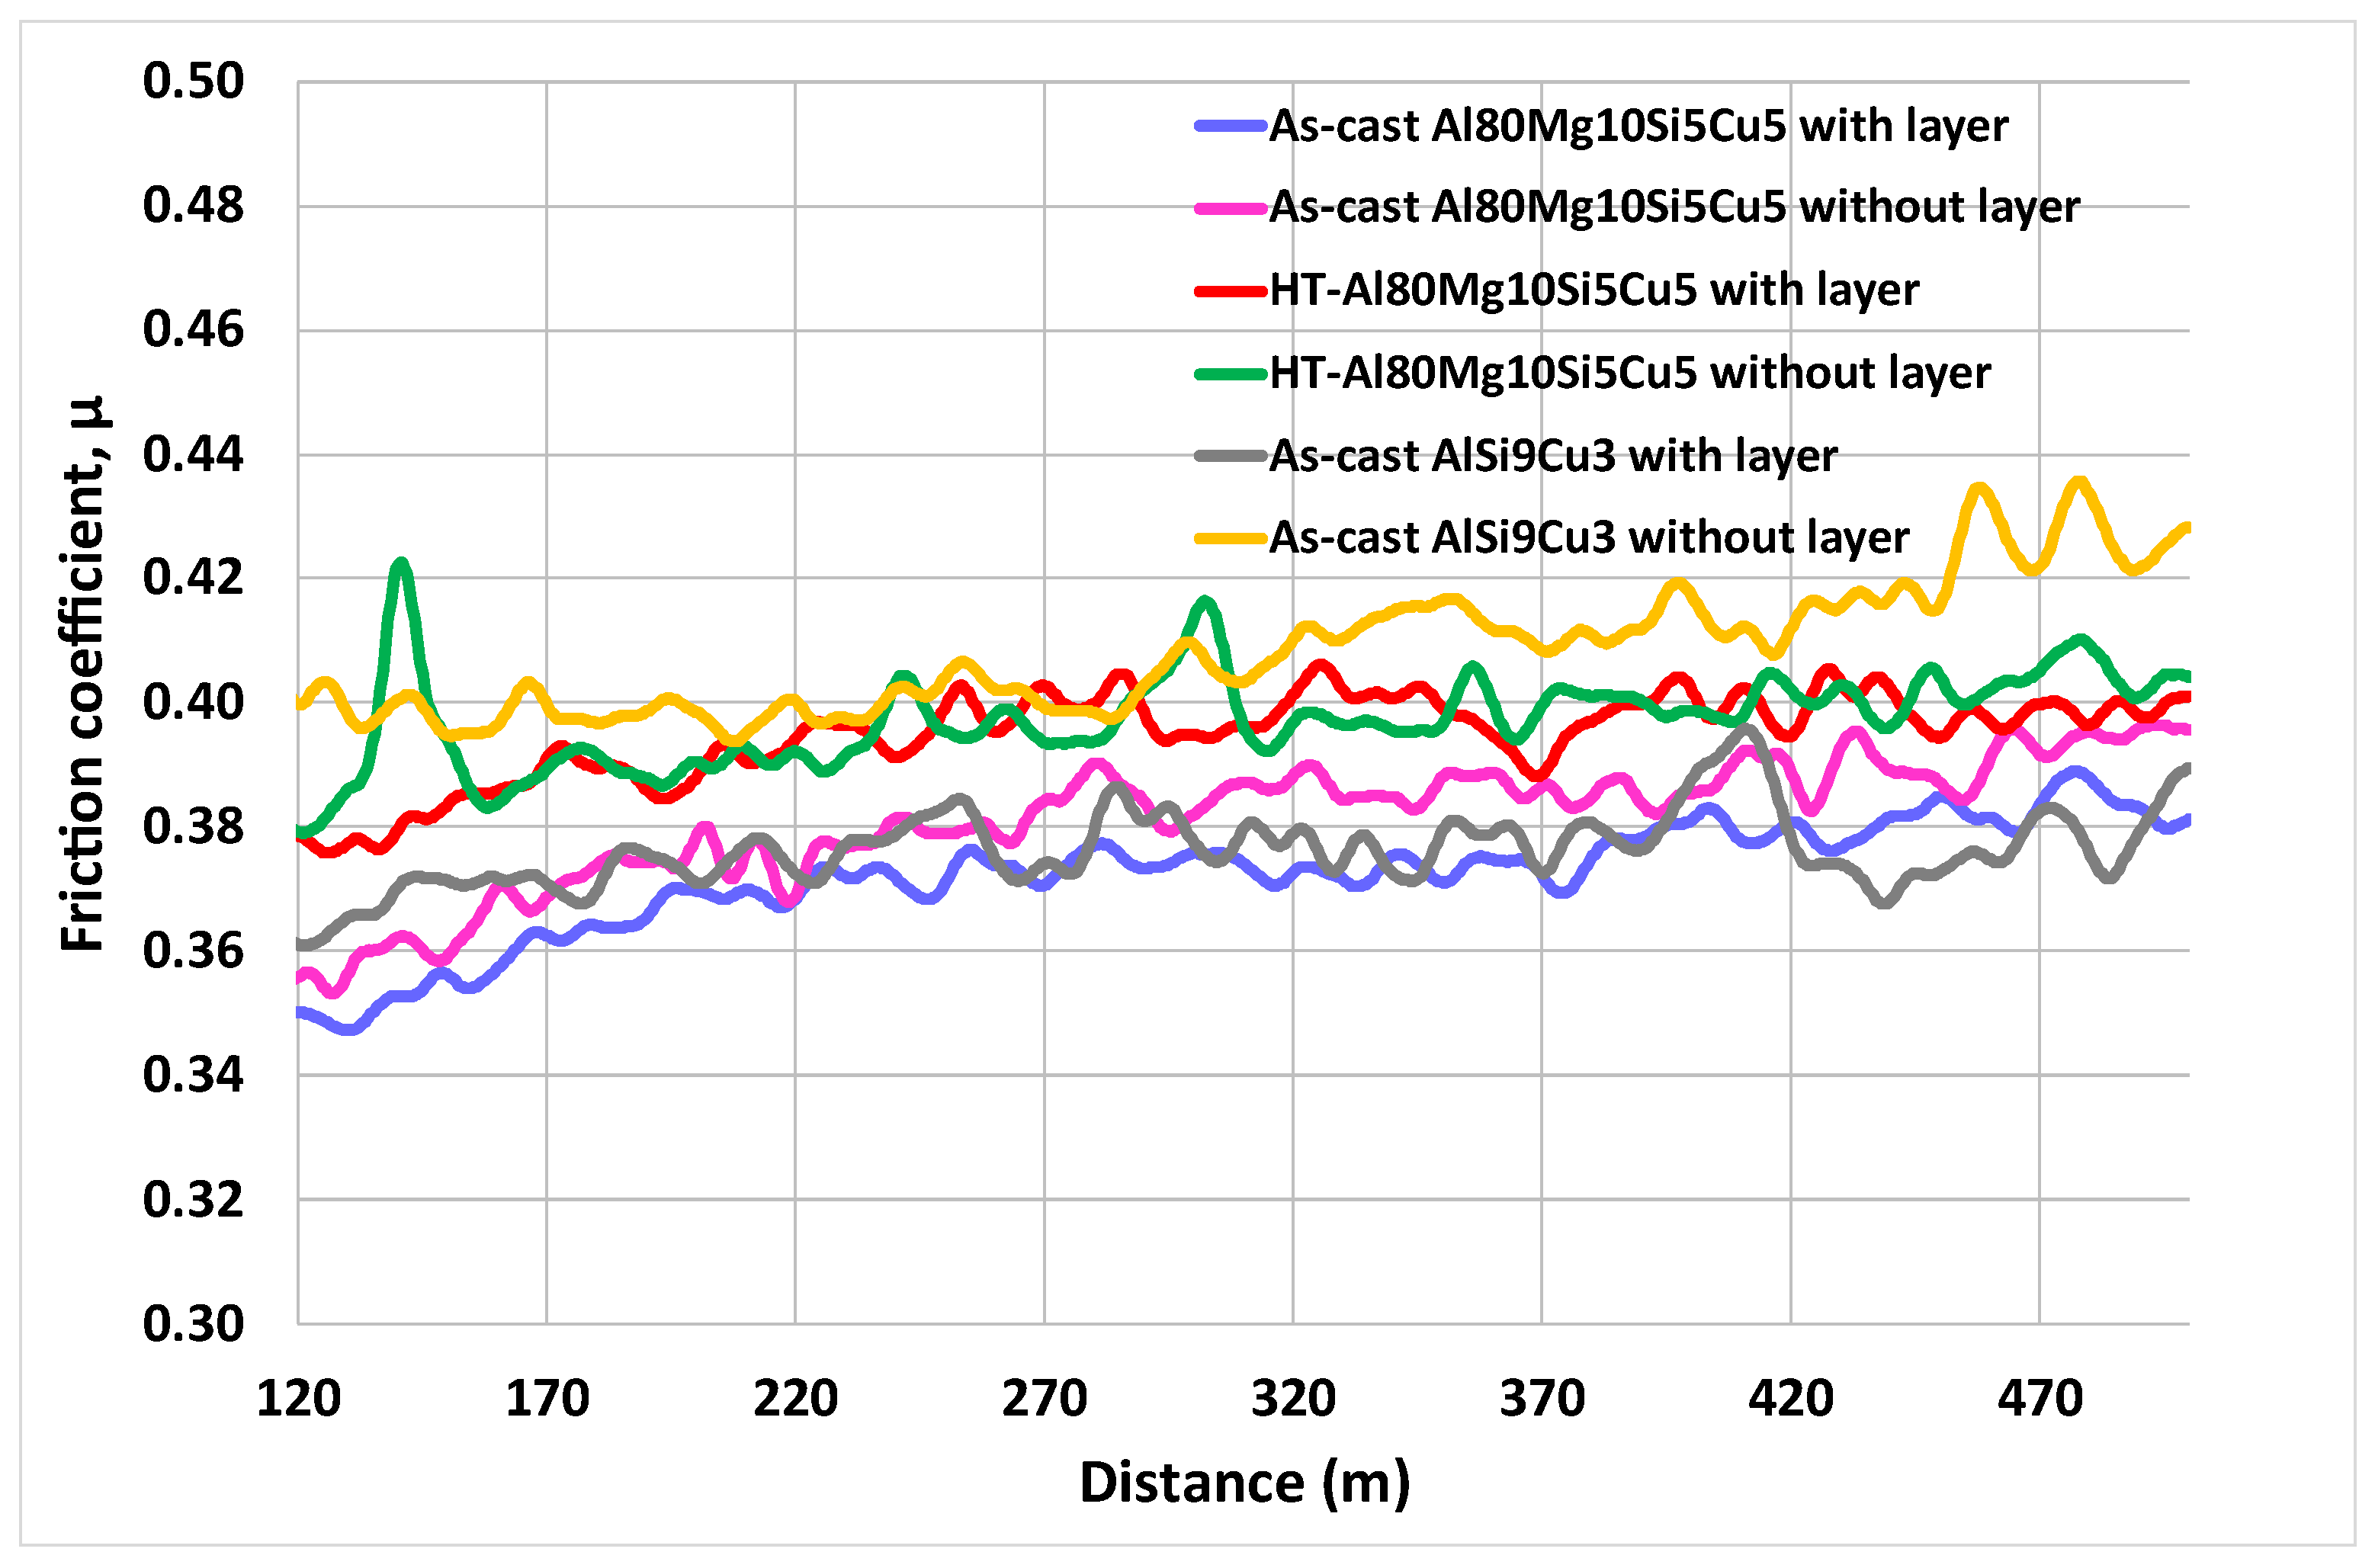
Figure 8 displays the friction coefficient curves during Stage 3. Finally, during Stage 3, corresponding to the steady state, the samples presented very similar mean values for friction coefficient, ranging between 0.371 and 0.416. However, some differences were observed. The as-cast Al80Mg10Si5Cu5 alloy with a surface layer exhibited the lowest friction coefficient values, while the as-cast AlSi9Cu3 without the surface layer showed the highest values.
The maximum friction coefficient (µmax) and friction coefficient in the steady-state or phase 3 (µsteady-state) (mean and standard deviations) of all repetitions of experimental alloys are presented in Table 4. The results demonstrated that although steady-state friction coefficient values were similar, small differences were observed, particularly in the maximum friction coefficient during the early stages. The friction values obtained during the steady-state or stage 3 cannot be correlated with the hardness of the alloys, as the friction values are quite similar despite significant differences in hardness across samples. On the other hand, it is notable that the as-cast Al80Mg10Si5Cu5 alloy with the surface layer presented the lowest value for the maximum friction coefficient. Thus, it is demonstrated that friction wear during the early stages is significant [78].

3.3. Determination of Wear Rate Coefficient

The wear rate coefficient determined for each experimental alloy using a laser scanning confocal microscope is compiled in Table 5. Despite the experimental alloys presenting practically similar values for friction coefficient, the wear rate values differed. The results indicated that there is no clear relationship between the friction coefficient at a given test distance and wear rate values, despite indications in other literature suggesting that the characterization of the system’s properties relies on measurements of wear rates or friction forces specifically during stable, steady-state conditions [79,80]. Only the HT-Al80Mg10Si5Cu5 and as-cast AlSi9Cu3 alloy, without surface layer, confirmed that higher friction coefficient values in the steady-state corresponded to higher wear rates. This is because most experiments often neglect to consider wear and friction values during the initial stages, such as the friction tests in the previous stage, stage 1, and stage 2. Some studies have highlighted the significance of these phases, noting that wear rates can vary significantly across different stages of the friction curve and may reach relatively high levels [81]. Comparing the maximum friction values, a more direct correlation is observed between the friction values and the wear rates for the different samples. Consequently, wear rate prediction ability during the running-in phase becomes crucial [82].

3.4. Application of the New Method to Estimate the Wear Rate from the Friction Curve

In this section, the new methods based on the study of friction curves were applied to compare the wear rate of the six experimental alloys.
The frictional force (Ffric) is related to COF and the normal load (N) as Equation (2) [83]:
F f r i c = C O F × N
If the distance (d) is expressed as a function of time (t), denoted as d(t), the friction force becomes a function of time, and the work dissipated over time W(t)) can be written as Equation (3) [84]
W   t = C O F t × N × d ( t )
The distance run over time can be expressed as the integral of the velocity function v(t) as Equation (4):
d t = 0 t v t . d t
Substituting this into the equation for W(t), we obtain Equation (5):
W t = C O F × N × 0 t v t . d t
Thus, the area under the COF curve over time represents the total energy dissipated by friction during the test. A larger area indicates greater interaction between the contacting surfaces, leading to increased wear as more frictional work is conducted, resulting in higher energy dissipation as heat.
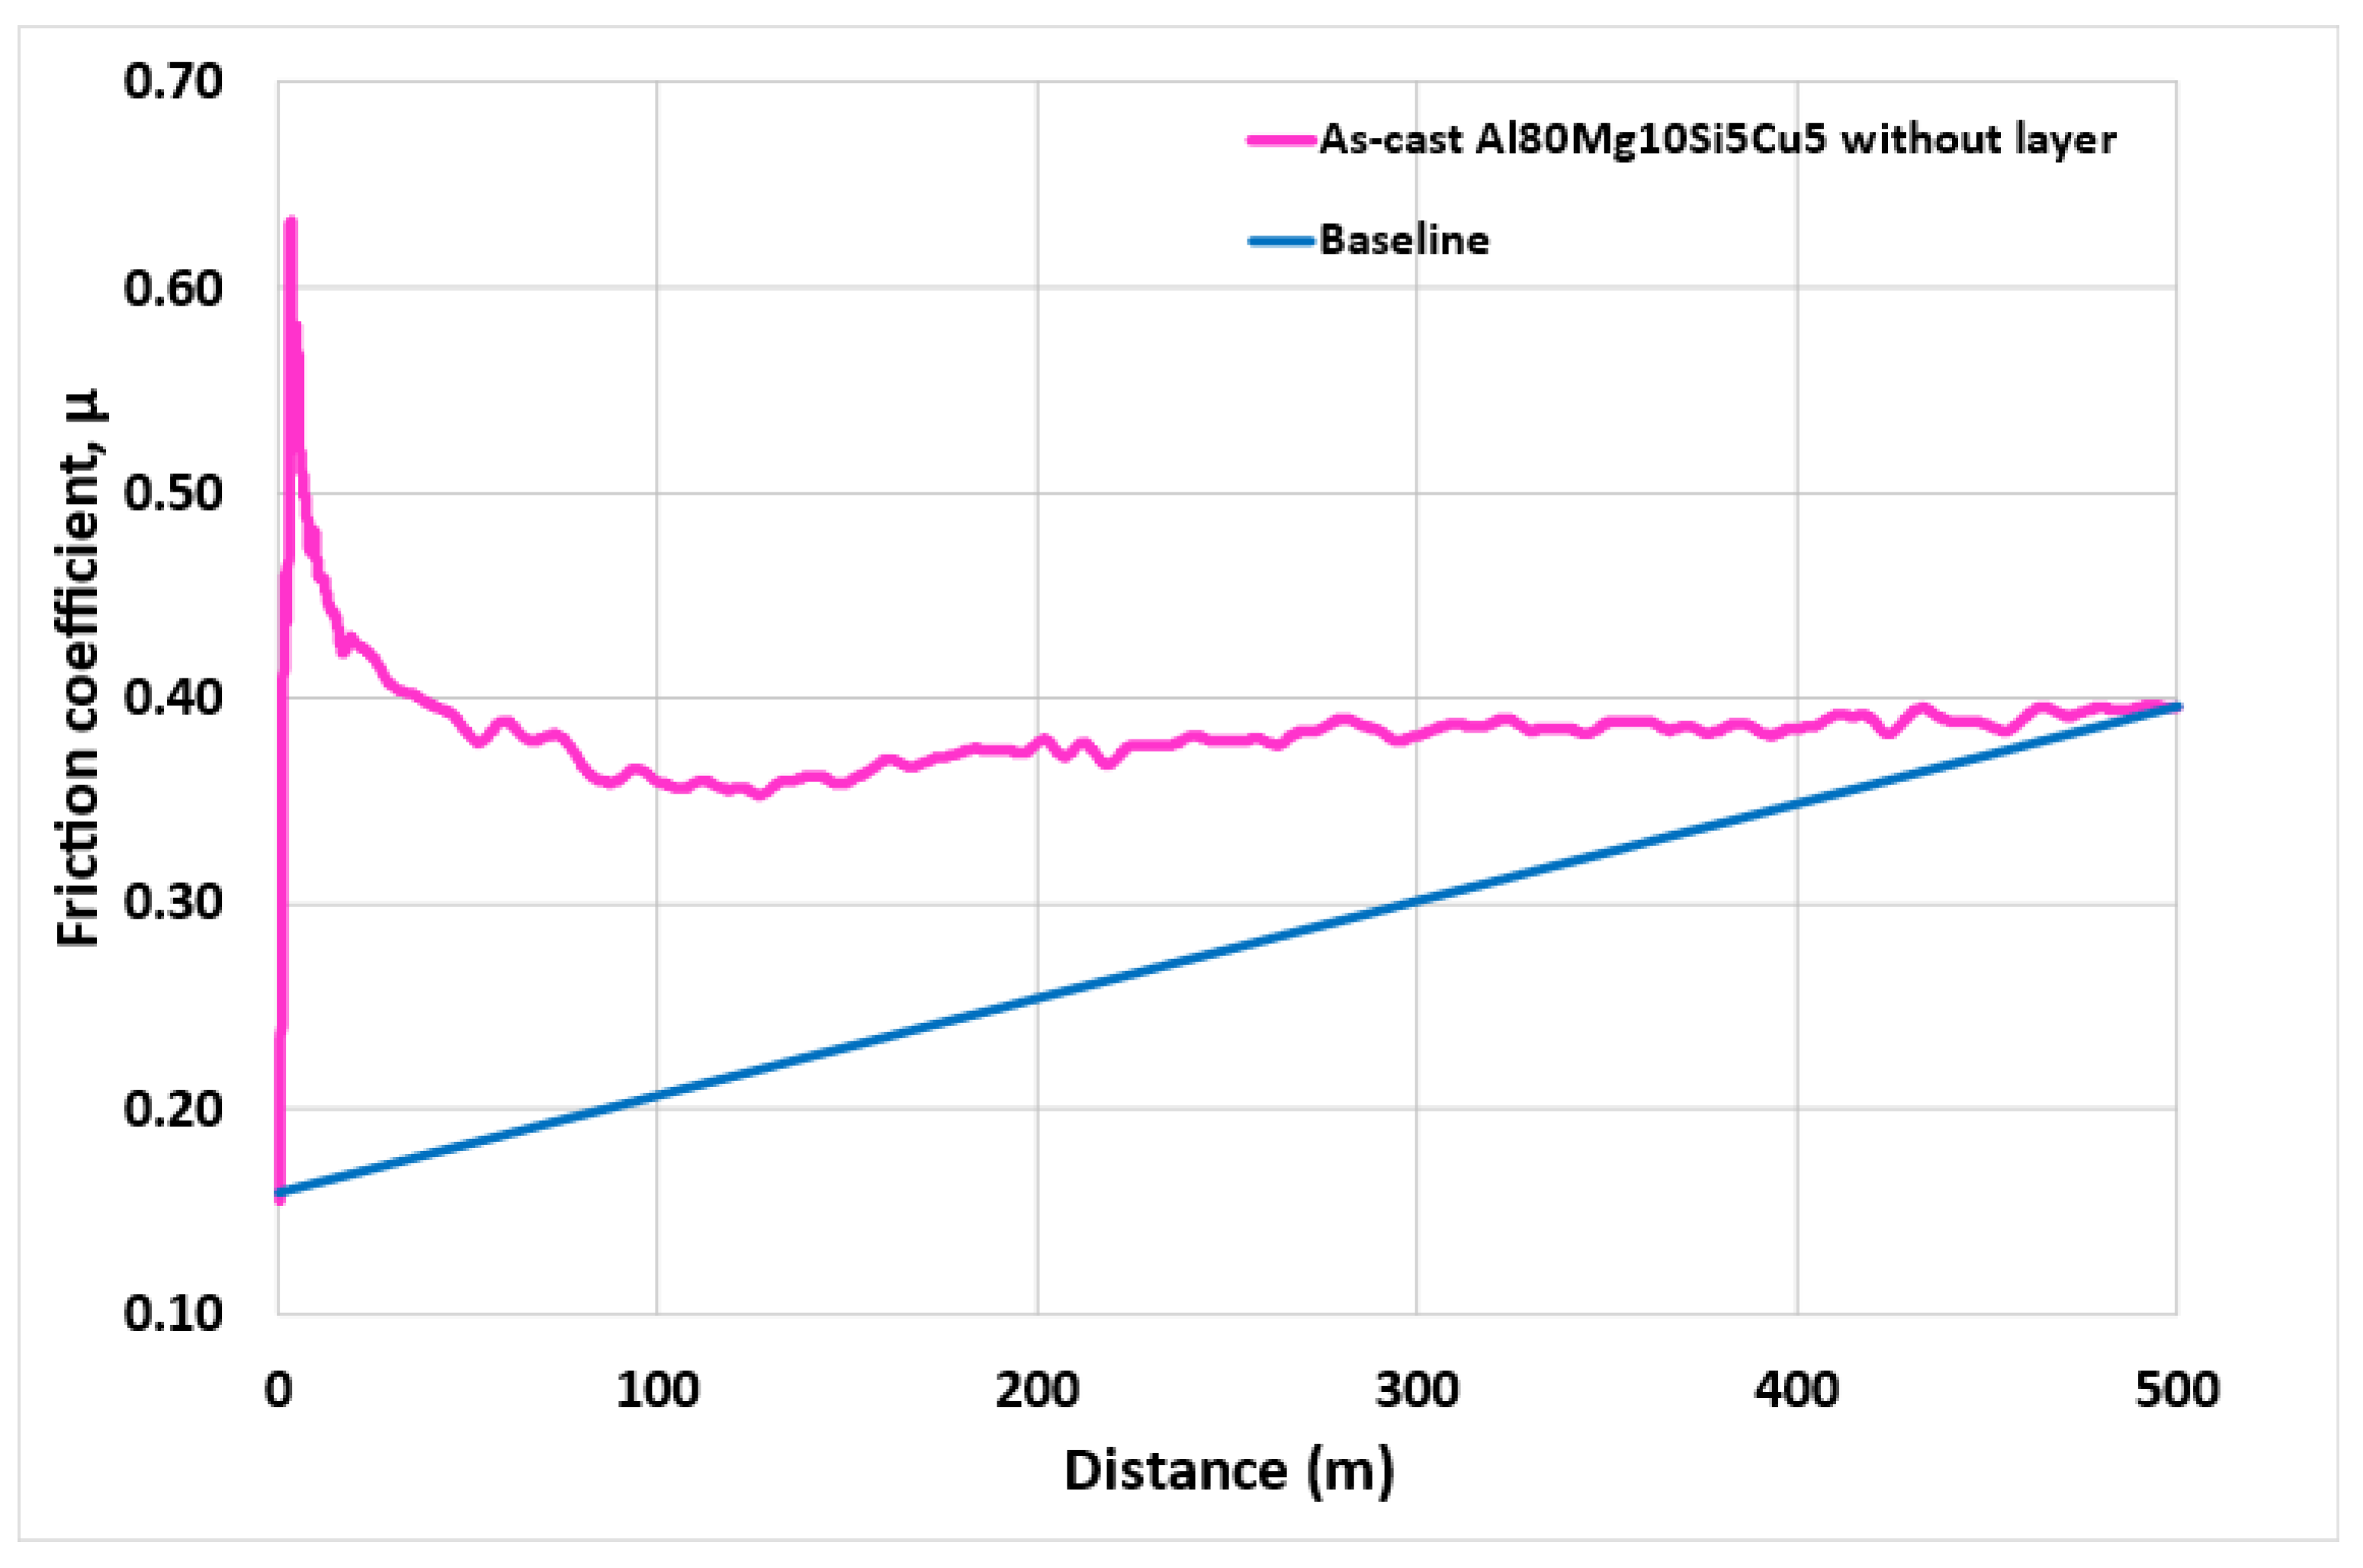
To calculate the integral, a zero-curve or baseline curve was established from the starting point to the endpoint of the friction curve. The baseline is the hypothetical friction curve assuming no transition or phase transformation [85]. This technique is commonly used in thermal analysis to predict the latent heat involved in transformations and to calculate the solid fraction curve [86]. The most used methods are Newtonian and Fourier [87,88]. The baseline is defined as forming a slope that reflects the progressive wear of the material during the test. This approach, compared to traditional horizontal baselines, provides a more accurate representation of the test’s physical conditions. This method is inspired by previous studies that employed dynamic baselines [89], such as the polygonal and slightly inclined straight baselines, which are effective when initial and final values differ significantly, enhancing the accuracy of the results.
Figure 9 illustrates an example of the baseline applied on the as-cast Al80Mg10Si5Cu5 friction curve using linear Newton analysis. The baseline was utilized to compute the total area under the friction curve.
The first method involved calculating the total area under the friction coefficient curve (COF), corresponding to a sliding distance of 500 m, equivalent to 5000 s in this case:
W t = C O F × N × 0 5000 v t . d t
In method 2 (shown in Figure 10), the baseline was established for the initial 20 m (or 200 s), representing the period just before the friction values start to decrease with increasing speed. The concept of an intermediate baseline is commonly used in other studies, such as thermal analysis of aluminum solidification [90], where it is employed to determine heat at different stages of the crystallization processes.
W t = C O F × N × 0 200 v t . d t
Table 6 collects the area measured in each experimental alloy, arranged from lowest to highest value: total area in unit area, the area under 20 m in unit area and percentage, the ratio of the total area (obtained by dividing the total area value by the smallest total area), and the ratio of the area under 20 m (obtained by dividing the area under 20 m value by the smallest area under 20 m). As a preliminary analysis, it can be observed that the calculated area values were lower for samples with the surface layer than without the surface layer, which exhibited higher values, especially in the early stages.

3.5. Comparison of Calculated and Determined Wear Rate Values

In this section, the determined wear rate coefficients using laser scanning confocal microscopy were compared with the values of the ratio areas obtained under the friction curve from two methods: method 1 under the total friction curve and method 2 under the early stages (20 m) of the friction curve. Table 7 collects the different values.
Using the as-cast Al80Mg10Si5Cu5 alloy with layer as reference, the determined wear rate was approximately 30% higher for as-cast AlSi9Cu3 with the layer, 50% higher for as-cast Al80Mg10Si5Cu5 without the layer, 55% higher for HT-Al80Mg10Si5Cu5 with the layer, 65% higher for HT-Al80Mg10Si5Cu5 without the layer, and 66% higher for as-cast AlSi9Cu3 without the layer. These values correspond to the percentages calculated from the ratio of the area under the 20 m friction curve and are more distant in the case of the total ratios.
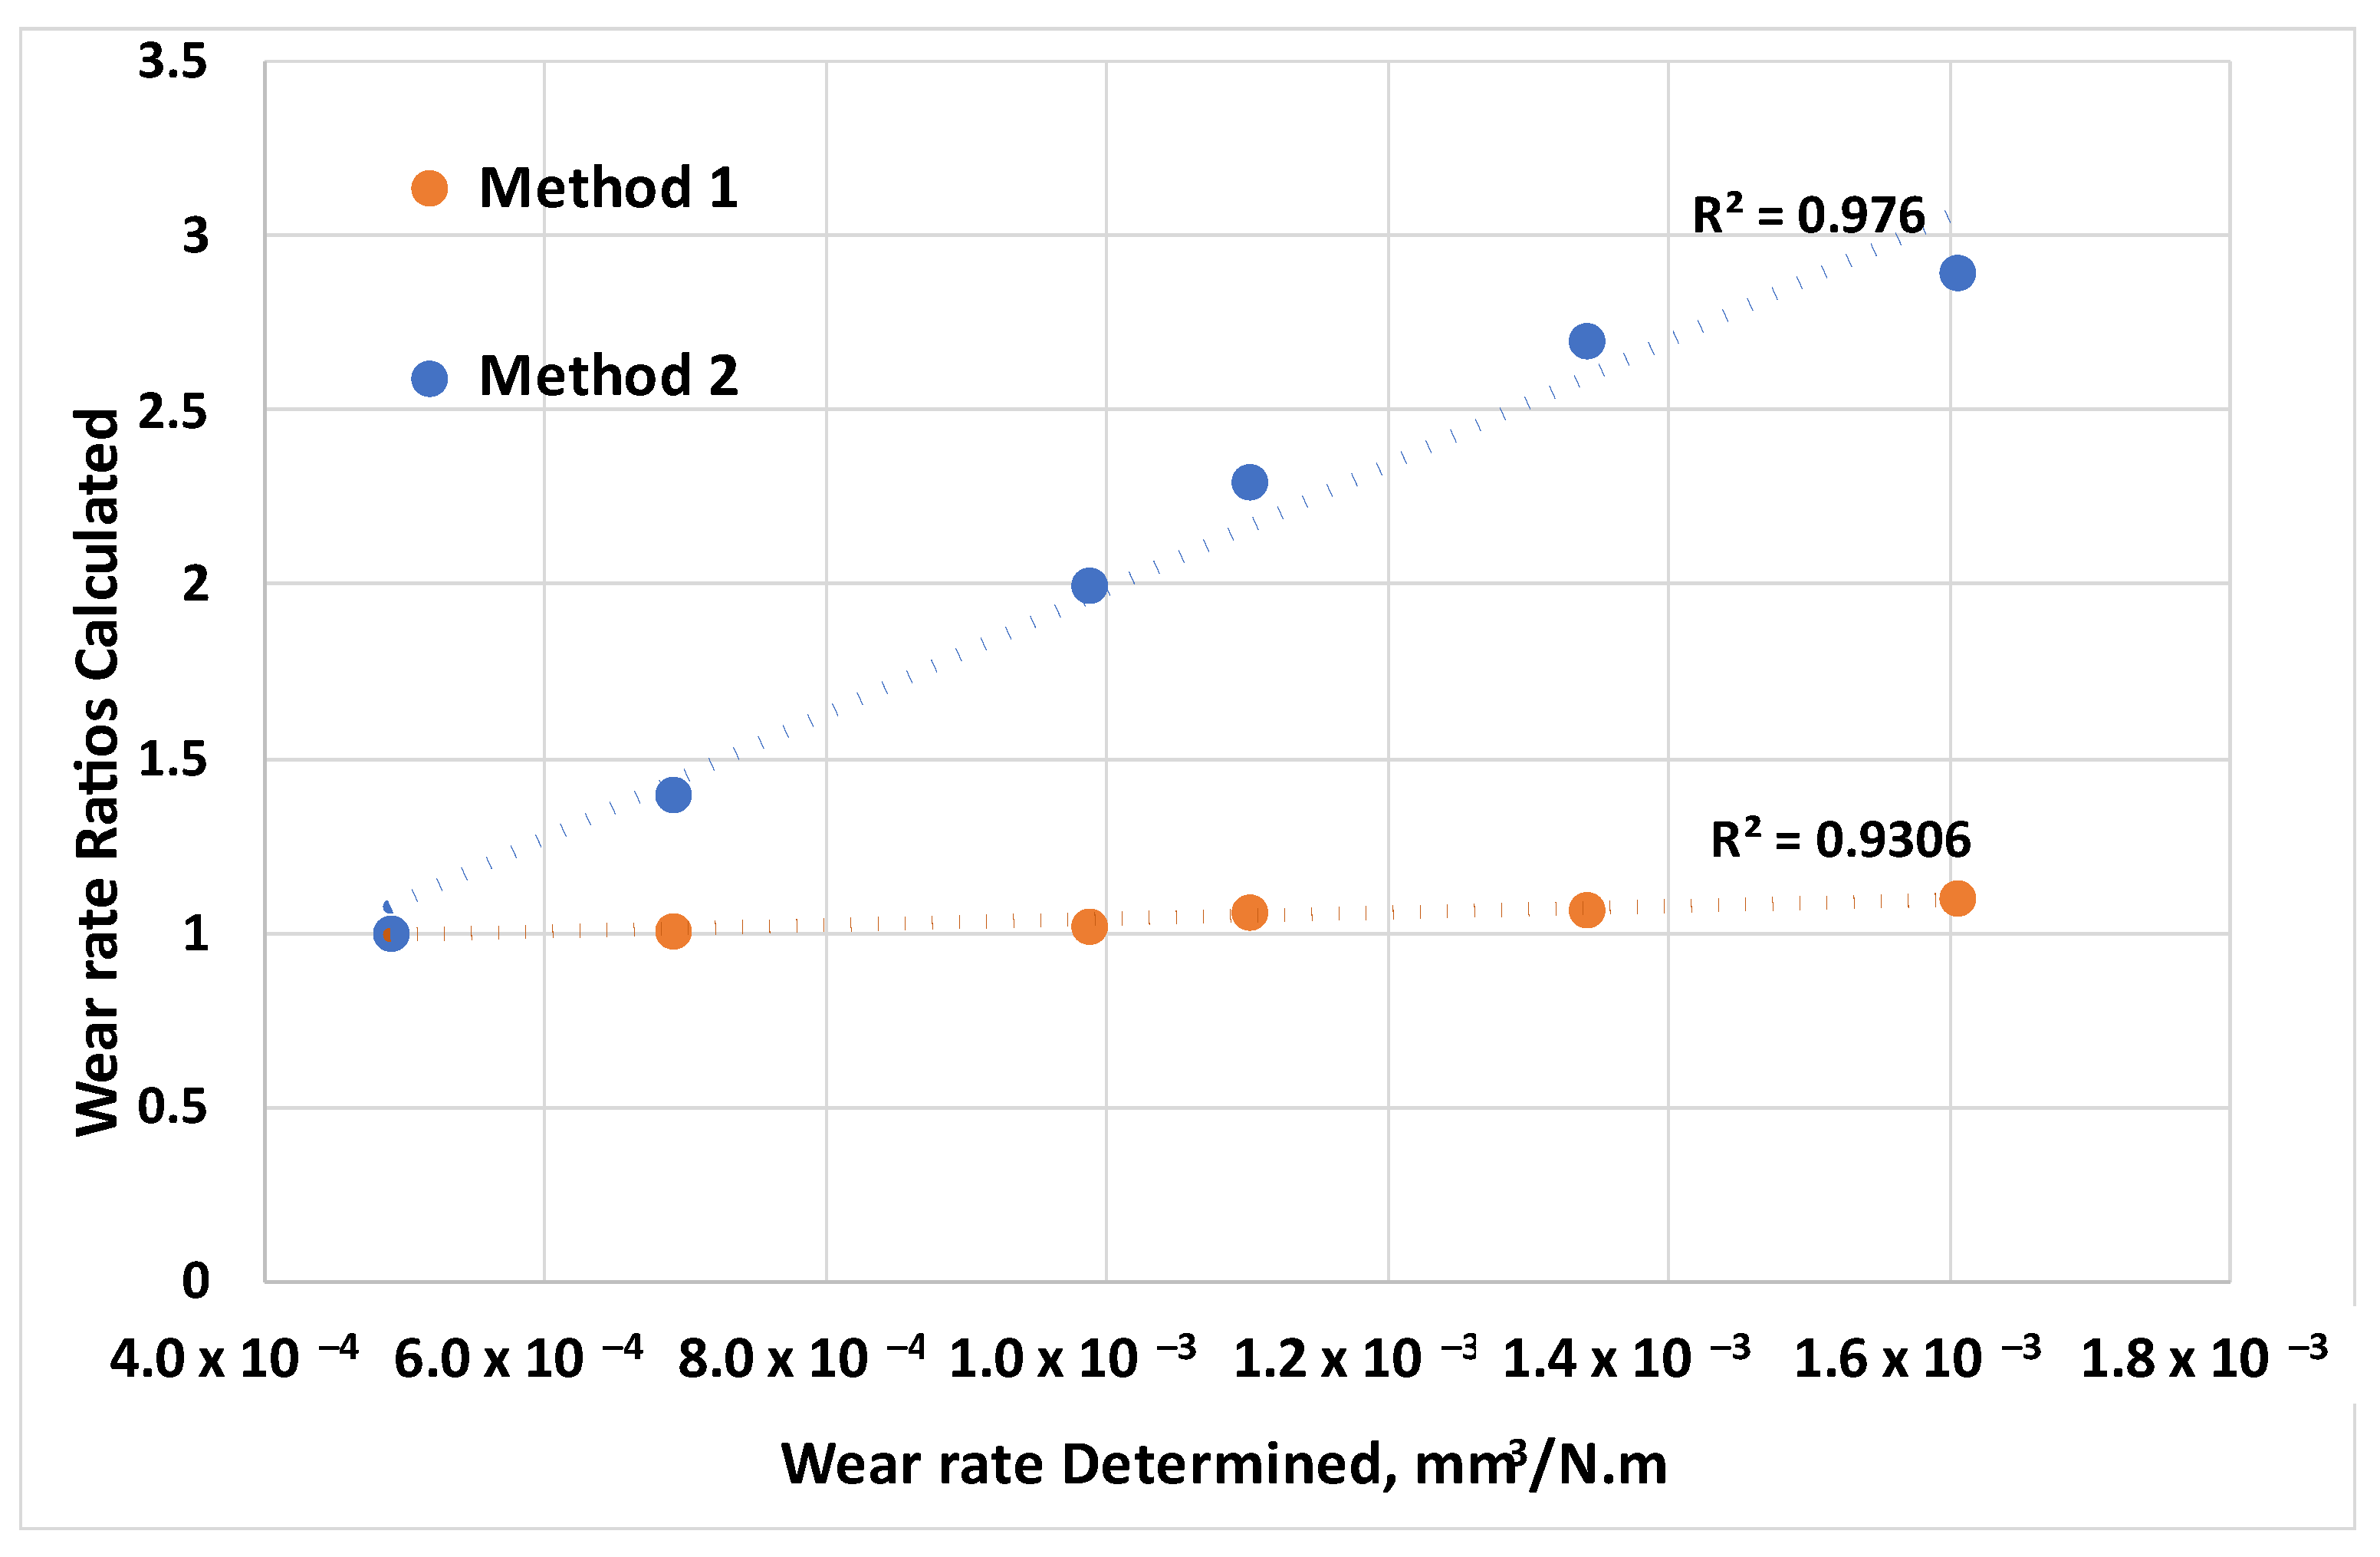
The following figure (Figure 11) presents the correlation between the wear rate values determined by applying confocal technology and the calculated values of the new methods based on the friction curve. The results demonstrated that method 2 is a robust indicator of wear rate, with a high regression coefficient of 0.9761. In contrast, method 1 is less effective in predicting the total wear rate.
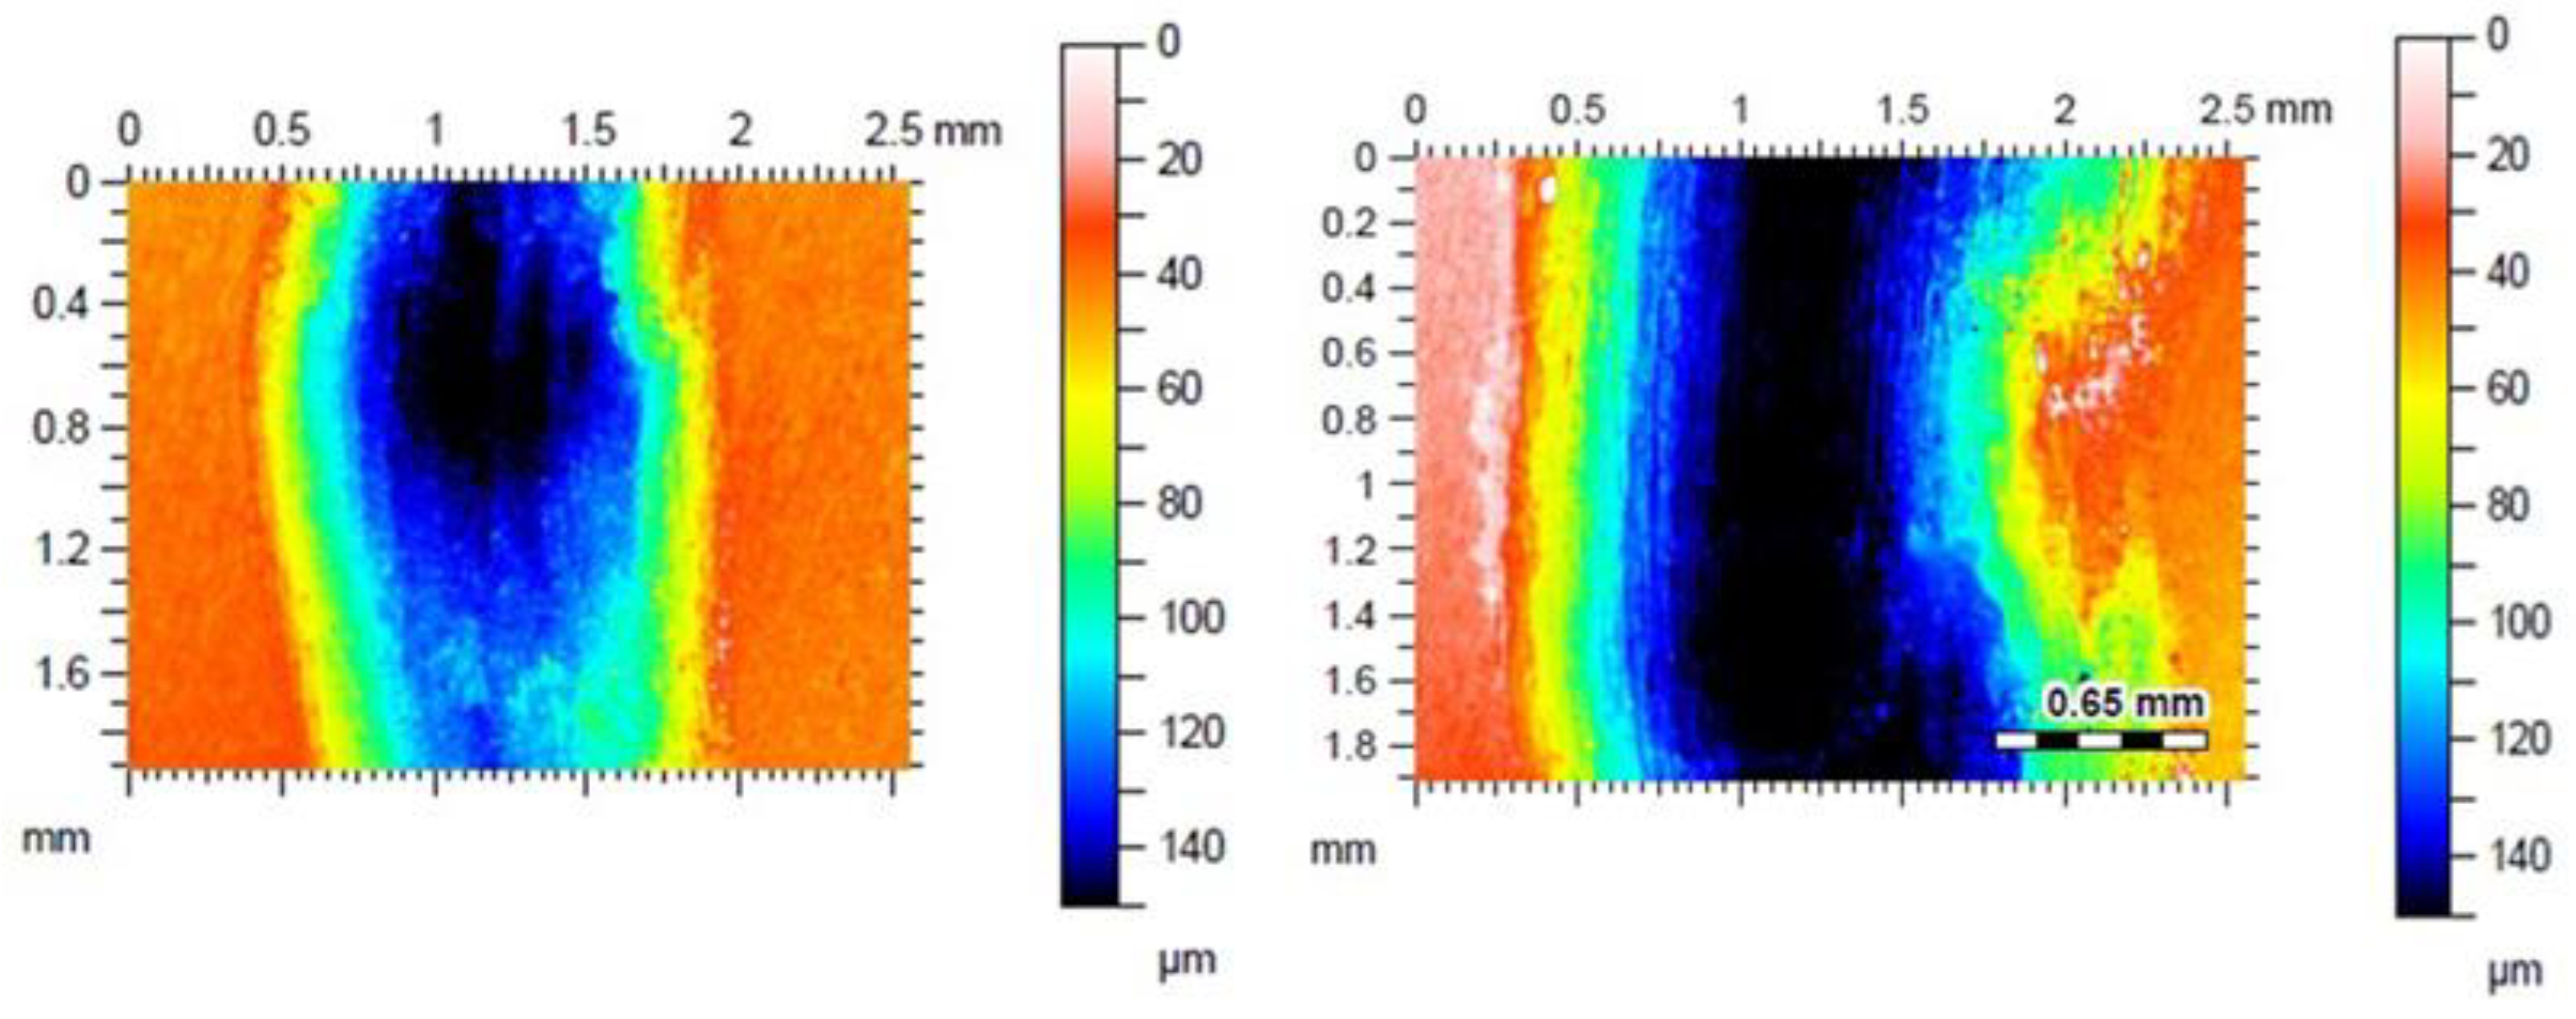
When wear analysis was conducted on the samples at different distances, it was determined that the worn volume at 20 m represents 70% of the total wear rate. Figure 12 illustrates the worn surfaces of as-cast Al80Mg10Si5Cu5 without the surface layer at the different stages. Despite the wear rate being higher at 500 m, at 20 m, the sample reached maximum depths of around 150 µm with a width of 0.6 mm. In contrast, at 500 m, the width at the maximum depths was approximately 30% higher, measuring 0.85 mm.

4. Discussion

In this study, we have developed two different methods to estimate the wear rate of six experimental samples of two Al alloys in situ from friction curves. Firstly, the friction curve was studied in detail, from the lowest and maximum coefficient of friction values in the early stages to the stable coefficient of friction during the steady-state, which is used to evaluate the tribological properties of materials.
At the beginning of the friction test, the samples with the surface layer showed lower values for a certain period than the samples without the layer. This demonstrates that the surface layer acts as a lubricant, decreasing the wear rate. The as-cast Al80Mg10Si5Cu5 alloy with the surface layer exhibited greater hardness and a longer duration during this previous stage. Regarding the maximum friction coefficient values, the as-cast Al80Mg10Si5Cu5 alloy with the surface layer presented the lowest values again. Conversely, the samples with the highest wear rate exhibited the highest values for maximum friction coefficient. However, there is no linear relationship because some samples showed lower values despite having a higher wear rate, although in these cases, they exhibited up to three maximum peaks. During the steady-state, the as-cast Al80Mg10Si5Cu5 alloy with the surface layer presented the lowest values in terms of the minimum ranges; however, the mean values were very similar in all the samples. So, it is proven that the steady-state friction coefficient is not a good indicator of the total wear rate, and there is no relationship between the friction values and hardness. This may be why there is so much controversy in the literature regarding the statement that the lower the friction value (using the steady-state value), the lower the wear rate. However, during the early stages, the behavior of the samples is more evident and shows a stronger relationship.
To validate the new methods, the estimated values obtained for wear rate applying the two methods were compared to the values of friction coefficient and wear rate obtained using laser scanning confocal microscopy.
It has been proved that the proposed methods are helpful tools for comparing the wear rate of materials in the study.
Method 1 based on the total area calculation can predict the trend to a higher wear rate, but it is not a good indicator.
Method 2, based on the calculation of the area under the first 20 m corresponding to the early stages, can accurately predict the total worn area of the samples.
The results indicated a correlation of 0.976 between the values of the wear rate determined and the values calculated applying the new method, showing that wear rate values can be calculated with high accuracy using the new method initially and applying confocal microscope techniques later as complementary tools. This proposed method can serve as a complementary method, as it provides a direct value and can be automated to compare efficiently different samples. Additionally, it is supported by the areas under the friction curve comparison with the ratio and wear rate in two different alloys, which validates its applicability in comparative studies. This approach does not replace more complex methods but provides an additional tool for analyzing and predicting wear under controlled testing conditions.
In future work, more investigations with different alloys will be developed to determine general equations.

5. Conclusions

The method of calculating the area under the curve has been analyzed to assess the total wear of the different samples. The conclusions are as follows:
  • The results presented in this work highlight the significance of the early stages in determining the wear rate.
  • The findings demonstrate no clear relations between the coefficient of friction and the wear rate.
  • The results also demonstrate that hardness has a greater influence on wear rate than the steady-state friction coefficient.
  • The results from studied samples indicate that the area under the curve during the early stages can serve as a quick indicator of wear rate, which was later confirmed by more precise methods like confocal technology that require longer analysis times.
  • With a regression coefficient of R2 = 0.976, the correlation coefficient is approximately 0.988, indicating a robust linear relationship. Therefore, the model is expected to predict future observations with a minimal margin of error.

Author Contributions

Conceptualization, J.A. and I.V.; Methodology, E.V. and I.V., software, E.V., J.A. and I.V.; validation, P.C., T.G.; formal analysis; J.A., P.C. and T.G.; investigation, E.V., J.A., P.C. and I.V.; resources, J.A., P.C. and T.G.; data curation, P.C. and T.G.; writing—original draft preparation, E.V. and P.C.; writing—review and editing, J.A. and I.V.; visualization, J.A., P.C. and T.G.; supervision, J.A. and I.V.; project administration J.A.; funding acquisition, I.V. All authors have read and agreed to the published version of the manuscript.

Funding

This research was partially funded by H2MAT by the Basque Government through the Elkartek Programme 2022, under the Filing Identification Number KK-2022/00064, the DESGAS- through the Elkartek Programme 2023 under the number KK-2023/00020, and H2MAT+ through the Elkartek Programme 2024 and number KK-2024/00021.

Data Availability Statement

Data are contained within the article although it is possible to provide raw data upon request by email.

Conflicts of Interest

The authors declare no conflicts of interest.

References

  1. Das, S.; Robi, P.S.; Kumar, P. Tribological properties of (Al)10(FeCoNiCu)90 high entropy alloy. Tribol.—Mater. Surf. Interfaces 2022, 17, 72–80. [Google Scholar] [CrossRef]
  2. Devaraju, A. A critical review on different types of wear of material. Int. J. Mech. Eng. Technol. 2015, 6, 77–83. [Google Scholar]
  3. Soares, F.; Manfrinato, M.D.; Gazzola, J.; Rossino, L.S. Determination of the wear resistance of 1020 steel superficially treated in contact with 3104 aluminum alloy using the microwear test compared to the designed wear test evaluated by the moiré optical technique. Matéria 2024, 29, e20240094. [Google Scholar] [CrossRef]
  4. Swain, B.; Bhuyan, S.; Behera, R.; Mohapatra, S.S.; Behera, A. Wear: A Serious Problem in Industry. In Tribology, 2nd ed.; Patnaik, A., Singh, T., Kukshal, V., Eds.; Intechopen: London, UK, 2021; pp. 1–20. [Google Scholar]
  5. Neale, M.J. Wear mechanisms. In Lubrication and Reliability Handbook; Elsevier: Amsterdam, The Netherlands, 2001; Volume B19, pp. 1–3. [Google Scholar] [CrossRef]
  6. Wimmer, M.A.; Fischer, A.; Buscher, R.; Pourzal, R.; Sprecher, C.; Hauert, R.; Jacobs, J.J. Wear mechanisms in metal-on-metal bearings: The importance of tribochemical reaction layers. J. Orthop. Res. 2010, 28, 436–443. [Google Scholar] [CrossRef]
  7. Jeyaprakash, N.; Yang, C.H. Friction, Lubrication, and Wear. In Tribology in Materials and Manufacturing—Wear, Friction and Lubrication, 2nd ed.; Patnaik, A., Singh, T., Kukshal, V., Eds.; Intechopen: London, UK, 2020; pp. 1–17. [Google Scholar]
  8. Hemadri, K.; Daniel, A.A.; Kukanur, V.; Nagaral, M. Determination of wear rate and coefficient of friction of Al6262 reinforced with different weight percentage of WC/MoS2 under dry sliding condition. J. Res. Eng. Struct. Mater. 2024, 10, 1125–1138. [Google Scholar] [CrossRef]
  9. Zawawi, N.N.M.; Azmi, W.H.; Redhwan, A.A.M.; Sharif, M.Z. Coefficient of friction and wear rate effects of different composite nanolubricant concentrations on Aluminium 2024 plate. In Proceedings of the Materials Science and Engineering Conference, Kuantan, Malaysia, 1–2 August 2017. [Google Scholar] [CrossRef]
  10. Zhang, Y.; Kovalev, A.; Meng, Y. Combined Effect of Boundary Layer Formation and Surface Smoothing on Friction and Wear Rate of Lubricated Point Contacts during Normal Running-in Processes. Friction 2018, 6, 274–288. [Google Scholar] [CrossRef]
  11. Perfilyev, V.; Moshkovich, A.; Lapsker, I.; Rapoport, L. Friction and Wear of Copper Samples in the Steady Friction State. Tribol. Int. 2010, 43, 1449–1456. [Google Scholar] [CrossRef]
  12. Yue, T.; Wahab, M.A. Finite Element Analysis of Fretting Wear under Variable Coefficient of Friction and Different Contact Regimes. Tribol. Int. 2017, 107, 274–282. [Google Scholar] [CrossRef]
  13. Li, L.; Kang, L.; Ma, S.; Li, Z.; Ruan, X.; Cai, A. Finite element analysis of fretting wear considering variable coefficient of friction. Proc. Inst. Mech. Eng. Part J J. Eng. Tribol. 2019, 233, 758–768. [Google Scholar] [CrossRef]
  14. Xavier, L.F.; Suresh, P. Wear Behavior of Aluminium Metal Matrix Composite Prepared from Industrial Waste. Sci. World J. 2016, 2016, 6538345. [Google Scholar] [CrossRef] [PubMed]
  15. Pawelec, K.M.; White, A.A.; Best, S.M. Properties and characterisation of bone repair materials. Bone Repair Biomater. 2009, 4, 65–102. [Google Scholar] [CrossRef]
  16. Wang, Y.; Zhang, J. A Review of the Friction and Wear Behavior of Particle-Reinforced Aluminum Matrix Composites. Lubricants 2023, 11, 317. [Google Scholar] [CrossRef]
  17. Marimuthu, U.; Aravindan, S.; Kaliyamoorthy, R. Wear performance of Al–SiC–B4 C hybrid composites under dry sliding conditions. Mater. Des. 2013, 47, 456–464. [Google Scholar] [CrossRef]
  18. Elhefnawey, M.; Shuai, G.L.; Li, Z.; Nemat-Alla, M.; Zhang, D.T.; Li, L. On Dry Sliding Wear of ECAPed Al-Mg-Zn Alloy: Wear Rate and Coefficient of Friction Relationship. Alex. Eng. J. 2021, 60, 927–939. [Google Scholar] [CrossRef]
  19. Suh, N.P.; Sridharan, P. Relationship between the coefficient of friction and the wear rate of metals. Wear 1975, 34, 291–299. [Google Scholar] [CrossRef]
  20. Al-Enzi, F.F.S.; Mohammed, S.S. Prediction Of Hardness And Wear Behaviour Of Friction Stir Processed Cast A319 Aluminum Alloys Using Machine Learning Technique. Eng. Res. J. 2020, 1, 16–26. [Google Scholar]
  21. Zhu, C.; Jin, L.; Li, W.; Han, S.; Yan, J. The Prediction of Wear Depth Based on Machine Learning Algorithm. Lubricants 2024, 12, 34. [Google Scholar] [CrossRef]
  22. Wattel, S.; Molinari, J.F. A story of two transitions: From adhesive to abrasive wear and from ductile to brittle regime. J. Chem. Phys. 2024, 160, 014711. [Google Scholar] [CrossRef]
  23. Popov, V.L. Generalized Archard law of wear based on Rabinowicz criterion of wear particle formation. Facta Univ. Mech. Eng. 2019, 17, 39–45. [Google Scholar] [CrossRef]
  24. Udoye, N.; Fayomi, O.S.I.; Inegbenebor, A.O. Assessment of Wear Resistance of Aluminium Alloy in Manufacturing Industry-A Review. Procedia Manuf. 2019, 35, 1383–1386. [Google Scholar] [CrossRef]
  25. Mokhtar, M.O.A. The effect of hardness on the frictional behaviour of metals. Wear 1982, 78, 297–304. [Google Scholar] [CrossRef]
  26. Qiao, L.; Ramanujan, R.V.; Zhu, J. Effect of Aluminum on the Friction and Wear Behavior of Medium-Entropy Alloys. Adv. Eng. Mater. 2022, 24, 2101475. [Google Scholar] [CrossRef]
  27. Gopi, V.; Sellamuthu, R.; Sanjivi, A. Measurement of hardness, wear rate and coefficient of friction of surface refined Al-Cu alloy. Procedia Eng. 2014, 97, 1355–1360. [Google Scholar] [CrossRef]
  28. Alajmi, M.; Shalwan, A. Correlation between Mechanical Properties with Specific Wear Rate and the Coefficient of Friction of Graphite/Epoxy Composites. Materials 2015, 8, 4162–4175. [Google Scholar] [CrossRef] [PubMed]
  29. Mezlini, S.; Kapsa, P.; Abry, J.C.; Meille, G.; Ribes, H.; Dif, R. Relationship between Hardness and Abrasive Wear for some Aluminium Alloys. Mater. Sci. Forum 2002, 396, 1517–1524. [Google Scholar] [CrossRef]
  30. Hoic, M.; Skugor, B.; Deur, J.; Tissot, A. Correlation of wear rate, hardness, and density for a dry clutch friction material. In Proceedings of the 7th World Tribology Congress, Lyon, France, 10–15 July 2022. [Google Scholar]
  31. The Wear of Metals: Theory, Mechanism and Testing. University of Cambridge. Available online: https://www.phase-trans.msm.cam.ac.uk/2011/JG/4.pdf (accessed on 25 December 2024).
  32. Smith, D.A. Wear and Friction Analysis of Thin Coatings. Available online: https://www.silcotek.com/hs-fs/hub/22765/file-341679011-pdf/docs/t-09-113_silcotek_tribology_testing_final_report.pdf (accessed on 12 November 2024).
  33. Gregorio, A.V.L.; Silva, T.E.F.; Reis, A.P.; de Jesus, A.M.P.; Rosa, P.A.R. A Methodology for Tribo-Mechanical Characterization of Metallic Alloys under Extreme Loading and Temperature Conditions Typical of Metal Cutting Processes. J. Manuf. Mater. Process. 2022, 6, 46. [Google Scholar] [CrossRef]
  34. ASTM G133-05; Standard Test Method for Linearly Reciprocating Ball-on-Flat Sliding Wear. ASTM International: West Conshohocken, PA, USA, 2016.
  35. Federici, M.; Straffelini, G.; Gialanella, S. Pin-on-Disc Testing of Low-Metallic Friction Material Sliding Against HVOF Coated Cast Iron: Modelling of the Contact Temperature Evolution. Tribol. Lett. 2017, 65, 121. [Google Scholar] [CrossRef]
  36. Morshed, A.; Wu, H.; Jiang, Z. A Comprehensive Review of Water-Based Nanolubricant. Lubricants 2021, 9, 89. [Google Scholar] [CrossRef]
  37. Mosleh, A.O.; Kotova, E.G.; Kotov, A.D.; Gershman, I.S.; Mironov, A.E. Bearing Aluminum-Based Alloys: Microstructure, Mechanical Characterizations, and Experiment-Based Modeling Approach. Materials 2022, 15, 8394. [Google Scholar] [CrossRef]
  38. Mathavan, J.; Patnaik, A. Analysis of wear properties of aluminium based journal bearing alloys with and without lubrication. In Proceedings of the Materials Science and Engineering, Bangalore, India, 14–16 July 2016. [Google Scholar] [CrossRef]
  39. Deuis, R.L.; Subramanian, C.; Yellup, J. Dry sliding wear of aluminium composites—A review. Compos. Sci. Technol. 1997, 57, 415–435. [Google Scholar] [CrossRef]
  40. Meyveci, A.; Karacan, I.; Caligulu, U.; Durmus, H. Pin-on-disc characterization of 2xxx and 6xxx aluminium alloys aged by precipitation age hardening. J. Alloys Compd. 2010, 491, 278–283. [Google Scholar] [CrossRef]
  41. Marimuthu, K.; Sornakumar, T. Friction and wear studies of die cast aluminum alloy-aluminum oxide-reinforced composites. Ind. Lubr. Tribol. 2010, 62, 361–371. [Google Scholar]
  42. Lutfar, M.; Zhang, L.C. An investigation into the friction and wear mechanisms of aluminium high silicon alloy under contact sliding. Wear 2017, 376, 940–946. [Google Scholar] [CrossRef]
  43. Wang, L.; Cai, J.; Zhou, J.; Duszczyk, J. Characteristics of the Friction Between Aluminium and Steel at Elevated Temperatures During Ball-on-Disc Tests. Tribol. Lett. 2009, 36, 183–190. [Google Scholar] [CrossRef]
  44. Edacherian, A.; Algahtani, A.; Tirth, V. Investigations of the Tribological Performance of A390 Alloy Hybrid Aluminum Matrix Composite. Materials 2018, 11, 2524. [Google Scholar] [CrossRef]
  45. Salguero, J.; Vazquez-Martinez, J.M.; Del Sol, I.; Batista, M. Application of Pin-On-Disc Techniques for the Study of Tribological Interferences in the Dry Machining of A92024-T3 (Al-Cu) Alloys. Materials 2018, 11, 1236. [Google Scholar] [CrossRef] [PubMed]
  46. Talibouya, E.C.; Rosa, M.; Sérgio, P.; Martins, R.; Martins da Cruz, M.P.; Ferreira, V. Investigation of the effects of skewness Rsk and kurtosis Rku on tribological behavior in a pin-on-disc test of surfaces machined by conventional milling and turning processes. Mater. Res. 2021, 24, e20200435. [Google Scholar] [CrossRef]
  47. Mia, M.; Anwar, S.; Yang, X. Development of interactive friction model for machining considering the instantaneous interfacial characteristics. J. Mater. Process. Technol. 2023, 322, 118203. [Google Scholar] [CrossRef]
  48. Hashiguchi, K.; Ozaki, S. Constitutive equation for friction with transition from static to kinetic friction and recovery of static friction. Int. J. Plast. 2008, 24, 2102–2124. [Google Scholar] [CrossRef]
  49. Coban, A.; Boyaci, S. The Calculation of Kinetic and Static Friction Coefficient and Friction Graph Analysis Using Arduino. Phys. Educ. 2020, 56, 013003. [Google Scholar] [CrossRef]
  50. Tocci, M.; Pola, A.; Girelli, L.; Lollio, F.; Montesano, L.; Gelfi, M. Wear and Cavitation Erosion Resistance of an AlMgSc Alloy Produced by DMLS. Metals 2019, 9, 308. [Google Scholar] [CrossRef]
  51. Gnanamoorthy, R. Development of a fretting wear test rig and preliminary studies for understanding the fretting wear properties of steels. Mater. Des. 2006, 27, 141–146. [Google Scholar] [CrossRef]
  52. Leiro, A.; Kankanala, A.; Vuorinen, E.; Prakash, B. The tribological behaviour of carbide-free bainitic steel under rolling/sliding conditions. Wear 2011, 273, 2–8. [Google Scholar] [CrossRef]
  53. Wu, J.M.; Lin, S.J.; Yeh, J.W.; Chen, S.K.; Huang, Y.S.; Chen, H.C. Adhesive wear behavior of AlxCoCrCuFeNi high-entropy alloys as a function of aluminum content. Wear 2006, 261, 513–519. [Google Scholar] [CrossRef]
  54. Wen, Q.; Liu, M.; Zhang, Z.; Sun, Y. Experimental Investigation into the Friction Coefficient of Ball-on-Disc in Dry Sliding Contact Considering the Effects of Surface Roughness, Low Rotation Speed, and Light Normal Load. Lubricants 2022, 10, 256. [Google Scholar] [CrossRef]
  55. Krbata, M.; Eckert, M.; Majerik, J.; Barenyi, I. Wear Behaviour of High Strength Tool Steel 90MnCrV8 in Contact with Si3N4. Metals 2020, 10, 756. [Google Scholar] [CrossRef]
  56. Orasanu, N.; Voicu, G.; Ungureanu, N. Determination of the static and dynamic friction coefficients for the milling products and their variation with respect to some parameter. In Proceedings of the OPROTEH Conference, Bacau, Romania, 22–24 October 2009. [Google Scholar]
  57. Maculotti, G.; Goti, E.; Genta, G.; Mazza, L.; Galetto, M. Uncertainty-based comparison of conventional and surface topography-based methods for wear volume evaluation in pin-on-disc tribological test. Tribol. Int. 2021, 165, 107260. [Google Scholar] [CrossRef]
  58. Torres, A.; Hernandez, A.; García-Atance, G.; Viesca, J.L.; Gonzalez, R.; Hadfield, M. Use of optical profilometry in the ASTM D4172 standard. Wear 2011, 271, 2963–2967. [Google Scholar] [CrossRef]
  59. Neis, P.D.; Ferreira, N.F.; da Silva, F.P. Comparison between methods for measuring wear in brake friction materials. Wear 2014, 319, 191–199. [Google Scholar] [CrossRef]
  60. Tomovich, S.; Peng, Z.; Yuan, C.; Yan, X.P. Quantitative Surface Characterisation Using Laser Scanning Confocal Microscopy. In Laser Scanning, Theory and Applications; Intechopen: London, UK, 2011. [Google Scholar] [CrossRef]
  61. Conroy, M.; Armstrong, J. A comparison of surface metrology techniques. J. Phys. Conf. Ser. 2005, 13, 458. [Google Scholar] [CrossRef]
  62. Klapetek, P.; Valtr, M.; Bursik, P. Non-equidistant scanning approach for millimetre-sized SPM measurement. Nanoscale Res. Lett. 2012, 7, 213. [Google Scholar] [CrossRef] [PubMed]
  63. Ansari, M.; Hazrati, I.A.; Esmailzadeh, E.; Azadi, S. Wear Rate Estimation of Train Wheels Using Dynamic Simulations and Field Measurements. Veh. Syst. Dyn. 2008, 46, 739–759. [Google Scholar] [CrossRef]
  64. Villanueva, E.; Vicario, I.; Albizuri, J.; Arruebarrena, G.; Guraya, T. Wear properties of a new Al80Mg10Si5Cu5 multicomponent alloy. Wear 2024, 15, 558–559. [Google Scholar] [CrossRef]
  65. Lehmhus, D. Advances in Metal Casting Technology: A Review of State of the Art, Challenges and Trends—Part I: Changing Markets, Changing Products. Metals 2022, 12, 1959. [Google Scholar] [CrossRef]
  66. Sharma, P.; Dwivedi, V.K.; Dwivedi, S.P. Development of high entropy alloys: A review. Mater. Today Proc. 2021, 43, 502–509. [Google Scholar] [CrossRef]
  67. UNE-EN ISO 1706:2020+A1:2021; Aluminio y Aleaciones de Aluminio. Piezas Moldeadas. Composición Química y Características Mecánicas. Asociación Española de Normalización: Génova, Spain, 2022.
  68. Otarawanna, S.; Gourlay, C.; Laukli, H.I.; Dahle, A.K. Formation of the surface layer in hypoeutectic Al-alloy high-pressure die castings. Mater. Chem. Phys. 2011, 130, 251–258. [Google Scholar] [CrossRef]
  69. ASTM G99-17; Standard Test Method for Wear Testing with a Pin-on-Disk Apparatus. ASTM International: West Conshohocken, PA, USA, 2023.
  70. Timelli, G.; Fabrizi, A.; Vezzù, S.; De Mori, A. Design of Wear-Resistant Diecast AlSi9Cu3(Fe) Alloys for High-Temperature Components. Metals 2020, 10, 55. [Google Scholar] [CrossRef]
  71. Ghazali, J.; Rainfoth, W.M.; Omar, M.Z. A comparative study of mechanically mixed layers (MMLs) characteristics of commercial aluminium alloys sliding against alumina and steel sliders. J. Mater. Process. Technol. 2008, 201, 662–668. [Google Scholar] [CrossRef]
  72. Lee, S.J.; Sohn, Y.C.; Kim, C.L. Tribological Effects of Water-Based Graphene Lubricants on Graphene Coatings. Materials 2023, 16, 197. [Google Scholar] [CrossRef] [PubMed]
  73. Vanna, K.; Venkata, A.; Lumley, R.; Horacio, C. The Skin Effect in High Pressure Die Casting Al Alloys. In Proceedings of the 12th International Conference on Aluminium Alloys, Yokohama, Japan, 5–9 September 2010; pp. 687–692. [Google Scholar]
  74. Khonsari, M.; Ghatrehsamani, S.; Akbarzadeh, S. On the running-in nature of metallic tribo-components: A review. Wear 2021, 474–475, 203871. [Google Scholar] [CrossRef]
  75. Devenport, T.M.; Griffin, J.M.; Rolfe, B.F.; Pereira, M.P. Friction and Wear in Stages of Galling for Sheet Metal Forming Applications. Lubricant 2023, 11, 288. [Google Scholar] [CrossRef]
  76. Pongen, R.; Kumar, A.; Parthiban, P. Study of microstructure and mechanical properties of A713 aluminium alloy having an addition of grain refiners Al-3.5 Ti-1.5C and Al-3Cobalt. Results Phys. 2019, 13, 102105. [Google Scholar] [CrossRef]
  77. Alkhafaji, A.; Camas, D.; Lopez-Crespo, P.; Al-Asadi, H.; Han, J.G.G.; Hori, M. The Influence of Tool Geometry on the Mechanical Properties and the Microstructure of AA6061-T6 Aluminum Alloy Friction Stir Spot Welding. Materials 2023, 16, 4135. [Google Scholar] [CrossRef]
  78. Yunyou, J.; Xiuyan, L. The Microstructure Evolution in Early Running-in Stage and its Effect on the Friction Behavior in 304 Stainless Steel. Tribology 2018, 38, 37–43. [Google Scholar] [CrossRef]
  79. Shaikh, A. Friction and Wear Measurement Techniques; Modern Tribology Handbook, CRC Press: Boca Raton, FL, USA, 2001; p. 13. [Google Scholar]
  80. Kar, S.; Sahu, B.B.; Kousaka, H. Study of the effect of normal load on friction coefficient and wear properties of CNx thin films. AIP Adv. 2020, 10, 065214. [Google Scholar] [CrossRef]
  81. Behrens, B.A.; Bouguecha, A.; Vucetic, M.; Chugreev, A. Advanced Wear Simulation for Bulk Metal Forming Processes. In Proceedings of the NUMIFORM 2016: The 12th International Conference on Numerical Methods in Industrial Forming Processes, Troyes, France, 4–7 July 2016; Volume 80, p. 04003. [Google Scholar]
  82. Ghatrehsamani, S.; Akbarzadesh, S.; Khonsari, M.M. Experimentally verified prediction of friction coefficient and wear rate during running-in dry contact. Tribol. Int. 2022, 170, 107508. [Google Scholar] [CrossRef]
  83. Bird, J.O.; Chivers, P.J. Engineering and Physical Science. In Newnes (An Imprint of Butterworth-Heinemann Ltd.); Pocket Book: Lugano, Switzerland, 1993; pp. 235–237. [Google Scholar]
  84. Liu, D.; Luo, J. Energy dissipation through phonon and electron behaviors of superlubricity in 2D materials. In Superlubricity, 2nd, ed.; Elsevier: Amsterdam, The Netherlands, 2021; pp. 145–166. [Google Scholar] [CrossRef]
  85. Erbas, K.C. On the Newtonian Thermal Analysis of Casting: A Critical Aproach. J. Eng. Sci. 2014, 7, 47–60. [Google Scholar] [CrossRef]
  86. Villanueva, E.; Vicario, I.; Sanchez, J.M.; Albizuri, J.; Montero, J. Solid Fraction Determination at the Rigidity Point by Advanced Thermal Analysis. Appl. Sci. 2021, 12, 237. [Google Scholar] [CrossRef]
  87. Emadi, D.; Laurence, W.; Djurdjevic, M.B.; Witold, K.; Sokolowski, J.H. Comparison of Newtonian and Fourier thermal analysis techniques for calculation of latent heat and solid fraction of aluminum alloys. J. Met. 2004, 10, 91–106. [Google Scholar] [CrossRef] [PubMed]
  88. Rafalski, I.V.; Arabey, A.; Lushchik, P.; Chaus, A. Computer Modeling of Cast Alloys Solidification by Computer-Aided Cooling Curve Analysis; International Doctoral Seminar, Proceedings; Alumni Press: Trnava, Slovakia.
  89. Hemminger, W.F.; Sarge, S.M. The Baseline Construction and Its Influence On The Measurement Of Heat With Differential Scanning Calorimeters. J. Therm. Anal. Calorim. 1991, 37, 1455–1477. [Google Scholar] [CrossRef]
  90. Tanski, T.; Snopinski, P.; Roszak, M.; Rusz, S.; Palcek, P. Thermal, structure and phases analysis of the aluminium ENAC-AlMg5Si2Mn alloy. Mater. Sci. Eng. 2015, 22, 54–65. [Google Scholar]
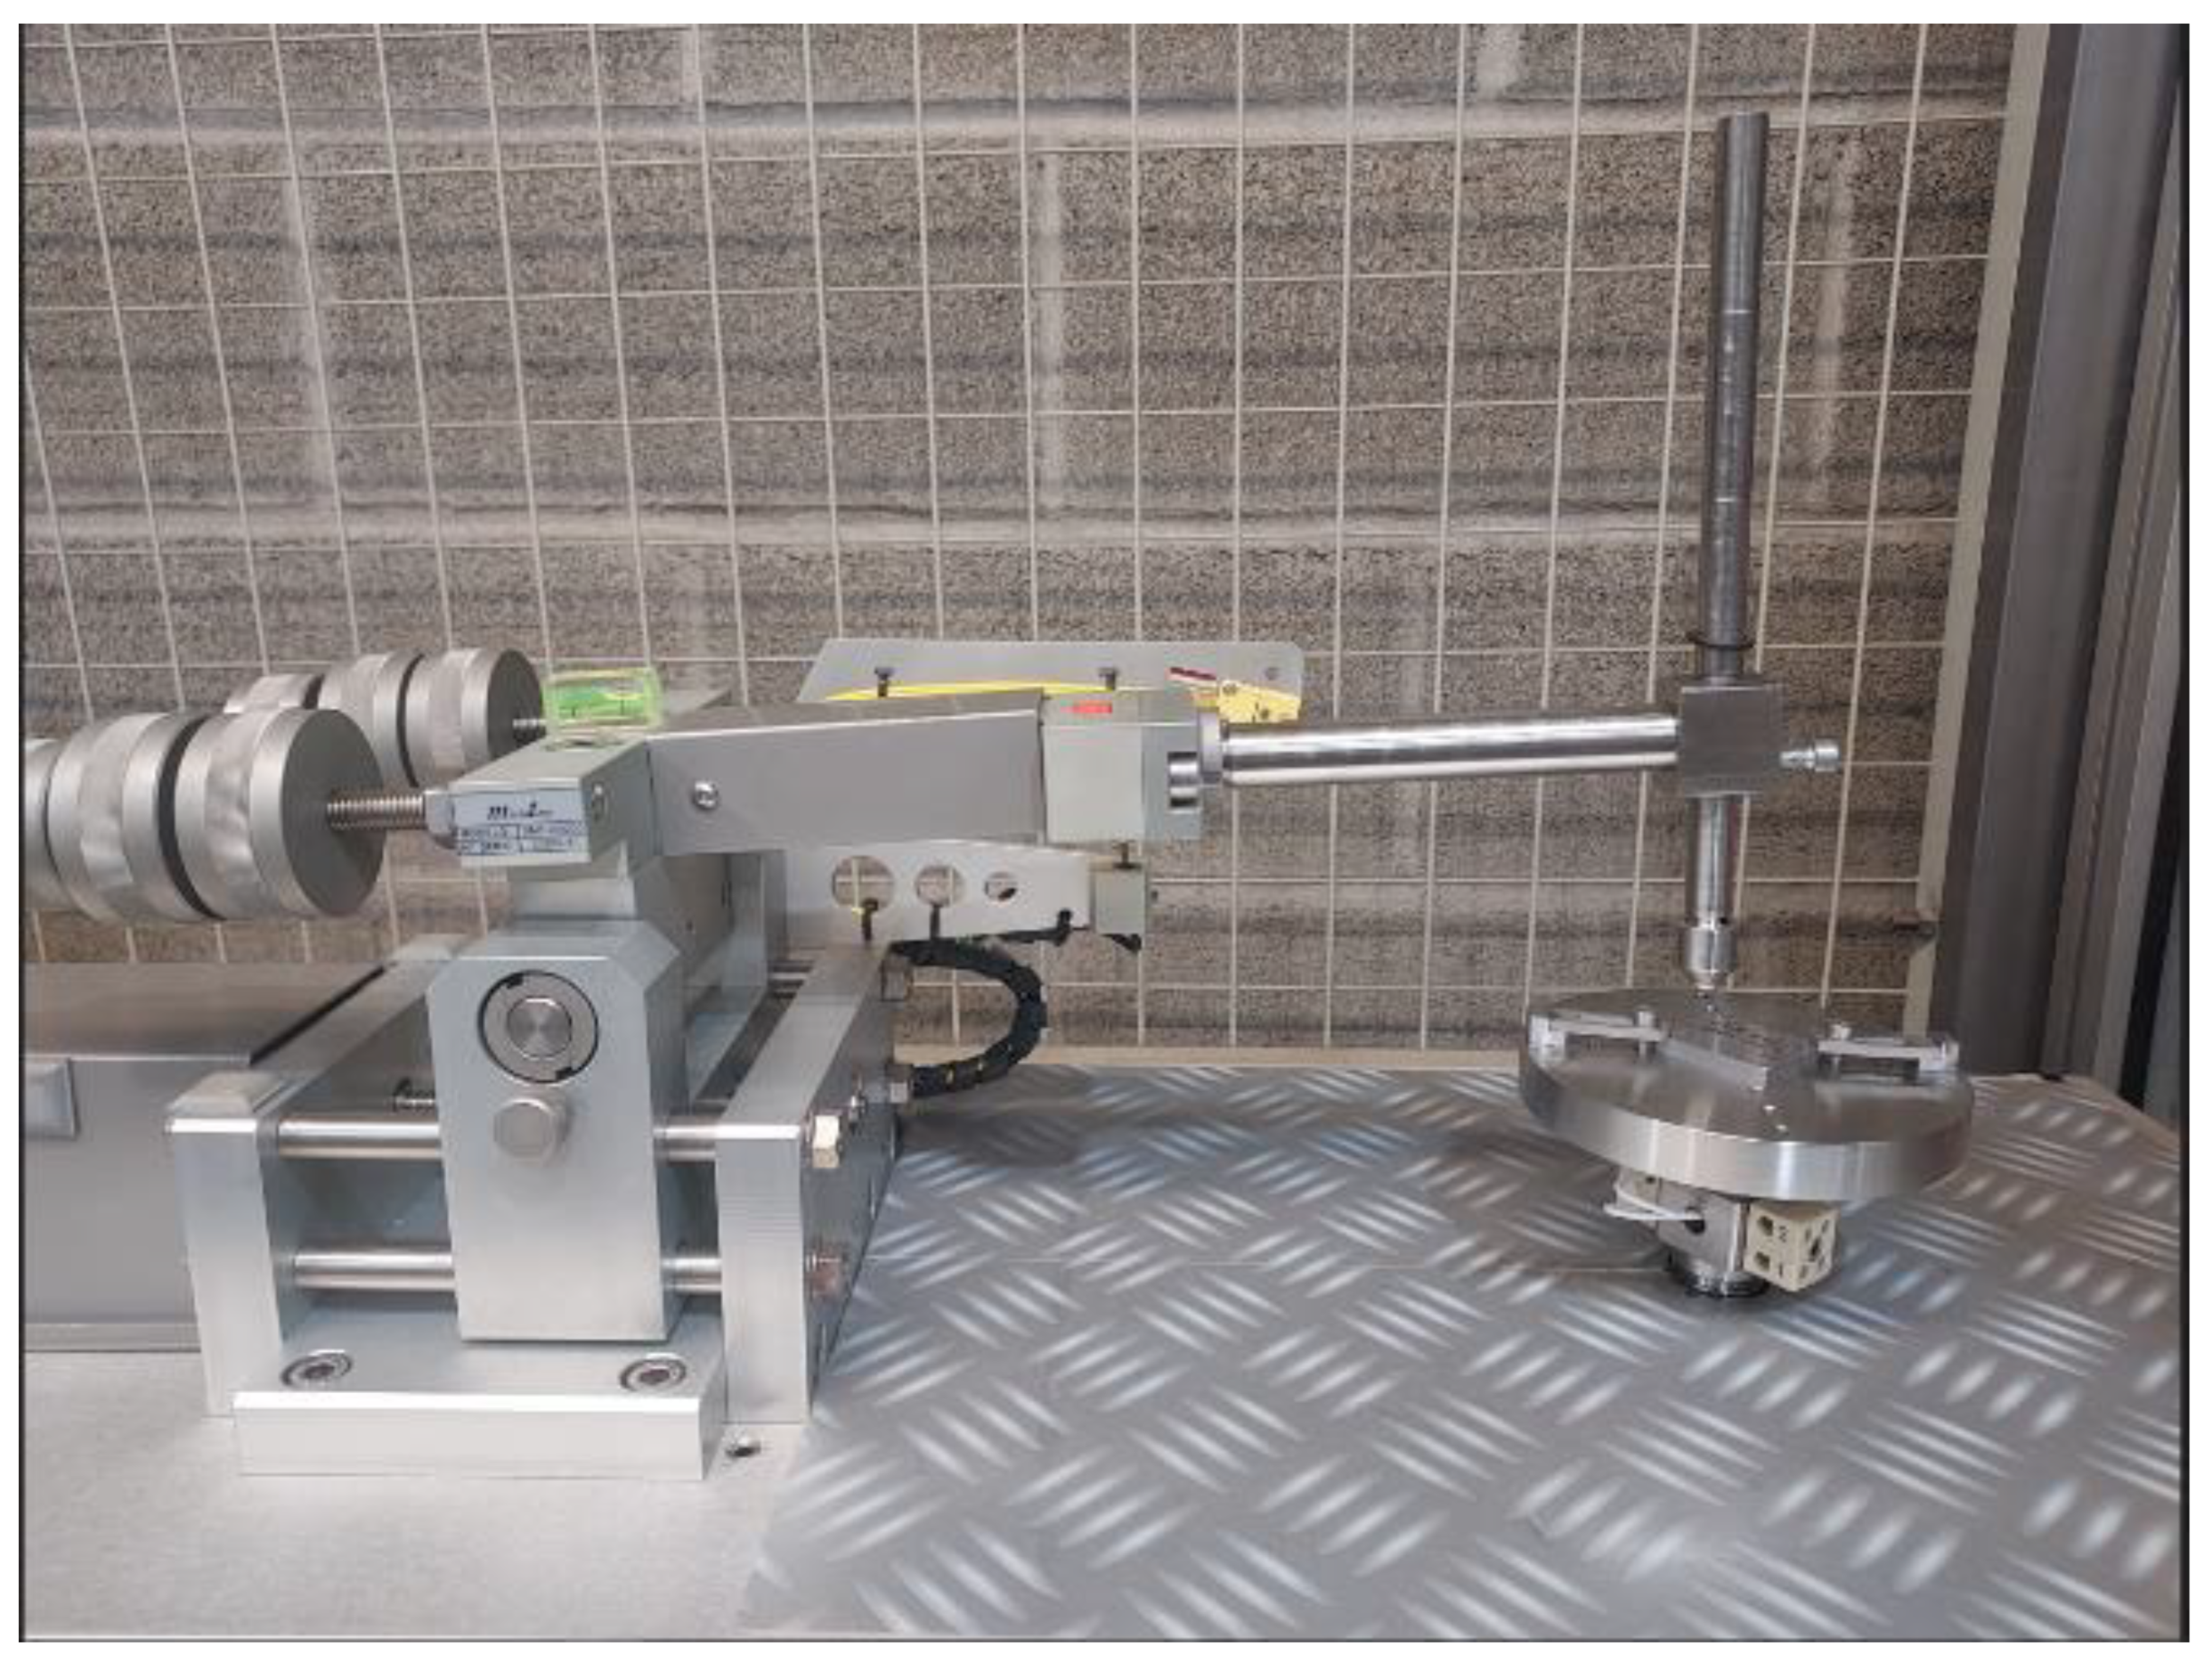
Figure 1. Detail of tribometer employment and their components.
Jmmp 09 00006 g001
Figure 2. Detail of wearing surface topography.
Jmmp 09 00006 g002
Figure 3. OM micrographs of Al80Mg10Si5Cu5 by HPDC, highlighting the surface layer and interior differences: (a) ×50, (b) ×100.
Jmmp 09 00006 g003
Figure 4. Friction coefficient curve of experimental alloys.
Jmmp 09 00006 g004
Figure 5. Friction coefficient curve segmented into Stages.
Jmmp 09 00006 g005
Figure 6. Friction coefficient curve of experimental alloys Stage 0 and Stage 1.
Jmmp 09 00006 g006
Figure 7. Friction coefficient curve of experimental alloys, Stage 2.
Jmmp 09 00006 g007
Figure 8. Friction coefficient curve of experimental alloys, Stage 3.
Jmmp 09 00006 g008
Figure 9. Application of zero baseline curve on friction curves, method 1.
Jmmp 09 00006 g009
Figure 10. Application of zero baseline curve on friction curves, method 2.
Jmmp 09 00006 g010
Figure 11. Correlation between the calculated wear ratio values and the wear rate obtained.
Jmmp 09 00006 g011
Figure 12. Three-dimensional topography determined: (left) at 20 m and (right) at 500 m.
Jmmp 09 00006 g012
Table 1. Chemical composition (wt.%) of Al80Mg10Si5Cu5 and AlSi9Cu3.
ReferenceAlSiFeCuMnMgZn
Al80Mg10Si5Cu578.95.60.34.70.110.30.1
AlSi9Cu387.28.30.62.40.20.20.7
Table 2. BOD test parameters.
Test ParametersValue
Load (N)15.0
Velocity (m/s)0.1
Rotation Speed (rpm)127.3
Sliding distance (m)500.0
Track diameters (mm)15
EnvironmentDry air
Table 3. Hardness values (HV3) of experimental alloys.
ReferenceHV3
As-cast Al80Mg10Si5Cu5 with layer136 ± 5
As-cast Al80Mg10Si5Cu5 without layer130 ± 13
HT-Al80Mg10Si5Cu5 with layer125 ± 6
HT-Al80Mg10Si5Cu5 without layer114 ± 12
As-cast AlSi9Cu3 with layer114 ± 5
As-cast AlSi9Cu3 without layer95 ± 7
Table 4. Maximum and steady-state friction coefficient values.
Referenceµmaxµsteady-state
As-cast Al80Mg10Si5Cu5 with a layer0.52 ± 0.010.38 ± 0.006
As-cast Al80Mg10Si5Cu5 without layer0.63 ± 0.120.38 ± 0.008
Thermal-treated Al80Mg10Si5Cu5 with layer0.64 ± 0.150.38 ± 0.008
Thermal-treated Al80Mg10Si5Cu5 without layer0.57 ± 0.080.39 ± 0.007
As-cast AlSi9Cu3 with layer0.62 ± 0.030.38 ± 0.003
As-cast AlSi9Cu3 without layer0.61 ± 0.040.39 ± 0.019
Table 5. Values for wear coefficient rate of experimental alloys.
ReferenceK (mm3/N.m)
As-cast Al80Mg10Si5Cu5 with layer4.90 × 10−4 ± 0.39
As-cast Al80Mg10Si5Cu5 without layer9.86 × 10−4 ± 0.19
HT-Al80Mg10Si5Cu5 with layer1.10 × 10−3 ± 0.43
HT-Al80Mg10Si5Cu5 without layer1.34 × 10−3 ± 0.63
As-cast AlSi9Cu3 with layer6.90 × 10−4 ± 0.01
As-cast AlSi9Cu3 without layer1.61 × 10−3 ± 0.16
Table 6. Values for areas calculated from friction curves.
ReferenceTotal Area (Units Area)Area Under 20 m (Units Area)Area Under 20 m (%)Ratio
Total Area
Ratio Area Under 20 m
As-cast Al80Mg10Si5Cu5 with layer1.8827741.001.00
As-cast AlSi9Cu3 with layer1.9018041.011.40
As-cast Al80Mg10Si5Cu5 without layer1.9198851.022.00
HT-Al80Mg10Si5Cu5 with layer2.0039351.062.30
HT-Al80Mg10Si5Cu5 without layer2.01010651.072.70
As-cast AlSi9Cu3 without layer2.07010851.102.90
Table 7. Comparison of determined and calculated wear rates.
ReferenceK (mm3/N.m)Ratio Total AreaRatio Area Under 20 m
As-cast Al80Mg10Si5Cu5 with layer4.90 × 10−41.001.00
As-cast AlSi9Cu3 with layer6.90 × 10−41.011.40
As-cast Al80Mg10Si5Cu5 without layer9.86 × 10−41.022.00
Thermal-treated Al80Mg10Si5Cu5 with layer1.10 × 10−31.062.30
Thermal-treated Al80Mg10Si5Cu5 without layer1.34 × 10−31.072.70
As-cast AlSi9Cu3 without layer1.61 × 10−31.102.90
Disclaimer/Publisher’s Note: The statements, opinions and data contained in all publications are solely those of the individual author(s) and contributor(s) and not of MDPI and/or the editor(s). MDPI and/or the editor(s) disclaim responsibility for any injury to people or property resulting from any ideas, methods, instructions or products referred to in the content.