Article

Feasibility Study on Laser Powder Bed Fusion of Ferritic Steel in High Vacuum Atmosphere

Materials Testing Institute, University of Stuttgart, Pfaffenwaldring 32, 70569 Stuttgart, Germany
*
Author to whom correspondence should be addressed.
J. Manuf. Mater. Process. 2025, 9(3), 101; https://doi.org/10.3390/jmmp9030101
Submission received: 8 February 2025 / Revised: 7 March 2025 / Accepted: 16 March 2025 / Published: 18 March 2025

Abstract

:
The boiling point of metals is dependent on the ambient pressure. Therefore, in laser-based fusion welding and additive manufacturing processes, the resulting process regime, ranging from heat conduction welding to the keyhole mode, is also influenced by the process pressure. While laser welding deliberately uses reduced process pressures to achieve the keyhole mode with a lower laser power input as well as a more stable keyhole, there are no positive findings on the laser powder bed fusion process (PBF-LB/M) under vacuum conditions so far. Furthermore, the literature suggests that the process window is significantly reduced, particularly in the high vacuum regime. However, this work demonstrates that components made of the ferritic steel 22NiMoCr3-7 can be successfully manufactured at low process pressures of 2   ×   10 2   mbar using a double-scanning strategy. The strategy consists of a first scan with a defocused laser beam, where the powder is preheated and partially sintered, followed by a second scan with a slightly defocused laser beam, in which the material within a single layer is completely melted. To test this manufacturing strategy, 16 test cubes were manufactured to determine the achievable relative densities and tensile specimens were produced to assess the mechanical properties. Metallographic analysis of the test cubes revealed that relative densities of up to 98.48 ± 1.43% were achieved in the test series with 16 different process parameters. The tensile strength determined ranged from 722 to 724 MPa. Additionally, a benchmark part with complex geometric features was successfully manufactured in a high vacuum atmosphere without the need for a complex parameterization of individual part zones in the scanning strategy.

1. Introduction

In the PBF-LB/M process, an atmospheric pressure of around p     10 3   mbar is typically used as the process pressure. To prevent oxidation of the powder, the melt pool and the manufactured parts, a shielding gas atmosphere (typically argon or nitrogen) is employed [1]. Additionally, the shielding gas is circulated, filtered and guided over the powder bed, forming a homogeneous and laminar flow profile. The purpose of the shielding gas circulation is to transport spatter, metal condensates and other byproducts generated during the melting process out of the build chamber, preventing them from being incorporated into the part or from interacting with the laser beam, weakening it and thereby destabilizing the process [2]. The interaction between the laser beam and powder bed, the formation of the resulting melt pool and its subsequent solidification have a significant influence on the microstructure of the manufactured part. The goal is to fuse the loose powder particles into a solid part with the highest possible relative density through localized melting and solidification. Key process parameters include the laser power P, the scanning speed v, the thickness of the applied powder layer t L and the distance between adjacent laser paths (hatch distance) h. The combination of these four process parameters allows for a simplified quantification of the energy input into the powder bed in the form of the volumetric energy density E V [3]:
E V = P v · h · t L
The laser power P is often only related to the scanning speed v, which is referred to as linear energy density E L [4].
E L = P v
Basically, three process regimes can be distinguished in PBF-LB/M with regard to the energy input. Insufficient energy input results in incomplete melting of the powder bed or weak bonding between the current melt pool, the adjacent remelted hatches and/or the previous layer. This results in irregularly shaped, large pores, which significantly impair part quality and, in particular, mechanical properties. These are known as lack of fusion pores due to the cause of their formation. If too much energy is applied, keyholes form and collapse irregularly. Gas can be trapped when the keyhole collapses. The resulting large and mostly round pores are referred to as keyhole pores in the literature. These also have a detrimental effect on part quality, especially on mechanical properties. Between these two process regimes, there is a transition regime with moderately high energy input, suitable for manufacturing parts with high relative density and, therefore, good mechanical properties [5,6]. However, metal evaporation also occurs in the transition regime, as the center of the melt pool is heated above the evaporation temperature of the metal [7,8]. Furthermore, due to the decrease in gas solubility during the transition from the liquid to the solid state, spherical pores with diameters of a few micrometers can form. These small pores are known as gas pores and are hardly avoidable in PBF-LB/M [9].
A less considered process influence is the so-called powder denudation, a direct result of metal evaporation. The metal expands significantly during evaporation and forms a jet of metal vapor that moves away from the melt pool at a high velocity, perpendicular to its surface. This metal vapor jet induces an additional flow in the otherwise uniform shielding gas flow. The induced gas flow moves radially toward the metal vapor jet and then parallel to it (see Figure 1a). If the induced flow is strong enough, it can entrain particles from the powder bed, which are either fed into the melt pool or ejected with the metal vapor jet [7,10,11]. Some of the ejected particles are melted in the metal vapor jet and contribute significantly to spatter formation in the PBF-LB/M process [12,13]. As a result of the induced gas flow, powder denudation can occur in the vicinity of the melt pool [7,10,11]. The temperature and velocity of the metal vapor jet increase with increased laser power P, resulting in a higher velocity of the induced gas flow.
In laser welding, reducing the process pressure results in advantages in terms of process stability, a reduction in spattering behavior and the energy required to achieve the keyhole mode [14]. At slow scanning speeds, an increase in keyhole depth can be achieved by reducing the process pressure with the same energy input or an equally high keyhole depth with a lower energy input [14,15]. This is due to the lower evaporation temperature T v at low process pressure compared to atmospheric pressure. However, despite some similarities between laser welding and PBF-LB/M in the literature, recently conducted investigations at the Materials Testing Institute of the University of Stuttgart indicate that the advantages observed for laser welding in a vacuum cannot be directly transferred to the PBF-LB/M process [11,16,17,18].
The main reason for this is that the degree of denudation increases significantly with reduced process pressure, under otherwise unchanged process conditions. Figure 1 schematically visualizes the results of single-line experiments conducted by Bidare et al. with 316L and a self-built PBF-LB/M system under sub-atmospheric process pressures [16]. Initially, the decrease in process pressure results in an increase in the velocity of the induced gas flow, leading to a higher degree of denudation (Figure 1b). A further decrease in process pressure causes a greater spatial expansion of the metal vapor jet, which interacts with the induced gas flow and consequently leads to an expanded denudation zone (Figure 1c). At very low process pressures, there is no longer any induced gas flow and the metal vapor jet expands even further in all spatial directions, resulting in a very high degree of denudation (Figure 1d). Bidare et al. further note that the scanning speed influences whether powder particles are entrained into the melt pool and recommend a minimal process pressure of p = 5   ×   10 1   mbar for the PBF-LB/M process [16].
Figure 1. Schematic illustration of the denudation effect in PBF-LB/M at a process pressure of p = 10 3 mbar (a), p = 2   ×   10 1 mbar (b), p = 1 mbar (c) and p = 10 2 mbar (d). The top images present the perspective where the laser beam moves toward the viewer, while the bottom images depict the view where the laser beam travels to the left within the image plane. The illustration was created using the data published in [16].
Jmmp 09 00101 g001
Matthews et al. conducted single-line experiments with Ti6Al4V under varying process pressures and reported that at sub-atmospheric pressures, the width of the denudation zone can be several times the width of the melt track [17]. Kaserer et al. also conducted single-line experiments with two powder materials, Ti6Al4V and a maraging steel. For both materials, the amount of powder particles incorporated into the melt track decreases significantly with decreased process pressure, while at the same time, the amount of material ejected from the process zone increases considerably. Kaserer et al. therefore recommend a minimal process pressure of p = 2     ×   10 2 mbar [11].
Sato et al. conducted several studies with commercially pure titanium and Ti6Al4V under process pressures between p = 5   ×   10 5   mbar   and p = 10 4 mbar [19,20,21,22]. In these studies, they manufactured not only single lines but also whole layers with an area of A = 10 × 10 mm2 and stacks of up to 20 layers. Notably, the scanning speed was kept significantly lower ( v min = 5   mm / s , v max = 100   mm / s ) compared to typical manufacturing conditions ( v     800 1000   mm / s ) under atmospheric process pressure and with shielding gas flow. The very low scanning speed mitigates the formation of spatter, which seems to be beneficial to the process.
Zhou et al. also report the manufacturing of small specimens (20 × 20 × 10 mm3) from Ti6Al4V with a PBF-LB/M system under process pressures as low as p = 10 2   mbar using low scanning speeds [23]. A similar approach with low scanning speeds was used by Watanabe et al. to manufacture cuboids from Ti6Al4V with and without the addition of TiC nanoparticles, with dimensions of 7.5 × 7.5 × 5 mm3, under a process pressure of p = 2 × 10 4   mbar [24]. Nagahari et al. used the same manufacturing system capable of decreasing the process pressure down to p = 10 4   mbar to manufacture small specimens from IN718 in a vacuum atmosphere. They compared these specimens with ones manufactured under atmospheric process pressure conditions with shielding gas flow and found superior creep properties for the specimens manufactured under vacuum conditions. This was attributed to a coarser grain size and less contamination with oxygen [25].
Recent experiments at the Materials Testing Institute, University of Stuttgart, demonstrated the manufacturability of parts via PBF-LB/M under process pressures as low as p = 2 × 10 2   mbar using AISI 316L in a powder particle size fraction of 15–45 µm. This was achieved by employing a so-called double-scanning strategy. During the first scan, the fill pattern was executed in four consecutive passes, with every fourth line being drawn in each pass. The goal was to mitigate the effects of powder denudation. The second scan was used to smooth the surface and ensure good bonding with the underlying layers. This double-scanning strategy resulted in a maximum relative density of ϱ rel = 89 . 2 % and a maximum ultimate tensile strength of UTS = 446   ±   33   MPa [18]. However, the achieved values of relative density and tensile strength were significantly lower than those obtained via PBF-LB/M under atmospheric process pressures on the same manufacturing system [5].
In electron beam powder bed fusion of metals (PBF-EB/M), it is standard practice to preheat the entire powder bed in a first step before selectively melting the part geometry in a second step. For preheating, a highly defocused electron beam is used to partially sinter the powder particles in one or more passes. The purpose of sintering is to improve the electrical conductivity of the powder particles, thereby preventing excessive negative charging, which could lead to powder scattering due to Coulomb forces (powder smoking). In the second step, the sintered powder particles are melted using a focused electron beam [26,27].
In PBF-LB/M, the approach of preheating with a defocused laser beam is not well known or widely used. Achee et al. employed a preheating step with a defocused laser beam to mitigate the effects of denudation before melting single lines of Ti6Al4V with a focused laser beam under atmospheric pressure conditions. The energy density during preheating was varied by adjusting the number of passes. By selecting appropriate parameters for the preheating step, the effects of denudation were significantly reduced [28].
In this study, the feasibility of using a preheating step with a highly defocused laser beam to enable the manufacturing of parts in a vacuum atmosphere is investigated. In contrast to PBF-EB/M and the approach of Achee et al., preheating is performed in a single pass. Unlike in PBF-EB/M, this preheating process is limited to the areas of the powder bed that are melted in the second step. Therefore, this approach is still classified as a double-scanning strategy, with the first scanning referring to preheating and the second scanning referring to the melting of the powder.

2. Materials and Methods

2.1. PBF-LB/M System and Global Parameters

All experiments were conducted using the Evobeam SLaVAM 300 PBF-LB/M system for research and development (Evobeam GmbH, Niederolm, Germany). The system is equipped with a TruFiber2000 fiber laser (Trumpf SE + Co. KG, Ditzingen, Germany) with a wavelength of λ     1075   nm and a power range between P min = 60   W and P max = 2000   W , an intelliSCANse 30 scan head and a varioSCANde 40i focusing system (Scanlab GmbH, Puchheim, Germany). The optical configuration described above results in a laser beam diameter of approximately d B , min     0 . 061   mm in the focal plane. A schematic picture of the manufacturing system, including the focusing system, is shown in Figure 2a. By varying the ζ parameter of the focusing system, the position of the focal plane relative to the process plane, where powder is deposited by the recoater, can be adjusted. This results in a variation of the beam diameter d B in the process plane. Positive values of ζ shift the focal plane of the laser beam upwards, while negative values shift it downwards. In this study, positive values for ζ were consistently used. According to [29], this reduces sensitivity to heat input variations for larger beam diameters, thereby enhancing the overall stability of the PBF-LB/M process. The build plate can be preheated by a ceramic heating element. All investigations were conducted at a process pressure of p = 2 × 10 2   mbar . The combination of the Trivac D25B rotary slide pump and the TURBOVAC 450i turbomolecular pump (Leybold GmbH, Cologne, Germany) installed in the Evobeam SLaVAM 300 was used to achieve the vacuum. The set process pressure of p = 2   ×   10 5   mbar was maintained through a control loop involving the turbomolecular pump and a high-precision mass flow controller connected to an argon pressure bottle.

2.2. Material

The powder material used was 22NiMoCr3-7 with a particle size range of 15–45 μm. This ferritic-bainitic steel is closely related to ASTM A508 Class 2. It exhibits a fine-grained microstructure and was commonly used in Germany for pressure vessels in nuclear power plants [30]. The powder was gas-atomized by Höganäs (Höganäs AB, Höganäs, Sweden). The specification for the chemical composition as well as the chemical composition of the powder are provided in Table 1.
The first experiments on manufacturing 22NiMoCr3-7 parts via PBF-LB/M were conducted by Mally et al. Their investigations demonstrated that a broad range of parameter sets can achieve a relative density exceeding 99% when the material is processed at atmospheric process pressure in an argon atmosphere. Tensile specimens in the as-printed state exhibited an ultimate tensile strength (UTS) of approximately UTS 1230 MPa and a martensitic microstructure [31].
Table 1. Specification for the chemical composition in wt.-% [32] and chemical composition in wt.-% of the powder used in this study.
CSiMnCrMoNiPSCuSnAlVTaCoAs
min.0.170.100.500.250.500.60---------
max.0.250.351.000.500.751.000.0120.0150.100-0.050.050.030.03-
Powder0.190.220.930.280.510.670.0060.0040.0070.020.02<0.01<0.010.01-

2.3. Manufacturing

As established in the literature and previous experiments, it is generally not possible to apply the parameter sets developed for atmospheric pressure directly under vacuum conditions [18]. Therefore, preliminary experiments were conducted to develop an optimized base parameter set using a double-scanning strategy, incorporating laser beam defocusing in both the first and the second scanning step. The parameters for both scanning steps are presented in Table 2. For all experiments, the build plate was preheated to T = 300   ° C and the layer thickness was set to t L = 0 . 025   mm . The scan direction was rotated by 90° between the first and second scanning of each layer and by 67° between consecutive layers. Unless stated otherwise, a simple line scanning strategy was employed. Small test cubes with an edge length of 8 mm were manufactured to determine the achievable relative density. The base parameter set in Table 2 was determined through a trial-and-error approach. This involved systematically varying the laser power P, scanning speed v, hatch distance h, and beam diameter d B by adjusting the ζ parameter of the focusing system. Notably, Table 2 provides only the ζ parameter, as the exact relationship between the beam caustic and ζ has not yet been quantified for the Evobeam SLaVAM 300. Based on the results of single-track experiments on anodized aluminum plates, it is estimated that a value of ζ = 19 corresponds to a beam diameter of approximately d B = 0.25 mm, while ζ = 9 corresponds to approximately d B = 0.10 mm.
To evaluate the process window in which high relative densities can be achieved, a parameter variation was performed. Both the first and the second scans of the double-scanning strategy were examined. The minimum laser power of P min = 60   W was consistently applied during the variation of the first scan parameter, which aims to preheat and partially sinter the powder bed selectively. The corresponding process parameters are listed in Table 3. In two series of tests, the scanning speed (parameter sets 1-1 to 1-4) and hatch distance (parameter sets 1-5 to 1-8) were varied. For the second scan, parameter set 2-4 (P = 250 W, v = 1000 mm/s, h = 0.100 mm) was consistently used. When varying the parameters for the second scan, which is designed to completely melt the partially sintered powder, the effect of the hatch distance (parameter sets 2-1 to 2-4) is investigated in a first series of tests, as shown in Table 4. In a second test series, the influence of higher scanning speeds at a constant linear energy density E L (parameter sets 2-5 to 2-8) was examined to assess how the process responds to varying build rates. In all cases, parameter set 1-0 (P = 60 W, v = 1200 mm/s, h = 0.200 mm) was applied for the first scan.
For each of the 16 double-scanning parameter sets, one test cube (8 × 8 × 8 mm3) was manufactured. The test cubes were manufactured to first assess the feasibility of printing sample material in a vacuum atmosphere using the selected process parameters and, in a second step, to determine the achieved relative densities. They were attached directly to the build plate to mitigate process instabilities caused by support structures. In a second step, tensile specimens oriented along the build direction (0° polar angle) were manufactured using parameter set 1-0 for the first scan and 2-7 for the second scan. Tensile specimens were chosen to determine the mechanical properties, especially the ductility, as the ductility is dependent on the relative density. The tensile specimens were printed directly according to the geometry DIN 50125—A 6 × 30 and were not machined afterwards, only glass bead blasted. Instead of a simple linear filling pattern, a stripe filling with a width of 10 mm was used and the specimens were attached to the build plate with wedge-like support structures. In a third step, a self-developed benchmark part (dimensions: 60 × 60 × 56 mm3) with complex geometric features was manufactured using the same conditions as for the tensile specimens (parameter set 1-0 for the first scan, parameter set 2-7 for the second scan, stripe filling with a width of 10 mm and wedge-like support structures). The benchmark part is used in this study in order to determine, how suitable the double-scanning strategy is for manufacturing complex geometries, strongly deviating from simple shapes like test cubes or tensile specimens, and how suitable it is for printing larger parts in a high vacuum atmosphere. Additionally, it was used to assess the manufacturability of specific component features such as narrow gaps, thin walls, overhang angles, and cooling channels.

2.4. Analysis

To evaluate the relative density of the test cubes manufactured with the 16 double-scanning parameter sets, the method of image analysis of metallographic specimens was used. Each test cube was cut parallel to the build direction, hot mounted, ground and polished. Tile scans of the entire micrograph of each cube were recorded at a magnification of 50× using a Leica DM8000 M (Leica Microsystems GmbH, Wetzlar, Germany). The tile scans were analyzed using ImageJ (1.50d) to quantify the area percentage of defects of the test cubes. In order to exclude the influence of surface roughness, only the area inside the cube with a minimum edge distance of 0.3 mm was analyzed. To obtain additional information on the distribution of the relative density for each test cube, the resulting image area was divided into 6 × 6 sections of the same size, each covering an area of approximately 1.7 mm2. The area percentage of defects was calculated for each of these sections to determine the relative density of each section. The mean value of the relative density values of all 36 sections was calculated to determine the relative density of the entire test cube. The standard deviation of the relative densities of the 36 sections was also calculated to quantify the extent to which the relative density values vary within the cube, which can be used as an indicator for the overall process stability. The tensile specimens were tested using an MTS Sintech 65G (MTS Systems Corporation, Eden Prairie, MN, USA) universal testing machine in their as-built condition, according to DIN EN ISO 6892-1. Fracture surfaces of the tensile specimens and powder particles were examined with a TM4000Plus Tabletop SEM (Hitachi High-Tech Corporation, Tokyo, Japan). Additional images of the powder particles were obtained using optical microscopy with a Leica Aristomet (Leica Microsystems GmbH, Wetzlar, Germany).

3. Results

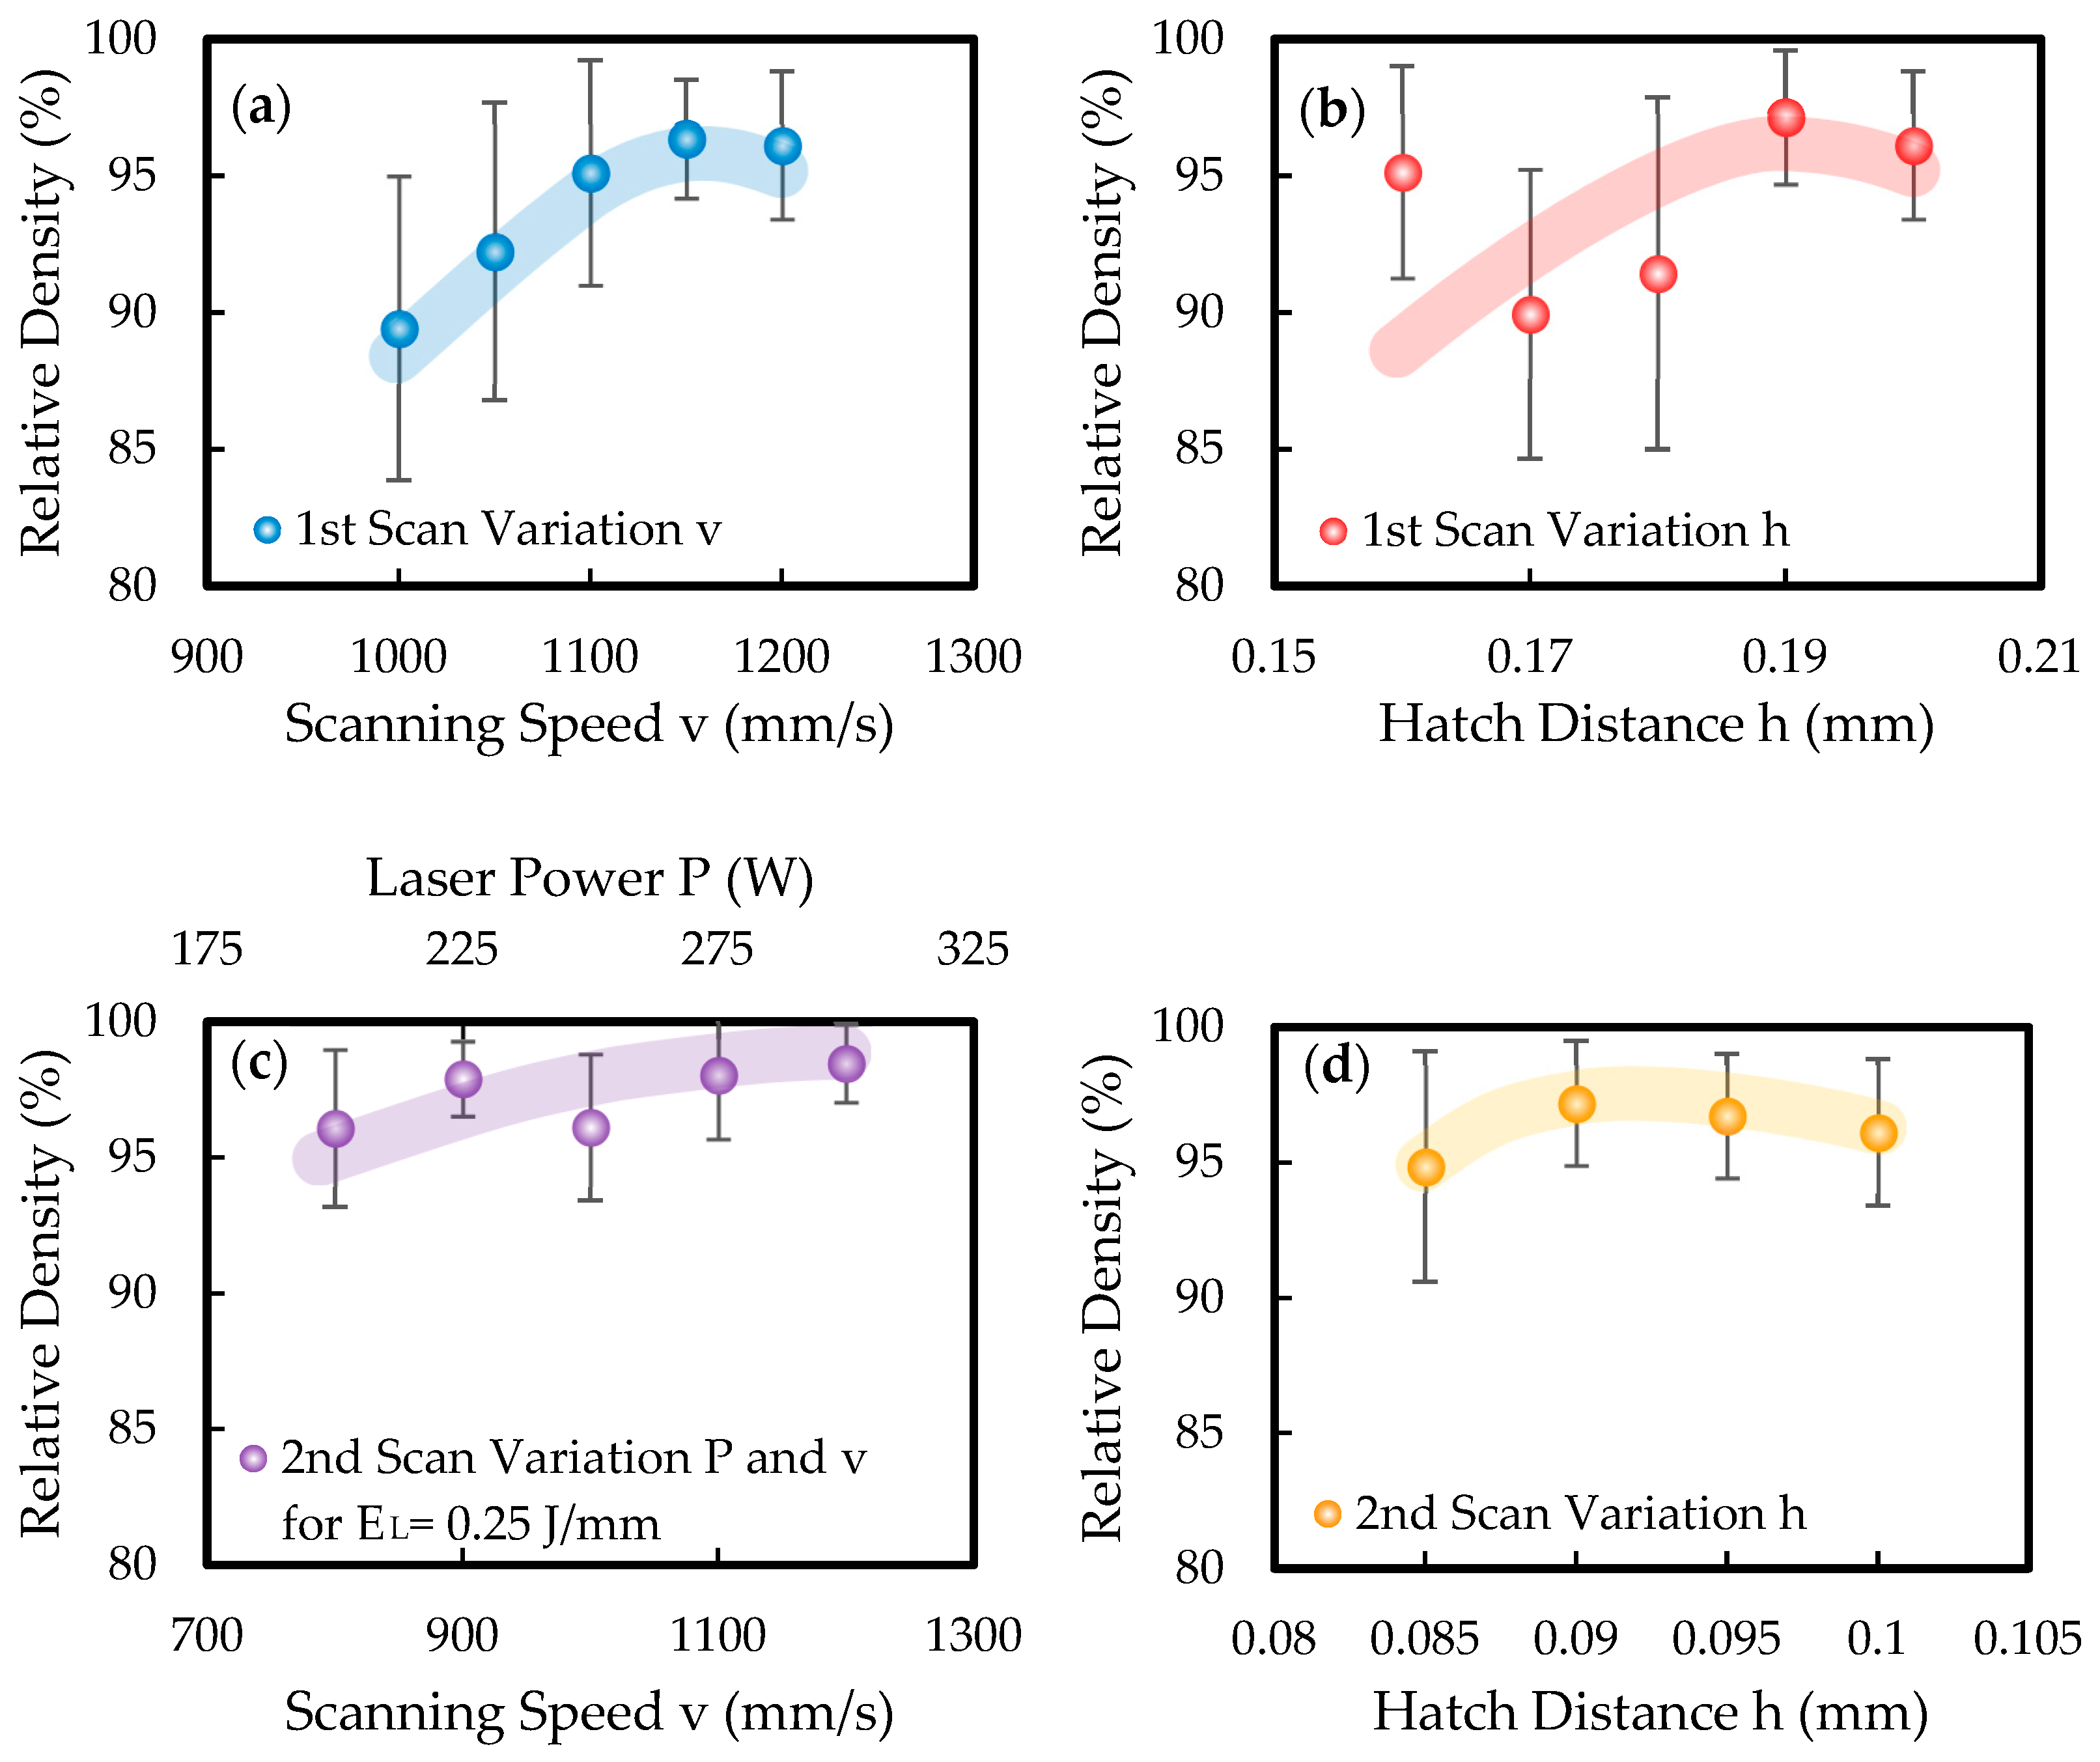
3.1. Relative Density Measurement

The results of the relative density measurements are summarized in Table 5. Determined values range from ϱ rel = 89.43 ± 5.57% (parameter set 1-1) to ϱ rel = 98.48 ± 1.43% (parameter set 2-8). The test cube manufactured with the base parameter set developed in the preliminary tests exhibits a relative density of ϱ rel = 96.12 ± 2.70%. Test cubes manufactured with variations of the first scan show relative density values ranging from ϱ rel = 89.43 ± 5.57% (parameter set 1-1) to ϱ rel = 97.14 ± 2.44% (parameter set 1-8), while test cubes manufactured with variations of the second scan exhibit relative density values ranging from ϱ rel = 94.85 ± 4.26% (parameter set 2-1) to ϱ rel = 98.48 ± 1.43% (parameter set 2-8). It can be concluded that, within the range of parameters investigated, the relative density is more sensitive to variations in the first scan. The relatively high standard deviations suggest that the local distribution of pores and lack of fusion defects in the test cubes are not homogeneous.
Figure 3 shows the relative density of the series of tests as a function of various process parameters. Parameter set 2-4, which serves as the base parameter set from which the parameter variations were derived, is included in all test series. The error bars represent the standard deviation within a single test cube and serve as an indicator of the process stability of the respective parameter sets. A lower standard deviation indicates higher process stability, while a higher standard deviation indicates greater instability.
Increasing the scanning speed within the range of v = 1000–1200 mm/s during the first scan results in a higher overall relative density, as shown in Figure 3a. Figure 3b shows the effect of varying the hatch distance h during the first scan. Although no clear trend is observed, the variation in relative density is greater for smaller hatch distances (h = 0.16–0.18 mm) compared to larger hatch distances. For the laser beam diameter used, a low volumetric energy density of approximately E V = 10.5 J/mm3 represents an upper limit for the first scan. Higher E V values induce inhomogeneities in the partially sintered powder bed, which increase the likelihood of lack-of-fusion defects. When both laser power P and scanning speed v are increased at a constant linear energy density of E L = 0 . 25   J / mm , higher values of P and v result in higher relative densities within the investigated range, as shown in Figure 3c. Figure 3d shows the effect of the hatch distance in the second scan. The highest relative densities were achieved for hatch distances in the range of h = 0.090–0.095 mm. The given standard deviations refer only to the variation of the density inside one cube, which can be seen as an indicator of the process stability but does not allow for statistical analysis of the differences in relative densities between different parameter sets.
Figure 4 shows representative micrographs for the test cubes printed with parameter sets 1-3 and 2-7, which yielded relative density values of ϱ rel = 95.12 ± 4.11% and ϱ rel = 98.04 ± 2.36%, respectively. Figure 4b,e show tile scans of the entire micrographs of these two test cubes, while Figure 4a,d depict representative areas at a higher magnification. Figure 4c,f display a heat map illustrating the relative density distribution across the entire tile scan. The heat map was created by dividing each tile scan into 12 × 13 individual images, each measuring 0.6 mm in height and 0.65 mm in width. The area fraction of process defects in each of these regions was determined and color-coded.
Three distinct types of defects can be identified. The first type consists of small spherical pores, which have a significantly smaller diameter than the other defects. These pores are evenly distributed throughout the micrograph and are likely to be gas pores. The other two types are lack of fusion defects, which are further subdivided into defects located within a single layer or at the boundary between two layers, and those that extend across more than two layers, referred to as major binding defects. Figure 4d primarily shows defects with elongation perpendicular to the build direction. These resemble lack of fusion defects caused by insufficient energy input, which are well documented in the literature for processes conducted at atmospheric process pressure. Their width ranges from approximately 50 to 250 µm, and their height, in the build direction, ranges from about 5 to 50 µm. Figure 4e shows major binding defects, which have a width of approximately 150 to 1000 µm and a height of 120 to 350 µm. A comparison between Figure 4b and Figure 4e reveals that both lack of fusion and major binding defects are present in both test cubes. However, the test cube manufactured with parameter set 1-3 exhibits a significantly higher number of major binding defects. The heat maps of relative density distribution in Figure 4c,f show variations in relative density depending on the position within the cube. For both test cubes, the upper portion of the cube exhibits higher relative density values, which can be attributed to a decreasing number of major binding defects with increasing build height. This phenomenon is also observed in the micrographs of the other test cubes. In the test cube manufactured with parameter set 2-7, major binding defects accumulate at a height of 3 to 4 mm above the build plate.

3.2. Tensile Testing

Figure 5 shows the stress–strain curves of the tensile tests conducted in this study. The data from the tensile test specimens manufactured under conventional conditions using PBF-LB/M by Mally et al. [31] are provided as a reference for comparison. The two specimens from [31] were printed at atmospheric process pressure with argon as shielding gas. One specimen was tested as-printed, and the other was tested after a subsequent heat treatment. The aim of the heat treatment was to achieve microstructural characteristics and mechanical properties similar to those of the forged material. Further details can be found in [31]. It should be noted that a different specimen geometry was used in their tests (DIN 50125—B 8 × 40).
Table 6 summarizes the results of the tensile tests. The two specimens manufactured in a vacuum exhibit very similar mechanical properties, with a yield strength of YS1 = 659 MPa and YS2 = 656 MPa and an ultimate tensile strength of UTS1 = 724 MPa and UTS2 = 722 MPa. The elongation at break for specimen 1 and specimen 2 is A1 = 14% and A2 = 12%, respectively. The as-printed tested specimen manufactured in an argon shielding gas atmosphere has a significantly higher ultimate tensile strength of UTSMally,noHT = 1233 MPa compared to the specimens manufactured in a vacuum atmosphere. In terms of strength, the vacuum specimens are comparable to the specimen that underwent subsequent heat treatment. However, they exhibit lower elongation at the maximum load point and a reduced elongation at break, which can likely be attributed to the high number of lack of fusion defects.

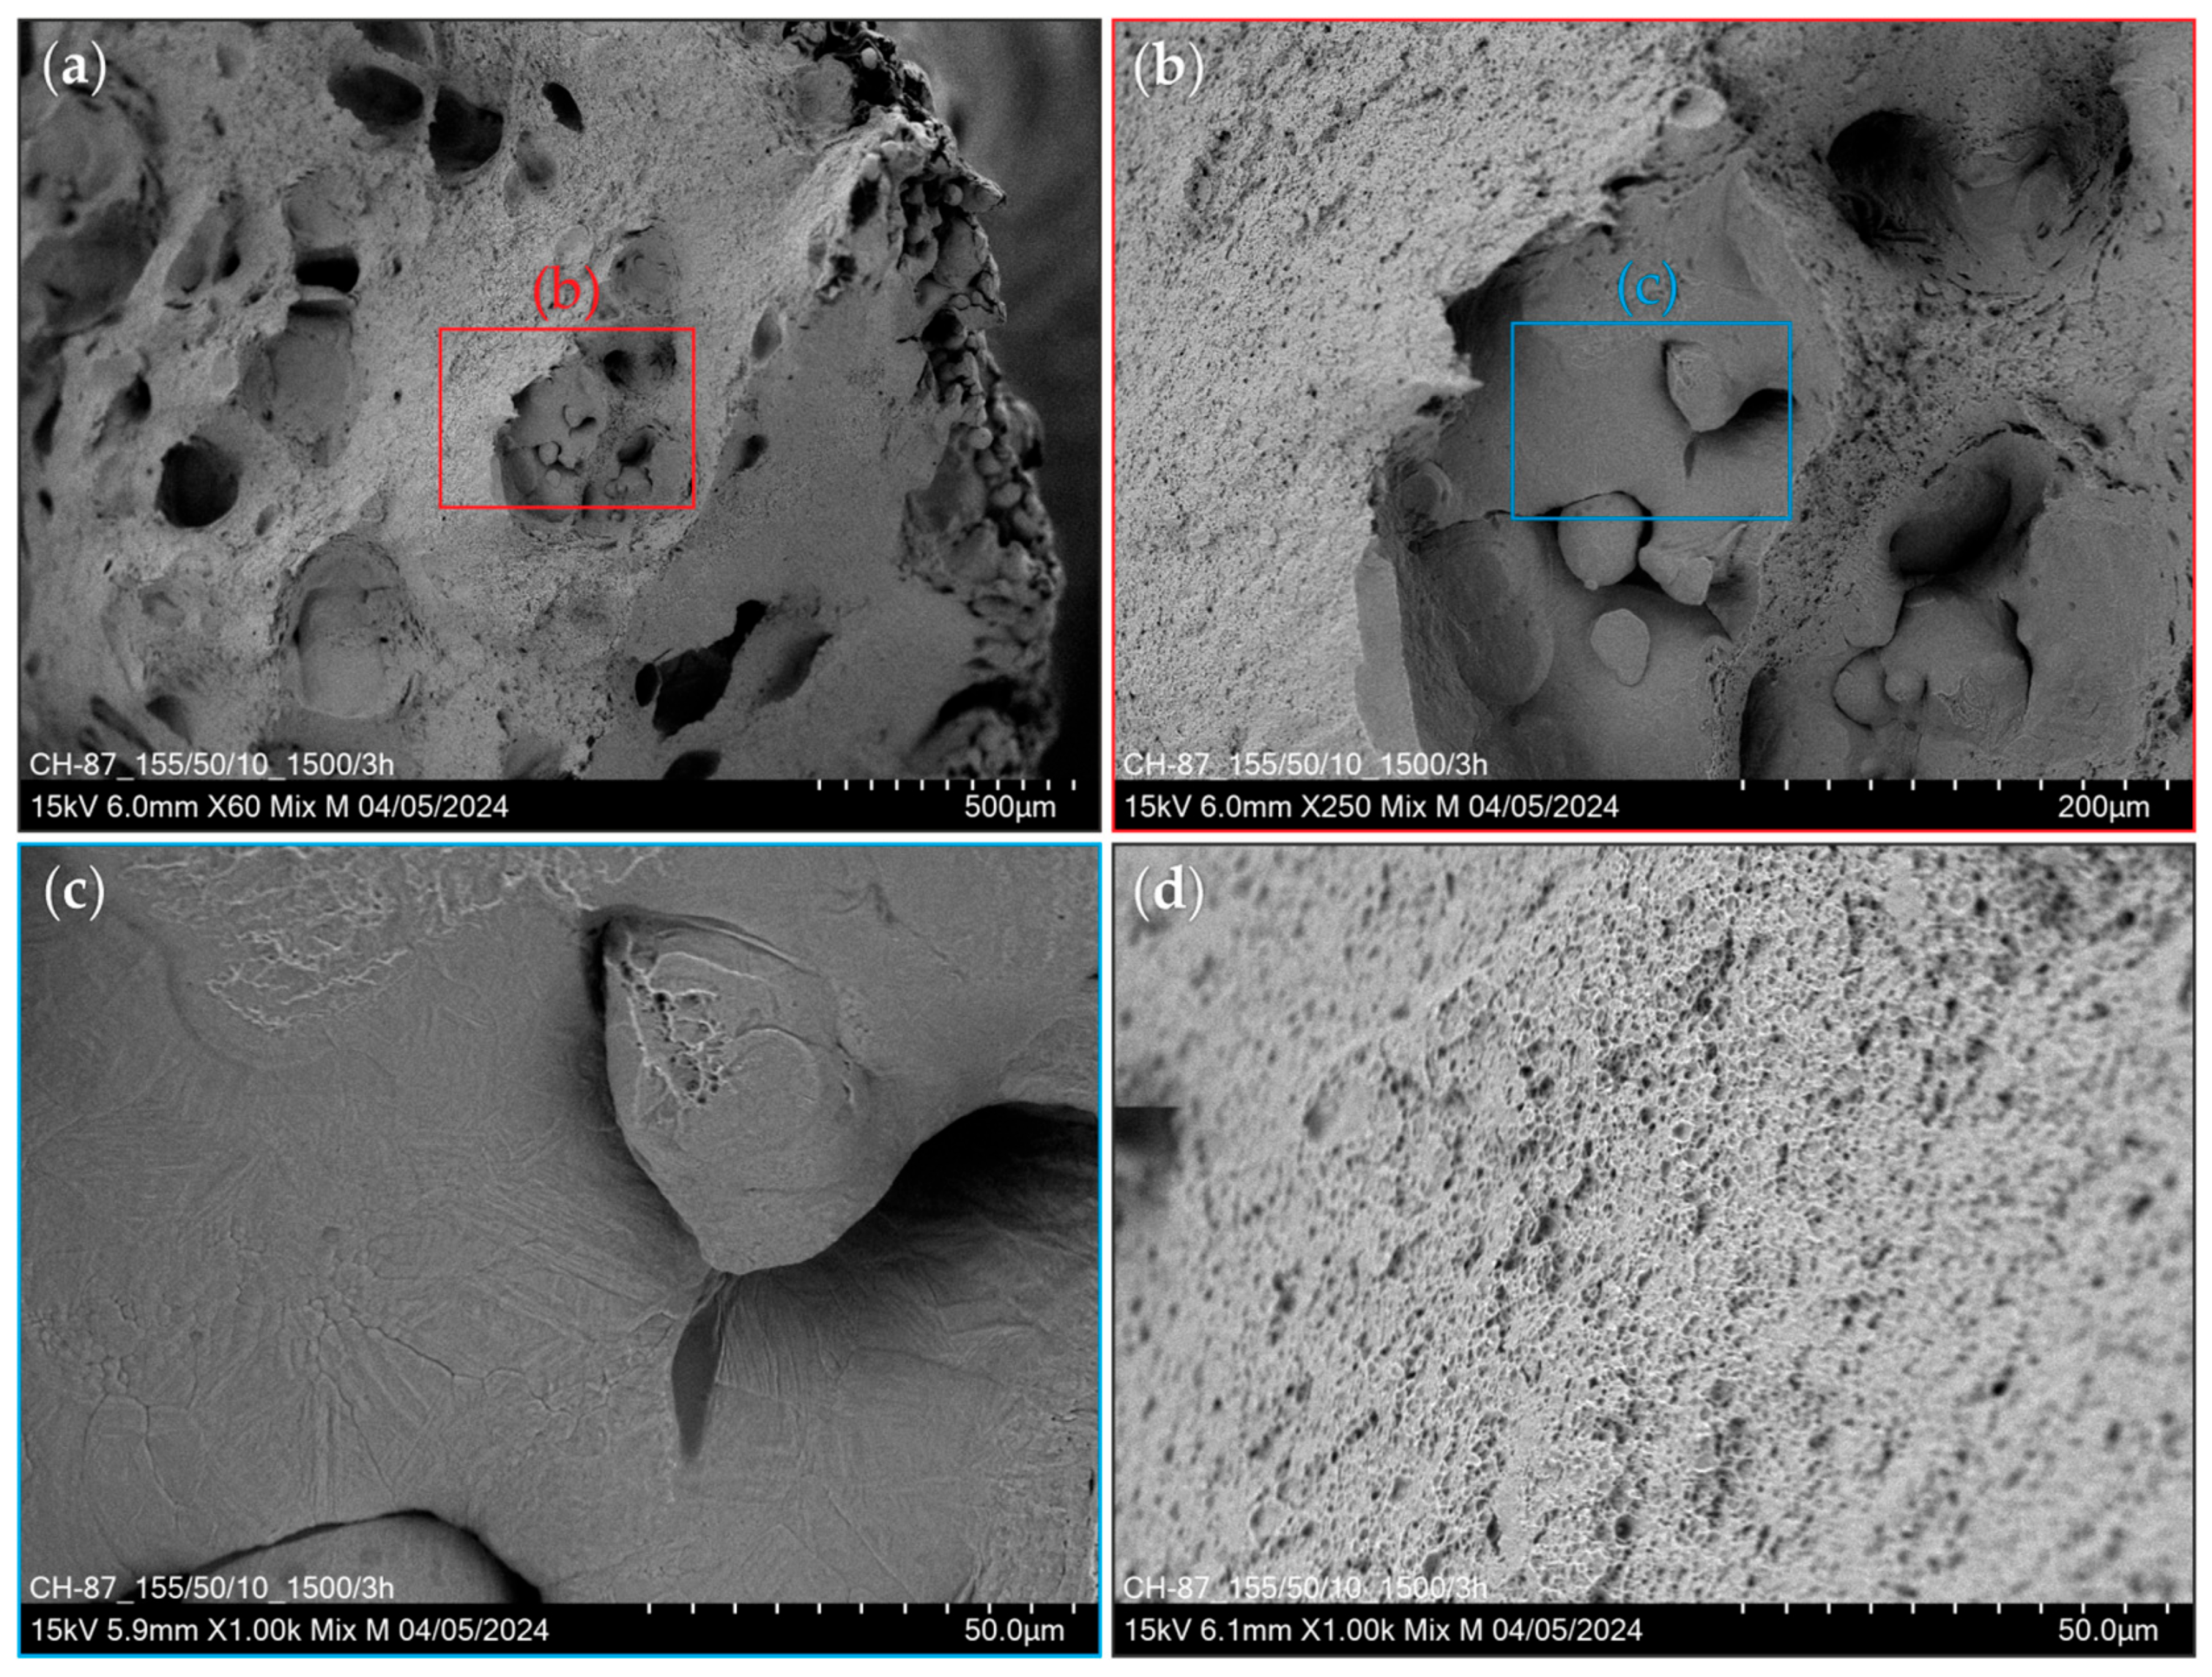
3.3. Fracture Surfaces

The analysis of fracture surfaces generally provides deeper insights into the material behavior and the fracture-inducing defects. Figure 6 shows SEM images of the fracture surface of specimen 1 at various magnifications. The overview image in Figure 6a reveals areas on the ductile fracture surface where partially melted powder particles, freely solidified surfaces and large pores are present. This is to be expected considering the relative density of 98.04 ± 2.36% determined in Section 3.1. It is also noticeable that the outer contour of the specimen consists of an approximately 100 µm thick layer of partially melted powder particles. This can be explained by the fact that the same process parameters were used for the contour as for the filling. Due to the defocussed laser beam, the intensity in the outer region was not high enough to completely melt the powder particles.
To increase the density of the outer skin, it would be possible to scan the contour a second time with a focused laser beam. Figure 6b shows a section of Figure 6a at higher magnification, where areas of several hundred micrometers in size are visible, containing freely solidified surfaces and partially melted powder particles. These are presumably fractured lack of fusion and major binding defects similar to the ones that are visible in the micrographs of the test cubes. Figure 6c shows a further magnified section of Figure 6b, in which a freely solidified surface is visible. Figure 6d shows a ductile fracture surface in comparison.

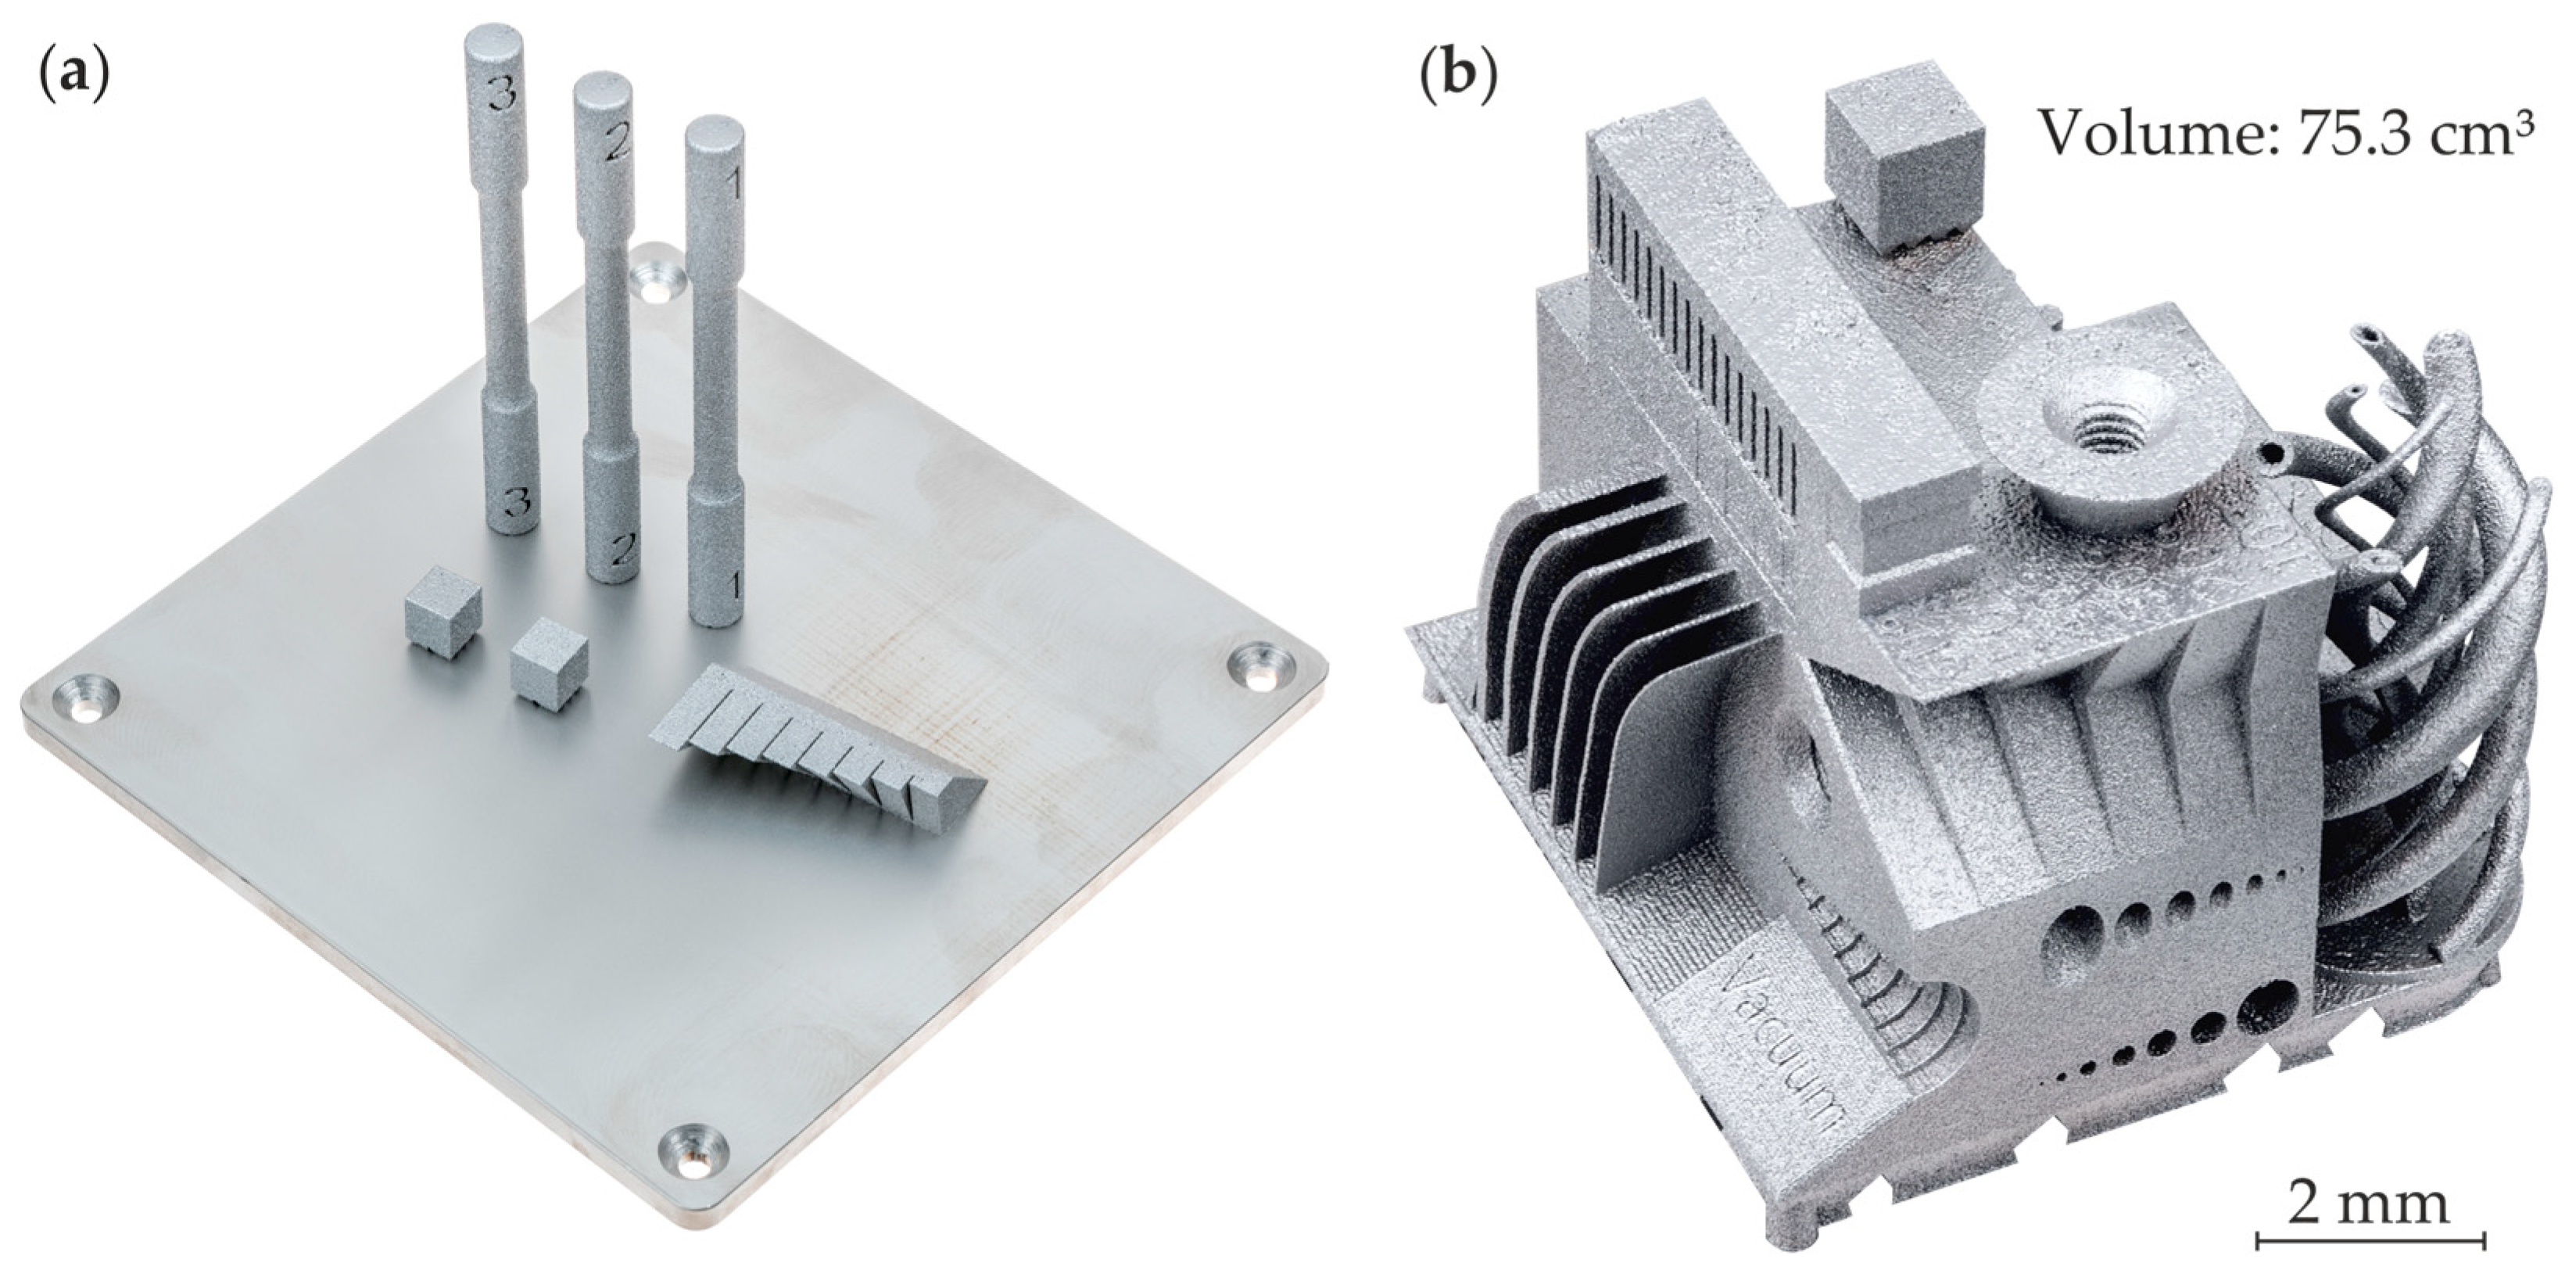
3.4. Manufacturing of Components with PBF-LB/M in High Vacuum

Reducing the process pressure to a high vacuum significantly affects the PBF-LB/M process. This is due to several factors that do not normally occur in the PBF-LB/M process under atmospheric pressure conditions, such as the denudation of powder particles and the lower boiling temperature of metallic materials at low process pressure. However, as part of the investigations conducted here, it was possible to successfully manufacture a benchmark part in a high vacuum, featuring complex geometric features in addition to the tensile specimens previously presented in Section 3.3. Figure 7a,b show the tensile specimens and the benchmark part after glass bead blasting. The benchmark part has a volume of 75.3 cm3 and includes overhangs with a polar angle of up to 60°, horizontal and vertical channels with diameters ranging from 0.5 to 8.0 mm, thin walls and gaps between 0.05 and 1.0 mm as well as two M6 threads (one vertical and one horizontal). These geometric features were successfully realized with a simple scanning strategy and minimal local deformation. A stripe filling pattern was used for the infill, with a contour aligned to the CAD reference (no beam compensation) and identical parameters as for the filling. Upskin and downskin instances were not included in the scanning strategy.
During high vacuum manufacturing at a process pressure of p = 2   ×   10 2   mbar , additional characteristics can be observed, beyond the effects already mentioned, such as powder denudation, which distinguish this process from manufacturing at atmospheric process pressure. Strong discoloration is observed on the powder bed, the manufactured parts and components of the PBF-LB/M system, becoming more pronounced with increasing part volume. These discolorations range from yellow to reddish-brown, purple, blue and light grey. Figure 8a shows the final layer of a successfully completed build job in which test cubes were manufactured. A discoloration of the surrounding powder bed is visible at a distance of approximately 2 mm around each test cube. The powder immediately surrounding the test cube is light grey, while the discoloration gradually changes to bluish, red-brown and finally yellowish as the distance from the test cube contour increases. Figure 8b shows the de-powdered build job of the tensile specimens before glass bead blasting. All parts manufactured during the build job show discolored surfaces. The test cubes exhibit a color gradient from bluish-purple on the upper half to brownish-red, yellow and, finally, no discoloration near the build plate. The tensile specimens show a similar color gradient to the cubes in the lower area. The upper section of the lower grip length and the gauge length exhibit a largely uniform purple discoloration, while the lower part of the upper grip length shows a strong yellowish discoloration. In the upper part of the upper grip length, a color gradient is again visible, ranging from bluish-purple at the top to reddish-brown and then to yellowish discoloration. Figure 8c shows an image of the laser protection window after the build job in which the benchmark part was printed. This image also displays strong discoloration with a color gradient, although the colors differ slightly from those observed on the tensile specimens and in the powder. A yellowish discoloration is visible in the center of the laser protection window, which transitions to green, blue and, finally, purple at the edges.
The discoloration can be observed not only after but also during a build job. Figure 9a shows the build job of the benchmark part during the scanning of one layer after several hundred layers. Supplementary Video S1 provides a video of one recoating and scanning cycle taken shortly after Figure 9a. After the deposition of the powder layer, a time-delayed discoloration of the powder, which was applied directly to the parts by the recoater, becomes visible. Before the laser scans the benchmark part, the powder initially turns yellowish and gradually transitions to bluish. Additionally, both the powder bed and the already scanned parts undergo a color change after the second scan in the area surrounding the currently scanned surface. This discoloration also exhibits the color gradient described earlier. The shorter the distance to the scanned surface and the larger the scanned area is, the more pronounced the surrounding discoloration becomes.
The extent and trajectories of the spatters can also be observed in the Supplementary Video S1. While almost no spatters are visible during the first scan, flying spatters occur during the second scan. These spatters cannot be removed due to the absence of shielding gas flow but are instead distributed over a large area within the build chamber. A quantitative comparison to PBF-LB/M at atmospheric process pressure is not possible, as no suitable monitoring systems were installed for this purpose. However, the extent of the spatters does not appear to be higher with the selected double-scanning strategy in a vacuum than at atmospheric process pressure. This is an achievement for the double-scanning strategy as, for example, in the experiments by Bidare et al., a significantly higher spatter flight was observed in vacuum compared to at atmospheric process pressure [16]. The spatters indicate that material continues to evaporate during the second scan.
After completing the build job with the benchmark component (shown in Figure 9b), the powder bed surface exhibited significantly larger discolorations compared to the surface observed after manufacturing the test cubes. Additionally, when the build platform was raised, the powder did not flow evenly in all directions as expected. Instead, a large portion of the powder particles remained interconnected. Using a brush proved insufficient to fully remove the powder from the components. Figure 9c shows the build job after an attempt to clean the components with a brush, revealing pronounced discoloration of the powder, which either remained adhered to the parts or could only be partially removed. In the immediate vicinity of the components, a distinct blue discoloration was observed. The remaining powder residues could only be completely removed by glass bead blasting.
To further investigate the influence of the process on the powder, optical microscopy and SEM images were taken of virgin powder obtained directly from the manufacturer and of powder samples collected near the benchmark component. These images are shown in Figure 10. It is apparent that the virgin powder already contains irregular particles and that some satellites are already present on powder particles. This observed powder morphology is also present in the vacuum powder samples, so that no direct influence of the process on the morphology of the powder can be determined here. When looking at the optical images, however, a clear difference in the color of the particles is visible. The virgin powder has almost no discoloration, whereas the particles in the vacuum powder sample show significant discoloration.

4. Discussion

4.1. Feasibility of Manufacturing with Double-Scanning Strategy and Density

Despite the recommendations by Bidare et al. and Kaserer et al. to maintain process pressures above p     5   ×   10 1   mbar [16] and p     2   ×   10 2   mbar [11], respectively, it was possible to manufacture test cubes with an edge length of 8 mm, tensile specimens and a benchmark part with a volume of 75.3 cm3 using PBF-LB/M in a vacuum atmosphere at a process pressure as low as p = 2   ×   10 2   mbar . The double-scanning strategy with a defocused laser beam can therefore be considered a success. Table 7 compares the maximum relative density obtained in this study with those reported by other authors in a vacuum atmosphere and by Mally et al. at atmospheric pressure [31].
The maximum relative density achieved here is lower than that reported by Mally et al. [31], which is expected, as the process window at atmospheric pressures is currently wider and the process is more stable due to the higher boiling temperature of metals and the shielding gas flow, which helps remove spatters from the build chamber. Compared to the work of other authors manufacturing parts in a vacuum atmosphere, the maximum relative density achieved here is higher than that reported by Sato et al. [19,22]. The relative density values reported by Watanabe et al. and Zhou et al. are slightly higher than those obtained in this study [23,24]. A comparison with the work of Nagahiri et al., who reported better creep properties for parts manufactured in a vacuum atmosphere compared to parts manufactured under atmospheric process pressure conditions, is not possible, as the authors do not provide values for relative density [25]. Generally, the comparison should be made with caution, as the process pressures in the vacuum atmospheres differ greatly, by two to three orders of magnitude, and most of the cited relative density values were obtained by comparing measured values of absolute density (Archimedes’ method) with literature values for the materials. In contrast, in this work, the relative density was analyzed using the optical microscopy of micrographs. It is worth noting that for all the cited maximum relative density values, the scanning speed used to manufacture the specimens was not higher than v = 100   mm / s . This appears to be a critical factor for attempts to manufacture parts via PBF-LB/M in a vacuum atmosphere when only one scan per layer is used. However, this results in very low build rates compared to the double-scanning approach used in this study, with scanning speeds in the range of v = 800–1200 mm/s.
With the current state of the art, the achievable relative densities in vacuum PBF-LB/M are slightly lower than those at atmospheric process pressure, generally due to a higher number of lack of fusion defects and major binding defects. Although major binding defects can also occur in PBF-LB/M at atmospheric pressure, they occur more frequently under vacuum conditions. The occurrence of major binding defects in the test cubes manufactured in this study may be explained by the formation of an uneven layer after the respective two scans of each layer and the interaction of this uneven layer with the recoater. Larger spatter particles that occur during the scanning of the second layer cannot be removed by shielding gas flow in a vacuum and can therefore land directly on the part. This can result in a very uneven surface after several layers. The uneven surface can then no longer be covered with a uniformly thick layer of powder by the recoater. As a result, too little or no powder may be deposited in some areas, while a significantly thicker layer is created in others. Since the laser intensity is significantly lower compared to a focused laser beam due to the increased laser beam diameter, the melt pools are also not always deep enough to completely melt the uneven powder layer. This can presumably result in large defects, which may either be filled with powder (that can fall out during metallographic preparation) or be empty, appearing as large voids in the micrograph. In this case, these voids can extend over up to 15 layers.
Similar major binding defects can also be found in the micrographs of specimens manufactured by Sato et al. [22] and Watanabe et al. [24]. In the study by Sato et al., an increase in scanning speed from v = 10   mm / s to v = 30   mm / s and v = 50   mm / s led to significantly larger lack of fusion defects, extending over several hundred micrometers perpendicular to the build direction. These defects, in turn, significantly lowered the relative density to ϱ rel = 81 . 4   % for v = 30   mm / s and ϱ rel = 69 . 2   % for v = 50   mm / s [22]. This is consistent with the observations in this study, which suggest that possible process windows are considerably smaller than under atmospheric process pressure conditions. It is worth noting that the addition of TiC nanoparticles to Ti6Al4V successfully suppressed the formation of major binding defects in the study by Watanabe et al. The authors attribute this to heterogeneous nucleation caused by the TiC nanoparticles during solidification [24].
The fact that the number of major binding defects in the test cubes manufactured in this work decreases with build height may be explained by an effect observed by Sato et al. They found that a higher build plate temperature, with otherwise constant process parameters, leads to a significant reduction in spatter formation under vacuum conditions due to the improved wetting behavior of the melt at higher temperatures [21].
Numerical investigations by Masoomi et al. have demonstrated that neglecting convective cooling due to shielding gas flow leads to a systematic overestimation of temperatures in the PBF-LB/M process [33]. Furthermore, experiments conducted by Wei et al. show that the thermal conductivity of metal powders used in additive manufacturing decreases by almost an order of magnitude, when the pressure of the carrier gas is decreased from atmospheric pressure to p = 1 . 4   ×   10 1   mbar [34]. Therefore, it is quite likely that the test cubes manufactured in this work accumulated more heat with increasing build height due to lower thermal conductivity in the powder bed and the absence of convective cooling by the shielding gas flow. This could have led to improved wetting behavior of the melt, reduced spatter generation and, in turn, a more stable process. A similar hypothesis concerning the cooling conditions in a vacuum atmosphere is proposed by Nagahiri et al., who explain differences in primary dendritic arm spacing by different cooling rates under atmospheric pressure and vacuum conditions [25].

4.2. Tensile Testing

As mentioned earlier, the properties of materials manufactured in a vacuum may differ from those manufactured under atmospheric pressure and shielding gas flow. The tensile specimens manufactured in high vacuum in this study exhibit different mechanical properties compared to those manufactured by Mally et al. [31]. Notably, the vacuum-manufactured specimens show significantly lower yield strength and ultimate tensile strength than the as-built specimens from Mally et al. [31], but they exhibit higher elongation at the maximum load point. This could suggest that the increased porosity is not the only factor contributing to the differences between the vacuum and as-built specimens. It is also possible that microstructural differences play a role. As previously mentioned, Nagahiri et al. report that IN718 specimens manufactured in a vacuum atmosphere exhibit significantly larger primary dendritic arm spacing compared to those made under atmospheric pressure. This difference was attributed to a cooling rate in vacuum conditions that is several orders of magnitude lower than under ambient pressure conditions, where shielding gas flows over the powder bed [25].
Mally et al. report a martensitic microstructure in the as-built state and a ferritic-bainitic microstructure in the heat-treated state. It is possible that the specimens manufactured in this study experienced similarly low cooling rates as the IN718 specimens manufactured by Nagahiri et al., which may have resulted in a microstructure more similar to the heat-treated specimen described by Mally et al. rather than the as-built ones [25,31]. The difference in elongation at the maximum load point between the vacuum-manufactured specimens and the heat-treated specimen from Mally et al. could be attributed to variations in porosity. It is likely that necking occurs in or near regions with increased porosity. Although Figure 4 shows a trend where porosity decreases with increasing build height, this merely indicates that the process boundary conditions may change over time or with build height. It cannot be guaranteed that porosity will not increase again in higher layers. The fracture surface of tensile specimen 1 in Figure 6 supports this hypothesis, as larger areas exhibiting major binding defects and freely solidified surfaces are visible. Due to the currently narrower process window in vacuum PBF-LB/M, small changes can lead to process instabilities, which in turn cause increased porosity.

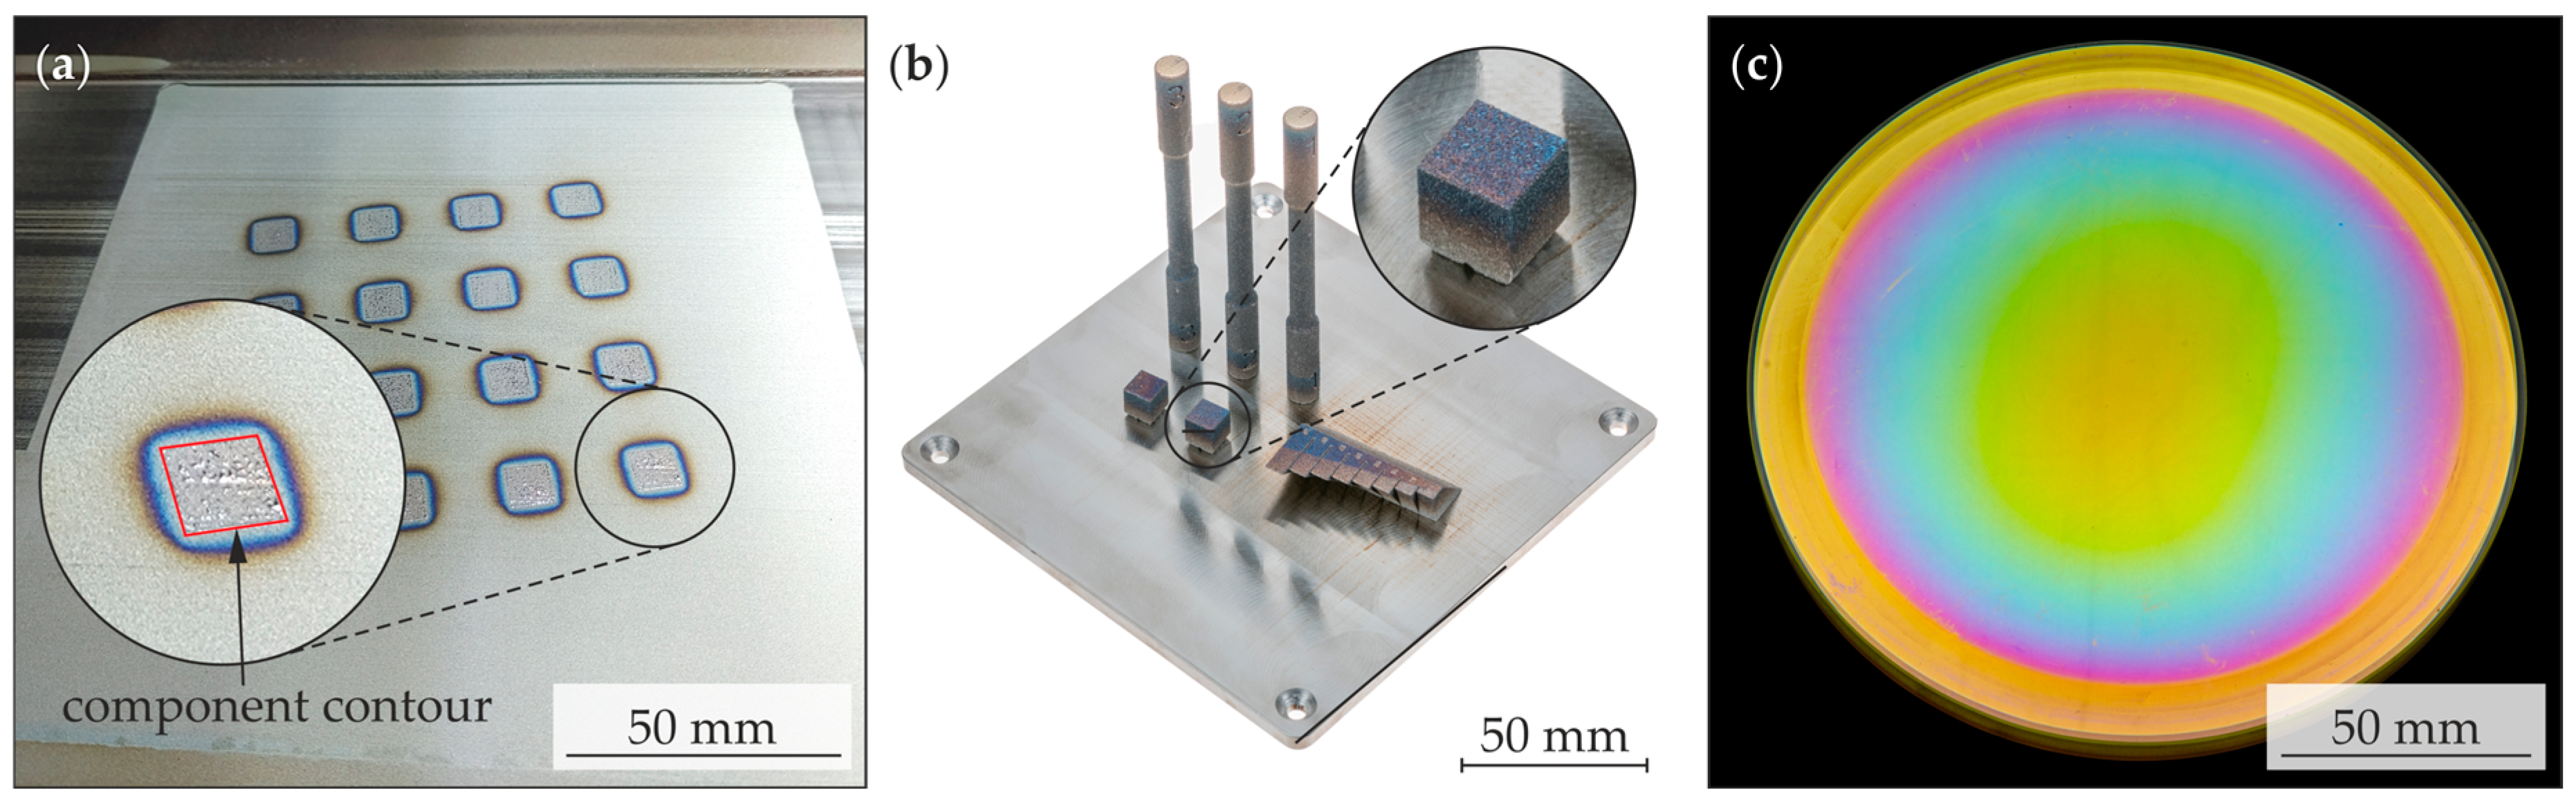
4.3. Formation and Consequences of Discoloration in PBF-LB/M in a High Vacuum

The pronounced discolorations described in Section 3.4 represent a distinct characteristic of the PBF-LB/M process under high vacuum conditions, as they generally do not occur at atmospheric process pressures or to a much lesser extent. In particular, when discolorations occur on machine components such as the laser protection window or the powder bed surface, they could negatively impact the process. The exact mechanism of the formation of these discolorations is currently not known. However, several possible explanations are discussed below.
In general, discolorations as described above can be caused by a phenomenon called thin-film interference [35]. This phenomenon is well known in steel tempering, where surface oxidation leads to characteristic discolorations. The observed colors correspond to different oxide layer thicknesses, which function as thin films. The formation of these oxide layers depends on factors such as the chemical composition of the steel, the temperature and the exposure time to an oxygen-rich atmosphere. Discoloration can thus serve as an indicator of the maximum temperature the steel has experienced under such conditions. The color spectrum ranges from yellow, brown and red to violet, blue and gray with increasing temperature [36].
This effect also occurs to a lesser extent in the PBF-LB/M process when steels are processed at atmospheric pressure, particularly if the residual oxygen content in the process chamber is elevated and when the parts reach high temperatures during manufacturing. Another potential cause of the observed discolorations could be the deposition of metal vapor within the process chamber. Under vacuum conditions, the metal vapor generated during processing can spread more widely throughout the chamber compared to when a shielding gas atmosphere is used. The observed powder denudation and the formation of spatters during the process suggest that a portion of the metal powder evaporates due to laser interaction during the second scan. The resulting metal vapor can, in principle, precipitate as nanoscale agglomerates in the chamber atmosphere or deposit on available surfaces. When metal vapor deposits on surfaces, several mechanisms may contribute to discoloration, including thin-film interference, oxidation or other optical effects.
In the PBF-EB/M process, discoloration of machine components has been documented [27]. However, reports about the components or powder bed exhibiting discolorations cannot be found in typical journal papers about PBF-EB/M [37,38,39,40].
In contrast to PBF-EB/M, the process pressures in this study were several orders of magnitude higher, leading to increased oxygen levels in the chamber compared to PBF-EB/M and more favorable conditions for oxidation. Nakano et al. reported that the discoloration of Ti6Al4V still occurs at a process pressure of p = 10 3   mbar , attributing it to oxidation [41]. Additionally, the powder bed was not preheated to the same extent as in PBF-EB/M. A lower temperature of the powder bed may favor metal vapor deposition. This could explain the more pronounced discoloration observed in this study compared to PBF-EB/M.
Currently, it is assumed that the discoloration on the surfaces of printed parts, as well as the gradual color change of the metal powder deposited by the recoater on the parts during the process, results from oxidation reactions with the residual oxygen content at a process pressure of p = 2   ×   10 2   mbar . Additionally, the discoloration observed on machine components (including the laser protection window) and the intense discoloration of the powder bed near the scanned areas after the second scan are believed to result from metal vapor deposition, where oxidation could also play a role.
As previously mentioned, process-induced discoloration can potentially have a negative impact on the process and its stability. If the discoloration of the laser protection window is not transparent to the laser wavelength of λ ≈ 1075 nm, it leads to a reduction in laser power due to absorption. Additionally, the transmitted portion of the laser beam may be scattered by the thin deposited layer. The absorbed fraction of the laser beam can, in turn, increase the temperature of specific areas of the laser protection window, resulting in a phenomenon known as thermal lensing. This effect can further reduce the laser power in the process zone by shifting the focal plane away from the intended process plane [42]. All three of these effects represent potential sources that can contribute to process instabilities. Zhou et al. also report discoloration of the laser protection window during PBF-LB/M in a vacuum atmosphere [23]. They developed a mechanism for cleaning the laser protection window during the process. However, despite the cleaning, discoloration of the laser protection window remains an issue. In summary, discoloration may negatively affect the process by shifting the focal plane and reducing laser power over time.
As described in Section 3.4, the discolorations on the powder bed do not visibly affect the morphology of the powder particles. However, discoloration of the powder particles, potentially caused by metal vapor deposition, could affect powder flowability and accelerate powder aging. If the powder deposited on the parts by the coater is already oxidized before laser exposure, this could lead to an increased oxygen content in the printed parts. A higher oxygen content in the printed parts or in the reused powder is detrimental to the mechanical properties, particularly the ductility of the material [43,44]. To accurately assess the effect of oxygen content in the printed material, further investigations are required, particularly regarding oxidation mechanisms in vacuum PBF-LB/M.
Based on our hypotheses regarding the origin of discoloration, two measures can be proposed to mitigate it: reducing the residual oxygen content in the process chamber and minimizing material evaporation during melting. One approach to lower the residual oxygen content is to further decrease the process pressure. To reduce material evaporation during melting, the laser beam diameter could be increased, which would lower the maximum laser intensity and distribute the laser power more evenly. However, this could lead to increased surface roughness of the printed parts and may limit the resolution of very small geometric features. Alternatively, a different laser intensity distribution could be employed. In this study, a Gaussian intensity profile was used, which exhibits a pronounced intensity peak at the center. Using a top-hat or ring-core distribution would result in a more uniform intensity profile, potentially reducing material evaporation. In the future, complex intensity profiles specifically tailored through beam shaping could further minimize evaporation in vacuum PBF-LB/M, thereby enhancing process stability.

5. Conclusions and Future Scope

This study developed a double-scanning strategy to examine its feasibility for manufacturing components via PBF-LB/M in a high-vacuum atmosphere at a process pressure of p = 2   ×   10 2   mbar , as an alternative to using a shielding gas atmosphere at p = 10 3   mbar . This double-scanning strategy consists of two consecutive laser scans: the first scan aims to locally and partially sinter the powder particles, while the second scan completely melts the partially sintered powder to achieve a dense component.
Key findings of this investigation include:
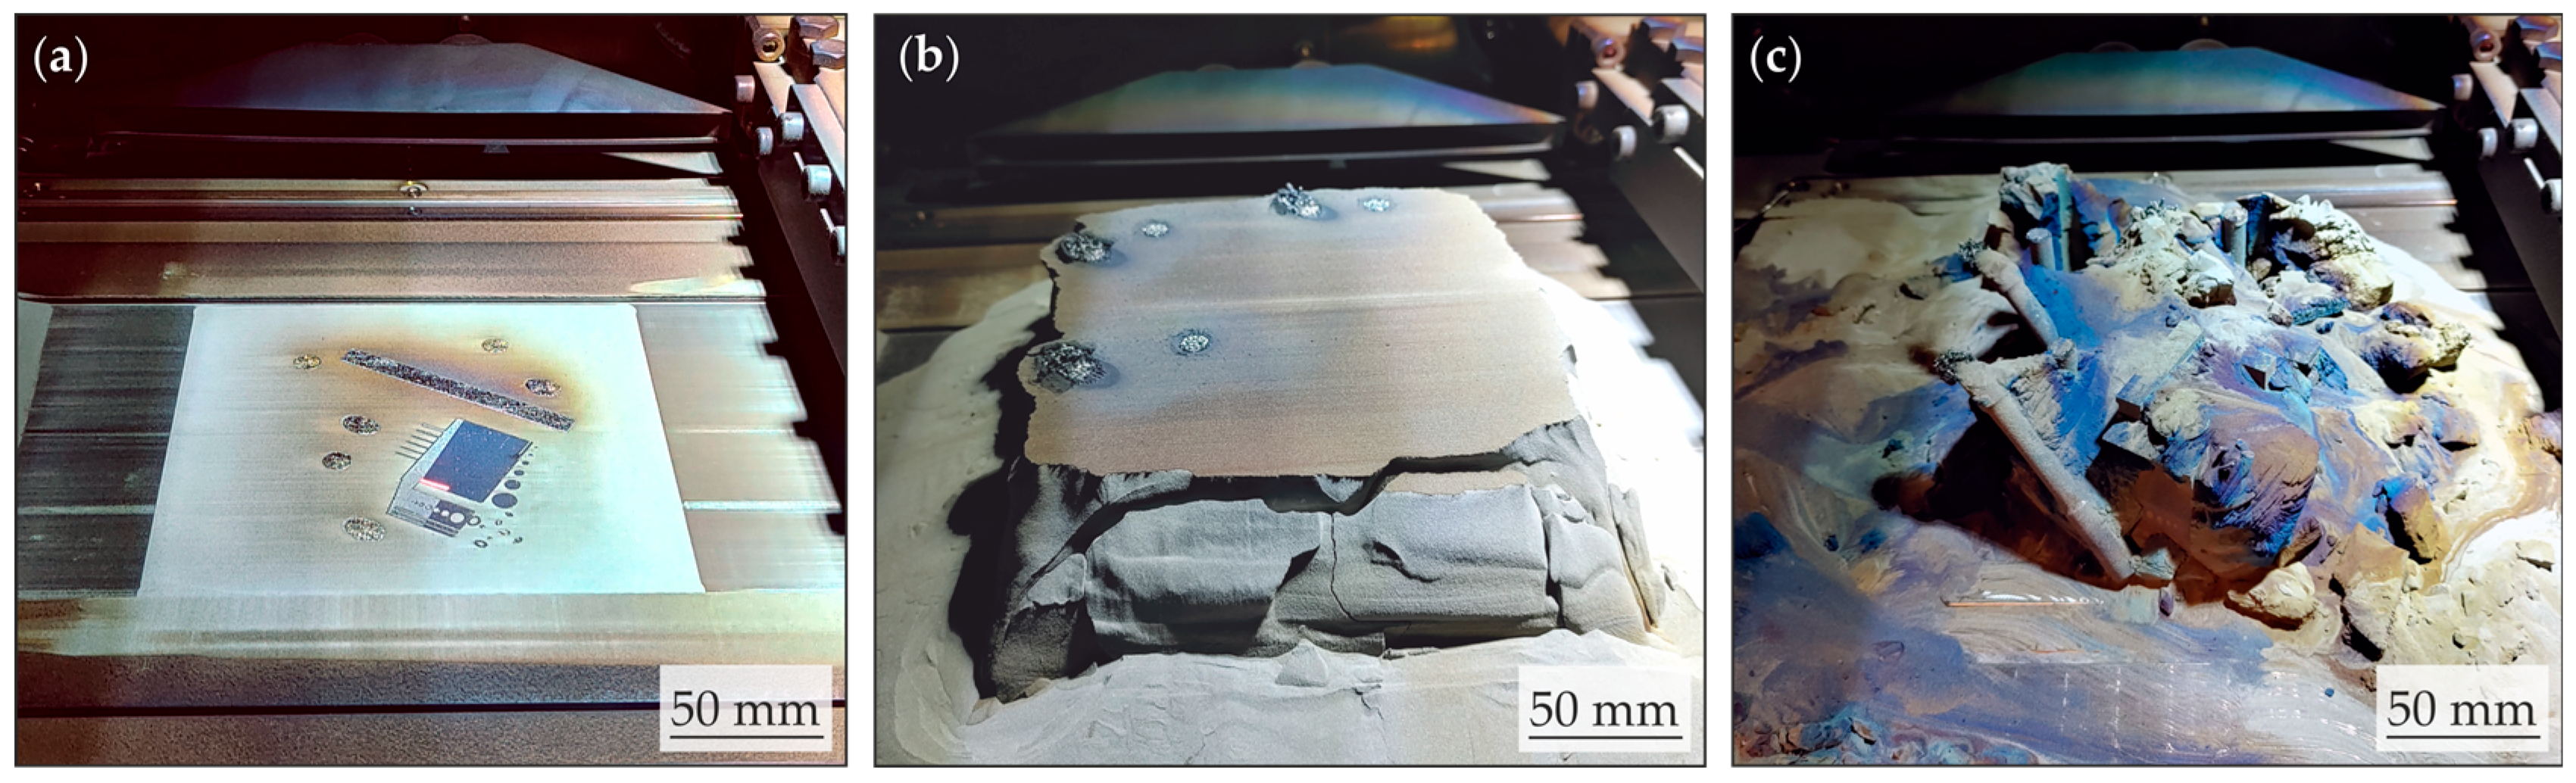
  • The double-scanning strategy enables the manufacturing of complex components in high vacuum at a process pressure of p = 2   ×   10 2   mbar . A self-developed benchmark part was successfully printed without requiring specialized upskin or downskin parameterization in a high vacuum atmosphere.
  • The relative densities of the vacuum-fabricated specimens range from ϱ rel = 89.43 ± 5.57% to ϱ rel = 98.48 ± 1.43%, which are lower than those achieved in PBF-LB/M under a shielding gas atmosphere. Additionally, the process defect distribution within the specimens is inhomogeneous.
  • The double-scanning strategy significantly reduced powder particle denudation, a major challenge in vacuum PBF-LB/M. Compared to other approaches in the literature [11,16,17] for manufacturing components using vacuum PBF-LB/M, it also reduced the number of process-induced spatter particles.
  • The process window for achieving high relative densities in vacuum PBF-LB/M is smaller than in a shielding gas atmosphere. This is most likely due to the lower evaporation temperature of the metals at reduced ambient pressure, among other influencing factors.
  • Tensile tests revealed differences in the mechanical properties of 22NiMoCr3-7 specimens fabricated in a vacuum compared to those manufactured under a shielding gas atmosphere. The ultimate tensile strengths (UTS) of the vacuum-fabricated specimens at p = 2   ×   10 2   mbar were UTS₁ = 724 MPa and UTS₂ = 722 MPa, whereas specimens manufactured in a shielding gas atmosphere by Mally et al. reached approximately UTS ≈ 1230 MPa [31].
  • During vacuum PBF-LB/M at p = 2   ×   10 2   mbar , pronounced discolorations were observed on the components, the powder bed and components of the PBF-LB/M system such as the laser protection window. These discolorations are likely caused by oxidation and/or metal vapor deposition. In particular, discolorations on the laser protection window and powder bed pose a risk of negatively affecting and destabilizing the process.
This study investigated a newly developed double-scanning strategy through a series of experiments with varying process parameters. All tests were conducted at a pressure of p = 2   ×   10 2   mbar and a constant preheating temperature of 300 °C using a Gaussian beam source.
Future research could focus on monitoring oxidation during the PBF-LB/M process in a vacuum atmosphere and measuring the oxygen content in the material after processing. Since the oxidation of steel surfaces correlates with the maximum temperature they experience, real-time temperature monitoring could provide valuable insights into the mechanisms leading to discoloration. Further studies should include a detailed microstructural characterization to quantify the effects of the double scanning strategy and the vacuum atmosphere on the microstructure. Additional approaches could include optimizing the laser beam intensity profile through beam shaping to achieve a more uniform temperature distribution, reducing the amount of evaporated material and/or further lowering the process pressure to minimize the available oxygen during the process.

Supplementary Materials

The following supporting information can be downloaded at: https://www.mdpi.com/article/10.3390/jmmp9030101/s1, Video S1: Video of one recoater-scanning cycle of a Laser Powder Bed Fusion (PBF-LB/M) process under high vacuum conditions with strong discolorations.

Author Contributions

Conceptualization, S.F. and S.S.; methodology, S.F. and S.S.; software, S.F. and S.S.; validation, S.F. and S.S.; formal analysis, S.F. and S.S.; investigation, S.F. and S.S.; resources, M.W. and S.W.; data curation, S.F. and S.S.; writing—original draft preparation, S.F. and S.S.; writing—review and editing, S.F., S.S. and M.W.; visualization, S.F. and S.S.; supervision, M.W.; project administration, M.W. and S.W.; funding acquisition, M.W. and S.W. All authors have read and agreed to the published version of the manuscript.

Funding

This work was supported by the Federal Ministry for the Environment, Nature Conservation, Nuclear Safety and Consumer Protection (BMUV), grant no. 1501654. Jmmp 09 00101 i001

Data Availability Statement

The data presented in this study is available on request from the corresponding author.

Acknowledgments

This publication was supported by the Open Access Publishing Fund of the University of Stuttgart.

Conflicts of Interest

The authors declare no conflicts of interest.

References

  1. Lachmayer, R.; Rettschlag, K.; Kaierle, S. Konstruktion für die Additive Fertigung 2020; Springer: Berlin/Heidelberg, Germany, 2021; ISBN 978-3-662-63029-7. [Google Scholar]
  2. Ferrar, B.; Mullen, L.; Jones, E.; Stamp, R.; Sutcliffe, C.J. Gas flow effects on selective laser melting (SLM) manufacturing performance. J. Mater. Process. Technol. 2012, 212, 355–364. [Google Scholar] [CrossRef]
  3. Gu, D.D.; Shen, Y.F.; Yang, J.L.; Wang, Y. Effects of processing parameters on direct laser sintering of multicomponent Cu based metal powder. Mater. Sci. Technol. 2006, 22, 1449–1455. [Google Scholar] [CrossRef]
  4. Zavala-Arredondo, M.; London, T.; Allen, M.; Maccio, T.; Ward, S.; Griffiths, D.; Allison, A.; Goodwin, P.; Hauser, C. Use of power factor and specific point energy as design parameters in laser powder-bed-fusion (L-PBF) of AlSi10Mg alloy. Mater. Des. 2019, 182, 108018. [Google Scholar] [CrossRef]
  5. Diaz Vallejo, N.; Lucas, C.; Ayers, N.; Graydon, K.; Hyer, H.; Sohn, Y. Process Optimization and Microstructure Analysis to Understand Laser Powder Bed Fusion of 316L Stainless Steel. Metals 2021, 11, 832. [Google Scholar] [CrossRef]
  6. Patel, S.; Vlasea, M. Melting modes in laser powder bed fusion. Materialia 2020, 9, 100591. [Google Scholar] [CrossRef]
  7. Grigoriev, S.; Ableyeva, R.; Korotkov, A.; Khmyrov, R.; Tarasova, T.; Gusarov, A. Powder bed surface relief formation and denudation in selective laser melting. Int. J. Adv. Manuf. Technol. 2022, 123, 543–558. [Google Scholar] [CrossRef]
  8. Hügel, H.; Graf, T. Materialbearbeitung mit Laser; Springer Fachmedien Wiesbaden: Wiesbaden, Germany, 2023; ISBN 978-3-658-41122-0. [Google Scholar]
  9. Cunningham, R.; Narra, S.P.; Montgomery, C.; Beuth, J.; Rollett, A.D. Synchrotron-Based X-ray Microtomography Characterization of the Effect of Processing Variables on Porosity Formation in Laser Power-Bed Additive Manufacturing of Ti-6Al-4V. JOM 2017, 69, 479–484. [Google Scholar] [CrossRef]
  10. Bidare, P.; Bitharas, I.; Ward, R.M.; Attallah, M.M.; Moore, A.J. Fluid and particle dynamics in laser powder bed fusion. Acta Mater. 2018, 142, 107–120. [Google Scholar] [CrossRef]
  11. Kaserer, L.; Bergmueller, S.; Braun, J.; Leichtfried, G. Vacuum laser powder bed fusion—track consolidation, powder denudation, and future potential. Int. J. Adv. Manuf. Technol. 2020, 110, 3339–3346. [Google Scholar] [CrossRef]
  12. Young, Z.A.; Guo, Q.; Parab, N.D.; Zhao, C.; Qu, M.; Escano, L.I.; Fezzaa, K.; Everhart, W.; Sun, T.; Chen, L. Types of spatter and their features and formation mechanisms in laser powder bed fusion additive manufacturing process. Addit. Manuf. 2020, 36, 101438. [Google Scholar] [CrossRef]
  13. Ly, S.; Rubenchik, A.M.; Khairallah, S.A.; Guss, G.; Matthews, M.J. Metal vapor micro-jet controls material redistribution in laser powder bed fusion additive manufacturing. Sci. Rep. 2017, 7, 4085. [Google Scholar] [CrossRef] [PubMed]
  14. Rominger, V.; Berger, P.; Hügel, H. Effects of reduced ambient pressure on spattering during the laser beam welding of mild steel. J. Laser Appl. 2019, 31. [Google Scholar] [CrossRef]
  15. Luo, Y.; Tang, X.; Lu, F.; Chen, Q.; Cui, H. Effect of subatmospheric pressure on plasma plume in fiber laser welding. J. Mater. Process. Technol. 2015, 215, 219–224. [Google Scholar] [CrossRef]
  16. Bidare, P.; Bitharas, I.; Ward, R.M.; Attallah, M.M.; Moore, A.J. Laser powder bed fusion at sub-atmospheric pressures. Int. J. Mach. Tools Manuf. 2018, 130-131, 65–72. [Google Scholar] [CrossRef]
  17. Matthews, M.J.; Guss, G.; Khairallah, S.A.; Rubenchik, A.M.; Depond, P.J.; King, W.E. Denudation of metal powder layers in laser powder bed fusion processes. Acta Mater. 2016, 114, 33–42. [Google Scholar] [CrossRef]
  18. Fritz, S.; Weiser, J.; Werz, M. Nachweis der Herstellbarkeit von Bauteilen mittels PBF/L im Hochvakuum. In 8. Tagung des DVM-Arbeitskreises Additiv Gefertigte Bauteile und Strukturen; Eiber, M., Richard, H.A., Eds.; Deutscher Verband für Materialforschung und -Prüfung e.V.: Berlin, Germany, 2023; pp. 13–30. [Google Scholar]
  19. Sato, Y.; Tsukamoto, M.; Yamashita, Y. Surface morphology of Ti–6Al–4V plate fabricated by vacuum selective laser melting. Appl. Phys. B 2015, 119, 545–549. [Google Scholar] [CrossRef]
  20. Sato, Y.; Tsukamoto, M.; Masuno, S.; Yamashita, Y.; Yamashita, K.; Tanigawa, D.; Abe, N. Investigation of the microstructure and surface morphology of a Ti6Al4V plate fabricated by vacuum selective laser melting. Appl. Phys. A 2016, 122, 439. [Google Scholar] [CrossRef]
  21. Sato, Y.; Tsukamoto, M.; Shobu, T.; Yamashita, Y.; Yamagata, S.; Nishi, T.; Higashino, R.; Ohkubo, T.; Nakano, H.; Abe, N. Preheat effect on titanium plate fabricated by sputter-free selective laser melting in vacuum. Appl. Phys. A 2018, 124, 288. [Google Scholar] [CrossRef]
  22. Sato, Y.; Mizuguchi, Y.; Takenaka, K.; Yoshida, N.; Srisawadi, S.; Tanprayoon, D.; Ohkubo, T.; Suga, T.; Tsukamoto, M. Pure titanium fabrication with spatter-less selective laser melting in vacuum. Results Opt. 2021, 5, 100184. [Google Scholar] [CrossRef]
  23. Zhou, B.; Zhou, J.; Li, H.; Lin, F. A study of the microstructures and mechanical properties of Ti6Al4V fabricated by SLM under vacuum. Mater. Sci. Eng. A 2018, 724, 1–10. [Google Scholar] [CrossRef]
  24. Watanabe, Y.; Sato, M.; Chiba, T.; Sato, H.; Sato, N.; Nakano, S. 3D Visualization of Top Surface Structure and Pores of 3D Printed Ti-6Al-4V Samples Manufactured with TiC Heterogeneous Nucleation Site Particles. Met. Mater. Trans. A 2020, 51, 1345–1352. [Google Scholar] [CrossRef]
  25. Nagahari, T.; Nagoya, T.; Kakehi, K.; Sato, N.; Nakano, S. Microstructure and Creep Properties of Ni-Base Superalloy IN718 Built up by Selective Laser Melting in a Vacuum Environment. Metals 2020, 10, 362. [Google Scholar] [CrossRef]
  26. Lin, Z.; Dadbakhsh, S.; Rashid, A. Developing processing windows for powder pre-heating in electron beam melting. J. Manuf. Process. 2022, 83, 180–191. [Google Scholar] [CrossRef]
  27. Fu, Z.; Körner, C. Actual state-of-the-art of electron beam powder bed fusion. Eur. J. Mater. 2022, 2, 54–116. [Google Scholar] [CrossRef]
  28. Achee, T.; Guss, G.; Elwany, A.; Matthews, M. Laser pre-sintering for denudation reduction in the laser powder bed fusion additive manufacturing of Ti-6Al-4V alloy. Addit. Manuf. 2021, 42, 101985. [Google Scholar] [CrossRef]
  29. Metelkova, J.; Kinds, Y.; Kempen, K.; de Formanoir, C.; Witvrouw, A.; van Hooreweder, B. On the influence of laser defocusing in Selective Laser Melting of 316L. Addit. Manuf. 2018, 23, 161–169. [Google Scholar] [CrossRef]
  30. Laufs, P. Reaktorsicherheit für Leistungskernkraftwerke; Springer: Berlin/Heidelberg, Germany, 2013; ISBN 978-3-642-30654-9. [Google Scholar]
  31. Mally, L.; Werz, M.; Weihe, S. Feasibility Study on Additive Manufacturing of Ferritic Steels to Meet Mechanical Properties of Safety Relevant Forged Parts. Materials 2022, 15, 383. [Google Scholar] [CrossRef]
  32. TÜV Bayern. Anlage 2 zum Abnahmeprüfzeugnis des TÜV Bayern: Prüf-Nr. 1415113/7; TÜV Bayern: Füssen, Germany, 1976. [Google Scholar]
  33. Masoomi, M.; Pegues, J.W.; Thompson, S.M.; Shamsaei, N. A numerical and experimental investigation of convective heat transfer during laser-powder bed fusion. Addit. Manuf. 2018, 22, 729–745. [Google Scholar] [CrossRef]
  34. Wei, L.C.; Ehrlich, L.E.; Powell-Palm, M.J.; Montgomery, C.; Beuth, J.; Malen, J.A. Thermal conductivity of metal powders for powder bed additive manufacturing. Addit. Manuf. 2018, 21, 201–208. [Google Scholar] [CrossRef]
  35. Macleod, H.A. Thin-Film Optical Filters; Institute of Physics Publishing: London, UK, 2001. [Google Scholar]
  36. Gordon, P. The temper colors on steel. J. Heart Treat. 1979, 1, 93. [Google Scholar] [CrossRef]
  37. Chandrasekar, S.; Coble, J.B.; Yoder, S.; Nandwana, P.; Dehoff, R.R.; Paquit, V.C.; Babu, S.S. Investigating the effect of metal powder recycling in Electron beam Powder Bed Fusion using process log data. Addit. Manuf. 2020, 32, 100994. [Google Scholar] [CrossRef]
  38. Zhong, Y.; Rännar, L.-E.; Liu, L.; Koptyug, A.; Wikman, S.; Olsen, J.; Cui, D.; Shen, Z. Additive manufacturing of 316L stainless steel by electron beam melting for nuclear fusion applications. J. Nucl. Mater. 2017, 486, 234–245. [Google Scholar] [CrossRef]
  39. Burkhardt, C.; Wendler, M.; Lehnert, R.; Hauser, M.; Clausnitzer, P.; Volkova, O.; Biermann, H.; Weidner, A. Fine-grained microstructure without texture obtained by electron beam powder bed fusion for AISI 304 L-based stainless steel. Addit. Manuf. 2023, 69, 103539. [Google Scholar] [CrossRef]
  40. Körner, C. Additive manufacturing of metallic components by selective electron beam melting—A review. Int. Mater. Rev. 2016, 61, 361–377. [Google Scholar] [CrossRef]
  41. Nakano, S.; Hagiwara, M.; Shimizu, T.; Horiba, Y.; Sato, N.; Matsuzaki, K.; Sassa, M. Novel selective laser melting solution for metal additive manufacturing using vacuum and a quasi continuous wave laser. LEM21 2013, 7, 419–422. [Google Scholar] [CrossRef]
  42. Dobek, K. Thermal lensing: Outside of the lasing medium. Appl. Phys. B 2022, 128, 18. [Google Scholar] [CrossRef]
  43. Song, C.; Deng, Z.; Chen, J.; Yang, Z.; Zou, Z.; Liu, L.; Yang, Y.; Xu, K.; Wang, J. Study on the influence of oxygen content evolution on the mechanical properties of tantalum powder fabricated by laser powder bed fusion. Mater. Charact. 2023, 205, 113235. [Google Scholar] [CrossRef]
  44. Wasz, M.L.; Brotzen, F.R.; McLellan, R.B.; Griffin, A.J. Effect of oxygen and hydrogen on mechanical properties of commercial purity titanium. Int. Mater. Rev. 1996, 41, 1–12. [Google Scholar] [CrossRef]
Figure 2. Schematic set-up of the vacuum-capable PBF-LB/M system Evobeam SLaVAM 300 and its optics (a). Picture of the build chamber of the system (b).
Jmmp 09 00101 g002
Figure 3. Determined relative density values for the first scan in relation to (a) scanning speed v and (b) hatch distance h and for the second scan in relation to (c) laser power P and scanning speed v for EL = 0.25 J/mm and (d) hatch distance h. Error bars indicate standard deviation inside one single test cube.
Jmmp 09 00101 g003
Figure 4. Micrographs of cubes manufactured with parameter set 1-3 (top) and parameter set 2-7 (bottom), with (b,e) showing the whole tile scan, (a,d) showing representative areas at higher magnification including typical process-related defects and (c,f) showing a heat map of the determined relative density distribution over the entire tile scan.
Jmmp 09 00101 g004
Figure 5. Stress–strain curves for 22NiMoCr3-7 determined at room temperature for specimens 1 and 2 printed in a vacuum atmosphere at 2   ×   10 2   mbar . The data at 10 3   mbar from Mally et al. [31] was added here as a reference for comparison. Their specimens were printed in an argon shielding gas atmosphere at atmospheric process pressure. One of the specimens was tested as printed and the other was tested post-heat treatment. The diamonds indicate the elongation and stress at the maximum load point.
Jmmp 09 00101 g005
Figure 6. SEM images of the fracture surface of tensile specimen 1: (a) overview of the fracture surface, (b) detailed view of the fracture surface with areas showing signs of freely solidified surfaces and partially melted powder particles, as well as areas of ductile fracture surfaces, (c) high magnification of the area showing signs of freely solidified surfaces and partially melted powder particles, (d) area of a ductile fracture surface.
Jmmp 09 00101 g006
Figure 7. Images of components printed in a high vacuum atmosphere at p = 2   ×   10 2   mbar after glass bead blasting. (a) Tensile specimens, test cubes and one overhang specimen. (b) Self-developed benchmark part with various geometric features.
Jmmp 09 00101 g007
Figure 8. Images of observed discoloration on (a) the last layer of a completed build job, (b) the surface of printed parts, (c) the laser protection window.
Jmmp 09 00101 g008
Figure 9. Images of the build job in which the benchmark part was printed. (a) shows the laser exposure of one layer. (b) shows the raised build plate after the completed build job. (c) shows the build job after the attempt of removing the powder with a brush.
Jmmp 09 00101 g009
Figure 10. Images of 22NiMoCr3-7 metal powder: (a) optical microscopy image of virgin powder, (b) SEM image of virgin powder, (c) optical microscopy image of powder discolored after a build job in vacuum, and (d) SEM image of powder discolored by vacuum PBF-LB/M.
Jmmp 09 00101 g010
Table 2. Vacuum PBF-LB/M base parameter set.
Laser Power in WScanning Speed in mm/sHatch
Distance in mm
Layer
Thickness in mm
Focusing
Parameter ζ
Scanning StrategyTilt AngleShielding Gas
First Scan6012000.2000.02519lines67°Ar 1
Second Scan25010000.100967° (+90°)
1 It is important to note that while the process was conducted in a high vacuum atmosphere, argon was used for pressure control within the process chamber.
Table 3. List of process parameters in which the first scan parameters were varied. For the second scan, the same process parameters were always used.
Parameter Set
Variation 1st Scan
Laser Power P
in W
Scanning Speed v
in mm/s
Hatch Distance h
in mm
Focusing
Parameter ζ
Energy Density EV
in J/mm3
1-16010000.2001912.00
1-2105011.43
1-3110010.91
1-4115010.43
1-512000.16012.50
1-60.17011.76
1-70.18011.11
1-80.19010.53
Second Scan 2-125010000.1009100.00
Table 4. List of process parameters in which the second scan parameters were varied. For the first scan, the same process parameters were always used.
Parameter Set
Variation 2nd Scan
Laser Power P
in W
Scanning Speed v
in mm/s
Hatch Distance h
in mm
Focusing
Parameter ζ
Energy Density EV
in J/mm3
First Scan 1-06012000.2001910.00
2-125010000.0859117.65
2-20.090111.11
2-30.095105.26
2-40.100100.00
2-52008000.100100.00
2-6225900
2-72751100
2-83001200
Table 5. Results of the relative density measured by image analysis for all 16 double-scanning parameter sets used.
Double-Scanning
Parameter Set
Energy Density EV
1st Scan in J/mm3
Energy Density EV
2nd Scan in J/mm3
Relative   Density   ϱ rel
in % 1
1-112.00100.0089.43 ± 5.57
1-211.4392.24 ± 5.44
1-310.9195.12 ± 4.11
1-410.4396.35 ± 2.16
1-512.5095.14 ± 3.88
1-611.7689.95 ± 5.29
1-711.1191.44 ± 6.43
1-810.5397.14 ± 2.44
2-110.00117.6594.85 ± 4.26
2-2111.1197.19 ± 2.30
2-3105.2696.73 ± 2.29
2-4100.0096.12 ± 2.70
2-5100.0096.08 ± 2.90
2-697.91 ± 1.38
2-798.04 ± 2.36
2-898.48 ± 1.43
1 Average ± Standard deviation inside a single test cube.
Table 6. Results of tensile tests of 22NiMoCr3-7, manufactured with PBF-LB/M.
SpecimenYield Strength
in MPa
Ultimate Tensile Strength in MPaElongation at Maximum Load in %
Vacuum Specimen 16597247.11
Vacuum Specimen 26567226.85
Argon without HT [31]111112334.28
Argon with HT [31]6516939.21
Table 7. Comparison of achieved values of maximum relative density with values for the same material manufactured under atmospheric process pressure conditions and values from the works of other authors using PBF-LB/M under vacuum conditions.
Author and YearSourceMaterialProcess Pressure
in mbar
Maximum Relative Density in %
This study-22NiMoCr3-7 2   ×   10 2 98.48
Mally 2021[31]22NiMoCr3-7 10 3 99.60
Sato 2015[19]Ti6Al4V 10 4 90.20
Sato 2021[22]Commercially pure Ti 5   ×   10 5 97.10
Zhou 2018[23]Ti6Al4V 10 2 98.58
Watanabe 2020[24]Ti6Al4V without TiC 2   ×   10 4 98.70
Watanabe 2020[24]Ti6Al4V with TiC 2   ×   10 4 99.30
Disclaimer/Publisher’s Note: The statements, opinions and data contained in all publications are solely those of the individual author(s) and contributor(s) and not of MDPI and/or the editor(s). MDPI and/or the editor(s) disclaim responsibility for any injury to people or property resulting from any ideas, methods, instructions or products referred to in the content.

