Abstract
To address solder paste drawbacks, such as die contamination and flux residue, a polymer-based sheet containing Sn-3.0 (wt%) Ag-0.5Cu solder particles as fillers was fabricated, and its bonding characteristics were analyzed. The reductant in the manufactured sheet evaporated while removing the oxide layers on the solder and copper finish surfaces during heating. Subsequently, the resin component (polymethyl methacrylate) began to decompose thermally and gradually dissipated. Ultimately, the resulting joint formed a solder interconnection with a small amount of residual resin. This joint is expected to exhibit superior thermal conductivity compared with composite joints with a polymer matrix structure. Die-attach tests were conducted in air using the fabricated sheet between Cu finishes. Results showed that joints formed at 300 °C for 30 s and 350 °C for 10 s provided excellent shear strength values of 48.0 and 44.3 MPa, respectively, along with appropriately developed intermetallic compound (IMC) layers at the bonding interface. In contrast, bonding at 350 °C for 60 s resulted in excessive growth of IMC layers at the interface. When comparing size effects of solder particles, type 6 particles exhibited superior shear strength along with a relatively thinner total IMC layer thickness compared to when type 7 particles were used.
1. Introduction
In a semiconductor package assembly, the traditional die-attach process, which involves dispensing a curable Ag paste and pressing the die onto it, has been rapidly replaced by a method that utilizes a sheet-type material known as die attach film (DAF) [1,2,3]. This shift is primarily aimed at simplifying the process and minimizing defects such as excessive bleed-out and kerf creep [4,5]. The DAF-based die-attach process enables wafer-level lamination of the sheet material prior to dicing, thereby contributing to further process simplification [6,7]. Additionally, DAF joints offer improved uniformity in bond-line thickness compared with conventional paste joints.
DAF materials can be broadly classified into two categories: conductive types containing Ag particles, and non-conductive types incorporating thermally conductive insulating fillers such as SiO2 [8,9]. Among them, conductive DAFs exhibit excellent processability; however, their high cost and limited thermal conductivity (<10 W/m∙K)—arising from the polymer (typically epoxy) matrix structure that forms the bond-line—remain significant drawbacks [10]. To simultaneously address these two limitations, a new approach involves replacing Ag particles with familiar solder particles, which not only provide interconnection by forming the matrix themselves but also allow for a minimal amount of polymer within the bond-line. Unlike Ag particles, solder particles undergo reflow during bonding, resulting in their consolidation and enabling the thermal conductivity of bulk solder to be achieved. This structure offers enhanced thermal conductivity while retaining mechanical integrity. Moreover, the sheet type die-attach materials containing solder particles offer the added advantage of eliminating the post-cleaning step typically required to remove flux residue that could otherwise cause electrical shorts, compared to conventional soldering processes.
Liu et al. fabricated a solder sheet by immersing a flux-coated porous Cu sheet into molten solder and subsequently analyzed its bonding characteristics [11]. However, this sheet material lacks sufficient flexibility and is more appropriately classified as a solder preform. Furthermore, the excessive formation of Cu6Sn5 intermetallic compound (IMC) phases within the bond-line is expected to degrade its thermal conductivity. On the other hand, Joo et al. developed an anisotropic solder film containing solder particles and demonstrated its use for bonding mini light emitting diodes (LED) arrays using a simultaneous transfer and bonding technique [12]. Nevertheless, this film was specifically designed for flip-chip bonding owing to its ability to form anisotropic solder interconnections. If applied to die-attach processes, the formation of a polymer matrix structure would be unavoidable.
Consequently, this study aimed to develop a flexible sheet material containing solder particles that enables solder interconnection while minimizing residual polymer within the bond-line after die attachment. The bonding characteristics of the proposed sheet were evaluated between various copper surface finishes. Specifically, a thermally decomposable resin component was incorporated into the sheet formulation to facilitate resin removal during subsequent bonding process. Additionally, a chemical reductant was added to eliminate not only the oxide layers on the solder particles, but also those present on the Cu finishes during bonding.
2. Materials and Methods
2.1. Fabrication of a Sheet Containing Solder Powder
In this study, a solder filler-based DAF was fabricated by combining Sn-3.0 (wt%) Ag-0.5Cu (SAC305) solder alloy powders of type 6 and type 7 with a custom-developed resin formulation, as shown in Figure 1. The weight mixing ratio of the powder to the resin formulation was 10:1. In type 6, most of the particle size distribution falls within the range of 5–15 μm, whereas in type 7, the majority of the particles are within the range of 2–11 μm. These types were selected considering the particle size that can be appropriately incorporated into a 50 μm-thick sheet. The bonding characteristics of the fabricated sheet were evaluated under low bonding pressure. Polymethyl methacrylate (PMMA; LG MMA, Yeosu-si, Republic of Korea) was dissolved in a solvent at room temperature for approximately three days. After complete dissolution, a reductant (EW-10; Epsilon Epowder, Sungnam-si, Republic of Korea) and SAC305 powders were added sequentially and mixed uniformly to prepare a homogeneous paste. The prepared paste was printed onto a glass substrate with dimensions 20 × 20 × 0.1 mm3 and dried on a hot plate at 100 °C for approximately 2 min to evaporate the solvent used during paste preparation, thereby forming the material with a reduced thickness of approximately 50 μm.
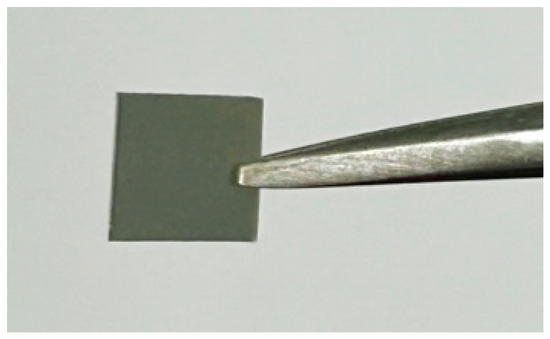
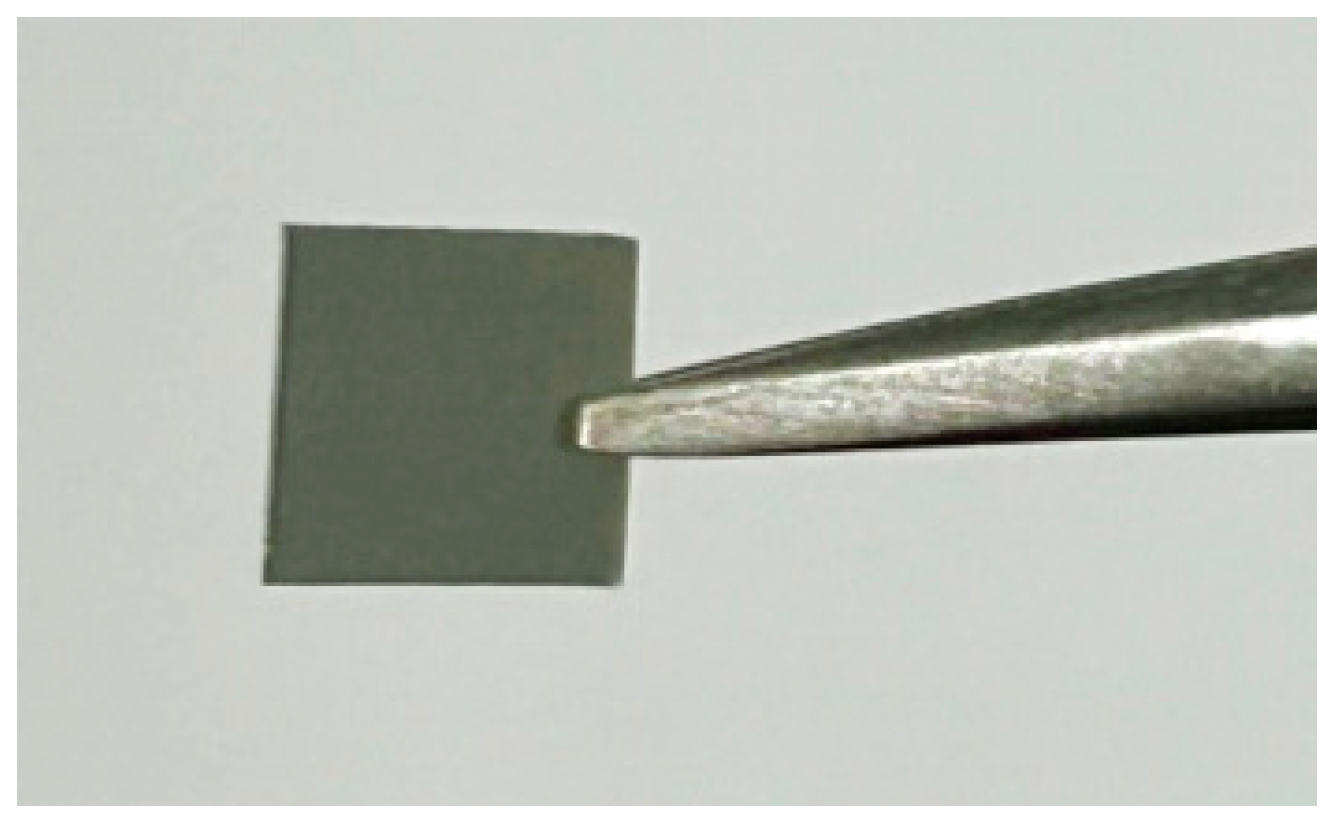
Figure 1.
Image of sheet containing type 6 SAC305 powder.
2.2. Bonding Process
To evaluate the bonding performance of the developed DAF material, pressure-assisted bonding was conducted in air using Cu plates as dummy die and substrate. A sheet sample was cut into 3 × 3 mm2 squares and aligned on the Cu substrate, upon which a Cu die measuring 3 × 3 × 1 mm3 was placed to form a sandwich-structured sample. The prepared samples were bonded under a pressure of 0.05 MPa at bonding temperatures of 250, 280, 300, 320, and 350 °C for bonding times of 10, 30, and 60 s. The reported bonding time includes the heating time required to reach the target temperature. For example, in the case of bonding at 300 °C, approximately 10 s was required to reach the target temperature. Therefore, a 10 s bonding time refers to immediate air cooling upon reaching 300 °C, while a 30 s bonding time indicates that the temperature was held at 300 °C for an additional 20 s before air cooling. Various temperature–pressure profiles attempted for optimal bonding are presented in Figure S1.
2.3. Characterization
To evaluate the reduction effectiveness of the reductant used in sheet fabrication, the wettability of SAC305 solder powder was assessed. A solder paste for wettability testing was prepared using only the reductant and type 7 SAC305 powder, and its reflow behavior was compared with that of a solder paste formulated with a commercial no-clean flux (Chip Quik, Hamilton, ON, Canada). The two prepared solder pastes were printed onto Cu dummy substrates (10 × 10 × 1 mm3) in a 3 × 3 × 0.1 mm3 pattern, followed by reflow on a hot plate at 250 °C for 1 min. The reflowed samples were mounted in epoxy resin and cross-sectionally polished for analysis using optical microscopy (OM; LV-100ND, Nikon, Tokyo, Japan) and scanning electron microscopy (SEM; SU8010, Hitachi High Technologies, Tokyo, Japan). The wetting angles were quantitatively measured using ImageJ (U.S. National Institutes of Health, Bethesda, MD, USA, https://imagej.net/ij/ (accessed on 23 August 1997)).
The thermal behavior of the fabricated DAF was investigated by thermogravimetric and differential thermal analysis (TG-DTA; DTG-60H, Shimadzu, Kyoto, Japan). Dynamic heating was performed in an air atmosphere up to 500 °C at a constant heating rate of 20 °C/min.
Shear tests were conducted on the bonded joints to evaluate the variation in bonding strength according to the solder powder particle size and bonding process conditions. Additionally, cross-sectional microstructure and fracture surfaces of the bond-lines were analyzed using SEM. For clearer observation of the bond-line microstructure, the samples were mounted in epoxy resin, cross-sectioned, and mechanically polished. Then, polished sections were etched using a mixed solution prepared from hydrochloric acid (HCl, 35%, Daejung Chemical & Metals Co., Ltd., Siheung-si, Republic of Korea), nitric acid (HNO3, 65%, Daejung Chemical & Metals Co., Ltd., Siheung-si, Republic of Korea), and ethanol (CH3CH2OH, Bucheon-si, Republic of Korea). All SEM images were acquired in back-scattered electron (BSE) mode. To investigate the changes in the IMC layers at the upper and lower interfaces of the solder joint under different bonding conditions, image analysis software was used to measure the area of the IMC layers. Average thickness was calculated by dividing the measured area by the length of the corresponding interface region.
3. Results and Discussion
3.1. Characteristics of a Solder Sheet
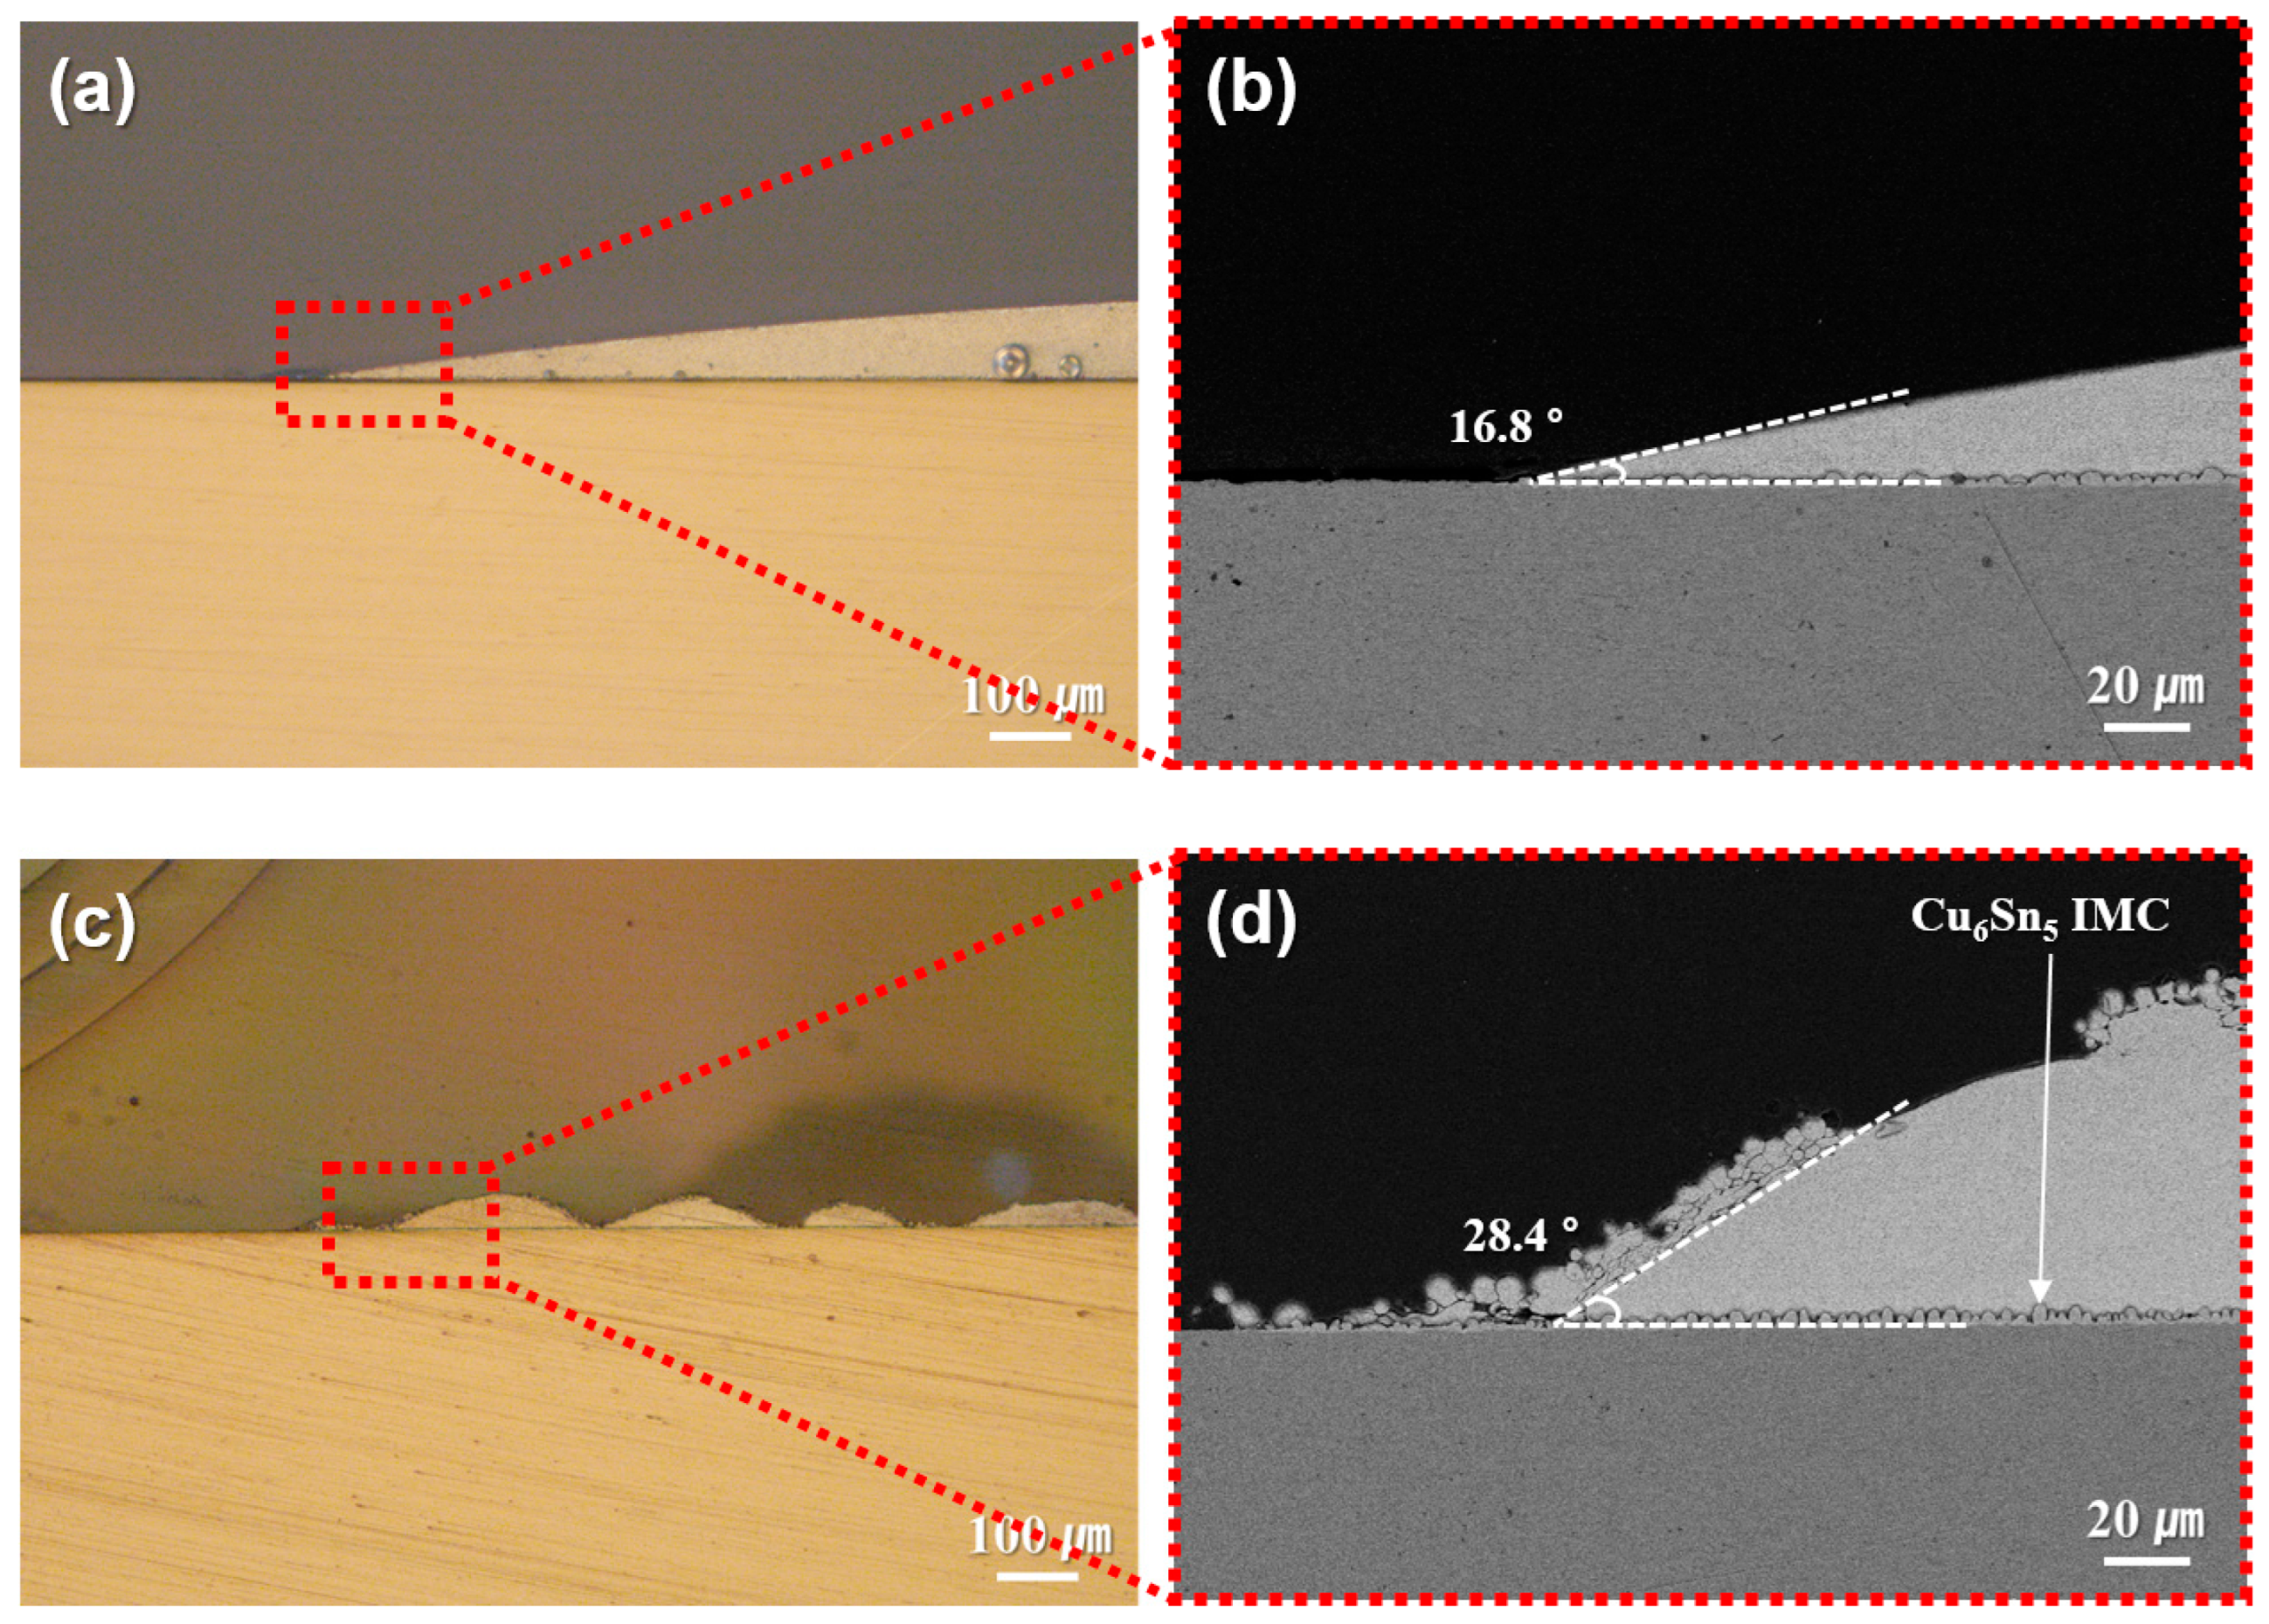
The reduction behavior of EW-10, used as a reductant in the sheet fabrication process, was confirmed as shown in Figure 2. Solder pastes containing type 7 SAC305 powder were prepared using either EW-10 or a commercial no-clean flux and reflowed on Cu plates at 250 °C. The resulting cross-sectional morphologies of the joints are presented in Figure 2. Compared with the results (wetting angle: 16.8°) obtained using the commercial flux (Figure 2a,b), the joints prepared with EW-10 (Figure 2c,d) exhibited signs of lower reducibility, including the presence of non-wet particles and an increased wetting angle (28.4°) at the formed solder caps. Nevertheless, EW-10 demonstrated sufficient reducing capability to activate both the SAC305 powder and the Cu surface, leading to wetting of the SAC305 particles on the Cu substrate. As a result, the formation of a Cu6Sn5 IMC layer was confirmed at the reaction interface. Unlike flux, EW-10 can rapidly evaporate and be removed in the temperature range exceeding 200 °C.
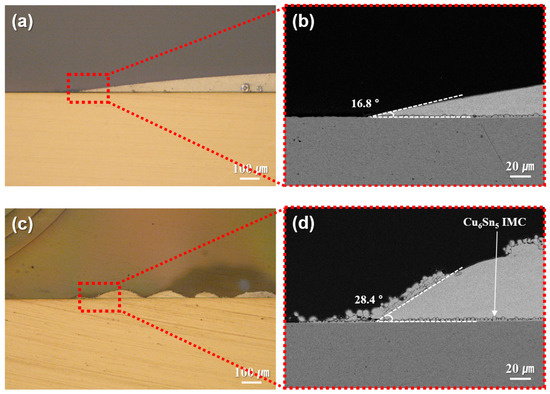
Figure 2.
Cross-sectional microstructures of type 7 SAC305 powder-containing pastes reflowed at 250 °C on Cu plates using (a,b) commercial flux and (c,d) EW-10 reductant.
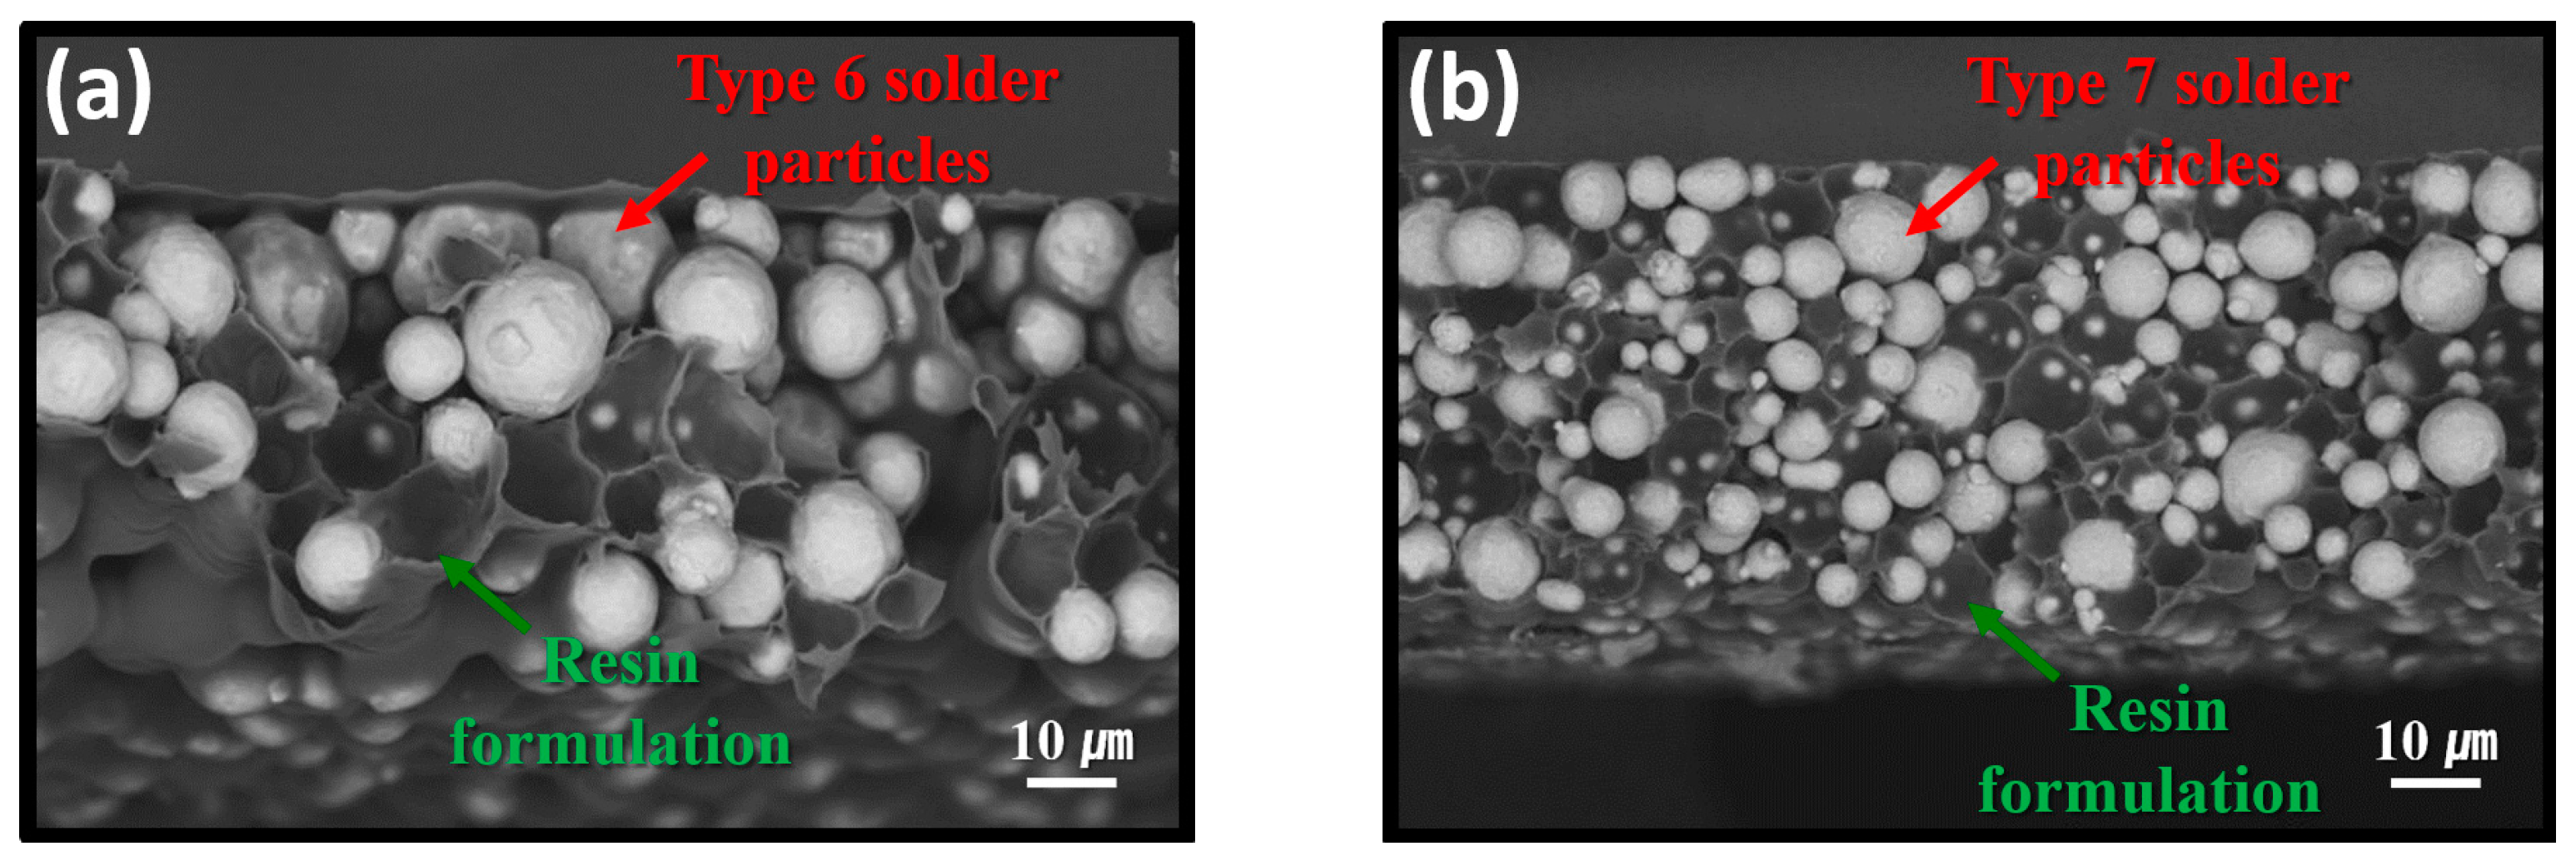
Figure 3 presents SEM BSE images showing cross-sectional structures of the fabricated sheets. In the sheet containing type 6 powder (Figure 3a), the SAC305 particles appeared significantly larger than those in the sheet containing type 7 powder (Figure 3b), consistent with their nominal size ranges of approximately 5–15 μm for type 6 and 2–11 μm for type 7. The average particle size difference between the two types was approximately 2.5-fold. Owing to the stencil printing process used for fabrication, both the type 6- and type 7-based sheets exhibited a uniform thickness of approximately 100 µm. Additionally, the resin formulation uniformly surrounded the SAC305 particles, forming a consistent matrix structure in both sheets.

Figure 3.
Cross-sectional SEM BEI images of the fabricated sheets containing (a) type 6 and (b) type 7 SAC305 powders.
Figure 4 shows the TG-DTA results of the sheets containing type 6 SAC powder (Figure 4a) and type 7 powder (Figure 4b). Both sheets exhibited similar thermal behavior. The first endothermic peaks, observed at 225.7 °C in Figure 4a and 223.9 °C in Figure 4b, correspond to the melting of the solder particles. The second endothermic peaks, appearing at 372.9 °C in Figure 4a and 385.3 °C in Figure 4b, are attributed to the thermal decomposition of PMMA. The weight loss of the sheets occurred in two distinct stages. The first stage, ranging from approximately 60 °C to the end of the first endothermic peak, is primarily associated with the evaporation of residual solvent and reductant. The second stage, from approximately 325 °C to 410–420 °C, is attributed to the thermal decomposition of PMMA.
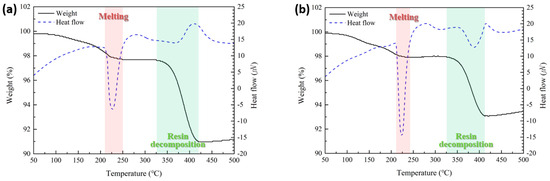
Figure 4.
TG-DTA results of the fabricated sheets containing (a) type 6 and (b) type 7 SAC305 powders.
When type 7 powder was used instead of type 6, the solder melting endothermic peak appeared slightly earlier and exhibited a significantly narrower width. This behavior is attributed to the reduced particle size, which allows all particles to melt more simultaneously within a shorter time. Additionally, the weight loss caused by the thermal decomposition of PMMA reached approximately 9% in the sheet with type 6 powder, whereas it was reduced to around 7% in the sheet with type 7 powder. This reduction is likely due to the influence of particle size on the out-gassing behavior of PMMA during decomposition. Specifically, as shown in Figure 3b, the PMMA matrix located between the smaller type 7 particles experiences a more confined and tortuous out-gassing path during decomposition. As a result, the gas escapes more slowly, leading to lower overall weight loss within the same timeframe. This hindered out-gassing also contributed to a slight delay in the onset temperature of the endothermic peak associated with PMMA decomposition.
3.2. Bonding Properties of a Solder Sheet
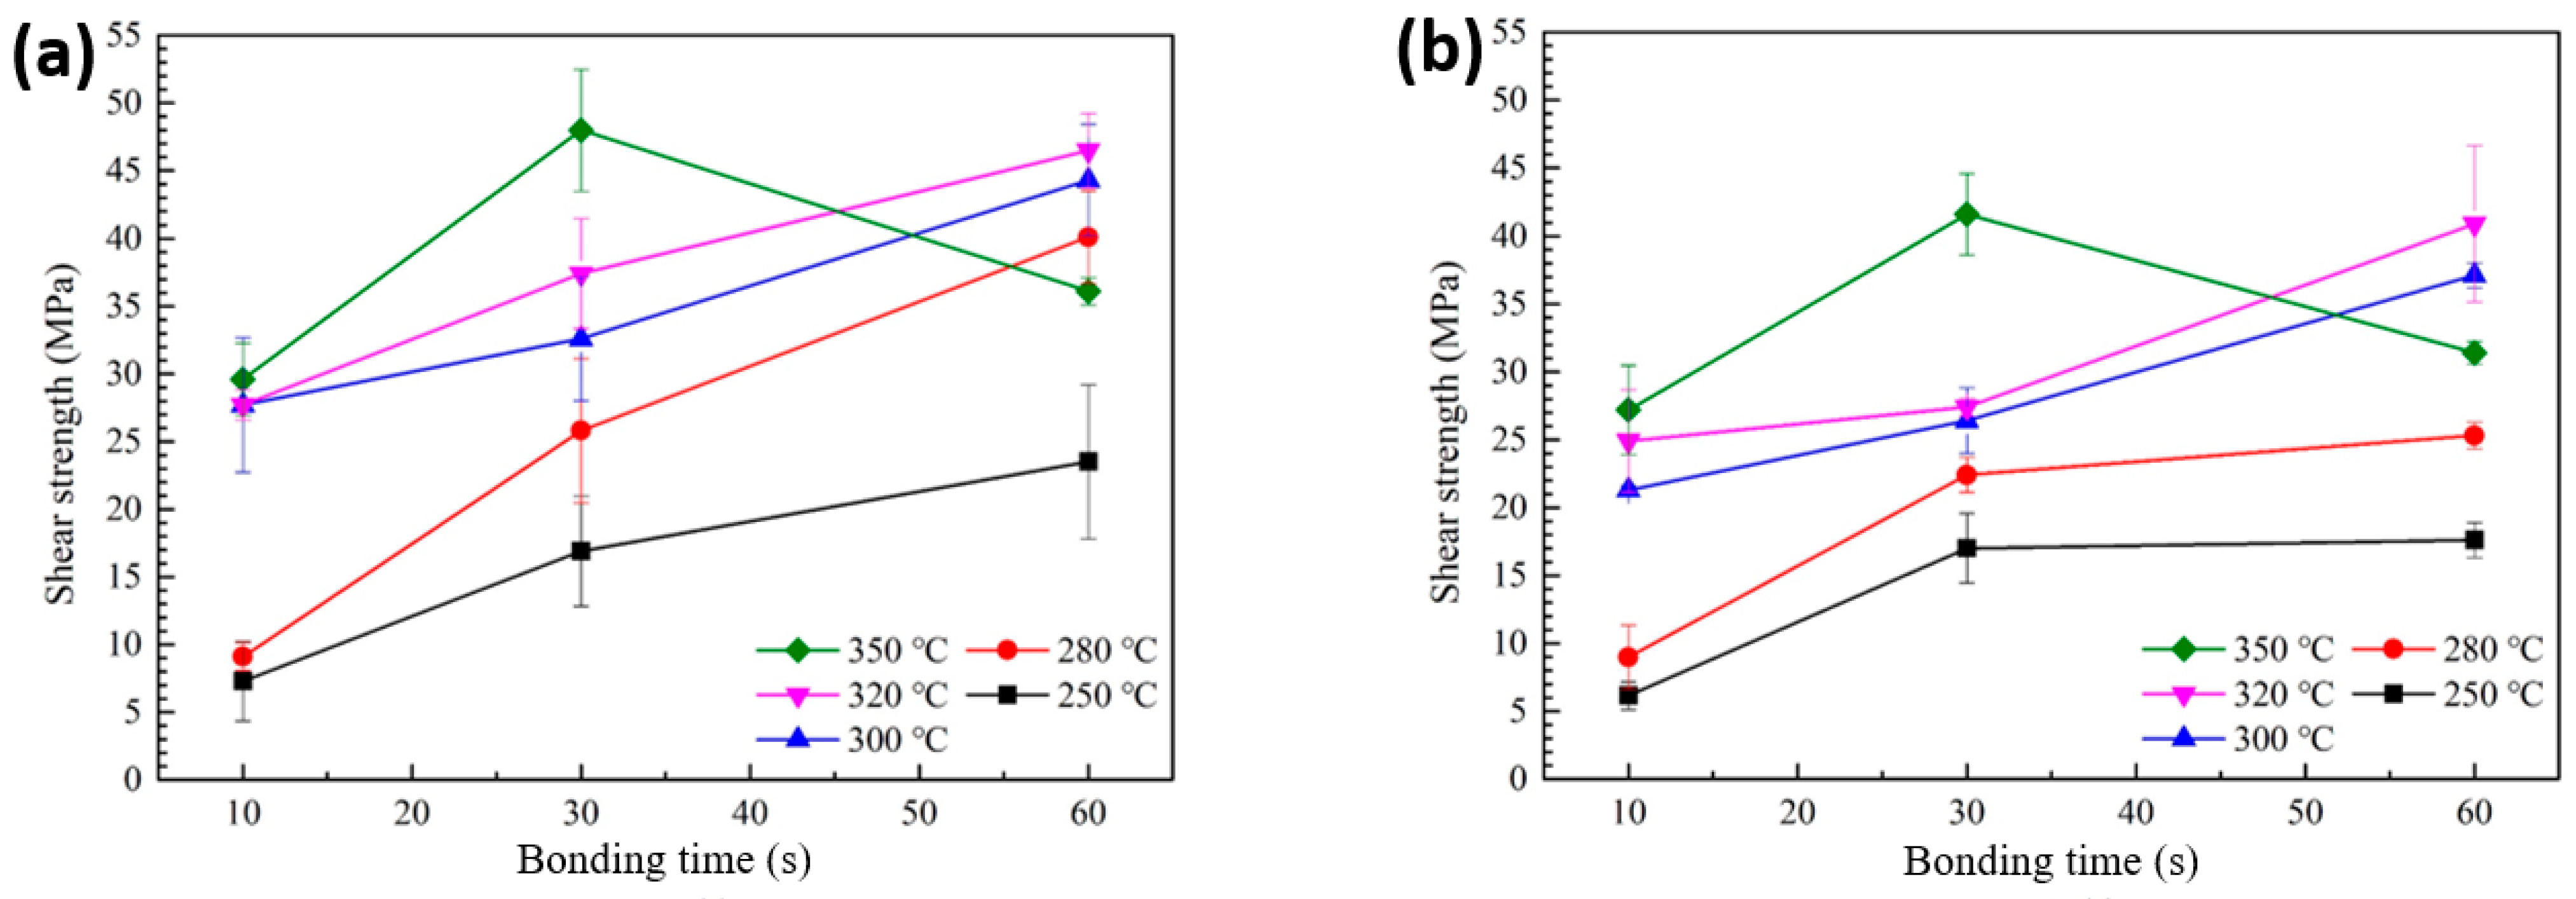
Figure 5a presents the shear strength values of solder joints formed using the sheet with type 6 SAC305 powder, bonded in air at temperatures ranging from 250 to 350 °C, as a function of bonding time. At 250 °C, the shear strength started at a relatively low value of 7.3 MPa for a bonding time of 10 s and increased to 23.5 MPa at 60 s. However, significant amounts of PMMA remained in the joint, indicating that the polymer was not fully decomposed and removed during bonding. When the bonding temperature was increased to 280 °C, the shear strength was still low at 9.1 MPa for 10 s but increased to 25.8 MPa at 30 s and reached 40.1 MPa at 60 s, showing a substantial improvement. At 300 °C, even a short bonding time of 10 s resulted in a shear strength of 27.7 MPa, which further increased to 44.3 MPa at 60 s. A similar trend was observed at 320 °C. However, at 350 °C, the shear strength increased from 29.6 MPa at 10 s to a maximum of 48.0 MPa at 30 s, but then significantly decreased to 36.1 MPa at 60 s. This reduction suggests that prolonged exposure to excessively high temperatures may degrade the joint integrity or introduce defects.

Figure 5.
Shear strength of solder joints formed with different bonding temperatures and bonding times: (a) type 6 SAC and (b) type 7 SAC solder sheet.
Figure 5b shows the variation in shear strength of solder joints formed using the sheet with type 7 SAC305 powder under bonding conditions of 250–350 °C in air, as a function of bonding time. At 250 °C, incomplete removal of PMMA from the joint resulted in a low initial shear strength of 6.1 MPa at 10 s, which only increased to 17.6 MPa even after 60 s of bonding. When the bonding temperature was raised to 280 °C, the shear strength was 9.0 MPa at 10 s, increased to 22.4 MPa at 30 s, and reached 25.3 MPa at 60 s. A noticeable improvement in bonding strength from the early stage of bonding was observed at 300 °C, where a strength of 21.3 MPa was obtained at 10 s and increased to 37.1 MPa at 60 s. A similar trend was also observed at 320 °C. However, when the bonding temperature was further increased to 350 °C, the strength rose from 27.1 MPa at 10 s to 41.6 MPa at 30 s, but then decreased to 31.4 MPa at 60 s. Overall, the shear strengths obtained using the sheet with type 7 SAC305 powder were slightly lower than those achieved with type 6 under the same bonding conditions. This difference is attributed to the reduced amount of decomposed PMMA observed in the TG-DTA results, which likely suppressed the degree of linkage and coarsening between solder particles during reflow. As observed in Figures S2 and S3, this led to insufficient solder interconnection formation in the bond-line, accompanied by increased regions of residual PMMA and void formation.
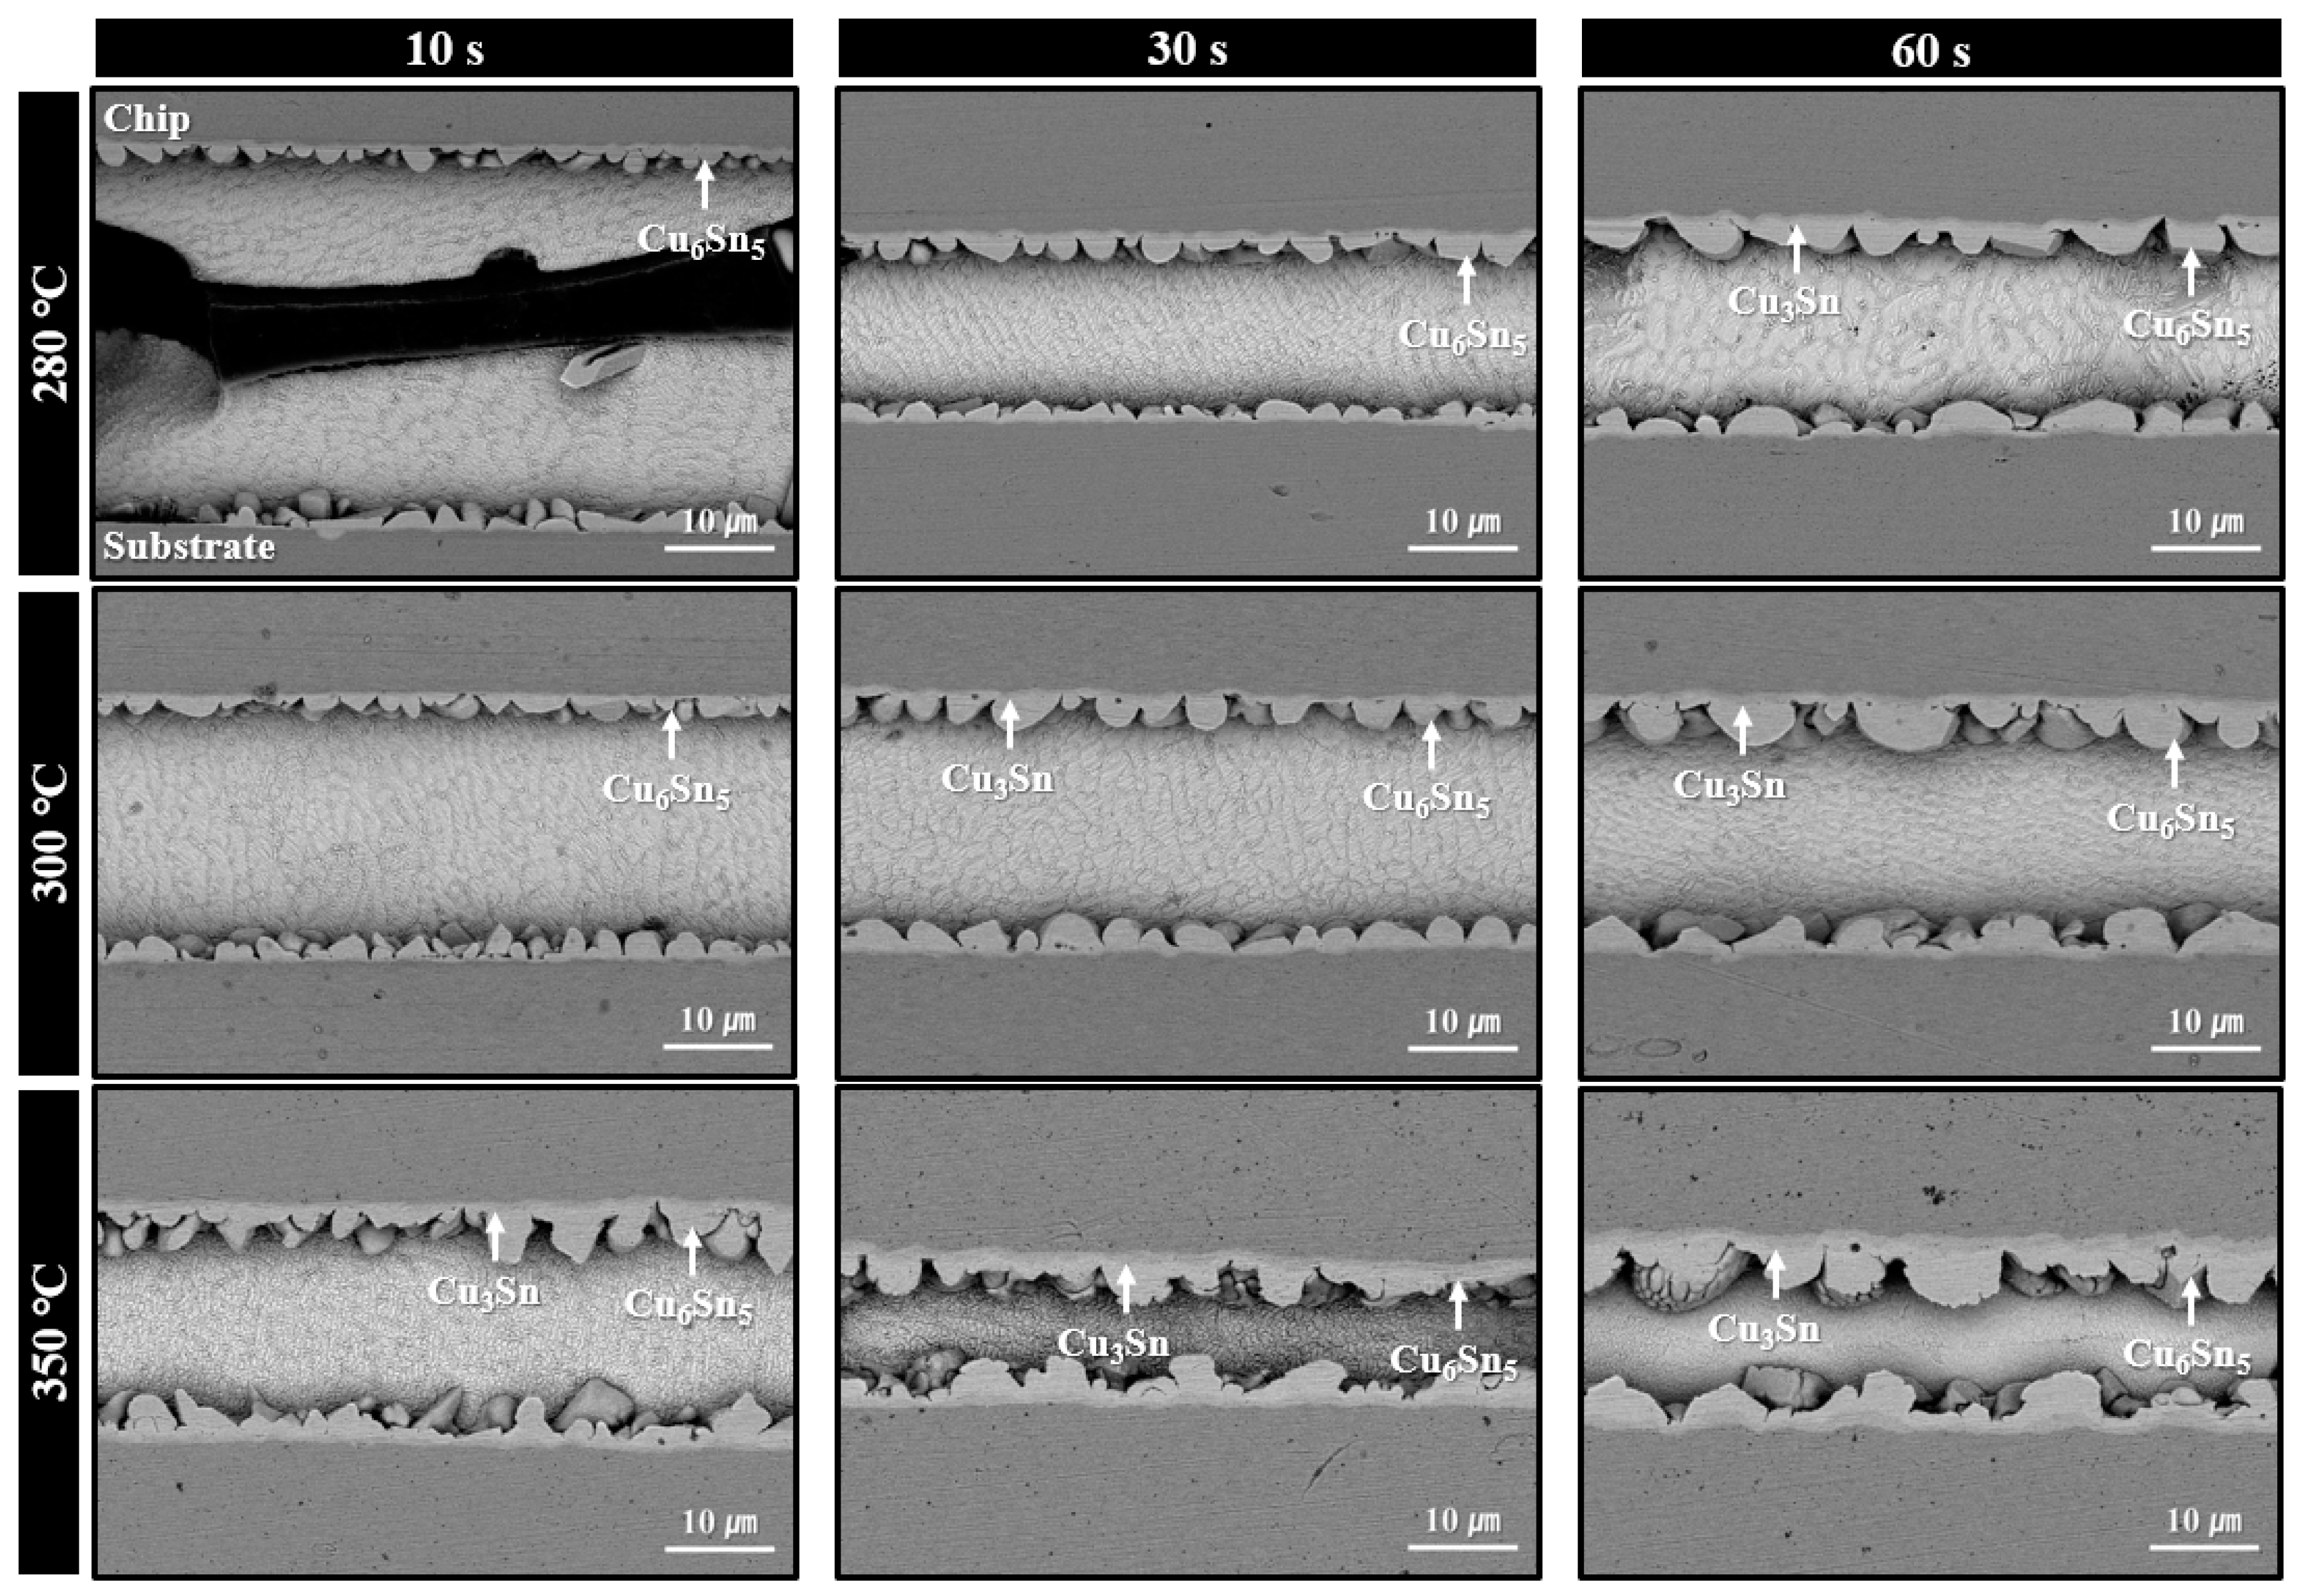
Figure 6 displays the microstructures of solder joints formed using the sheet with type 6 SAC305 powder under bonding in air at 280–350 °C for various bonding times. Under the 280 °C bonding condition, a short bonding time of 10 s resulted in minimal thermal decomposition of PMMA, leaving significant amounts of residual PMMA within the joint and preventing successful solder interconnection. This microstructure clearly explains the low shear strength (less than 10 MPa) observed in Figure 5. However, from 30 s of bonding, a noticeable reduction in residual PMMA was observed. At 60 s, desirable microstructures were formed, showing solder interconnections accompanied by the formation of IMC layers at both the upper and lower interfaces. According to the SEM images, only Cu6Sn5 IMC layers were observed at both interfaces after 30 s of bonding. However, after 60 s, both Cu6Sn5 and Cu3Sn IMC layers were detected at the top and bottom interfaces. Although the TG-DTA result in Figure 4a indicated that PMMA decomposition begins at approximately 325 °C, the clear evidence of PMMA removal at 280 °C bonding suggests that the applied pressure during bonding facilitated the decomposition of PMMA even at lower temperatures.
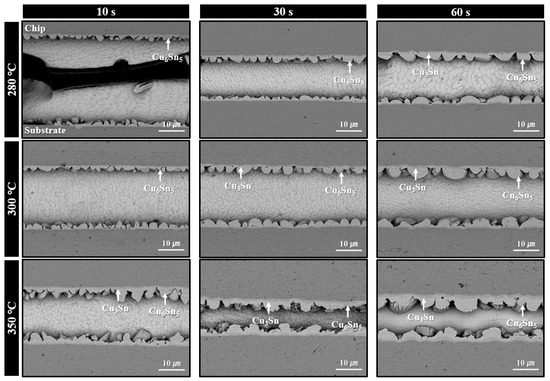
Figure 6.
Shear cross-sectional SEM BSE images of solder joints formed using the sheet with type 6 SAC305 powder at 280–350 °C under various bonding times in air.
In contrast, for the samples bonded at 300 °C, thermal decomposition and removal of PMMA proceeded actively even at a bonding time of 10 s, resulting in well-formed solder interconnections across most of the joint area. As a result, only Cu6Sn5 IMC layers were observed after 10 s of bonding, while both Cu6Sn5 and Cu3Sn IMC layers were present at both interfaces after 30 s of bonding. Meanwhile, in the samples bonded at 350 °C, well-defined solder interconnections with negligible residual PMMA were observed from as early as 10 s, along with the formation of both Cu6Sn5 and Cu3Sn IMC layers. However, the microstructure of the joint bonded for 60 s showed excessively thick IMC layers. It is well known that such overly thick IMC layers can degrade the mechanical properties and reliability of the joint [13,14,15].
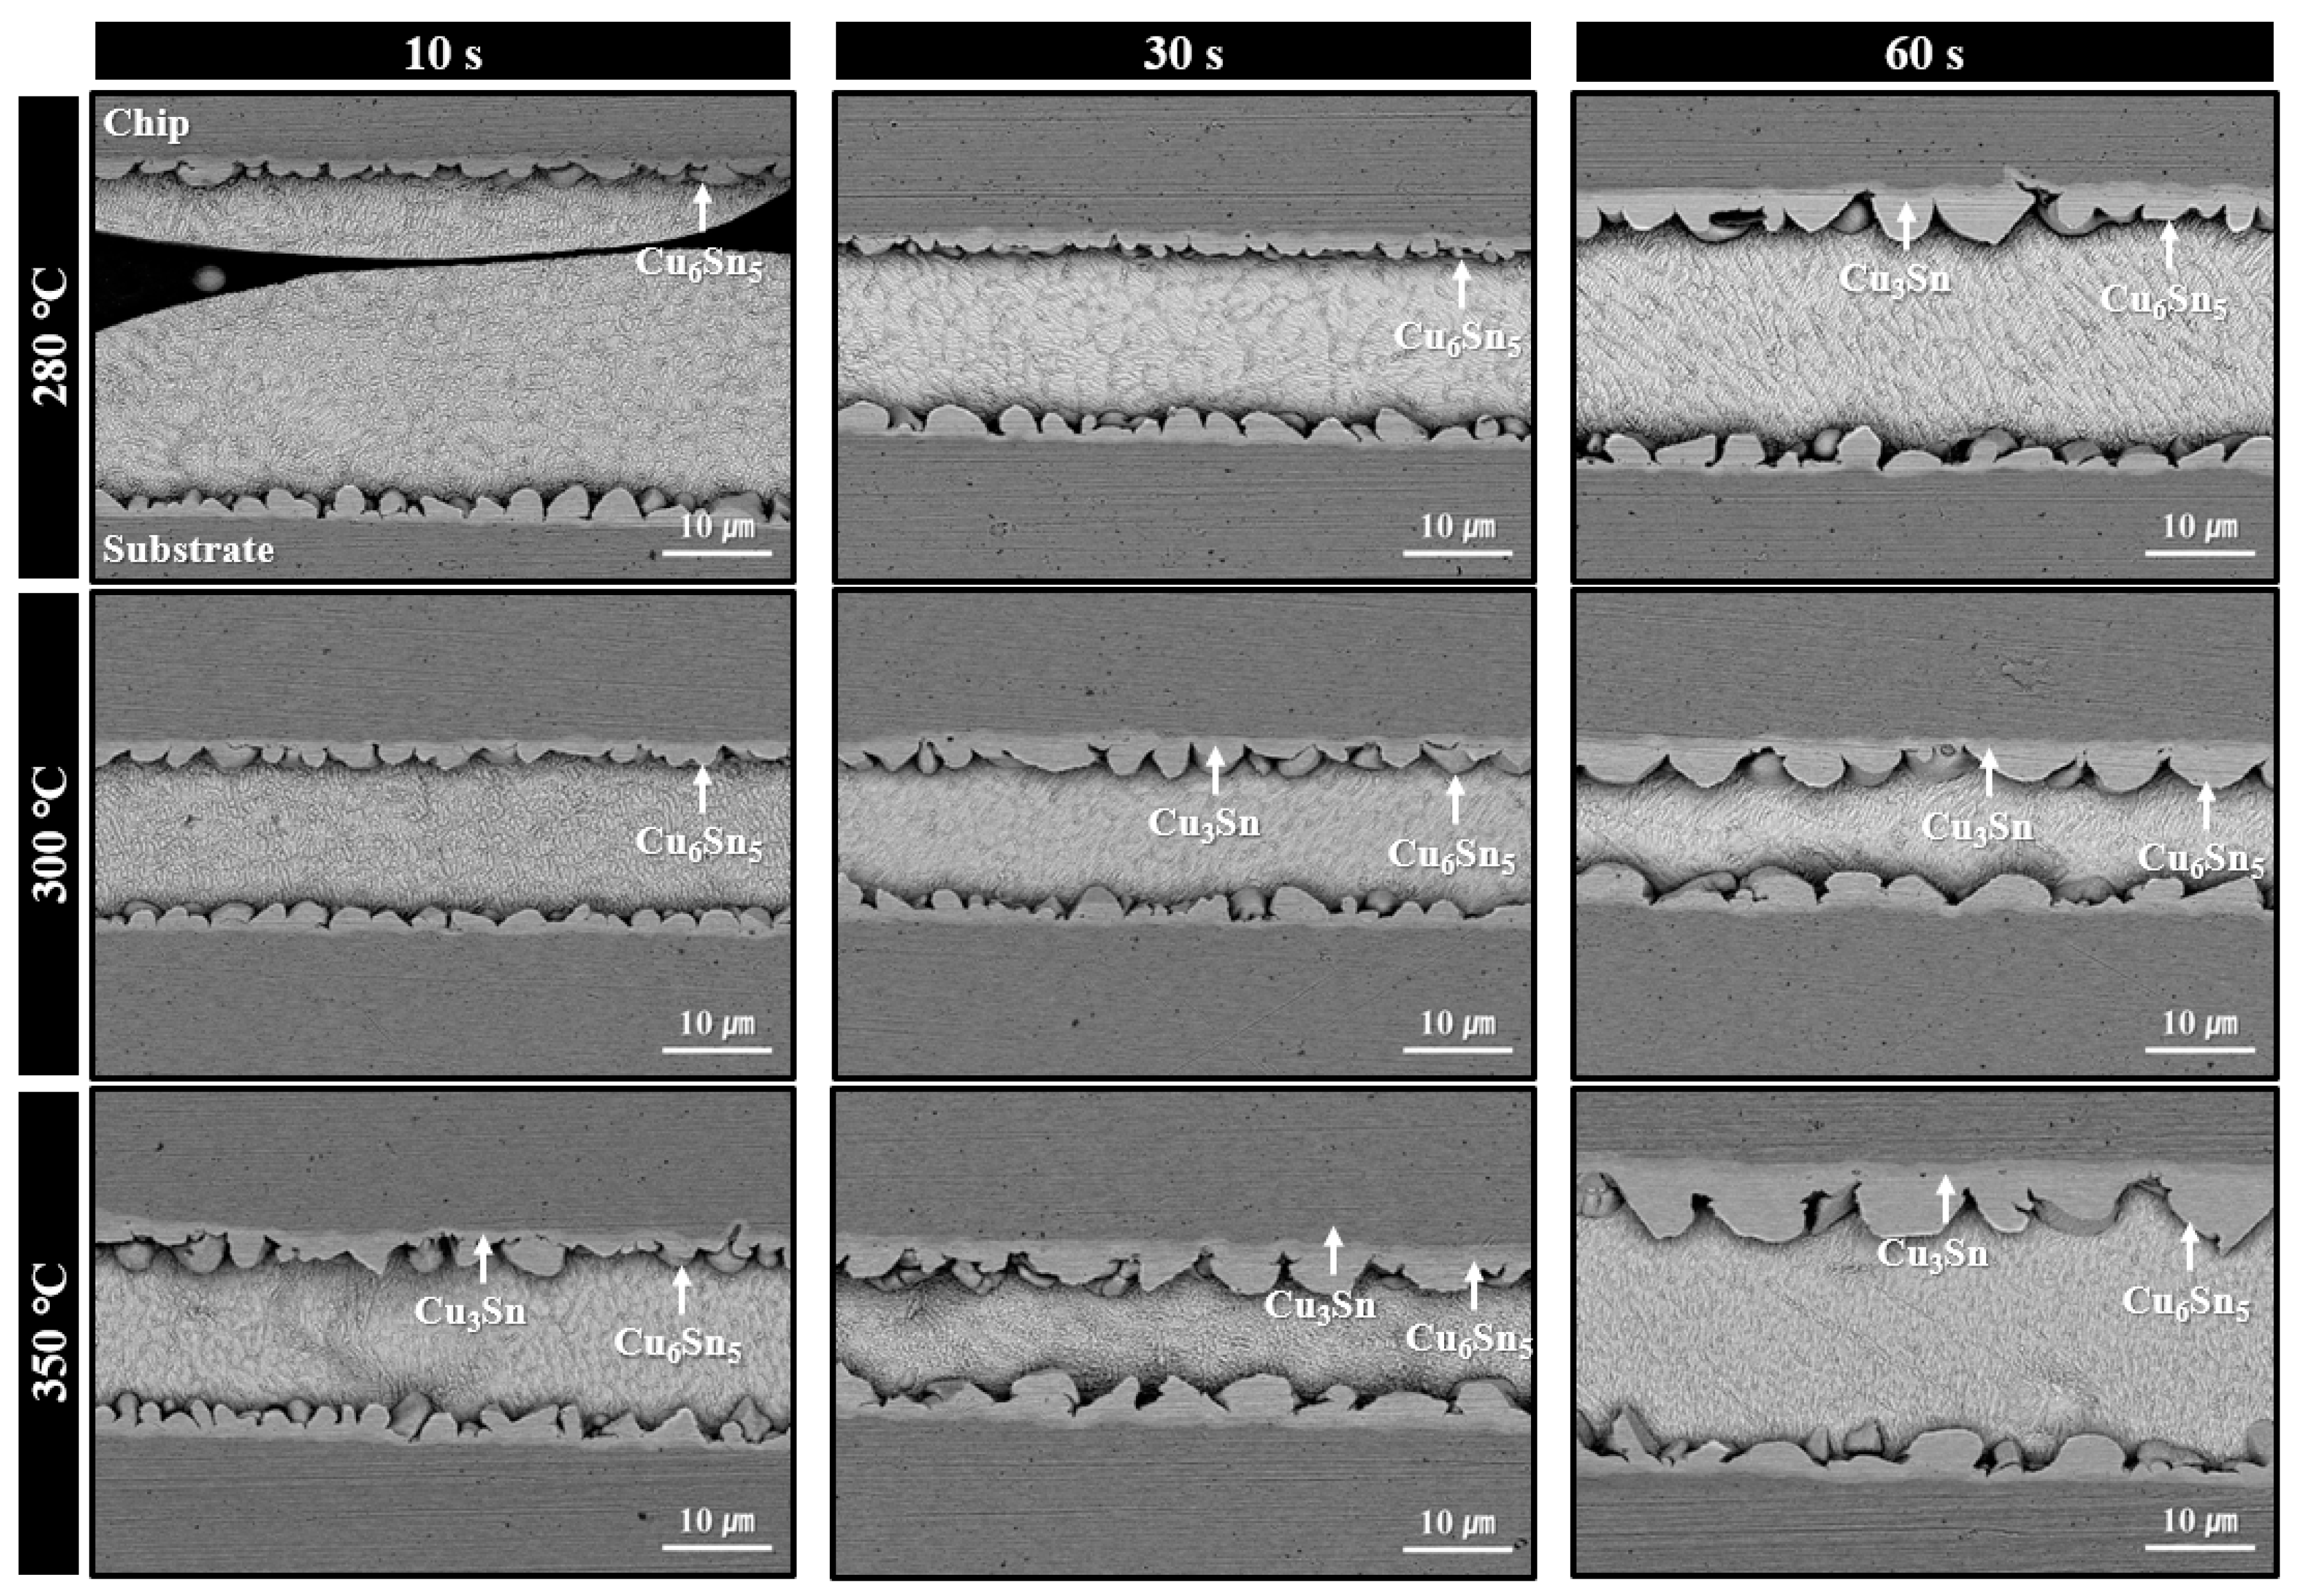
Microstructures of solder joints formed using the sheet with type 7 SAC305 powder under bonding in air at 280–350 °C for various bonding times are shown in Figure 7. At 280 °C, minimal thermal decomposition of PMMA was observed at a bonding time of 10 s, resulting in significant PMMA residue and poor solder interconnection. However, by 30 s, the amount of residual PMMA was significantly reduced, and by 60 s, solder interconnections were formed across most regions of the joint. According to SEM images, only Cu6Sn5 phases were observed at the interface after 30 s of bonding, while both Cu6Sn5 and Cu3Sn IMC layers were present after 60 s. Similar to the case with type 6 powder, this indicates that the applied pressure during bonding accelerated PMMA decomposition, initiating the process at temperatures lower than that observed in the TG-DTA result of Figure 4b. For the samples bonded at 300 °C, well-formed solder interconnections with interfacial Cu6Sn5 IMC layers were already observed at 10 s. At 30 s, further growth of Cu6Sn5 along with the appearance of Cu3Sn layers was confirmed. At 350 °C, complete PMMA removal and the formation of both Cu6Sn5 and Cu3Sn layers were observed from 10 s bonding. However, the total IMC thickness was already substantial at 30 s and became the thickest at 60 s. Accordingly, in Figure 5b, the shear strength (41.6 MPa) was excellent at 30 s, but dropped significantly to 31.4 MPa at 60 s, likely due to the adverse effects of excessive IMC growth.

Figure 7.
Shear cross-sectional SEM BSE images of solder joints formed using the sheet with type 7 SAC305 powder at 280–350 °C under various bonding times in air.
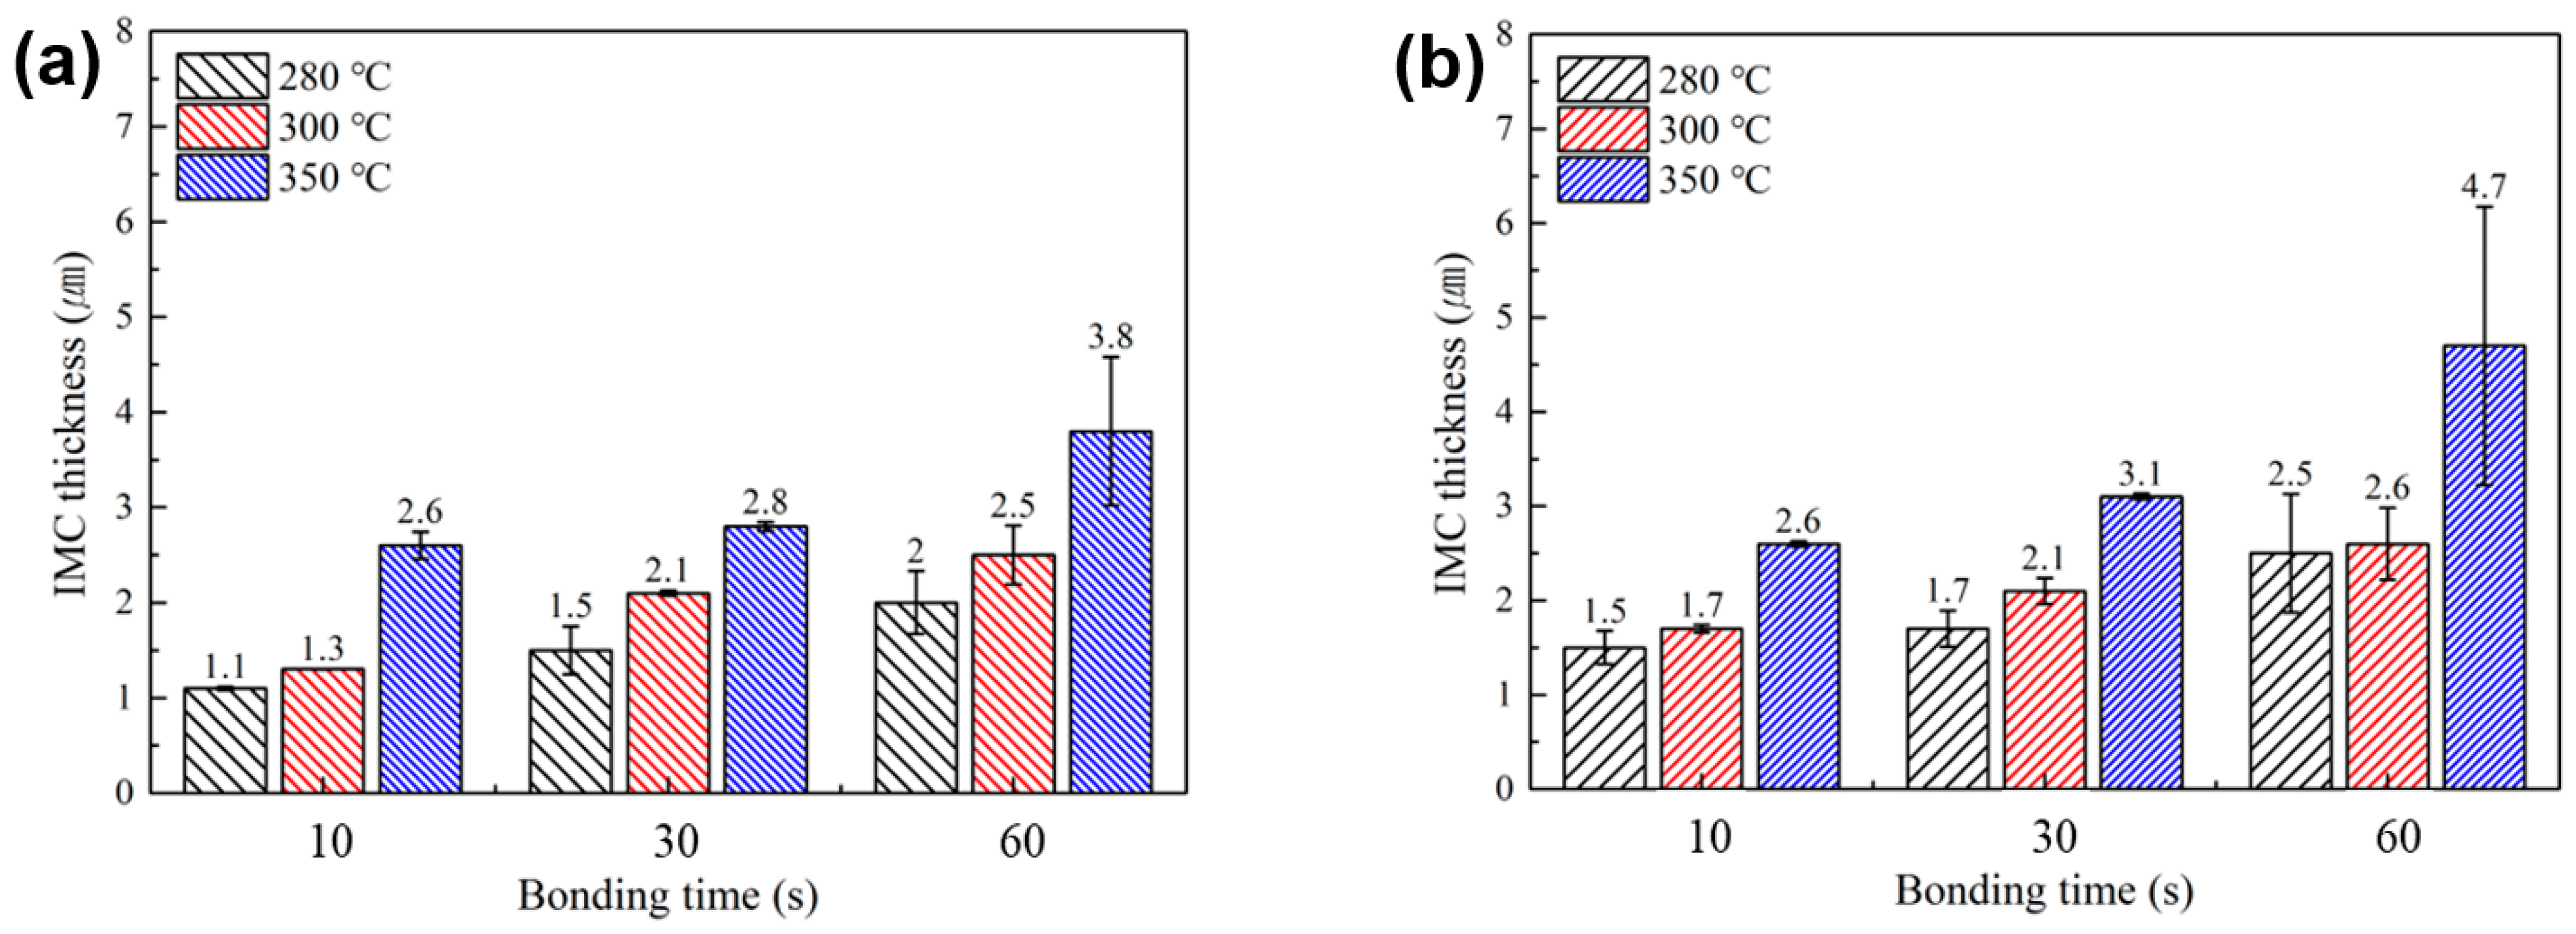
Figure 8 summarizes average thickness of interfacial IMC layers formed at the upper and lower bond-line interfaces under various bonding temperatures and times, as observed in Figure 6 and Figure 7. Regardless of the SAC powder particle size, a clear trend of increasing IMC layer thickness with higher bonding temperatures and longer bonding times was observed. Notably, under all identical bonding temperature and time conditions, the total IMC thickness for the sheet containing type 7 SAC305 powder was equal to or greater than that for the sheet with type 6 powder. This result is attributed to the faster melting behavior of type 7 particles, which, as suggested by the TG-DTA results in Figure 4, promotes earlier and more rapid IMC formation reactions.
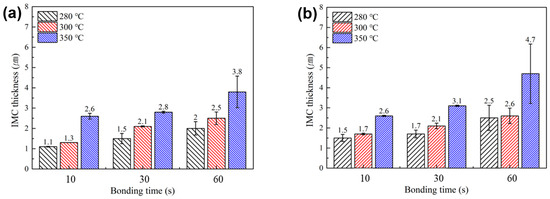
Figure 8.
Average thicknesses of interfacial IMC layers formed at the upper and lower interfaces of the bond-line under various bonding temperatures and times, for sheets containing (a) type 6 and (b) type 7 SAC305 powder.
3.3. Fractography
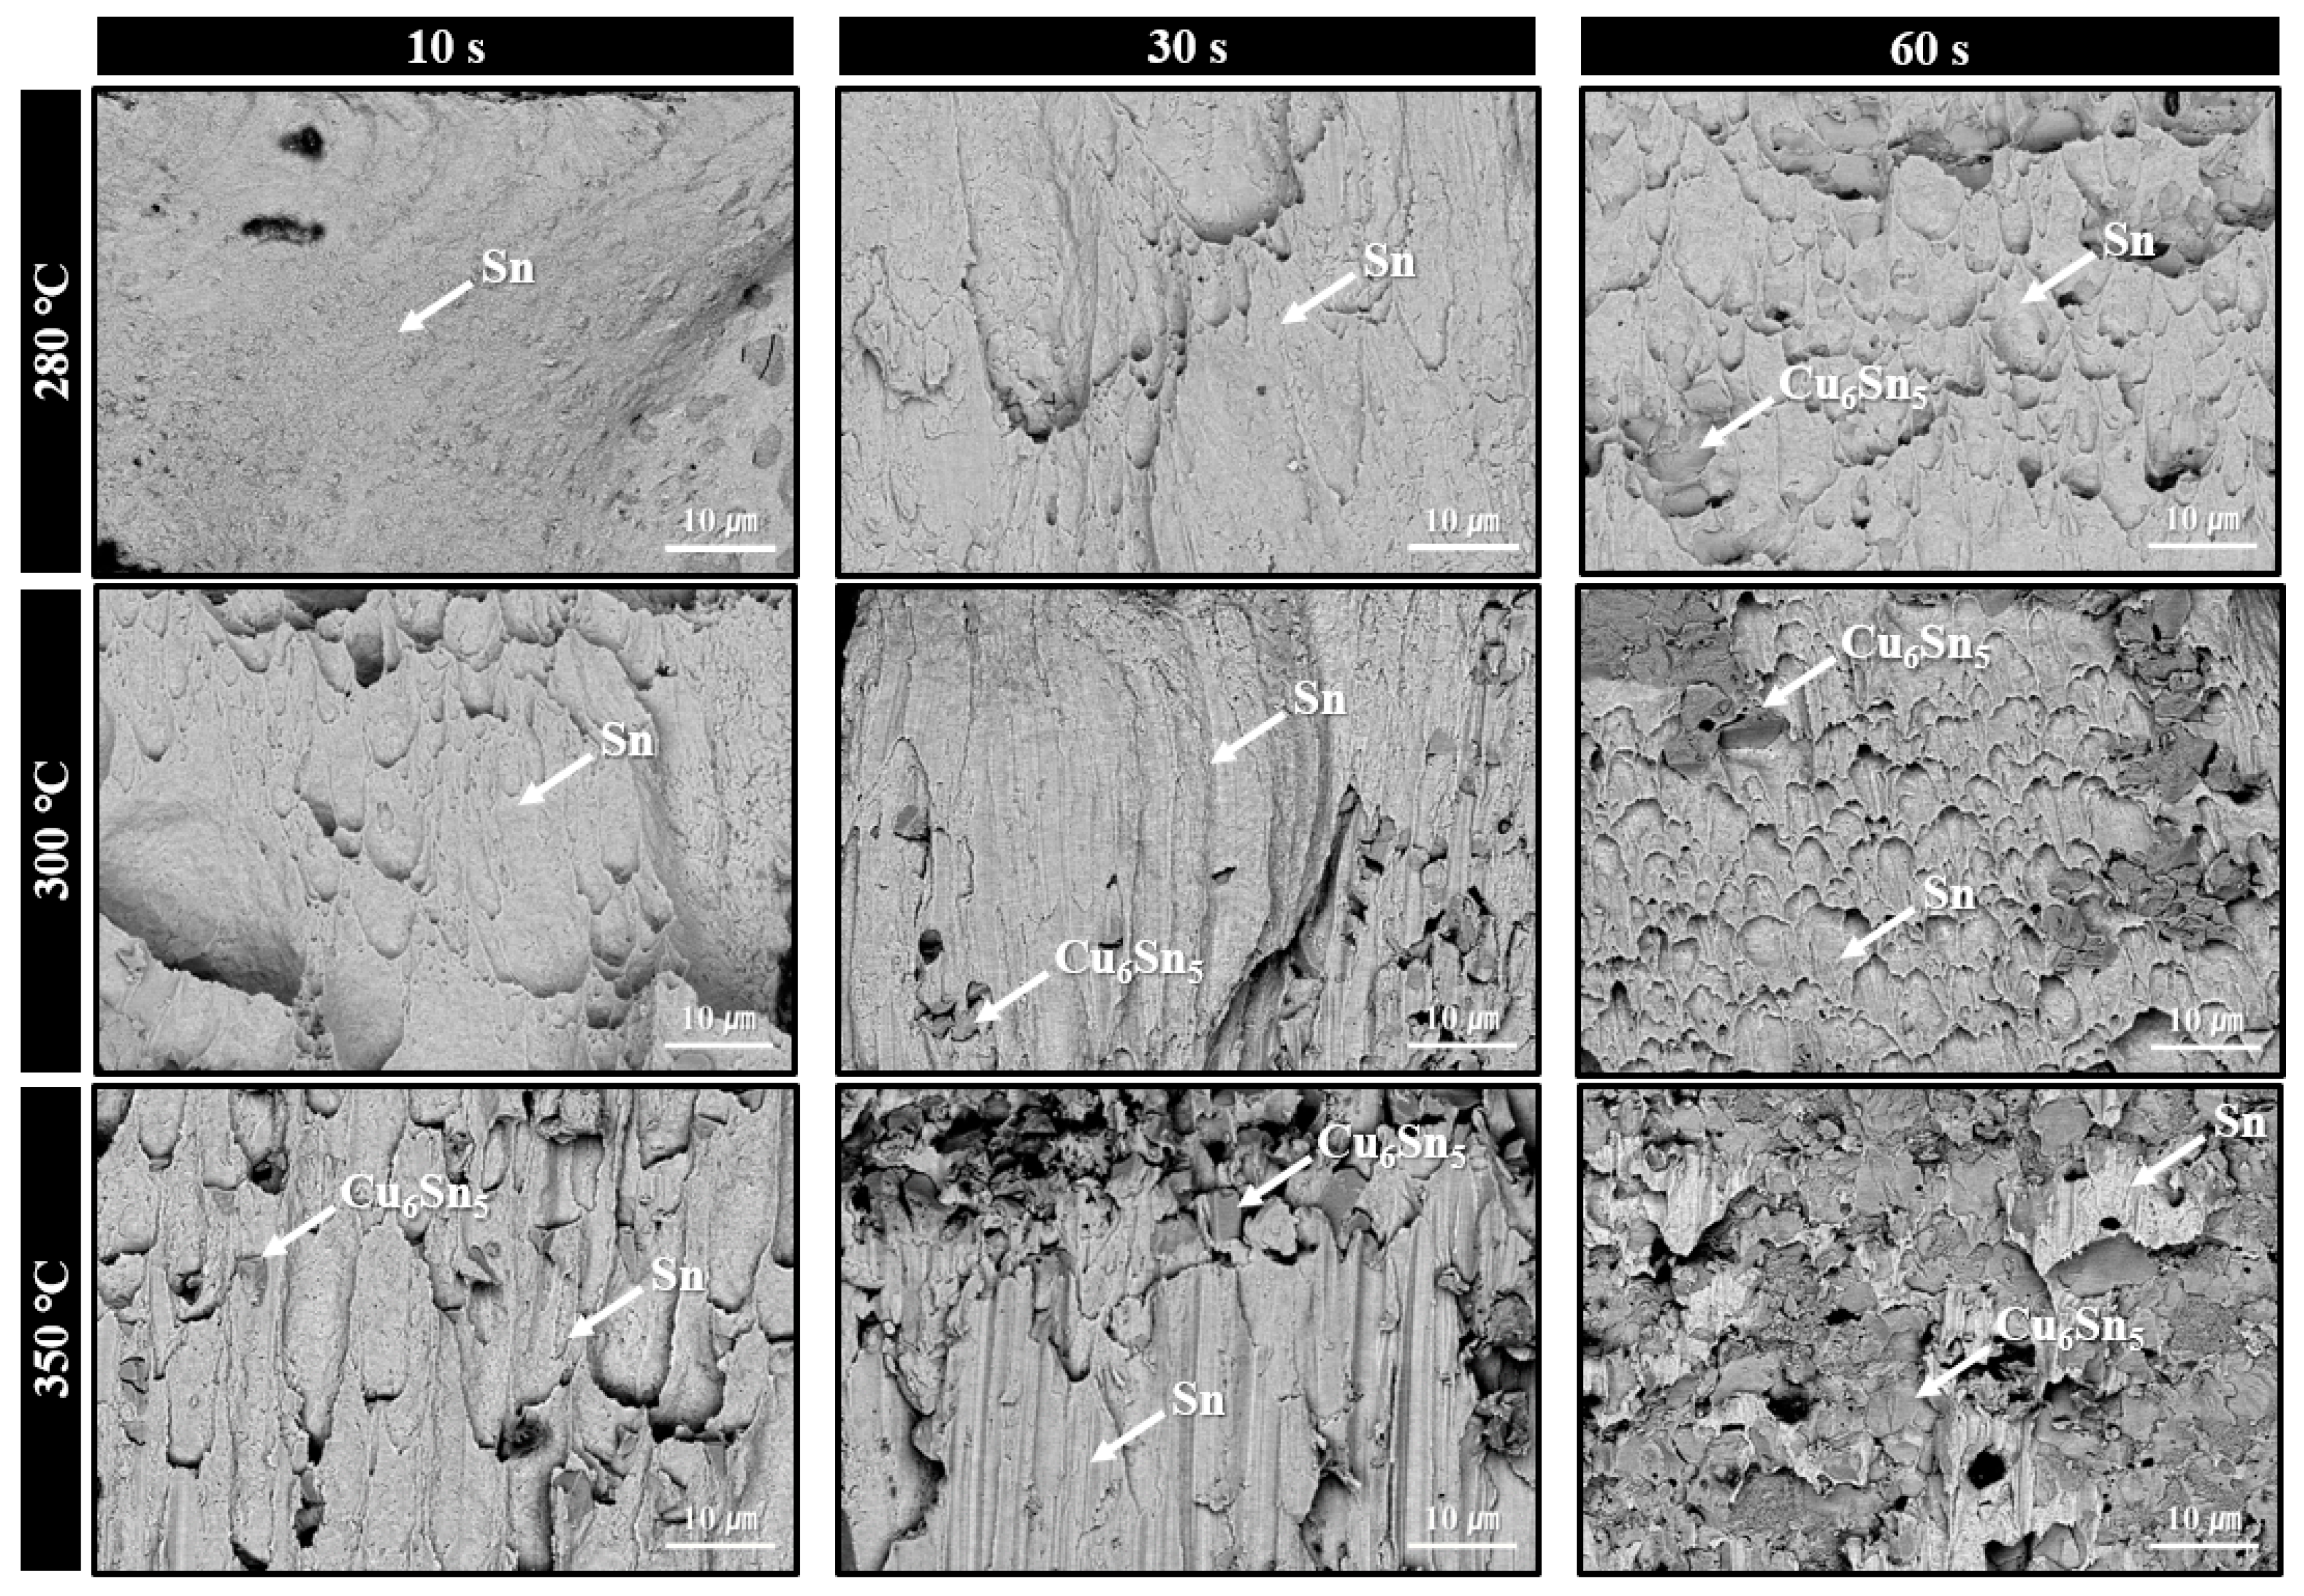
Figure 9 displays the fracture surfaces of solder joints formed using the sheet with type 6 SAC305 powder, bonded in air at 280–350 °C, after shear testing at various bonding times. At 280 °C with a bonding time of 10 s, where solder interconnection was not sufficiently established, almost no evidence of solder deformation or tearing along the shear direction was observed. However, with increased bonding times of 30 s and 60 s, fractured regions exhibiting elongated and torn solder structures became more pronounced. In the 300 °C bonding condition, elongated fracture features were already visible at 10 s, and reached their maximum extent at 30 s. At 60 s, a rougher fracture surface was observed, indicating that fracture likely occurred near the IMC layer. Locally, exposed Cu6Sn5 IMC phases were detected on the fracture surface. At 350 °C, the elongated solder microstructure reached its maximum already at 10 s, while partial exposure of Cu6Sn5 IMC phases was observed at 30 s. Lastly, at 60 s, Cu6Sn5 was exposed across most of the fracture surface, suggesting that fracture predominantly occurred along the Cu6Sn5 layer/solder interface. This fracture surface evolution trend closely corresponds with the shear strength results presented in Figure 5a.

Figure 9.
Fracture surface SEM BSE images of solder joints bonded under 0.05 MPa in air at 280–350 °C for various bonding times using the sheet containing type 6 SAC305 powder.
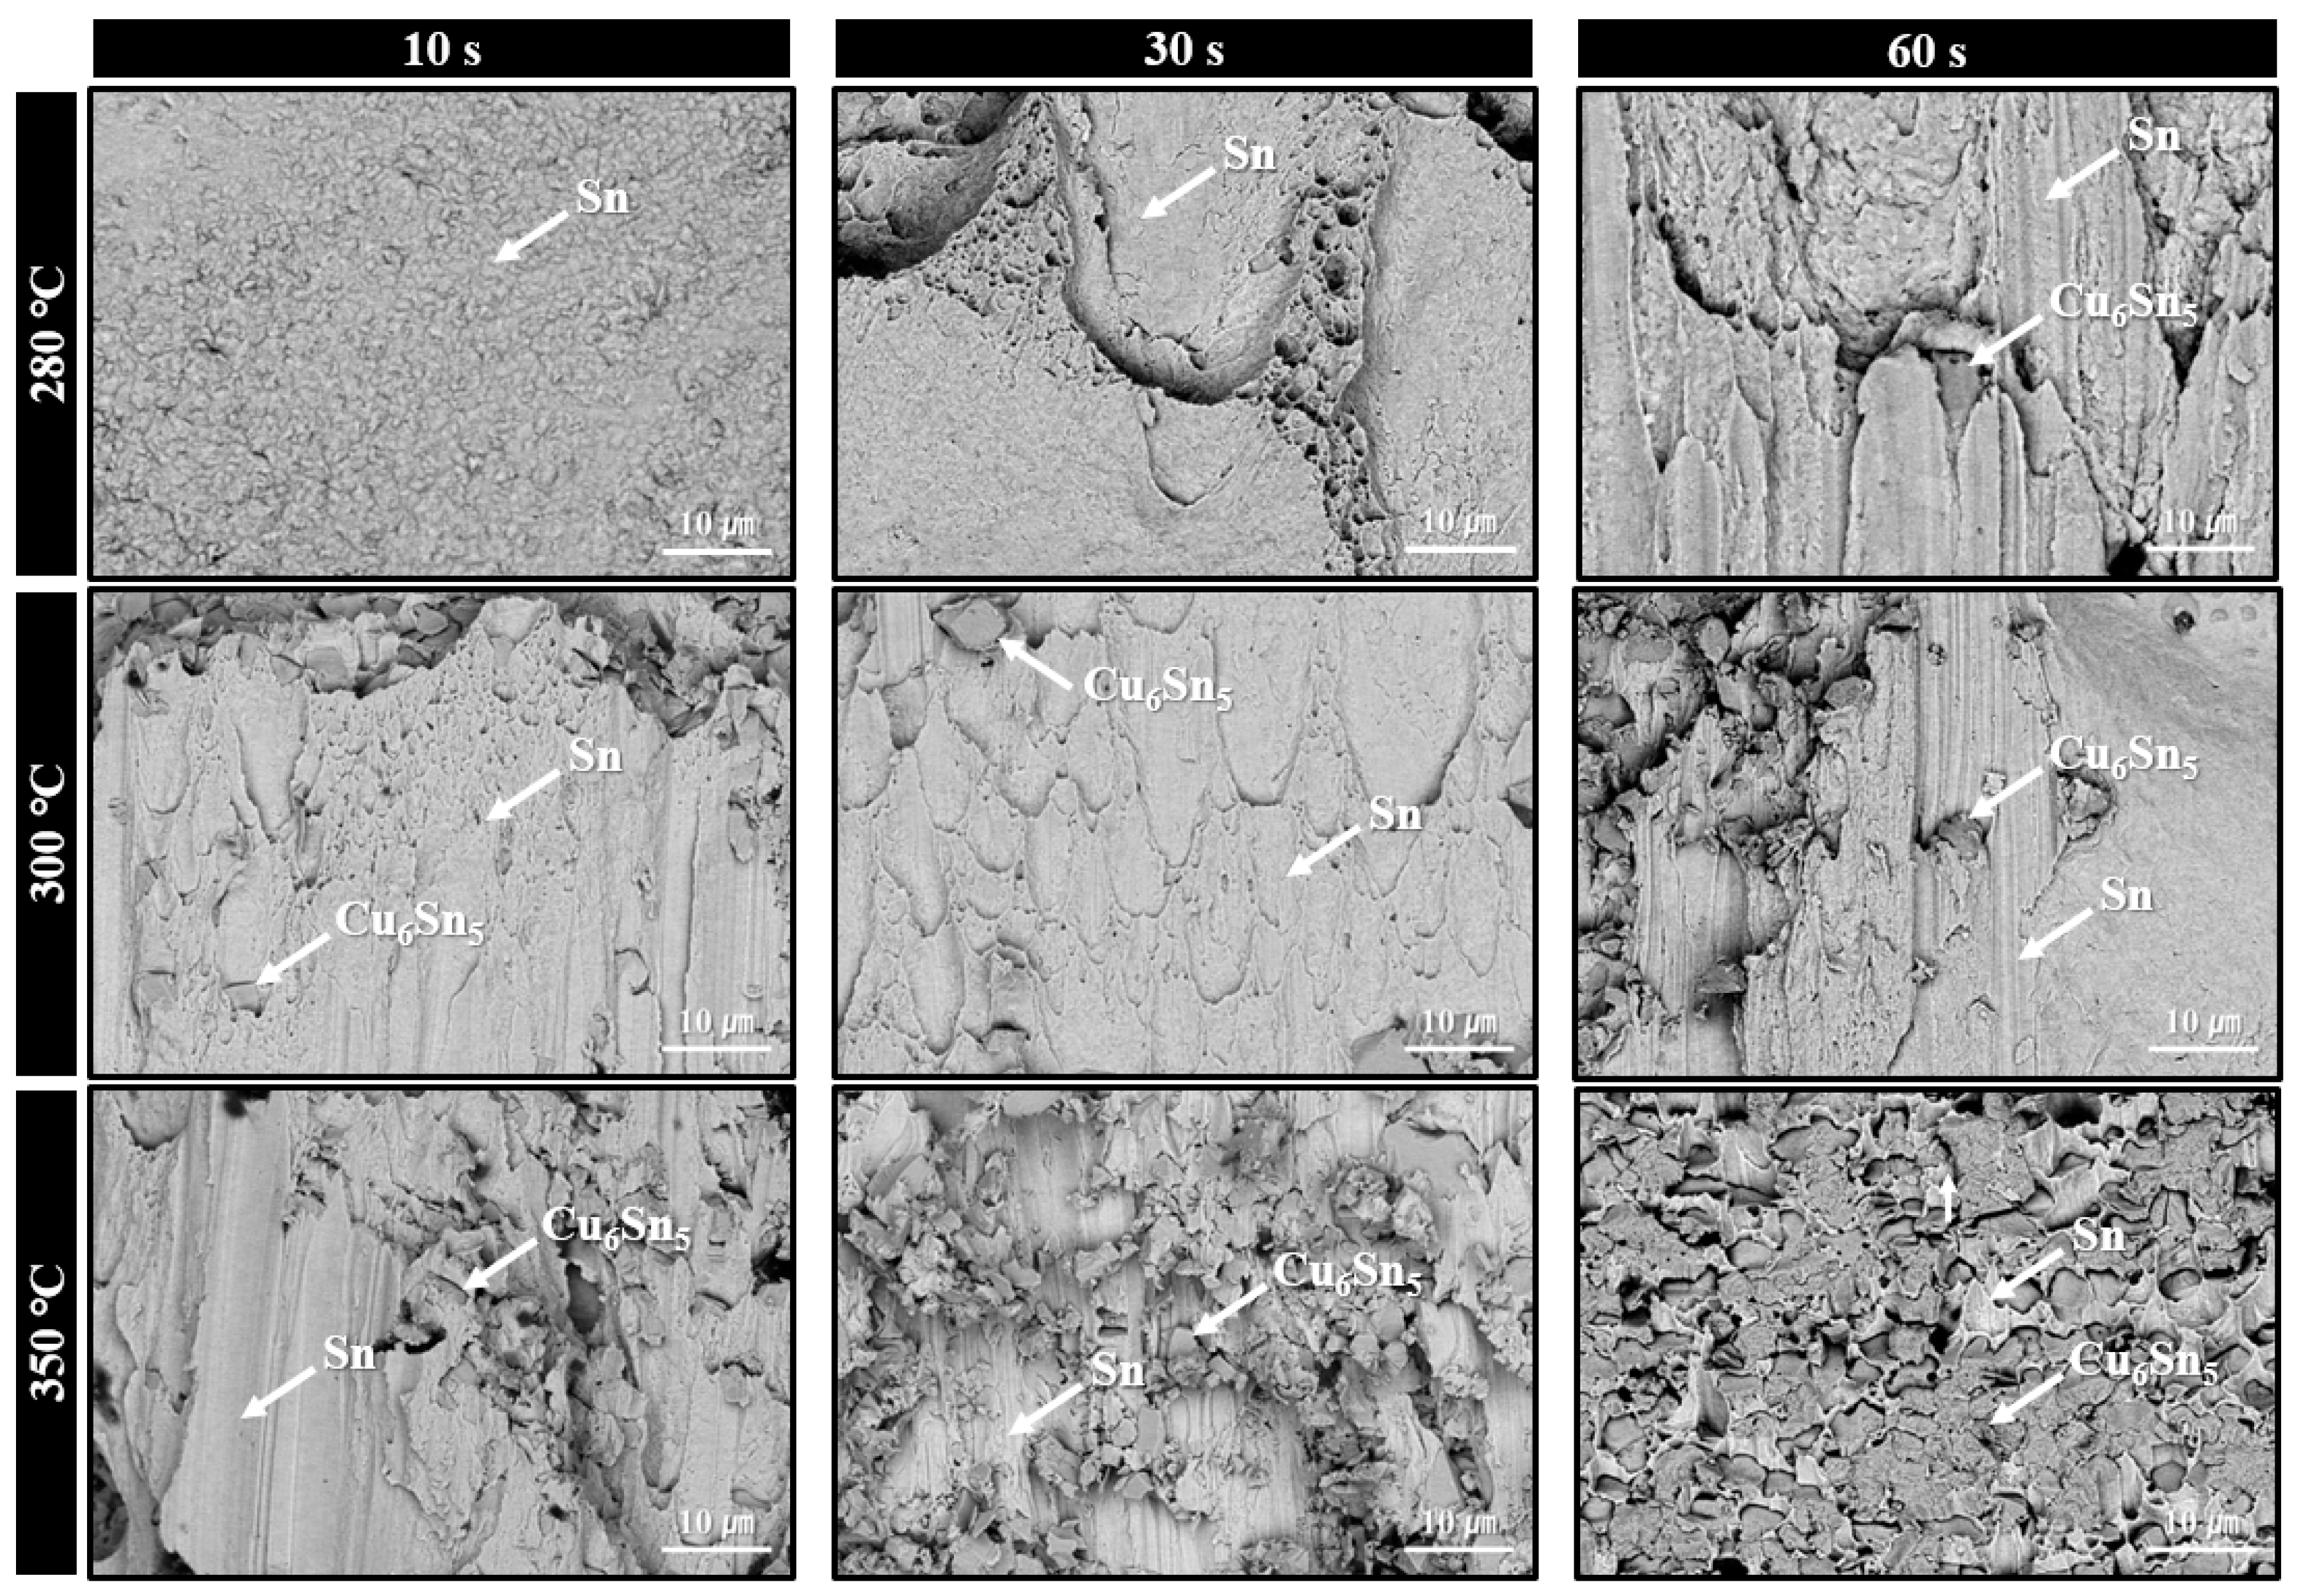
Figure 10 summarizes the fracture surfaces of solder joints formed using the sheet with type 7 SAC305 powder, bonded under the same conditions as those in Figure 9, and subjected to shear testing at various bonding times. At 280 °C and 10 s bonding time, insufficient solder interconnection resulted in a lack of observable deformation or tearing of the solder along the shear direction. However, as the bonding time increased to 30 s and 60 s, elongated and torn solder fracture features gradually developed. For the samples bonded at 300 °C, elongated surfaces were already evident at 10 s and became more pronounced at 30 s. At 60 s, rougher regions appeared locally on the fracture surface, accompanied by visible Cu6Sn5 IMC phases, indicating that fracture occurred near the IMC layer. At 350 °C, partial exposure of Cu6Sn5 was observed on the fracture surface as early as 10 s. This exposed area increased further at 30 s. By 60 s, Cu6Sn5 covered most of the fracture surface, suggesting that fracture predominantly occurred along the Cu6Sn5 layer/solder interface. These fracture surface evolution trends closely resemble those observed in Figure 9, and they are consistent with the joint behavior as a function of bonding temperature and time described in Figure 5b.

Figure 10.
Fracture surface SEM BSE images of solder joints bonded under 0.05 MPa in air at 280–350 °C for various bonding times using the sheet containing type 7 SAC305 powder.
4. Conclusions
A solder particle-containing sheet material was developed for die-attach applications, enabling solder interconnection while minimizing residual polymer within the bond-line. Bonding performance was evaluated using dummy copper die and substrate. In the fabricated sheet with a thickness of 100 µm, the resin formulation encapsulated SAC305 solder particles, forming the matrix structure. The sheet exhibited a primary endothermic peak at 223.9–225.7 °C corresponding to solder melting, and a secondary endothermic peak at 372.9–385.3 °C associated with the thermal decomposition of PMMA.
Using the sheet containing type 6 powder, die-attach bonding in air at 300 °C yielded a sufficient shear strength of 27.7 MPa after only 10 s, which further increased to 44.3 MPa at 60 s. At 350 °C, the shear strength increased from 29.6 MPa (10 s) to 48.0 MPa (30 s), but then decreased to 36.1 MPa at 60 s, likely due to the formation of excessively thick interfacial IMC layers. The sheet containing type 7 powder exhibited slightly lower strength under identical bonding conditions. The increase in shear strength with bonding temperature and time was directly correlated with the extent of PMMA decomposition, which reduced residual polymer content in the bond-line and promoted solder interconnection. Additionally, it was observed that the applied pressure during bonding accelerated the thermal decomposition of PMMA, initiating it at significantly lower temperatures than those indicated by TG-DTA analysis.
Supplementary Materials
The following supporting information can be downloaded at: https://www.mdpi.com/article/10.3390/jmmp9050161/s1. Figure S1: Temperature and pressure profiles for bonding at varying heating temperatures of 280–350 °C and heating times of 10–60 s; Figure S2: Cross-sectional optical microscopy images of solder joints formed using the sheet with type 6 SAC305 powder at 280–350 °C under various bonding times in air; Figure S3: Cross-sectional optical microscopy images of solder joints formed using the sheet with type 7 SAC305 powder at 280–350 °C under various bonding times in air.
Author Contributions
Conceptualization, J.-H.L.; methodology, H.-M.L. and J.-H.L.; validation, H.-M.L.; formal analysis, H.-M.L. and J.-H.L.; investigation, H.-M.L.; resources, J.-H.L.; data curation, H.-M.L.; writing—original draft preparation, H.-M.L. and J.-H.L.; writing—review and editing, J.-H.L.; visualization, H.-M.L.; supervision, J.-H.L.; project administration, J.-H.L.; funding acquisition, J.-H.L. All authors have read and agreed to the published version of the manuscript.
Funding
This work was supported by a National Research Foundation of Korea (NRF) grant funded by the Korea government (MSIT) (No: 2021R1A2C1007400).
Data Availability Statement
The original contributions presented in the study are included in the article, and further inquiries can be directed to the corresponding author.
Conflicts of Interest
The authors declare no conflicts of interest.
References
- Takeda, S.; Masuko, T.; Takano, N.; Inada, T. Die attach adhesives and films. In Materials for Advanced Packaging, 2nd ed.; Lu, D., Wong, C.P., Eds.; Springer: Cham, Switzerland, 2017; pp. 469–510. [Google Scholar]
- Bai, J.; Do, P.; Kwak, D.; Chieng, Y.; Hikita, A.; Wu, J. The Development of a Non-Conductive Die Attach Film for High-Reliability Applications. In Proceedings of the IEEE 25th Electronics Packaging Technology Conference (EPTC), Singapore, 5–8 December 2023. [Google Scholar]
- Yamagishi, M.; Ishii, Y.; Kirihata, T.; Miyawaki, M. A Novel Ultra-Thin Dicing Die Attach Film for Various Dicing Processes. In Proceedings of the IEEE 10th Electronics System-Integration Technology Conference (ESTC), Berlin, Germany, 11–13 September 2024. [Google Scholar]
- Noble, T.; Davidson, J.R.; Floreani, C.; Bajpai, A.; Moses, W.; Dooher, T.; Mcllhagger, A.; Archer, E.; Ó Brádaigh, C.M.; Robert, C. Powder epoxy for one-shot cure, out-of-autoclave applications: Lap shear strength and Z-pinning study. J. Compos. Sci. 2021, 5, 225. [Google Scholar] [CrossRef]
- Wan, M.F.; Chiew, Y.H.; Tey, Y.Y. Detailed Analysis of Conductive Die Attach Film in Miniature Package X3DFN. In Proceedings of the IEEE 39th International Electronics Manufacturing Technology Conference (IEMT), Selangor, Malaysia, 19–21 October 2022. [Google Scholar]
- Shi, D.; Fan, X. Wafer-Level Film Selection for Stacked-Die Chip Scale Packages. In Proceedings of the IEEE 57th Electronic Components and Technology Conference (ECTC), Reno, NV, USA, 29 May–1 June 2007. [Google Scholar]
- Töpper, M.; Fischer, T.; Baumgartner, T.; Reichl, H. A comparison of thin film polymers for Wafer Level Packaging. In Proceedings of the IEEE 60th Electronic Components and Technology Conference (ECTC), Las Vegas, NV, USA, 1–4 June 2010. [Google Scholar]
- Zhao, J.; Du, F.; Cui, W.; Zhu, P.; Zhou, X.; Xie, X. Effect of silica coating thickness on the thermal conductivity of polyurethane/SiO2 coated multiwalled carbon nanotube composites. Compos. Part A 2014, 58, 1–6. [Google Scholar] [CrossRef]
- Mu, Q.; Li, Q.; Liu, H. Enhancing the thermal conductivities of SiO2/epoxy composites by orientation. Polym. Compos. 2016, 37, 818–823. [Google Scholar] [CrossRef]
- Sun, Z.; Li, J.; Yu, M.; Kathaperumal, M.; Wong, C.-P. A review of the thermal conductivity of silver-epoxy nanocomposites as encapsulation material for packaging applications. Chem. Eng. J. 2022, 446, 137319. [Google Scholar] [CrossRef]
- Liu, Y.; Ren, B.; Zhou, M.; Xue, Y.; Zeng, X.; Sun, F.; Fan, X.; Zhang, G. Effect of porous Cu addition on the microstructure and mechanical properties of SnBi-xAg solder joints. Appl. Phys. A 2020, 126, 735. [Google Scholar] [CrossRef]
- Joo, J.; Choi, G.-M.; Lee, C.; Eom, Y.-S.; Kye, I.; Jang, K.; Hwang, S.T.; Kim, J.D.; Choi, K.-S. Mini LED Array Transferred onto a Flexible Substrate Using Simultaneous Transfer and Bonding (SITRAB) Process and Anisotropic Solder Film (ASF). In Proceedings of the IEEE 72nd Electronic Components and Technology Conference (ECTC), San Diego, CA, USA, 31 May–3 June 2022. [Google Scholar]
- Bakar, M.A.; Jalar, A.; Atiqah, A.; Ismail, N. Significance of Intermetallic Compound (IMC) Layer to the Reliability of a Solder Joint, Methods of IMC Layer Thickness Measurements. In Recent Progress in Laed-Free Solder Technology; Salleh, M.A.A.M., Aziz, M.S.A., Jalar, A., Ramli, M.I.I., Eds.; Springer: Cham, Switzerland, 2022; pp. 239–263. [Google Scholar]
- Wu, W.; Yang, H.; Li, Y.; Fan, Z.; Li, J. Effect of IMC thickness on the mechanical properties of microbumps. IEEE Trans. Compon. Packag. Manuf. Technol. 2023, 13, 265–273. [Google Scholar] [CrossRef]
- Lee, H.-T.; Chen, M.-H.; Jao, H.-M.; Liao, T. Influence of interfacial intermetallic compound on fracture behavior of solder joints. Mater. Sci. Eng. A 2023, 358, 134–141. [Google Scholar] [CrossRef]

Disclaimer/Publisher’s Note: The statements, opinions and data contained in all publications are solely those of the individual author(s) and contributor(s) and not of MDPI and/or the editor(s). MDPI and/or the editor(s) disclaim responsibility for any injury to people or property resulting from any ideas, methods, instructions or products referred to in the content. |
© 2025 by the authors. Licensee MDPI, Basel, Switzerland. This article is an open access article distributed under the terms and conditions of the Creative Commons Attribution (CC BY) license (https://creativecommons.org/licenses/by/4.0/).