Article

Direct Fiber Simulation of a Compression Molded Ribbed Structure Made of a Sheet Molding Compound with Randomly Oriented Carbon/Epoxy Prepreg Strands—A Comparison of Predicted Fiber Orientations with Computed Tomography Analyses

1
Volkswagen AG, Group Innovation, 38436 Wolfsburg, Germany
2
Polymer Engineering Center (PEC), University of Wisconsin-Madison, Madison, WI 53706, USA
*
Author to whom correspondence should be addressed.
J. Compos. Sci. 2020, 4(4), 164; https://doi.org/10.3390/jcs4040164
Submission received: 21 October 2020 / Revised: 21 October 2020 / Accepted: 22 October 2020 / Published: 31 October 2020
(This article belongs to the Special Issue Discontinuous Fiber Composites, Volume II)

Abstract

:
Discontinuous fiber composites (DFC) such as carbon fiber sheet molding compounds (CF-SMC) are increasingly used in the automotive industry for manufacturing lightweight parts. Due to the flow conditions during compression molding of complex geometries, a locally varying fiber orientation evolves. Knowing these process-induced fiber orientations is key to a proper part design since the mechanical properties of the final part highly depend on its local microstructure. Local fiber orientations can be measured and analyzed by means of micro-computed tomography (µCT) and digital image processing, or predicted by process simulation. This paper presents a detailed comparison of numerical and experimental analyses of compression molded ribbed hat profile parts made of CF-SMC with 50 mm long randomly oriented strands (ROS) of chopped unidirectional (UD) carbon/epoxy prepreg tape. X-ray µCT scans of three entire CF-SMC parts are analyzed to compare determined orientation tensors with those coming from a direct fiber simulation (DFS) tool featuring a novel strand generation approach, realistically mimicking the initial ROS charge mesostructure. The DFS results show an overall good agreement of predicted local fiber orientations with µCT measurements, and are therefore precious information that can be used in subsequent integrative simulations to determine the part’s mesostructure-related anisotropic behavior under mechanical loads.

1. Introduction

1.1. Motivation and Materials

Fiber reinforced composites have gained importance in the automotive industry due to their potential for lightweight applications. During compression molding of discontinuous fiber composites (DFC) the long fibers undergo low shear stresses and can flow in the melt without significant fiber breakage that is common during plastification and mold filling in the injection molding process [1,2]. The shorter the required flow length to fill the mold, the lower is the possibility of fiber attrition [3]. Since typical sheet molding compounds (SMC) charge coverages lead to comparably short flow paths, the reinforcing fibers maintain their length [3,4] and compression molded DFCs show more advanced mechanical properties with high mass-specific stiffness and strength than compared to injection molded long fiber reinforced polymers [3,5].
The low tooling costs (compared to steel processing) and fast cycle times make compression molding a cost-efficient method to manufacture large DFC parts in a one-shot high volume production process, enabling DFC parts to replace automotive metal components for mass-reduction purposes [6,7]. As this material class and manufacturing method allow a high freedom of design [5], part integration (e.g., fasteners or inserts) [7], and can be used to mold complex three-dimensional (3D) shaped structural and non-structural components with corrugations, ribs and domes, it is widely used among the automotive industry and a key aspect for the endeavor to reduce the vehicle weight as much as possible [5,8]. Among this type of DFC, carbon fiber sheet molding compounds (CF-SMC) have been extensively used for interior and exterior, structural and non-structural composite applications in the automotive and aerospace industry [7,9,10,11,12].
The focus of this work is on a DFC consisting of transversely chopped unidirectional (UD) carbon fiber prepreg tows, so called ‘strands’, ‘chips’ or ‘platelets’, which are randomly distributed into a mat. SMCs with those randomly oriented strands (ROS) show a high degree of heterogeneity (variability in intra- and inter-part structure on the meso- and macro-scale) yet seek to reach quasi-isotropic mechanical properties [13,14,15]. This material class is also called prepreg platelet molding compound (PPMC) [4,16,17,18,19,20,21,22,23,24,25,26,27] or tow-based discontinuous composite (TBDC) [28,29,30,31,32,33]. The material system is characterized by a high fiber volume fraction with good impregnation, comparable to continuous fiber layups, and therefore higher mechanical properties are reachable than with traditional SMCs [18]. High performance CF-SMCs, such as the epoxy-based material used in this study (see Section 2.1), are further characterized by a high delamination resistance, near quasi-isotropic in-plane stiffness, high out-of-plane strength and stiffness, and low notch sensitivity [13]. Moreover, state of the art resin systems enable very short curing times, leading to an 84% shorter molding time and an overall process time reduction of 44% for a one-piece inner monocoque compared to the same part produced in a resin transfer molding (RTM) process [34].
However, due to the part design together with the high fiber volume fraction and fiber length in the CF-SMC material, complex anisotropic material flow conditions occur [21], which induce a characteristic microstructure in compression molded components [5,31]. This process-induced microstructure is mainly characterized by locally varying fiber orientations and fiber concentrations. Besides defects such as voids (air entrapments), swirls or resin rich pockets in between strands [35,36,37,38,39,40], the flow-induced strand alignments have the biggest impact on the mechanical performance of DFC parts [21,31,41]. Therefore, obtaining realistic 3D information of the local strand orientations in a CF-SMC part is key for a better understanding of its related mechanical behavior and a sophisticated part design. 3D representations of the morphology of entire CF-SMC parts help engineers to grasp the compression molding process related fiber alignment and the gained fiber orientation information can be mapped to a structural simulation mesh and used as a digital twin in an integrative (coupled) Finite Element Analysis (FEA) [42,43]. This microstructure information can be acquired by precise and reliable process simulations or laborious micro-computed tomography (µCT) measurements. CT scans that allow fiber orientation measurements of complete parts may be used to compare ‘real’ with numerically predicted fiber orientations coming from molding simulations in order to evaluate the quality of the simulation results. However, especially for parts made of carbon fiber reinforced plastics, this is so far a costly challenge due to the low contrast between the carbon fibers and the polymer matrix system in CT scans.
This paper shows the application of a direct fiber simulation (DFS) tool featuring a novel strand generation approach to simulate the compression molding of ROS-based CF-SMC parts. The strand generation feature is a pre-processing step to initialize multi-bundle UD strands in the initial numerical material charge. In order to validate the filling and fiber orientation prediction accuracy on real parts, automotive-related demonstrator parts with a complex ribbed structure are molded with a high-performance ROS-based CF-SMC material. As the accuracy of the numerical flow prediction is crucial for fiber orientation predictions, it is compared with the real part filling behavior observed in short shot experiments. Subsequently, simulated fiber orientations are compared with true process-induced strand orientations inside the molded parts, which are determined by CT scan analyses. The micro-, or more appropriately, mesostructures of three entire parts are non-destructively analyzed using low-resolution CT scans. The determined fiber orientations of all three CT scanned parts are averaged to eliminate local mesostructure differences between the parts and to gain a representative image of the general fiber orientations in the ribbed structure. In order to eliminate further influencing factors when comparing measured and predicted fiber orientations, both the process simulation and the CT scan analyses are conducted with exactly the same tetra mesh, enabling a one-to-one comparison. The size of the molded, simulated and CT scanned CF-SMC parts and the conducted detailed analyses surpass previously published studies dealing with this material class. The objective of this paper is to provide a good understanding of the process-induced mesostructure in complex ribbed DFC parts and to show the application of a commercially available DFS tool in a DFC part development process to avoid costly trial and error molding experiments and part design loops.

1.2. Compression Molding Simulations

Compression molded DFCs show distinct long fiber effects such as complex fiber orientations and fiber matrix separation (FMS) due to fiber entanglements and accumulations leading to fiber content irregularities and consequently to significant changes in mechanical properties [44,45]. As this process-induced microstructure has a strong effect on the part performance, molding simulation results such as fiber orientations and fiber content distributions are nowadays mapped to FEA meshes and used in integrative (coupled) simulations to account for the created anisotropy and to obtain realistic mechanical part behavior predictions. Therefore, accurate fiber configuration predictions are of major importance for the quality of subsequent structural simulations. Furthermore, high-quality virtual process chains help to avoid cumbersome trial-and-error molding experiments and design loops, which decreases the associated costs for the trials and mold changes and also accelerates the part development process. In conclusion, accurate numerical predictions are crucial to keep costs as low as possible and enable efficient material use and safe lightweight part design.
Process simulation tools are widely used in the automotive industry to predict the flow front advancement during molding and to indicate adverse effects like short shots or knit lines [6]. These tools are further used for the calculation of changing fiber configurations during molding of fiber reinforced plastics. Process simulations of CF-SMC parts can be done with traditional numerical tools that use phenomenological models or with more elaborate methods like smoothed particle hydrodynamics (SPH) or direct fiber simulations (DFS).

1.2.1. Statistical Fiber Orientation Models

Common commercially available molding simulation tools show good results predicting fiber orientation and fiber length changes during processing of short fiber reinforced plastics using standard empirical calculation models designed for short fibers [6,46,47,48]. Based on Jeffery’s hydrodynamic model, the fibers are modeled as ellipsoidal shaped rigid bodies rotating in a viscous flow [47]. Leveraging the work on short fiber orientation behavior in concentrated suspensions by Folgar and Tucker [48], the change of fiber orientations during processing can be described by an evolution equation introduced by Advani and Tucker [49] stated in Equation (1):
D a i j D t = 1 2 ω i k a k j a i k ω k j + 1 2 λ γ ˙ i k a k j + a i k γ ˙ k j 2 γ ˙ k l a i j k l + 2 C I γ ˙ δ i j 3 a i j .
This evolution equation for the second order orientation tensor a i j is often used in contemporary molding software providing a compact expression for the fiber orientation state at reasonable calculation speed [2]. It includes the vorticity tensor ω i j , the rate of deformation γ ˙ i j , the scalar magnitude of the rate of deformation tensor γ ˙ , and the identity tensor δ i j ( δ i j = I ). λ denotes the particle shape parameter (for long fibers λ 1 ), which is related to the fiber aspect ratio. The fiber interaction term 2 C I γ ˙ δ i j 3 a i j results from the isotropic rotary diffusion (IRD) model by Folgar and Tucker and includes the empirical fiber interaction coefficient C I [48,50]. In order to determine the fourth order tensor a i j k l in the evolution equation, a closure approximation is needed and various are proposed in the literature to achieve good simulation accuracy at reasonable calculation times [51,52,53,54,55,56,57].
In addition to this fundamental equation for isotropic rotary diffusion and fiber dynamics [48,49], some enhancements by successor models that are implemented in conventional software improved the ability to take fiber–fiber interactions into account by implementing various anisotropic rotary diffusion (ARD) models [50,58,59,60,61]. The observed orientation delay between the measured fiber orientation and the theoretical orientation evolution is considered through strain reduction models [62,63,64]. Excluded volume effects can be considered to describe the dependency of the fiber interaction and the volume fraction of long fiber filled materials [65]. Recently the flow and fiber orientation prediction was coupled using anisotropic viscosity models to analyze the behavior of concentrated fiber suspensions where the fiber orientation state affects the viscosity [66,67,68,69,70,71].
These statistical fiber orientation models strongly depend on empirical coefficients, which are cumbersome to determine experimentally [72,73]. Furthermore, the model simplifications and boundary condition assumptions made in these models are not valid for flexible fibers significantly longer than structural features of the part (scale separation) [21,45,73]. In addition, phenomenological models do not consider segments of one fiber being in different flow conditions (at different positions inside the material flow) at the same time, which is highly probable for long fibers [45]. Consequently, velocity and strain rate distributions along the fiber axes cannot be taken into account and the prediction of fiber bending is not feasible [2,74]. Since interactions of long bendable fibers lead to fiber entanglements and accumulations influencing the fiber movement, the capability to model fiber bending is a crucial element [15].
In conclusion, the used empirical models implemented in conventional molding simulation tools, such as Moldflow (Autodesk, Inc., San Rafael, CA, USA) or Moldex3D (CoreTech System Co., Ltd., Zhubei City, Taiwan), are designed for rigid particles with low aspect ratios and are therefore not suited for highly filled long fiber materials. As expected and seen in the literature, even with modified evolution equations, flow-induced long fiber specific effects like fiber bending, fiber–fiber interactions, and changes in fiber content distribution (especially FMS) cannot be accurately predicted by traditional short fiber models [2,6,45,46].

1.2.2. Stochastic Particle-Based Simulation Method (Purdue University)

A particle-based flow simulation method with a stochastic approach was recently developed at the Purdue University (West Lafayette, IN, USA) to investigate ROS materials with flow-induced fiber alignment [4,17,21,25,75,76]. In contrast to conventional flow simulations typically executed in Eulerian frameworks [25], a smoothed particle hydrodynamics (SPH) method with a variable user-defined material subroutine (VUMAT) is applied in Abaqus/Explicit achieving a Lagrangian solution that allows large deformations required by mold filling [17,21,22,25,76]. The 3D flow molding simulation method is based on a stochastically generated random planar initial strand orientation distribution [17]. To predict the complex 3D strand deformations and the resulting orientations in the final part, it calculates the strand orientation evolution based on the assumption of affine motion (equivalent to Jeffery’s equation) coupled with an anisotropic viscosity model [17,21,22,25,76].
The initially introduced variability of the charge orientation state is generated with a pseudo-random number generator (strand generation scheme) [25]. Coded in Python, the strand generator randomly defines in-plane strand centroid locations with random strand orientation angles as long as all SPH particles in the layer are assigned to one strand set [22,25]. Accordingly, the strands are modeled as a set of interconnected SPH particles (‘groupings’ [4,17]) forming a rectangular strand shape with one particle through the thickness [25]. This leads to a low resolution of the orientation distribution through the thickness of the flow simulation [17]. However, the particle size cannot be set to be equal to the strand thickness, since the computation time would be unreasonably high [17]. This is due to the fact that the particle size equally reduces in all three spatial directions so that a huge amount of particles would be needed to describe one strand.
During the flow simulation the initial charge is extended and the strand sets deform and progressively align along their flow direction tending to disaggregate [17]. Since an anisotropic (transversely isotropic) viscosity model is used, strands that are initially oriented in flow direction tend to translate, while those oriented in cross-flow direction widen [17]. Both effects are qualitatively consistent with physical observations [17,31]. Moreover, strand–strand interfaces [17] and interactions are only implicitly taken into account through the anisotropic viscosity model [21].

1.2.3. Direct Fiber Simulations (DFS)

In order to overcome the deficiencies of the described phenomenological models, many single fiber based models were devolved. Single fiber simulations, also called direct fiber simulations (DFS), connect a number of particles or rigid rods (beams) to model long flexible fibers inside the polymer flow [2,45,74,77,78,79,80,81,82,83,84]. Because of the fiber segmentation DFSs can consider the strain rate distribution along the fiber axis and are therefore suited to predict long fiber behavior like bending [74]. These models use the lubrication theory combined with small flexible inextensible threads [85], stretchable, bendable, and twistable chains of bonded spheres [78] or rigid spheres connected by ball and socket joints [86,87,88,89]. Contact formulations describe the fiber–fiber interactions [90,91] and fiber–fluid interactions are modeled by hydrodynamic drag forces [92,93,94].
Two types of DFS techniques can be distinguished—the velocity-based method and the mechanistic model [45]. Kuhn et al. show notable amelioration in prediction precision when using DFS tools compared to commercial phenomenological simulation tools predicting long fiber behavior in a small rib structure [45]. However, modeling a large amount of connected particles leads to long computation times if applied to practical/industrial parts, whereas the duration can be decreased by using connected rigid rods to model long fibers with a velocity-based method [74]. The same observations are made by Kuhn et al. who describe decreased preparation efforts and calculation durations when using a commercial velocity-based non-interaction DFS instead of a non-commercial, research-focused mechanistic DFS [45]. However, due to the enormous amount of calculated fibers necessary, and the therefore very numerically expensive task of single fiber simulations, this method is often restricted to predict the resulting fiber configuration in small volumes [45].

Mechanistic Model (University of Wisconsin-Madison)

Kuhn et al. use a bead chain model for a DFS of a single rib of a molded component using a reduced amount of fibers [6,45,46]. The presented study uses a particle level simulation approach based on a mechanistic model to simulate fiber bending, fiber interactions, and especially FMS during compression molding of long fiber reinforced plastics [6,45,46]. The mechanistic model simulation approach begins with a traditional mold filling calculation with a standard tool like Moldex3D [46]. The calculated flow field is then extracted and used as basis for the mechanistic model simulation. After a stack of fibers is randomly inserted into the cavity volume, the movement of all single fibers is determined by interaction with the flow field. In the mechanistic model each fiber is individually modeled as a chain of rigid rods connected by ball-and-socket joints [6,46,95,96]. The fiber discretization numerically enables fiber bending at the joints (nodes) between the rods, which is important for the prediction of long fiber behavior in component areas that are smaller than the fiber length [46,97]. Furthermore, the inside of the rods is modeled as a chain of balls to include fiber interactions and hydrodynamic effects [6]. Accordingly, the fibers are simulated as a collection of equidistant nodes where the connecting rods experience elastic deformation, hydrodynamic drag forces and excluded volume effects in the polymer flow field [46,97]. The contact and hydrodynamic forces are used in force and momentum balance equations to calculate the rotations and movements of each modeled fiber. Additionally, complex interactions with the enclosing melt flow, other fibers and mold walls are considered [45,46,96,98,99,100]. The excluded volume forces act as repulsive forces to inhibit fibers to interpenetrate or overlap one another or with the mold wall and are used to model fiber–fiber as well as fiber–mold interactions [46,97,98].
Due to the high fiber stiffness and the more significant impact of fiber bending, extensional fiber deformation is neglected [46]. In order to decrease the tremendous calculation times required, fiber–fiber and fiber–mold interactions are only computed once every 50 integrations [46]. However, due to the still limited amount of calculable fibers or rather the overall low simulation speed, the mechanistic model is currently limited to small part volumes [45]. In sum, the mechanistic model calculates the motion, bending, and rotation of single fibers considering all their complex interactions with the fluid, the mold walls, and other fibers. Although the mechanistic model describes only a one-way coupling from the fluid flow to the fibers, the direct fiber simulation approach results in more accurate fiber orientation and fiber content distribution predictions when compared to common process simulation software [6,45].

Direct Bundle Simulation (DBS)

For a DFS of a small compression molded cross-rib-shaped SMC part in LS-DYNA (Livermore Software Technology Corporation (LSTC), Livermore, CA, USA) Hayashi et al. use beam elements constrained in highly deformable solid elements representing the matrix [101]. In order to enable large deformations of the matrix elements, the 3D adaptive Element-Free-Galerkin (EFG) method is applied. Recently, this tool was enhanced to handle ROS composites. The fibers within one strand are modeled by multiple connected elastic beam elements in a row [102]. Since the real amount of fibers in ROS composites and even within a strand is very large, the calculated number of fibers per strand was drastically reduced, while the beam thickness was increased to ensure maintaining the nominal fiber volume fraction of the material [102]. This simplification method reduces the numerical calculation time by representing thousands of fibers as fiber bundles. Considering microstructure studies reported in the literature [4,73,103,104], it can be seen that most of the fiber bundles or strands widen and flatten, but do not disperse. Only the highly sheared strands are more likely to fan out. This observation justifies the simplifying assumption to represent thousands of carbon fibers within a strand as one bundle in order to shorten the calculation time and to enable full component scale simulations [73].
Recently, Meyer et al. [73] presented a DBS method that reproduces Jeffery’s equation for single fiber bundles in shear flow, which are described as a chain of truss elements. Since the bundles are represented as one-dimensional instances, they can move independently from the matrix material, flow and interact through contact forces and with hydrodynamic drag forces of the surrounding flow. Since bundle–wall and bundle–bundle interactions are considered, there is no need for empirical interaction parameters, unlike in the commonly used statistical descriptors of fiber orientation changes (Folgar–Tucker-based models). Since this DBS approach additionally considers two-way coupling it allows for a more accurate calculation of fiber volume fraction distributions, knit lines and FMS at a component level with reasonable computation times [73].

1.2.4. 3D TIMON CompositePRESS

Fiber Orientation Simulation in 3D TIMON CompositePRESS

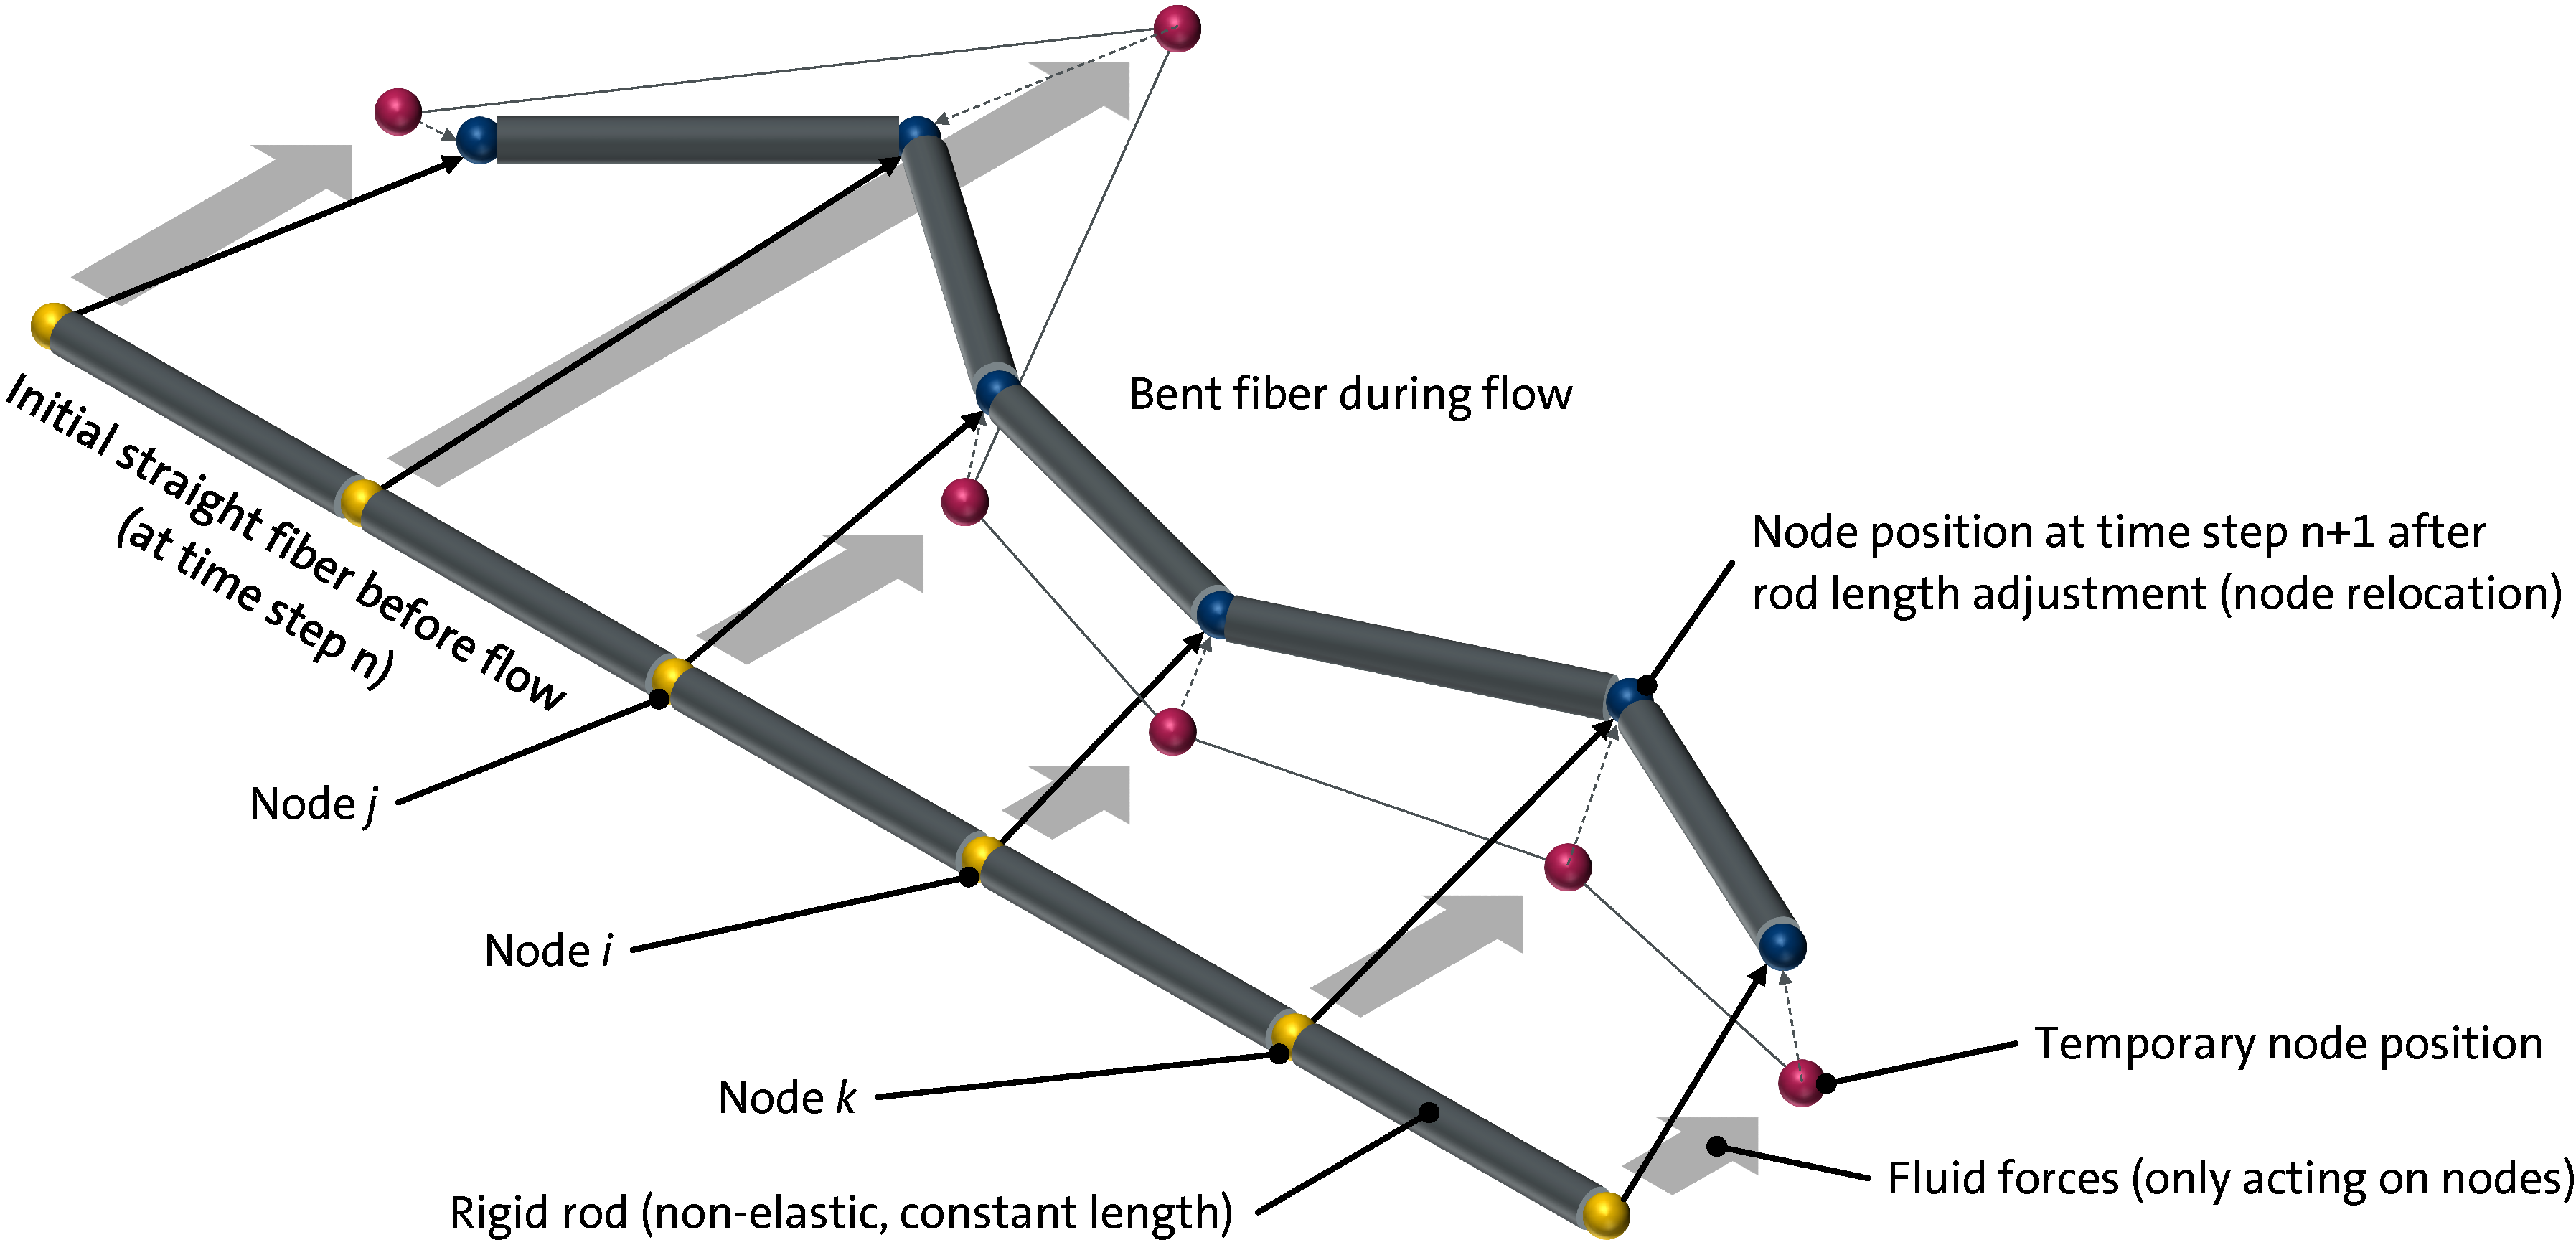
A commercially available compression molding simulation tool with a similar DFS approach is 3D TIMON CompositePRESS (Toray Engineering D Solutions Co., Ltd., Ōtsu, Shiga, Japan) [105]. Here, each fiber within the initial fiber cluster is modeled using a flexible, non-elastic chain of rods (rigid bodies, constant rod length) connected by hinge nodes [2], as shown in Figure 1. The velocity-based DFS tool begins with the filling simulation determining the flow field, assuming homogeneous isotropic resin properties (isotropic viscosity) and using a one-way coupling from the fluid flow to the fibers. Subsequently, it calculates the motion of each single fiber based on the flow velocities [2,45]. The position and curvature of each single fiber are changed according to the strain rate distribution along the fiber length [74]. Thereby, the nodes function as universal joints allowing the rods to rotate in three independent axes and thus enabling the calculation of movement, bending, and rotation of each single long fiber [2,106]. In this velocity-based direct fiber simulation approach the fiber node position u i is a function of the enclosing fluid velocity v fluid at every time step n [2]. The melt velocity v fluid is interpolated from the node positions in the velocity field [2]. Since the motion u i of node i directly follows the surrounding melt flow velocity, the temporary new node position for the next time step n + 1 can be calculated by Equation (2) [45,107]:
u i n + 1 = u i n + v fluid , i n d t .
This leads to an unrealistic and impermissible stretching of the fibers, which is numerically corrected by rod length adjustments (cf. Figure 1) or node relocations, respectively. At each time step the change of the rod length L is reviewed to a maximum elongation threshold ε (Equation (3)):
max 1 L i j n + 1 L i j n < ε .
If the rod length change exceeds this threshold, node i is relocated considering the neighboring nodes and rod lengths by Equation (4):
u i n + 1 = u i n + d u i ,
with
d u i = u i n + 1 u i n + 1 2 1 L i j n + 1 L i j n u j n + 1 u i n + 1 + 1 2 1 L i k n + 1 L i k n u k n + 1 u i n + 1 ,
where L i j is the rod length between node i and node j and L i k is the rod length between node i and node k . Equation (5) is iteratively solved until the rod length changes are smaller than ε and the node positions are updated by time integration based on an explicit Euler scheme [2].
Outperforming conventional fiber orientation models, the velocity-based DFS method applied in 3D TIMON CompositePRESS enables the prediction of local fiber orientations and fiber content distributions in compression molded SMC parts where long fibers (typically 25–50 mm) are used [2]. Moreover, fiber breakage can be simulated through detachment of rod–rod connections [2]. However, due to the fact that fiber attrition is of minor importance during SMC compressing molding, this effect is typically neglected. Fiber–fiber interactions are not considered in the current R6.0 version of 3D TIMON 10 to keep the calculation time reasonable [2,73,105]. Furthermore, the software does not account for anisotropic viscosity and two-way coupling [73]. Compared to phenomenological models though, the long fiber behavior is superiorly predicted, despite being based on non-colliding, velocity-following nodes [45]. However, it is reported that fiber content distribution simulation results have some insufficiencies when compared with experiments. Kuhn et al. conclude that these discrepancies are induced by extensive fiber interactions causing FMS in reality, which cannot be accurately predicted by either phenomenological (statistical) models based on Morris and Boulay or the velocity-based DFS by 3D TIMON [45].
Due to the current status of the presented long fiber orientation models, Kuhn et al. recommend to use velocity-based DFSs like 3D TIMON for the fiber orientation simulation of large SMC components [45]. However, for smaller volumes, where FMS is pronounced and of interest, they suggest to use the mechanistic model to be able to predict fiber agglomeration more accurately [45]. Kuhn et al. further propose to develop and implement a phenomenological or simplified model for FMS in common computational tools like Moldflow, Moldex3D or 3D TIMON [45].

Flow Simulation Simplifications in 3D TIMON CompositePRESS

In order to simulate the compression molding process, the flow analysis in 3D TIMON is based on the standard equations of traditional fluid dynamics: the continuity equation, the momentum equation, and the energy equation. These governing equations for the filling phase are given in the following. Theoretical background and a more detailed deduction of the general and special forms of the equations are given in Appendix A.
Continuity equation:
ρ t + x ρ u x + y ρ u y + z ρ u z = 0 ,
where ρ is the density, t is time and u i stands for the fluid velocity vector in direction x , y , and z , respectively. Assuming incompressibility and a steady state, neglecting inertia and gravity, and considering the fluid motion in z -direction, the governing equations for non-Newtonian polymer melt flow can be simplified to a volume continuity equation:
u x x + u y y + u z z = 0 .
Momentum equation in x-direction:
ρ u x t + u x u x x + u y u x y + u z u x z = p x + μ 2 u x x 2 + 2 u x y 2 + 2 u x z 2 + ρ g x ,
where p : pressure, μ : viscosity of Newtonian fluids, g i : body force acting on the continuum, for example, gravity. This equation can also be expressed in terms of deviatoric stress τ and is then commonly called the Cauchy momentum equation:
ρ u x t + u x u x x + u y u x y + u z u x z = p x + τ xx x + τ yx y + τ zx z + ρ g x .
Energy equation for a fluid with constant properties is given by:
ρ c p D T D t = k 2 T x 2 + 2 T y 2 + 2 T z 2 + Q ˙ viscous   heating + Q ˙ ,
where ρ : density, c p : specific heat, T : temperature, t : time, k : thermal conductivity, Q ˙ v i s c o u s   h e a t i n g : viscous dissipation and Q ˙ : arbitrary heat source (i.e., exothermic reaction).
For polymer flows, the fundamental governing equations given above are non-linear, non-unique, complex, do not have a general solution, and are thus difficult to solve [108]. To gain analytical solutions and to reduce the required CPU time the balance equations must be simplified. 3D TIMON CompositePRESS avoids solving the Navier–Stokes equations to realize a 3D flow analysis of non-Newtonian polymer melts, and instead uses the traditional Hele-Shaw approximation for a 2.5D flow simulation (called Light 3D) conducted on a one layer tetra mesh when using the morphing method [109]. The Light 3D solver virtually divides each mesh element (tetra or hexa) into 20 calculation points across the thickness (between the nodes on the surfaces) in order to predict the flow front advancement realistically [109] (see Figure 2). This procedure allows the calculation of temperatures, velocities, shear rates, and viscosity changes through the thickness by using a single layer mesh [109]. The Light 3D method reduces the number of necessary elements for accurate flow predictions for large and thin parts drastically [109].
The Hele-Shaw simplification, which is commonly used in injection molding simulations, was also applied by Folgar and Tucker to solve the compression molding process [110,111]. By assuming a flow through a narrow cavity gap h between lower and upper platen an order-of-magnitude analysis shows that the flow rate in thickness direction is small compared to the x- and y-directions. Furthermore, it shows that the in-plane velocity gradient can be neglected [109]. Therefore, in a thin layer flow field the shearing stresses τ zx z across the narrow cavity gap h are dominant [112]. These assumptions allow simplifying the volume continuity and the momentum equation to:
u x x + u y y = 0 ,
p x = τ zx z ,
p y = τ zy z .
The 2.5D Hele-Shaw simplification method applied in 3D TIMON CompositePRESS aims at solving the momentum equation with the continuity equation. Therefore, the shear stresses must be derived from the three unknown variables in a 2D flow: pressure p and the flow velocities u x , and u y . As the flow field through the part thickness is neglected in the Hele-Shaw model, the velocity across the thickness h is integrated from the lower platen to the upper platen to compute the gap-wise average velocities u ¯ x and u ¯ y . When the continuity equation is integrated over the thickness it takes the form:
x 0 h u x d z + y 0 h u y d z = 0 .
This integrated continuity equation further reduces to:
x h u ¯ x + y h u ¯ y = 0 .
In order to solve the continuity equation (Equation (11)) 3D TIMON CompositePRESS uses an assumption of potential viscous flow to express the flow velocity components u ¯ x and u ¯ y , which can be written as:
u ¯ x = S h p x ,
u ¯ y = S h p y ,
where h is the gap height between the mold halves and S is the viscosity-dependent flow conductance for 2.5D flow analysis of thin parts, defined by:
S =   0 h z λ 2 η d z ,
where λ is the local value of z at which the shear stresses are zero. Since most problems are symmetric, λ = h / 2 .
Equations (16) and (17) show that the flow rate in each direction is proportional to its pressure gradient. Substituting the unknown flow velocities u x and u y in Equation (11) with the gap-wise average velocities from Equations (16) and (17) reduces the number of unknowns at each node in the calculation from three to one (pressure only) in Equation (19), which is the classic Hele-Shaw model:
x S p x + y S p y = 0 .
However, for the compression molding process the z -velocity component cannot be fully neglected and therefore the mold closing speed h ˙ is included as an extra term in the continuity equation:
x h u ¯ x + y h u ¯ y + h ˙ = 0 ,
which, when implementing Equations (16) and (17), leads to the Hele-Shaw model for compression molding:
x S p x + y S p y h ˙ = 0 .
Since the flow conductance S depends on the temperature-dependent viscosity η , the temperature field must be calculated. In order to calculate the temperature distribution in the thermoset molding compound, 3D TIMON CompositePRESS assumes the heat conduction in thickness direction is dominant [105] and therefore simplifies the energy equation (Equation (10) and Equation (A10) in Appendix A) to the energy equation for thermoset materials in 2.5D flow, written as
ρ c p T t + u x T x + u y T y + u z T z = k 2 T z 2 + τ yz u y z + τ zx u x z + Q ˙ ,
where ρ : density, c p : specific heat, T : temperature, u i : fluid velocity vector in direction x , y , and z , respectively, k : thermal conductivity, τ i j : deviatoric stress, and Q ˙ : heat generation due to the exothermic reaction in the thermoset curing process.
Using the simplification τ yz = η u y z and τ zx = η u x z (assumption of simple shear flow) yields to the final energy equation used in Light 3D heat transfer analyses in 3D TIMON CompositePRESS:
ρ c p T t + u x T x + u y T y + u z T z = k 2 T z 2 + η u y z 2 + η u x z 2 + Q 0 d α d t ,
where Q 0 denotes the total amount of generated heat in the exothermic curing reaction and d α d t is the curing reaction rate.
In conclusion, the presented simplification method of determining the flow conductance facilitates the pressure field calculation. Subsequently, the temperature field is calculated and the flow front advancement during the 2.5D filling simulation can be predicted. However, in more complex parts with thicker ribs the narrow gap assumption of this simplified approach has its limits. Furthermore, the model does not account for the plug flow with a slip boundary condition at the mold surface, so that a proper choice of the flow conductance is important. For a more detailed explanation of the balance equations and their transformations, the simplifications made, and general background knowledge, the reader is referred to Appendix A and [1,108,110,111,113,114,115,116]. For more information about the flow analysis in 3D TIMON CompositePRESS the reader is referred to [105,109].

Viscosity Models in 3D TIMON CompositePRESS

During the compression molding process the thermoset resin is continuously heated up by the hot mold walls and the self-generating curing reaction heat leading to a viscosity drop. Simultaneously, due to the temperature increase, the curing reaction accelerates causing a conversion rate and viscosity increase. In order to describe these dependencies between viscosity, shear rate, temperature, and the curing reaction rate of the polymer melt, 3D TIMON combines three models: the Arrhenius-like temperature-dependent Andrade model (Equation (24)) [117], the curing reaction rate-dependent Castro–Macosko model (Equation (25)) [118,119], and the shear rate-dependent Cross model (Equation (26)) [120].
Andrade model:
η 0 T = A   exp B T ,
with η 0 : zero shear viscosity (initial resin viscosity before curing), A : empirical model constant (fitted), B : material specific constant in Kelvin,   T : melt temperature in Kelvin.
The Castro–Macosko model in Equation (25) is a widely used model in molding simulation tools, which describes the viscosity of thermoset materials as a function of temperature T and degree of cure α that can be expressed as follows:
η 1 T , α = η 0 T α gel α gel α D + E α .
Here, η 1 is the viscosity of the resin at a given degree of cure (conversion) α , η 0 is the initial resin viscosity before curing, α gel is the degree of cure at the gel point, and D and E are empirical model constants that fit the experimental data.
Modified Cross model:
η T , α , γ ˙ = η 1 T , α 1 + η 1 T , α γ ˙ τ * 1 n ,
with γ ˙ : shear rate, τ * : critical shear stress (stress level at which the viscosity is during the transition between zero shear region (Newtonian plateau) and the shear thinning (power law) region of the viscosity curve), n : power law index. This model considers the effect of shear rate and temperature on the viscosity and describes the shear thinning behavior by the power law index n .
The combination of all three viscosity models extends the Castro–Macosko model with a power-law type shear rate dependence and leads to a modified Cross–Castro–Macosko model:
η = A   exp B T α gel α gel α D + E α 1 + A   exp B T α gel α gel α D + E α γ ˙ τ * 1 n ,
which is the finally used viscosity model in 3D TIMON CompositePRESS [105]. This model considers the dependence of the thermoset resin viscosity on temperature, degree of cure (conversion), and shear rate.

Curing Model in 3D TIMON CompositePRESS

The widely used semi-empirical Kamal model [121], which is a further development of a model proposed earlier by Kamal and Sourour [122], is applied in 3D TIMON CompositePRESS in order to describe the temperature-driven, n th-order autocatalytic reaction of thermoset resins. Equation (28) expresses the curing reaction velocity as a product of a temperature term following the Arrhenius temperature dependence and a function of the degree of cure α . Typically, the resin curing behavior is measured by differential scanning calorimetry (DSC) analyses and the six unknown constants in Equation (28) can be fitted to the DSC data.
Kamal model:
d α d t = A 1 exp E 1 R T + A 2 exp E 2 R T α m 1 α n ,
where d α d t stands for the curing reaction rate, A 1 , and A 2 for pre-exponential factors, E 1 and E 2 for activation energies, R for the universal gas constant and m and n are reaction orders.
During the flow simulation this curing reaction model calculates the reaction rate, which is then used in the Cross–Castro–Macosko model to obtain the current viscosity of the flowing and simultaneously curing material. This coupling allows for a viscosity model that considers the effect of the curing kinetics on the conversion rate and the corresponding viscosity.

1.3. Computed Tomography of ROS Materials

In order to collect experimental 3D information about fiber orientation distributions of heterogeneous fiber reinforced materials, X-ray computed tomography (CT) is widely used in industry as a non-destructive measuring method due to the fact that it is easy to prepare samples and only requires a difference in the density-dependent linear X-ray attenuation coefficients of the matrix and the reinforcement [123]. The morphology of inhomogeneous materials like CF-SMCs can be investigated three-dimensionally by micro-CT (µ-CT), which is a high resolution X-ray CT method, allowing an in-depth material characterization [123].
To gain microstructural information with this experimental technique the sample is exposed to X-rays while incrementally rotating on a platform between the X-ray source and the detector (cf. Figure 11a). For each angle increment the sample is penetrated with radiation for a specific exposure time. Denser parts of the sample (fibers) absorb more radiation and therefore appear brighter in CT images than less dense material (resin). Since the X-ray radiation is proportionally attenuated as a function of the material’s density, the detector can record a shadow projection of the sample revealing its inner structure [124]. The sample is fractionally rotated and irradiated until radiographic projections of a full 180° sample rotation are recorded. This acquired set of angular projections is sufficient to be reconstructed into a 3D model consisting of a large number of parallel micro-slice images by applying specific mathematical algorithms [124]. In order to improve the scan quality, a 360° rotation is usually carried out and several recordings per increment can be taken and averaged. The achievable scan quality (resolution and image sharpness) further depends on the spot/focal size of the X-ray tube, geometrical magnification, detector quality, vibrations during the image recording and the chosen combination of scan parameters [125].
In the reconstructed volumetric representation of the internal sample structure the scanned material is defined and visualized by its grayscale values (high density = high grayscale value). Therefore, composites show two maxima in the grayscale value histogram—one for the fibers and one for the matrix material. In order to analyze the fiber constitution, especially the fiber orientation, a threshold between both maxima is set by the user to define the surface of the fibers or strands, respectively. However, as this is a user-dependent manual act, analyzed fiber volume content distributions should only be used normalized.
In order to ensure a proper component design regarding mechanical requirements and for quality assurance of manufactured composite parts, the industry’s endeavor is to determine the material’s microstructure for large areas or ideally for entire parts [43]. However, due to the lack of contrast between polymer resins and carbon fibers (similar linear X-ray attenuation coefficients) in X-rayed composites, μ-CT scans of entire CF-SMC components are so far limited in size when receiving useful data for fiber orientation analyses is required. Normally, attaining fiber orientations by CT scan data analysis of fiber reinforced polymer parts requires a finer scan resolution than the fiber’s diameter to distinguish between individual fibers, which by implication limits the scan volume size [126]. Obtaining CT data for a larger 3D part is therefore always a trade-off between scan volume size, or part size, respectively, achievable resolution (voxel size) and the required scanning time. In conclusion, with increasing sample size, the achievable scan resolution decreases, which makes it very time-consuming and costly or even impossible to resolve fiber-scale details in CT scans of entire composite parts [126].
Useful μ-CT scans for CF-SMC parts, however, just need a sufficient resolution so that it is clearly distinguishable between strands and resin by grayscale value differences related to local relative fiber volume fraction variations enabling a fiber orientation analysis with a common CT scan analysis software (e.g., the commercially available software package VGSTUDIO MAX 3.3., Volume Graphics GmbH, Heidelberg, Germany). The analysis algorithm within VGSTUDIO MAX 3.3 (VG hereafter) is indeed intended to be used for the orientation analysis of discretely visible fibers [42,127,128,129,130]. Yet with correctly set parameters and with local relative density gradients between resin and fibers the image analysis principles are suited to be used for scans with mesoscale resolutions, where no single fibers, only coarser structures like strands and fiber bundles, respectively, are visible [43,123]. Since microscopy shows that during compression molding the fibers within one strand mostly flow and orient together, deforming yet remaining as an intact strand with locally highly aligned fibers, the density gradients of CT scanned ROS-based materials are sufficient for a determination of local average strand orientations even at a coarser scan resolution [4,42,43,123]. In a CT scan of a ROS-based material the smallest density gradient is present in fiber direction, intermediate density differences are visible transverse to the strand orientation, and the highest density gradient occurs normal to the strand plane and at strand–strand boundaries (matrix rich strand interfaces), respectively [4,20,21,42,43,123]. Due to these intra- and inter-strand density changes the determination of strand orientations from mesoscale resolution CT scan data is feasible [4,20,21,43].
Denos et al. use a CT scan with a mesoscale resolution of 53 µm (voxel edge length) to determine the heterogeneous internal microstructure of a prepreg carbon/polyetherketoneketone (PEKK) UD strand-based T-bracket part with maximum dimensions of 65 × 65 × 45 mm [20,42,43]. However, at that resolution and with the applied CT scan settings it is not possible to distinguish between single carbon fibers (⌀ ≈ 5–7 µm) and the matrix or to discern strand boundaries (~100 µm thick) in thickness direction [42]. Although Denos’ CT scan configuration is not able to represent distinct strand boundaries, it is still possible to receive a mean local fiber orientation due to sufficiently pronounced relative density gradients [20,42].
Another common method to achieve bigger CT scan volumes at a reasonable resolution is to merge several scan volumes generating a digital twin of the scanned part and its microstructure. Sommer et al., Kravchenko, and Denos et al. merged 8 partial scans of a prepreg carbon/PEKK UD strand-based tensile test specimen with a size of 30 × 30 × 5 mm each, using a scan resolution of 15 µm [17,123,131]. At that resolution the CT scan quality is high enough to discern between strands and suitable for precise fiber orientation analyses. An analysis mesh size of 0.7 × 0.7 × 0.1 mm is used to determine a single orientation tensor from each of the measured orientation vectors by a grayscale analysis [123,131]. The finer analysis resolution better resolves the thin strands in thickness direction and enables gathering more detailed information about the local strand orientation changes.
The spectrum generated by the X-ray source significantly depends on the elemental composition of the used target material. Tungsten (W) is widely used as target material for microfocus X-ray sources. However, depending on the applied X-ray voltage and the absorption behavior of the sample material, alternative target materials might deliver beneficial spectrum characteristics that can improve CT measurement quality concerning the separation capability of fiber and matrix for fiber orientation analysis [132]. A higher μ-CT scan quality, by means of a higher contrast between fiber and matrix, also enables to scan bigger composite part volumes, fulfilling industry demands, where the fiber orientation within a whole component is of interest.

2. Material and Methods

2.1. Compression Molding

The high-performance CF-SMC used in this study is Hexcel’s HexMC® (Hexcel Corporation, Stamford, CT, USA). This DFC material is designed for compression molding of complex 3D shaped parts in a heated metal tool. HexMC consists of prepreg carbon/epoxy UD tapes that are longitudinally slit and transversely chopped into strands and then randomly distributed into a mat [14]. Those ROS have nominal in-plane dimensions of 50 × 8 mm and a thickness of approximately 0.15 mm (Figure 3). The strands contain high strength carbon fibers impregnated by fast-curing Hexcel HexPly® M77 epoxy resin [14,133]. The carbon fiber content amounts to 62% by weight in the raw material, corresponding to 57% fiber volume content in a molded part and giving a material density of 1.55 g/cm3 (Table 1) [14,15].
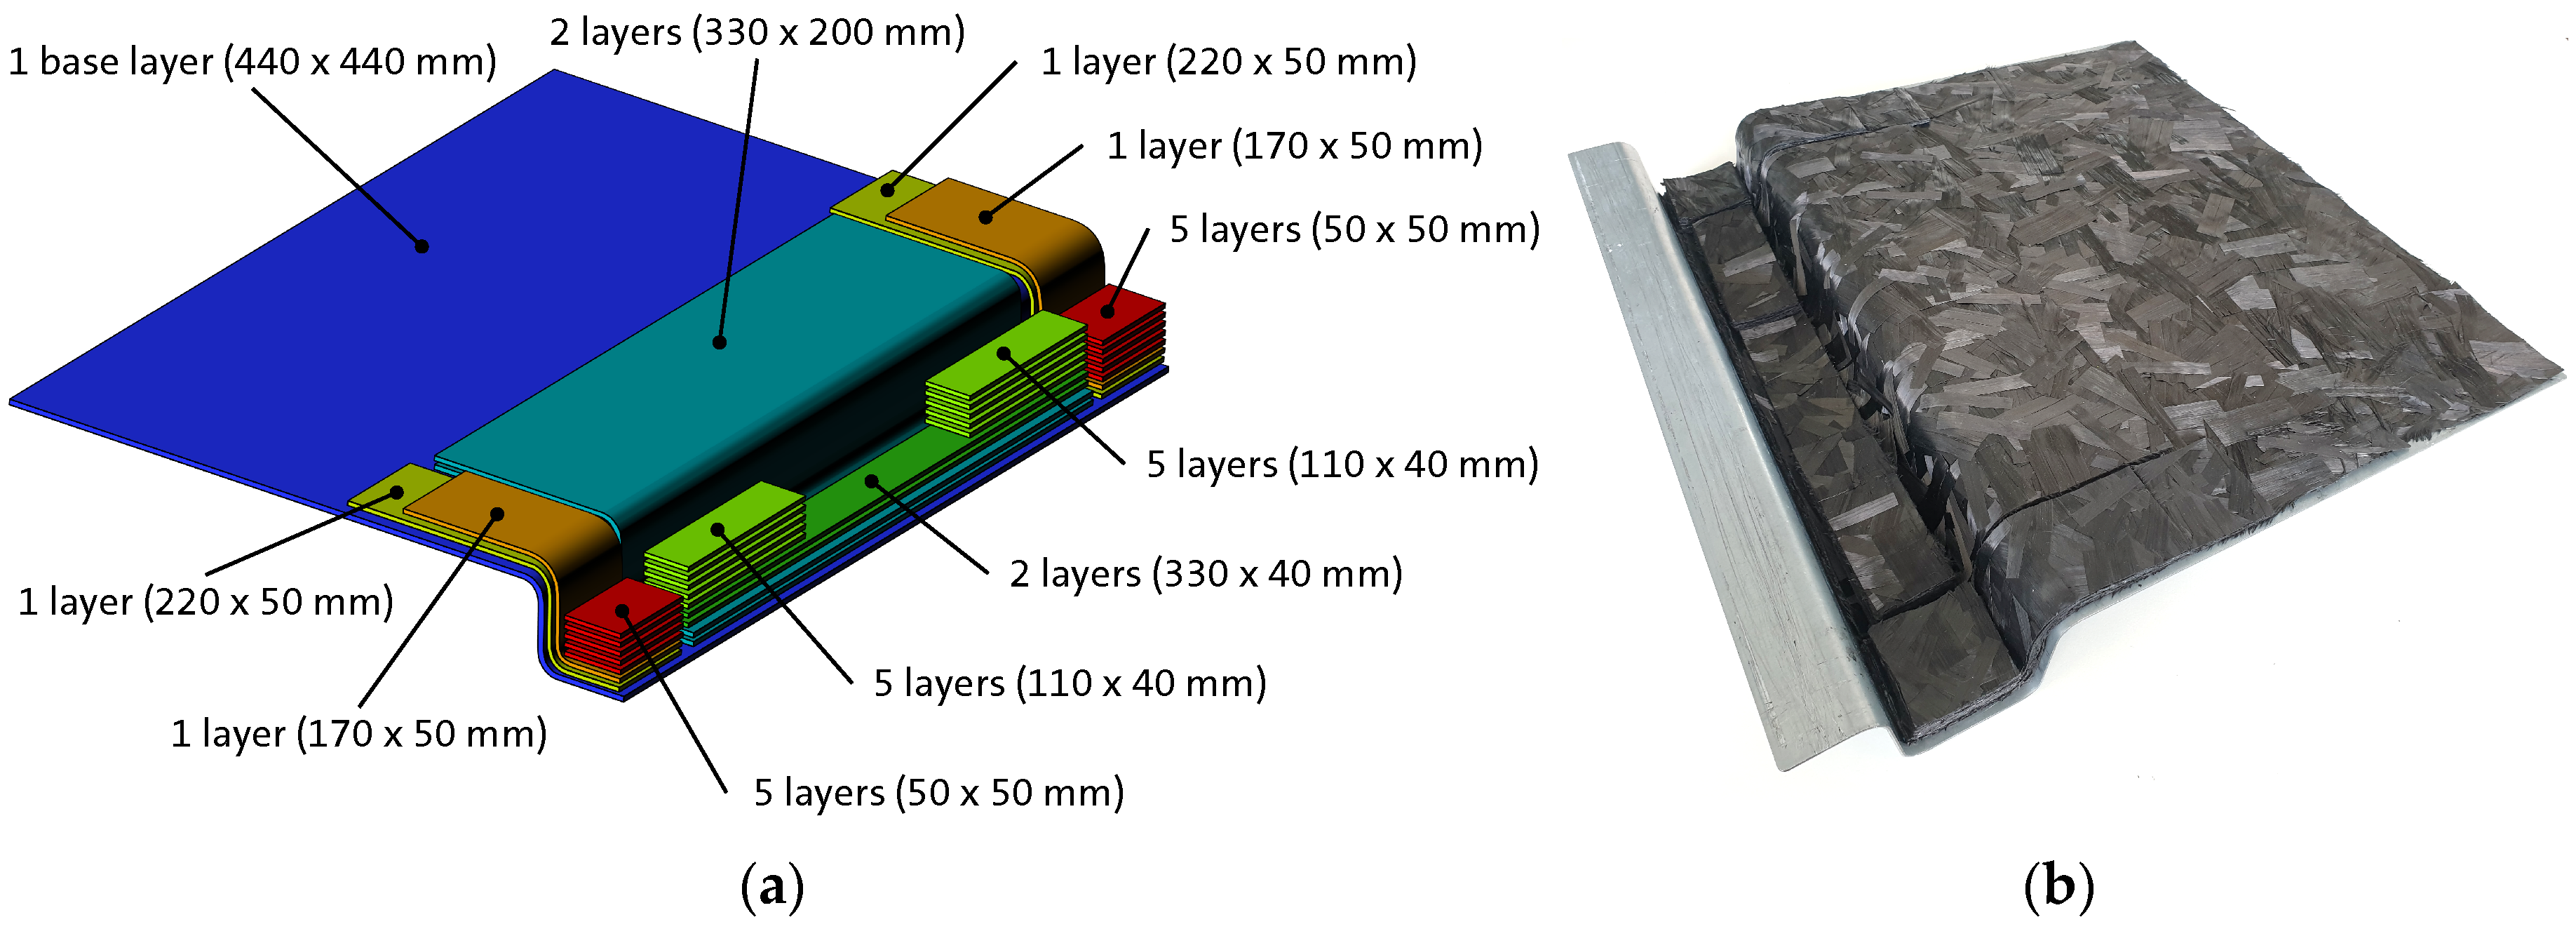
For the compression molding trial a research tool with a ribbed hat profile tool insert designed for compression molding of CF-SMCs is used (Figure 4a). The tool is made to mold a complex ribbed structure with ribs of varying heights and non-symmetrically alternating wall thicknesses with an attached plate (Figure 4b). The molded part has outer dimensions of 450 × 450 mm and a nominal wall thickness of 2 mm. The ribbed hat profile spans an area of 150 × 450 mm and has a hat height of 52 mm.
The ribbed hat profile parts analyzed in this study were manufactured with a mold coverage of approximately 80% using a 1000 ton compression molding machine (Dieffenbacher DCL-S 1000, Dieffenbacher GmbH, Eppingen, Germany) at a temperature of 140 °C, a pressure of 200 bar, a closing speed of 5 mm/s, and a closing time of 480 s (Table 2). The mold coverage would be high for standard SMCs, yet for ROS-based high-performance CF-SMCs it is rather low giving the material a sufficiently long flow path to create a flow-induced fiber mesostructure especially in the hat end brim section, which is wanted in this study.
Material flow simulations in 3D TIMON CompositePRESS were used to develop an SMC charge pattern (Figure 5), which allows for a 100% filling of the complex ribbed structure without defects, such as FMS. Predicted pressure distributions, shear rates, flow velocities and flow front advancements are analyzed for various charge patterns with the goal to reach uniform filling of the cavity. Due to the slightly asymmetrical design of the ribbed structure with very thin (0.8 mm) and very thick ribs (8.2 mm) of different rib heights, the cavity volume in the hat profile area changes locally. Therefore, the finally identified charge pattern used in this study consists of several smaller single charge packages optimized in size and position in order to achieve a balanced raw material distribution in the cavity and to facilitate optimal rib filling. Furthermore, the edges of some charge packages are placed underneath some rib entries to ease the flow of the UD strands into the ribs. All smaller charge packages are stacked on one 440 × 440 mm base layer to ease the charge placement in the tool.
In order to reach a lower viscosity for optimal flow behavior, the material charge was pre-heated for 17 s. This pre-heating time was found in a previous flowability study for HexMC plates. For the pre-heating procedure the charge is placed in the bottom mold half and the upper mold half is fast lowered to the pre-heating position leaving a small gap between the cavity wall and the material surface. Heat conduction from the lower mold half and heat radiation from the upper mold half decrease the material viscosity enabling better flowability when the mold is closed after the pre-heating phase.

2.2. Short Shots

For accurate fiber orientation predictions with DFS tools it is crucial to obtain as precise filling predictions as possible. In order to receive a first understanding about the simulation quality, short-shot experiments were conducted with a shimmed mold for a comparison of the true material flow behavior and the numerical flow front advancement inside the mold cavity. For the shimming technique, two different shims are used as spacers between both mold halves preventing a complete mold closure but allowing the material to undergo the real pressure applied in the unshimmed mold. The used spacers have dimensions so that the press contacts the shims at intermediate positions leaving a gap between the mold halves of 8.65 and 4.00 mm, respectively. The schemes in Figure 6 illustrate the shimming technique. For the short shot trials the material charge pattern and the molding parameters remain the same as for the normal press experiments (cf. Figure 5 and Table 2).

2.3. Compression Molding Simulation with 3D TIMON CompositePRESS

2.3.1. Filling Simulation

The 3D TIMON software module CompositePRESS is used to simulate the press process of the ribbed structure. It calculates the cavity filling and the resulting fiber orientations for the thermoset sheet-shaped HexMC charge. In 3D TIMON CompositePRESS there are two analysis methods available to simulate the compression molding process—the ‘Euler method’ and the ‘morphing method’ [105]. The Euler method uses a multi-layer voxel mesh to discretize the part by several elements over the thickness, whereas the morphing method utilizes a one-layer tetra mesh to represent the final part geometry (mold-closed shape). Advantages of the Euler method are the ease of 3D expressions for the charge definition and its flow as well as the possibility to discretize the part by several elements over the thickness. The accuracy of the movement, rotation and bending prediction of each single fiber improves when the number of elements across the thickness increases. However, this ultimately leads to a huge number of elements for more complex and/or larger components. Furthermore, due to the cubic-shaped voxel elements, a 3D-shaped component cannot be meshed without terraced steps in the contour.
In order to calculate the material flow during the compression molding process with the morphing method, the mesh is initially morphed in negative pressing direction, which means that the tetra elements are artificially stretched in z-direction to represent the open mold condition (cf. Figure 7). During the mold closure the morphed elements are then pressed back into their initial form (mold-closed shape) enabling the material flow calculation. The biggest advantage of the morphing method is that a tetra mesh can be used. Tetra elements allow easy meshing of complex geometries without terraced steps. This enables a high quality mesh consisting of a much smaller number of elements than a comparable voxel mesh. Therefore, the morphing method allows for faster analyses than the Euler method.
Considering the size and complexity of the ribbed part, the morphing method is the method of choice in this study since a high-quality tetra mesh without terraced steps can be used with a reasonable calculation time. As the applied Light 3D solver virtually divides each tetra element into 20 calculation points across the thickness, realistic flow predictions are possible even with a one-layer mesh. For the discretization of the entire part 141,385 tetra elements are used. Element sizes are varied to reduce the total amount of elements. Simple geometry areas of less interest, like the plate area, are meshed coarser with a maximal element edge length of 14 mm, whereas the hat area is discretized finer with a minimal element edge length of 0.4 mm in some rib fillets (cf. Figure 7) giving precise prediction results at a still reasonable calculation time. In total, 203 output steps are defined in order to gain a finely resolved filling analysis. Each charge package used in the physical moldings trials is also defined in 3D TIMON CompositePRESS by selecting all elements in the respective charge area and assigning the real charge thickness to those elements. Stacked charge packages are considered as one combined volume so that the actual thickness of each charge stack can be taken into account by the 20 virtual calculation points across the thickness of the stretched mesh (open-mold position). This enables a realistic modeling of the total charge volume.
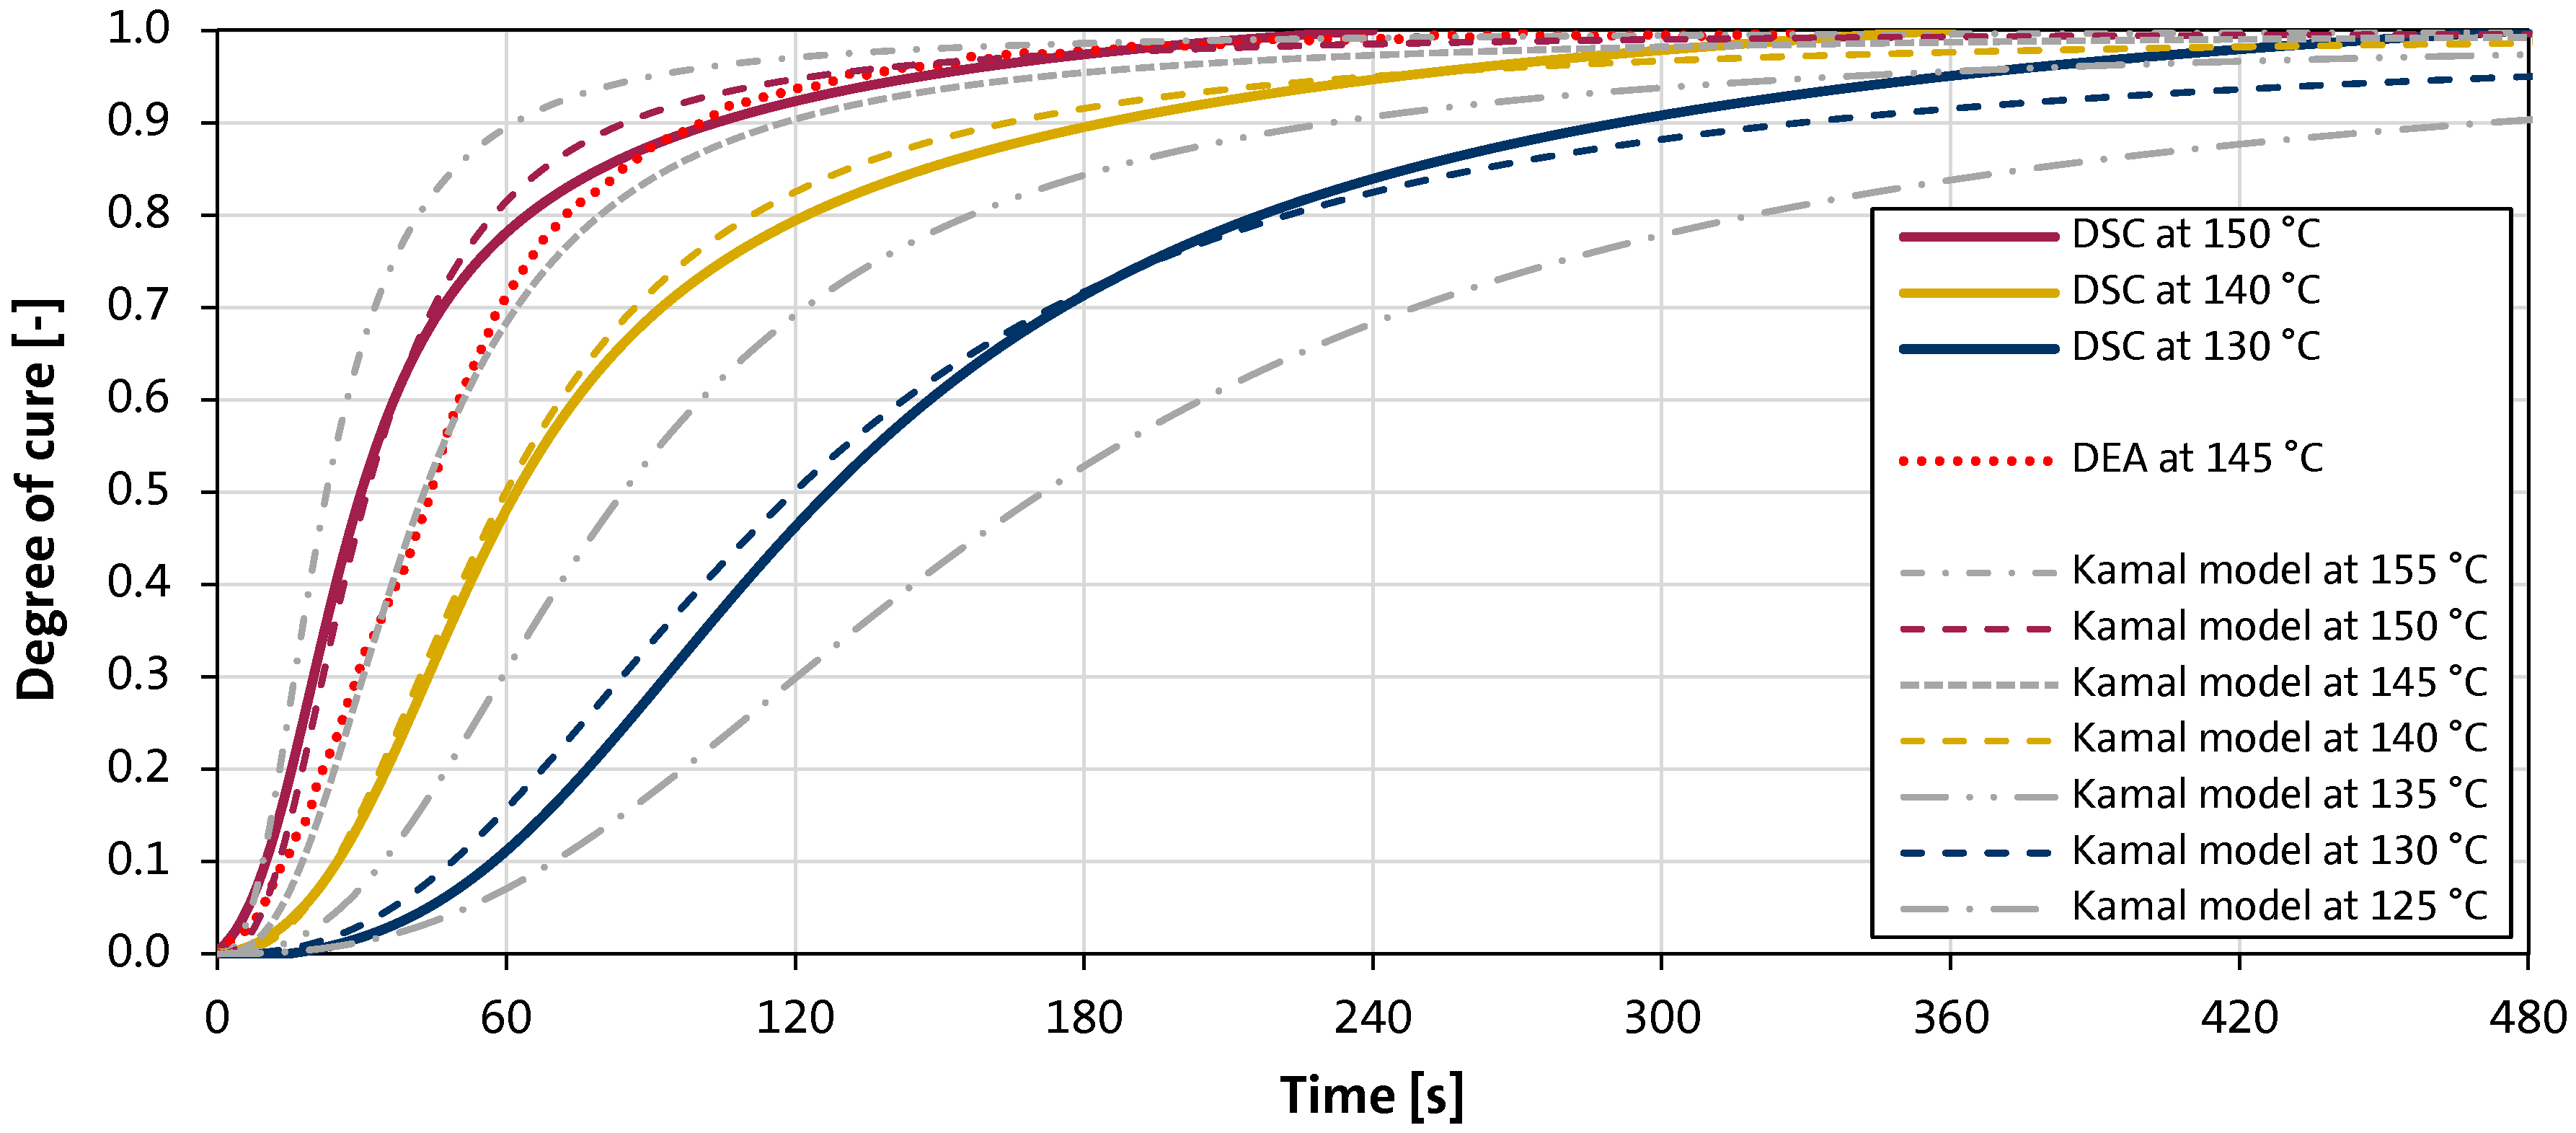
Besides the chosen curing and viscosity models, good filling simulation quality depends on the material properties deposited in the material card. The interaction between the fibers and the fluid flow (two-way coupling) and the resulting anisotropic viscosity is not considered. Typical polymer characterization techniques, such as viscosity measurements by means of rotational viscometers, differential scanning calorimetry (DSC), and dielectric analysis (DEA) measurements are used in order to calibrate the HexMC material parameters for the applied Cross–Castro–Macosko viscosity model (Table 3) and to find fitting Kamal parameters (Table 4) to model the curing behavior appropriately.
Figure 8 shows three DSC curing curves at relevant molding temperatures of 150 °C, 140 °C, and 130 °C, one exemplary DEA measurement at 145 °C, and the corresponding fitted Kamal model curves. Additionally, three Kamal model curves at 155 °C, 135 °C, and 125 °C are plotted in gray to show the modeled curing behavior at slightly varied temperatures. The generated Kamal model curves fit well to the experimentally observed curing behavior of HexMC.

2.3.2. Direct Fiber Simulation (DFS) with Strand Generation Feature

A novel feature recently implemented in 3D TIMON CompositePRESS enables the simulation of ROS materials. In the pre-processing the new strand generation feature generates randomly oriented multi-bundle UD strands mimicking the real initial material charge. In contrast to the DBS of Meyer et al. [73], which uses one chain of truss elements per fiber bundle, 3D TIMON CompositePRESS represents strands by a grouping of several aligned numerical fibers (cf. Figure 9). Four fibers frame the outer strand dimensions and a user-defined number of additional inner fibers can be added inside the strand volume to represent a realistic amount of fiber bundles within a strand. Each fiber is still divided into a user-defined number of divisions (rods) giving the fibers the possibility to bend naturally in the flow. If it is assumed that a single fiber represents one fiber bundle within a strand, the simulation approach can be considered to be representative and gives the opportunity to mimic the strand geometry and character properly. Nonetheless, so far all fiber bundles defining one strand are numerically handled separately without a cohesive force between them.
More fiber divisions allow a more realistic bending behavior, especially in situations where fibers flow into small features such as ribs. Regarding the calculation effort, the number of divisions as well as the number of additional fibers should be carefully chosen. However, the more fibers are calculated, the better the simulation accuracy and the better the fiber volume fraction representation. The numerical strands have dimensions of 50 × 8 × 0.15 mm, equal to the real HexMC UD strands. For this study each strand is represented by 4 boundary fibers and 11 inner fibers, all divided into 19 rods connected by 20 nodes (cf. Figure 9). Using 15 fibers to represent the designated strand volume is chosen as a compromise between the ability to visually analyze the strands’ movements and deformations during the DFS and the needed calculation time.
For the DFS of the ribbed structure a random in-plane strand orientation distribution in the 3D-shaped initial charge is generated (Figure 10a). The parameters for the strand generation algorithm are set so that one strand is generated per mesh element and that the minimum distance between initial fibers is zero, which means that fibers can be generated close to each other. The strand generation approach does not model the strands as enclosed volumes, so that strands intersect each other and compaction is not considered. In Figure 10b the numerically defined individual charge packages are displayed in different colors. Both the macroscopic shape of the generated charge and the distribution of strands are comparable to the physical HexMC. Since the strands are cut at each edge of a charge package, it is possible that incomplete and/or shorter virtual strands are generated—just like in reality. Even in the almost vertically oriented cavity zones the numerical representation of the initial charge pattern is reasonably realistic when compared to the true charge configuration (cf. Figure 5b). As only straight fibers are generated, a negligible amount of fibers is cut in order to fit into the mesh in tight radii. Initially, the generated strands are not bent in order to follow the curvature of the charge in those regions.

2.4. Micro-CT Measurements

Three entire ribbed hat profile parts were µCT scanned with a CT-AlphaDuo device (Procon X-Ray GmbH, Sarstedt, Germany) operated by the Fraunhofer WKI, Hannover, Germany. The system is equipped with a 240 kV microfocus X-ray tube XWT-240-TCHE Plus (X-RAY WorX GmbH, Garbsen, Germany) with a high energy diamond/tungsten transmission target offering a JIMA (Japan Inspection Instruments Manufacturers’ Association) test resolution of 0.9 µm. The X-rays are recorded by a 249 × 302 mm PaxScan® 2530DX detector (Varian Medical Systems, Inc., Salt Lake City, UT, USA) with a resolution of 1792 × 2176 pixels. In order to maximize the voxel resolution at the given sample diameter, the detector panel width was virtually extended by measuring field extension (MFE) (in situ horizontal movement of the detector panel). The focus object distance (FOD) and the focus detector distance (FDD) were 642 mm and 1500 mm, respectively. For best possible scan results, the parts’ plates were removed from the hat section with a water jet cutter. This improves the CT scan quality since the penetration length is shorter and thereby induced scan defects (e.g., the resulting image noise) are kept low. Each ribbed part was mounted on a rotating table between X-ray source and detector (see Figure 11a). The whole scan setup is built on an air-damped granite base in order to minimize vibration-induced scan artifacts. For the measurements the X-ray tube was operated at a voltage of 160 kV and a current of 250 µA. The sample was rotated in 2400 rotation steps (0.15° angular increments) for a full 360° rotation with an integration time of 6 × 200 ms per angular increment. This was repeated for both detector positions. The measuring time for each partial scan accumulated to approximately 100 min.
All samples were scanned at a mesoscale resolution of 59.6 µm (voxel edge length) corresponding to approximately 16.8 pixels/mm. Each voxel contains a single 16-bit relative density-defined grayscale value between 0 and 65,535. With the applied scan resolution, which is approximately 10× the carbon fiber diameter, it is possible to clearly see in-plane strand boundaries. However, the strands are only resolved with ~2.5 voxels in thickness direction (minimum fiber bundle dimension), which is not enough for clear boundary detections in that strand dimension. Further, a 1 mm thick aluminum filter is used in front of the X-ray target in order to reduce the effect of beam hardening. As a result of different penetration lengths of low and high energy X-ray photons beam hardening causes grayscale value gradients inside the sample, which can especially affect grayscale value sensitive analyses such as the fiber orientation analysis. By using a filter, low-energy X-ray photons are suppressed and thereby the X-ray spectrum is shifted to higher energies. In previous experiments this specific CT scan configuration has proven to be conducive for reasonable fiber orientation analyses of larger CF-SMC components. Reconstruction of the 3D volumes was performed with the software ’Offline CT’ (Fraunhofer Institute for Integrated Circuits IIS, Erlangen, Germany). Table 5 summarizes the applied µCT scan parameters.
To capture the entire ribbed structure at the necessary resolution, seven partial scans were performed and afterward virtually stitched together using the CT scan visualization and processing software VGSTUDIO MAX 3.3. As the individual CT scans slightly vary in their grayscale value distribution, for each 3D data set the average grayscale values of background and material were determined from the grayscale value histograms. Based on these values the volumes were imported into VG applying the ‘histogram calibration’ function to create a homogeneous grayscale value profile over all scans. Each individual scan captures a sample section of about 150 mm in width, 52 mm in height, and 90 mm in axial direction (Figure 11b) leading to an overlap of at least 15 mm between adjacent scans that eases the manual alignment and merging of the imported partial volumes. The alignment and merging procedure was done with utmost care so that any negative effect on the final 3D data set and the subsequent CT scan analysis is ruled out. Regions of interest (ROIs) were created defining the area of two adjacent volumes to be merged. The filter ‘merge volumes’ in mode ‘mean’ was applied to combine two adjacent volumes based on these ROIs. By repeating this procedure, one continuous 3D volume of the entire sample was composed of the partial scans.
The surface determination was conducted on the merged volume so that the scanned parts’ thicknesses match with the average true thicknesses of the molded parts measured with an electronic external measuring gauge. The final object volume is then used as ROI where the background (surrounding air) is removed. This reduces the 3D volume data to be analyzed leading to faster fiber orientation calculations. The final volume of each stitched ribbed part has outer dimensions of 150 × 450 × 52 mm and an analyzed volume of approximately 350,000 mm3 captured by almost 1.78 billion voxels.
All three scanned ribbed structures are analyzed regarding their second order fiber orientation tensors (hereafter FOTs) in several sample areas using the fiber composite material analysis (FCMA) tool implemented in VG. The same tetra mesh that is used for the 3D TIMON CompositePRESS process simulation is imported to VG and is utilized as an integration mesh for the CT scan analysis. Therefore, each 3D volume is registered to the tetra mesh’s coordinate system, so that the scanned ribbed structures are perfectly superimposed with the tetra mesh. With this procedure a one-to-one comparison with the process simulation results is possible since the same tetra elements used in the process simulation can be utilized for the fiber orientation analyses in VG. For each element of this analysis mesh the FOTs, eigenvectors, and eigenvalues are determined and evaluated.

3. Results

3.1. Compression Molded Ribbed Structure

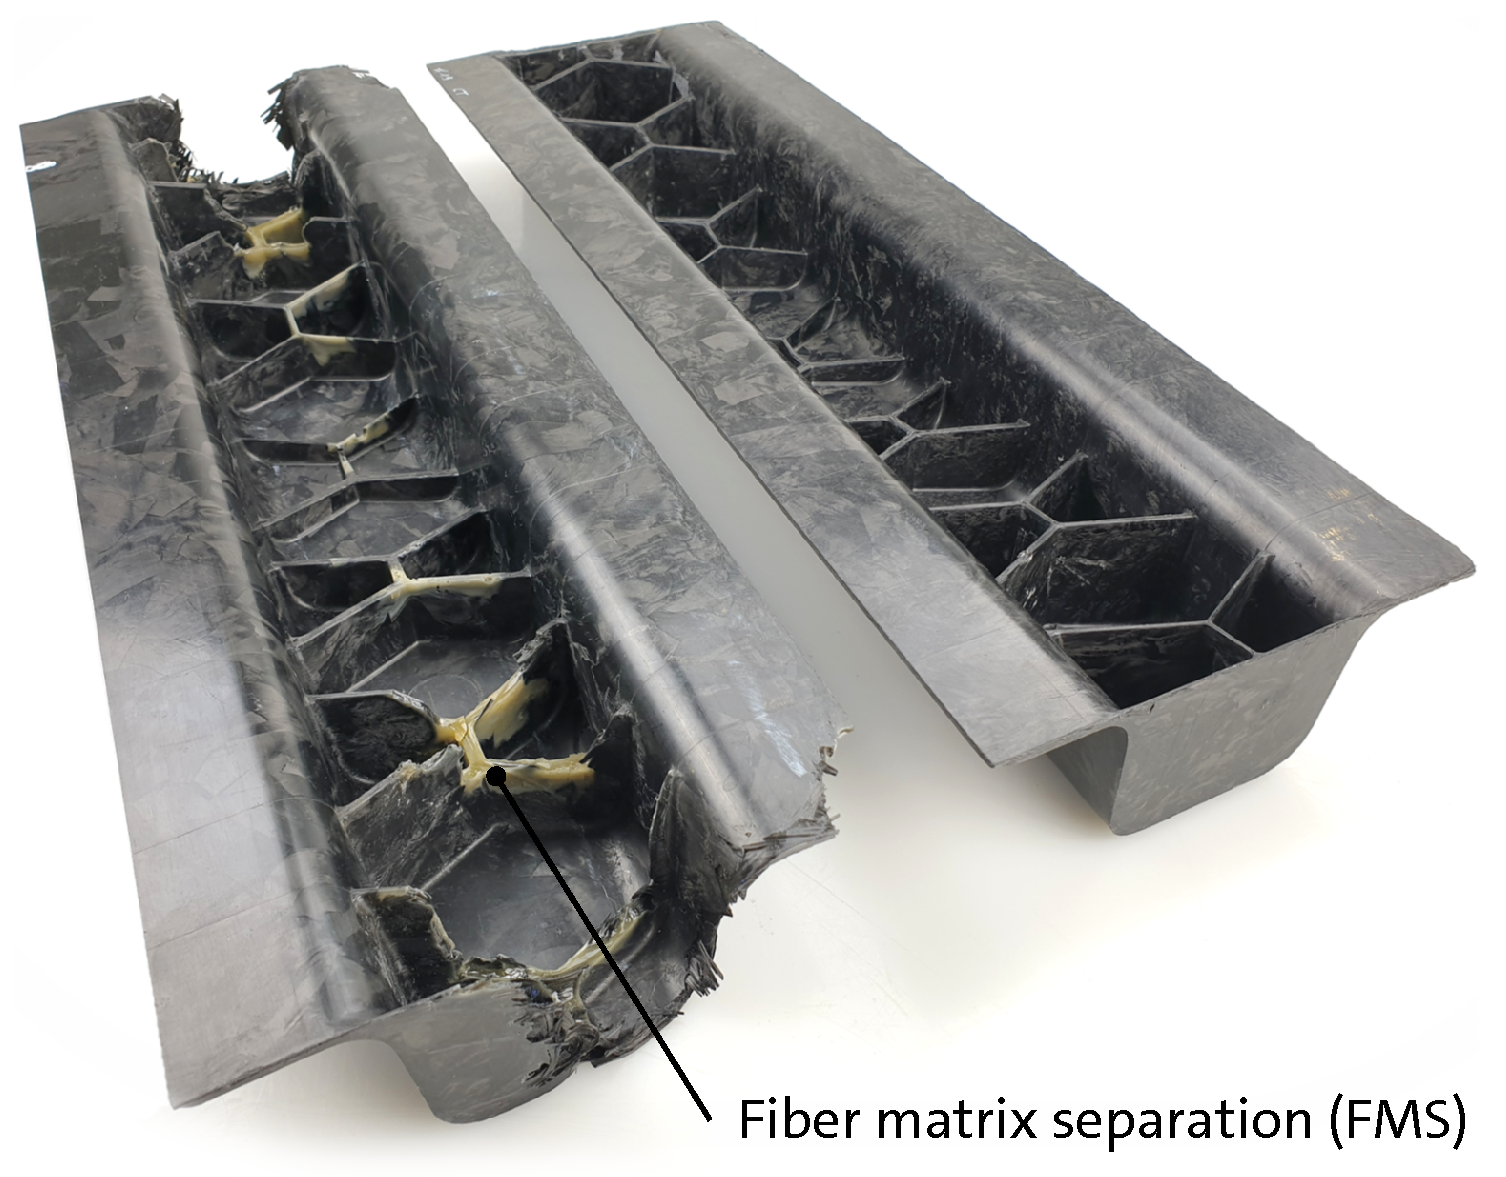
Typically, long fiber reinforced plastics (LFRP) are predestined to interlock and accumulate for instance at the entrance of ribs causing FMS. This effect is even more pronounced for SMC that consist of ROS since the UD strands are stiffer than single long fibers, which impedes the flow into narrow structures such as ribs. Filling the complex ribbed part with 50 mm long UD strands is therefore challenging as FMS is highly likely. Simple charge patterns and non-optimal compression molding parameters led to incomplete part filling, as depicted on the left hand side in Figure 12. Simulating several different charge configurations in 3D TIMON CompositePRESS showed uneven pressure distributions and finally helped to develop a complex charge pattern with a more even pressure distribution. The virtually developed final charge pattern (see Figure 5) allows a balanced flow to all cavity areas for an even part filling without visible FMS. The cut strands at the edges and the size and position of each charge package help to fully fill the part. Lowering the material viscosity by the previously described pre-heating procedure increases the flowability when the material is compression molded, which further prevents FMS. Moreover, the charge pattern ensures a good venting, so that no air traps occur. The incompletely filled part in Figure 12 is juxtaposed with a fully filled ribbed part after applying the pre-heating technique and using the final process simulation optimized charge configuration.
Figure 13 shows a picture of three randomly picked ribbed hat profiles that were pre-heated and then compression molded with the optimized charge pattern. These three parts are CT scanned for a comparison with the DFS results of 3D TIMON CompositePRESS. The detailed view on the right hand side shows the middle section of sample #19 in bottom view. In the plate brim of the hat profile just slightly deformed strands can be seen. In contrast, the strands are exposed to complex flow conditions and undergo high shear forces when they flow from the initial charge edge in the hat to the end of the cavity in the end brim. The flow path length is approximately 100 mm. Therefore, the end brim is characterized by highly deformed strands split into fiber bundles. At the flow path end these bundles align along the cavity wall.

3.2. Filling Simulation Results Compared to Short Shot Experiments

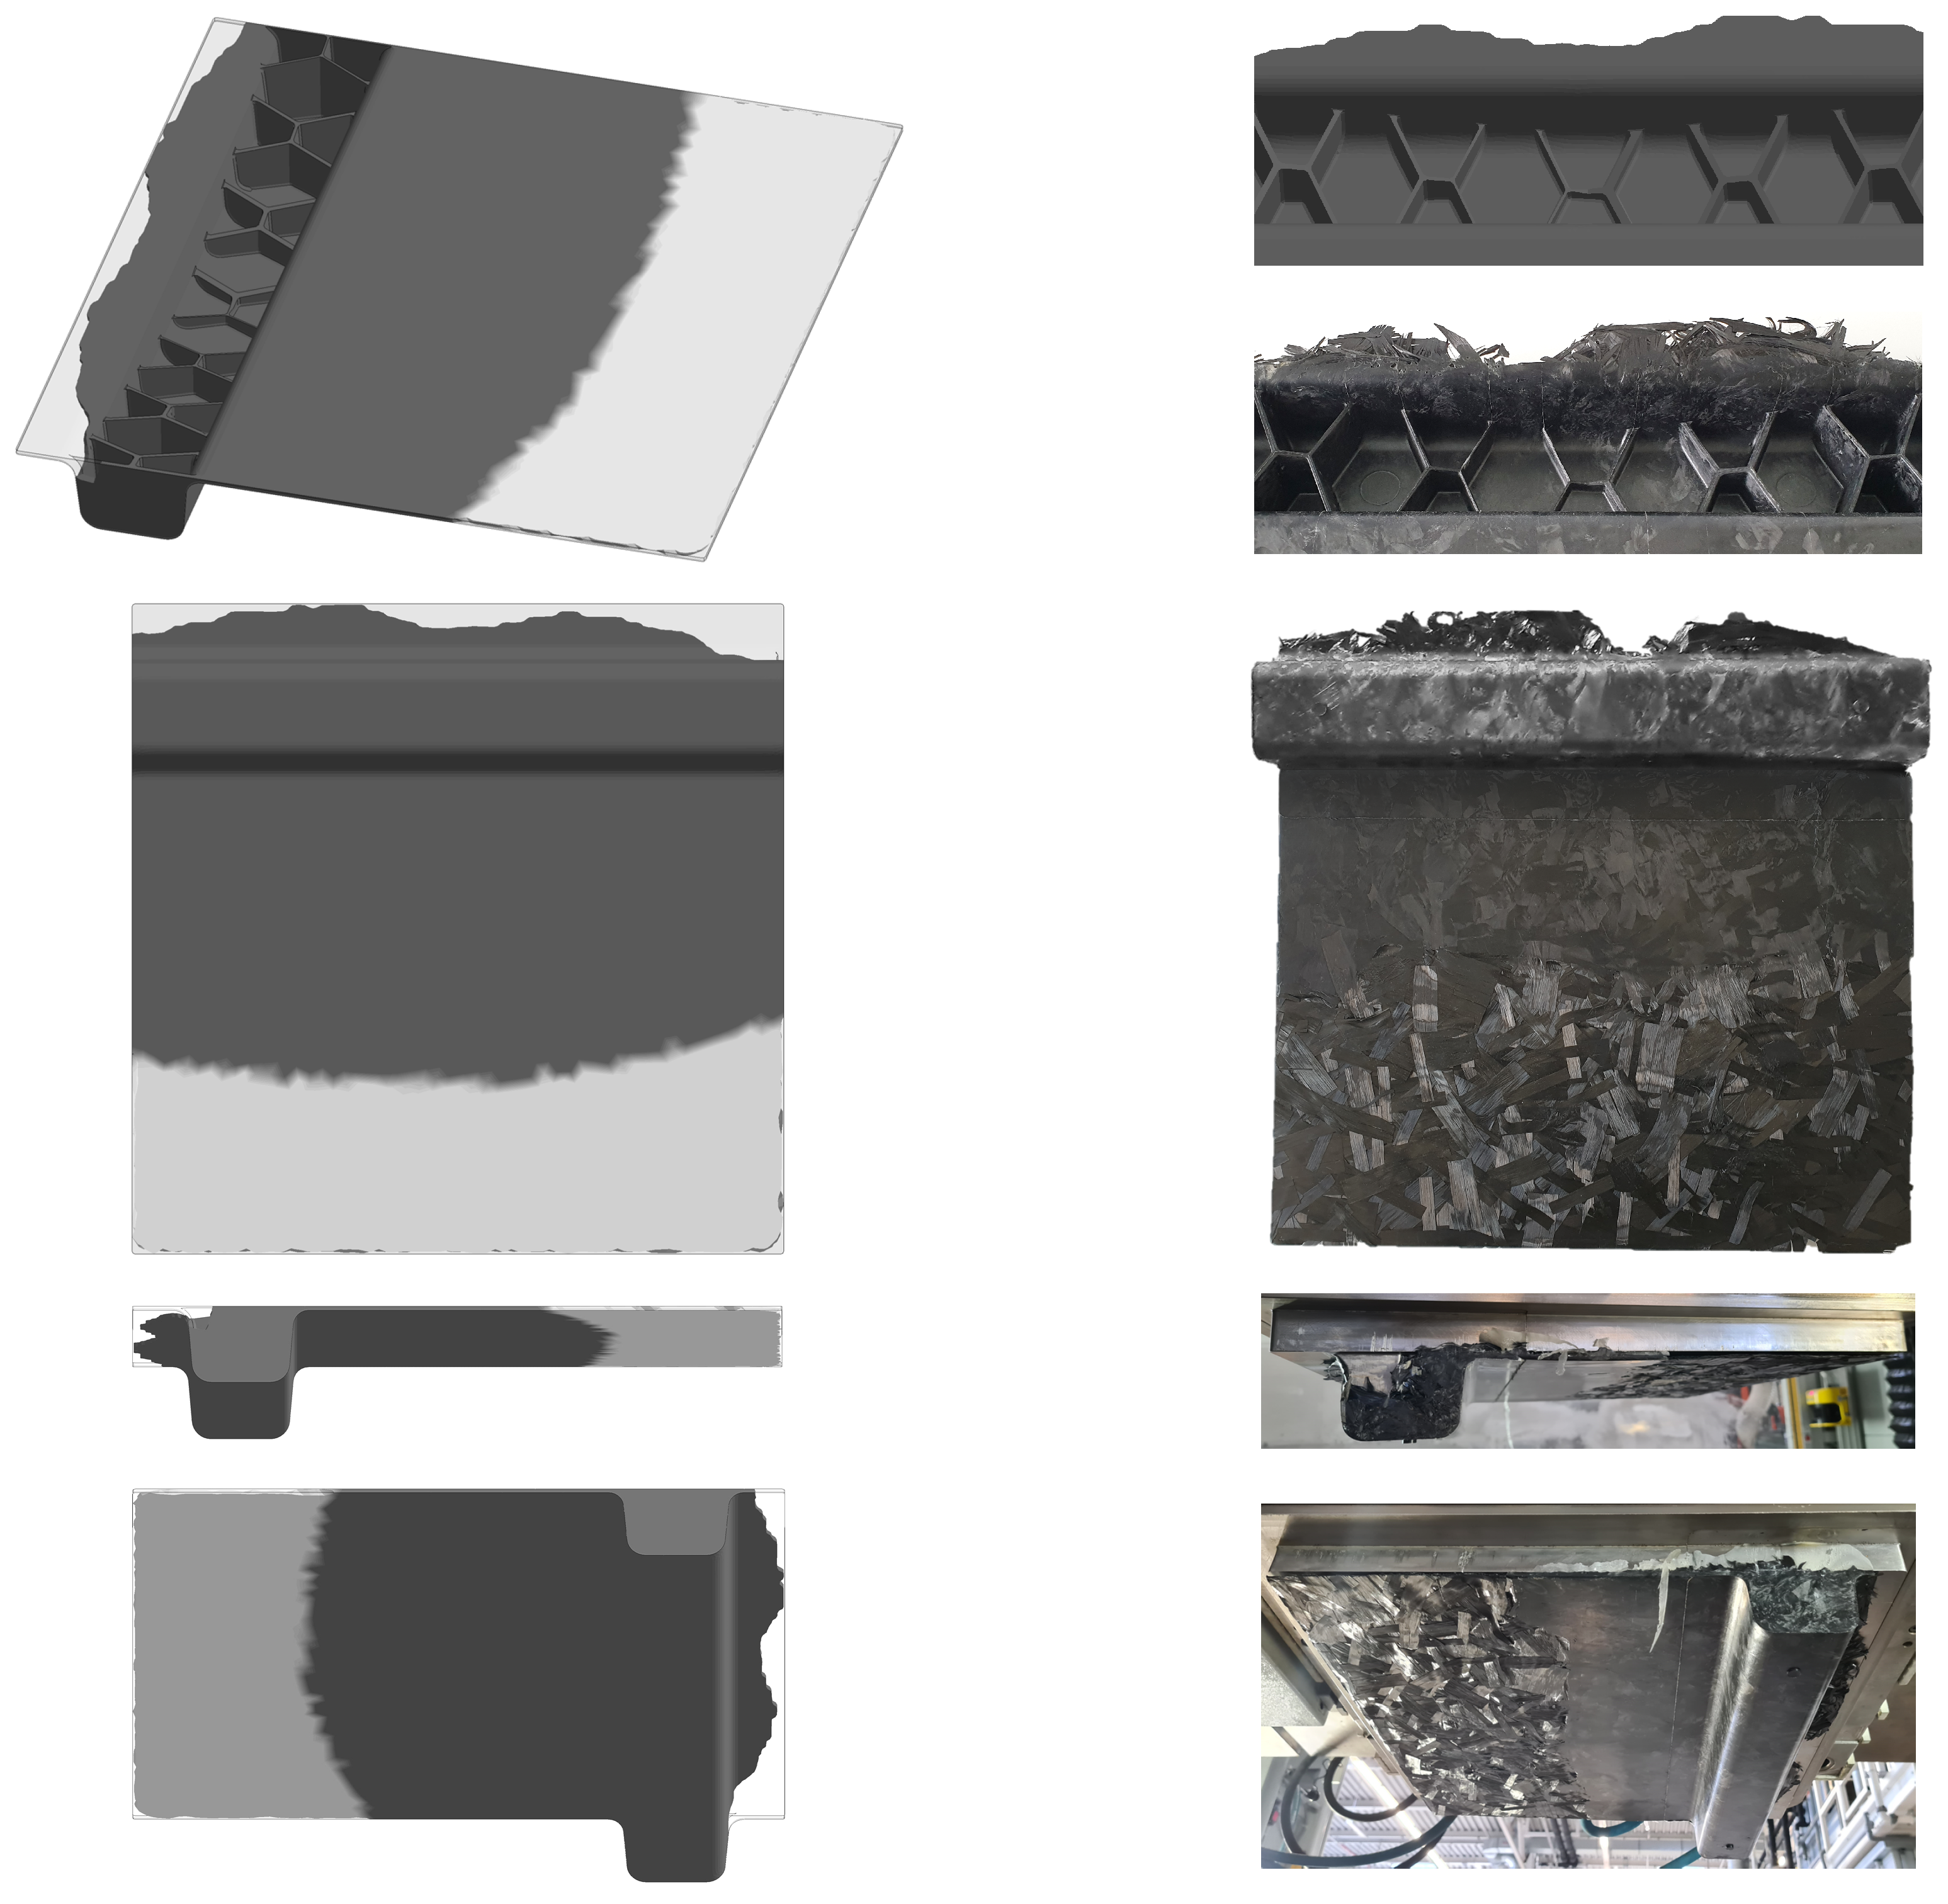
In velocity-based DFSs good fiber orientation predictions depend on the accuracy of the filling simulation. In order to check and evaluate the flow prediction accuracy in 3D TIMON CompositePRESS short shots were conducted and are used as first quality indicator in direct comparison with the simulation results. Figure 14 shows the predicted mold filling in 3D TIMON CompositePRESS and qualitatively compares it with the real flow front advancement in the corresponding short shot. When the mold closing is interrupted at a cavity gap of 8.65 mm the ribs have begun to fill (dark grey colored) and the numerical filling status is in very good agreement with the experiment. Due to its higher thickness the charge material in the ribbed area is pressed first, whereas the base layer material in the plate area has no contact to the upper mold half yet (light grey colored). Moreover, at a remaining cavity gap of 4.00 mm the proceeding flow front in the end brim of the hat profile is almost identical in experiment and simulation (see Figure 15). In the plate area the numerical flow front is slightly faster than in reality. In both, in reality and in the simulation the last unfilled rib is the left outer flank, whereas the right outer flank is already filled. Since these numerical filling results are in such a good agreement with the experimentally observed flow front advancement in the short shots, especially in the complex geometry of the hat area, it is assumed to have an accurate flow field prediction as basis for the subsequent DFS. In total, the flow simulation takes only 21 min (wall clock time) using four cores of a standard tower PC (Intel® Xeon® E-2246G CPU @ 3.60 GHz, 32 GB RAM).

3.3. Direct Fiber Simulation (DFS) Results

For the DFS of the ribbed part 1,193,306 fibers are generated in the initial charge corresponding to approximately 62,800 strands. The DFS simulation for this number of fibers, the amount of tetra elements and the number of output steps takes 112.41 h or 4.68 days (wall clock time, corresponding to 202.96 h or 8.46 days in CPU time), respectively, using four cores of a standard tower PC (Intel® Xeon® E-2246G CPU @ 3.60 GHz, 32 GB RAM). Since fiber attrition is insignificant during compression molding of CF-SMC materials, fiber breakage is not simulated in this work.
Figure 16 shows the initial charge with the generated UD strands at the start of the DFS and the flowing strands close to the end of the press process. At the end of the end brim the fiber bundles orient parallel to the cavity wall and the material flow stops. The proceeding flow front in the plate area is characterized by blurriness due to the deformed fibers. This effect can also be observed in Figure 17, where the movement and deformation of one highlighted UD strand in the lower right corner of the plate is depicted. The images clearly show how the UD strand flows and slightly rotates. From the images it can be seen that the fibers building one strand (cf. the purple colored fibers of one individual strand) are following the flow field as a grouping, although there is no cohesive force between the fibers of one strand. The initially straight fibers deform into a zigzag shape causing the blurriness. This behavior corresponds to the observations made in reality, where the UD strands stay intact and flow together in the plate area. For a one-to-one comparison, images of the initial strand configuration in the real HexMC charge and of flown strands in a molded part are given in Figure 18. Under more complex flow conditions, like in the ribbed structure, a strand splitting can be seen (cf. Figure 19). The DFS shows how the fiber bundles of one blue highlighted strand flow into and through a rib. After exiting the rib the fibers separate. This effect is also visually notable on the surface of molded parts (for example in the end brim area in Figure 13) and in CT scans of the same area (see Figure 21).
Figure 20 shows the predicted fiber orientations in the entire ribbed hat profile displayed as vectors. After flowing through the ribs the fibers align in flow direction. Between the rib exits a more random orientation is visible. Highly oriented and random orientation area alternate. At the end brim it comes to a distinct alignment with the cavity wall. Following the melt flow direction, the fibers point into the left and right end brim corners, which are the last filled areas of the ribbed structure. Due to the more even flow conditions in the plate brim a uniform fiber orientation distribution can be discerned there. The two connecting rib bridges at the left hand side and the right hand side of the ribbed structure exhibit a complex fiber orientation, whereas the three smaller connecting rib bridges, shown in the cross section in Figure 20b, are characterized by almost homogeneous horizontal fiber alignment.

3.4. Fiber Orientation Measurements (VGSTUDIO MAX 3.3)

For this study a working combination of CT scan hardware and scanning parameters is found that allows for full-sized analyses of fiber orientations in carbon fiber composite parts. Three randomly picked samples of a series of ribbed HexMC parts are CT scanned. A first example of the achieved scan quality is given in Figure 21. The detailed view of the right end brim section of sample #20 shows a flow-induced mesostructure, where individual fiber bundles can be clearly discerned. This determined mesostructure also resembles the observed strand splitting in the end brim predicted in 3D TIMON CompositePRESS. In the grayscale image the denser carbon fiber bundles are defined by white voxels, whereas the pure low-density epoxy is represented by black voxels. Consequently, gray pixels indicate the homogenized mesoscale density variations. These variations span a range from the density at maximal fiber volume fraction (nominal 57 vol.%) in tightly compacted strands (bright voxels) to the epoxy density occurring at strand boundaries, strand intersections, and in pure resin areas (dark voxels) due to FMS.
The CT images of all three scanned samples in Figure 22a allow a visual analysis of the fiber bundle orientations in the middle section of the hat profile and also a comparison among the scans. The plate brims show less deformed and more randomly oriented UD strands, whereas in the end brims clear alignments of split fiber bundles can be seen. In some areas slight indications of FMS are visible. In the head area of the hat profiles the ribs stand out. This is due to the material flow into the ribs leading to highly oriented areas underneath and within each rib.
For the fiber orientation analysis with the FCMA tool in VG, fiber bundles and matrix material are distinguished by appropriate thresholding in each of the three merged scan volumes. Although the applied scan resolution of 59.6 µm is not fine enough to see discrete carbon fibers or to exactly differentiate between individual strands in thickness direction (~150 µm strand thickness), it is sufficient to determine strand orientations, proven in Figure 22b. This is possible due to the large strand scale and since the direction of least density change within a strand stack is aligned with the strand’s longitudinal axis. Instead of identifying single fibers for the orientation analysis, the FCMA algorithm detects inter- and intra-strand density gradients and uses them as indicators for the local fiber bundle orientation. The local relative density gradients in the recorded voxel data can thus be used to determine the mean orientations for each element volume of the integration mesh without even capturing all strand boundaries. In Figure 22b the determined fiber orientations in the brim areas are displayed as ellipsoids in the end brim area and as compass needles representing the 1st eigenvectors in the plate brim area, which is a typical second method to visualize fiber orientations in composite parts. The rounder and flatter the green ellipsoids get, the more random in-plane are the determined bundle orientations. This is especially visible in the middle section of the end brim, whereas the outer sections of the end brim are characterized by more distinct bundle alignments, shown as red elongated ellipsoids. The measured orientations indicate reasonable bundle orientations proving that the local mesoscale density variations in the scanned parts can be used to analyze the fiber orientations by VG.
In Figure 23a a detailed 3D view of the hat profile middle section of sample #20 shows fiber bundle orientations at the part surface and inside the slightly removed brim areas. The FOTs visible as ellipsoids in Figure 23b are determined using the process simulation tetra mesh also used for the fill simulation and DFS in 3D TIMON CompositePRESS. For better visibility the CT scan data are set to 100% transparency so that only the ellipsoids are visible. Highly oriented fiber bundles, displayed as red elongated ellipsoids, characterize the ribs and also some areas in the head and in the end brims. Especially the rib exits shows high bundle alignments in flow direction. At the flow path end at the outer edge of the end brim it comes to a clearly visible alignment with the cavity wall. The plate brim shows a more random orientation status. Overall, the image color is more green than red, which indicates that most of the hat profile has a random in-plane fiber bundle orientation, displayed as green flattened ellipsoids. Only in areas with strong material flow the initially random strand orientation of the raw material changes into a process-induced mesostructure with areas of distinct bundle orientations (red elongated ellipsoids). Since the process simulation mesh has only one element across the part thickness, it averages the bundle orientations over the thickness for each element volume. However, it still delivers reasonable FOTs when visually compared with the CT scan grayscale image. Therefore, an easy one-to-one comparison with the DFS results on the same mesh in order to evaluate the simulation accuracy is possible.

3.5. Comparison of Predicted and Measured Fiber Orientations

All three CF-SMC hat profiles show visually similar fiber bundle orientations. This observation can be proved by comparing determined FOTs, eigenvectors, and eigenvalues of all three completely scanned parts. In order to eliminate the expectable local fiber orientation differences between the scanned parts, certain areas in the hat profile are used for the analysis. The determined orientation values for all tetra elements within these analysis zones are averaged to give a representative orientation status in that area. The analysis areas with their designations are given in Figure 24. The analysis boxes are superimposed with the tetra mesh and the box transparency makes it possible to discern which elements are used for the analysis.
The orientation angles for the rib analysis areas are determined by calculating angle θ (see Figure 25). The conversion equation for spherical coordinates given in Equation (29) is applied on the 1st eigenvectors in x-, y-, and z-direction and subsequently the calculated angle is projected onto the yz-plane. For the brims and head analysis areas in the xy-plane Equation (30) is used to calculate angle φ (see Figure 25) based on the 1st eigenvectors in x and y-direction.
θ = arccos z x 2 + y 2 + z 2 .
φ = arctan 2 x , y = arctan y x , if   x > 0 , arctan y x + π , if   x < 0 y 0 , arctan y x π , if   x < 0 y < 0 .
The CT scan results with the determined average values and standard deviations (SD) for the seven rib analysis areas are given in Table 6. The average fiber orientation components Axx, Ayy, and Azz have mean standard deviation between all three scans of just 0.03, 0.04, and 0.03. Furthermore, the measured average orientation angles show a very low mean standard deviation of 4.1°. All measured angle SDs are below 4°, the only higher SD has the left rib center analysis area. Since there is a distinct uniform material flow in the rib areas, these low differences between the three CT scans are expectable.
In the brim analysis areas the mean standard deviation for the main FOT components Axx, Ayy, and Azz are comparable low (Table 7). The mean SD for the tensor component Azz is even lower than in the rib areas as in the brim and head areas a low fiber orientation component in z-direction is apparent. The mean SD for the measured orientation angles is at 18.6°. This deviation is reasonably small considering the initially random in-plane orientation of the UD strands and shows that there is a measurable flow-induced mesostructure.
The consistency between the three scans, ascertainable by the low standard deviations, is justifying to average the fiber orientation results of all three samples in the hat profile section in order to get a representative depiction of the average mesostructure. Furthermore, the averaged FOTs can subsequently be used to compare the CT scan measurements with the process simulation results. This comparison is a direct method to validate the predicted fiber orientations.
In Table 8 the predicted fiber orientation results coming from the DFS in 3D TIMON CompositePRESS are given for the rib analysis areas. Here the absolute errors with the averaged CT scans in the respective analysis areas are given in order to quantify deviations. To indicate the overall degree of error for all regions of interest, the mean absolute errors (MAEs) are given. The MAE for the FOT components is 0.06 for Axx, 0.15 for Ayy, and 0.16 for Azz. The highest FOT and orientation angle deviation between CT measurement and prediction are observable in the right rib’s bottom analysis area. This could be linked to the rib’s base wall thickness, which is thicker than at the other two ribs. Here, the narrow gap assumption of the Hele-Shaw simplification method applied in 3D TIMON CompositePRESS might have reached its limits. The 1st and 2nd eigenvalues have a MAE of 0.12 and 0.10, respectively. These MAE values show that the DFS results are not perfect but certainly realistic. The predicted orientation angles have a comparably low MAE versus the measured bundle orientation angles in the CT scans of only 11.6°, which explicitly shows that the orientation behavior is correctly captured by the DFS.
In order to make the comparison between the measured and the predicted fiber orientations in the respective analysis areas easier, the orientations are visually superimposed as 2D ellipses in Figure 26. Fiber orientations in space can be easily visually represented by ellipsoids. However, in stationary 2D images it is easier to demonstrate FOTs as ellipses, neglecting the extension in the third room direction. For the visualization of the mean bundle orientations in those analysis areas the determined average values for the 1st and 2nd eigenvalues are used to define the length of the ellipses principal axes (outer dimensions) and the averaged orientation angle is used for the rotation of the ellipses (cf. [134]). For the rib analysis areas the angle θ is related to the z-axis and rotates the ellipses in the yz-plane. Since the 1st and 2nd eigenvalues already consider the ignored 3rd eigenvalue (representing the ellipsoid’s spatial extent in the third room direction), there is no error between the 3D ellipsoid and the 2D ellipse presentation of the orientation when using a 2D front view without any viewing angle. This method enables to easily visually compare the measured and the predicted orientation values in one figure independently from the software they are coming from.
In Figure 26 the 2D ellipses calculated from the CT measurements in green are compared with the 3D TIMON CompositePRESS results in pink ellipses. There are analysis boxes with pretty good and some with less good but overall reasonable agreements between orientation measurement and prediction. The eigenvalues do not agree perfectly in all cases, yet the orientation angles capture the right orientation trends. According to Table 8 the highest absolute errors exit in the left rib top and the right rib bottom analysis areas, which can be quickly visually checked in Figure 26.
Table 9 gives the predicted fiber orientation results for the brim and head analysis areas. The results from 3D TIMON CompositePRESS exhibit lower MAEs for the FOTs and the eigenvalues than compared to the rib analysis areas. The maximal FOT error is 0.09 for Axx and 0.07 for the eigenvalues, respectively. These lower MAEs could arise out of the fact that here, in all analysis areas, the maximal part thickness is just 2 mm and the orientation component in the thickness direction (Azz) is very low, so that it has a low significance. The mean absolute error (MAE) is in a still reasonable area around the true orientations measured in the CT scans. The tensor components Axx and Ayy are always bigger than Azz similar to the CT scan measurements. So the overall orientation tendencies are correctly captured. The predicted orientation angles’ MAE is only 2.9° higher than the SD of the measured bundle orientation angles in the CT scans. This is a good indication that on average the orientation trends can be reasonably predicted. This deduction can also be visually proven in Figure 27. Here, the angle φ is related to the x-axis and rotates the ellipses in the xy-plane.
In comparison to the ribs, the brims and head analysis areas have lower MAEs for the FOT components and the eigenvalues. This manifests in better agreement of the ellipses outer dimensions, which in most areas fit well. Additionally, in some areas the deviation between the measured and the predicted orientation angles is very small, so that visually a very good agreement can be quickly found, for example, in the right end and plate brim section (cf. Figure 27).

4. Discussion

For this study the compression molding of ROS-based CF-SMC into complex ribbed structures without defects, such as FMS, is accomplished although the chosen coarsely structured material with the scale and stiffness of its 50 mm long and 8 mm wide UD strands is typically not suited to fill thin and high ribs like those existent in the part. This is achieved by increasing the material’s flowability with a pre-heating step and an optimal charge pattern allowing an even part filling without untimely curing through long flow paths or inhomogeneous shear loads. The sizes and positions of each of the single smaller charge packages is devised by means of fill simulation studies using 3D TIMON CompositePRESS. Such filling simulations take less than half an hour on a standard tower PC so that several studies can be conducted in reasonable time frames. This simulation-aided charge pattern development process prevented long trial and error molding sessions to find a working charge pattern and thus shortened the experimental time. This molding success shows the possible capabilities of a good charge preparation technique and a proper process simulation tool.
The accuracy of the cavity filling prediction is qualitatively evaluated by a comparison with short shots. The consistency between the experimentally obtained and the predicted mold filling is conclusive so that the calculated flow field can be assumed to be a sound basis for the consecutive DFS of the part. The slightly faster numerical filling of the plate area could be traced back to the fact that only a one-way coupling is used in the flow simulation. The missing impact of the fibers on the fluid flow behavior may lead to an over prediction of the material flow velocity at longer flow path lengths. A promising approach to overcome these shortcomings could be the incorporation of a two-way coupling between fibers and fluid to achieve an anisotropic material flow. From the convincing fill simulation results in the hat profile section and the marginal over prediction of the plate area filling it can be further concluded that the developed HexMC material card with its determined Kamal parameters and isotropic viscosity properties is suited to be used. The applied simplifications for the flow prediction, such as the Hele-Shaw model for the compression molding process and the only one-layered tetra mesh, lead to accurate results and are thus valid. Apparently, the 20 calculation points per element over the part thickness are a reliable approach to use simple tetra meshes and yet deliver convincing results in comparable short calculation times.
In order to be able to validate the 3D TIMON CompositePRESS process simulation results, CT scans of three entire ribbed structures were recorded. The quality of the CT scans is remarkable for the part size and the carbon fiber reinforced material. Due to the low contrast between carbon fibers and polymer matrix systems, there is always a trade-off between the needed CT scan resolution and the maximal scannable size of carbon fiber composite samples. However, in this study an optimum interaction of the CT scan hardware and scan parameter settings enabled CT scans with sufficient scan resolution to determine local orientations in a complex ribbed CF-SMC part. Single scans were successfully merged to full-part 3D CT scan volumes. As far as is known, such high-quality CT scans of a full CF-SMC part of this size are not published elsewhere. The scans can be easily analyzed by using the local density gradients instead of discrete carbon fibers for the fiber orientation measurement with a commercial CT scan analysis software—in this study VGSTUDIO MAX 3.3. Here, the analysis benefits from scale of the strands, which is used to correlate inter- and intra-strand density gradients to local orientation states similar to findings by Denos et al. [20] and Favaloro et al. [21]. Although the scan resolution is not fine enough to discern individual fibers from each other or to differentiate between strands in thickness direction, the local orientation states can be accurately measured for the whole part volume. Due to the mesoscale character of ROS materials, the scan quality and the used analysis mesh is suited for mesostructure analyses and comparisons with process simulation results or as input data for subsequent integrative structural simulations. If more detailed information is really needed, a finer scan resolution must be applied and either more and smaller CT scan volumes have to be merged (higher expenses), or just local spots of interest can be scanned without gaining whole-part 3D fiber orientation information. Finer analysis meshes with several elements over the thickness might also be beneficial for coupled structural simulations. On the other hand, when 3D orientation information is needed for an even bigger part, the CT scan method comes to its limits if the costs may not be too extensive.
Subsequently, the measured orientations of the three scanned parts were averaged to receive a characteristic representation of the part’s mesostructures in 21 analysis areas. The averaging reduces local differences between the samples and reveals low standard deviations between the measured orientations of the three CT scanned mesostructures. This consistency justifies using the averaged 3D fiber orientation information as basis for the DFS software validation. Although additional CT scans of further parts would obviously enhance the reliability of the CT scan measurement results, the detected low standard deviations are a good sign that the small number of just three scanned parts is sufficient to represent the general orientation state occurring in the ribbed structures. As the gained CT orientation information for the CF-SMC parts are the only expedient data basis to validate predicted orientations in 3D, the apparent full-part CT scan results are valuable data, without precedent.
As far as is known, there is no other commercially available software tool that enables one to simulate the compression molding of ROS-based SMCs by applying a DFS method other than 3D TIMON CompositePRESS. Therefore, 3D TIMON CompositePRESS and its novel strand setting feature is applied and evaluated in this study. In comparison to the DBS of Meyer et al., which uses one chain of truss elements per fiber bundle, 3D TIMON models each strand by several fibers representing the fiber bundles within one strand. This gives the opportunity to mimic the strand geometry and behavior, such as strand splitting, properly. Since there is so far no cohesive force between the fibers of one strand or any interaction between fibers or strands modeled, all fiber bundles are numerically handled separately and fiber spreading and strand deformation will be inevitably overestimated. Furthermore, the assumed higher stiffness of strands compared with single fibers and especially its effect on the rib filling behavior is not taken into account. This could be addressed and studied in prospective simulations by numerically increasing the fibers’ stiffness in the material card. However, the numerical strands show realistic flow behavior when compared to the experiments and therefore the software’s UD strand mimicking is considered as a valid and working modeling strategy. From these results it is concluded that cohesive forces and interactions may not be absolutely necessary to represent a realistic strand movement and that the additional CPU time, when implementing such feature in the software, can be saved without losing too much accuracy. As the DFS simulation takes more than four days, the number of mesh elements, fibers, and output steps should be adapted to the situation and the needed degree of detail. For very large structural CF-SMC parts, which are currently targeted by automotive engineers, the needed simulation power for DFSs is a limiting factor for the presented DFS method. Even with high performance clusters the calculation of billions of fibers will not be effective anymore at a certain part size. Possible improvements could be made by modeling the UD strands by deformable cuboids instead of a group of single fibers, ignoring the strands’ splitting behavior. As commonly very high charge coverages are used for such big parts, split strands play a minor role and this modeling idea could decrease the calculation times effectively. Although it has a minor impact on the DFS results, the charge generation in tighter radii, where the initial strands are so far unrealistically cut, could be improved, so that the strands follow the charge curvature instead of being cut.
The used high-performance CF-SMC HexMC is a typical member of the ROS-SMC material class and is therefore utmost suited for the software validation. For the evaluation the averaged CT measurements of the three ribbed hat profile parts are used. With the process simulation tetra mesh imported into the CT analysis software, a one-to-one comparison with the DFS results in the defined 21 analysis areas using exactly the same elements was conducted. The average CT values for the FOTs, eigenvectors and eigenvalues in the regions of interest were juxtaposed with the predicted values. Besides the small CT database with just three scanned parts, the detected deviations between CT measurements and DFS results might also originate from the chosen analysis areas and their sizes. Appropriate sizes for the analysis areas are crucial in order to ensure that local differences between the three CT scans and also in the process simulation are not overrated by using too small analysis areas. On the other hand, the analysis areas could also be too large so that clear orientation effects, for example, at cavity walls, are averaged out. Moreover, the underlying assumptions and boundary conditions in the DFS are a very simplified approach to simulate ROS materials and deviations from the real mesostructures in the ribbed structures are expectable. However, the calculated comparable low MAEs indicate overall reasonable agreement between measurement and simulation, especially when the initially random in-plane strand orientation and the comparably short flow paths (mold coverage of ~80%) are considered, which does not inherently lead to very pronounced flow-induced orientations. For this reason, it is concluded that 3D TIMON CompositePRESS delivers sufficiently accurate fill and orientation predictions that are valuable for ROS-based SMC part design processes and to avoid trial and error molding trials to find suitable processing conditions and a working charge pattern. The similarity between CT and DFS results was also visually shown in an orientation depiction method with 2D ellipses, allowing for an easy visual comparison. This method would be also suited to quickly compare simulation results using other settings, charge patterns or coming from different software.

5. Conclusions

For this study, complex ribbed structures were compression molded with a high-performance ROS-based CF-SMC. This relatively new material class with its advanced mechanical properties is a promising candidate for large lightweight structural parts for sports cars. However, due to the characteristic material configuration with its randomly oriented strands, a flow-induced mesostructure is evolving when the compound is compression molded into complex structures. As this mesostructure can be characterized by strong fiber alignments when the material is forced to flow, it directly impacts the parts response to applied mechanical loads. Therefore, the local mesostructure with its anisotropic mechanical properties must be considered in the part development process in order to avoid structural shortcomings due to adverse fiber orientations or knit lines and also plays a paramount role in the part performance calculation. For this reason, highly accurate simulations tools that can predict these unwanted effects are needed in the automotive field and must be developed and tested.
This paper aimed to evaluate a novel DFS tool with the feature to model ROS-based materials. In order to check its simulation accuracy by comparison with fiber orientation measurements full-part CT scans of the compression molded CF-SMC parts of unprecedented size are conducted. Full-part CT scans delivered a holistic depiction of the inner mesostructure with low standard deviations between the measured orientations of the scans and enabled comparisons with simulation results at any point of the part. Scan size and quality as well as the conducted detailed analyses of the presented CT scans surpass previously published studies dealing with this material class and show the current state of the art. Besides the quality assurance aspect, these full-part CT scans are the only expedient nondestructive microstructural characterization method to evaluate the accuracy of predicted fiber orientations. Although this method is admittedly limited in size as scan time and costs would be unreasonable for noticeably bigger parts, in future work, CT scans of larger components at maintaining quality are imaginable when CT hardware further improves and with increasing knowledge about the needed resolution for the specific part of interest. Notwithstanding, this study effectively demonstrates what kind of information for entire part volumes is already available.
Trial and error molding sessions of big CF-SMC parts quickly lead to high expenses for material, molds and manpower, hence trustworthy simulation tools are crucial for the application of the new material class. The DFS tool 3D TIMON CompositePRESS is extensively tested on a complex 3D-shaped part with ribs in different thicknesses and heights. Its main limitations are the non-considered anisotropic viscosity, the simple one-way coupling, and the lacking interactions between the fibers or strands, respectively. However, the fill simulation results were remarkably precise so that the software was used to optimize the charge configuration used in this molding trial. This capability can be used in future part design processes to accelerate the development process and to prevent disadvantageous part filling leading to orientation-related weak spots.
In order to validate the accuracy of the novel process simulation approach the orientation results attained with 3D TIMON CompositePRESS were compared with the mean orientations of three averaged CT scans in certain analysis areas. For this purpose, exactly the same analysis mesh is used in the simulation and the CT scan analyses allowing a one-to-one comparison. The determined deviations (average errors) between the predicted orientations and the CT measurements were calculated for 21 analysis areas in the ribbed structure and showed a reasonable low MAE. This result indicates that the examined DFS method is capable to accurately assess orientation trends in complex parts using ROS-based materials. Furthermore, the presented DFS approach can be applied to optimize part geometries, charge patterns, processing conditions and to choose suitable material prior to the mold manufacturing or the compression molding of SMC parts avoiding several design loops and costly experiments.
The obtained high-quality microstructure information, either from CT measurements or process simulations, will be used as input data for building a digital twin incorporated into structural simulations in further studies. In such integrative simulations, where the part performance predictions are based on its process-induced microstructure, this 3D information is highly valuable. The key benefit of this integrative simulation approach is that the automotive engineer can predict the mechanical performance of CF-SMC parts even before they physically exist. Due to the fact that, for example, different variations of charge patterns can be quickly virtually analyzed, the new DFS tool can make its own contribution to the development of reliable structural parts made of high-performance ROS-based materials for automotive lightweight applications.

Author Contributions

Conceptualization, J.T.; methodology, J.T.; software, J.T., S.K.H.; validation, J.T.; formal analysis, J.T.; investigation, J.T. and S.K.H.; resources, J.T.; data curation, J.T. and S.K.H.; writing—original draft preparation, J.T.; writing—review and editing, J.T., T.A.O.; visualization, J.T.; supervision, T.A.O.; project administration, J.T. All authors have read and agreed to the published version of the manuscript.

Funding

This research received no external funding.

Acknowledgments

The authors wish to thank Katsuya Sakaba and Ryugo Tanaka (Toray Engineering D Solutions Co., Ltd., Ōtsu, Shiga, Japan) for the technical provision of 3D TIMON 6.0, their professional support with the software, and many helpful hints. A special thanks also goes to Florian Bittner (Leibniz University, Institute of Plastics and Circular Economy IKK, Hanover, Germany) and Christina Haxter (Fraunhofer Institute for Wood Research, Wilhelm-Klauditz-Institute WKI, Hanover, Germany) for the excellent CT scans. Finally, the Volkswagen AG Group Innovation would like to thank the University of Wisconsin-Madison for their ongoing support in joint research projects.

Conflicts of Interest

The authors declare no conflict of interest.

Appendix A

In order to simulate the pressing/compression molding process, the flow analysis in 3D TIMON is based on the standard equations of traditional fluid dynamics: the equation of continuity, the equation of motion, and the equation of energy. These governing equations for the filling phase are given in the general and special form of the balance equations as follows:
The mass continuity equation (mass balance):
ρ t + x ρ u x + y ρ u y + z ρ u z = 0 ,
where ρ is the density, t is time and u i stands for the fluid velocity vector in direction x , y , and z , respectively. For incompressible flow ρ is constant and Equation (A1) can be reduced to a volume continuity equation:
u x x + u y y + u z z = 0 .
The equation of motion (momentum balance) in fluid flow in all three directions can be expressed in terms of deviatoric stress τ i j and this form of the equation is commonly called the Cauchy momentum equation:
ρ D u i D t = p x i + τ j i x j + ρ g i ,
which in the x-direction becomes:
ρ u x t + u x u x x + u y u x y + u z u x z = p x + τ xx x + τ yx y + τ zx z + ρ g x ,
where p : pressure, g i : body force acting on the continuum, for example, gravity. In this force balance the mass is represented by the fluid density ρ and the following bracket represents the acceleration, meaning how the velocity of a particle changes with time. Therein, u x t stands for the change of velocity over time and the three following terms represent the speed and direction in which the fluid is moving. The right hand side of the equation shows all forces acting in the fluid, where p x stands for the internal pressure gradient of the fluid, the second term is representing the internal stress forces acting on the fluid (viscous effects are considered), and the last term represents all external forces acting on the fluid, such as gravity.
In fluid mechanics the deviatoric stress tensor τ i j is commonly defined as:
τ i j = μ γ ˙ i j ,
with μ : viscosity and γ ˙ i j : rate of deformation tensor reducing the Cauchy momentum equation to the Navier–Stokes equation for a simple Newtonian fluid with constant density ρ and viscosity μ :
ρ D u i D t = p x i + μ 2 u i x j x j + ρ g i ,
which in the x-direction looks like:
ρ u x t + u x u x x + u y u x y + u z u x z = p x + μ 2 u x x 2 + 2 u x y 2 + 2 u x z 2 + ρ g x .
The equation of energy (energy balance) for a Newtonian fluid with constant properties is given by:
ρ c p D T D t = k 2 T x 2 + 2 T y 2 + 2 T z 2 + Q ˙ viscous   heating + Q ˙ ,
where ρ : density, c p : specific heat, T : temperature, t : time, k : thermal conductivity, Q ˙ viscous   heating : viscous dissipation and Q ˙ : arbitrary heat source (i.e., exothermic reaction).
The viscous heating for a Newtonian material is written as:
Q ˙ viscous   heating = μ γ ˙ i j 2 = μ u i x j + u j x i 2 .
Inserting the viscous heating term into Equation (A8) gives the energy equation in Cartesian coordinates:
ρ c p T t + u x T x + u y T y + u z T z = k 2 T x 2 + 2 T y 2 + 2 T z 2 + 2 μ u x x 2 + u y y 2 + u z z 2 + μ u x y + u y x 2 + u x z + u z x 2 + u y z + u z y 2 + Q ˙ .
With the convention to denominate the viscosity of Newtonian fluids with μ and the viscosity of non-Newtonian fluids as η Equation (A9) can be rewritten as:
Q ˙ viscous   heating = η γ ˙ 2 .
In the compression molding process the polymer melt can be considered as a viscous fluid. When the material is pressed through the cavity to fill the mold, the melt is assumed to behave as a generalized Newtonian fluid (GNF). Therefore, the non-isothermal 3D flow can be described by the following simplified variant of the energy equation:
ρ c p T t + u x T x + u y T y + u z T z = k 2 T x 2 + 2 T y 2 + 2 T z 2 + η γ ˙ 2 .
During the exothermic curing reaction of thermosets, heat generates. This effect is considered with an additional energy source terms on the right hand side in Equation (A13), where the energy balance for thermosets in a mold is shown.
ρ c p T t + u x T x + u y T y + u z T z = k 2 T x 2 + 2 T y 2 + 2 T z 2 + η γ ˙ 2 + d Q d t .
Therein, the left terms stands for the temperature change and the convective heat transfer (more precisely thermal advection), whereas the terms on the right hand side of the equation represent the thermal conduction, shear heat generation (viscous heating), and the heat generation due to an exothermic reaction. Equation (A14) shows the relation between the heat generation velocity d Q d t and the total amount of generated heat Q 0 in the exothermic curing reaction affected by the curing reaction rate d α d t :
d Q d t = Q 0 d α d t .
With the viscosity standardly defined as:
μ = τ γ ˙   or   η = τ γ ˙ ,
and substituting μ in Equation (A9) the viscous dissipation can also be written as:
Q ˙ viscous   heating = τ i j γ ˙ i j .
For generalized Newtonian fluids (incompressible viscous fluids), the deviatoric stress τ can be expressed by:
τ i j = η γ ˙ i j = η u + u T ,
where η is the non-Newtonian viscosity that depends both on temperature T and the rate of deformation tensor γ ˙ i j , u is the velocity gradient tensor and u T is the transposed velocity gradient tensor.
Since η is a scalar it must depend only on scalar invariants of γ ˙ . Therefore, another notation for the symmetric rate of deformation tensor γ ˙ i j in the Generalized Newtonian Fluid (GNF) model in Equation (A17) is the scalar strain rate γ ˙ :
γ ˙ = γ ˙ i j = 1 2 γ ˙ i j : γ ˙ j i = 1 2 II = 1 2 i j γ ˙ i j γ ˙ j i   with   i ,   j = x ,   y ,   z ,
where γ ˙ is the magnitude of the rate of deformation tensor γ ˙ i j and II is the second invariant of the rate of deformation tensor.
The rate of deformation tensor components in Equation (A18) are defined by:
γ ˙ i j = u i x j + u j x i ,
which yields:
γ ˙ = 2 u x x 2 + 2 u y y 2 + 2 u z z 2 + u x y + u y x 2 + u y z + u z y 2 + u z x + u x z 2 ,
respecting the flow field in thickness direction.
The stress tensor components for GNFs in Cartesian coordinates are consequently given by:
τ xx = 2 η u x x τ xy = τ yx = η u x y + u y x τ yy = 2 η u y y τ yz = τ zy = η u y z + u z y τ zz = 2 η u z z τ zx = τ xz = η u z x + u x z
τ i j = τ xx τ xy τ xz τ yx τ yy τ yz τ zx τ zy τ zz = η 2 u x x u x y + u y x u z x + u x z u x y + u y x 2 u y y u y z + u z y u z x + u x z u y z + u z y 2 u z z .
With Equation (A16) the stress tensor components are implemented into Equation (A10), which results in the energy equation for thermoset materials, written as:
ρ c p T t + u x T x + u y T y + u z T z = k 2 T x 2 + 2 T y 2 + 2 T z 2 + τ xx u x x + τ yy u y y + τ zz u z z + τ xy u x y + u y x + τ yz u y z + u z y + τ zx u z x + u x z + Q ˙ ,
where Q ˙ denotes the heat generation due to the exothermic reaction in the thermoset curing process. In order to calculate the temperature distribution in the thermoset molding compound, 3D TIMON, however, assumes the heat conduction in thickness direction is dominant and therefore simplifies Equation (A23) to:
ρ c p T t + u x T x + u y T y + u z T z = k 2 T z 2 + τ yz u y z + τ zx u x z + Q 0 d α d t ,
where Q ˙ is substituted with Equation (A14).
Using the simplification τ yz = η u y z and τ zx = η u x z (assumption of simple shear flow) yields to the final energy equation applied in 3D TIMON’s Light 3D Heat Transfer:
ρ c p T t + u x T x + u y T y + u z T z = k 2 T z 2 + η u y z 2 + η u x z 2 + Q 0 d α d t .

References

  1. Osswald, T.A.; Hernández-Ortiz, J.P. Polymer Processing-Modeling and Simulation; Carl Hanser Verlag: Munich, Germany, 2006; ISBN 978-3-446-41286-6. [Google Scholar]
  2. Nakano, R.; Sakaba, K. Development of CAE software for injection and BMC/SMC molding including short/long fibers reinforcement. In Proceedings of the SAMPE Technical Conference, Seattle, WA, USA, 2–5 June 2014. [Google Scholar]
  3. Song, Y.; Gandhi, U.N.; Sekito, T.; Vaidya, U.K.; Hsu, J.; Yang, A.; Osswald, T.A. A novel CAE method for compression molding simulation of carbon fiber-reinforced thermoplastic composite sheet materials. J. Compos. Sci. 2018, 2, 33. [Google Scholar] [CrossRef] [Green Version]
  4. Denos, B.R.; Kravchenko, S.G.; Sommer, D.E.; Favaloro, A.J.; Pipes, R.B.; Avery, W.B. Prepreg platelet molded composites process and performance analysis. In Proceedings of the 33rd Technical Conference of the American Society for Composites 2018, Seattle, WA, USA, 24–26 September 2018. [Google Scholar]
  5. Schemmann, M.; Görthofer, J.; Seelig, T.; Hrymak, A.; Böhlke, T. Anisotropic meanfield modeling of debonding and matrix damage in SMC composites. Compos. Sci. Technol. 2018, 161, 143–158. [Google Scholar] [CrossRef]
  6. Kuhn, C.; Walter, I.; Taeger, O.; Osswald, T.A. Experimental and numerical analysis of fiber matrix separation during compression molding of long fiber reinforced thermoplastics. J. Compos. Sci. 2017, 1, 2. [Google Scholar] [CrossRef] [Green Version]
  7. Automobili Lamborghini, S.p.A. Technical Data Sheet–Forged Composites. Available online: https://www.lamborghini.com/sites/it-en/files/DAM/lamborghini/forged/Forgedpresentation_EN.pdf (accessed on 17 April 2020).
  8. Görthofer, J.; Meyer, N.; Pallicity, T.D.; Schöttl, L.; Trauth, A.; Schemmann, M.; Hohberg, M.; Pinter, P.; Elsner, P.; Henning, F.; et al. Virtual process chain of sheet molding compound: Development, validation and perspectives. Compos. Part B Eng. 2019, 169, 133–147. [Google Scholar] [CrossRef]
  9. NORDAM Group Inc. Boeing 787 features composite window frames. Reinf. Plast. 2007, 51, 4. [Google Scholar] [CrossRef]
  10. Feraboli, P.; Gasco, F.; Wade, B.; Maier, S.; Kwan, R.; Masini, A.; De Oto, L.; Reggiani, M. Lamborgini “forged composite” technology for the suspension arms of the sesto elemento. In Proceedings of the 26th Annual Technical Conference of the American Society for Composites 2011: The 2nd Joint US-Canada Conference on Composites, 6–28 September; Curran Associates, Inc.: Red Hook, New York, USA; Montreal, QC, Canada, 2011; Volume 2, pp. 1203–1215. [Google Scholar]
  11. Gardiner, G. Is the BMW 7 Series the Future of Autocomposites? Available online: https://www.compositesworld.com/articles/is-the-bmw-7-series-the-future-of-autocomposites (accessed on 17 April 2020).
  12. Bruderick, M.; Denton, D.; Shinedling, M. Applications of carbon fiber SMC for the 2003 Dodge Viper. In Proceedings of the Society of Plastics Engineers (SPE) Automotive Composites Conference & Exhibition (ACCE), Troy, MI, USA, 12–13 September 2002. [Google Scholar]
  13. Tuttle, M.E.; Shifman, T.J.; Boursier, B. Simplifying certification of discontinuous composite material forms for primary aircraft structures. In Proceedings of the International SAMPE Symposium and Exhibition, Seattle, WA, USA, 17–20 May 2010. [Google Scholar]
  14. Hexcel Corporation. HexMC® User Guide. Available online: https://www.hexcel.com/user_area/content_media/raw/HexMC_UserGuide.pdf (accessed on 27 August 2020).
  15. Hexcel Corporation. HexMC®-i Moulding Compound-Product Data Sheet. Available online: https://www.hexcel.com/user_area/content_media/raw/HexMCi_C_2000_M77_RA_DataSheet.pdf (accessed on 27 August 2020).
  16. Sommer, D.E. Anisotropic Flow and Fiber Orientation Analysis of Preimpregnated Platelet Molding Compounds; Purdue University: West Lafayette, IN, USA, 2018. [Google Scholar]
  17. Sommer, D.E.; Kravchenko, S.G.; Denos, B.R.; Favaloro, A.J.; Pipes, R.B. Integrative analysis for prediction of process-induced, orientation-dependent tensile properties in a stochastic prepreg platelet molded composite. Compos. Part A Appl. Sci. Manuf. 2020, 130, 105759. [Google Scholar] [CrossRef]
  18. Cutting, R.A.; Rios-Tascon, F.; Goodsell, J.E. Experimental investigation of the crush performance of prepreg platelet molding compound tubes. J. Compos. Mater. 2020. [Google Scholar] [CrossRef]
  19. Favaloro, A.J.; Sommer, D.E. On the use of orientation tensors to represent prepreg platelet orientation state and variability. J. Rheol. 2020, 64, 517–527. [Google Scholar] [CrossRef]
  20. Denos, B.R.; Sommer, D.E.; Favaloro, A.J.; Pipes, R.B.; Avery, W.B. Fiber orientation measurement from mesoscale CT scans of prepreg platelet molded composites. Compos. Part A Appl. Sci. Manuf. 2018, 114, 241–249. [Google Scholar] [CrossRef]
  21. Favaloro, A.J.; Sommer, D.E.; Denos, B.R.; Pipes, R.B. Simulation of prepreg platelet compression molding: Method and orientation validation. J. Rheol. 2018, 62, 1443–1455. [Google Scholar] [CrossRef]
  22. Favaloro, A.J.; Sommer, D.E.; Pipes, R.B. Manufacturing simulation of composites compression molding in Abaqus/Explicit. In Proceedings of the Science in the Age of Experience (SIMULIA Global User Meeting), Boston, MA, USA, 18–21 June 2018. [Google Scholar]
  23. Kravchenko, S.G.; Denos, B.R.; Sommer, D.E.; Favaloro, A.J.; Avery, W.B.; Pipes, R.B. Analysis of open hole tensile strength in a prepreg platelet molded composite with stochastic morphology. In Proceedings of the 33rd Technical Conference of the American Society for Composites 2018, Seattle, WA, USA, 24–27 September 2018; Volume 3, pp. 1881–1896. [Google Scholar]
  24. Kravchenko, S.G.; Pipes, R.B. Progressive failure analysis in discontinuous composite system of prepreg platelets with stochastic meso-morphology. In Proceedings of the Science in the Age of Experience (SIMULIA Global User Meeting), Boston, MA, USA, 18–21 June 2018. [Google Scholar]
  25. Sommer, D.E.; Favaloro, A.J.; Kravchenko, S.G.; Denos, B.R.; Byron Pipes, R. Stochastic process modeling of a prepreg platelet molded composite bracket. Tech. Conf. Am. Soc. Compos. 2018, 4, 2159–2169. [Google Scholar] [CrossRef]
  26. Kravchenko, S.G.; Sommer, D.E.; Denos, B.R.; Favaloro, A.J.; Tow, C.M.; Avery, W.B.; Pipes, R.B. Tensile properties of a stochastic prepreg platelet molded composite. Compos. Part A Appl. Sci. Manuf. 2019, 124. [Google Scholar] [CrossRef]
  27. Kravchenko, S.G.; Sommer, D.E.; Denos, B.R.; Avery, W.B.; Pipes, R.B. Structure-property relationship for a prepreg platelet molded composite with engineered meso-morphology. Compos. Struct. 2019, 210, 430–445. [Google Scholar] [CrossRef]
  28. Li, Y.; Pimenta, S.; Singgih, J.; Nothdurfter, S.; Schuffenhauer, K. Experimental investigation of randomly-oriented tow-based discontinuous composites and their equivalent laminates. Compos. Part A Appl. Sci. Manuf. 2017, 102, 64–75. [Google Scholar] [CrossRef]
  29. Li, Y. The Effect of Variability in the Microstructure of Tow-Based Discontinuous Composites on Their Structural Behaviour; Imperial College London: London, UK, 2018. [Google Scholar]
  30. Li, Y.; Pimenta, S. Development and assessment of modelling strategies to predict failure in tow-based discontinuous composites. Compos. Struct. 2019, 209, 1005–1021. [Google Scholar] [CrossRef]
  31. Martulli, L.M.; Muyshondt, L.; Kerschbaum, M.; Pimenta, S.; Lomov, S.V.; Swolfs, Y. Carbon fibre sheet moulding compounds with high in-mould flow: Linking morphology to tensile and compressive properties. Compos. Part A Appl. Sci. Manuf. 2019, 126, 105600. [Google Scholar] [CrossRef]
  32. Martulli, L.M.; Creemers, T.; Schöberl, E.; Hale, N.; Kerschbaum, M.; Lomov, S.V.; Swolfs, Y. A thick-walled sheet moulding compound automotive component: Manufacturing and performance. Compos. Part A Appl. Sci. Manuf. 2020, 128, 105688. [Google Scholar] [CrossRef]
  33. Alves, M.; Carlstedt, D.; Ohlsson, F.; Asp, L.E.; Pimenta, S. Ultra-strong and stiff randomly-oriented discontinuous composites: Closing the gap to quasi-isotropic continuous-fibre laminates. Compos. Part A Appl. Sci. Manuf. 2020, 132, 105826. [Google Scholar] [CrossRef]
  34. De Oto, L. Carbon fibre innovation for high volumes: The forged composite. In Proceedings of the IICS JEC, Paris, France, 29–31 March 2011. [Google Scholar]
  35. Feraboli, P.; Cleveland, T.; Ciccu, M.; Stickler, P.; De Oto, L. Defect and damage analysis of advanced discontinuous carbon/epoxy composite materials. Compos. Part A Appl. Sci. Manuf. 2010, 41, 888–901. [Google Scholar] [CrossRef]
  36. Landry, B.; Hubert, P. Experimental study of defect formation during processing of randomly-oriented strand carbon/PEEK composites. Compos. Part A 2015, 77, 301–309. [Google Scholar] [CrossRef]
  37. Selezneva, M.; Lessard, L. Characterization of mechanical properties of randomly oriented strand thermoplastic composites. J. Compos. Mater. 2016, 50, 2833–2851. [Google Scholar] [CrossRef]
  38. Stelzer, P.S.; Plank, B.; Major, Z. Mesostructural simulation of discontinuous prepreg platelet based carbon fibre sheet moulding compounds informed by X-ray computed tomography. Nondestruct. Test. Eval. 2020, 35, 342–358. [Google Scholar] [CrossRef]
  39. Sommer, D.E.; Kravchenko, S.G.; Pipes, R.B. A numerical study of the meso-structure variability in the compaction process of prepreg platelet molded composites. Compos. Part A Appl. Sci. Manuf. 2020, 138, 106010. [Google Scholar] [CrossRef]
  40. Martulli, L.M.; Kerschbaum, M.; Lomov, S.V.; Swolfs, Y. Weld lines in tow-based sheet moulding compounds tensile properties: Morphological detrimental factors. Compos. Part A Appl. Sci. Manuf. 2020, 139, 106109. [Google Scholar] [CrossRef]
  41. Pipes, R.B.; McCullough, R.L.; Taggart, D.G. Behavior of discontinuous fiber composites: Fiber orientation. Polym. Compos. 1982, 3, 34–39. [Google Scholar] [CrossRef]
  42. Denos, B.R.; Pipes, R.B. Local mean fiber orientation via computer assisted tomography analysis for long discontinuous fiber composites. In Proceedings of the American Society for Composites (ASC) 2016 – 31st Technical Conference on Composite Materials, Williamsburg, VA, USA, 19–22 September 2016. [Google Scholar]
  43. Denos, B.R. Fiber Orientation Measurement in Platelet-Based Composites via Computed Tomography Analysis; Purdue University: West Lafayette, IN, USA, 2017. [Google Scholar]
  44. Kuhn, C.; Ton, Y.; Taeger, O.; Osswald, T.A. Experimental study on fiber matrix separation during compression molding of fiber reinforced rib structures. In Proceedings of the Society of Plastics Engineers (SPE) Annual Technical Conference (ANTEC), Orlando, FL, USA, 7–10 May 2018. [Google Scholar]
  45. Kuhn, C.; Körner, E.; Täger, O. A simulative overview on fiber predictions models for discontinuous long fiber composites. Polym. Compos. 2020, 41, 73–81. [Google Scholar] [CrossRef]
  46. Kuhn, C.; Walter, I.; Täger, O.; Osswald, T.A. Simulative prediction of fiber-matrix separation in rib filling during compression molding using a direct fiber simulation. J. Compos. Sci. 2018, 2, 2. [Google Scholar] [CrossRef] [Green Version]
  47. Jeffery, G.B. The motion of ellipsoidal particles immersed in a viscous fluid. Proc. R. Soc. London A Math. Phys. Eng. Sci. 1922, 102, 161–179. [Google Scholar] [CrossRef] [Green Version]
  48. Folgar, F.; Tucker, C.L., III. Orientation behavior of fibers in concentrated suspensions. J. Reinf. Plast. Compos. 1984, 3, 98–119. [Google Scholar] [CrossRef]
  49. Advani, S.G.; Tucker, C.L., III. The use of tensors to describe and predict fiber orientation in short fiber composites. J. Rheol. 1987, 31, 751–784. [Google Scholar] [CrossRef]
  50. Phelps, J.H.; Tucker, C.L., III. An anisotropic rotary diffusion model for fiber orientation in short- and long-fiber thermoplastics. J. Nonnewton. Fluid Mech. 2009, 156, 165–176. [Google Scholar] [CrossRef]
  51. Bay, R.S. Fiber Orientation in Injection-Molded Composites: A Comparison of Theory and Experiment; University of Illinois at Urbana-Champaign: Urbana, IL, USA, 1991. [Google Scholar]
  52. Advani, S.G.; Tucker, C.L., III. Closure approximations for three-dimensional structure tensors. J. Rheol. 1990, 34, 367–386. [Google Scholar] [CrossRef]
  53. Cintra, J.S., Jr.; Tucker, C.L., III. Orthotropic closure approximations for flow-induced fiber orientation. J. Rheol. 1995, 39, 1095–1122. [Google Scholar] [CrossRef]
  54. Chung, D.H.; Kwon, T.H. Improved model of orthotropic closure approximation for flow induced fiber orientation. Polym. Compos. 2001, 22, 636–649. [Google Scholar] [CrossRef]
  55. Chung, D.H.; Kwon, T.H. Invariant-based optimal fitting closure approximation for the numerical prediction of flow-induced fiber orientation. J. Rheol. 2002, 46, 169–194. [Google Scholar] [CrossRef] [Green Version]
  56. Montgomery-Smith, S.; Jack, D.A.; Smith, D.E. The fast exact closure for Jeffery’s equation with diffusion. J. Nonnewton. Fluid Mech. 2011, 166, 343–353. [Google Scholar] [CrossRef]
  57. Montgomery-Smith, S.; He, W.; Jack, D.A.; Smith, D.E. Exact tensor closures for the three-dimensional Jeffery’s equation. J. Fluid Mech. 2011, 680, 321–335. [Google Scholar] [CrossRef] [Green Version]
  58. Wang, J.; Jin, X. Comparison of recent fiber orientation models in Autodesk Moldflow Insight simulations with measured fiber orientation data. In Proceedings of the Polymer Processing Society 26th Annual Meeting, Banff, AB, Canada, 4–8 July 2010. [Google Scholar]
  59. Tseng, H.-C.; Chang, R.-Y.; Hsu, C.-H. An objective tensor to predict anisotropic fiber orientation in concentrated suspensions. J. Rheol. 2016, 60, 215–224. [Google Scholar] [CrossRef]
  60. Tseng, H.-C.; Chang, R.-Y.; Hsu, C.-H. The use of principal spatial tensor to predict anisotropic fiber orientation in concentrated fiber suspensions. J. Rheol. 2018, 62, 313–320. [Google Scholar] [CrossRef]
  61. Bakharev, A.; Yu, R.; Ray, S.; Speight, R.; Wang, J. Using new anisotropic rotational diffuion model to improve prediction of short fibers in thermoplastic injection molding. In Proceedings of the Society of Plastics Engineers (SPE) Annual Technical Conference (ANTEC), Orlando, FL, USA, 7–10 May 2018. [Google Scholar]
  62. Huynh, H.M. Improved Fiber Orientation Predictions for Injection-Molded Composites; University of Illinois: Urbana-Champaign, IL, USA, 2001. [Google Scholar]
  63. Wang, J.; O’Gara, J.F.; Tucker, C.L., III. An objective model for slow orientation kinetics in concentrated fiber suspensions: Theory and rheological evidence. J. Rheol. 2008, 52, 1179–1200. [Google Scholar] [CrossRef]
  64. Tseng, H.-C.; Chang, R.-Y.; Hsu, C.-H. Phenomenological improvements to predictive models of fiber orientation in concentrated suspensions. J. Rheol. 2013, 57, 1597–1631. [Google Scholar] [CrossRef]
  65. Latz, A.; Strautins, U.; Niedziela, D. Comparative numerical study of two concentrated fiber suspension models. J. Nonnewton. Fluid Mech. 2010, 165, 764–781. [Google Scholar] [CrossRef]
  66. Favaloro, A.J.; Sommer, D.E.; Pipes, R.B. Anisotropic viscous flow simulation in Abaqus. In Proceedings of the Science in the Age of Experience, Chicago, IL, USA, 15–18 May 2017; pp. 115–125. [Google Scholar]
  67. Sommer, D.E.; Favaloro, A.J.; Pipes, R.B. Coupling anisotropic viscosity and fiber orientation in applications to squeeze flow. J. Rheol. 2018, 62, 669–679. [Google Scholar] [CrossRef]
  68. Favaloro, A.J.; Tseng, H.-C.; Pipes, R.B. A new anisotropic viscous constitutive model for composites molding simulation. Compos. Part A Appl. Sci. Manuf. 2018, 115, 112–122. [Google Scholar] [CrossRef]
  69. Tseng, H.; Favaloro, A.J. The use of informed isotropic constitutive equation to simulate anisotropic rheological behaviors in fiber suspensions. J. Rheol. 2019, 63, 263–274. [Google Scholar] [CrossRef]
  70. Li, T.; Luyé, J.-F. Flow-fiber coupled viscosity in injection molding simulations of short fiber reinforced thermoplastics. Int. Polym. Process. 2019, 34, 158–171. [Google Scholar] [CrossRef] [Green Version]
  71. Wittemann, F.; Maertens, R.; Kärger, L.; Henning, F. Injection molding simulation of short fiber reinforced thermosets with anisotropic and non-Newtonian flow behavior. Compos. Part A Appl. Sci. Manuf. 2019, 124. [Google Scholar] [CrossRef]
  72. Kugler, S.K.; Lambert, G.M.; Cruz, C.; Kech, A.; Osswald, T.A.; Baird, D.G. Efficient parameter identification for macroscopic fiber orientation models with experimental data and a mechanistic fiber simulation. AIP Conf. Proc. 2020, 2205, 1–6. [Google Scholar] [CrossRef]
  73. Meyer, N.; Schöttl, L.; Bretz, L.; Hrymak, A.N.; Kärger, L. Direct bundle simulation approach for the compression molding process of sheet molding compound. Compos. Part A Appl. Sci. Manuf. 2020, 132, 1–12. [Google Scholar] [CrossRef]
  74. Kobayashi, M.; Dan, K.; Baba, T.; Urakami, D. Compression molding 3D-CAE of discontinuous long fiber reinforced polyamide 6: Influence on cavity filling and direct fiber simulations of viscosity fitting methods. In Proceedings of the ICCM International Conferences on Composite Materials, Copenhagen, Denmark, 19–24 July 2015. [Google Scholar]
  75. Favaloro, A.J. Rheological Behavior and Manufacturing Simulation of Prepreg Platelet Molding Systems; Purdue University: West Lafayette, IN, USA, 2017. [Google Scholar]
  76. Favaloro, A.J.; Sommer, D.E.; Pipes, R.B. Process simulation of compression molding of prepreg platelet molding systems. In Proceedings of the 14th International Conference on Flow Processing in Composite Materials, Luleå, Sweden, 30 May–1 June 2018. [Google Scholar]
  77. Yamamoto, S.; Matsuoka, T. Dynamic simulation of fiber suspensions in shear flow. J. Chem. Phys. 1995, 102. [Google Scholar] [CrossRef]
  78. Yamamoto, S.; Matsuoka, T. A method for dynamic simulation of rigid and flexible fibers in a flow field. J. Chem. Phys. 1993, 98, 644–650. [Google Scholar] [CrossRef]
  79. Switzer, L.H.; Klingenberg, D.J. Rheology of sheared flexible fiber suspensions via fiber-level simulations. J. Rheol. 2003, 47, 759–778. [Google Scholar] [CrossRef] [Green Version]
  80. Joung, C.G.; Phan-Thien, N.; Fan, X.J. Direct simulation of flexible fibers. J. Nonnewton. Fluid Mech. 2001, 99, 1–36. [Google Scholar] [CrossRef]
  81. Qi, D. Direct simulations of flexible cylindrical fiber suspensions in finite Reynolds number flows. J. Chem. Phys. 2006, 125, 1–10. [Google Scholar] [CrossRef] [PubMed]
  82. Lindström, S.B.; Uesaka, T. Simulation of the motion of flexible fibers in viscous fluid flow. Phys. Fluids 2007, 19. [Google Scholar] [CrossRef]
  83. Wu, J.; Aidun, C.K. A method for direct simulation of flexible fiber suspensions using lattice Boltzmann equation with external boundary force. Int. J. Multiph. Flow 2010, 36, 202–209. [Google Scholar] [CrossRef]
  84. Yamamoto, S.; Matsuoka, T. Dynamic simulation of flow-induced fiber fracture. Polym. Eng. Sci. 1995, 35, 1022–1030. [Google Scholar] [CrossRef]
  85. Hinch, E. The distortion of a flexible inextensible thread in a shearing flow. J. Fluid Mech. 1976, 74, 317–333. [Google Scholar] [CrossRef] [Green Version]
  86. Skjetne, P.; Ross, R.F.; Klingenberg, D.J. Simulation of single fiber dynamics. J. Chem. Phys. 1997, 107, 2108–2121. [Google Scholar] [CrossRef]
  87. Phan-Thien, N.; Fan, X.; Tanner, R.I.; Zheng, R. Folgar–Tucker constant for a fibre suspension in a Newtonian fluid. J. Nonnewton. Fluid Mech. 2002, 103, 251–260. [Google Scholar] [CrossRef]
  88. Ross, R.F.; Klingenberg, D.J. Dynamic simulation of flexible fibers composed of linked rigid bodies. J. Chem. Phys. 1997, 106, 2949–2960. [Google Scholar] [CrossRef] [Green Version]
  89. Meirson, G.; Hrymak, A.N. Two-dimensional long-flexible fiber simulation in simple shear flow. Polym. Compos. 2016, 37, 2425–2433. [Google Scholar] [CrossRef]
  90. Yamane, Y.; Kaneda, Y.; Dio, M. Numerical simulation of semi-dilute suspensions of rodlike particles in shear flow. J. Nonnewton. Fluid Mech. 1994, 54, 405–421. [Google Scholar] [CrossRef]
  91. Sundararajakumar, R.R.; Koch, D.L. Structure and properties of sheared fiber suspensions with mechanical contacts. J. Nonnewton. Fluid Mech. 1997, 73, 205–239. [Google Scholar] [CrossRef]
  92. Fan, X.; Phan-Thien, N.; Zheng, R. A direct simulation of fibre suspensions. J. Nonnewton. Fluid Mech. 1998, 74, 113–135. [Google Scholar] [CrossRef]
  93. Ausias, G.; Fan, X.; Tanner, R.I. Direct simulation for concentrated fibre suspensions in transient and steady state shear flows. J. Nonnewton. Fluid Mech. 2006, 135, 46–57. [Google Scholar] [CrossRef]
  94. López, L.; Ramírez, D.; Osswald, T.A. Fiber attrition and orientation productions of a fiber filled polymer through a gate - A mechanistic approach. In Proceedings of the Society of Plastics Engineers (SPE) Annual Technical Conference (ANTEC), Cincinnati, OH, USA, 22–24 April 2013. [Google Scholar]
  95. Pérez, C. The Use of a Direct Particle Simulation to Predict Fiber Motion in Polymer Processing; University of Wisconsin-Madison: Madison, WI, USA, 2016. [Google Scholar]
  96. Ramírez, D. Study of Fiber Motion in Molding Processes by Means of a Mechanistic Model; University of Wisconsin-Madison: Madison, WI, USA, 2014. [Google Scholar]
  97. Walter, I.; Goris, S.; Teuwsen, J.; Tapia, A.; Pérez, C.; Osswald, T.A. A direct particle level simulation coupled with the folgar-tucker RSC model to predict fiber orientation in injection molding of long glass fiber reinforced thermoplastics. In Proceedings of the Society of Plastics Engineers (SPE) Annual Technical Conference (ANTEC), Anaheim, CA, USA, 8–10 May 2017; pp. 573–579. [Google Scholar]
  98. Pérez, C.; Ramírez, D.; Osswald, T.A. Mechanistic model simulation of a compression molding process: Fiber orientation and fiber-matrix separation. In Proceedings of the Society of Plastics Engineers (SPE) Annual Technical Conference (ANTEC), Orlando, FL, USA, 23–25 March 2015. [Google Scholar]
  99. Londoño-Hurtado, A.; Hernandez-Ortiz, J.P.; Osswald, T.A. Mechanism of fiber–matrix separation in ribbed compression molded parts. Polym. Compos. 2007, 28, 451–457. [Google Scholar] [CrossRef]
  100. Londoño-Hurtado, A. Mechanistic Models for Fiber Flow; University of Wisconsin-Madison: Madison, WI, USA, 2009. [Google Scholar]
  101. Hayashi, S.; Chen, H.; Hu, W. Development of new simulation technology for compression molding of long fiber reinforced plastics. In Proceedings of the 15th International LS-DYNA® Users Conference, Detroit, MI, USA, 10–12 June 2018. [Google Scholar]
  102. Hayashi, S. New simulation technology for compression molding of long fiber reinforced plastics: Application to randomly-oriented strand thermoplastic composites. In Proceedings of the ECCM 2018 – 18th European Conference on Composite Materials, Athens, Greece, 24–28 June 2018. [Google Scholar]
  103. Motaghi, A. Direct Sheet Molding Compound Process (D-SMC); University of Western Ontario: London, ON, Canada, 2018. [Google Scholar]
  104. Le, T.-H.; Dumont, P.J.J.; Orgéas, L.; Favier, D.; Salvo, L.; Boller, E. X-ray phase contrast microtomography for the analysis of the fibrous microstructure of SMC composites. Compos. Part A Appl. Sci. Manuf. 2008, 39, 91–103. [Google Scholar] [CrossRef] [Green Version]
  105. Toray Engineering Co., Ltd. 3D TIMON 10 — CompositePRESS; Toray Engineering Co., Ltd.: Ōtsu, Shiga, Japan, 2019. [Google Scholar]
  106. Kim, H.-S.; Chang, S.-H. Simulation of compression moulding process for long-fibre reinforced thermoset composites considering fibre bending. Compos. Struct. 2019, 230, 111514. [Google Scholar] [CrossRef]
  107. Kuhn, C. Analysis and Prediction of Fiber Matrix Separation during Compression Molding of Fiber Reinforced Plastics; Friedrich-Alexander-Universität Erlangen-Nürnberg: Erlangen, Germany, 2018. [Google Scholar]
  108. Dantzig, J.A.; Tucker, C.L., III. Modeling in Materials Processing; Cambridge University Press: New York, NY, USA, 2001; ISBN 9781139175272. [Google Scholar]
  109. Toray Engineering Co., Ltd. 3D TIMON 10 – Reference Manual; Toray Engineering Co., Ltd.: Ōtsu, Shiga, Japan, 2019. [Google Scholar]
  110. Tucker, C.L., III; Folgar, F. A model of compression mold filling. Polym. Eng. Sci. 1983, 23, 69–73. [Google Scholar] [CrossRef]
  111. Lee, C.C.; Folgar, F.; Tucker, C.L., III. Simulation of compression molding for fiber-reinforced thermosetting polymers. J. Manuf. Sci. Eng. Trans. ASME 1984, 106, 114–125. [Google Scholar] [CrossRef]
  112. Osswald, T.A. Numerical Methods for Compression Mold Filling Simulation; University of Illinois at Urbana-Champaign: Urbana-Champaign, IL, USA, 1987. [Google Scholar]
  113. Osswald, T.A.; Menges, G. Materials Science of Polymers for Engineers, 3rd ed.; Carl Hanser Verlag: Munich, Germany, 2012; ISBN 978-1-569-90514-2. [Google Scholar]
  114. Osswald, T.A.; Rudolph, N.M. Polymer Rheology-Fundamentals and Applications; Carl Hanser Verlag: Munich, Germany, 2015; ISBN 9781569905173. [Google Scholar]
  115. Osswald, T.A. Understanding Polymer Processing-Processes and Governing Equations; Carl Hanser Verlag: Munich, Germany, 2017; ISBN 9781569906477. [Google Scholar]
  116. Bay, R.S.; Tucker, C.L., III. Fiber orientation in simple injection moldings. Part I: Theory and numerical methods. Polym. Compos. 1992, 13, 317–331. [Google Scholar] [CrossRef]
  117. Andrade, E.N. da C. The viscosity of liquids. Nature 1930, 125, 309–310. [Google Scholar] [CrossRef]
  118. Castro, J.M.; Macosko, C.W. Kinetics and rheology of typical polyurethane reaction injection molding systems. In Proceedings of the Society of Plastics Engineers (SPE) Annual Technical Conference (ANTEC), New York, NY, USA, 5–8 May 1980; pp. 434–438. [Google Scholar]
  119. Castro, J.M.; Macosko, C.W. Studies of mold filling and curing in the reaction injection molding process. AIChE J. 1982, 28, 250–260. [Google Scholar] [CrossRef]
  120. Cross, M.M. Rheology of non-Newtonian fluids: A new flow equation for pseudoplastic systems. J. Colloid Sci. 1965, 20, 417–437. [Google Scholar] [CrossRef]
  121. Kamal, M.R. Thermoset characterization for moldability analysis. Polym. Eng. Sci. 1974, 14, 231–239. [Google Scholar] [CrossRef]
  122. Kamal, M.R.; Sourour, S. Kinetics and thermal characterization of thermoset cure. Polym. Eng. Sci. 1973, 13, 59–64. [Google Scholar] [CrossRef]
  123. Kravchenko, S.G. Failure Analysis in Platelet Molded Composite Systems; Purdue University: West Lafayette, IN, USA, 2017. [Google Scholar]
  124. Centea, T.; Hubert, P. Measuring the impregnation of an out-of-autoclave prepreg by micro-CT. Compos. Sci. Technol. 2011, 71, 593–599. [Google Scholar] [CrossRef]
  125. Willems, F.; Beerlink, A.; Metayer, J.; Kreutzbruck, M.; Bonten, C. Bestimmung der Faserorientierung langglasfaserverstärkter Thermoplaste mittels bildoptischer Analyse und Computertomografie. In Proceedings of the DGZfP-Jahrestagung, Leipzig, Germany, 7–9 May 2018. [Google Scholar]
  126. Garcea, S.C.; Wang, Y.; Withers, P.J. X-ray computed tomography of polymer composites. Compos. Sci. Technol. 2018, 156, 305–319. [Google Scholar] [CrossRef]
  127. Shen, H.; Nutt, S.; Hull, D. Direct observation and measurement of fiber architecture in short fiber-polymer composite foam through micro-CT imaging. Compos. Sci. Technol. 2004, 64, 2113–2120. [Google Scholar] [CrossRef]
  128. Riedel, T. Evaluation of 3D fiber orientation analysis based on x-ray computed tomography data. In Proceedings of the 4th International Conference on Industrial Computed Tomography (iCT), Wels, Austria, 19–21 September 2012; pp. 313–320. [Google Scholar]
  129. Goris, S.; Osswald, T.A. Progress on the characterization of the process-induced fiber microstructure of long glass fiber-reinforced thermoplastics. In Proceedings of the Society of Plastics Engineers (SPE) Automotive Composites Conference & Exhibition (ACCE), Novi, MI, USA, 7–9 September 2016. [Google Scholar]
  130. Maier, D.; Dierig, T.; Reinhart, C.; Günther, T. Analysis of woven fabrics and fiber composite material aerospace parts using industrial CT data. In Proceedings of the 5th International Symposium on NDT in Aerospace, Singapore, 13–15 November 2013. [Google Scholar]
  131. Denos, B.R.; Kravchenko, S.G.; Pipes, R.B. Progressive failure analysis in platelet based composites using CT-measured local microstructure. In Proceedings of the International SAMPE Technical Conference, Seattle, WA, USA, 22–25 May 2017. [Google Scholar]
  132. Teuwsen, J.; Bittner, F.; Steffen, J.P. Evaluation of X-ray target materials to improve CT-based measurement of fiber orientations inside CF-SMC components. In Proceedings of the International Symposium on Digital Industrial Radiology and Computed Tomography – DIR2019, Fürth, Germany, 2–4 July 2019. [Google Scholar]
  133. Hexcel Corporation. HexPly® M77-Product Data Sheet. Available online: https://www.hexcel.com/user_area/content_media/raw/HexPly_M77_EpoxyResin_DataSheet.pdf (accessed on 27 August 2020).
  134. Park, C.H.; Lee, W.I.; Yoo, Y.E.; Kim, E.G. A study on fiber orientation in the compression molding of fiber reinforced polymer composite material. J. Mater. Process. Technol. 2001, 111, 233–239. [Google Scholar] [CrossRef]
Figure 1. Schematic illustration of a flexible long fiber modeled with 6 hinge nodes and 5 rods in 3D TIMON shown in its initial straight form and bent after moved by fluid forces and applied rod length adjustments (node relocations).
Jcs 04 00164 g001
Figure 2. Schematic illustration of a tetra element in the morphing method with one node at the top, 3 nodes at the bottom, and 20 calculation points through the thickness for Light 3D analyses in 3D TIMON CompositePRESS.
Jcs 04 00164 g002
Figure 3. (a) HexMC raw material roll; (b) HexMC mesostructure with randomly in-plane oriented prepreg carbon/epoxy unidirectional (UD) strands.
Jcs 04 00164 g003
Figure 4. (a) CAD images of the upper and lower mold half of a research tool with a ribbed hat profile tool insert designed for compression molding of carbon fiber sheet molding compounds (CF-SMCs); (b) CAD geometry of the ribbed hat profile part with varying rib heights and thicknesses.
Jcs 04 00164 g004
Figure 5. HexMC charge pattern for ribbed structure part; (a) schematic illustration with dimensions and number of layers per charge package (for visualization purposes the charge package are slightly separated in thickness direction); (b) prepared HexMC charge on a metal preform.
Jcs 04 00164 g005
Figure 6. Schematic illustration of the shimming technique for short shot experiments in a cross-sectional view; (a) initial pre-heating position of the upper mold half; (b) final position of the upper mold half touching the 8.65 mm shims and showing the short shot of the pressed HexMC charge.
Jcs 04 00164 g006
Figure 7. Mold filling simulation in 3D TIMON CompositePRESS using the morphing method; (a) cross sectional view of the morphed tetra mesh in the initial open-mold position; (b) pressed back tetra mesh close to end of compression showing the proceeding flow front in the hat brim.
Jcs 04 00164 g007
Figure 8. Isothermal differential scanning calorimetry (DSC) measurements of curing HexMC samples at different temperatures and fitted Kamal model curing curves using the identified parameters given in Table 4.
Jcs 04 00164 g008
Figure 9. HexMC carbon fiber UD strands and a schematic illustration of their numerical counterpart modeled in 3D TIMON CompositePRESS with 4 boundary fibers defining the outer strand dimensions and 11 added inner fibers (here each fiber consists of 20 nodes and 19 rods, indicated on just one boundary fiber) (note: for visualization purposes length specifications are not true to scale).
Jcs 04 00164 g009
Figure 10. (a) Numerically modeled initial charge pattern for the ribbed hat profile part consisting of in-plane randomly oriented UD strands (5 UD strands are highlighted); (b) bottom view of the numerical charge definition where each charge package is colored differently for better discernibility.
Jcs 04 00164 g010
Figure 11. (a) Exemplary CT measurement setup (note: here, focus object distance (FOD) and the focus detector distance (FDD) are not the ones used for the scans); (b) schematic illustration of merged CT scans with overlap areas.
Jcs 04 00164 g011
Figure 12. Ribbed structure compression molded with a simple quadratic HexMC charge pattern and unsuited molding parameters showing extensive fiber matrix separation (FMS) (left) compared to a part molded with a pre-heated and optimized charge pattern developed by means of filling simulation studies using 3D TIMON CompositePRESS (right) (plate areas are removed from the ribbed hat profiles).
Jcs 04 00164 g012
Figure 13. Three compression molded ribbed structures made of HexMC (plate areas are removed from the ribbed hat profiles) picked for CT scanning and a detailed view on the right hand side showing the middle section of sample #19 in bottom view.
Jcs 04 00164 g013
Figure 14. 3D TIMON CompositePRESS fill simulation status compared to a real HexMC short shot using 8.65 mm shims.
Jcs 04 00164 g014
Figure 15. 3D TIMON CompositePRESS fill simulation status compared to a real HexMC short shot using 4.00 mm shims (numerical and real short shot are shown from different viewing angles).
Jcs 04 00164 g015
Figure 16. (a) Progressing flow front and deformed UD strands during the direct fiber simulation (DFS) with 3D TIMON CompositePRESS at an intermediate time step; (b) DFS result close to the end of compression.
Jcs 04 00164 g016
Figure 17. (a) Initial virtual charge configuration with randomly oriented UD strands consisting of 15 fibers each; (b) highlighted UD strand (purple colored) at the plate surface before molding; (c) same UD strand near to the end of its flow path; (d) detailed view showing the 15 slightly deformed single fibers of the flown UD strand (for visualization purposes all other strands are colored in light gray).
Jcs 04 00164 g017
Figure 18. (a) Photo of the initial HexMC charge configuration with randomly oriented UD strands in several charge packages on a metal preform; (b) detailed view of the UD strands in the lower right corner of the base charge; (c) compression molded part; (d) detailed view of the lower right corner of the plate showing the flown and slightly deformed UD strands.
Jcs 04 00164 g018
Figure 19. Virtual UD strand (colored in blue; initial position blue dotted) in the hat profile area deforming and splitting after flowing into and through a rib shown at two different time steps (all other fibers are colored in light gray).
Jcs 04 00164 g019
Figure 20. (a) Predicted fiber orientation vectors displayed at the part surface of the hat profile; (b) detailed view of a cross section (front view) showing the fiber orientation vectors in the three middle ribs.
Jcs 04 00164 g020
Figure 21. CT scan of sample #20 showing fiber bundles of split UD strands on the surface of the hat profile’s end brim after a flow length of approximately 100 mm.
Jcs 04 00164 g021
Figure 22. (a) CT images of the hat profile middle sections of all three scanned parts (top view; 1 mm of the each part surface is removed to see the inner strand bundle orientations); (b) fiber bundle orientations determined by VGSTUDIO MAX 3.3 on a 5 × 5 mm integration mesh in a wider section of sample #20 displayed as ellipsoids in the end brim and as vectors (1st eigenvector) in the plate brim.
Jcs 04 00164 g022
Figure 23. (a) Detailed 3D view of the CT scanned ribbed structure #20 (displayed are density gradients at the part surface; the surface of the hat brims is slightly removed to show the carbon fiber bundle orientations inside the brims); (b) determined FOTs of the same part displayed as ellipsoids in VGSTUDIO MAX 3.3 (analysis based on the process simulation tetra mesh; CT scan data are set to 100% transparency) (red elongated ellipsoids: fibers highly oriented in one direction, green flattened ellipsoids: planar fiber orientation, blue spherical ellipsoids: 3D random fiber orientation).
Jcs 04 00164 g023
Figure 24. CAD image of the ribbed structure’s middle section (3D view, superimposed tetra mesh) with all analysis areas used for the comparison of the averaged fiber orientations of all three CT scans with the fiber orientations predicted with 3D TIMON CompositePRESS.
Jcs 04 00164 g024
Figure 25. 1st eigenvector (displayed as arrow) of a fiber orientation in 3D space described by the polar angle θ and the azimuthal angle φ (Eulerian angles) in a Cartesian coordinate system.
Jcs 04 00164 g025
Figure 26. CAD image of the ribbed structure’s middle section (front view) with the rib analysis areas (white boxes) showing the determined averaged fiber orientations of all three CT scans in green superimposed with the fiber orientations predicted with 3D TIMON CompositePRESS in pink (both displayed as 2D ellipses on the used tetra mesh).
Jcs 04 00164 g026
Figure 27. CAD image of the ribbed structure’s middle section (bottom view) with the brims and head analysis areas (white boxes) showing the determined averaged fiber orientations of all three CT scans in green superimposed with the fiber orientations predicted with 3D TIMON CompositePRESS in pink (both displayed as 2D ellipses on the tetra mesh).
Jcs 04 00164 g027
Table 1. HexMC material properties.
Material PropertyValue/TypeUnit
FiberHigh strength carbon-
Fiber length50mm
Fiber density1.80g/cm3
ResinM77 epoxy-
Resin density1.22g/cm3
UD strand dimensions50 × 8 × 0.15mm
Material density1.55g/cm3
Nominal fiber weight content62%
Nominal fiber volume content57%
Areal weight2000g/m2
Table 2. Compression molding processing conditions.
Molding ParameterValueUnit
Mold temperature140°C
Preheating time17s
Pressure200bar
Closing speed5mm/s
Curing time480s
Charge weight~1000g
Mold coverage~80%
Table 3. Cross–Castro–Macosko viscosity model constants.
ConstantValueUnit
a1.000 × 10−11Pa s
b1.100 × 104K
D1.500 × 101-
E−4.000 × 100-
n6.000 × 10−1-
τ*2.000 × 10²Pa
αgel8.500 × 10−1-
Table 4. Kamal curing model constants.
ConstantValueUnit
m6.100 × 10−1-
n1.580 × 100-
A11.280 × 1071/s
A26.750 × 10101/s
E11.187 × 104K
E21.159 × 104K
Table 5. Micro-CT measurement parameters.
Scan ParameterValueUnit
Voxel resolution59.6µm
X-ray voltage160kV
X-ray current250µA
Focus object distance (FOD)642mm
Focus detector distance (FDD)1500mm
Integration time6 × 200ms
Projections2 × 2400-
Measuring time per partial scan100min
Table 6. Averaged fiber orientation measurement results for the rib analysis areas of three CT scanned ribbed hat profiles.
Analysis AreaAxxAyyAzz1st Eigenvalue2nd Eigenvalue Measured   Angle   θ
Left RibTop0.050.700.260.730.2379.4°
SD0.020.040.020.030.012.6°
Center0.060.600.340.650.3087.0°
SD0.030.020.000.030.0115.0°
Bottom0.070.610.320.650.2874.8°
SD0.020.020.010.020.001.4°
Center Rib0.100.710.190.730.2196.5°
SD0.030.060.040.070.040.6°
Right RibTop0.150.610.240.660.25101.2°
SD0.060.090.040.090.052.5°
Center0.120.540.340.610.30107.2°
SD0.030.030.050.050.043.6°
Bottom0.090.490.420.600.32115.5°
SD0.030.030.050.050.033.1°
Mean SD0.030.040.030.050.034.1°
* normalized to a positive angle between 0° and 180° related to the z-axis in the yz-plane.
Table 7. Averaged fiber orientation measurement results for the brim and head analysis areas of three CT scanned ribbed hat profiles.
Analysis AreaAxxAyyAzz1st Eigenvalue2nd Eigenvalue Measured   Angle   φ
End BrimLeftTop0.270.700.030.730.25103.5°
SD0.010.010.020.020.0119.9°
Bottom0.420.550.030.630.34113.5°
SD0.050.040.020.030.0113.3°
CenterTop0.320.650.030.680.29102.0°
SD0.030.010.020.010.0110.6°
Bottom0.460.510.030.610.36129.5°
SD0.010.010.020.030.0113.0°
RightTop0.280.700.020.730.2697.8°
SD0.010.010.010.010.013.9°
Bottom0.400.570.020.650.33115.9°
SD0.040.040.010.040.0311.3°
Plate BrimLeftTop0.360.610.030.650.3396.2°
SD0.040.050.010.040.0423.2°
Bottom0.390.600.010.640.3597.4°
SD0.050.050.000.040.044.5°
CenterTop0.380.580.040.630.3585.1°
SD0.050.060.010.050.0418.6°
Bottom0.450.540.010.610.3792.4°
SD0.060.060.010.030.0217.6°
RightTop0.370.590.030.640.3491.2°
SD0.040.050.010.050.0423.1°
Bottom0.410.570.010.620.3699.7°
SD0.040.040.010.050.0467.6°
HeadLeft0.560.400.040.610.36156.5°
SD0.060.060.020.060.0414.6°
Right0.510.440.050.580.37141.3°
SD0.070.050.030.060.0419.3°
Mean SD0.040.040.010.040.0318.6°
* normalized to a positive angle between 0° and 180° related to the x-axis in the xy-plane.
Table 8. Predicted fiber orientation results for the rib analysis areas of the ribbed hat profile using 3D TIMON CompositePRESS.
Analysis AreaAxxAyyAzz1st Eigenvalue2nd Eigenvalue Predicted   Angle   θ
Left RibTop0.120.530.340.540.3495.8°
Absolute error vs. CT scans0.080.160.090.190.1116.4°
Center0.090.670.230.670.2488.4°
Absolute error vs. CT scans0.030.070.110.030.061.4°
Bottom0.100.780.130.790.1282.6°
Absolute error vs. CT scans0.030.160.190.140.167.8°
Center Rib0.210.600.180.610.2284.2°
Absolute error vs. CT scans0.120.110.010.120.0112.3°
Right RibTop0.150.710.150.710.1594.1°
Absolute error vs. CT scans0.000.100.100.050.107.1°
Center0.150.760.090.770.1594.5°
Absolute error vs. CT scans0.030.220.250.150.1512.7°
Bottom0.190.740.070.740.1992.4°
Absolute error vs. CT scans 0.090.250.350.140.1323.2°
MAE vs. averaged CT scans0.060.150.160.120.1011.6°
* normalized to a positive angle between 0° and 180° related to the z-axis in the yz-plane.
Table 9. Predicted fiber orientation results for the brim and head analysis areas of the ribbed hat profile using 3D TIMON CompositePRESS.
Analysis areaAxxAyyAzz1st Eigenvalue2nd Eigenvalue Predicted   Angle   φ
End BrimLeftTop0.180.810.010.810.1991.2°
Absolute error vs. CT0.080.100.020.080.0612.3°
Bottom0.290.700.010.700.2985.7°
Absolute error vs. CT0.130.150.020.070.0527.8°
CenterTop0.450.540.020.550.43112.1°
Absolute error vs. CT0.130.120.010.130.1410.1°
Bottom0.700.290.010.700.291.9°
Absolute error vs. CT0.240.220.020.100.0752.5°
RightTop0.240.750.010.760.2397.4°
Absolute error vs. CT0.050.050.010.030.020.4°
Bottom0.430.560.010.590.40111.7°
Absolute error vs. CT0.020.010.010.050.074.3°
Plate BrimLeftTop0.210.750.050.830.14109.3°
Absolute error vs. CT0.150.140.020.170.1913.1°
Bottom0.360.630.000.740.26117.5°
Absolute error vs. CT0.030.040.010.100.0920.1°
CenterTop0.260.680.070.690.27101.7°
Absolute error vs. CT0.130.090.030.060.0816.6°
Bottom0.320.660.010.680.30102.5°
Absolute error vs. CT0.120.120.000.070.0710.1°
RightTop0.290.640.070.670.2976.1°
Absolute error vs. CT0.080.050.030.030.0515.0°
Bottom0.380.610.010.610.3887.1°
Absolute error vs. CT0.030.040.010.010.0212.5°
HeadLeft0.570.420.000.600.4020.3°
Absolute error vs. CT0.010.020.040.010.0443.8° **
Right0.590.400.000.640.3623.5°
Absolute error vs. CT0.080.030.050.060.0162.2° **
MAE vs. averaged CT scans0.090.080.020.070.0721.5°
* normalized to a positive angle between 0° and 180° related to the x-axis in the xy-plane. ** since the calculated normalized angle is over 90°, the smaller supplementary angle (adjacent angle) is taken for the deviation calculation.
Publisher’s Note: MDPI stays neutral with regard to jurisdictional claims in published maps and institutional affiliations.