Article

Fatigue Life Prediction for Carbon-SMC and Carbon-FRP by Considering Elastic Modulus Degradation

1
Department of Naval Architecture and Ocean Engineering, Pusan National University, Busan 600-011, Korea
2
Hyundai Motor Company R&D Center, Namyang 445-010, Korea
*
Author to whom correspondence should be addressed.
J. Compos. Sci. 2021, 5(2), 54; https://doi.org/10.3390/jcs5020054
Submission received: 29 December 2020 / Revised: 3 February 2021 / Accepted: 5 February 2021 / Published: 10 February 2021
(This article belongs to the Special Issue Composite Carbon Fibers)

Abstract

:
In the automotive industry, being lightweight has become an important design factor with the enhancement of environmental regulations. As a result, many studies on the application of composite materials are in progress. Among them, interest in carbon materials, such as carbon sheet molding compound (C-SMC) and carbon-fiber-reinforced plastic (CFRP), which have excellent strength and stiffness, is increasing. However, CFRP is a material that makes it difficult to secure economic feasibility due to its relatively high manufacturing costs and limited mass production, despite its excellent mechanical strength and durability. As a result, many studies have been conducted on C-SMC as an alternative carbon composite material that can be easily mass-produced. In this regard, this study intended to conduct a study on evaluating the fatigue strength of C-SMC and CFRP among mechanical properties due to the lack of clear failure criteria for fatigue design. We investigated the tensile and fatigue strengths of C-SMC and CFRP, respectively. In the case of C-SMC, the mechanical strength tests were conducted for two different width conditions to evaluate the cutting effect and the machining methods to assess the effects of the edge conditions. To evaluate the fatigue failure assessment criteria, the stiffness drop and elastic modulus degradation criteria were applied for each fatigue test result from the C-SMC and CFRP. The results confirmed that the rationality of the failure criteria in terms of the stiffness drop and the application of the fatigue life prediction of C-SMC based on elastic modulus degradation demonstrated promising results.

1. Introduction

Carbon-fiber-reinforced plastic (CFRP) has excellent strength and stiffness. It can be lightweight, making it suitable for the manufacture of simple feature parts for automobiles, and is currently being applied in various ways [1]. However, CFRP is a material that makes it difficult to secure economic feasibility due to its high manufacturing costs and limited mass production, despite its excellent mechanical strength and durability. As a result, many studies have been conducted on carbon sheet molding compound (C-SMC), an alternative carbon composite material that can be mass-produced. C-SMC is a fiberglass-reinforced thermosetting material that has been applied to automobile production for a long time and can be mass-produced. It has excellent lightweight realization and durability. However, it has been suggested that the existing fatigue tests of C-SMC do not have clear failure criteria and that the standard deviation for the fatigue data is quite large, making it difficult to ensure sufficient reliability.
Salkind studied composite fatigue behavior in terms of the damage and failure mechanics [2]. Wang and Chim presented the fatigue life estimation formula of SMC based on elastic modulus degradation [3]. Sieberer et al. investigated the fatigue behavior of C-SMC while accounting for modulus degradation and stiffness [4]. Lin suggested a fatigue damage accumulation formula in composite materials based on elastic modulus degradation [5]. Denton studied the mechanical properties of SMC-R50 under various temperature effects [6]. Echaabi et al. investigated the failure criteria of a composite material according to the stress and strain of various components [7]. Tang et al. investigated the material behavior of SMC under three different cyclic loading conditions, i.e., tension–tension (T–T), compression–compression (C–C), and tension–compression (T–C) [8]. Fleckenstein et al. investigated the influences of different fiber orientations and fiber weight contents on the fatigue strength behavior of this long-fiber reinforced thermosetting material on SMC [9]. Studies have been conducted on the fatigue life of the composite, such as failure criteria of the stiffness drop and fatigue damage accumulation [10,11,12,13,14,15]. Shokrieh et al. investigated the fatigue behavior according to damage modeling of composite laminates [16,17,18]. Jain et al. presented a stress–number of cycles (S–N) curve that considered the effect of the stiffness drop according to the fiber orientation distribution during a fatigue test [19]. Tamboura et al. investigated the damage and fatigue life prediction of short-fiber-reinforced composites [20]. Therefore, even in recent studies, fatigue life prediction by applying the degradation of the elastic modulus according to the stiffness reduction and damage of the composites were being made. The aforementioned studies suggested failure criteria for composites but did not present failure criteria by applying them to C-SMC and CFRP. Furthermore, existing C-SMC and CFRP fatigue test data have a fairly large standard deviation and it is difficult to ensure sufficient reliability. Therefore, C-SMC and CFRP should evaluate the fatigue strength through fatigue tests according to various criteria and apply failure criteria.
In this study, the considerations for each material were classified as an experimental approach and an analytical approach. The experimental approach in this study was conducted based on fatigue and tensile tests, and the analytical approach was conducted via numerical calculations that were based on specific failure criteria. Finally, a new failure criterion for each material was proposed based on the fatigue life estimation.

2. Preparation of Test Specimen

The specimens used for the tensile and fatigue tests had the same dimensions, and the CFRP was designed according to American Society for Testing and Materials (ASTM)D 3039 [21]. Because C-SMC does not have a clear standard, it was designed based on ASTM D 3039 [21] and is shown in Figure 1. There were a total of four cases, three cases for C-SMC and one for CFRP. C-SMC was prepared using flat-plate machining C-SMC-Cut (carbon sheet molding compound cut) specimens and C-SMC-In-mold (carbon sheet molding compound in mold) specimens according to different molding methods. In the case of C-SMC-Cut, the C-SMC-Cut-35 (35 mm width) specimen and the large-width C-SMC-Cut-100 (100 mm width) specimen were produced to investigate the effect of the width of the specimen. The polymer matrix of C-SMC was of the thermosetting type. In addition, the proportion of carbon fiber and epoxy in the composition was 50% each. The distribution method of C-SMC involved cutting the material with a 1-inch width and distribute the top surface of a sheet from above followed by uniform compression. Figure 2 presents the specimen surface magnified by 50 times. According to Figure 2, it was observed that the fiber was randomly distributed in the C-SMC. In this regard, the C-SMC was considered to present relatively isotropic characteristics compared to the CFRP. In the case of CFRP, the fiber presented a constant orientation for each layer, such as 0° and 90°, though the CFRP tended to exhibit anisotropic characteristics, as shown in Figure 3. Table 1 shows the number of test specimens for the fatigue tests in ASTM D3479 [22].

3. Estimation of Fatigue Life for C-SMC and CFRP According to the Failure Criteria

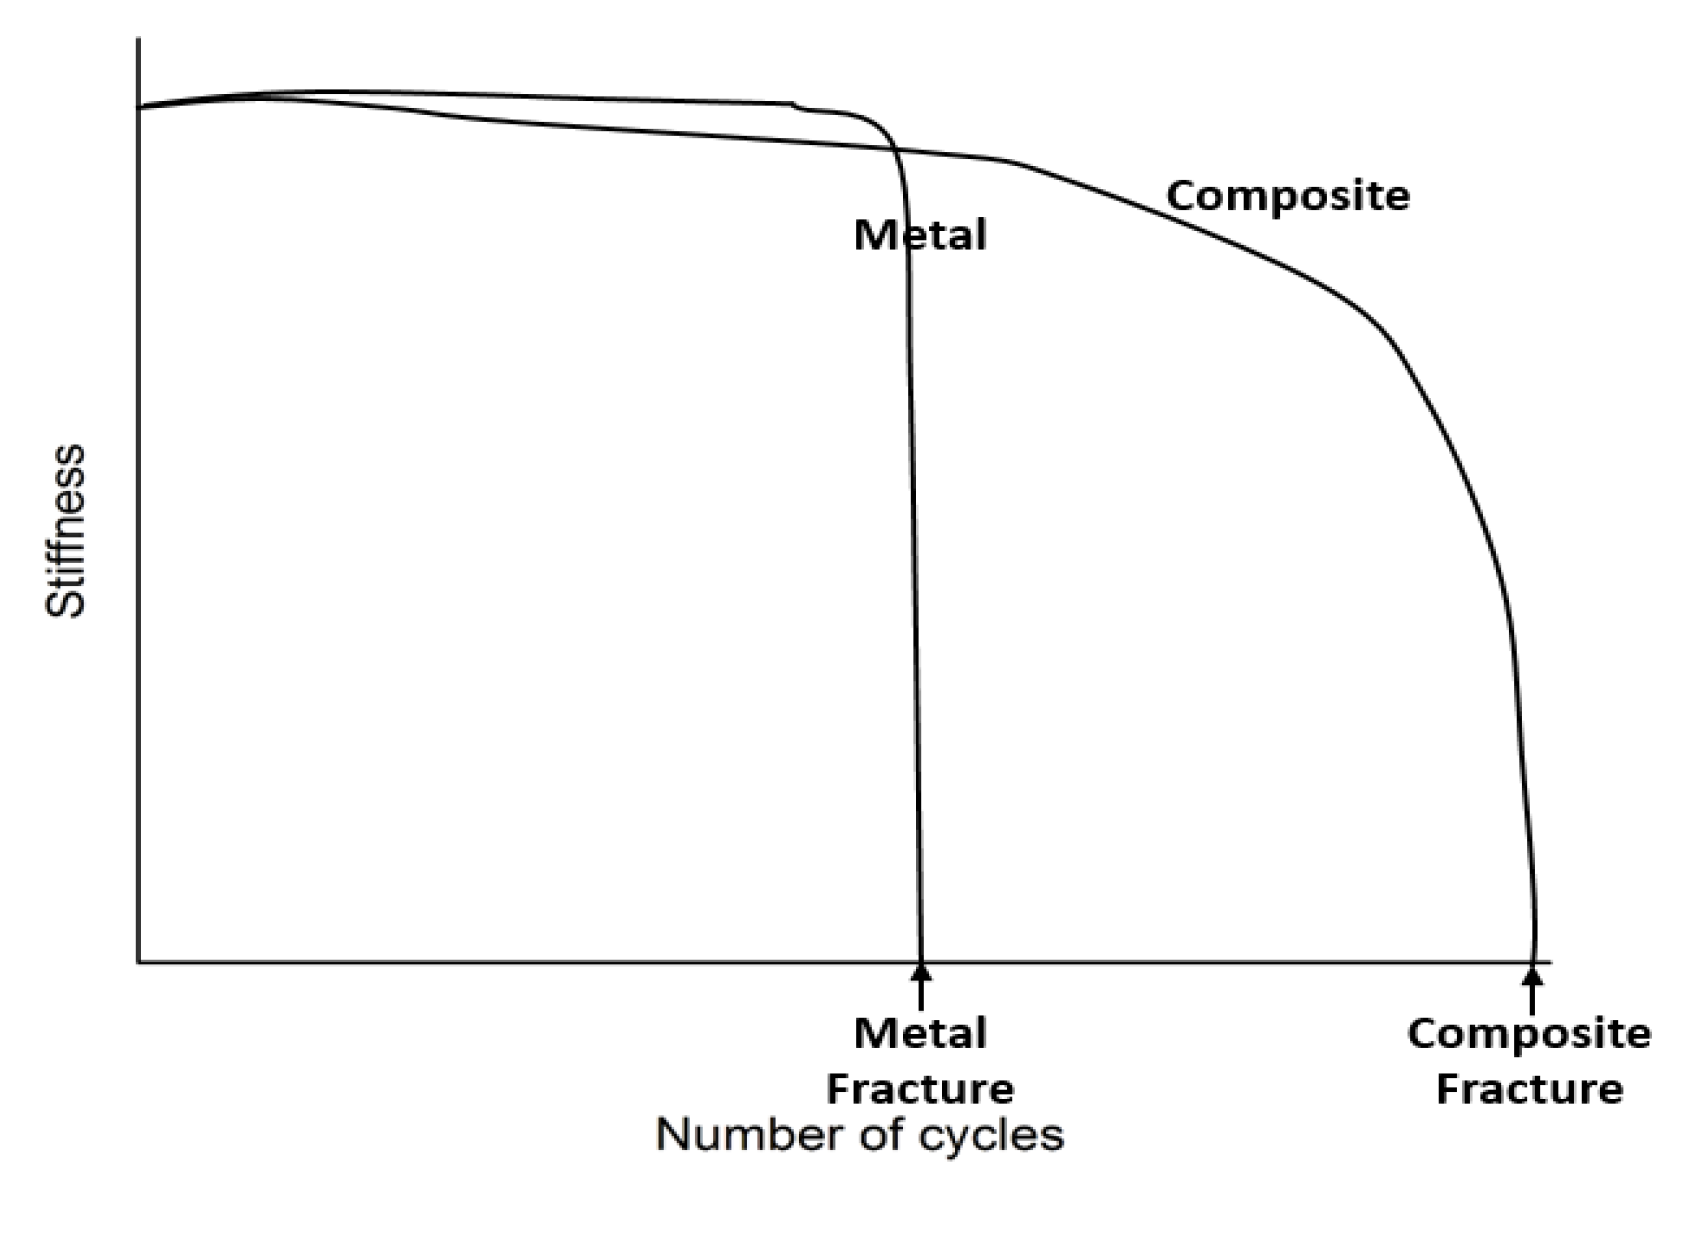
In this section, two different criteria are considered for deriving failure criteria and assessing the fatigue life. First, Salkind studied composite fatigue behavior [2]. Composites exhibit different stiffness changes from the metal at fracture. Figure 4 shows the difference in the stiffness change between metal and composite. Figure 5 shows the difference in the number of cycles between the stiffness change and the complete fracture of the composite [2]. The general stiffness behavior of metals and composites under fatigue loading conditions present significant differences for crack initiation and propagation. According to Thomas et al. [23], more than 50% of damage occurs in the first 20% of the life in the composite, which means that a structure or a component is able to survive in a condition with the presence of cracks. In the case of the metal, crack initiation generally occurs after more than 75% of the fatigue life, as presented in Figure 6. Therefore, in this study, the S–N curve at complete fracture was compared with the S–N curve at a specified stiffness drop according to the cycle. By evaluating the fatigue damage, a failure criterion for a particular stiffness drop was determined. The stiffness was obtained by dividing the load range by the displacement range based on Equation (1):
Stiffness = Maximum   Load Minimum   Load Maximum   Displacement Minimum   Displacement .
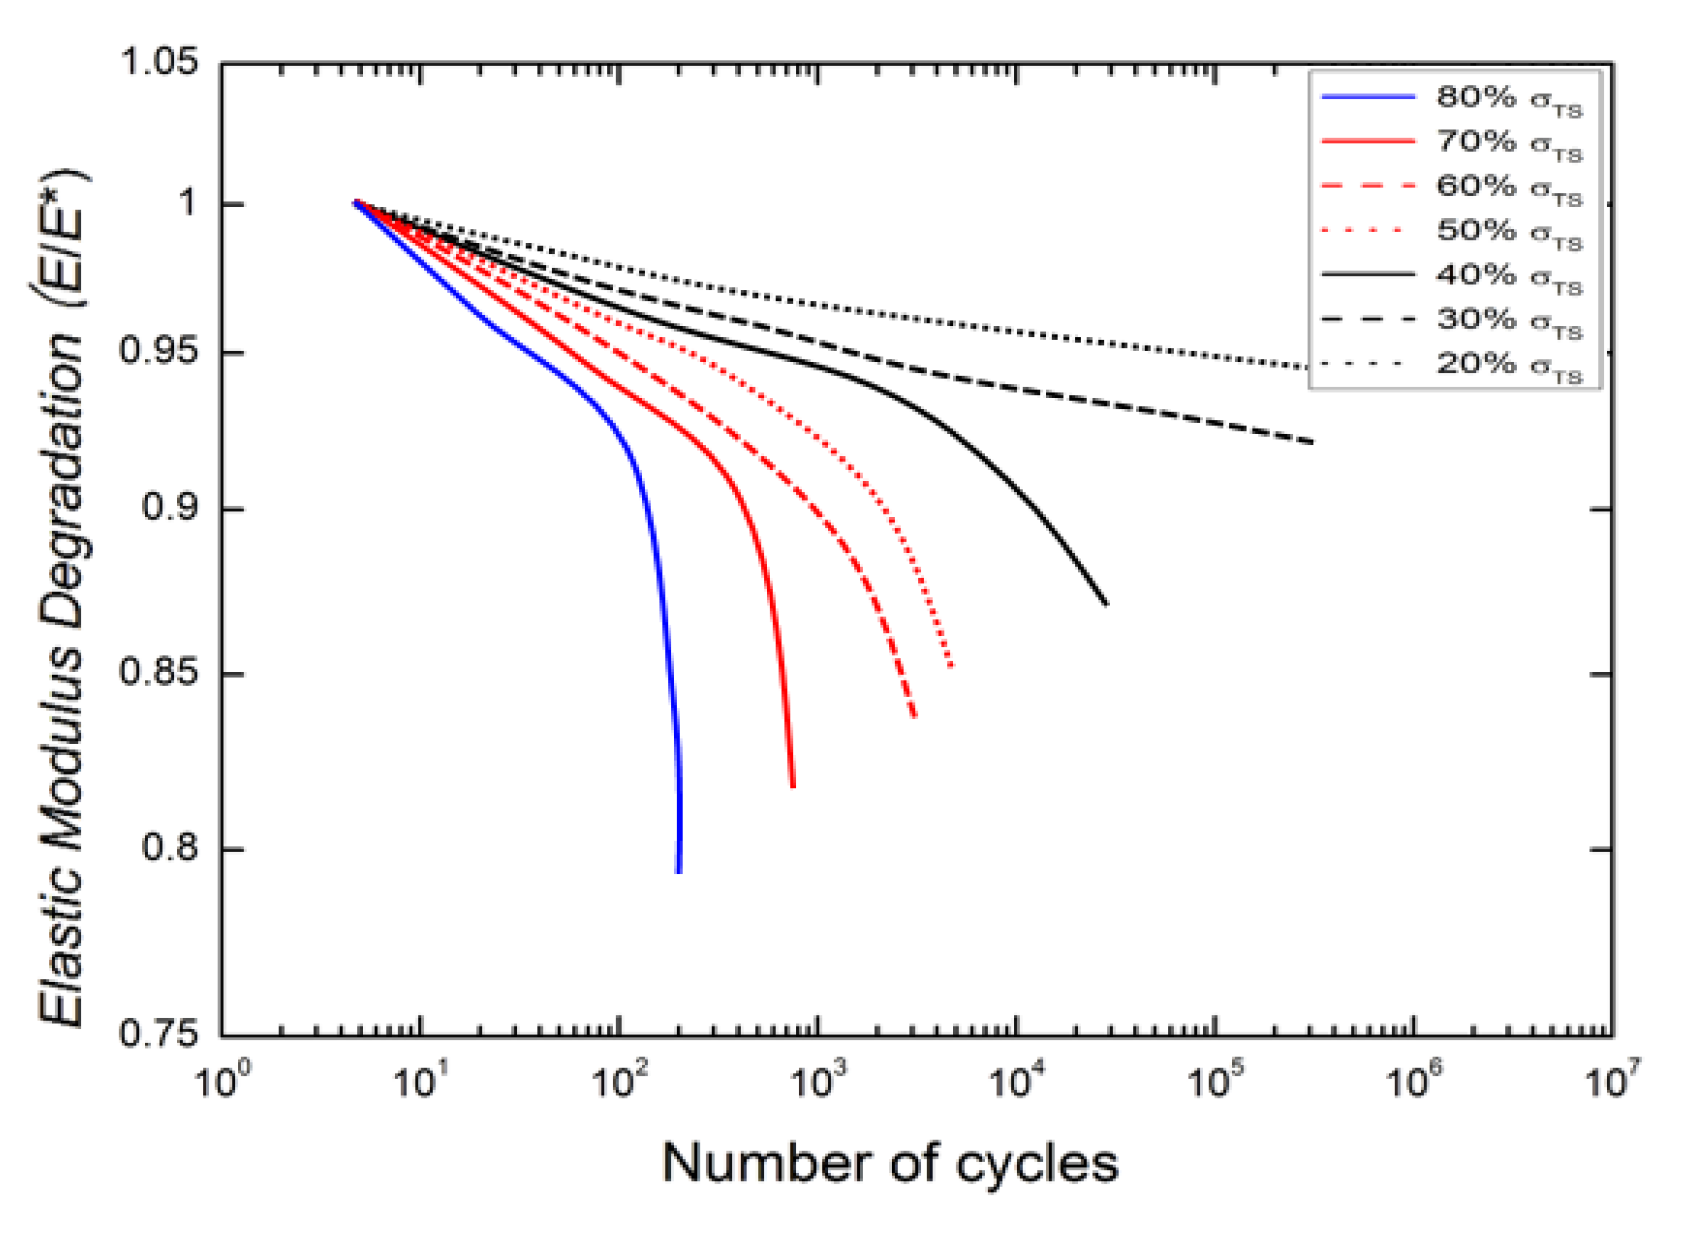
To predict the fatigue life of C-SMC, Wang and Chim used a criterion for reducing the elastic modulus of materials during fatigue testing to predict the fatigue life through an equation based on the fatigue damage rate [3]. Figure 7 shows a decrease in the elastic modulus due to different cyclic stresses during fatigue tests [3]. Equations (2)–(4) show the expressions necessary for calculating the fatigue damage rate. The parameter, D, is defined to provide a quantitative measure of the cycle fatigue damage.
D = 1 E E * ,
d D d N = A ( D ) N B ,
N f = [ 0 D f B + 1 A d D ] 1 B + 1 ,
where E is the current elastic modulus and E * is the initial elastic modulus. A is a function of D, and B is the slope of the material in a log scale. N f is the number of cycles it takes to achieve fatigue failure and D f is the elastic modulus based on the failure criterion. Figure 8 shows the evaluation of the d D d N curve to the number of cycles with different cyclic stress magnitudes [3].
In addition, fatigue tests based on the reduced elastic modulus and the predicted fatigue life results were verified through comparative analysis.
Ye investigated a damage accumulation law according to the stiffness drop. Therefore, D according to the change in stiffness is shown in Equation (2) [5]. Figure 9 shows the fatigue damage evolution in the composites.
Damage accumulation occurs in three stages. The damage accumulates rapidly due to the initiation of many cracks at stage one, and through continuous crack growth, the cracks merge and reach fracture at stage three. The crack growth in stage two is based on the Paris law, which defines an equation that describes the fatigue damage accumulation:
d D d N = C   ( σ max 2 D ) n ,
where C and n are material constants that can be determined by testing specimens at various stress levels. By integrating Equation (5) and noting that D = 0 when N = 0, a simple form of the damage function (Equation (6)) can be obtained:
D = [ ( n + 1 ) C N ] 1 / ( n + 1 ) σ max 2 n / ( n + 1 ) .
Equation (7) is derived from Equation (6):
N 1 = D C n + 1 ( n + 1 ) C σ max 2 n .
Based on this, the fatigue life estimation according to the stiffness drop was applied to various composite materials.

4. Test Results

4.1. Tensile Test

In this section, the results of the tensile tests are described, which were carried out in accordance with the criteria in ASTM D3039 [21]; the detailed test conditions are summarized in Table 2.

Comparison of the Tensile Test Results of C-SMC and CFRP

In this section, the tensile test results of the C-SMC and CFRP are presented. In Figure 10 and Table 3, the test results show that the tensile strength of CFRP was higher by about 3 times and the elastic modulus was 2 times higher than those of C-SMC. This appeared because C-SMC mainly consists of chopped carbon fiber. As shown in Figure 2, C-SMC has relatively more boundaries in the microstructure of the material. Therefore, when loading is applied to C-SMC, each boundary acts as a crack initiation site, which leads to more frequent crack initiations compared to CFRP. On the other hand, CFRP consists of a fiber matrix that has specific directionality, which has different mechanical properties depending on the directionality. According to Campbell [25] and Jeong and Cho [26], a 0° orientation fiber matrix is designed to endure the axial loading on the CFRP. On the other hand, a 90° orientation fiber matrix is designed to endure the brittle effect. Due to these structural differences, CFRP presents relatively high tensile properties. Therefore, it shows lower strength and stiffness compared to CFRP.

4.2. Fatigue Test

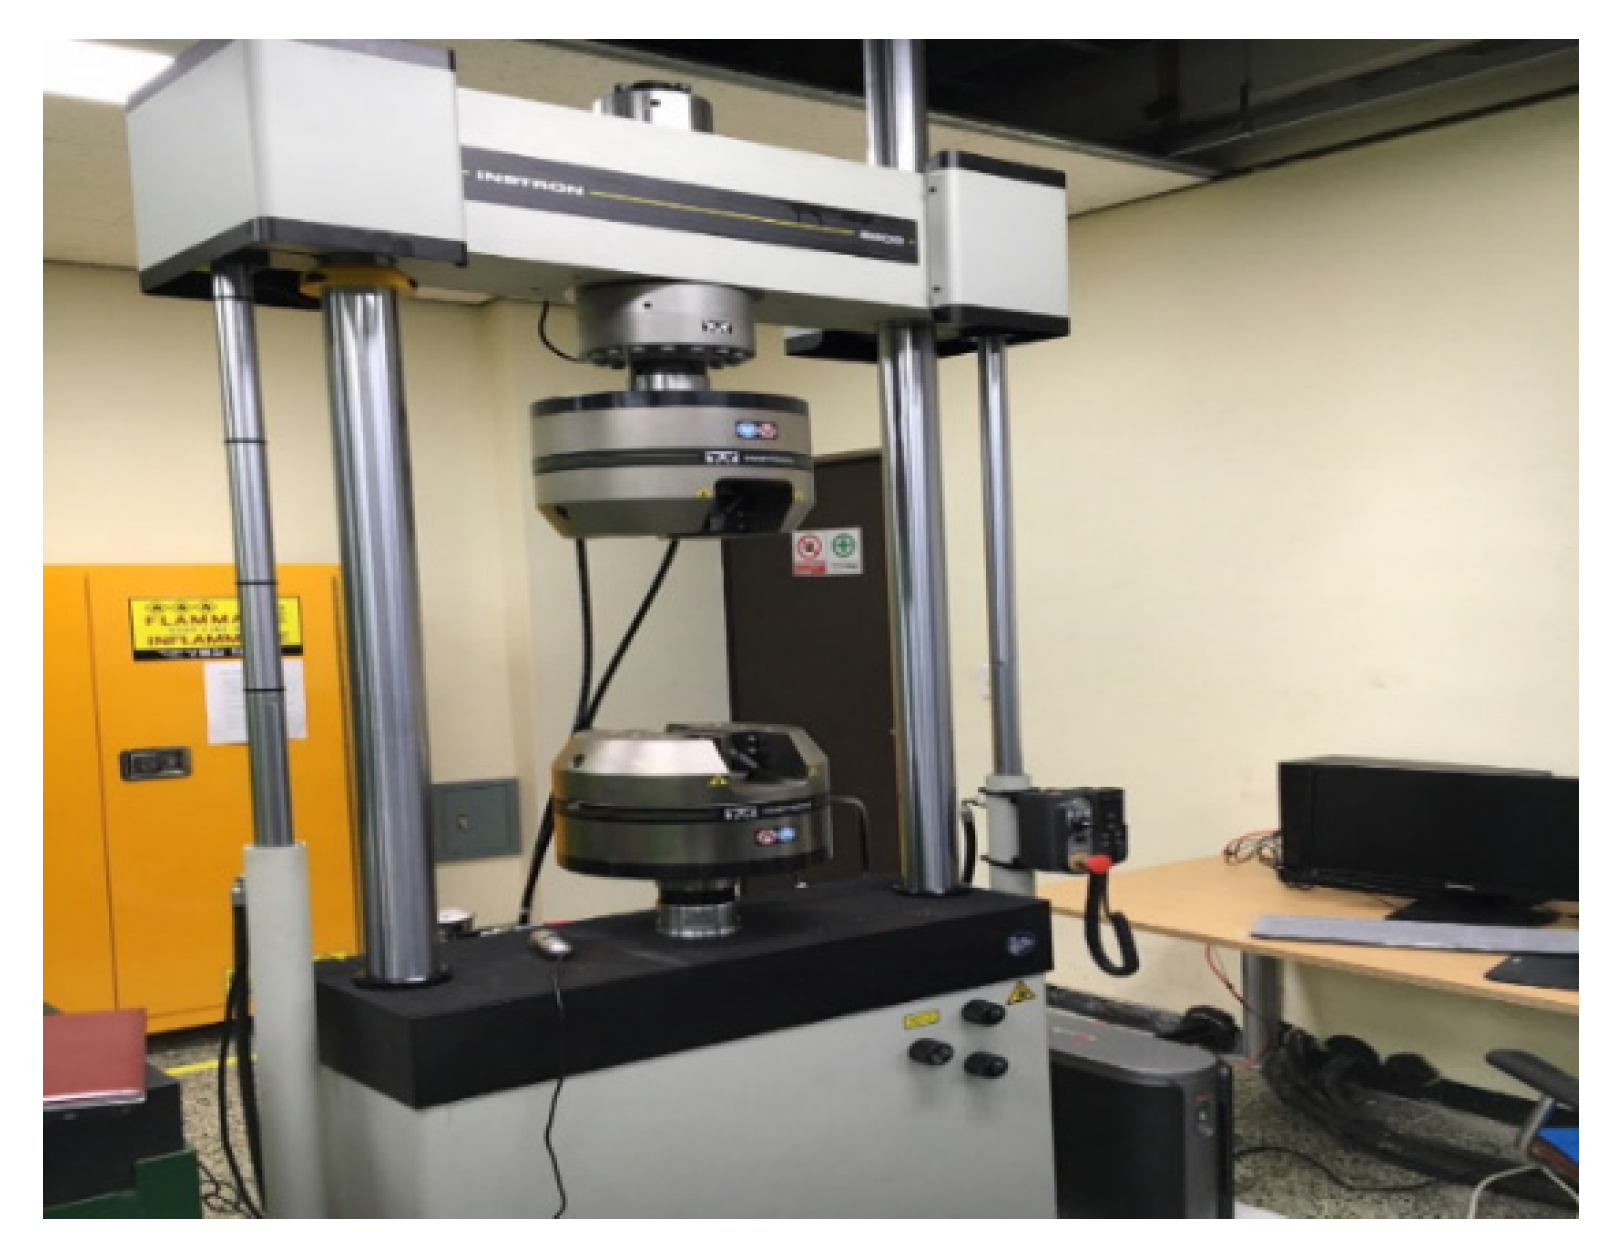
Fatigue tests were carried out according to the specifications in ASTM D3479 [22]. All fatigue tests used the same testing machine (IMT 8802, Instron, UK), with a maximum load capacity of 250 kN, as shown in Figure 11. The stress ratio R was set to 0.1 and was performed at 10 Hz.
All fatigue tests were conducted by determining the fatigue test stress range as fractions of the tensile strength and defining it as a complete fracture due to a sharp drop in the applied load between fatigue tests. This section also explains how the fatigue lives and the S–N curves differed according to each specimen shape and process method.

4.2.1. Effect of the Edge Fabrication in Fatigue Life

In this section, the results of the fatigue tests that were carried out with R = 0.1 and a test frequency of 10 Hz are presented. A comparative evaluation analysis was conducted to evaluate the fatigue strength according to different molding method effects for the flat-plate machining specimen C-SMC-Cut-35 and the specimen C-SMC-In-mold. Figure 12 gives the S–N curves of the C-SMC-Cut-35 and C-SMC-In-mold specimens.
A comparative evaluation indicated that the value of the fatigue strength was about 21% higher for the flat-plate machining C-SMC-Cut-35 specimens than for the C-SMC-In-mold specimens.

4.2.2. Effect of the Specimen Width on the Fatigue Life

In the case of the surface-cut specimens, the flatbed machining specimens were constructed as SMC-Cut-35 and SMC-Cut-100 such that a comparative evaluation was conducted to determine the influence of the width on the fatigue strength and fatigue life. Figure 13 shows the fatigue curves for SMC-Cut-35 and SMC-Cut-100.
The difference in the S–N curve according to width was not significant, as shown in Figure 13. Comparing the fatigue strengths for the two different width cases, Cut-35 presented 90 MPa for the fatigue limit while Cut-100 presented 88.7 MPa. Therefore, it was determined that the specimen size did not significantly affect the fatigue strength and fatigue life in C-SMC.

4.2.3. Comparison of the Fatigue Lives of C-SMC and CFRP

In this section, the fatigue test results of C-SMC and CFRP are compared. Figure 14 shows the S–N curves for all specimens.
The comparisons show that CFRP exhibited a 5 times higher fatigue strength than C-SMC. These fatigue strength differences generally showed that CFRP had higher strength and stiffness than C-SMC, as expected. The reason for this is that C-SMC mainly consists of chopped carbon fiber. Therefore, C-SMC has relatively many boundaries in the microstructure of the material. On the other hand, CFRP consists of a fiber matrix, which has different directionalities. Due to these structural differences, C-SMC may have many initial cracks when subjected to cyclic loads. For this reason, as the cycles progress, the initial crack in C-SMC becomes larger, and as the cracks merge, it can be seen that the cracks progress even under relatively lower loads than in CFRP.

5. Discussion

In this section, the results of the failure criteria application and fatigue life assessment, which was suggested in Section 3, are presented. Each consideration was based on the stiffness drop and elastic modulus degradation criteria.

5.1. Failure Criterion

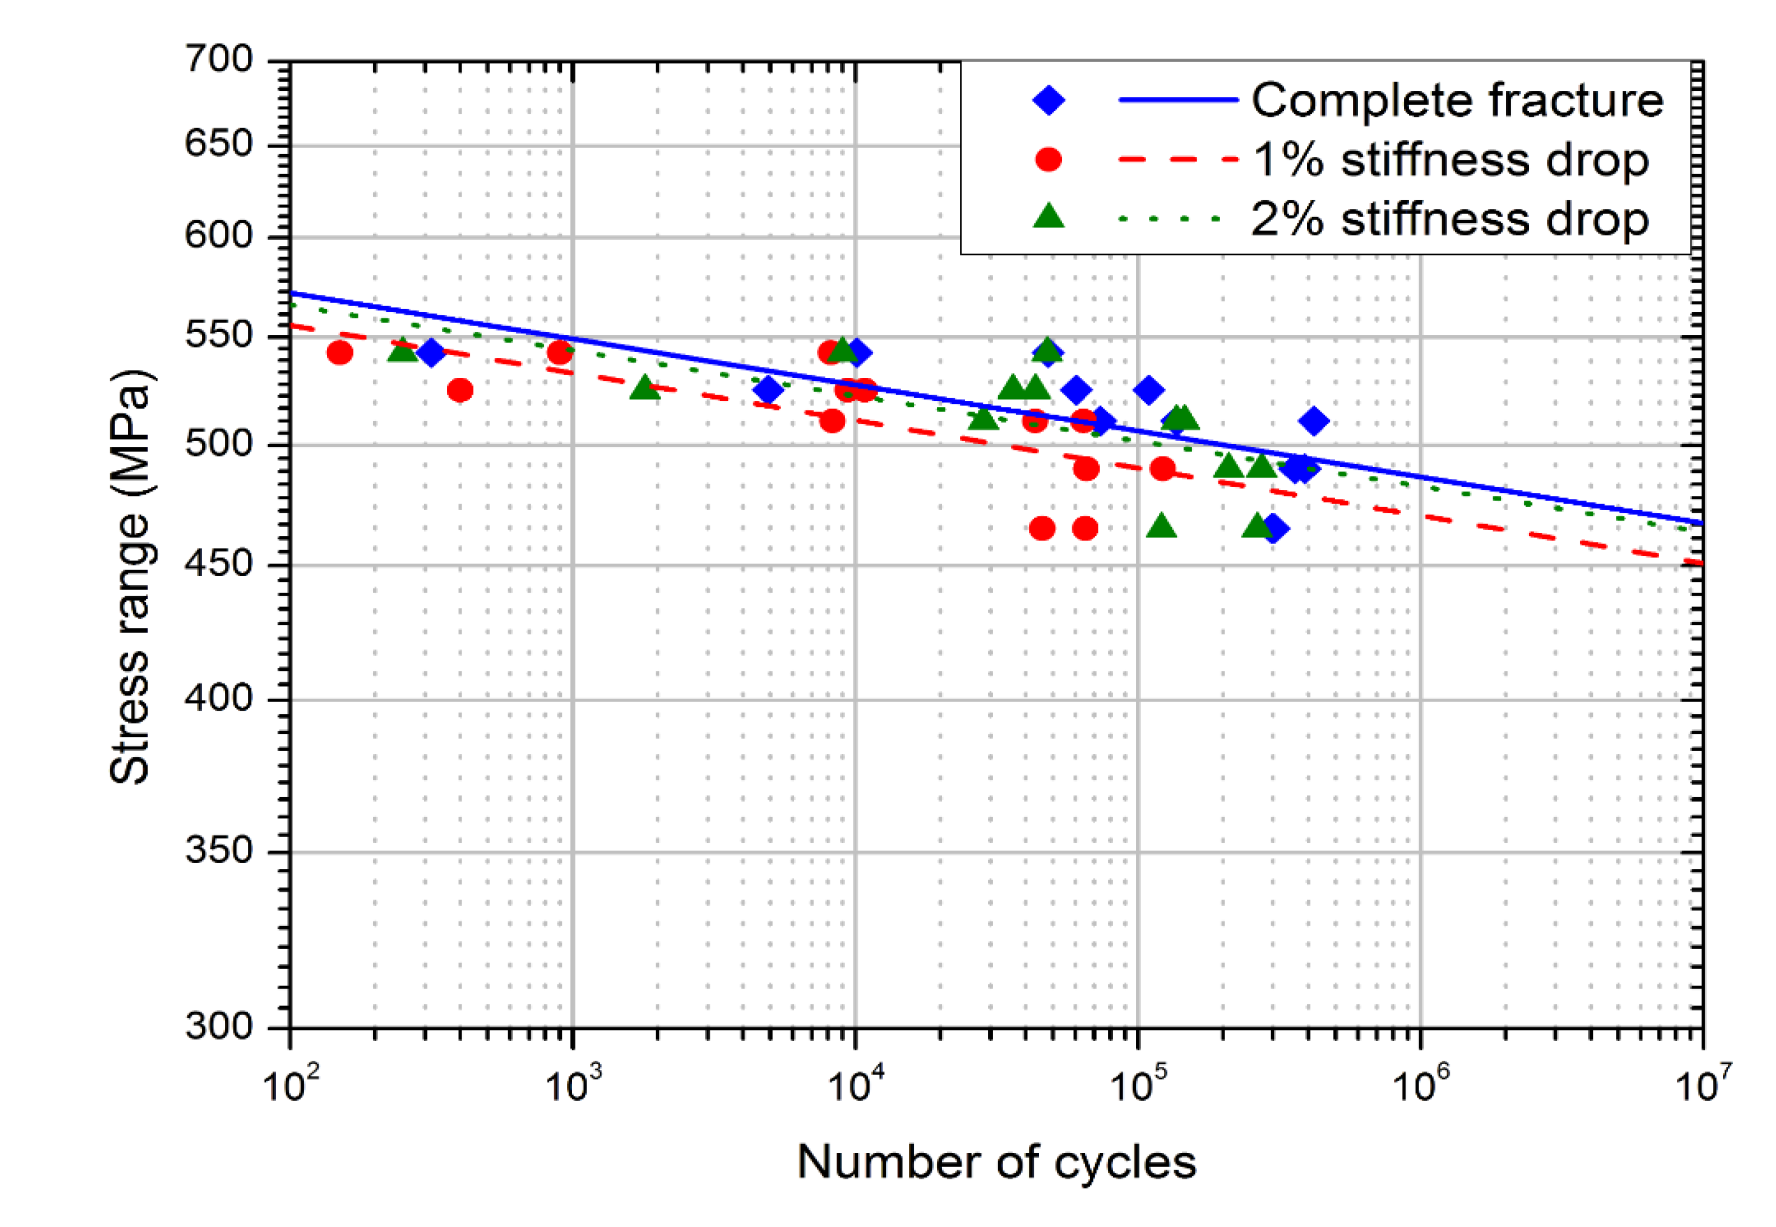
As discussed in Section 3, the composites showed a distinct difference in the stiffness drop compared to the metallic material. In particular, a complete fracture due to fatigue is very unlikely to be observed. Therefore, the final fracture in this study was defined using two classifications: (1) complete fracture and (2) stiffness drop. Figure 15 and Figure 16 present the S–N curves for various stiffness drops.
According to failure criteria in terms of the stiffness drop, a 10% stiffness drop was considered as a reasonable final fracture condition for C-SMC. In the case of CFRP, it showed a negligible stiffness drop, unlike C-SMC. Therefore, the complete fracture should be a reasonable final fracture criterion for CFRP.

5.2. Fatigue Life Prediction based on the Degradation of Elastic Modulus

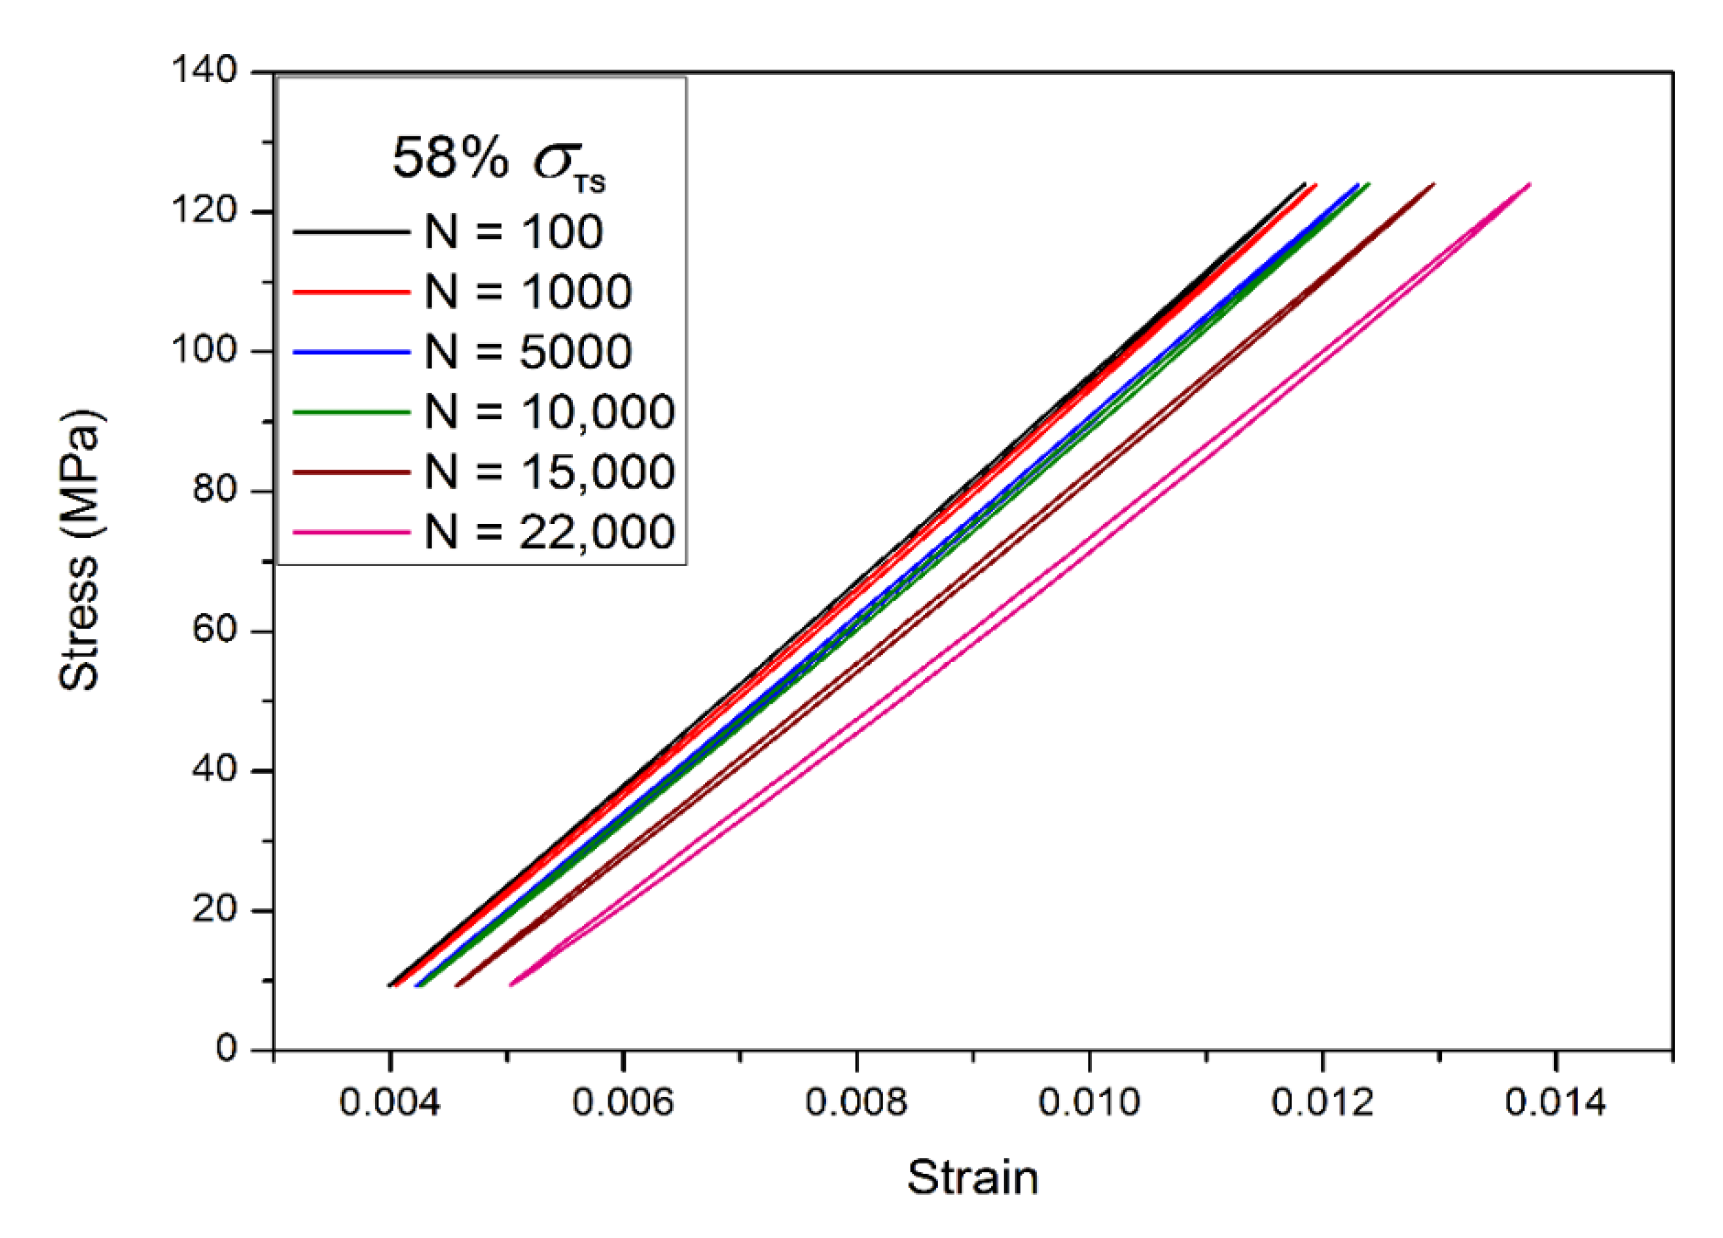
In this section, the results of the fatigue life prediction according to elastic modulus degradation during fatigue tests are presented [3]. A dynamic extensometer (Instron, United Kingdom) was installed in the C-SMC-Cut-35 specimen to record the changes in the elastic modulus during fatigue tests. The stress ratio R for the fatigue test was set to 0.1 and the frequency was 3 Hz. The test results were compared with the fatigue life prediction results obtained by applying the fatigue damage rate based on the life calculation formula. Figure 17 and Table 4 show the elastic modulus changing with the cycle. In addition, Figure 17 presents the cyclic softening phenomenon. According to Thomas et al. [23], more than 50% of damage occurs in the first 20% of life in the composite, and much of the crack initiation occurs during this time. Therefore, C-SMC may inherently contain many initial cracks when subjected to cyclic loads. For this reason, as the cycles progress, the initial cracks in C-SMC become larger and the cracks merge. Figure 18 and Figure 19 show the crack initiation of C-SMC via visual observation and digital image correlation (DIC). Therefore, the stiffness due to many crack initiations was reduced, resulting in the cyclic softening phenomenon.
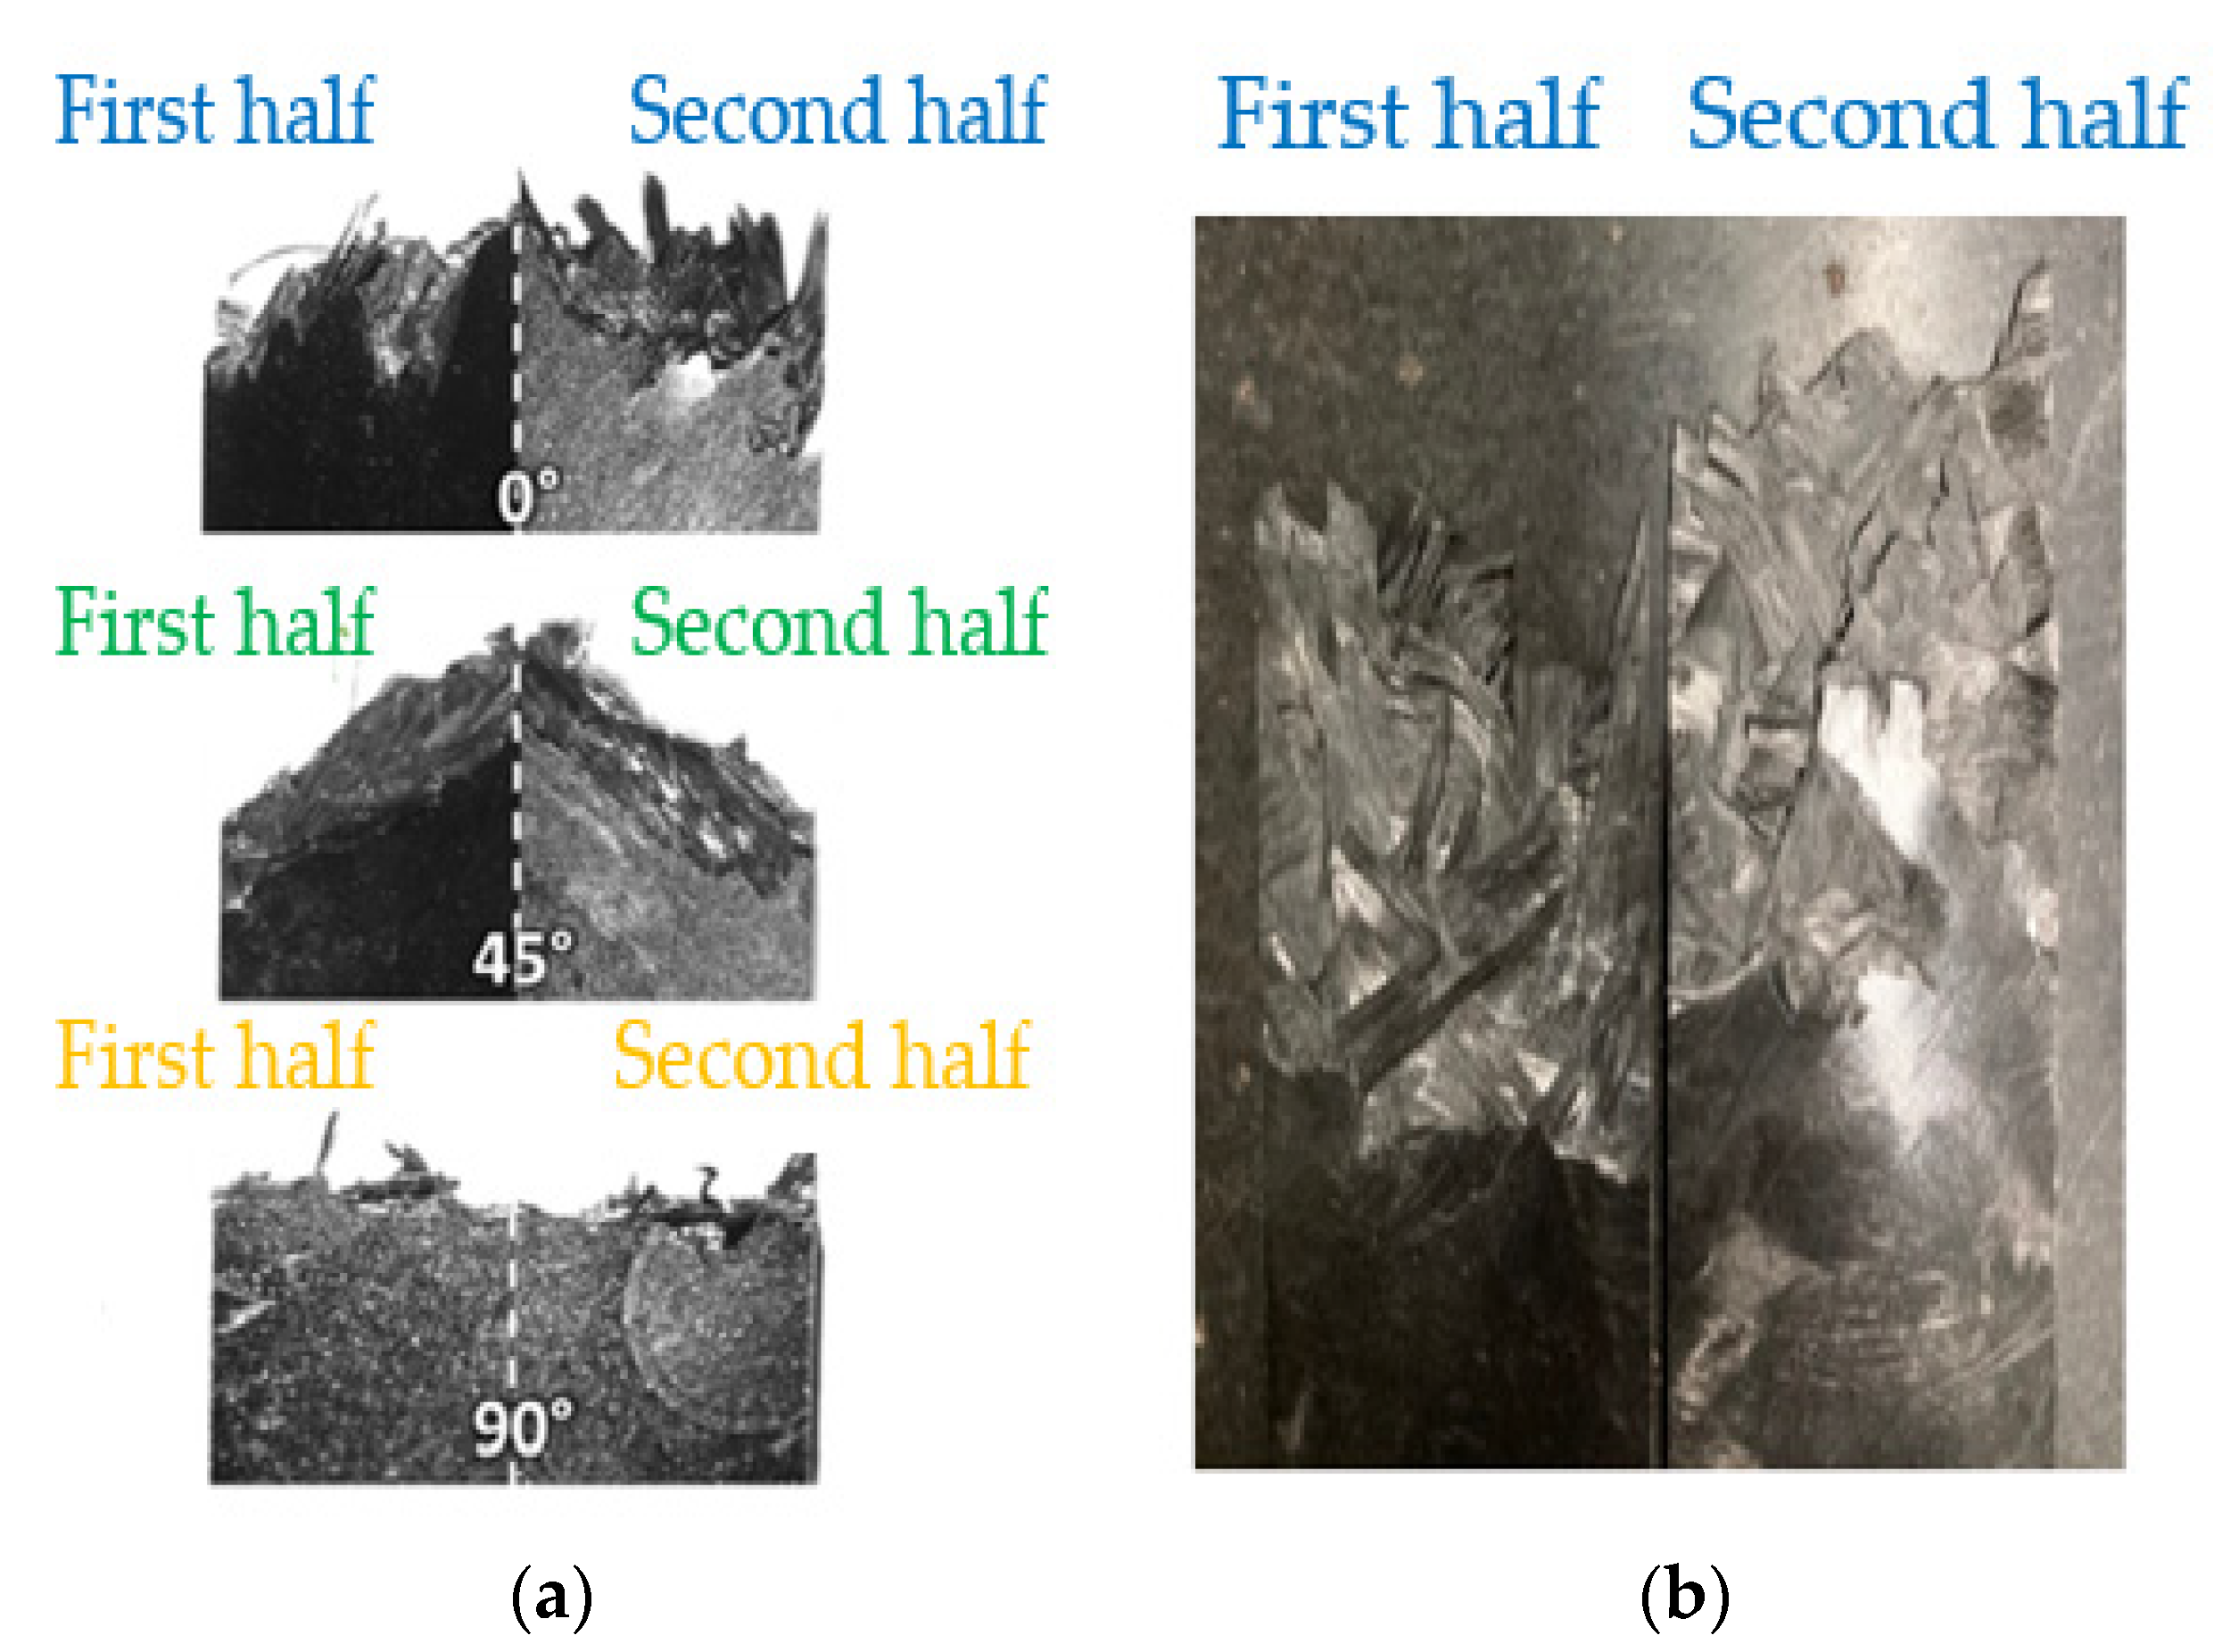
Figure 20 shows the rate of the reduction of the elastic modulus with increasing cycles for each load condition based on the tensile strength. The reasons for the elastic modulus degradation of the C-SMC with increasing cycles for each load condition are as follows. It is known that the fracture modes and physical properties of C-SMC change depending on the fiber orientation distribution. On the other hand, according to [27], the carbon sheet molding compound can be considered isotropic due to the uniformly distributed local fiber orientation. Figure 21 shows the fracture trends of the study of Martulli et al. and the C-SMC in this study. As a result of comparing the fracture tendency, it was found that the C-SMC of this study was similar to the fracture tendency of 0°. In addition, according to the study of Martulli et al., in the C-SMC distributed in the 0° direction, the fiber was mainly broken and reached the fracture condition. In this regard, the results of the SEM analysis of the C-SMC of this study are shown in Figure 22. According to the SEM analysis, the fibers broke and the caused failure, resulting in the elastic modulus degradation of C-SMC. Figure 23 presents the damage rate for each stress value.
Representatively, in the case of 65%   σ TS (1) of C-SMC, A(D) was 0.022 D 2 0.0035 D + 0.003 and B (slope) was −0.045 according to d D / d N . Based on the elastic modulus degradation ratio and the damage change rate obtained, the fatigue damage change rate was calculated using the fatigue lifetime formula based on Equation (4). Figure 24 compares the damage, D, between the predicted life and the experimental data per cycle.
Here, D f is the elastic modulus based on the fracture criterion, N Pre is the number of predicted load cycles and N Exp is the number of load cycles at the fatigue fracture from the experiment. Figure 25 shows that the fatigue life prediction results based on the elastic modulus degradation and the fatigue life curve from the actual test exhibited an excellent correlation. The error between the experiments and the estimation result based on the elastic modulus degradation was verified to be within 3%. Therefore, it is reasonable that the fatigue life estimation based on the fatigue damage rate is a viable alternative for estimating the fatigue life of C-SMC based on the cyclic stress–strain curves. Furthermore, the fatigue life estimation can predict the S–N curve without a lot of fatigue tests.

6. Conclusions

In this study, a series of fatigue tests for C-SMC and CFRP was conducted to assess the fatigue performance. In terms of the failure assessment criteria, stiffness drop and elastic modulus degradation criteria were applied for each fatigue test result of C-SMC and CFRP. In addition, the fatigue life of C-SMC was predicted based on the elastic modulus degradation. The conclusions from this study are summarized in the following:
  • As a result of the fatigue tests of C-SMC and CFRP, the fatigue strength of C-SMC obtained at 106 cycles was 90 MPa for Cut-35, 88.7 MPa for Cut-100, and 74.5 MPa for In-mold. The fatigue strength of CFRP was determined to be 486.5 MPa. The reason for this was that C-SMC mainly consists of chopped carbon fiber. The relatively lower fatigue strength of C-SMC was attributed to there being many boundaries in the microstructure of the material. On the other hand, CFRP consists of a fiber matrix, which has various directionalities. Due to these structural differences, CFRP was observed to exhibit a relatively higher fatigue strength compared to that of C-SMC.
  • In the case of C-SMC, the fatigue strength was evaluated for two different width and edge conditions. Comparing the fatigue strengths for two different width cases, Cut-35 presented 90 MPa for the fatigue limit while Cut-100 presented 88.7 MPa. Regarding the width effect, there was no significant effect on the fatigue strength of C-SMC. As a result of the assessment of the edge conditions, the In-mold condition presented 74.5 MPa for the fatigue limit. Regarding the edge effect, flat-plate machined cases exhibited 21% higher fatigue strengths than molded C-SMCs.
  • To assess the proper failure criterion for C-SMC, the stiffness drop criteria were employed in this study. In the case of C-SMC, the fatigue life of C-SMC reached 95% of the fracture life at the 10% stiffness drop point. In this regard, it is considered reasonable to determine the final fatigue life of C-SMC at the 10% stiffness drop. In the case of CFRP, there was no significant stiffness drop. Therefore, the final fatigue life should be considered at the final fracture.
  • In this study, a fatigue life estimation method was suggested based on the elastic modulus degradation. Validation for the suggested estimation was conducted via a comparison with the fatigue test result of the C-SMC-Cut-35 case. The fatigue life between the prediction and the experiment was calculated to be less than 3%. Therefore, making a fatigue life prediction of C-SMC by monitoring the elastic modulus degradation is a viable alternative in fatigue design to avoid time-consuming fatigue tests.

Author Contributions

Conceptualization, D.Y.K.; Data curation, Y.C.I. and D.Y.K.; Formal analysis, Y.C.I.; Funding acquisition, M.H.K.; Investigation, Y.C.I. and D.Y.K.; Methodology, D.Y.K.; Project administration, C.H.C. and M.H.K.; Resources, S.W.L., S.J.Y. and C.H.C.; Supervision, M.H.K.; Validation, Y.C.I., S.W.L., S.J.Y. and C.H.C.; Writing—original draft, Y.C.I.; Writing—review and editing, S.W.L. and M.H.K. All authors have read and agreed to the published version of the manuscript.

Funding

This work was supported by a National Research Foundation of Korea (NRF) grant funded by the Korea government (MSIT) through GCRC-SOP (no. 2011-0030013).

Institutional Review Board Statement

Not applicable.

Informed Consent Statement

Not applicable.

Conflicts of Interest

The authors declare no conflict of interest.

References

  1. Qiang, L.; Youngzhou, L.; Zhijian, Z.; Guangyoung, S.; Qing, L. Lightweight design of carbon twill weave fabric composite body structure for electric vehicle. Compos. Struct. 2013, 97, 231–238. [Google Scholar] [CrossRef]
  2. Salkind, M.J. Fatigue of Composite. In Composite Materials: Testing and Design (Second Conference); Corten, H., Ed.; ASTM International: West Conshohocken, PA, USA, 1972; pp. 143–169. [Google Scholar]
  3. Wang, S.S.; Chim, S.M. Fatigue damage and degradation in random short-fiber SMC composite. J. Comp. Mater. 1983, 17, 114–134. [Google Scholar] [CrossRef]
  4. Stefan, S.; Susanne, N.; Martin, S. Fatigue behavior of discontinuous carbon-fibre reinforced specimens and structural parts. Int. J. Fatigue 2020, 131, 105289. [Google Scholar] [CrossRef]
  5. Lin, Y. On Fatigue Damage Accumulation and Material Degradation in Composite Materials. Compos. Sci. Technol. 1989, 36, 339–350. [Google Scholar] [CrossRef]
  6. Denton, D.L. Mechanical Properties Characterization of an SMC-R50 Composite. SAE Int. 1979, 88, 2238–2294. [Google Scholar] [CrossRef]
  7. Jamal, E.; Francols, T.; Raymond, G. Review of Failure Criteria of Fibrous Composite Materials. Polym. Compos. 1996, 17, 786–798. [Google Scholar] [CrossRef]
  8. Haibin, T.; Zhangxing, C.; Guowei, Z.; Xuze, S.; Yang, L.; Li, H.; Haiding, G.; Hongtae, K.; Danielle, Z.; Carlos, E.P.; et al. Effect of Fiber Orientation Distribution on Constant Fatigue Life Diagram of Chopped Carbon Fiber Chip-Reinforced Sheet Molding Compound (SMC) Composite. Int. J. Fatigue 2019, 125, 394–405. [Google Scholar] [CrossRef] [Green Version]
  9. Fleckenstein, J.; Jaschek, K.; Buter, A.; Stoess, N. Fatigue design optimization of safety components made of SMC. Procedia Eng. 2011, 10, 390–396. [Google Scholar] [CrossRef]
  10. Fathollah, T.B.; Shokrieh, M.M.; Lessard, L.B. Residual stiffness in cross-ply laminates subjected to cyclic loading. Compos. Struct. 2008, 85, 205–212. [Google Scholar] [CrossRef]
  11. Hwang, W.; Han, K.S. Fatigue of Composites- Fatigue Modulus Concept and Life Prediction. J. Compos. Mater. 1986, 20, 154–165. [Google Scholar] [CrossRef]
  12. Hwang, W.; Han, K.S. Cumulative damage models and multi-stress fatigue life prediction. J. Compos. Mater. 1986, 20, 125–153. [Google Scholar] [CrossRef]
  13. Whitworth, H.A. Modeling Stiffness Reduction of Graphite/Epoxy Composite Laminates. J. Compos. Mater. 1987, 21, 362–372. [Google Scholar] [CrossRef]
  14. Yang, J.N.; Jones, D.L.; Yang, S.H.; Meskini, A. A Stiffness Degradation Model for Graphite/Epoxy Laminates. J. Compos. Mater. 1990, 24, 753–769. [Google Scholar] [CrossRef]
  15. Brondsted, P.; Lilholt, H.; Anderson, S.I. Fatigue damage prediction by measurements of the stiffness degradation in polymer matrix composites. In Proceedings of the 8th International Spring Meeting of ICFC, Paris, France, 3–5 June 1997. [Google Scholar]
  16. Shokrieh, M.M.; Lessard, L.B. Multiaxial fatigue behavior of unidirectional plies based on uniaxial fatigue experiments—I. Modelling. Int. J. Fatigue 1997, 19, 201–207. [Google Scholar] [CrossRef]
  17. Shokrieh, M.M.; Lessard, L.B. Multiaxial fatigue behavior of unidirectional plies based on uniaxial fatigue experiments—II. Exp. Int. J. Fatigue 1997, 19, 209–217. [Google Scholar] [CrossRef]
  18. Shokieh, M.M.; Zakeri, M. Generalized Technique for Cumulative Damage Modeling of Composite Laminates. J. Compos. Mater. 2007, 41, 2643–2656. [Google Scholar] [CrossRef]
  19. Jain, A.; Paepegem, W.V.; Verpoest, I.; Lonov, S.V. A statistical treatment of the loss of stiffness during cyclic loading for short fiber reinforced injection molded composites. Compos. Part B Eng. 2016, 103, 40–50. [Google Scholar] [CrossRef] [Green Version]
  20. Tamboura, S.; Laribi, M.A.; Fitoussi, J.; Shirinbayan, M.; Bi, R.T.; Tcharkhtchi, A.; Dali, H.B. Damage and fatigue life prediction of short fiber reinforced composites submitted to variable temperature loading: Application to Sheet Molding Compound composites. Int. J. Fatigue 2020, 138, 105676. [Google Scholar] [CrossRef]
  21. ASTM D3039. Standard Test methods for Tensile Properties of Polymer Matrix Composite Materials. In Annual Book of ASTM Standards; ASTM International: Baltimore, MD, USA, 2007. [Google Scholar]
  22. ASTM D3479. Standard Test methods for Tension-Tension Fatigue of Polymer Matrix Composite Materials. In Annual Book of ASTM Standards; ASTM International: Baltimore, MD, USA, 2007. [Google Scholar]
  23. Thomas, J.; Catherine, P.; Fabien, L. Damage of composite materials. Procedia Eng. 2013, 66, 746–758. [Google Scholar] [CrossRef] [Green Version]
  24. Shiri, S.; Yazdani, M.; Mohammad, P.M. A fatigue damage accumulation model based on stiffness degradation of composite materials. Mater. Des. 2015, 88, 1290–1295. [Google Scholar] [CrossRef]
  25. Campbell, F.C. Structural Composite Materials; ASTM International: St. Louis, MI, USA, 2010; ISBN 978-1-61503-037-8. [Google Scholar]
  26. Jeong, N.E.; Cho, D.H. Effect of Prepreg Angle-Ply on the Dynamic, Mechanical, Tensile, Flexural, and Impact Properties of Non-Crimp Carbon Fiber Fabric/Epoxy Composites. Polym. Soc. Korea 2020, 44, 61–69. [Google Scholar] [CrossRef]
  27. Martulli, L.M.; Muyshondt, L.; Kerschbaum, M.; Pimenta, S.; Lomov, S.V.; Swolfs, Y. Carbon fibre sheet moulding compounds with high in mould flow: Linking morphology to tensile and compressive properties. Compos. Part A 2019, 126, 105600. [Google Scholar] [CrossRef]
Figure 1. Test specimens for the fatigue and tensile test: (a) carbon sheet molding compound cut with a 35 mm width (C-SMC-Cut-35), (b) carbon sheet molding compound cut with a 100 mm width (C-SMC-Cut-100), (c) carbon sheet molding compound in mold (C-SMC-In-mold), (d) carbon-fiber-reinforced plastic (CFRP).
Jcs 05 00054 g001
Figure 2. Surface of test specimens magnified 50 times: (a) C-SMC and (b) CFRP.
Jcs 05 00054 g002
Figure 3. Schematic for the CFRP fiber orientation.
Jcs 05 00054 g003
Figure 4. Schematic fatigue behavior comparison between a metal and a composite [2].
Jcs 05 00054 g004
Figure 5. Stiffness change of a composite according to the number of cycles [2].
Jcs 05 00054 g005
Figure 6. Comparison between a composite and a metal based on cumulative damage [23].
Jcs 05 00054 g006
Figure 7. Change of elastic modulus in SMC composite subjected to different cyclic stresses during fatigue [3].
Jcs 05 00054 g007
Figure 8. The rate of change of homogeneous damage, d D d N , in the composite during tensile fatigue at different cyclic stress levels [3].
Jcs 05 00054 g008
Figure 9. Schematic of the fatigue damage evolution in composites [24].
Jcs 05 00054 g009
Figure 10. Stress–strain curves of the tensile test results: (a) C-SMC-Cut-35, (b) C-SMC-Cut-100, (c) C-SMC-In-mold, and (d) CFRP.
Jcs 05 00054 g010
Figure 11. IMT 8002 Servo hydraulic fatigue-testing machine.
Jcs 05 00054 g011
Figure 12. S–N curve with fatigue test result comparison between C-SMC-Cut-35 and C-SMC-In-mold.
Jcs 05 00054 g012
Figure 13. S–N curves for the fatigue test result comparison between C-SMC-Cut-100 and C-SMC-Cut-100.
Jcs 05 00054 g013
Figure 14. S-N curves of C-SMC and CFRP: (a) C-SMC, (b) CFRP.
Jcs 05 00054 g014
Figure 15. S–N curves of C-SMC in terms of the stiffness drop: (a) C-SMC-Cut-35, (b) C-SMC-Cut-100, (c) C-SMC-In-mold, and (d) comparison of the S–N curves on average.
Jcs 05 00054 g015
Figure 16. CFRP stiffness drop S–N curves.
Jcs 05 00054 g016
Figure 17. Stress–strain curve change of the elastic modulus.
Jcs 05 00054 g017
Figure 18. Confirmation of the crack initiation via visual observation during the fatigue test.
Jcs 05 00054 g018
Figure 19. Confirmation of the crack initiation using digital image correlation (DIC) during the fatigue test.
Jcs 05 00054 g019
Figure 20. Change in the elastic modulus of C-SMC-Cut-35 during the fatigue testing as a function of the number of cycles.
Jcs 05 00054 g020
Figure 21. Fracture trends: (a) the results of Martulli et al.’s study [27] and (b) the results of this study.
Jcs 05 00054 g021
Figure 22. SEM observation of C-SMC.
Jcs 05 00054 g022
Figure 23. The damage rate in C-SMC-Cut-35 as a function of the number of cycles.
Jcs 05 00054 g023
Figure 24. Validation of suggested damage model for C-SMC-Cut-35 in comparison to experiment.
Jcs 05 00054 g024
Figure 25. Prediction of the fatigue life for C-SMC-Cut-35 compared with the experiment.
Jcs 05 00054 g025
Table 1. Number of specimens required for each stress–number of cycles (S–N) curve [22].
Type of TestNumber of Test Specimens
Preliminary and exploratory6
Research and development testing of components and structures12
Design allowables data24
Reliability data24
Table 2. Tensile test conditions.
ClassificationCondition
Control modeDisplacement
TemperatureRoom temperature
Constant head speed1%
Gauge length 50 mm
Table 3. Tensile test results.
C-SMC-Cut-35C-SMC-Cut-100C-SMC-In-MoldCFRP
No. of CaseElastic Modulus (GPa)Tensile Strength (MPa)Elastic Modulus (GPa)Tensile Strength (MPa)Elastic Modulus (GPa)Tensile Strength (MPa)Elastic Modulus (GPa)Tensile Strength (MPa)
Case129.920632.4233.428201.750.8676.8
Case228.117926.4200.636.719259.5710.3
Case329.221530.6207.72315955.9658.4
Case4--28193.9--57.3711.4
Case5--26.6216.3--58671.7
Case6--26.4217.6--54.8626.3
Average2920028.4211.629.3184.356.1675.8
Table 4. Changes in elastic modulus as a function of the number of cycles.
StressN(Cycles)E(GPa)
55% σ TS 10014.8
100014.6
500014.3
10,00014.1
15,00013.9
22,00013.4
Publisher’s Note: MDPI stays neutral with regard to jurisdictional claims in published maps and institutional affiliations.