Next, we discuss two possible hypotheses related to the electrical conductivity increase in EVA/GNP composites under the applied electric field. First, we discuss whether GNPs could become aligned under the electric field, which leads to the increase in bulk electrical conductivity increase. Next, we discuss the effect of localized electrical treeing formation during dielectric breakdown could induce an increase in electrical conductivity.
4.1. GNP Alignment-Induced Conductivity Increase
Small particles such as GNPs can be aligned under an electric field via dielectrophoresis. In order to evaluate whether an individual GNP aligned under our experimental conditions, we applied the model proposed by Wu et al. [
11]. We modeled EVA/GNP composite as a dielectric matrix with conductive solid inclusions. The application of a sinusoidal alternating electric field can result in both rotational and translational movement to an individual GNP nanosheet. Assume that an individual GNP sheet is initially oriented at angle
relative to the electric field and placed at distance
from another GNP sheet. In response to the field, this GNP sheet first requires a rotation time (
) to be fully aligned within 1° with the field direction:
Once it becomes aligned with the field, it requires additional translation time (
) to form an end-to-end connection with the adjacent GNP sheet, which can be estimated as follows:
The detailed derivations of these equations can be found in [
11]. The following values relevant to our EVA/GNP system were used in our calculations:
and
refer to the lateral dimension (~1 µm) and thickness (~1 nm) of individual GNP sheets, respectively. The melt viscosity of the EVA matrix at 160 °C was
= 450 Pa·s (experimentally measured with ARES-2 rheometer);
= 400 V
rms/mm is the strength of the electric field;
is the dielectric constant of the EVA matrix (experimentally measured using the dielectric rheology accessory at processing temperature);
is the translational friction coefficient of GNP given as follows [
18]:
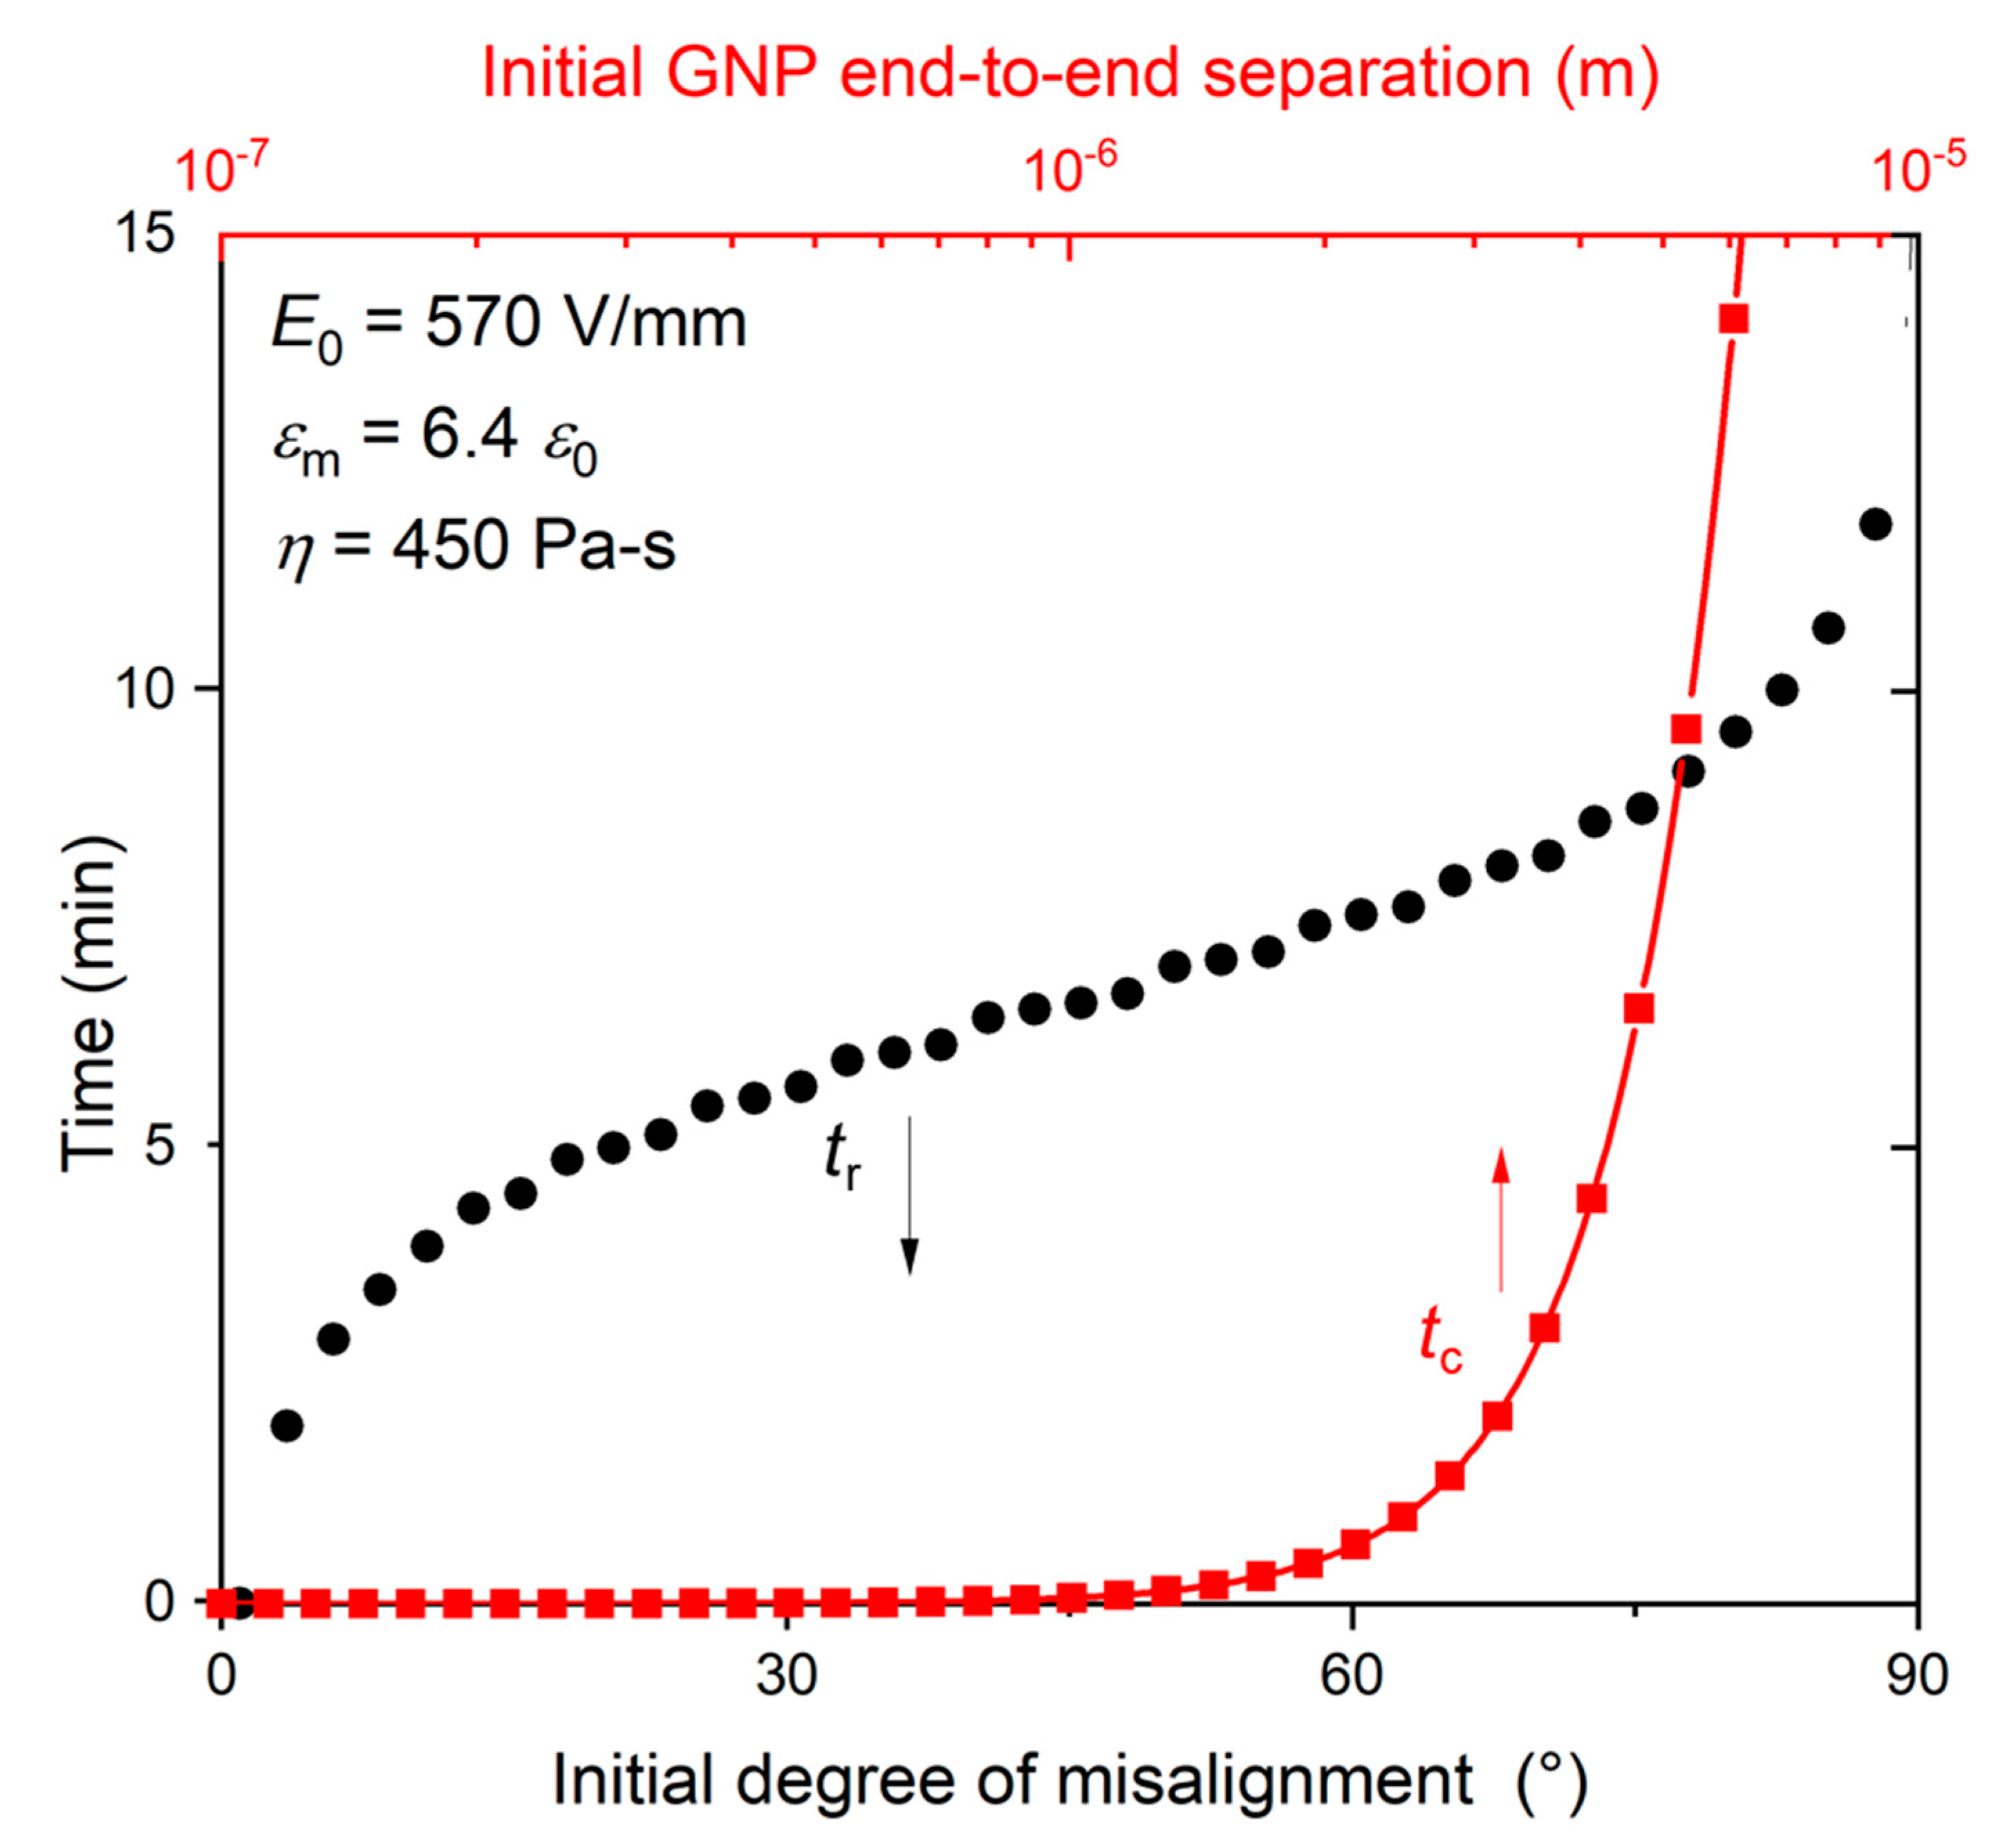
Our calculation shows that commanding 5 min of 400 V
rms/mm was sufficient to align GNP sheets within 15° of the electric field direction (
Figure 6). Once GNPs became aligned, end-to-end connection of two adjacent sheets that were separated by a few micrometers was formed within seconds, which leads to the formation of a conducting network in the field direction (
Figure 6).
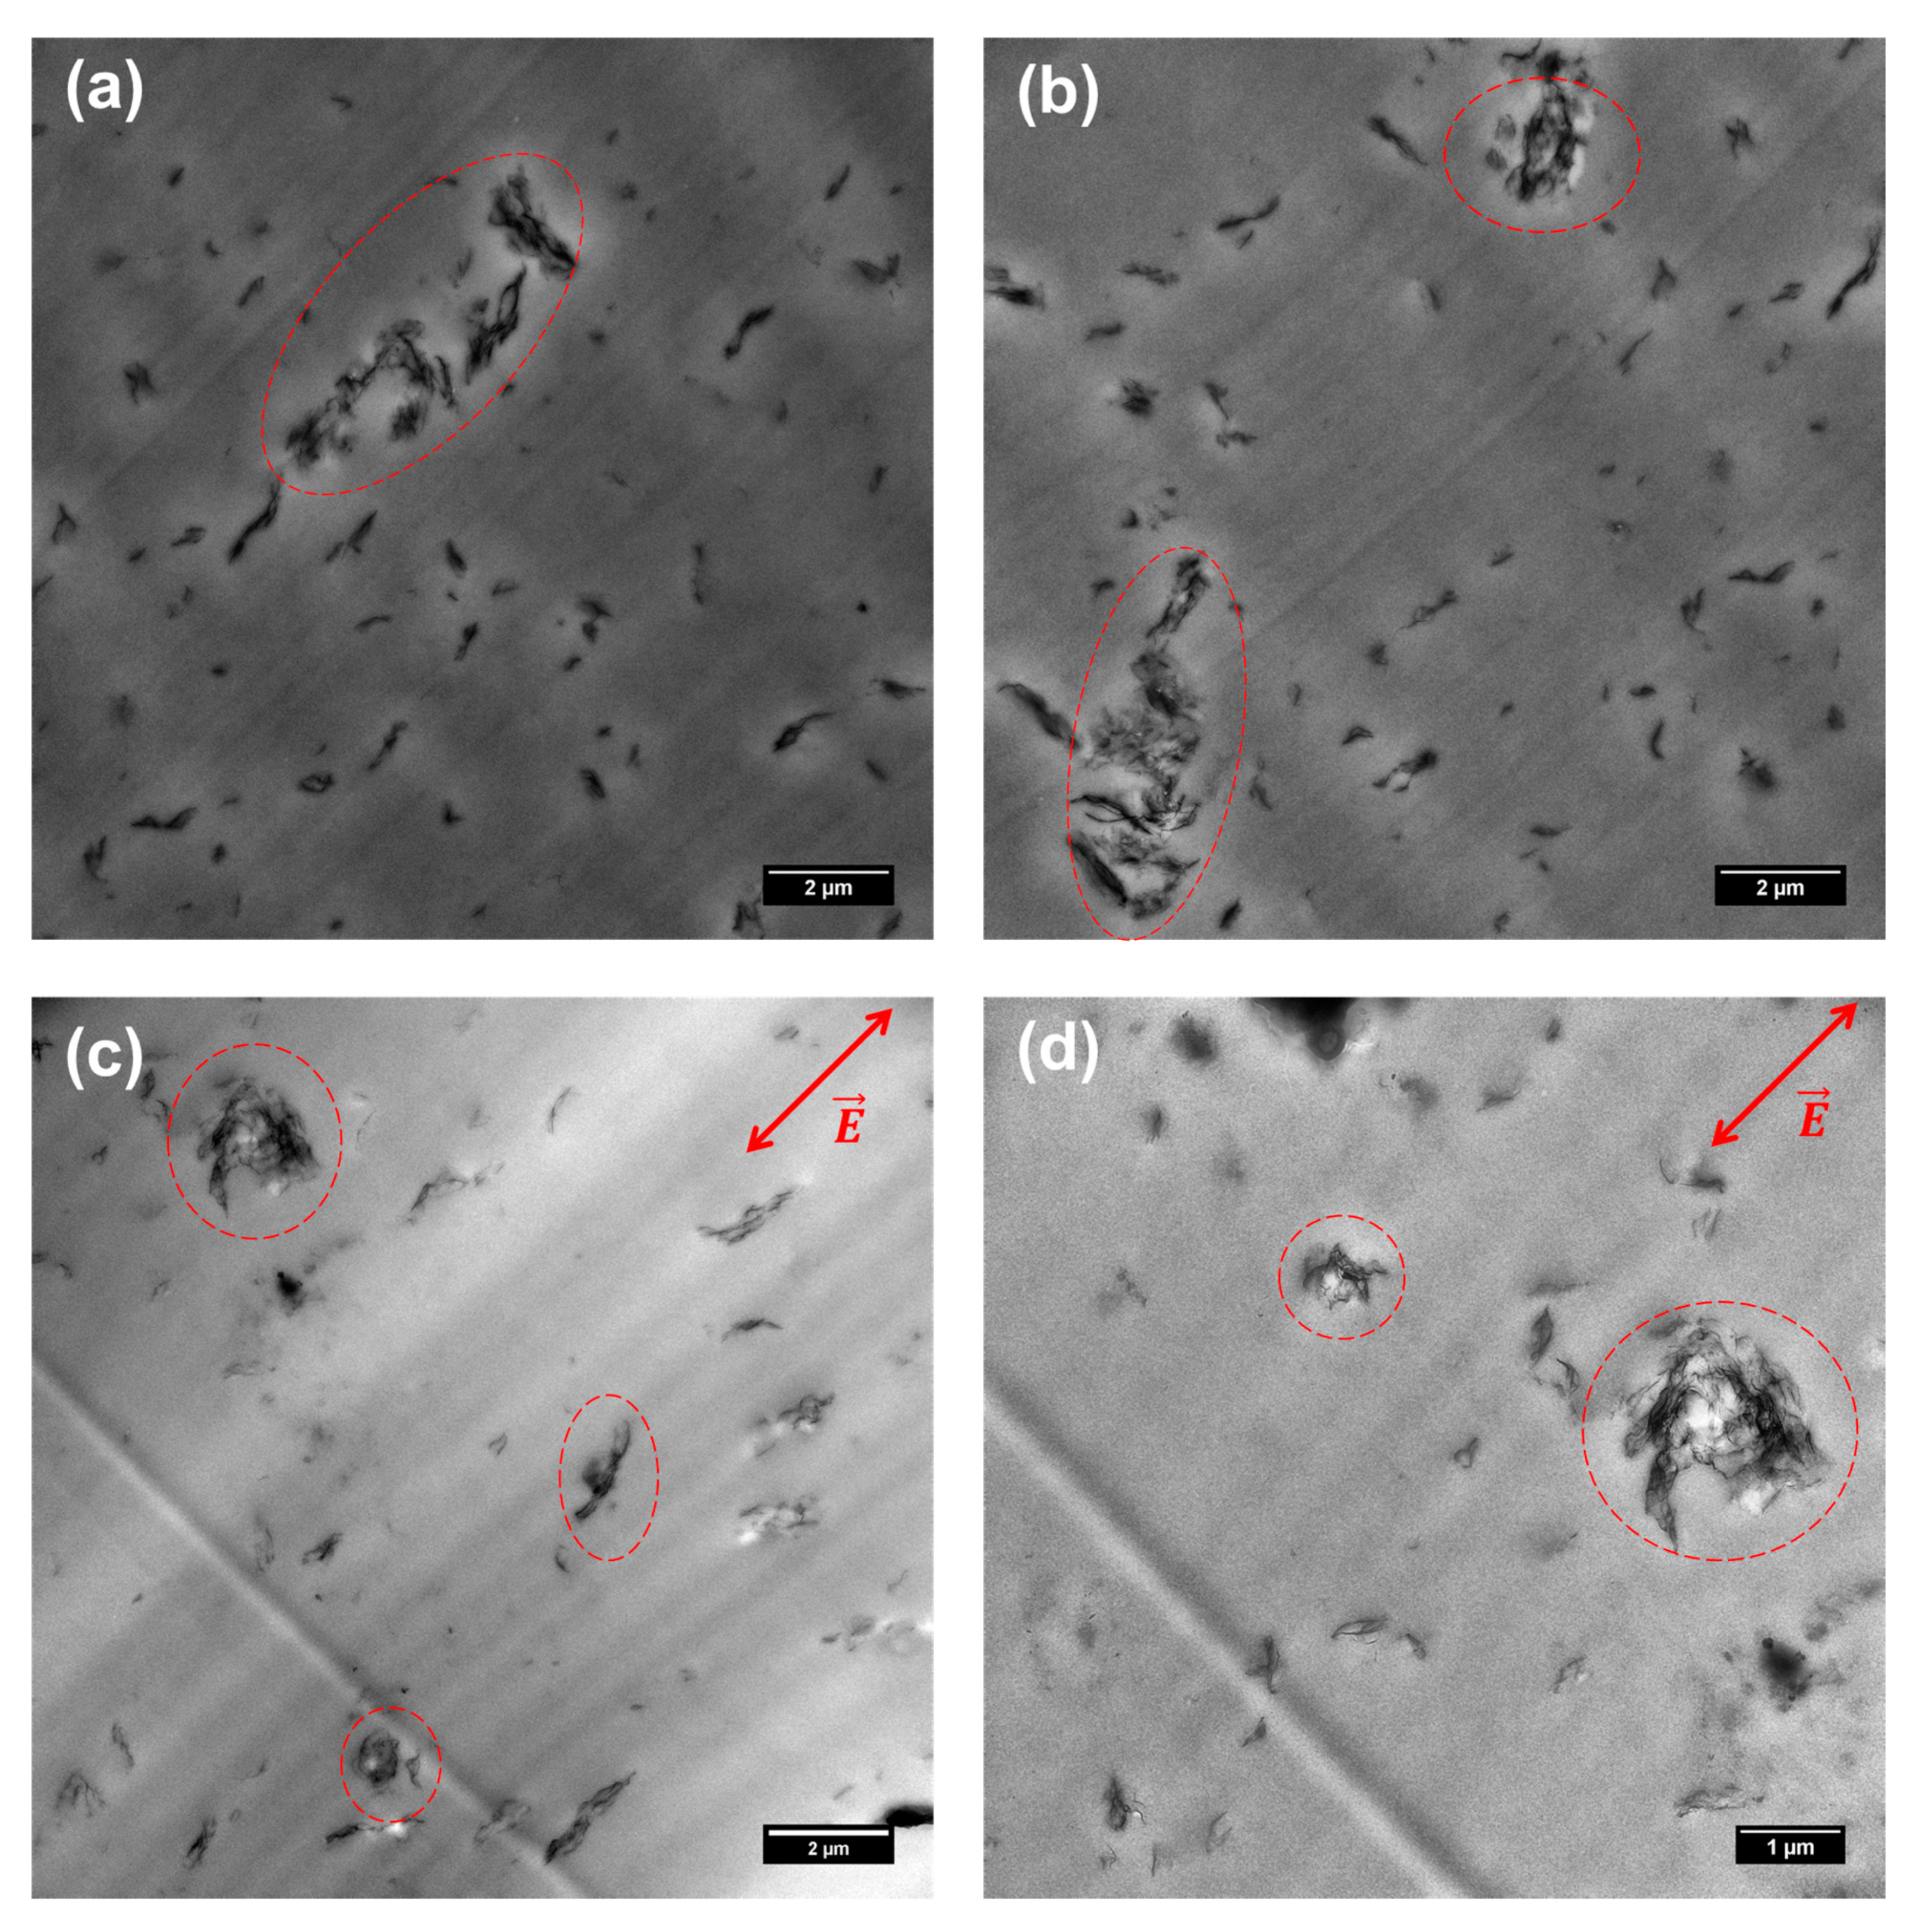
However, TEM results in
Figure 5 show that applying the electric field to the EVA/GNP melt did not result in global GNPs alignment. Contrary to the model that assumes a single GNP sheet in the polymer matrix, GNPs in the composite were local agglomerates (highlighted as dashed circles). Even though blends were prepared by extensive probe sonication and solution blending, GNPs were not fully exfoliated due to the strong π–π interactions between sheets. Therefore, the Wu model that describes individual graphene alignment under the electric field does not adequately describe the present system. The strong interparticle interaction causes GNP agglomeration, which reduces the polymer/particle interfacial volume and reduces the particles’ ability to improve the composites’ dielectric properties. Modifying nanoparticle–polymer interaction can lead to changes in the final composites’ material properties, such as rheology, mechanical properties, particle dispersibility, and dielectric strength [
19,
20,
21,
22]. Increased particle-polymer interaction changes both the polymer morphology and local charge distribution at the polymer-nanoparticle interface, thereby improving the composites’ dielectric properties. Siddabattuni et al. demonstrated that the dielectric constants of TiO
2/epoxy composites can be controlled by modifying TiO
2 surfaces with self-assembled monolayer organophosphate ligands with different chemical functionalities [
22]. However, the chemical functionalization of neat graphene sheets is difficult due to the strong sp
2 hybridization of carbon structure and can lead to the decreased electrical conductivity of graphene nanoparticles.
We performed statistical analysis on the TEM images of EVA/GNP blends after electric field application (
Figure 5c,d) on the orientation of the GNP sheets, but found no correlation between GNP orientation and electric field direction. After electric field application, we extracted the orientation angle of each individual GNP sheet (total number of sheets was ~150) within a single TEM image. The standard deviation of the orientation angle was ±52° relative to the mean angle of orientation, suggesting that the sheets were still randomly oriented over a wide distribution. Additionally, the mean angle of GNP orientation was ~40° different from the electric field direction. This evidence suggests that the electric field had a much weaker effect on inducing the alignment of GNP aggregates than that of individual GNP sheets. Therefore, the effect of electric field on the composite was localized. Since TEM imaging only provides a limited field of view (on the order of ~10 µm
2) whereas the cross-sectional area of the test specimen is ~8 mm
2, it is possible that the actual conductive pathway induced by electric field application occurred in a different area. Nevertheless, should the electric field induce global effects on the composite such as graphene orientation, these effects would be observed throughout the composite regardless of the specific area being examined.
4.2. Dielectric Breakdown Induced Conductivity Increase
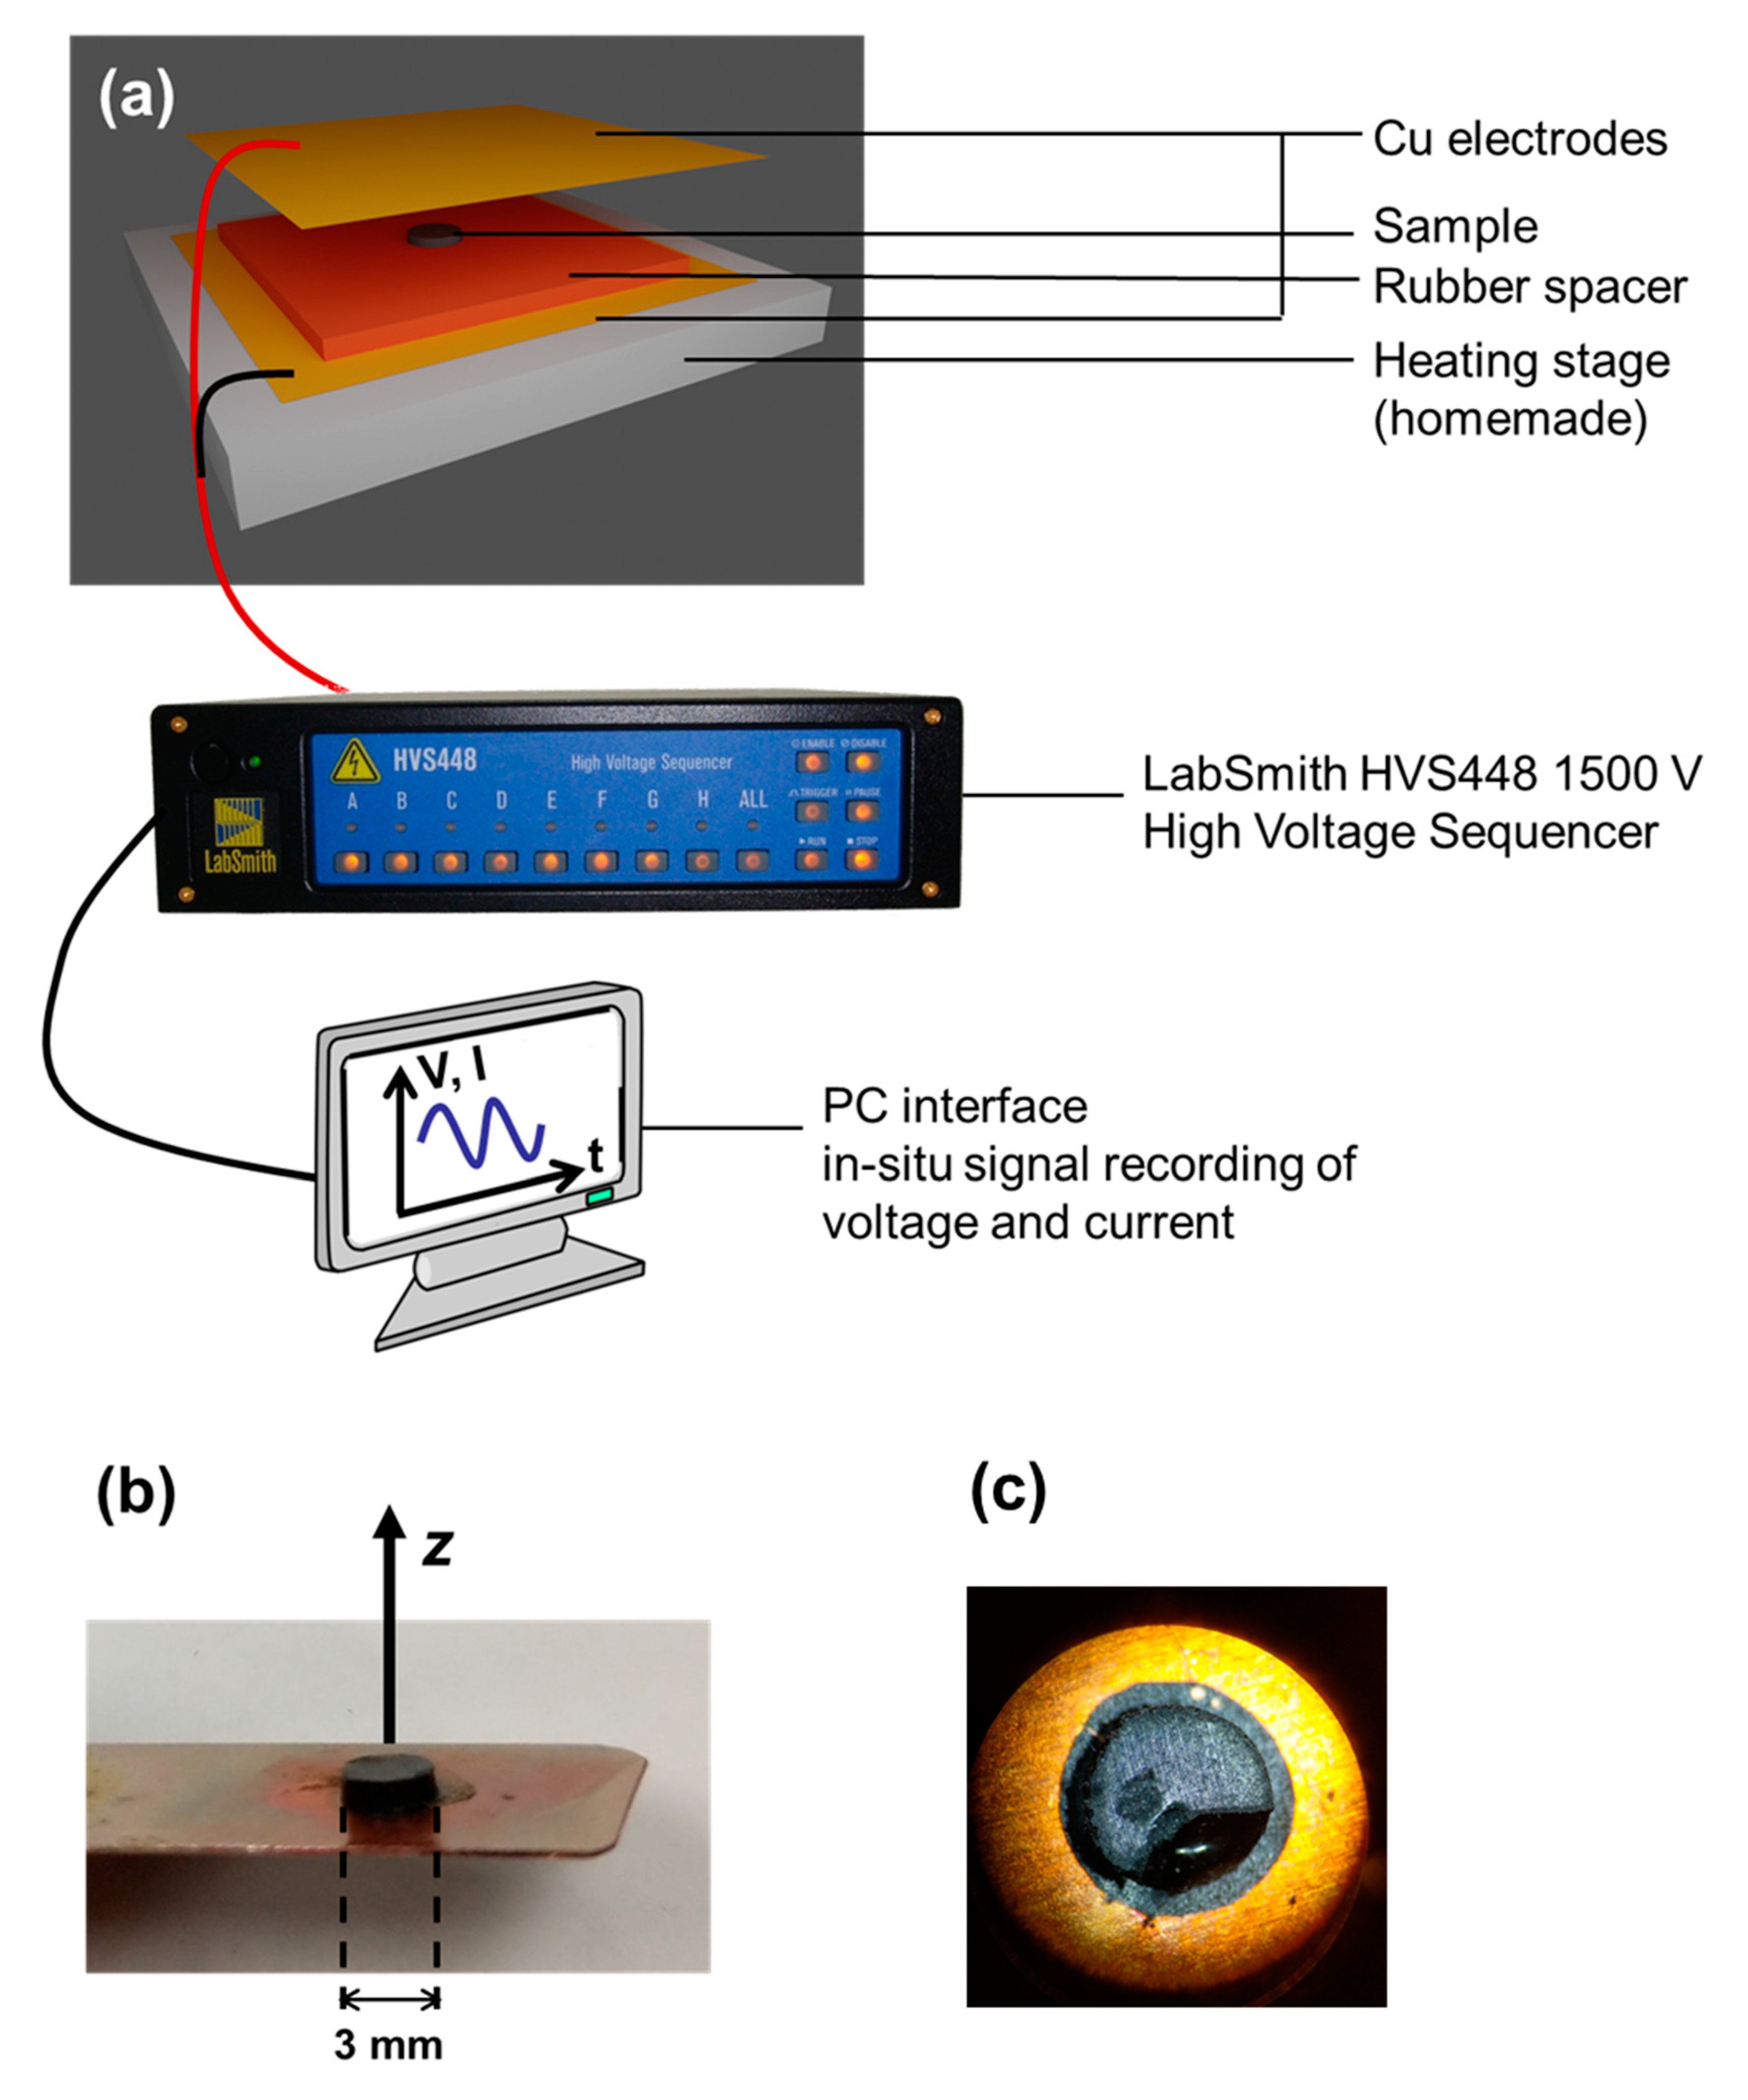
Another hypothesis that explains the observed increase in electrical conductivity during electric field application is due to the samples’ dielectric breakdown. When the sample was removed from the electrodes after reaching the maximal allowed current from the sequencer, a cavity was found towards the edge of nearly all our samples (
Figure 1c). Additionally, upon reaching the maximum allowable current, smoke would emit from the sample. The smoke indicated that the polymeric composite underwent electrical and thermal degradation, which ultimately caused soot particles to be formed [
23]. These observations suggest dielectric breakdown of the sample occurred due to the electric field.
The dielectric breakdown of polymers by tree propagation due to an external electric field can be described in three stages [
24]. First, tree inception occurs from a point of a high local electric field near the electrode. This process is usually enhanced by the presence of local defects in the composite, such as cavities in the dielectric medium, the presence of conductive fillers near the surface, roughness of the contacting electrode, and partial discharge activities [
3,
25]. Second, tree growth is initiated by the partial discharge of polymer surface that leads to surface erosion and decrease in material thickness. The loss of material could come from a number of processes related to electric field applications, such as direct ion bombardment, localized heating due to gases generated by the degradation of polymers to CO
2, and excitation and oxidation of surface molecules [
4]. Eventually, electric-field-induced surface erosion creates small channels that penetrate the polymer matrix, forming the first conductive bridge across the two electrodes [
25]. Third, as a conductive pathway is formed between the two electrodes, small and branched channels are widened. Electrical conductivity continues to increase until dielectric breakdown. The early stages of electrical treeing and channel growth are often modeled as a stochastic process that is proportional to the electric field strength [
20,
26].
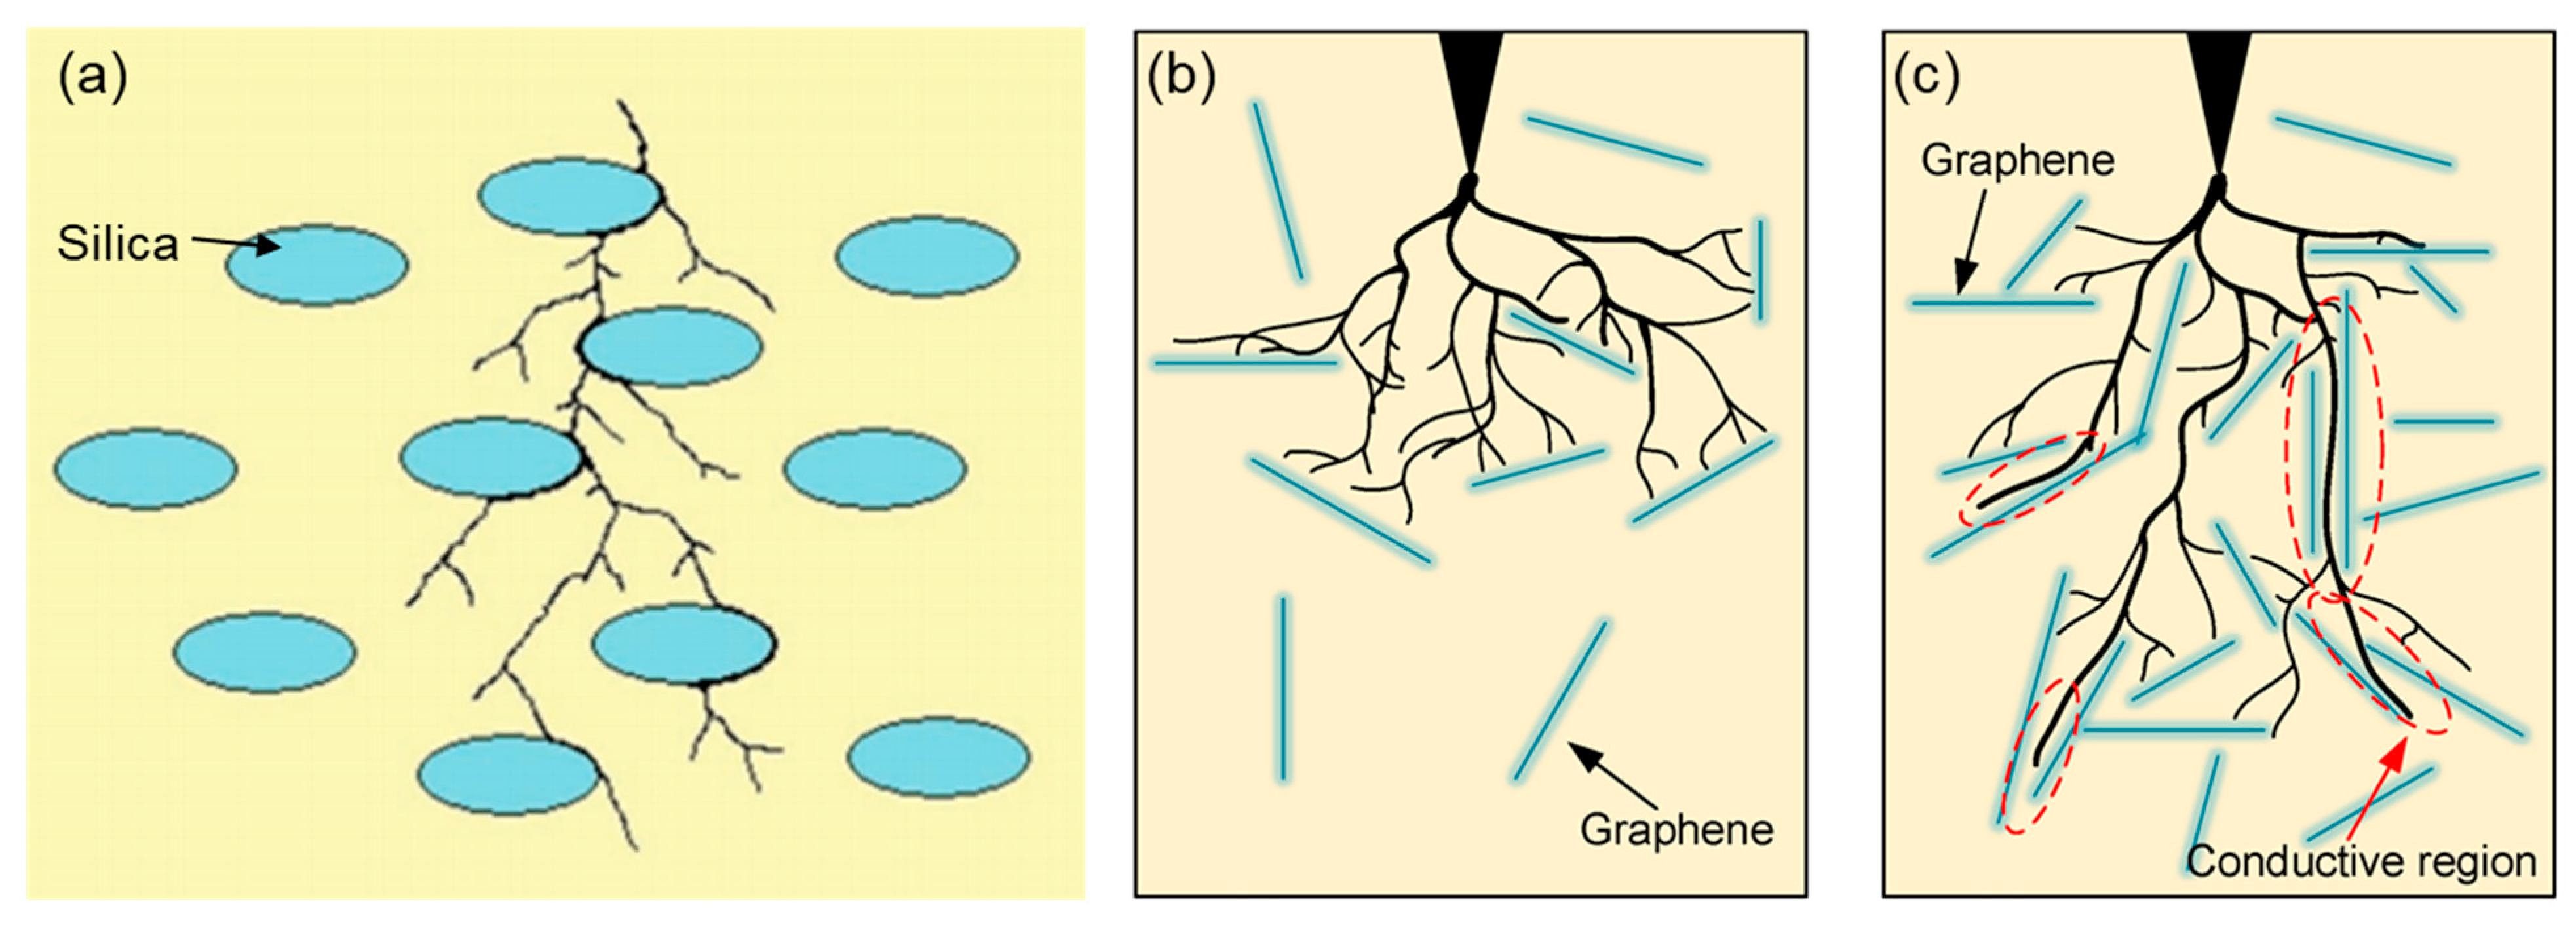
Nonetheless, electrical treeing at high field strengths can be deterred by adding well-dispersed insulating inorganic particles (e.g., silica, titanium dioxide, aluminum oxide, silicon carbide) into the polymer matrix. This enhances the dielectric strength of the host polymer, creating functional materials for high-voltage insulation (>10
3 V/mm) applications. When insulating nanoparticles are well-dispersed in a polymer matrix, the large interfacial area between the particle and the host matrix and the small interparticle distance both provide physical barriers that impede the flow of electric current between two electrodes (
Figure 7a). For conductive fillers, Han et al. found that their dispersion state strongly affects the rate of electrical treeing in polymer nanocomposites [
27]. In graphene/silicone rubber systems, a small amount (~0.005 wt %) of well-dispersed GNPs can act as physical barriers that inhibit electrical treeing. During tree growth, the channels align and grow preferentially along the polymer/graphene interface, creating a “bush tree” pattern that propagates slowly within the matrix (
Figure 7b). On the other hand, poorly dispersed GNPs at higher concentrations can create local highly conductive regions with reduced particle distances within clusters and dielectric strengths. In turn, tree channels propagate through these regions rapidly, causing lower degradation resistance and faster dielectric breakdown (
Figure 7c). While the EVA/GNP blends used in this study were prepared by probe sonication and solution blending, local areas of GNP aggregates are still readily found throughout the blend (
Figure 5). Hence, regions within the blend that contain clustered GNP agglomerates likely contribute to the electric treeing and dielectric breakdown of the composite under electric field application. Since the electrical treeing phenomenon is localized and occurs at a random location within the bulk sample, it is difficult to utilize imaging techniques such as TEM to directly observe treeing.
4.3. Parameters That Could Influence Dielectric Breakdown under Electric Field
We lastly measured the evolution of electrical conductivity as a function of time when EVA/GNP composites were subject to an applied electric field up to the point of dielectric breakdown. We systematically varied electric field strength (
Figure 4a), matrix viscosity (
Figure 4b), or GNP concentration (
Figure 4c) in order to understand factors that could influence the rate of dielectric breakdown within these composites.
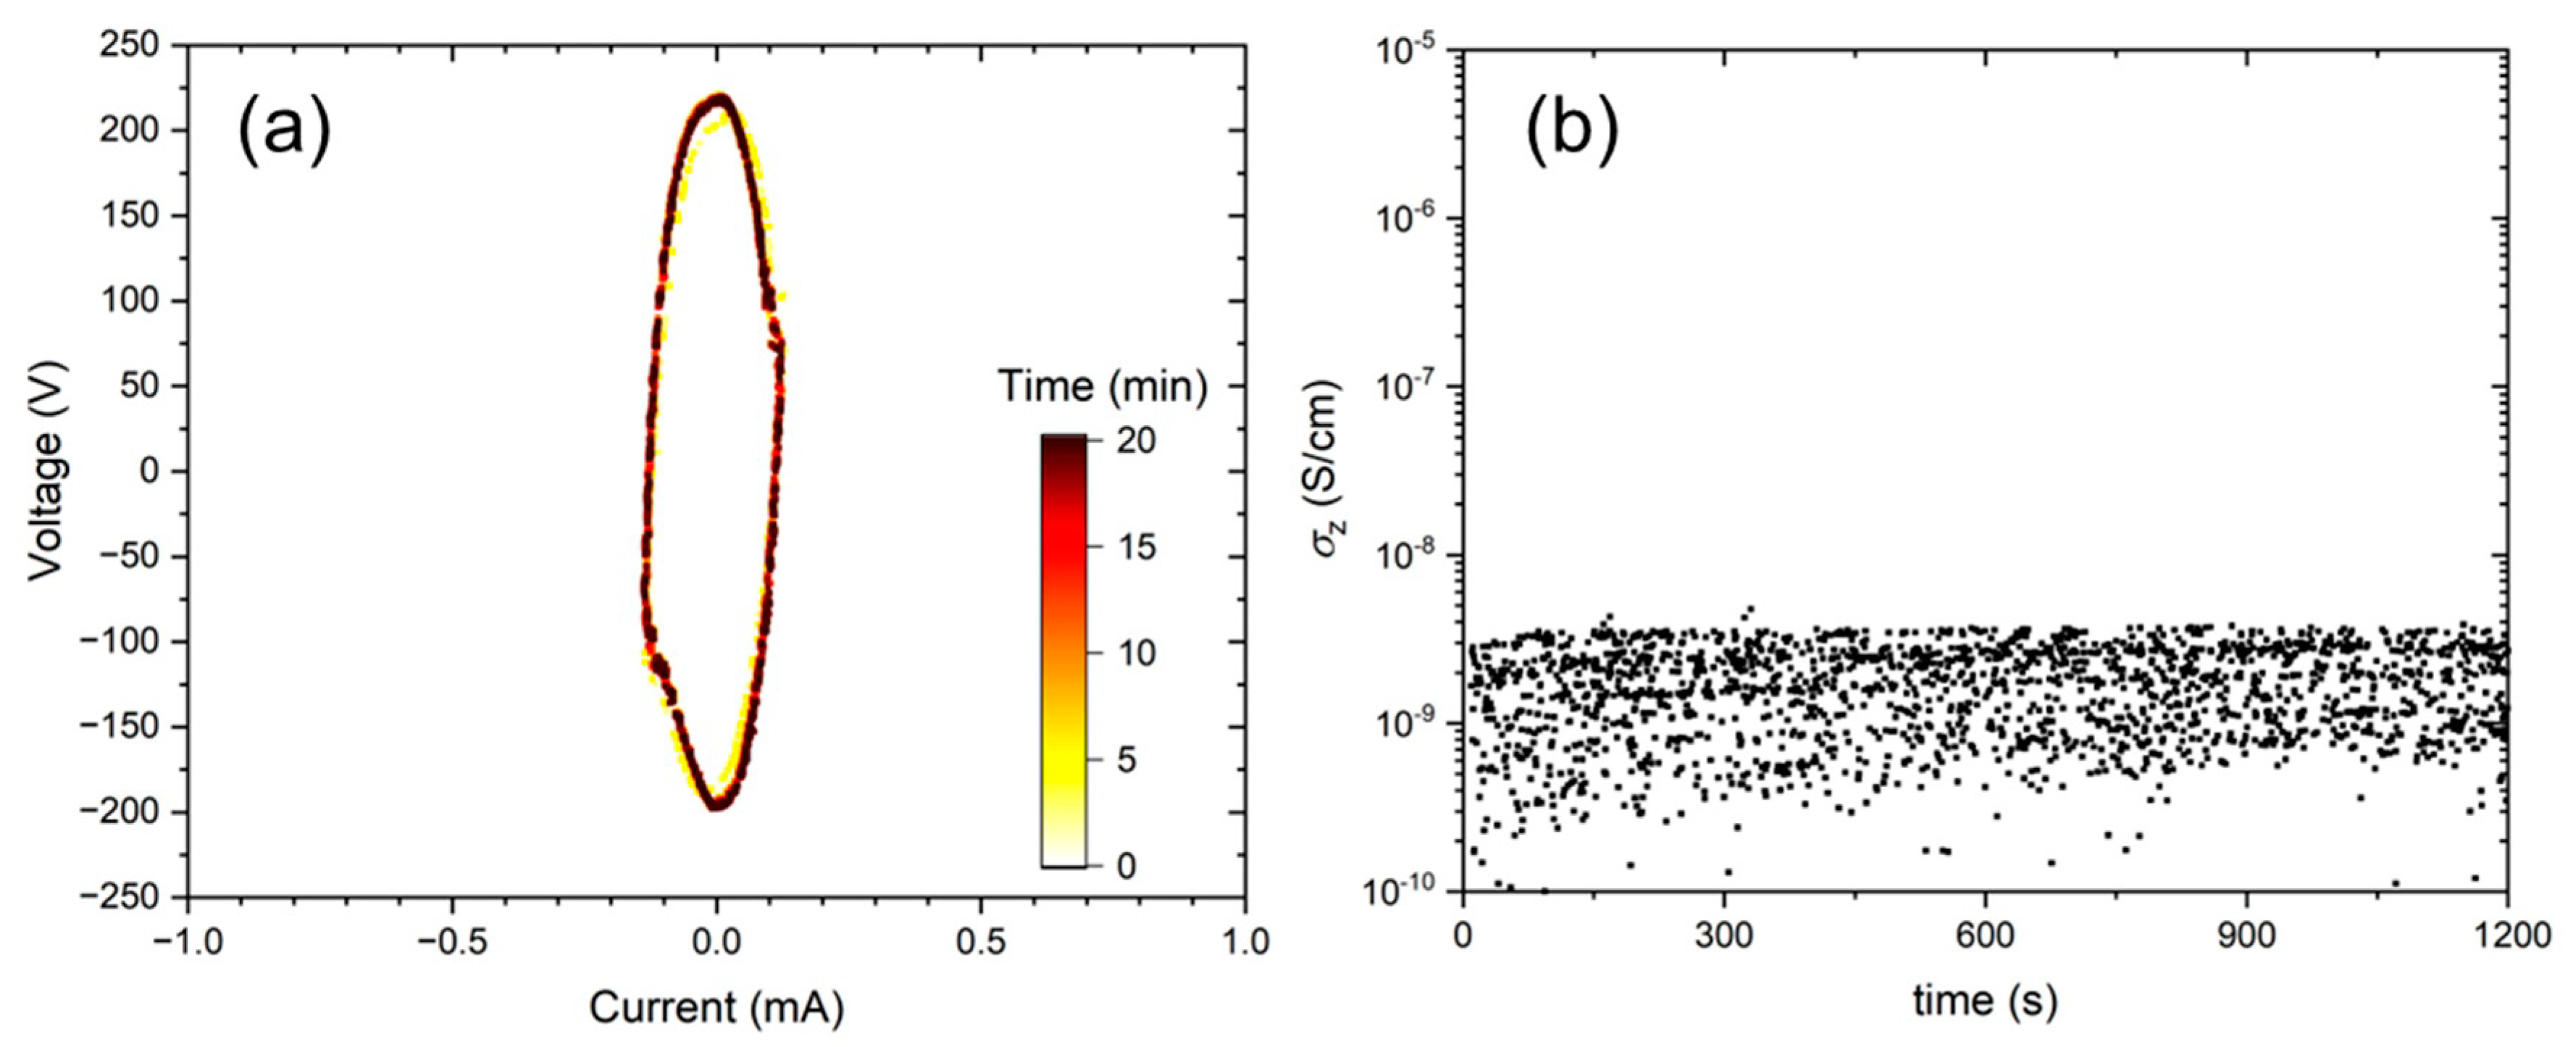
The growth in electrical conductivity of EVA/GNP composites under the external electric field undergoes three stages. Initially, the sample conductivity is low because the GNP concentrations of all samples were well below the percolation threshold in EVA (~0.6 wt %). Thus, the current signal was below the resolution of the high voltage sequencer (~10 µA, corresponding to ~2 × 10
−8 S/cm). Next, as the electric field induced the rotation and translation of individual GNP sheets, there was a sharp insulator to conductor transition. Lastly, the current growth appeared to be self-limiting upon nearing the current limit of the sequencer (~1 mA, corresponding to ~3 × 10
−6 S/cm). At that stage, electric treeing had presumably already created a conductive pathway across the specimen thickness and dielectric breakdown is occurring. Here, we implement a simple logistic model to describe the progressive dielectric; similar models were used to describe the breakdown of metal-oxide semiconductors [
28]. The simple three-parameter logistic growth model of the composite’s electrical conductivity
is constructed as follows:
where
is maximal conductivity prior to dielectric breakdown,
is the critical time when the rate of conductivity increase is the highest, and
is the characteristic duration for which the conductivity grew from
to
[
28]. Fitting results are summarized in
Table 1. Overall, the logistic model provides an adequate fit to the electrical conductivity growth of EVA/GNP composites, especially after the onset of the sharp increase in the electrical conductivity. During the early stage of electric field application, the measured electrical conductivity is subject to higher variability and uncertainty. Possible reasons include sample-to-sample variability such as sample surface roughness and defects, and imperfect contact with the Cu electrode. These factors could all affect the probability of tree inception. Nonetheless, the simple logistic model offers important insights into the effects of field strength and filler concentration on the dielectric breakdown of polymer/graphene composites.
We could establish several general observations from our results. When GNP concentration was near or above the percolation threshold (~0.5 wt %), EVA/GNP underwent instantaneous runaway increase in electrical conductivity when the field was turned on. As these samples were instantaneously broken down, conductivity measurements could not be obtained. When the particle loading is above the percolation threshold, local conductive pathways already exist in the bulk sample. As such, electric treeing proceeds through the conductive regions with lower dielectric strengths and leads to early onset of dielectric breakdown. Additionally, , which is the ratio between the time of fastest conductivity growth and the characteristic duration falls within a narrow range of 4.1–4.3. In the subsequent discussion, we use parameter , the characteristic duration of conductivity growth, to describe the effect of the electric field leading towards the eventual dielectric breakdown of the composite. For the lowest concentration of the 0.05 wt % GNP sample, a slightly lower = 2.0 × 10⁻⁷ S/cm and higher 5.6 were found.
First, we study the effect of the electric field strength on the dielectric breakdown when GNP concentration was fixed at 0.25 wt %. According to
Table 1,
measured at
= 250 V
rms/mm was ~2.7 times the value compared to when
= 400 V
rms/mm. Even though direct evidence of GNP alignment was not observed in TEM, the characteristic duration of conductivity growth similarly scaled with both the rotation and translation time of individual GNP sheets under the electric field on the basis of Equations (2) and (3),
and
. Given the experiments were performed at the same temperature of 160 °C, the viscosity of the EVA is identical across all samples. Therefore, the individual particle rotation and translation time between the two datasets would be inversely proportional to the square of the electric field strength, i.e., [(250 V
rms/mm)/(400 V
rms/mm)]
−2 = 2.56 ≈ 2.7.
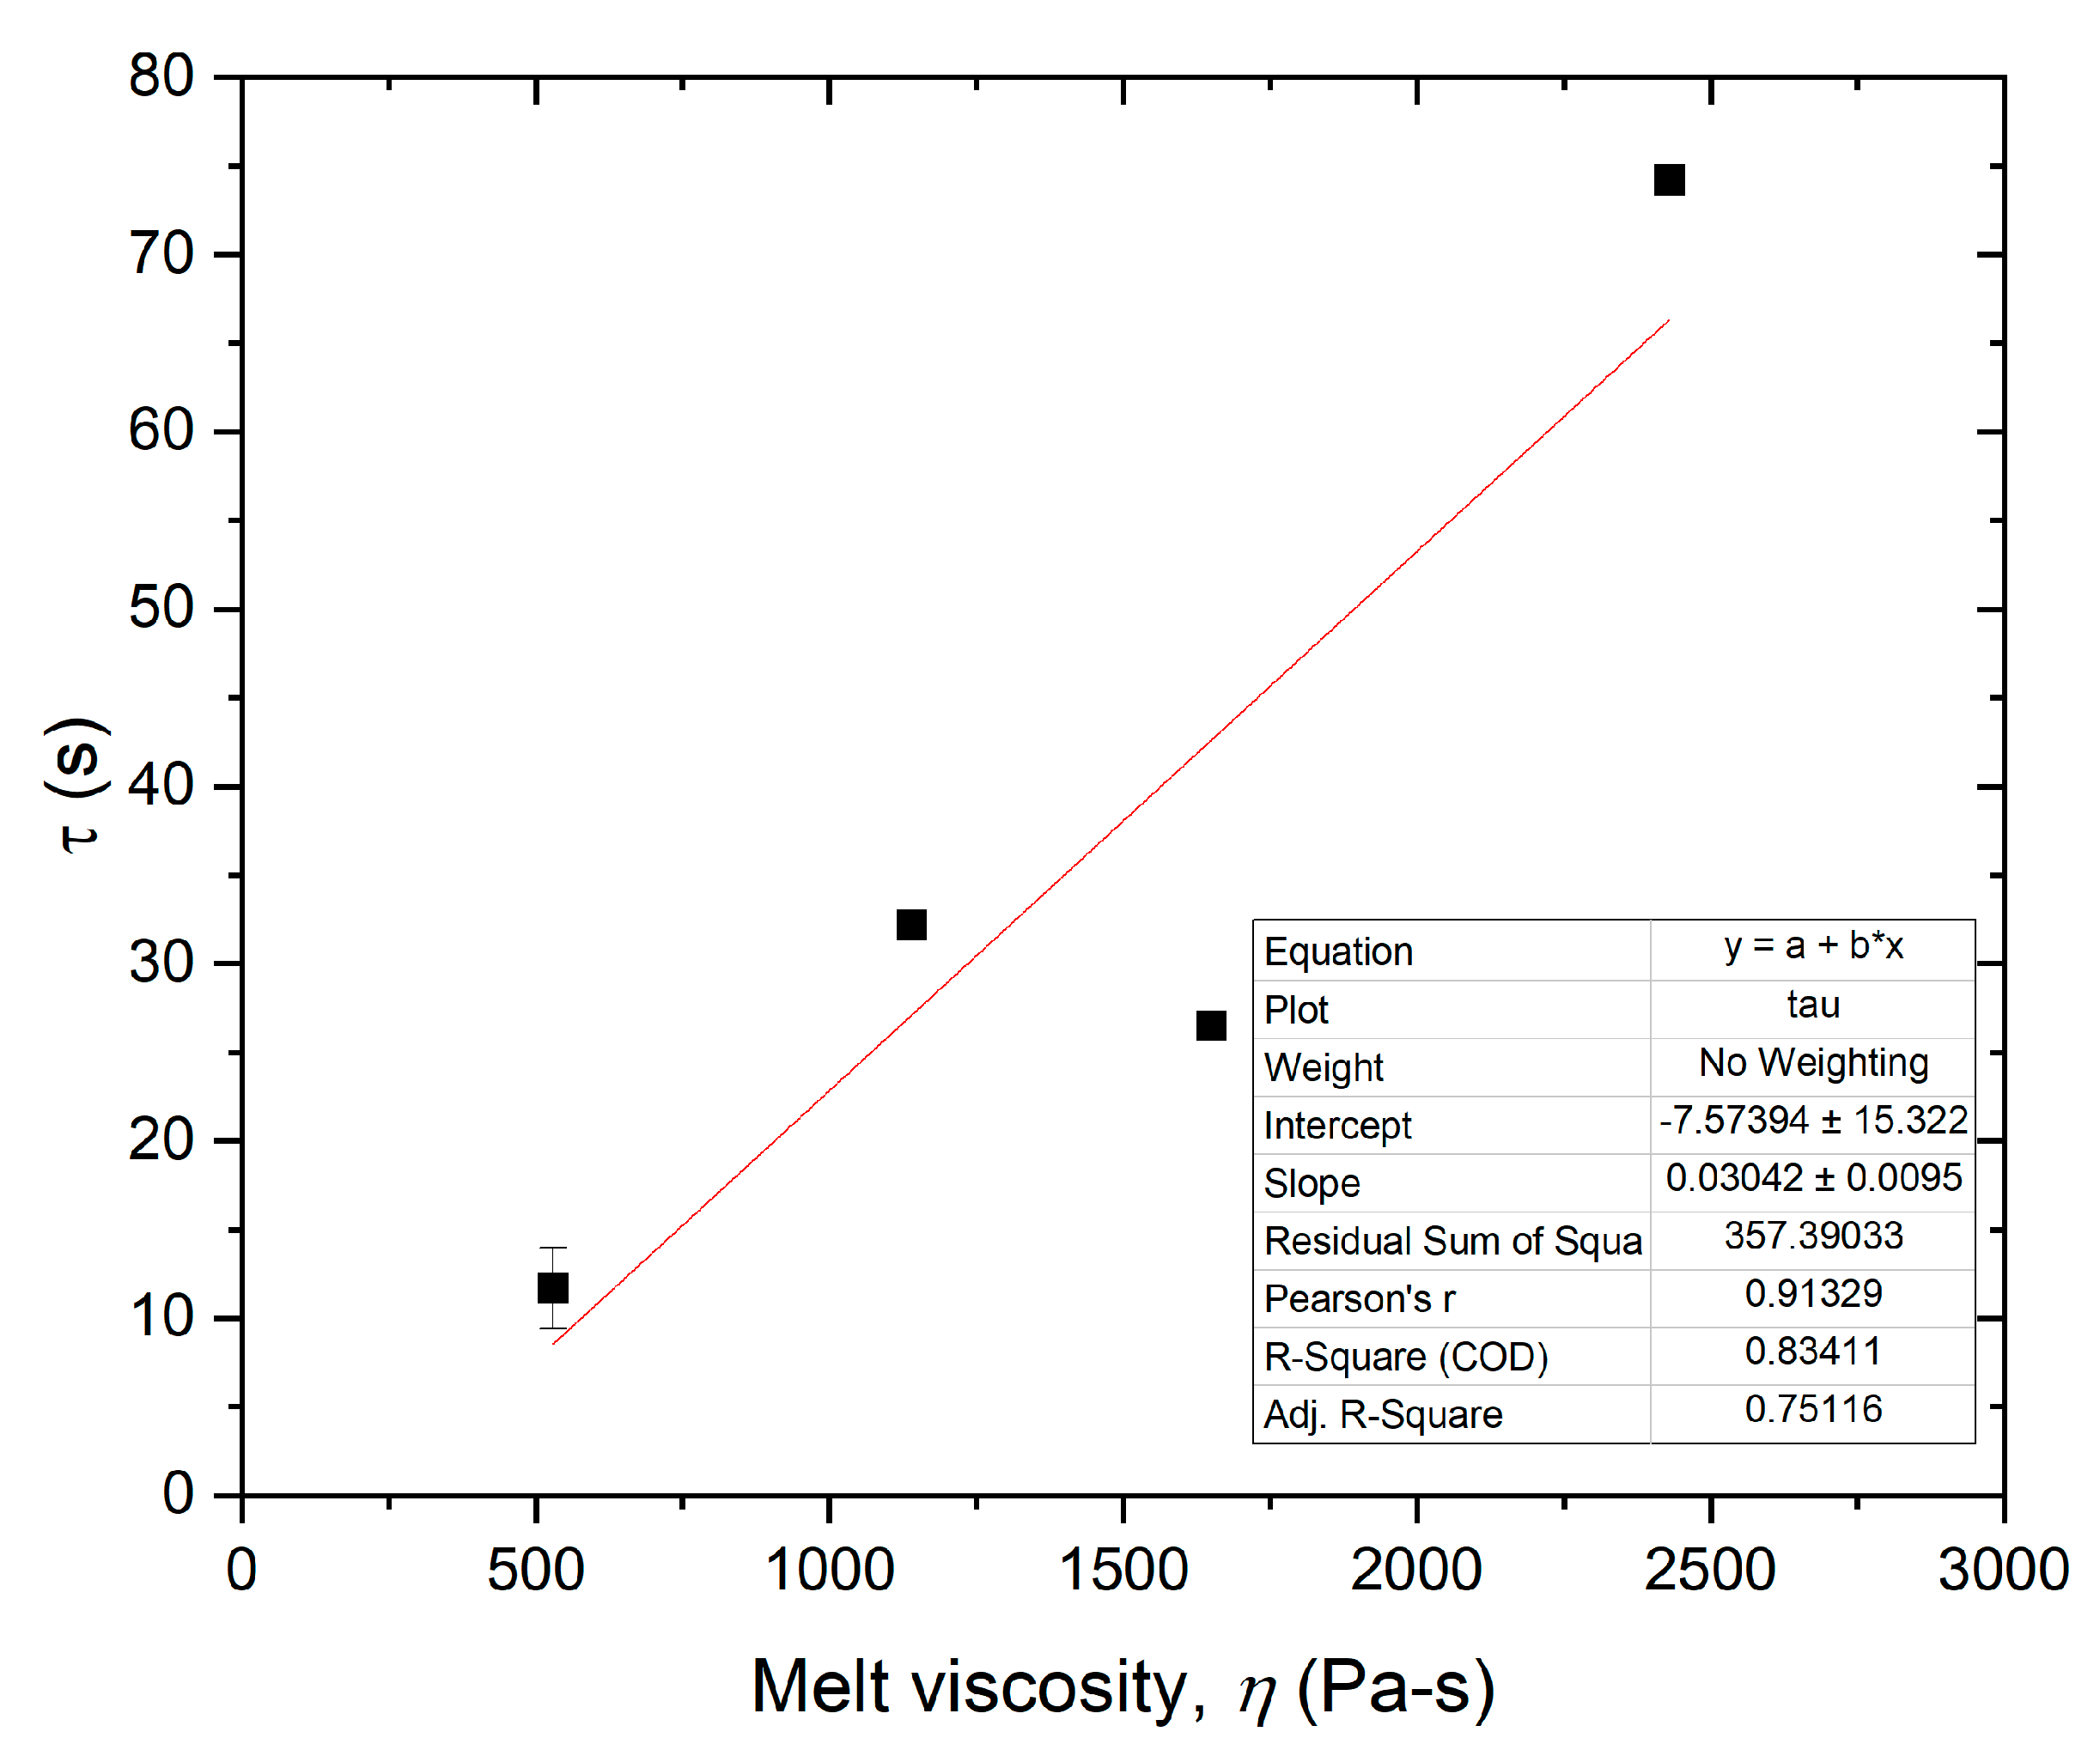
Next, the effect of matrix viscosity on the dielectric breakdown is studied by varying the temperature of the composite melt during electric field application. In
Table 2, we report the zero-shear melt viscosity of the EVA matrix at temperatures between 120 and 160 °C based on small-amplitude oscillatory shear measurements. By fitting
obtained from the three-parameter logistics model given by Equation (5), as a function of different melt viscosities, we find the approximate relationship of
(see
Figure A2). This also empirically agrees with the theory related to the rotation and translation of individual GNP under the electric field, i.e.,
and
. Therefore, the result suggests that the rate of conductivity increase could be related to the rate of individual conductive particles’ motion within the composite. The electric field induces motion to anisotropic conductive fillers to form a local conductive pathway, which in turn leads to a reduction in the dielectric strength to cause dielectric breakdown. Differences in the initiation time of electrical conductivity increase between different samples under similar processing conductions may arise from the inherent sample-to-sample variations in GNP dispersion and sample contact with the test electrodes.
Lastly, we observed that
dramatically decreased with increasing GNP concentration at fixed electric field strength of 400 V
rms/mm. The rate of conductivity increase was much slower for blends with lower GNP concentration of 0.10 and 0.05 wt % (
Figure 4c). Blends with higher GNP concentration exhibited shorter average interparticle distance. The lower concentration of the conductive filler species within the blend reduces the probability of the growth of electric treeing structure through conductive regions. Accordingly, blends with 0.10 or 0.05 wt % GNP were able to withstand eventual dielectric breakdown for longer duration (~25–60 min) as opposed to ~2–3 min in EVA/GNP_0.25 wt % blends. For GNP concentrations above 0.1 wt %,
reached at least 10
−7 S/cm despite GNP concentration being well below the percolation threshold. The dramatic enhancement in the maximal electrical conductivity may indicate the formation of conductive pathway from electrical treeing during electric field application. While the origin of dielectric breakdown during electric field application is presumably dominated by the local electric treeing formation, blends with higher GNP concentration are more probable to exhibit locally conductive regions that can favor treeing propagation. Results from
Table 1 show that doubling GNP concentration leads to an approximate order-of-magnitude reduction in
.


