Article

Piezoelectric Ceramic/Photopolymer Composites Curable with UV Light: Viscosity, Curing Depth, and Dielectric Properties

Institute of Mechanics and Adaptronics, Technische Universität Braunschweig, Langer Kamp 6, 38106 Brauschweig, Germany
*
Author to whom correspondence should be addressed.
J. Compos. Sci. 2022, 6(7), 212; https://doi.org/10.3390/jcs6070212
Submission received: 20 May 2022 / Revised: 11 July 2022 / Accepted: 14 July 2022 / Published: 18 July 2022

Abstract

:
Four piezoelectric ceramic materials with varying particle sizes and geometries are added up to 30 vol.% to a photopolymer resin to form UV-curable piezoelectric composites. Such composites solidify in a few minutes, can be used in UV-curing-based 3D printing processes, and can achieve improved sensor performance. The particle dispersion with ultrasonication shows the most homogeneous particle dispersion with ethanol, while two other solvents produced similar results. The viscosities of the prepared suspensions show some dependency on the particle size. The curing depth results show a strong dependency on the ceramic particle size, the difference in refractive index, and the particle size distribution, whereby composites filled with PZT produced the worst results and composites filled with KNN produced the highest curing depths. The SEM images show a homogeneous dispersion of ceramic particles. The highest dielectric properties are also shown by KNN-filled composites, while BTO and PZT produced mixed results of dielectric constants and dielectric losses. KNN-filled composites seem to be very promising for further 3D-printable, lead-free piezoelectric composite development.

1. Introduction

The research on thin, flexible, two-component 0–3 piezoelectric composites has lasted for a few decades. Their flexibility, low weight, low acoustic impedance, ease of manufacture, and formability make them good candidates for various sensing applications [1]. As an example, if applied on the surface of a structure, such sensors can convert various mechanical vibrations within the structure into electrical signals and suit structural health monitoring (SHM) applications.
In the last decades, the high adoptability of stereolithography (SLA)- and direct light projection (DLP)-type 3D printing techniques has created huge interest in the 3D printing of ceramics and ceramic composites [2,3,4]. The main materials used in SLA- and DLP-type 3D printing are photopolymer resins that solidify under UV light. By adding ceramic particles into the photopolymer, the composite material suspension is formed, which can be used in the 3D printing process. While most researchers aim to achieve solid ceramic parts, i.e., the 3D printing of the green part is followed by the debinding and sintering [5,6,7,8,9,10,11,12,13,14,15,16], other researchers aim to directly 3D print composite materials that can be used right away without sintering steps [17,18,19,20,21,22,23]. Such 3D-printable (UV-curable) composite materials solidify in a few minutes, which reduces particle sedimentation, reduces the waste material, and increases the manufacturing speed compared to epoxy-based systems. When photopolymers are filled with piezoelectric particles, piezoelectric composite sensors are created. With the possibility to solidify the material in a few minutes with UV light, non-standard sensor geometries are possible, which show increased piezoelectric performance [19,24,25] and suit SHM applications [26].
Most studies still focus on lead zirconate titanate (PZT) ceramic as a filler for composite piezoelectric materials [27,28,29,30,31,32,33,34], but more and more interest is being shown for lead-free ceramics, such as barium titanate (BTO) [17,22,23,35,36,37,38,39] and potassium–sodium niobate (KNN) [35,40,41,42,43,44,45], since the evaporation of lead oxide during PZT sintering might be harmful [46].
In this study, we prepare two-phase piezoelectric composites, which are solidifiable under UV light, with varying ceramic contents using three types of piezoelectric ceramic powders (PZT, KNN, and BTO) and a UV-curable photopolymer resin. The KNN was available in two sizes; therefore, 4 types of composites were investigated in total. The main aim of this study was to gain insights into how different piezoelectric ceramic types, particle sizes, and particle geometries influence the suspension’s viscosity, the curing depth, and the dielectric properties of the solidified composites. A secondary aim is to find out if different solvents used for particle dispersion have any influence on the properties of the composites and which one is the most suitable to achieve the most homogeneous particle dispersion.

State-of-the-Art

The main factors influencing the manufacturing of UV-curable piezoelectric composites are the chemical composition of the photopolymer, its viscosity, the difference in the refractive indexes of the materials, the ceramic particle type, the shape, the geometry, the UV light intensity used, the exposure time, and the loading of ceramic inclusions [3,7]. Furthermore, the particle dispersion quality influences the composite suspension viscosity and the curing depth, and influences the mechanical and dielectric properties of the cured composites. In the literature, various methods used to disperse ceramic particles in polymers are reported, including particle dispersion with a centrifugal mixer [36,47], high-shear mixing [5,48], ball milling [6,48], stirring [35], ultrasonic agitation [20,36,49,50,51,52], or combinations of the methods mentioned above. Centrifugal mixing, however, is not efficient and produces agglomerates, especially at higher ceramic loadings (≥30 vol.%) [36]. This was also observed in our previous experiments not reported here. The dispersion method must ensure a homogeneous particle distribution without agglomerations and no voids to give the highest composite performance [53]. The voids increase the dielectric losses because of the increased interfacial polarization between the matrix and piezoelectric ceramic particles [54]. Furthermore, the voids increase the chance of a breakdown during the piezoelectric composite polarization. The voids can be reduced or eliminated by using colloid processing techniques [55] or via particle functionalization [17,18,19,25]. In this study, none of these methods are used. This study focuses on the ultrasonic dispersion of ceramic particles (as received) in a solvent with an ultrasonic sonotrode.
The addition of ceramic particles increases the suspension viscosity and reduces the curing depth [5,12,23,48]. A smaller increase in viscosity with the addition of ceramic particles is favorable and allows the ceramic content in the composites to be increased even further until the viscosity becomes a limiting factor during composite manufacturing. A low viscosity (<3 Pa·s) is a must for composite suspensions to be used in most commercial 3D printers [48]. Suspensions not suitable for commercial printers because of their high viscosity can be still used with modified 3D printers or can be tape-cast, manually or automatically, on the glass or in the molds. While the viscosity can be reduced simply by heating the suspensions, limits still exist, because polymerization, up to some degree, can be triggered by temperature too. The literature suggests that bigger particles produce a smaller increase in viscosity [56], and at the same time bigger piezoelectric ceramic particles (particles with multi-domains) usually show higher piezoelectric coefficients because of their higher tetragonality.
The curing depth reduction with the addition of ceramic particles produces the biggest problem because it directly influences the printing resolution and curable layer thickness [12,57,58]. The curing depth reduction is mainly dependent on the ceramic loading and the difference in refractive index between the photopolymer and ceramic particles [9,23,48,58,59,60,61]. Furthermore, the particle size and geometry also play a role, which is not quite clear from the literature because of the mixed results reported. While some studies suggest that smaller particles with better light-scattering properties are preferred in the stereolithography process [3,18], other studies suggest that bigger particles (bigger than the UV wavelength used) are more suitable because they reduce the light scattering and increase the curing depth [59,60]. It is possible that particle sizes close to the UV light wavelength might produce the worst results in terms of the curing depth. It is critical to mention that a higher particle size distribution also decreases the curing depth and that similarly sized particles should be prioritized to achieve the highest curing depth [60]. While a decrease in printing resolution might not be important for the tape-casting approach, such as that used in this study, a reduced curing depth requires a stronger UV light source or longer exposure times. Therefore, varying degrees of curing of the photopolymer can occur throughout the composite cross-section, which can cause varying mechanical and dielectric properties too, which would be almost impossible to measure accurately.
From the literature, it is well known that increasing the content of the piezoelectric particles also increases the dielectric constant of the resulting composites [21,22,33,36,37,38,39,44,45,62]. The ceramic filler particle size also has a high influence on the dielectric properties because the bigger particles are multi-domain (>200 nm, ceramic-type-dependent [63]), can have higher tetragonality [56], and show a higher dielectric constant [50,56,64,65]. In addition, the bigger ceramic particles can be dispersed more easily and usually form fewer voids or agglomerations, which in turn increases the dielectric constant and decreases the dielectric loss [53,54].
In conclusion, the influences of the piezoelectric ceramic particle size and volumetric fraction on the viscosity, curing depth, and dielectric properties of two-phase composites are quite well researched. However, most studies focus on epoxies and other polymers. The suitability of the photopolymer as the matrix material is investigated here to prove that the ultrasonication process is suitable for particle dispersion. According to the literature, bigger ceramic particles (bigger than the UV light wavelength used) should produce the highest curing depth, lowest increase in suspension viscosity, and higher dielectric properties.

2. Materials and Methods

Three different types of piezoelectric ceramics were used in this study: lead zirconate titanate (PZT) (material PIC255, purchased from PI Ceramic GmbH, Lederhose, Germany), potassium–sodium niobate (KNN) (both types of KNN ceramic, with surface areas of 3.5 m2/g and 7 m2/g, purchased from Nippon Chemical Industrial Co., Ltd., Tokyo, Japan), and barium titanate (BTO) (Product-Nr.: NO-0041-UP, purchased from IoLiTec-Ionic Liquids Technologies GmbH, Heilbronn, Germany). The KNN ceramic is available in two sizes, and regarding their surface areas they are named KNN3.5 (bigger particles) and KNN7 (smaller particles); therefore, in total four materials were investigated in this study. Every ceramic has a different particle geometry and size. Figure 1 shows scanning electron microscopy (SEM) images (made with Helios G4 CX DualBeam™, Thermo Fisher Scientific, Waltham, MA, USA) of all ceramics, and Table 1 shows the properties of the ceramic particles.
As can be seen from the SEM images, the BTO particles are almost perfectly spherical and the particle size variation is quite small (see the particle size deviation as a percentage in Table 1). However, some particles are sintered together and form clusters of multiple particles that cannot be separated (seen on SEM pictures at lower magnifications not shown here), which increases the particle size distribution. KNN7 has some cubic particles but most of the particles have irregular geometry. The particle size deviation is quite high. KNN3.5, on the other hand, has an almost perfectly cubic particle shape with rounded edges. PZT shows the most irregular particle geometries, with both bigger and smaller particles and a huge variation in particle size. The particle size was measured from SEM images (either pure ceramic particles or particles in 20 vol.% composite) using Digimizer software (MedCalc Software Ltd., Ostend, Belgium) and by measuring at least 30 particles for every ceramic from the SEM image.
The theoretical densities (see Table 1) of the ceramics were used for composite weighting calculations; however, the literature suggests lower real densities of the materials (e.g., [66,67,68,69,70,71], to name a few). The refractive indexes were also taken from the literature and were not measured in this study.
Table 1. Properties of piezoelectric ceramic particles.
PropertyBTOKNN7KNN3.5PZT
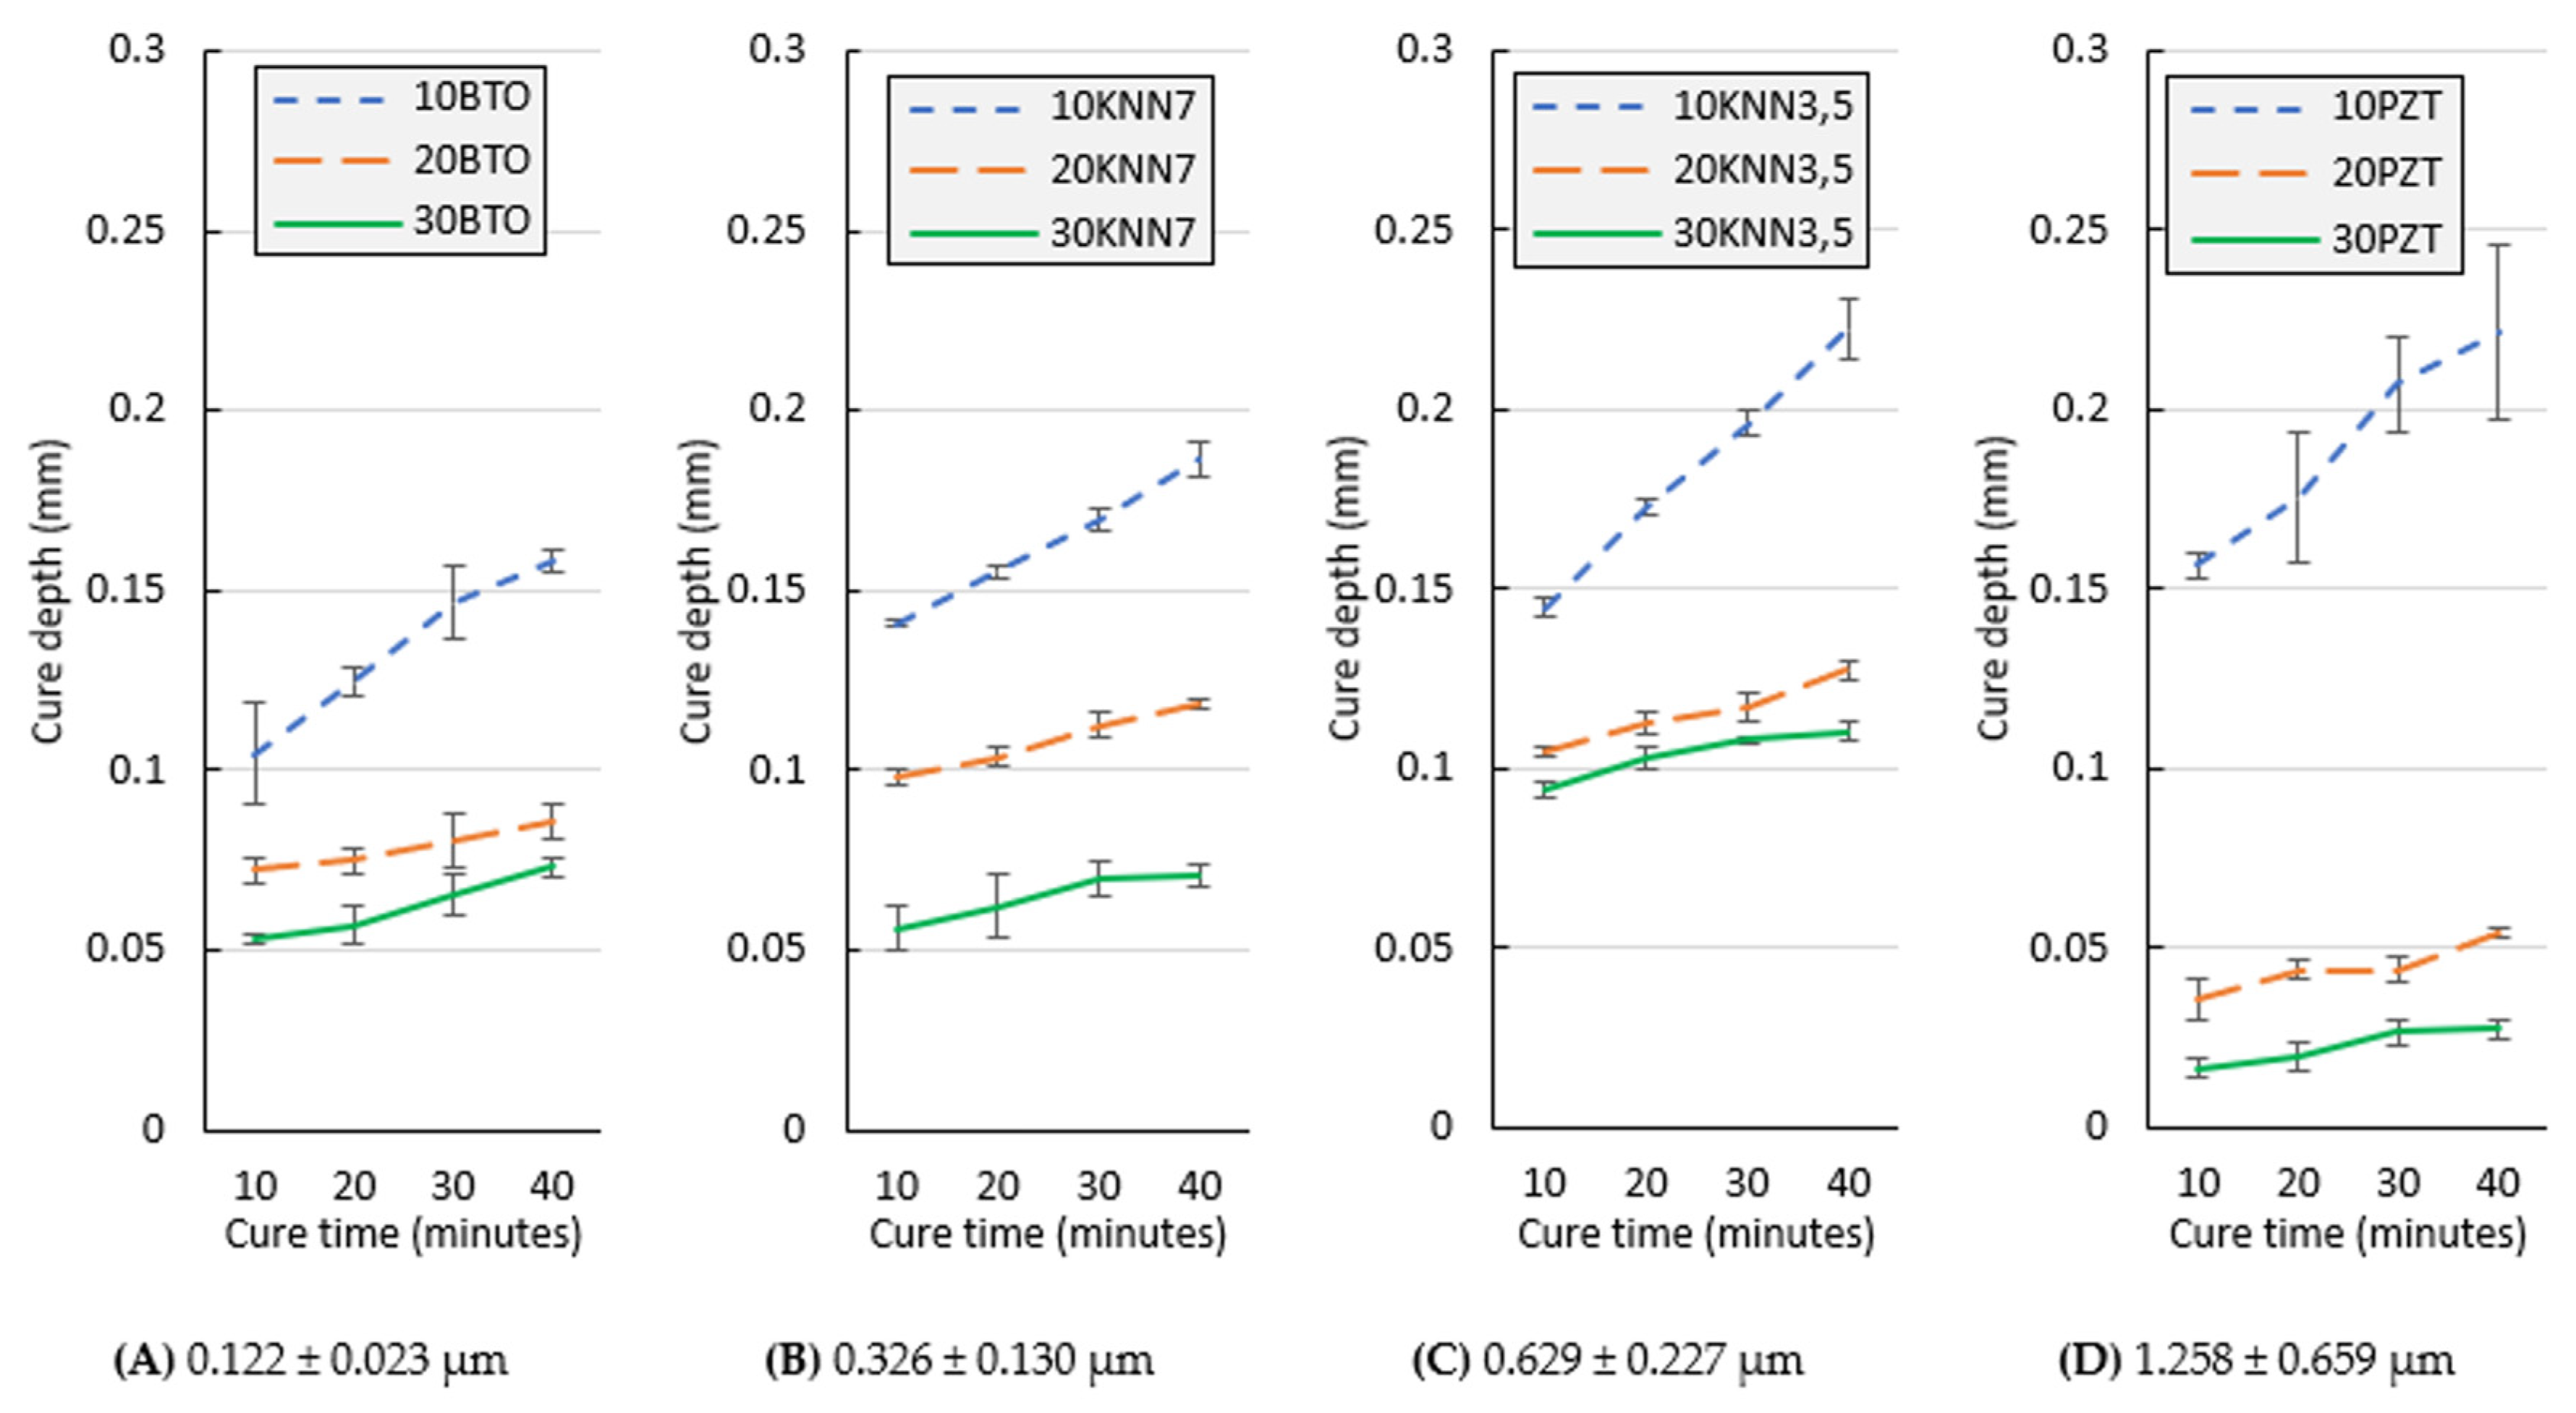
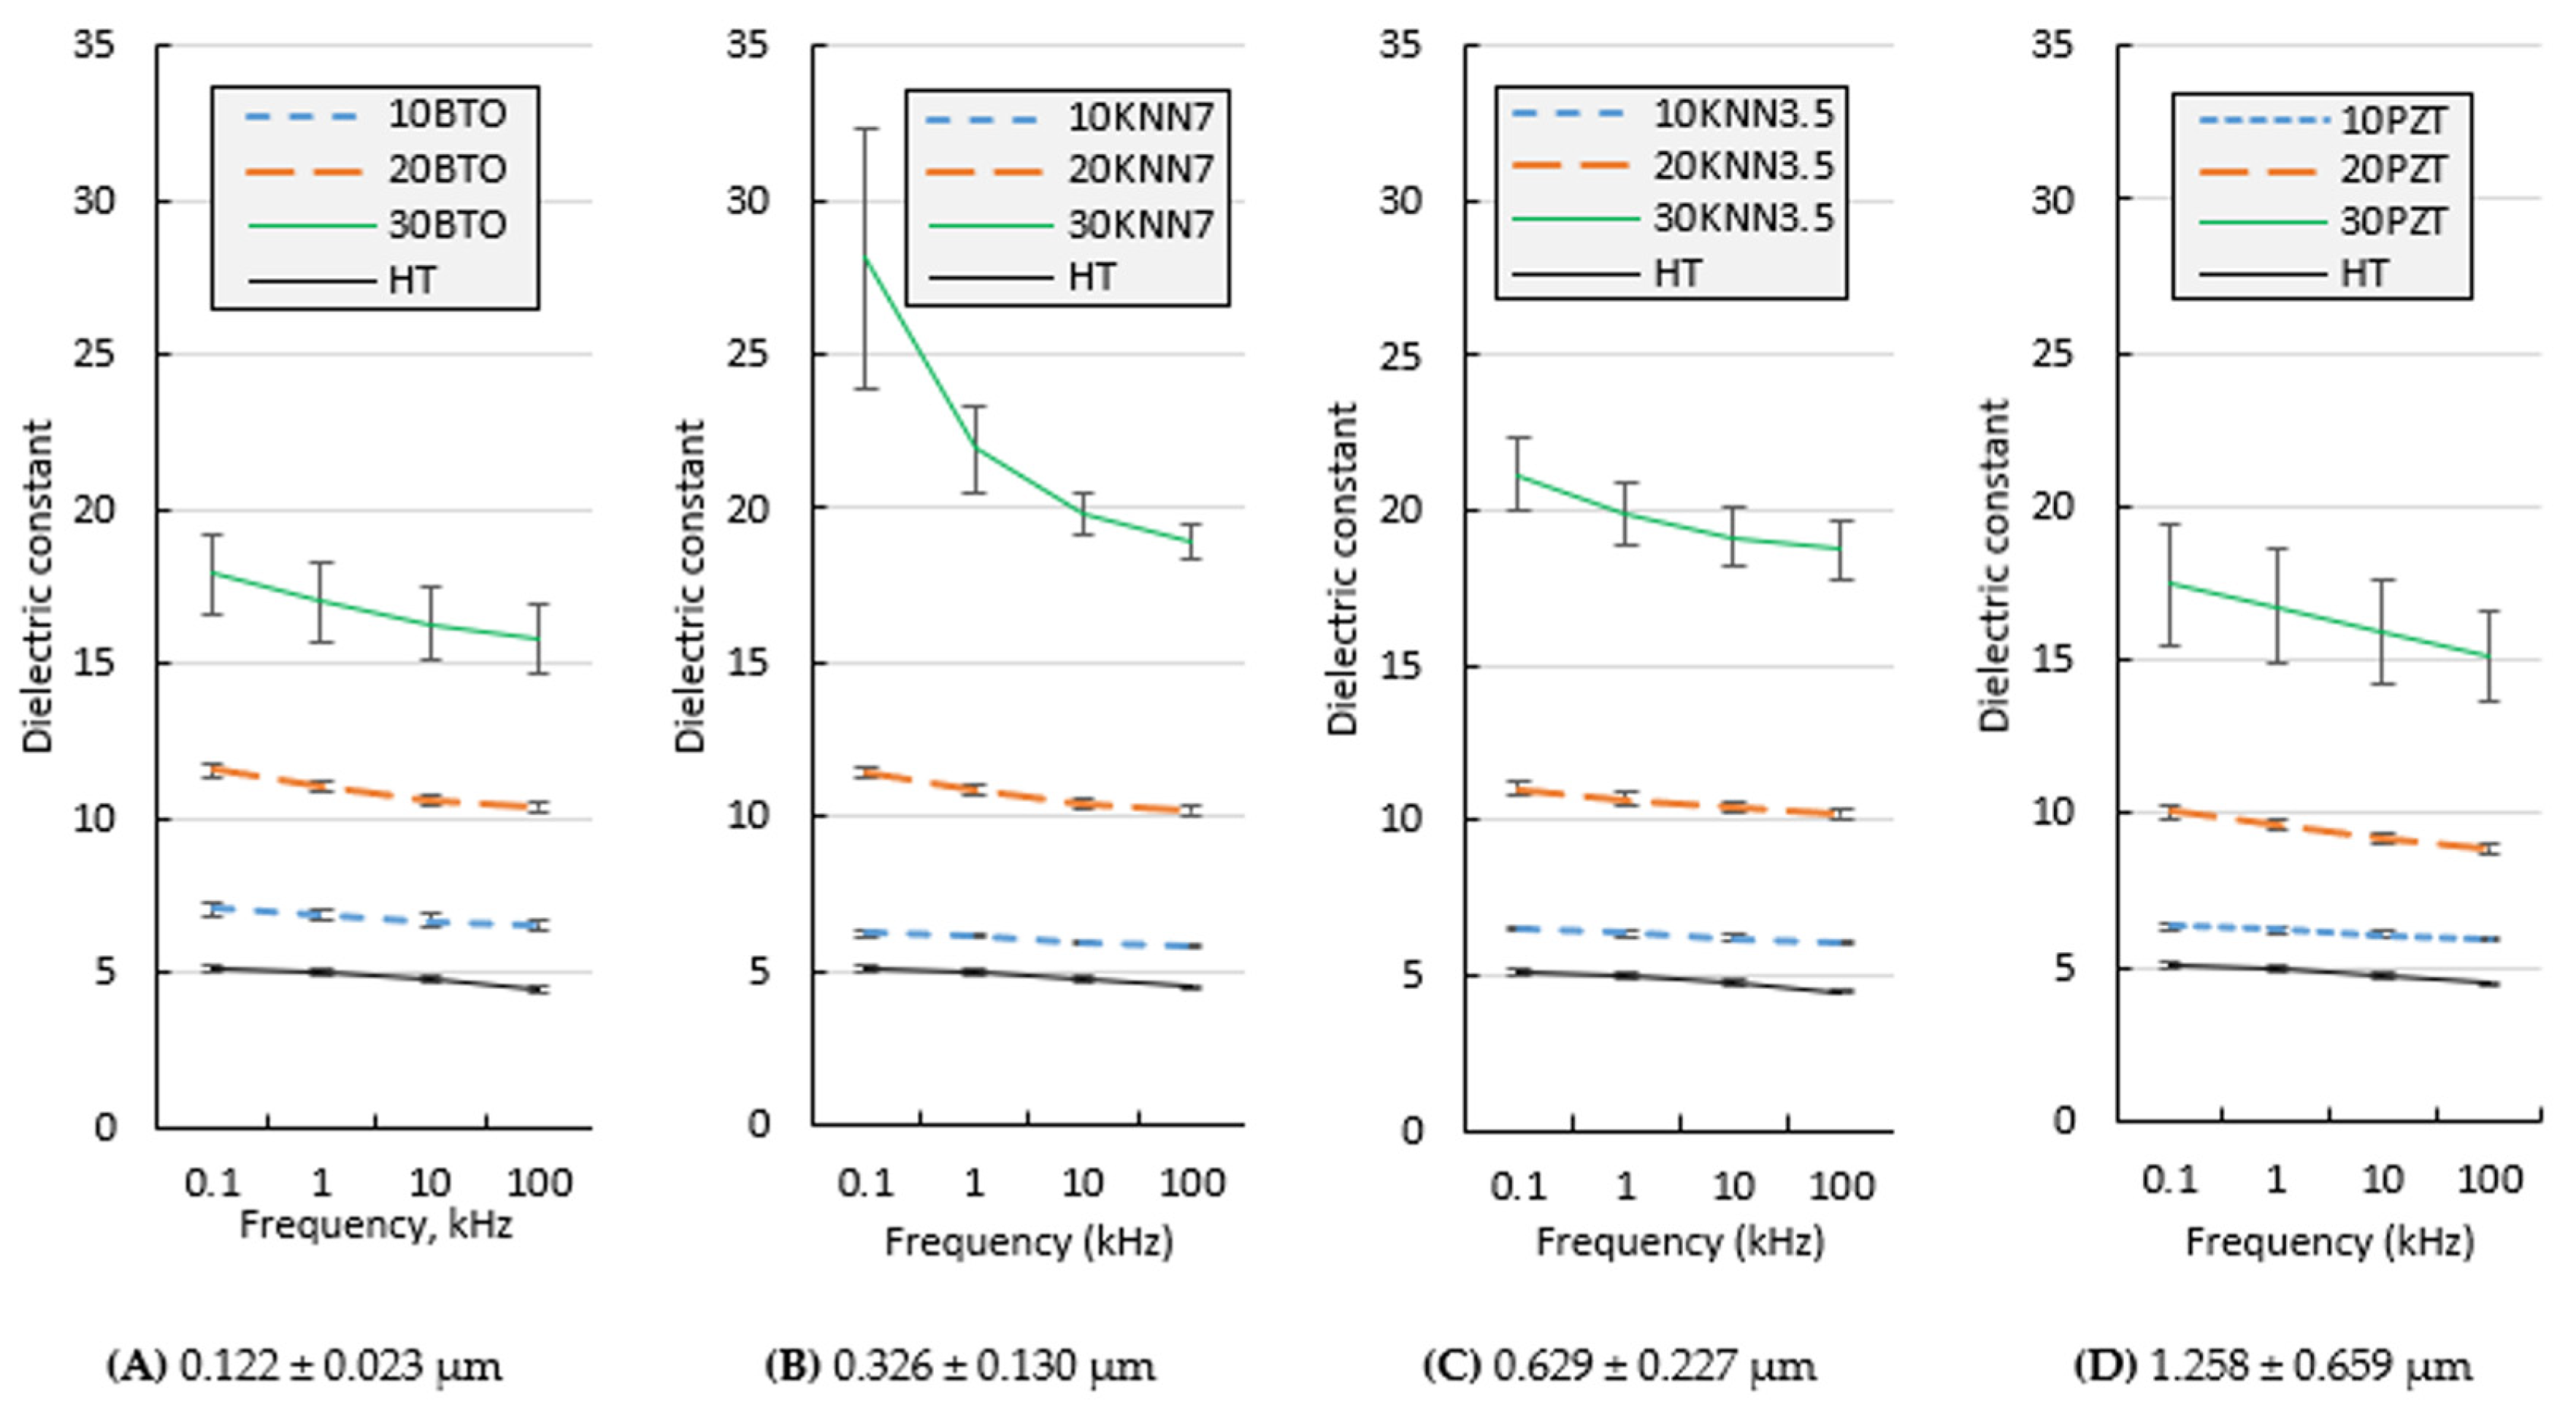
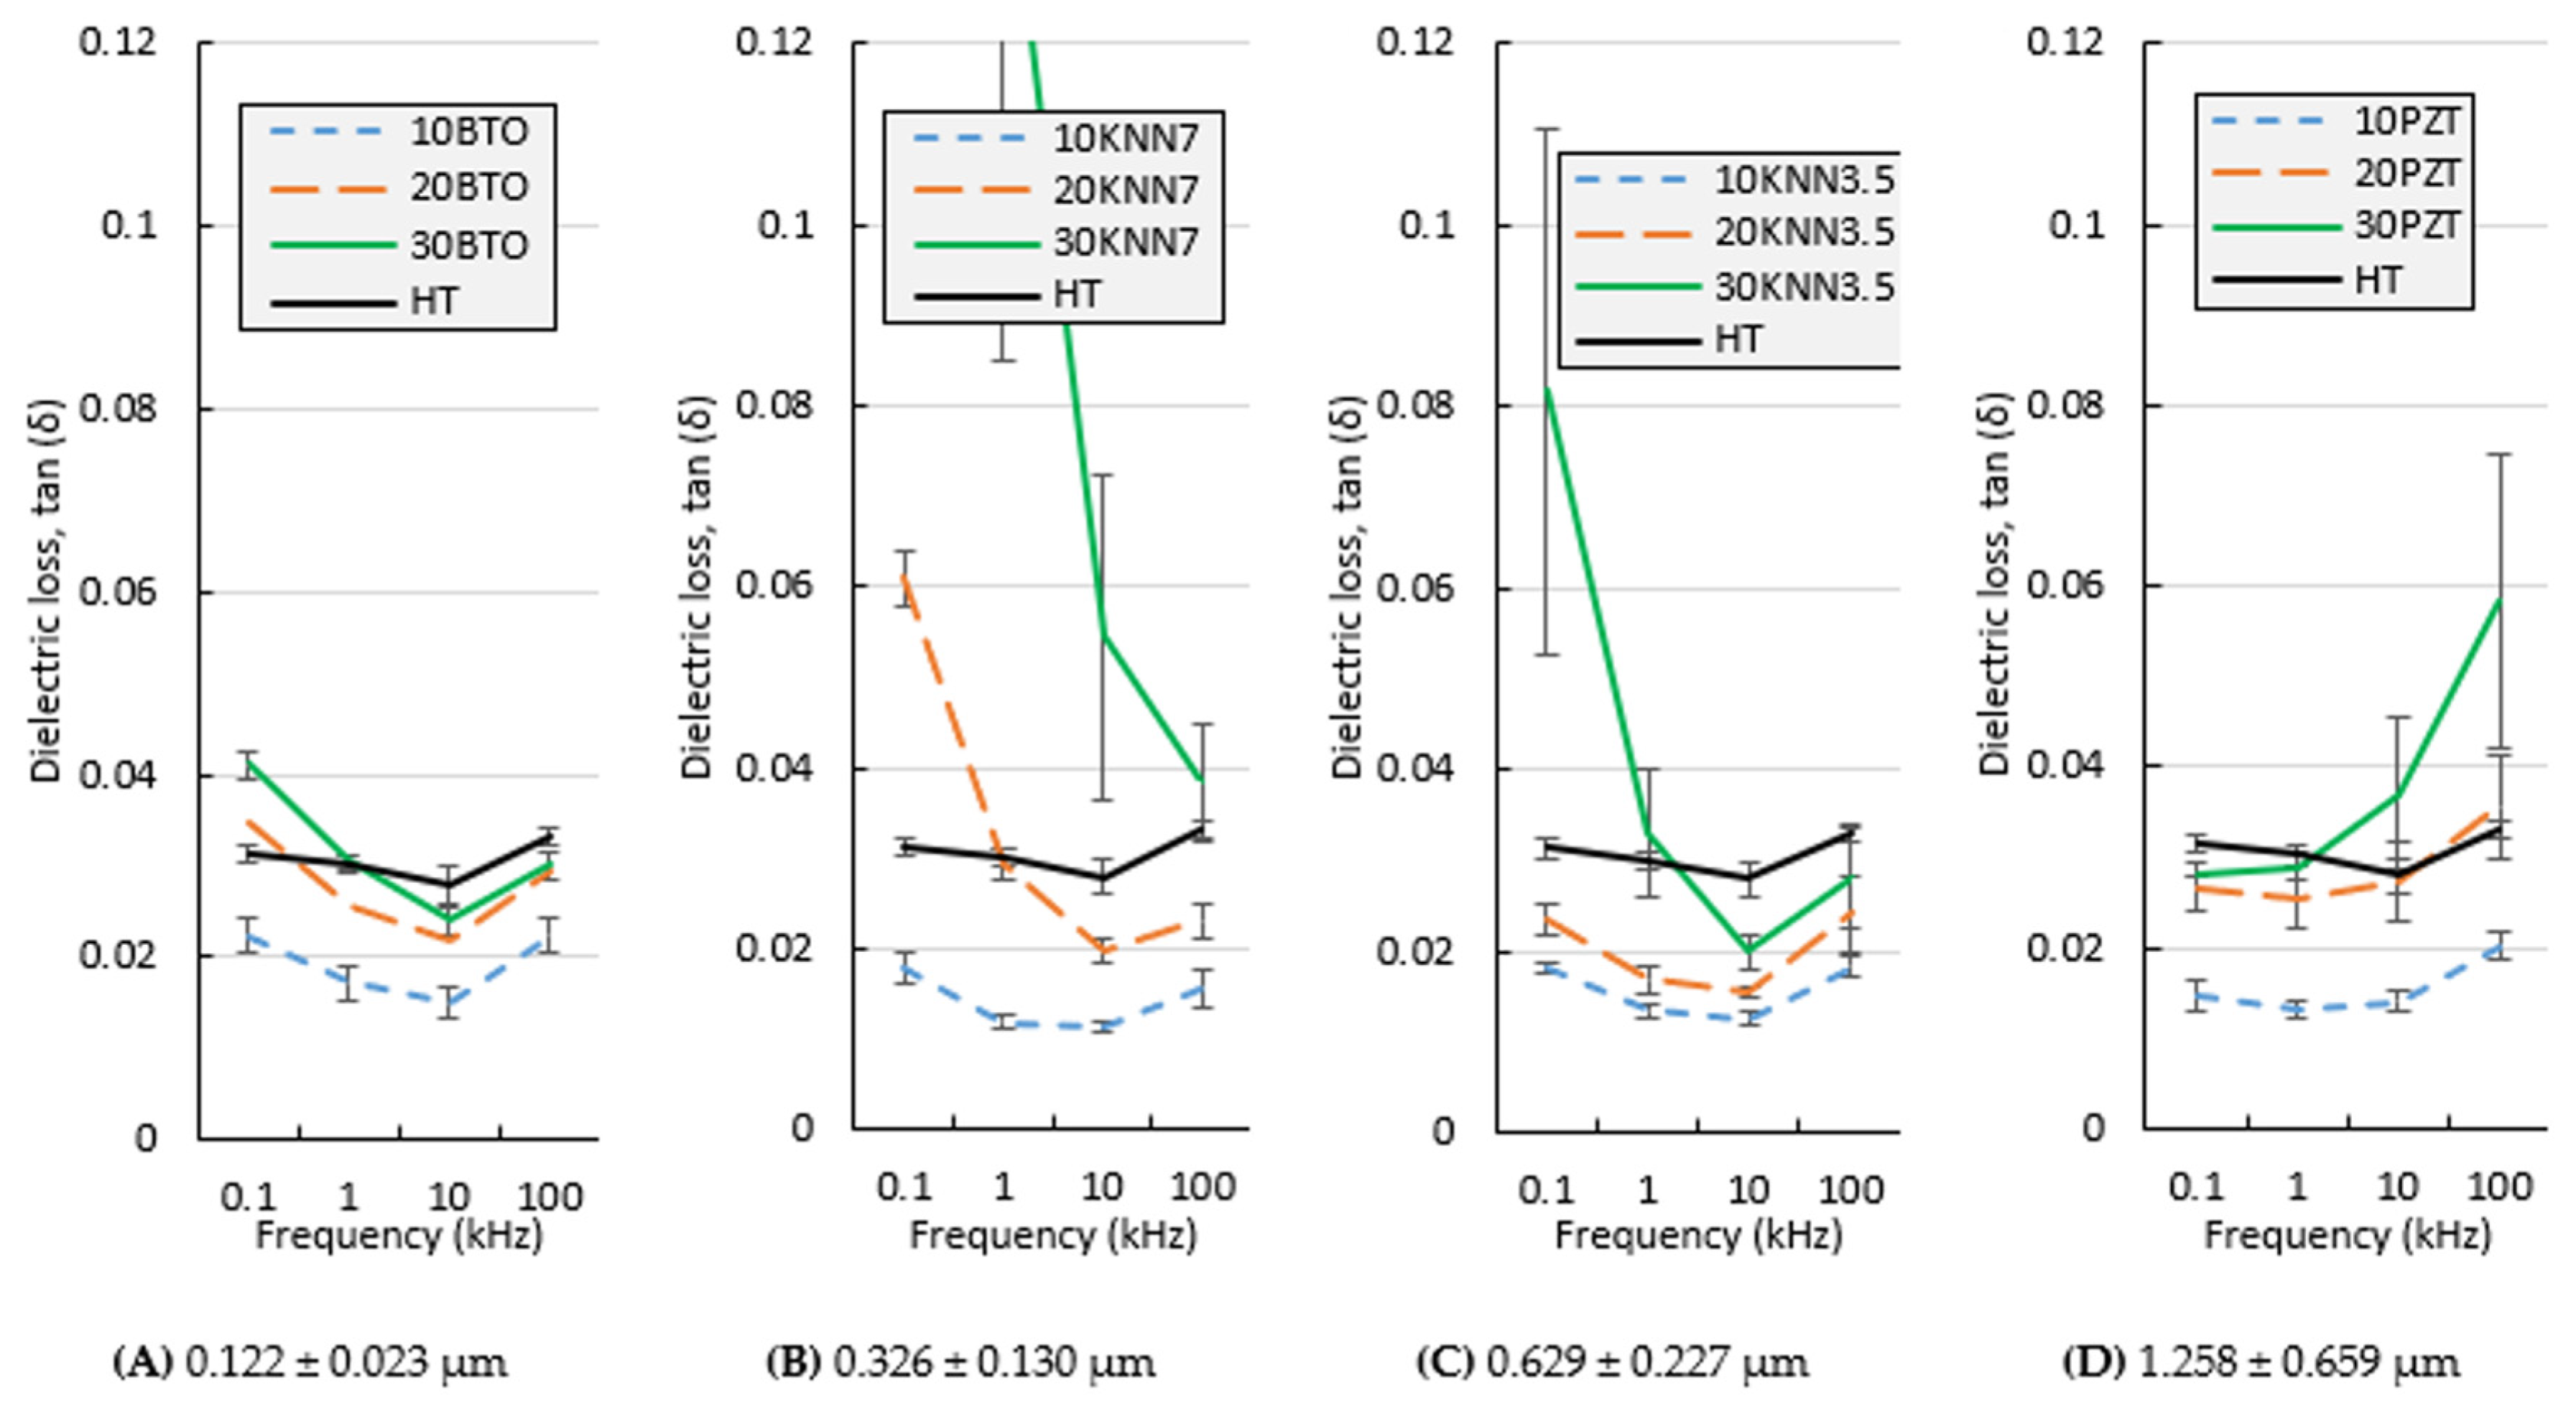
Particle size from SEM, μm (size deviation in %)0.122 ± 0.023 (18.8%)0.326 ± 0.130 (39.8%)0.629 ± 0.227 (36%)1.258 ± 0.659 (52.4%)
Particle geometrySphericalRandomCubicRandom
Theoretical density, g/cm36.024.44.47.8
Refractive index 12.37–2.64 22.3–2.54 32.3–2.4 32.5–2.85 4
Lattice structure 5Cubic (non-piezoelectric)Orthorhombic—tetragonalorthorhombictetragonal
1 At 405 nm wavelength, room temperature; 2 source [72,73]; 3 source [74]; 4 source [23,75,76]; 5 see XRD data.
A commercially available photopolymer resin “High-Temperature V2” (Formlabs, Somerville, MA, USA) was used as a matrix material throughout the study. This photopolymer was selected based on our previous studies, where it showed the best performance as a matrix material among various types of photopolymers [47]. Furthermore, this photopolymer can achieve high mechanical and thermal properties after post-curing, meaning it is well suited for piezoelectric composite manufacturing.
From the literature, it is known that polymers with higher stiffness can transfer more stress to ceramic particles and increase the overall piezoelectric composite performance [18,19,54].

2.1. Suspension Preparation

All 3D-printable (UV-curable) piezoelectric ceramic/photopolymer suspensions in this study were dispersed with the same method and parameters: two-step ultrasonic dispersion with an ultrasonic sonotrode followed by solvent evaporation to form a paste. This technique was selected to prove its suitability for ceramic dispersion in the photopolymer because the further research steps for piezoelectric composites reported here involve the addition of conductive nanomaterials. In the literature, most conductive nanomaterials are dispersed via ultrasonic dispersion by using various solvents, including acetone [77], ethanol [31], isopropyl alcohol (IPA) [38], and others.
Every suspension was prepared once, as precisely as possible. Ceramic particles (between 10 and 20 g, depending on ceramic used and vol.% planned) were added to the solvent to form a 5 wt.% ceramic/solvent suspension. The glass jar was covered with foil to avoid contamination and material splashing and to minimize the solvent evaporation during ultrasonic dispersion. The glass jar with the materials was placed in a plastic box, fixed to the bottom, and crushed ice with water was filled around it to cool the suspension during ultrasonic dispersion. In the first step, the suspension was ultrasonicated with an ultrasonic sonotrode (Branson Ultrasonics™ S-250D Model Sonifier™ Digital Cell Disrupter, BRANSON Ultrasonics Corporation, Danbury, CT, USA) for 15 min with the maximum power set to 70% of 200 W and with 1 s ultrasonication and 0.2 s pause intervals. The pauses were not taken into the ultrasonication time. The actual power of the ultrasonication varies depending on material viscosity, which in turn slightly varies depending on the temperature. Over a standard mixing procedure, the actual sonication power that affects the dispersion varies between 30 and 60 W and the temperature of the dispersion varies between 8 °C and 22 °C. An ultrasonic sonotrode and temperature sensors were immersed in the liquid through the small holes in the plastic foil. After the first ultrasonic dispersion step, a photopolymer was added, the glass jar was sealed again, crushed ice with water was added around the glass jar, and the ultrasonication process was run for the next 30 min. Further, the dispersion was left overnight for solvent evaporation while stirring with an average size magnet at 300 rpm and heating of the dispersion to 60 °C, until all solvent evaporated. Heating of the dispersion during solvent evaporation produces a single color suspension without clearly visible particles in the suspensions or on the glass jar walls, opposite to cold evaporation. As the last step, depending on the suspension viscosity, the air bubbles were eliminated by placing the suspensions in the vacuum for a few hours.

2.2. Piezoelectric Composite Sensor Manufacturing

The composite suspensions were solidified (cured) under UV light after tape-casting them manually on the glass. PVC film (Oraguard 270G, transparent, thickness 150 μm), with a plotter-cut square geometry (30 × 30 mm), was glued to the glass. The piezoelectric composite suspension of interest was poured into the cut geometry and tape-casted with a handheld metal blade at 30°. The glass with the tape-casted composite suspension (together with the PVC film) was placed into a post-curing UV device (Form Cure, Formlabs, MA, USA) for 10 min to solidify. The heating function was turned off. This device has 13 multi-directional LEDs (wavelength 405 nm) with a total LED power of 39 W (LED radiant power is 9.1 W). After curing, the PVC foil was peeled off, leaving the cured specimens on the glass, which were peeled off afterward from the glass. Composites with higher ceramic amounts tend to bend after manufacturing (due to containing residual stress inside), so they were kept between two glasses for a few days in the dark at room temperature. A thin gold layer (100 nm) was sputtered on both sides of the specimens for dielectric measurements, leaving 1 mm around the specimens’ edges uncovered by gold. These specimens can be poled in a high electric field to achieve measurable piezoelectric properties. However, in this study, they were not poled.

2.3. Characterization Methods

The XRD patterns of the ceramic materials as received were determined using Cu Kα radiation (Empyrean Cu LEF HR goniometer, Almelo, The Netherlands) on a Si sample holder. The XRD process helped to determine whether the ceramic powders used in this study were indeed piezoelectric, i.e., if materials have a non-cubic crystal structure. The XRD patterns were measured in the 10–90° 2θ range in 0.05° steps, with each step measured for 2 s at room temperature (Empyrean series 2, PANalytical PIXcel-3D detector, Almelo, The Netherlands).
The dynamic viscosity of the suspensions prepared in this study was measured with a Rheometer (Antoon Paar MCR 702, Anton Paar Germany GmbH, Ostfildern-Scharnhausen, Germany) over varying share rates from 1 to 30 s−1 at room temperature (25 °C). The viscosities were measured within one month of the material dispersion, since no visual sedimentation was observed, except for composites with PZT, which showed high sedimentation and were measured within a few days. A varying share rate was selected based on our previous studies [47], where a clear shear-thinning effect was observed with an increasing shear rate. The metal plates had a diameter of 25 mm and the distance between plates was set to 1 mm. It must be noted that the viscosity of the suspensions with a higher ceramic amount (30 vol.%) at higher shear rates (>10 s−1) could be slightly higher in reality than presented in the results. During the viscosity measurements, some material (10–20% of material between measurement plates) was pushed away from between the rotating plates, meaning the material did not cover the complete area of the measurement plates. However, at low shear rates or lower ceramic loading, this phenomenon did not occur.
The curing depths of the suspensions were measured over time, using four curing times: 10, 20, 30, and 40 min. The specially designed, pre-cut PVC film (Oracal 751C, black matt, thickness 60 μm) with cut holes was glued onto the glass [78]. For every curing time and material composition, 5 to 6 holes were created to measure the average curing depth. The film was designed in such a way that specific holes can be covered with a cardboard mask, creating different exposure times for specific holes. Below the glass, a 1-mm-deep container was filled with the suspension of interest, and the glass with a PVC film was placed on top, leaving no air bubbles trapped. The bottom side of the setup was covered to protect it from the UV light coming from the bottom. This whole setup was transferred to a post-curing UV device (the same as that used for manufacturing) to cure for the first 10 min. The heating function was turned off. After the first 10 min, the first cardboard mask (covering 5 holes) was placed on the respective holes and the whole setup was cured for the next 10 min. Another mask was added, covering a total of 11 holes, and the process was repeated until the final curing time (40 min) for the last holes was reached. The container with suspensions was removed and the solidified composite material on the glass was cleaned with isopropyl alcohol. The height of the cured circles (5 to 6 cured circles per curing time for every suspension) was measured with a laser distance sensor. The curing depth measurement technique and the procedure are described in our previous publications [47,78].
SEM was used to investigate as-received ceramic particles and the cross-sections of broken, solidified piezoelectric composite sensors. A Helios G4 CX DualBeam™ SEM imaging system (Thermo Fisher Scientific, Waltham, MA, USA) was used. The ceramic particles were applied to the conductive sticky tape without any force. The solidified composite sensors were broken to investigate the cross-sections. All specimens used for SEM (both the particles and cross-sections of solidified composites) were sputtered with a 4-nm-thick platinum layer to achieve a higher contrast.
The dielectric measurements in this study included measurements of the dielectric constant (relative permittivity εr) and dielectric loss (dissipation factor tan (δ)). The dielectric constant was calculated by measuring the capacitance of the specimens with the applied electrodes at different frequencies with an LCR meter (LCR-300, Voltrcraft) using Equation (1):
ε r = C × d ε 0 × A
where C is the capacitance of the specimen at a certain frequency (F), d is the average thickness of the specimen (m), ε0 is the permittivity of the vacuum with a constant of 8.84 × 10⁻¹² F/m, and A is the overlapping electrode area of the specimen (m2). The dielectric loss was directly measured using the LCR meter. Both the dielectric constant (relative permittivity εr) and dielectric loss (dissipation factor tan (δ)) were measured at room temperature for frequencies of 100 Hz, 1 kHz, 10 kHz, and 100 kHz. For every measurement of the dielectric properties, 5 to 6 electroded specimens of every composition were used, except the compositions with 30 vol.% loading of ceramic, which produced extremely brittle specimens, so only 2–3 specimens were used per composition.

3. Results and Discussion (Ceramic and Solvent Investigation)

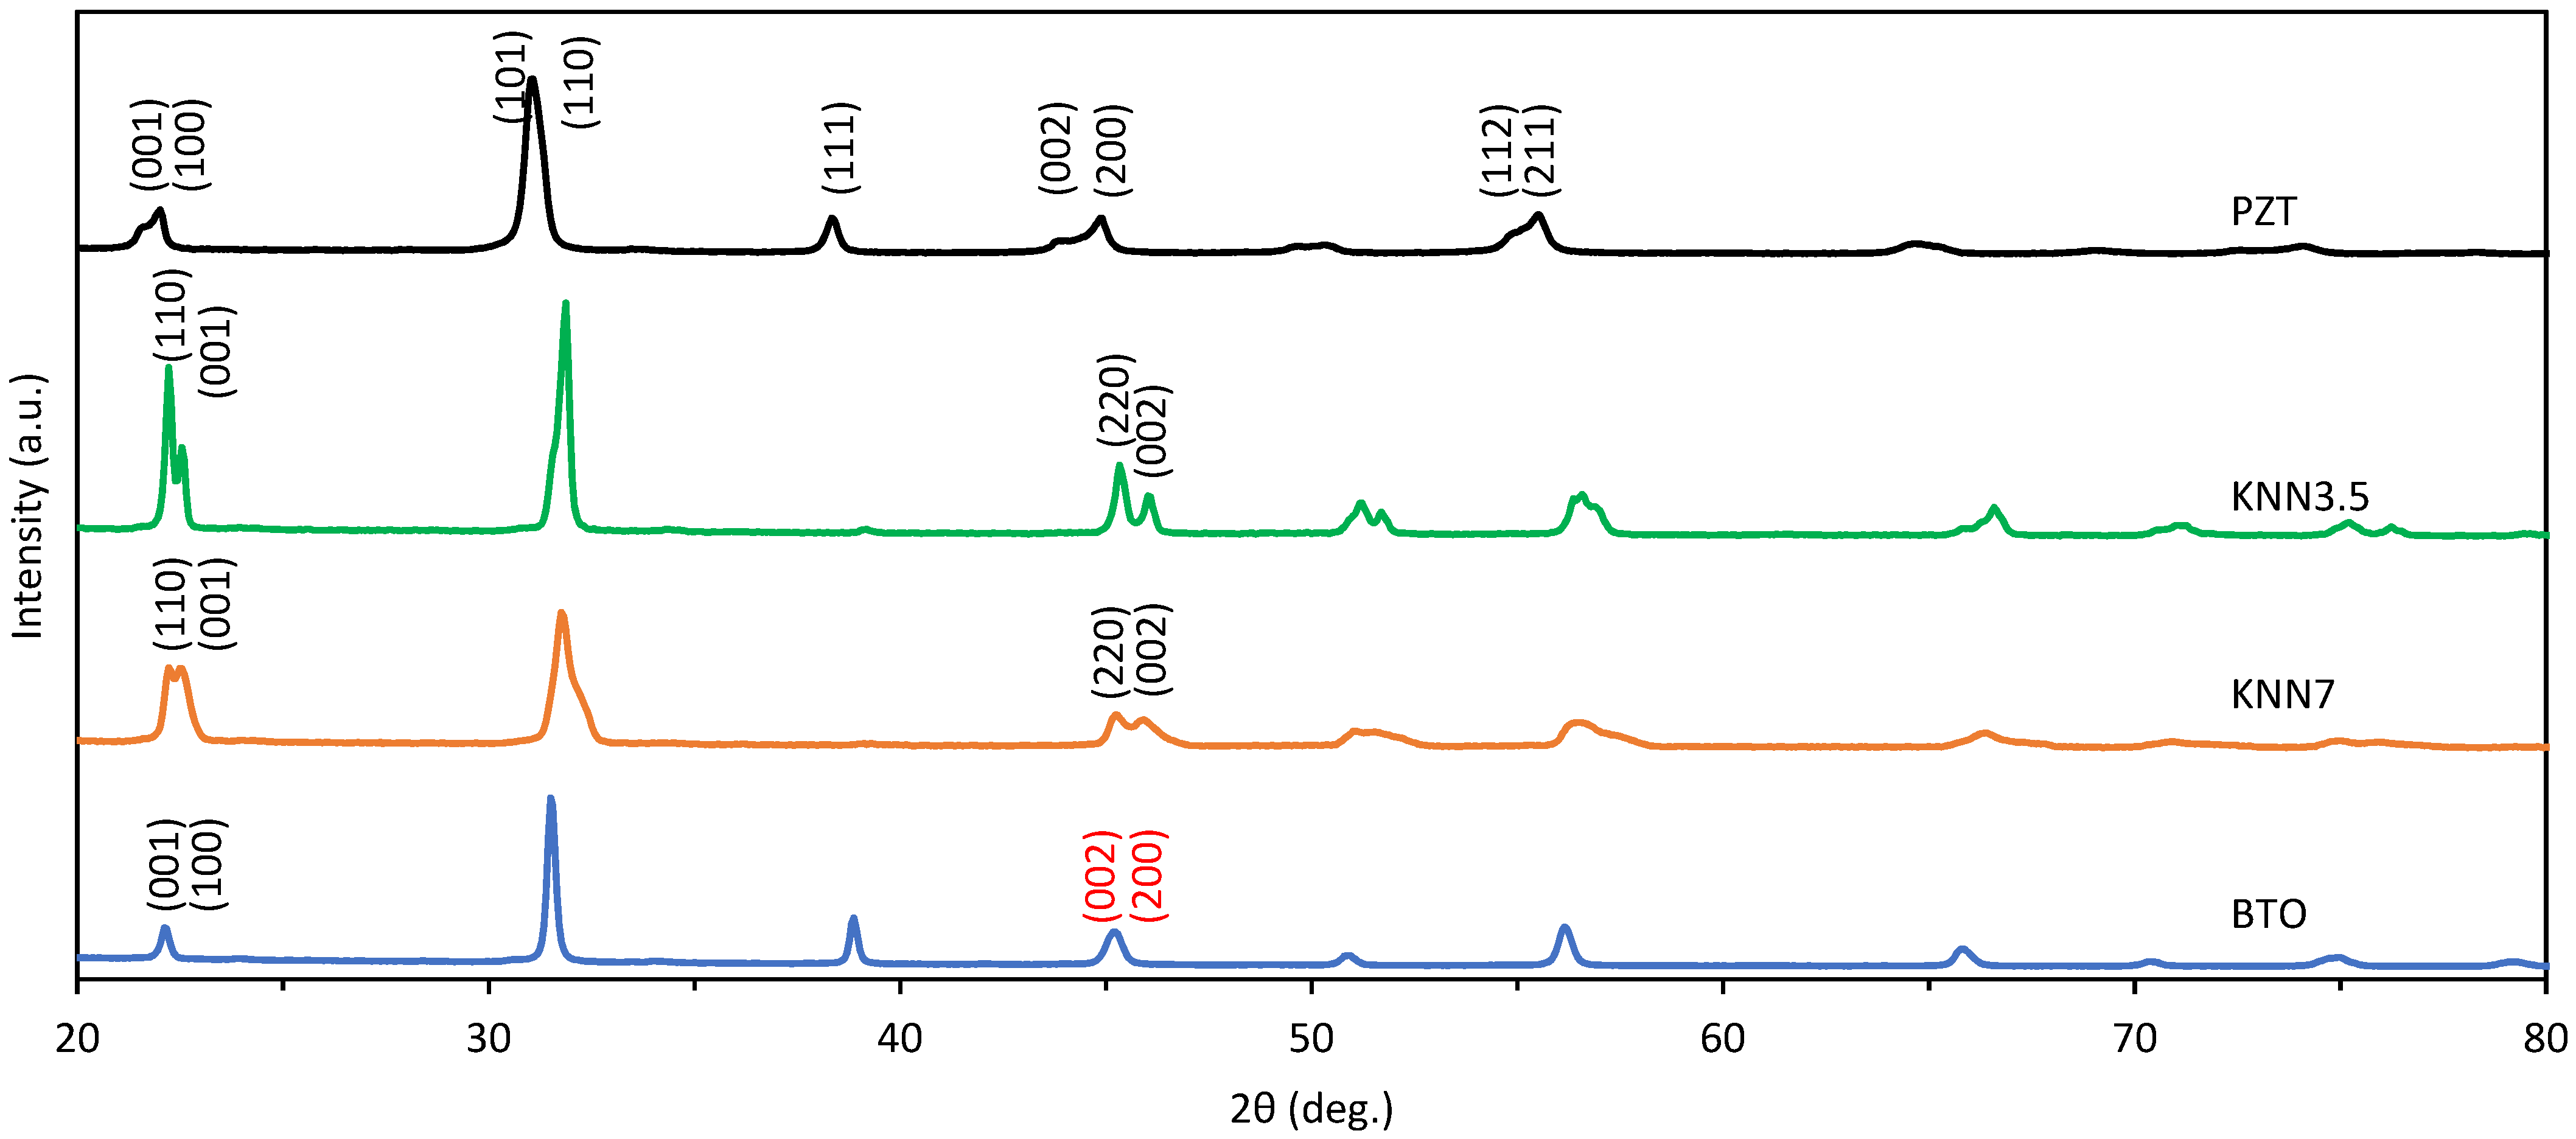
3.1. X-ray Diffraction of Ceramic Particles

X-ray diffraction (XRD) was used to prove whether ceramic particles used in this study were indeed piezoelectric. The results are presented in Figure 2. The XRD pattern of the BTO ceramic reveals no splitting of the (002)/(200) peaks (Figure 2, shown in red), which is indicative of the piezoelectric tetragonal crystal phase. No splitting of the peaks suggests a cubic lattice structure for the ceramic, without piezoelectric properties [79,80]. The literature also reports nanosized BTO particles (<200 nm) with a cubic lattice structure [38,81,82], and in this study we used ≈122 nm BTO particles, further proving the possibility of no piezoelectric effect occurring in the BTO ceramic used in this study. The XRD pattern of the KNN3.5 particles, on the other hand, shows similarities to orthorhombic KNN patterns reported in the literature [68,70,83,84,85], which have piezoelectric properties. The intensity ratio between (220)/(002) peaks at about 1.52 also suggests a highly orthorhombic lattice structure [84]. KNN7 shows peaks at very similar 2θ degrees in the XRD patterns; however, the peaks are lower compared to KNN3.5. A decrease in the ratio between (220)/(002) peaks (a decrease from 1.52 to 1.1) suggests some co-existence of both orthorhombic and tetragonal phases [84], where both of them are piezoelectric. The XRD pattern of PZT used in this study fits the piezoelectric tetragonal phase pattern reported in the literature [86,87,88,89], with clear peaks in intensities at 21.6°, 22°, 43.9°, and 44.9° [88]. Therefore, only the BTO piezoelectric ceramic used in this study did not have piezoelectric properties, most likely because of the nano-scale particle size.

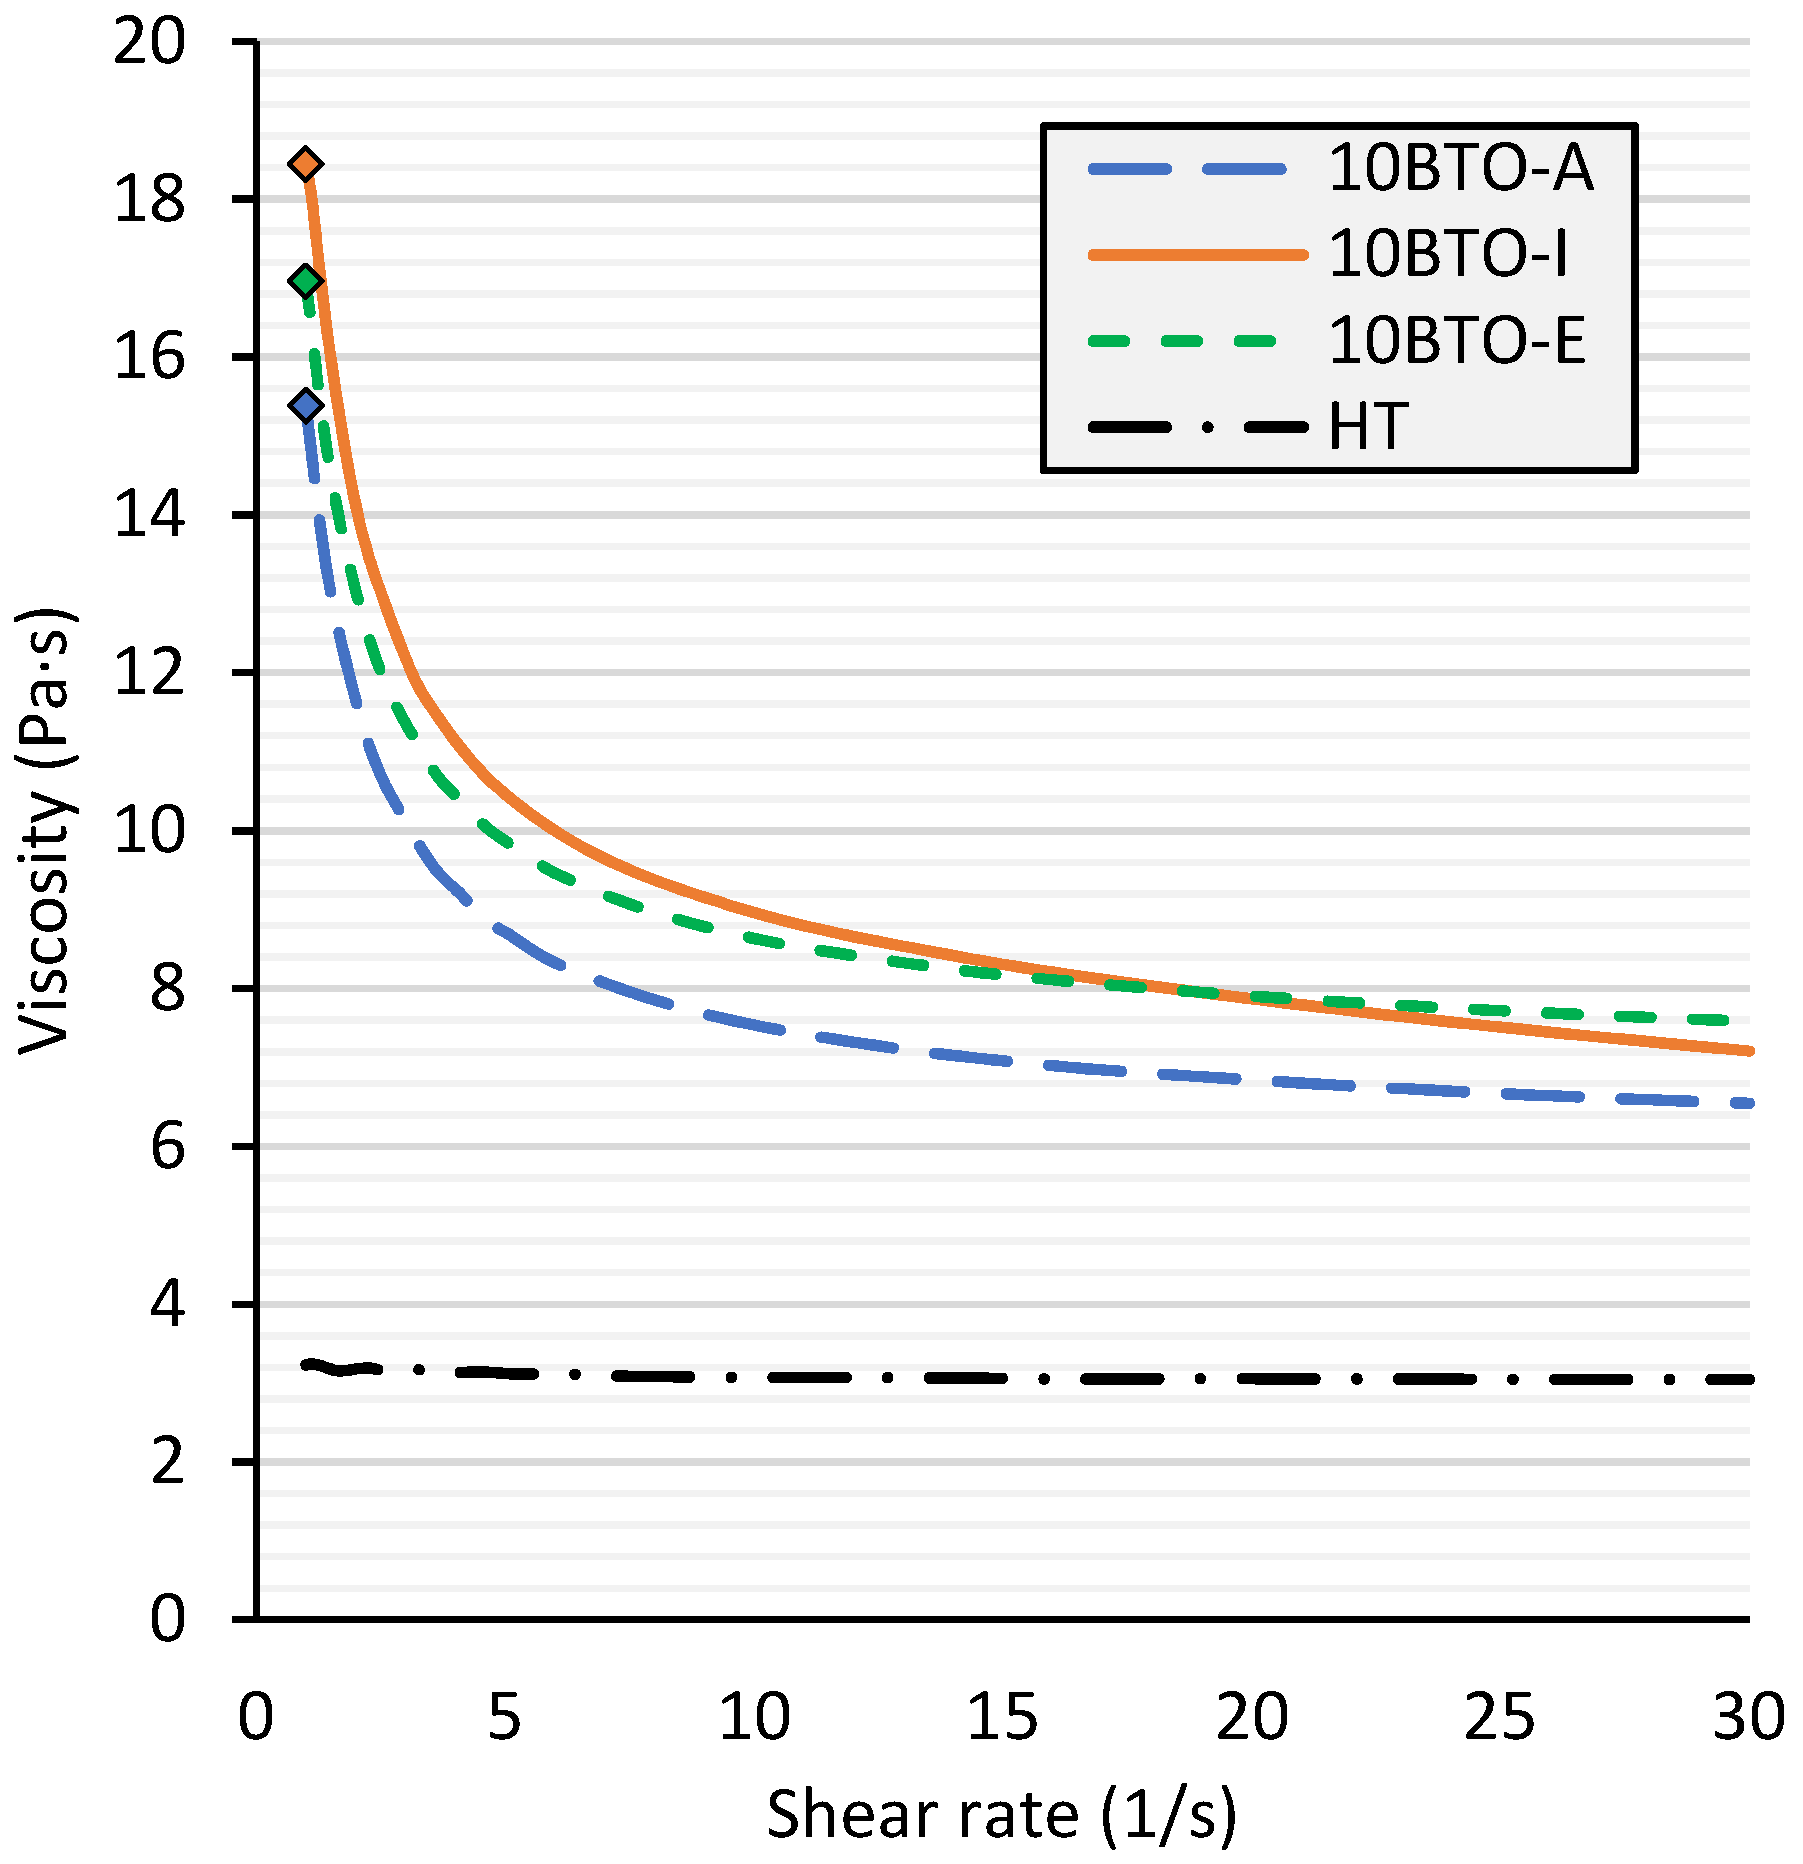
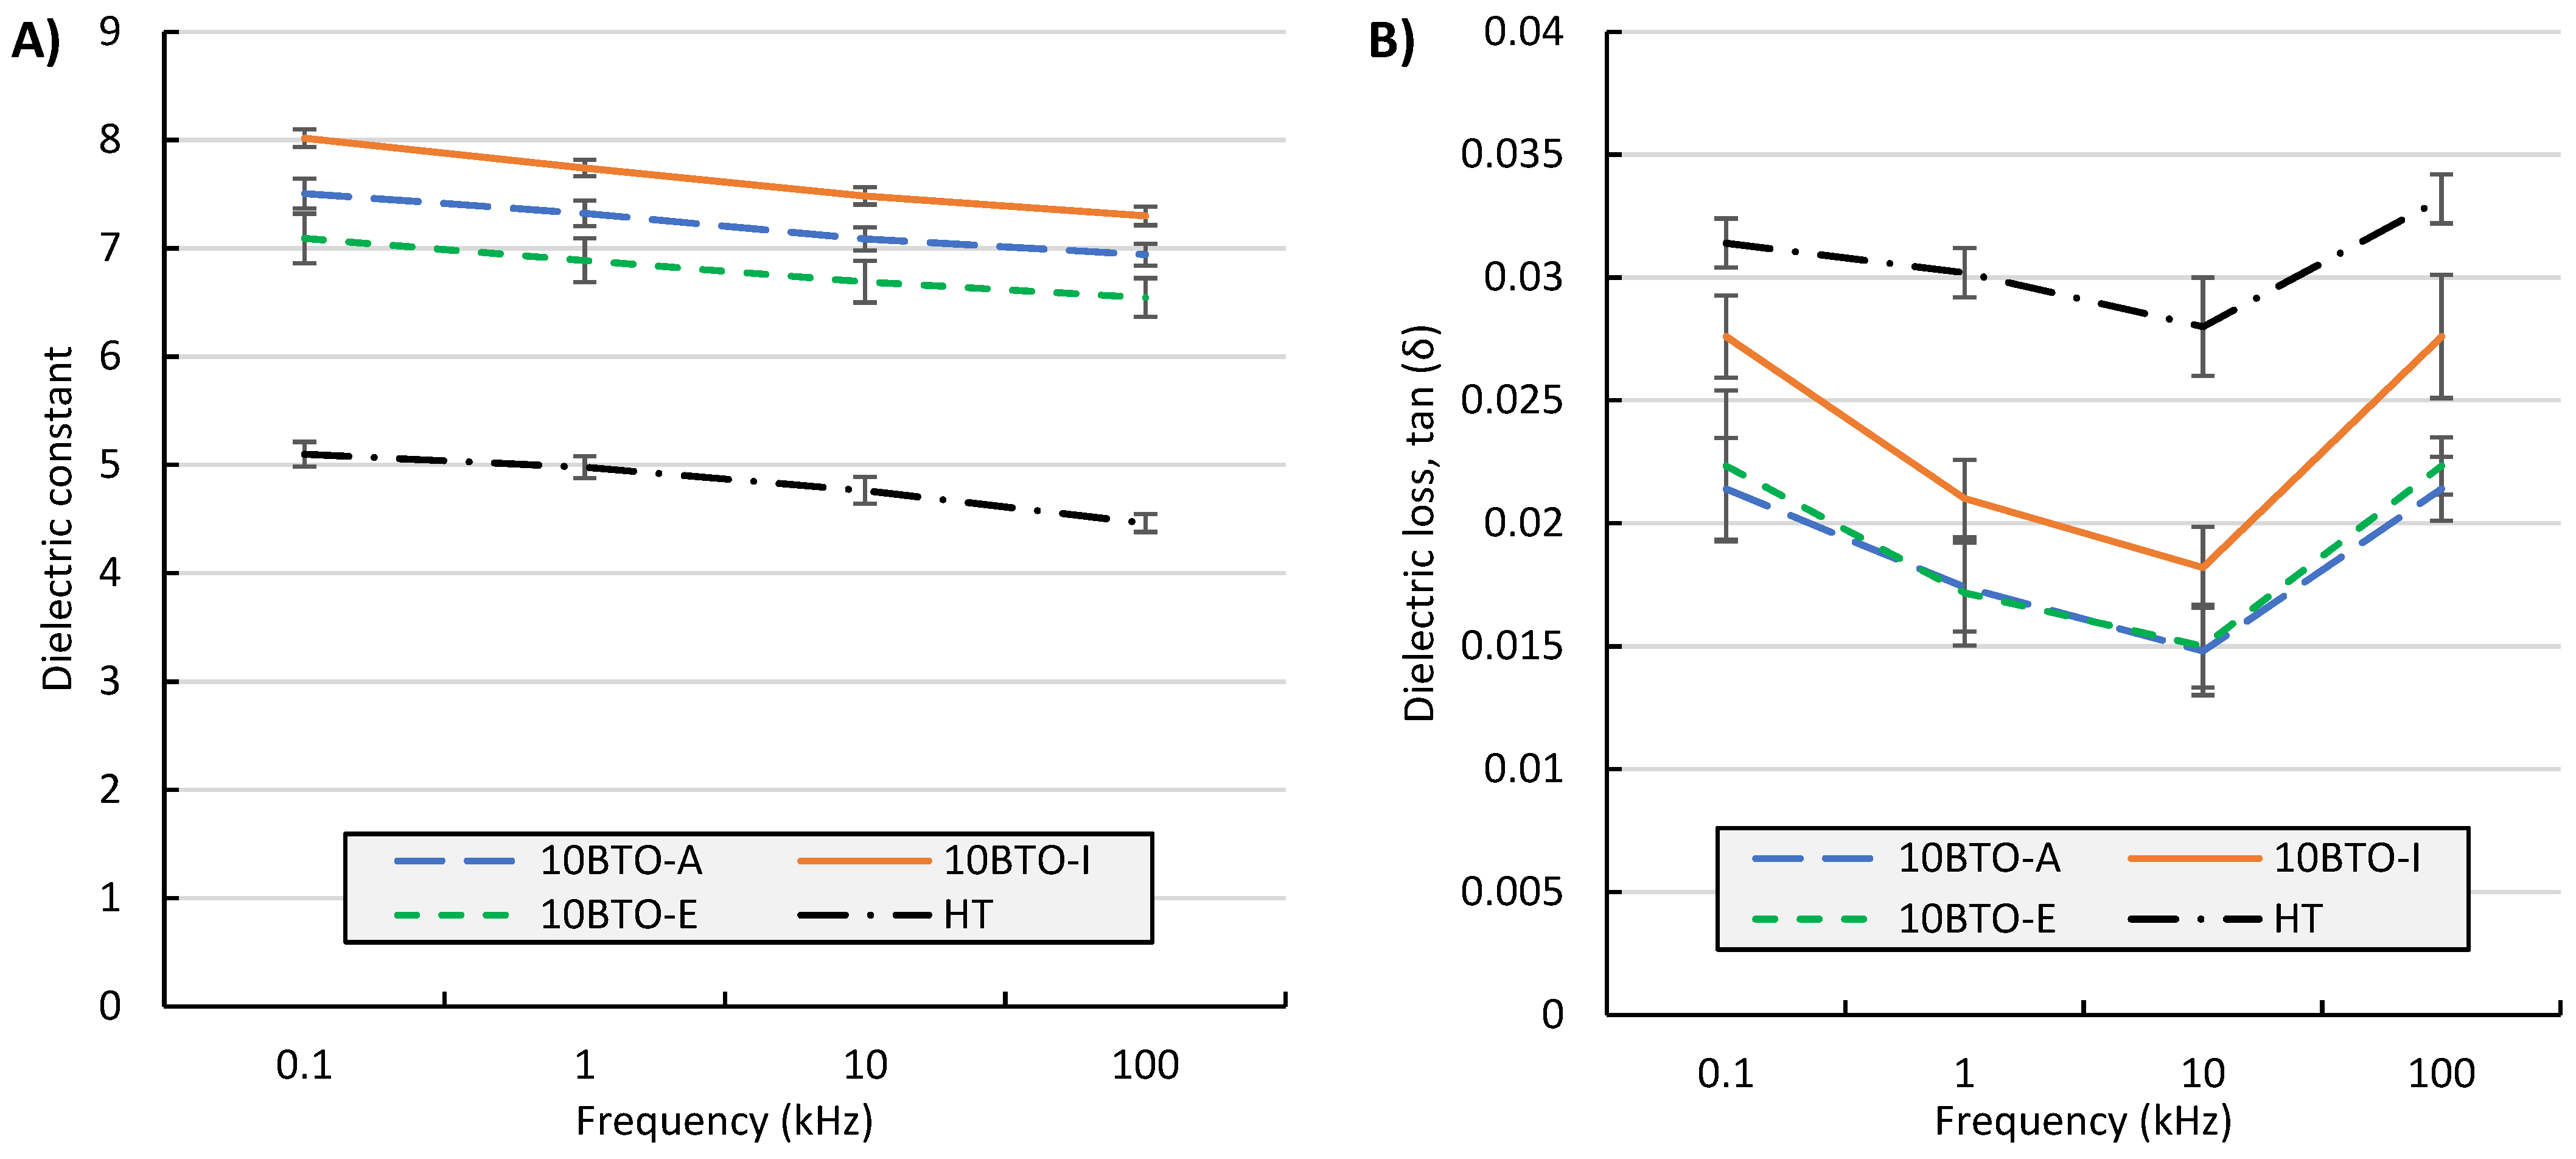
3.2. Solvent Influence on Composite Properties

The influence of the solvent used for the particle dispersion (acetone, isopropyl alcohol, ethanol) on the suspension viscosity, curing depth, dielectric properties, and ceramic particle dispersion quality was investigated. The BTO particles, being the smallest, were selected for solvent influence experiments as the most problematic to disperse into the photopolymer. In the following results, “10BTO-A” represents 10 vol.% BTO/photopolymer compositions, where the last letter indicates the solvent used for the material dispersion. Here, “A” represents acetone, “I” represents isopropyl alcohol, and “E” represents ethanol. The letters “HT” represents the pristine “High-Temperature V2” photopolymer without any inclusions, ultrasonication, or other treatments.
Figure 3 presents the viscosity of values 10 vol.% BTO/photopolymer suspensions, which were prepared with different solvents. The viscosity decreases with the shear rate, as expected. Using acetone as the solvent produced suspensions with a slightly lower viscosity than when using other solvents. The exact reason is unclear and could be due to a measurement error or some residue in the acetone.
Figure 4 shows the curing depths of the 10 vol.% BTO/photopolymer suspensions. The suspension dispersed in isopropyl alcohol shows the highest curing depth, while ethanol use as a solvent produces the lowest curing depth. Our previous experiments with nanomaterials in photopolymers suggested that a better dispersion of particles in the photopolymers leads to a reduced curing depth [78]. Therefore, it can be assumed that ethanol provides the best particle dispersion compared to the two other solvents used here. Interestingly, the suspension prepared with acetone produces a very high standard deviation for the curing depth results, especially at longer curing times.
A small residue of acetone in the suspensions could have evaporated during the curing of the composites, where longer exposure to UV light produced a higher degree of evaporation. The evaporation of acetone could have caused small voids inside the curing depth specimens, which in turn may have produced slightly rougher surfaces for the curing depth specimens. The roughness of the surfaces increased with increasing UV light exposure. This explains both the higher variation in curing depth at longer UV light exposure times and also the slightly lower viscosity of the suspension dispersed with acetone. Therefore, longer evaporation times might be considered for acetone.
Figure 5 shows the microstructures of the composites at two different magnifications.
The lighter colors indicate ceramic particles while the darker grey colors indicate photopolymers. From the first impression, the suspensions dispersed in both acetone and ethanol show the lowest number of dark grey areas (Figure 5, shown in red circles), indicating better dispersion. Furthermore, these two composites also show a high number of single particles in the cross-section. No sedimentation of particles was observed from lower magnification images (not shown here).
All three solvents investigated in this study are polar and are perfectly suited to disperse the polar piezoelectric ceramic particles used here. However, not all solvents are equally polar, whereby isopropyl alcohol has the lowest polarity and ethanol the highest. The highest polarity solvents are best suited to disperse polar particles, and the results shown in Figure 5 fit perfectly with this assumption.
The addition of the 10 vol.% piezoelectric ceramic into photopolymer increases the dielectric constant and decreases the dielectric loss, as shown in Figure 6. The lower relative permittivity of 10BTO-E suggests a better particle dispersion [90] because the better dispersion increases the amount of photopolymer in between the ceramic particles in the path of the electric flux and causes slightly lower permittivity. Very interestingly, the relative permittivity values follow the same trend as the curing depth results, agreeing with the hypothesis of improved particle dispersion when using ethanol.
On the other hand, the dielectric loss results also follow curing depth but inversely. The dielectric loss defines how much energy the dielectric material loses during actuation and indirectly attributes it as a capacitor quality factor. Therefore, low values of dielectric loss are desired. Both the ethanol and acetone used for suspension preparation show the lowest dielectric loss, whereas composites dispersed with isopropyl alcohol show the highest relative permittivity and dissipation factor values.
Concluding the results, isopropyl alcohol seems to be the worst solvent used here for ceramic dispersion in the photopolymer because of it having the worst particle dispersion (see Figure 5D), highest increase in viscosity (Figure 3), highest dielectric constant, and highest dielectric loss (Figure 6B). The low polarity of isopropyl alcohol compared to acetone or ethanol is most likely responsible for this result.
In particular, a high increase in viscosity is problematic because higher ceramic contents are not achievable. Acetone produces an average curing depth and dielectric properties and shows a reasonably good particle dispersion rate comparable to ethanol. Overall, ethanol produced similar viscosity to isopropyl alcohol, it also produced the lowest curing depth and lowest dielectric properties (both indicating the most homogeneous particle dispersion). Its high polarity is beneficial in dispersing polar piezoelectric particles. The particle dispersion quality is one of the most important factors to achieve homogenous composite materials; therefore, ethanol was selected as a solvent for further composite material manufacturing with other ceramics. Furthermore, our previous research showed the best conductive nanomaterial dispersion for ethanol when the same photopolymer resin was used [78]. Ethanol was selected as the solvent here for further composite manufacturing.

3.3. Piezoelectric Ceramic Influence on Composite Properties

Four different ceramics (see Table 1) with three being piezoelectric (see XRD data) were mixed with “High-temperature V2” photopolymer at varying loadings up to 30 vol.% (with 10 vol.% increments). Only ethanol was used as a solvent for the particle dispersion. It is expected that variations in the ceramic particle size, type, and geometry will have different influences on the suspension viscosity, curing depth, solidified material’s dielectric properties, and microstructure.
In the following results, “10BTO” represents a 10 vol.% BTO/photopolymer composition, “20BTO” represents a 20 vol.% BTO/photopolymer, and so forth, whereby the ceramic materials are named according to Table 1. The letters “HT” represent a pristine “High-Temperature V2” photopolymer without any inclusions, ultrasonication, or other treatments. The data in this article are provided to make the comparison of the composites as straightforward as possible. Additional graphs of the results presented here can be found in the Supplementary Materials, together with numerical values.
Figure 7 shows the viscosities of all manufactured suspensions, combined by volume loading for comparison. The viscosities of all suspensions, presented separately for every ceramic type, can be found in the Supplementary Materials (see Figure S1). In Figure 7C, 30PZT, 30BTO, 30KNN3.5, and 30KNN7 show values of 89.81 Pa·s, 2735 Pa·s, 2040 Pa·s, and 2270 Pa·s at a shear rate of 1 s−1, respectively. The results show that the smallest particles produce the highest viscosity (BTO composites) and the biggest particles produce the lowest viscosity (PZT composites). This is because of the increased particle surface area (therefore number of contacts between particles) when smaller particles are used, which is especially observable at lower shear rates. Similar observations are reported in the literature [56,91]. The results for both KNN composites also show higher suspension viscosity values for composites with smaller KNN particles. An exception is 20BTO, which shows lower viscosity compared to 20KNN7, although it contained two-fold smaller spherical particles. While the higher particle size distribution of KNN7 ceramic should lower the viscosity of the suspension, the irregular geometry of the particles increases their surface area and the probability of particle–particle interactions, which could cause higher viscosity. However, KNN7’s viscosity is above BTO only at 20 vol.%, meaning the result might be attributed to inaccuracies during measurement.
Interestingly, the 10PZT composite shows a much lower viscosity than pure photopolymer. Since it is impossible that the addition of 10 vol.% ceramic would not increase the suspension viscosity, this could mean that ethanol used as a solvent together with the ultrasonication procedure reduces the viscosity of the photopolymer itself. A very similar 30 vol.% PZT/photopolymer viscosity at a shear rate of 1 s−1 is also reported in the literature [92], but no details about the particle size or geometry are given. The viscosity of 30PZT is extremely low compared to the other ceramics used here. The PZT used in this study has the highest particle size deviation, i.e., both very small and very big particles are present, which usually lowers the suspension’s viscosity, since the smallest particles can work as a lubricant. Furthermore, PZT particles are the heaviest, meaning partial sedimentation could have occurred; however, this still does not explain the extremely low viscosity of 10PZT.
A further increase in the ceramic content would sharply increase the viscosity [5,91]. Interestingly, the change in viscosity of the BTO suspensions increases by roughly ten-fold when the ceramic content is increased by 10 vol.%. Other ceramics (bigger particles, non-spherical geometry, higher particle size distribution) do not follow this trend.
The curing depth shows how deep the UV light can penetrate the suspension and solidify it. This parameter is extremely important because a low curing depth reduces the maximum composite thickness and increases the complexity of the composite manufacturing. If thicker composites are needed, varying mechanical and dielectric properties over the material cross-section can occur, rendering the material characterization problematic.
Figure 8 shows the curing depths of the suspensions over time, and below the graphs the average particle sizes, as measured from SEM images, are written. The charts are presented from smallest to largest ceramic particle size to highlight a visible trend. At lower particle concentrations (10 vol.%), the curing depth shows a dependency on the particle size, whereby smaller particles produce greater UV light blocking or scattering. Similar results are reported in the literature [23,59]. Mixed results are achieved for the higher particle concentrations, especially for PZT, which does not follow the trend at all at higher loadings and produced the lowest curing depth, even with the largest particle mean size. It is well known from the literature that the particle light scattering ability is proportional to the square of the refractive index difference between the ceramic particles and photopolymer [9,23,48,58,59,60,61]. The refractive indexes of the ceramic materials used in this study are quite similar (see Table 1), except for PZT, which has the highest refractive index. In addition, the high deviation in the particle sizes of the PZT ceramic lowers the curing depth even further [60], especially at higher PZT loadings, whereby smaller particles are trapped between bigger particles and block more UV light. The PZT particle size distribution might also be slightly increased after the ultrasonic dispersion, whereby the smallest particles detach from the bigger particle surfaces (see Figure 1D). Therefore, a high refractive index and high particle size distribution are believed to be the main contributing factors to very low curing depths at higher PZT loadings.
Comparing results of other ceramics without PZT, the trend of increasing curing depth with increasing particle size at 20 vol.% filling is barely visible, especially between both KNN ceramics. No trend can be recognized at 30 vol.% fillings anymore, where 30KNN7 produced almost the same curing depth as 30BTO. It must be noted that KNN7 has bigger particles than BTO, but they have sharp edges and irregular geometry opposite to highly spherical BTO particles. Therefore, results suggest that the irregular geometry of the particles decreases the curing depth more. The same can be applied to PZT, which has also irregular particles, and by combining other factors described above, produces the lowest curing depth at higher ceramic loadings.
Since in literature mixed results regarding particle size influence on curing depth are presented [3,18,59,60], it is possible, that particle sizes close to the UV light wavelength used might absorb UV light instead of scattering it. 30KNN7 has the particle size closest to the UV light wavelength used here (405 nm) and therefore could have higher light absorption compared to other ceramic particle sizes used in this study, which might be another contributing factor to a small curing depth at higher KNN7 loading.
Concluding, irregular particle geometry (KNN7 and PZT) seems to block/scatter more UV light at higher ceramic loadings (30 vol.%) and thus produce lower curing depths than spherical or cubical particles. Furthermore, high particle size distribution has a very negative effect on the curing depth at higher ceramic concentrations, as the PZT composites show.
Figure 9 shows SEM images of 30 vol.% composites made with different ceramic particles. Because of the high variation in particle size, Figure 9A,B are shown at a magnification of 50,000× and Figure 9C,D are shown at a magnification of 20,000×. From the SEM images, good dispersion is visible for all composites. Some voids (red circles, see Figure 9A,B) are present in the BTO and KNN7 composites, containing the smallest particles. The composites with bigger particles do not show any voids. The yellow arrows in Figure 9 mark places where the ceramic particles are missing, because they were dropped when the manual composite broke before the SEM imaging. The areas with dropped particles are not marked on the BTO composite because the composite misses so many particles that the yellow arrows would cover the whole SEM image if shown. KNN7 and PZT show fewer spots with missing particles, indicating a stronger interface with the photopolymer resin, which most likely was caused by having an irregular particle geometry opposite to spherical BTO or cubical KNN3.5 particles.
When developing piezoelectric composite sensors, a low dielectric constant provides a larger piezoelectric voltage coefficient [1], which is important for piezoelectric sensors. The dielectric loss (dissipation factor tan (δ)) should always be as low as possible for piezoelectric composites; otherwise, a huge portion of the signal generated by the composite will be dissipated [1,54] and the application of a high voltage during polarization will be more difficult [93].
Figure 10 shows the dielectric constant values (relative permittivity, er) and Figure 11 shows the dielectric loss values for all piezoelectric composites manufactured in this study. The dielectric constant increases with the ceramic loading as expected [94], while the dissipation factor slightly decreases at lower ceramic loadings (10 vol.%) and starts to increase at higher ceramic loadings. The dielectric constant values of all composites decrease with frequency, as widely reported in the literature, because of the dominating interfacial polarization (space charge polarization) in the composite material. With increasing frequency, the dipoles cannot keep up with the fast-changing electric field and do not contribute to the dielectric properties anymore [95]. On the other hand, the dielectric losses are the highest at low frequencies (100 Hz), which then decrease and start to increase again at 100 kHz. This trend is followed for all ceramics except PZT, which shows opposite results.
All compositions ≤ 20 vol.% show very small standard deviations in terms of the measurements. However, all compositions with 30 vol.% of ceramic show high standard deviations for both the dielectric constant and dielectric loss. It must be noted that the dielectric properties of 30 vol.% composites were unfortunately measured from a very low number of specimens (3 or 2 only), while the other compositions had 5 to 6 specimens for every configuration. Most specimens broke while removing the protecting tape after sputtering. The addition of 30 vol.% ceramic made the composites extremely brittle. Some composite configurations also bent to a high degree after solidification because of the residual stresses introduced by the polymerization reaction, which complicated the electrode deposition. Furthermore, the 30PZT composite did not fully solidify after 10 min because of the extremely low curing depth (see Figure 8D), and solidification over a total of 20 min was used for the 30PZT composite.
Multiple factors can influence the high deviation in the results at 30 vol.%, including an uneven electrode thickness, varying degrees of photopolymer curing over the cross-section, particle agglomeration, and voids. Looking at the curing depth results (see Figure 8), all compositions with a 30 vol.% show curing depths below 100 μm, while the thickness of the tape-cast specimens was also around 100 μm. From experience, it is known that some UV light is reflected from the sides of the curing device used in this study, and a small portion of UV light comes from the bottom of the device through the glass on which the specimens are cast. Therefore, specimens with 30 vol.% may have varying degrees of curing throughout the cross-section, whereby some places in the same composite specimen can have higher or lower degrees of curing. This varying degree of curing could produce a high variation in the results. A high level of deviation can also occur because of ceramic particle agglomerations in the suspension or air voids. Voids indeed appear in the SEM images of 30BTO and 30KNN7, but a high standard deviation is observed for all ceramic types in this study, meaning the voids cannot be the only contributing factor. No agglomerations can be observed in SEM images.
All composites show quite similar dielectric constants at loadings ≤ 20 vol.%, although every composite was filled with varying combinations of the size, geometry, and types of piezoelectric particles. The smaller KNN particles (KNN7) at 30 vol.% loading show the highest dielectric constant er = 28.1 at 100 Hz, which does not fit the overall trend for the results. Very similar behavior for the composites with KNN at 30 vol.% loading has also been observed by other researchers [45], where it was attributed to the formation of a high number of interfaces between the KNN ceramic and polymer. Another study reported nanosized KNN (at 30 vol.%) showing a similar abrupt increase in dielectric constant at 10 kHz when using polyvinylidene fluoride (PVDF) as the matrix [44]. Furthermore, a composite with KNN3.5 particles also showed a slight increase in dielectric constant at 100 Hz, which suggests a slightly higher ceramic loading for bigger KNN particles is needed to achieve a similar dielectric constant to 30KNN7 at low frequencies. A decrease in the dielectric properties of KNN composites with increasing particle size was also reported in the literature [44], where nanosized particles were compared to micron-sized particles.
Looking at the dielectric constant values, the composite with 30 vol.% BTO particles achieves er = 17 at 1 kHz, which is about 2 times lower than for similar composites that were also made with photopolymers filled with BTO (with a particle size of 1 μm compared to ours at 0.12 μm) reported in the literature [22]. However, in the literature a different photopolymer was used, which itself had a dielectric constant er = ~10 at 1 kHz (double that used here), which contributed to the higher dielectric constant of the composite. Another comparison of the results can be made for 10PZT, which in this study shows er = 6.22 at 1 kHz, while in our previous results [24] showed very similar values of er = 5.77 at 1 kHz for rectangular sensors and er = 6.23–6.29 at 1 kHz for Y- and X-shaped sensors, respectively, although the suspension in the earlier study was mixed simply with a centrifugal mixer instead of a time-consuming ultrasonic dispersion process. This suggests that composites with a low ceramic content of micron-sized particles can be easily dispersed using a simple centrifugal mixing process.
The dielectric losses (see Figure 11) show mixed results, whereby most composites show higher dielectric losses at lower frequencies that decrease to a minimum at 10 kHz and start to increase at 100 kHz, except for PZT. The composites with PZT show very small decreases at 1 kHz and 10 kHz and a high increase in dielectric loss at 100 kHz. All composites with 10 vol.% loadings show lower dielectric losses at all frequencies measured than the photopolymer resin without particles. At 20 vol.%, the BTO and PZT composites show similar dielectric losses to the photopolymer, with some values being either slightly above or below the photopolymer’s values. Therefore, the results indicate that the addition of 20 vol.% of BTO or PZT ceramic particles does not alter the dielectric loss of the photopolymer in any significant way, while the dielectric constants are increased. The results for KNN composites are mixed, whereby 20KNN3.5 shows dielectric losses much lower than for the pure photopolymer and 20KNN7 shows lower dielectric losses at higher frequencies and high dielectric losses at low frequencies. A very high dielectric loss tan (δ) of 0.47 was measured for 30KNN7 at 100 Hz, followed by tan (δ) = 0.08 for 30KNN3.5 at 100 Hz. A full graph of 30KNN7 can be found in the Supplementary Materials (see Figure S4C). This abrupt increase in dielectric loss for both KNN composites follows the high values of the dielectric constant for both 30KNN7 and 30KNN3.5. The results for KNN composites fit quite well with the literature. The literature reports a very high tan (δ) = 1 at 100 Hz of KNN ceramic with 30 vol.% loading, which decreases by 5 times with a 40 vol.% loading of KNN [45]. The results in terms of the dielectric losses reported here also follow another study, where smaller KNN particles (nano size) produced much higher dielectric losses at low frequencies than micron-sized particles [44]. Therefore, the size of the KNN particles has a high influence on both the dielectric constant and dielectric loss, with smaller particles producing higher dielectric properties.
The literature reports the BTO ceramic itself not showing any significant dielectric losses up to MHz frequencies, indicating that any significant changes in the dielectric loss come from the polymer only [22]. Looking at Figure 11A, the result for the dielectric loss exactly follows the trend for the pure photopolymer resin, while the peaks and lows of the dielectric loss seem to be enhanced because of the addition of the BTO ceramic. In another study with three different UV-curable resins, different trends for dielectric losses over the frequency range were reported with the same ceramic loading [22], whereby the trend in terms of the dielectric loss is matrix-material-dependent, indicating that the composite matrix material is responsible for the dielectric loss behavior at frequencies in the <MHz range. In the literature, composites with 60 vol.% of 100 nm BTO particles in epoxy [39] and polyvinylidene fluoride (PVDF) [50] also showed higher dielectric losses at low frequencies (100 Hz), which decreased at average frequencies and started to increase again at higher frequencies (>10 kHz).
Comparing the dielectric loss results for PZT composites with the literature, high values were achieved in this study for the 30 vol.% (tan (δ) = 0.0302 at 1 kHz), whereas in the literature values between 0.02 and 0.04 were reported for composites with a 60 vol.% loading of similarly sized PZT particles [96]. Another study reported a decrease in the dielectric loss of the composite with the addition of PZT particles [27]; however, the matrix used in that study had quite a high dielectric loss itself, at tan (δ) = 0.1 (frequency unknown). One of the reasons for the high dielectric loss of PZT composites could have been the very low curing depth compared to the other composites investigated here. Our previous experiments showed that the lower curing degree of the photopolymer used here produces higher dielectric loss [78], because of the higher polymer chain mobility.
From the results and the literature, however, no clear influence of the particle size or geometry on the dielectric losses can be identified, except for KNN ceramic, which follows the results reported in the literature and produces high dielectric properties (both the dielectric constant and dielectric loss), especially at low frequencies.

4. Conclusions

Three different types of ceramics (4 different particle sizes) were successfully dispersed using an ultrasonic sonotrode up to 30 vol.% in a photopolymer resin with ethanol as the solvent and were solidified as thin layers using a UV post-curing device to form solid composites. Our investigation of the solvent’s influence on the particle dispersion showed isopropyl alcohol as the worst solvent in this study, owing to it having the lowest polarity, since high-polarity solvents are better suited to disperse polar piezoelectric ceramic particles. Both acetone and ethanol showed good particle dispersions; however, ethanol seems to produce a slightly better particle dispersion, based on the low dielectric values and SEM images.
After the selection of ethanol as the solvent for further experiments, suspensions with different ceramics and different loadings were prepared. The XRD analysis of the ceramics revealed that unfortunately the BTO ceramic used in this study is not piezoelectric. This was discovered after composite manufacturing. The prepared ceramic/photopolymer suspensions show decreasing viscosity values over the shear rate, indicating a shear thinning effect. Interestingly, the 10 vol.% loading of PZT decreased the viscosity of the suspension compared to the pristine photopolymer, most likely because of it having the highest particle size distribution and overall biggest mean particle size. While the smallest particles produced the highest viscosity, and the biggest particles produced the lowest viscosity, the results did not fit this trend perfectly. The curing depth results indicated an increase in curing depth with an increase in ceramic particle size at low ceramic contents (≤10 vol.%), but at higher ceramic concentrations the particle geometry, particle size distribution, and difference in refractive index seem to play a more important role. An irregular particle geometry and high particle size distribution should be avoided to achieve the highest curing depth, especially at higher ceramic loadings. The composites with the PZT ceramic, with highly irregular particles, a high refractive index, and a high particle size distribution, produced the worst curing depth results.
The SEM analysis of the solidified cross-sections showed a homogeneous particle distribution in all composites, with a few voids still existing, especially in composites with smaller particles. Poor particle–matrix adhesion was visible in all cross-section images, as indicated by the lost particles during composite breakage. However, the irregular particle geometry seems to leave fewer voids after breaking, suggesting a better particle–matrix interaction resulting from the higher surface contact between the particles and the matrix.
All ceramics investigated in this study produced very similar dielectric constants at both 10 vol.% and 20 vol.% loadings. However, the values for 30 vol.% ceramic loadings differed considerably, with both KNN composites producing the highest dielectric constants, especially at very low frequencies, as similarly reported in the literature. The dielectric losses also produced high values for respective KNN composites at 30 vol.% loadings, while BTO showed quite low dielectric losses for all loadings and all frequencies studied here.
In conclusion, the composites containing PZT (biggest particles, irregular geometry, very high particle size distribution) showed the lowest viscosity, the lowest curing depth, an average dielectric constant, and high dielectric losses (especially at higher frequencies). The composites containing BTO (smallest particles) showed the highest viscosity, second-lowest curing depth, an average dielectric constant, and low dielectric losses, but did not show any piezoelectric properties because of BTO’s cubic crystal structure. The composites filled with KNN showed average viscosities, high curing depths, and high dielectric properties.

Supplementary Materials

The following supporting information can be downloaded at: https://www.mdpi.com/article/10.3390/jcs6070212/s1. Figure S1: Viscosity values of ceramic/photopolymer suspensions over the shear rate. Figure S2: Curing depths of ceramic/photopolymer suspensions over the shear rate. Figure S3: Dielectric constant (relative permittivity) values at different frequencies at room temperature for piezoelectric composites. Figure S4: Dielectric loss (dissipation factor tan (δ)) values at different frequencies at room temperature for piezoelectric composites. Table S1: Viscosity values of ceramic/photopolymer suspensions over the shear rate at room temperature. Table S2: Curing depths of ceramic/photopolymer suspensions over time. Table S3: Dielectric constant (relative permittivity) and dielectric loss (dissipation factor tan (δ)) values at different frequencies at room temperature for piezoelectric composites.

Author Contributions

Conceptualization, methodology, software, validation, formal analysis, investigation, resources, data curation, writing—original draft preparation, writing—review and editing, visualization, supervision, project administration, R.M.; writing—review and editing, funding acquisition, M.S. All authors have read and agreed to the published version of the manuscript.

Funding

This research was funded by the German Research Foundation (Deutsche Forschungsgemeinschaft, DFG), grant number 389409970.

Institutional Review Board Statement

Not applicable.

Informed Consent Statement

Not applicable.

Data Availability Statement

Not applicable.

Acknowledgments

We acknowledge support by the Open Access Publication Funds of Technische Universität Braunschweig. The authors are grateful to Nippon Chemical Industrial Co., Ltd. (Tokyo, Japan) for providing the KNN materials used in this research. We thank Marion Görke for her help with the XRD measurements and we thank Bogdan Semenenko for his help with the SEM images. The authors thank Hui Gong for his help with the composite manufacturing and characterization.

Conflicts of Interest

The authors declare no conflict of interest. The funders had no role in the design of the study; in the collection, analyses, or interpretation of data; in the writing of the manuscript, or in the decision to publish the results.

References

  1. Akdogan, E.K.; Allahverdi, M.; Safari, A. Piezoelectric composites for sensor and actuator applications. IEEE Trans. Ultrason. Ferroelectr. Freq. Control 2005, 52, 746–775. [Google Scholar] [CrossRef] [PubMed]
  2. Bodkhe, S.; Ermanni, P. Challenges in 3D printing of piezoelectric materials. Multifunct. Mater. 2019, 2, 22001. [Google Scholar] [CrossRef]
  3. Chen, Z.; Li, Z.; Li, J.; Liu, C.; Lao, C.; Fu, Y.; Liu, C.; Li, Y.; Wang, P.; He, Y. 3D printing of ceramics: A review. J. Eur. Ceram. Soc. 2019, 39, 661–687. [Google Scholar] [CrossRef]
  4. Halloran, J.W. Ceramic Stereolithography: Additive Manufacturing for Ceramics by Photopolymerization. Annu. Rev. Mater. Sci. 2016, 46, 19–40. [Google Scholar] [CrossRef]
  5. Cha, J.; Lee, J.W.; Bae, B.; Lee, S.-E.; Yoon, C.-B. Fabrication and Characterization of PZT Suspensions for Stereolithography based on 3D Printing. J. Korean Ceram. Soc. 2019, 56, 360–364. [Google Scholar] [CrossRef] [Green Version]
  6. Zeng, Y.; Jiang, L.; Sun, Y.; Yang, Y.; Quan, Y.; Wei, S.; Lu, G.; Li, R.; Rong, J.; Chen, Y.; et al. 3D-Printing Piezoelectric Composite with Honeycomb Structure for Ultrasonic Devices. Micromachines 2020, 11, 713. [Google Scholar] [CrossRef]
  7. Dufaud, O.; Corbel, S. Stereolithography of PZT ceramic suspensions. Rapid Prototyp. J. 2002, 8, 83–90. [Google Scholar] [CrossRef]
  8. Singh, P.; Smith, L.S.; Bezdecny, M.; Cheverton, M.; Brewer, J.A.; Venkataramani, V. Additive manufacturing of PZT-5H piezoceramic for ultrasound transducers. In Proceedings of the 2011 IEEE International Ultrasonics Symposium (IUS), Orlando, FL, USA, 18–21 October 2011; IEEE: Piscataway, NJ, USA, 2011; pp. 1111–1114. [Google Scholar] [CrossRef]
  9. Chabok, H.; Zhou, C.; Chen, Y.; Eskandarinazhad, A.; Zhou, Q.; Shung, K. Ultrasound Transducer Array Fabrication Based on Additive Manufacturing of Piezocomposites. In Proceedings of the ASME/ISCIE 2012 International Symposium on Flexible Automation, St. Louis, MO, USA, 18–20 June 2012; pp. 433–444. [Google Scholar] [CrossRef]
  10. Woodward, D.I.; Purssell, C.P.; Billson, D.R.; Hutchins, D.A.; Leigh, S.J. Additively-manufactured piezoelectric devices. Phys. Status Solidi A 2015, 212, 2107–2113. [Google Scholar] [CrossRef] [Green Version]
  11. Chen, Z.; Song, X.; Lei, L.; Chen, X.; Fei, C.; Chiu, C.T.; Qian, X.; Ma, T.; Yang, Y.; Shung, K.; et al. 3D printing of piezoelectric element for energy focusing and ultrasonic sensing. Nano Energy 2016, 27, 78–86. [Google Scholar] [CrossRef] [Green Version]
  12. Song, X.; Chen, Z.; Lei, L.; Shung, K.; Zhou, Q.; Chen, Y. Piezoelectric component fabrication using projection-based stereolithography of barium titanate ceramic suspensions. Rapid Prototyp. J. 2017, 23, 44–53. [Google Scholar] [CrossRef]
  13. Komissarenko, D.A.; Sokolov, P.S.; Evstigneeva, A.D.; Shmeleva, I.A.; Dosovitsky, A.E. Rheological and Curing Behavior of Acrylate-Based Suspensions for the DLP 3D Printing of Complex Zirconia Parts. Materials 2018, 11, 2350. [Google Scholar] [CrossRef] [PubMed] [Green Version]
  14. Santawitee, O.; Grall, S.; Chayasombat, B.; Thanachayanont, C.; Hochart, X.; Bernard, J.; Debéda, H. Processing of printed piezoelectric microdisks: Effect of PZT particle sizes and electrodes on electromechanical properties. J. Electroceramics 2019, 188, 383. [Google Scholar] [CrossRef]
  15. Cheng, J.; Chen, Y.; Wu, J.-W.; Ji, X.-R.; Wu, S.-H. 3D Printing of BaTiO3 Piezoelectric Ceramics for a Focused Ultrasonic Array. Sensors 2019, 19, 4078. [Google Scholar] [CrossRef] [PubMed] [Green Version]
  16. Chen, W.; Wang, F.; Yan, K.; Zhang, Y.; Wu, D. Micro-stereolithography of KNN-based lead-free piezoceramics. Ceram. Int. 2019, 45, 4880–4885. [Google Scholar] [CrossRef]
  17. Kim, K.; Zhu, W.; Qu, X.; Aaronson, C.; McCall, W.R.; Chen, S.; Sirbuly, D.J. 3D Optical Printing of Piezoelectric Nanoparticle–Polymer Composite Materials. ACS Nano 2014, 8, 9799–9806. [Google Scholar] [CrossRef]
  18. Kim, K.; Middlebrook, J.L.; Chen, J.E.; Zhu, W.; Chen, S.; Sirbuly, D.J. Tunable Surface and Matrix Chemistries in Optically Printed (0–3) Piezoelectric Nanocomposites. ACS Appl. Mater. Interfaces 2016, 8, 33394–33398. [Google Scholar] [CrossRef]
  19. Yao, D.; Cui, H.; Hensleigh, R.; Smith, P.; Alford, S.; Bernero, D.; Bush, S.; Mann, K.; Wu, H.F.; Chin-Nieh, M.; et al. Achieving the Upper Bound of Piezoelectric Response in Tunable, Wearable 3D Printed Nanocomposites. Adv. Funct. Mater. 2019, 29, 1903866. [Google Scholar] [CrossRef]
  20. Tiller, B.; Reid, A.; Zhu, B.; Guerreiro, J.; Domingo-Roca, R.; Jackson, J.C.; Windmill, J. Piezoelectric microphone via a digital light processing 3D printing process. Mater. Des. 2019, 165, 107593. [Google Scholar] [CrossRef]
  21. Yang, Y.; Chen, Z.; Song, X.; Zhu, B.; Hsiai, T.; Wu, P.-I.; Xiong, R.; Shi, J.; Chen, Y.; Zhou, Q.; et al. Three dimensional printing of high dielectric capacitor using projection based stereolithography method. Nano Energy 2016, 22, 414–421. [Google Scholar] [CrossRef] [Green Version]
  22. Popielarz, R.; Chiang, C.K.; Nozaki, R.; Obrzut, J. Dielectric Properties of Polymer/Ferroelectric Ceramic Composites from 100 Hz to 10 GHz. Macromolecules 2001, 34, 5910–5915. [Google Scholar] [CrossRef]
  23. Jang, J.H.; Wang, S.; Pilgrim, S.M.; Schulze, W.A. Preparation and Characterization of Barium Titanate Suspensions for Stereolithography. J. Am. Ceram. Soc. 2000, 83, 1804–1806. [Google Scholar] [CrossRef]
  24. Mitkus, R.; Alashkar, A.T.; Sinapius, M. An Attempt to Topology Optimize 3D Printed Piezoelectric Composite Sensors for Highest D31 Output. In Proceedings of the ASME 2021 Conference on Smart Materials, Adaptive Structures and Intelligent Systems, Virtual, Online, 14–15 September 2021. [Google Scholar] [CrossRef]
  25. Cui, H.; Hensleigh, R.; Yao, D.; Maurya, D.; Kumar, P.; Kang, M.G.; Priya, S.; Zheng, X. Three-dimensional printing of piezoelectric materials with designed anisotropy and directional response. Nat. Mater. 2019, 18, 234–241. [Google Scholar] [CrossRef] [PubMed]
  26. Roloff, T.; Mitkus, R.; Lion, J.N.; Sinapius, M. (Eds.) 3D Printable Piezoelectric Composite Sensors for Guided Ultrasonic Wave Detection; MDPI: Basel, Switzerland, 2021. [Google Scholar] [CrossRef]
  27. Petrossian, G.; Aliheidari, N.; Ameli, A. Thermoplastic Polyurethane/Lead Zirconate Titanate/Carbon Nanotube Composites with Very High Dielectric Permittivity and Low Dielectric Loss. J. Compos. Sci. 2020, 4, 137. [Google Scholar] [CrossRef]
  28. Tang, J.; Liu, J.; Huang, H. Dielectric, Piezoelectric and Ferroelectric Properties of Flexible 0–3 Type PZT/PVDF Composites Doped with Graphene. J. Electron. Mater. 2019, 48, 4033–4039. [Google Scholar] [CrossRef]
  29. Gowdhaman, P.; Annamalai, V.; Thakur, O.P. Piezo, ferro and dielectric properties of ceramic-polymer composites of 0–3 connectivity. Ferroelectrics 2016, 493, 120–129. [Google Scholar] [CrossRef]
  30. Gowdhaman, P.; Antonyraj, K.; Annamalai, V. An effective approach on physical and dielectric properties of PZT-PVDF composites. Int. J. Adv. Sci. Res. 2015, 1, 322–328. [Google Scholar]
  31. Banerjee, S.; Cook-Chennault, K.A.; Du, W.; Sundar, U.; Halim, H.; Tang, A. Piezoelectric and dielectric characterization of corona and contact poled PZT-epoxy-MWCNT bulk composites. Smart Mater. Struct. 2016, 25, 115018. [Google Scholar] [CrossRef]
  32. Babu, I.; de With, G. Enhanced electromechanical properties of piezoelectric thin flexible films. Compos. Sci. Technol. 2014, 104, 74–80. [Google Scholar] [CrossRef]
  33. Babu, I.; de With, G. Highly flexible piezoelectric 0–3 PZT–PDMS composites with high filler content. Compos. Sci. Technol. 2014, 91, 91–97. [Google Scholar] [CrossRef]
  34. Sharma, S.K.; Gaur, H.; Kulkarni, M.; Patil, G.; Bhattacharya, B.; Sharma, A. PZT–PDMS composite for active damping of vibrations. Compos. Sci. Technol. 2013, 77, 42–51. [Google Scholar] [CrossRef]
  35. Narita, F.; Wang, Z.; Abe, S. On the Energy Harvesting Potential of Lead- Free Piezoelectric Composites from Air-Flow and Temperature Change. Res. Dev. Mater. Sci. 2018, 5, 000607. [Google Scholar] [CrossRef]
  36. Ferreira, O.B.; Venkat, R.S.; Adam, J.; Boller, C. Development of the Fabrication Process and Characterization of Piezoelectric BaTiO3/Epoxy Composite Used for Coated Ultrasonic Transducer Patterns in Structural Health Monitoring. In Proceedings of the 19th World Conference on Non-Destructive Testing, Munich, Germany, 13–17 June 2016. [Google Scholar]
  37. Chao, F.; Liang, G.; Kong, W.; Zhang, Z.; Wang, J. Dielectric properties of polymer/ceramic composites based on thermosetting polymers. Polym. Bull. 2008, 60, 129–136. [Google Scholar] [CrossRef]
  38. Patsidis, A.C.; Kalaitzidou, K.; Psarras, G.C. Carbon or Barium Titanate Reinforced Epoxy Resin Nanocomposites: Dielectric, Thermomechanical and Functional Behaviour. J. Adv. Phys. 2013, 2, 7–12. [Google Scholar] [CrossRef]
  39. Dang, Z.-M.; Yu, Y.-F.; Xu, H.-P.; Bai, J. Study on microstructure and dielectric property of the BaTiO3/epoxy resin composites. Compos. Sci. Technol. 2008, 68, 171–177. [Google Scholar] [CrossRef]
  40. Jeong, C.K.; Park, K.-I.; Ryu, J.; Hwang, G.-T.; Lee, K.J. Large-Area and Flexible Lead-Free Nanocomposite Generator Using Alkaline Niobate Particles and Metal Nanorod Filler. Adv. Funct. Mater. 2014, 24, 2620–2629. [Google Scholar] [CrossRef]
  41. Xue, Q.-T.; Wang, Z.; Tian, H.; Huan, Y.; Xie, Q.-Y.; Yang, Y.; Xie, D.; Li, C.; Shu, Y.; Wang, X.-H.; et al. A record flexible piezoelectric KNN ultrafine-grained nanopowder-based nanogenerator. AIP Adv. 2015, 5, 17102. [Google Scholar] [CrossRef]
  42. Gupta, M.K.; Kim, S.-W.; Kumar, B. Flexible High-Performance Lead-Free Na0.47K0.47Li0.06NbO3 Microcube-Structure-Based Piezoelectric Energy Harvester. ACS Appl. Mater. Interfaces 2016, 8, 1766–1773. [Google Scholar] [CrossRef]
  43. Zhang, P.; Wang, M.; Zhu, J.; Zhu, X. Lead-free piezoelectric composites with high piezoelectric performance and high dielectric constant caused by percolation phenomenon. J. Mater. Sci. Mater. Electron. 2014, 25, 4225–4229. [Google Scholar] [CrossRef]
  44. Ponraj, B.; Bhimireddi, R.; Varma, K.B.R. Effect of nano- and micron-sized K0.5Na0.5NbO3 fillers on the dielectric and piezoelectric properties of PVDF composites. J. Adv. Ceram. 2016, 5, 308–320. [Google Scholar] [CrossRef] [Green Version]
  45. Lin, J.; Chen, G.; Yang, W.; Li, H.; Lei, Q. New potassium sodium niobate/poly(vinylidene fluoride) functional composite films with high dielectric permittivity. J. Polym. Res. 2016, 23, 152. [Google Scholar] [CrossRef]
  46. Maeder, M.D.; Damjanovic, D.; Setter, N. Lead Free Piezoelectric Materials. J. Electroceramics 2004, 13, 385–392. [Google Scholar] [CrossRef]
  47. Mitkus, R.; Pierou, A.; Feder, J.; Sinapius, M. Investigation and Attempt to 3D Print Piezoelectric 0–3 Composites Made of Photopolymer Resins and PZT. In Proceedings of the ASME 2020 Conference on Smart Materials, Adaptive Structures and Intelligent Systems, Virtual, Online, 15 September 2020. [Google Scholar] [CrossRef]
  48. Griffith, M.L.; Halloran, J.W. Freeform Fabrication of Ceramics via Stereolithography. J. Am. Ceram. Soc. 1996, 79, 2601–2608. [Google Scholar] [CrossRef] [Green Version]
  49. Chan, H.L.; Cheung, M.C.; Choy, C.L. Study on BaTiO3/P(VDF-TrFE) 0–3 composites. Ferroelectrics 1999, 224, 113–120. [Google Scholar] [CrossRef]
  50. Mao, Y.P.; Mao, S.Y.; Ye, Z.-G.; Xie, Z.X.; Zheng, L.S. Size-dependences of the dielectric and ferroelectric properties of BaTiO3/polyvinylidene fluoride nanocomposites. J. Appl. Phys. 2010, 108, 014102. [Google Scholar] [CrossRef]
  51. Capsal, J.-F.; Dantras, E.; Dandurand, J.; Lacabanne, C. Electroactive influence of ferroelectric nanofillers on polyamide 11 matrix properties. J. Non-Cryst. Solids 2007, 353, 4437–4442. [Google Scholar] [CrossRef] [Green Version]
  52. Phan, T.T.M.; Chu, N.C.; Luu, V.B.; Xuan, H.N.; Pham, D.T.; Martin, I.; Carrière, P. Enhancement of polarization property of silane-modified BaTiO3 nanoparticles and its effect in increasing dielectric property of epoxy/BaTiO3 nanocomposites. J. Sci. Adv. Mater. Devices 2016, 1, 90–97. [Google Scholar] [CrossRef] [Green Version]
  53. Agarwal, V.; Chahal, P.; Tummala, R.R.; Allen, M.G. Improvements and recent advances in nanocomposite capacitors using a colloidal technique. In Proceedings of the 1998 Proceedings. 48th Electronic Components and Technology Conference (Cat. No.98CH36206), Seattle, WA, USA, 25–28 May 1998; pp. 165–170. [Google Scholar] [CrossRef]
  54. Cui, C.; Baughman, R.H.; Iqbal, Z.; Kazmar, T.R.; Dahlstrom, K. Piezoelectrics and Related Devices from Ceramics Dispersed in Polymers. U.S. Patent 5951908A, 14 September 1999. [Google Scholar]
  55. Han, K.; Safari, A.; Riman, R.E. Colloidal Processing for Improved Piezoelectric Properties of Flexible 0–3 Ceramic-Polymer Composites. J. Am. Ceram. Soc. 1991, 74, 1699–1702. [Google Scholar] [CrossRef]
  56. Cho, S.-D.; Lee, J.-Y.; Paik, K.-W. Effects of particle size on dielectric constant and leakage current of epoxy/barium titanate (BaTiO3) composite films for embedded capacitors. In Proceedings of the Advances in Electronic Materials and Packaging 2001 (Cat. No.01EX506), Jeju, Korea, 19–22 November 2001; pp. 63–68. [Google Scholar] [CrossRef]
  57. Sun, C.; Zhang, X. Experimental and numerical investigations on microstereolithography of ceramics. J. Appl. Phys. 2002, 92, 4796–4802. [Google Scholar] [CrossRef] [Green Version]
  58. Gentry, S.P.; Halloran, J.W. Depth and width of cured lines in photopolymerizable ceramic suspensions. J. Eur. Ceram. Soc. 2013, 33, 1981–1988. [Google Scholar] [CrossRef]
  59. Badev, A.; Abouliatim, Y.; Chartier, T.; Lecamp, L.; Lebaudy, P.; Chaput, C.; Delage, C. Photopolymerization kinetics of a polyether acrylate in the presence of ceramic fillers used in stereolithography. J. Photochem. Photobiol. A Chem. 2011, 222, 117–122. [Google Scholar] [CrossRef]
  60. Sun, C.; Zhang, X. The influences of the material properties on ceramic micro-stereolithography. Sens. Actuators A Phys. 2002, 101, 364–370. [Google Scholar] [CrossRef]
  61. Manapat, J.Z.; Chen, Q.; Ye, P.; Advincula, R.C. 3D Printing of Polymer Nanocomposites via Stereolithography. Macromol. Mater. Eng. 2017, 302, 1600553. [Google Scholar] [CrossRef]
  62. Nhuapeng, W.; Tunkasiri, T. Properties of 0–3 Lead Zirconate Titanate-Polymer Composites Prepared in a Centrifuge. J. Am. Ceram. Soc. 2002, 85, 700–702. [Google Scholar] [CrossRef]
  63. Lee, M.-H.; Halliyal, A.; Newnham, R.E. Poling studies of piezoelectric composites prepared by coprecipitated PbTiO3 powder. Ferroelectrics 1988, 87, 71–80. [Google Scholar] [CrossRef]
  64. Cho, S.-D.; Paik, K.-W. Relationships between suspension formulations and the properties of BaTiO3 epoxy composite films for integral capacitors. In Proceedings of the 2001 Proceedings. 51st Electronic Components and Technology Conference (Cat. No.01CH37220), Orlando, FL, USA, 29 May–1 June 2001; pp. 1418–1422. [Google Scholar]
  65. Hsiang, H.-I.; Lin, K.-Y.; Yen, F.-S.; Hwang, C.-Y. Effects of particle size of BaTiO3 powder on the dielectric properties of BaTiO3/polyvinylidene fluoride composites. J. Mater. Sci. 2001, 36, 3809–3815. [Google Scholar] [CrossRef]
  66. Gromada, M.; Biglar, M.; Trzepieciński, T.; Stachowicz, F. Characterization of BaTiO3 piezoelectric perovskite material for multilayer actuators. Bull. Mater. Sci. 2017, 40, 759–771. [Google Scholar] [CrossRef]
  67. Trzepiecinski, T.; Gromada, M. Characterization of mechanical properties of barium titanate ceramics with different grain sizes. Mater. Sci. 2018, 36, 151–156. [Google Scholar] [CrossRef] [Green Version]
  68. Kumar, P.; Pattanaik, M. Sonia Synthesis and characterizations of KNN ferroelectric ceramics near 50/50 MPB. Ceram. Int. 2013, 39, 65–69. [Google Scholar] [CrossRef]
  69. Wang, K.; Li, J.-F. (K, Na)NbO3-based lead-free piezoceramics: Phase transition, sintering and property enhancement. J. Adv. Ceram. 2012, 1, 24–37. [Google Scholar] [CrossRef] [Green Version]
  70. Bomlai, P.; Wichianrat, P.; Muensit, S.; Milne, S.J. Effect of Calcination Conditions and Excess Alkali Carbonate on the Phase Formation and Particle Morphology of Na0.5K0.5NbO3 Powders. J. Am. Ceram. Soc. 2007, 90, 1650–1655. [Google Scholar] [CrossRef]
  71. Yoon, M.-S.; Mahmud, I.; Ur, S.-C. Phase-formation, microstructure, and piezoelectric/dielectric properties of BiYO3-doped Pb(Zr0.53Ti0.47)O3 for piezoelectric energy harvesting devices. Ceram. Int. 2013, 39, 8581–8588. [Google Scholar] [CrossRef]
  72. Karvounis, A.; Timpu, F.; Vogler-Neuling, V.V.; Savo, R.; Grange, R. Barium Titanate Nanostructures and Thin Films for Photonics. Adv. Opt. Mater. 2020, 8, 2001249. [Google Scholar] [CrossRef]
  73. Wemple, S.H.; Didomenico, M.; Camlibel, I. Dielectric and optical properties of melt-grown BaTiO3. J. Phys. Chem. Solids 1968, 29, 1797–1803. [Google Scholar] [CrossRef]
  74. Umemura, N.; Yoshida, K.; Kato, K. Phase-matching properties of KNbO3 in the mid-infrared. Appl. Opt. 1999, 38, 991–994. [Google Scholar] [CrossRef]
  75. Singh, S.K.; Remeika, J.P.; Potopowicz, J.R. Nonlinear Optical Properties of Ferroelectric Lead Titanate. Appl. Phys. Lett. 1972, 20, 135–137. [Google Scholar] [CrossRef]
  76. Thacher, P.D. Refractive index and surface layers of ceramic (Pb,La)(Zr,Ti)O3 compounds. Appl. Opt. 1977, 16, 3210–3213. [Google Scholar] [CrossRef]
  77. Wang, F.; Drzal, L.T.; Qin, Y.; Huang, Z. Mechanical properties and thermal conductivity of graphene nanoplatelet/epoxy composites. J. Mater. Sci. 2015, 50, 1082–1093. [Google Scholar] [CrossRef]
  78. Mitkus, R.; Scharnofske, M.; Sinapius, M. Characterization 0.1 wt.% Nanomaterial/Photopolymer Composites with Poor Nanomaterial Dispersion: Viscosity, Cure Depth and Dielectric Properties. Polymers 2021, 13, 3948. [Google Scholar] [CrossRef]
  79. Li, X.; Shih, W.-H. Size Effects in Barium Titanate Particles and Clusters. J. Am. Ceram. Soc. 1997, 80, 2844–2852. [Google Scholar] [CrossRef]
  80. Panomsuwan, G.; Manuspiya, H. A comparative study of dielectric and ferroelectric properties of sol–gel-derived BaTiO3 bulk ceramics with fine and coarse grains. Appl. Phys. A 2018, 124, 713. [Google Scholar] [CrossRef]
  81. Yamamoto, T.; Niori, H.; Moriwake, H. Particle-Size Dependence of Crystal Structure of BaTiO3 Powder. Jpn. J. Appl. Phys. 2000, 39 Pt 1, 5683–5686. [Google Scholar] [CrossRef]
  82. Patsidis, A.C.; Kalaitzidou, K.; Anastassopoulos, D.L.; Vradis, A.A.; Psarras, G.C. Graphite nanoplatelets and/or barium titanate/polymer nanocomposites: Fabrication, thermomechanical properties, dielectric response and energy storage. J. Chin. Adv. Mater. Soc. 2014, 2, 207–221. [Google Scholar] [CrossRef]
  83. Skidmore, T.A.; Milne, S.J. Phase development during mixed-oxide processing of a [Na0.5K0.5NbO3]1−x–[LiTaO3]x powder. J. Mater. Res. 2007, 22, 2265–2272. [Google Scholar] [CrossRef]
  84. Dwivedi, S.; Pareek, T.; Kumar, S. Structure, dielectric, and piezoelectric properties of K0.5Na0.5NbO3-based lead-free ceramics. RSC Adv. 2018, 8, 24286–24296. [Google Scholar] [CrossRef] [Green Version]
  85. Zhu, F.; Skidmore, T.A.; Bell, A.J.; Comyn, T.P.; James, C.W.; Ward, M.; Milne, S. Diffuse dielectric behaviour in Na0.5K0.5NbO3–LiTaO3–BiScO3 lead-free ceramics. Mater. Chem. Phys. 2011, 129, 411–417. [Google Scholar] [CrossRef]
  86. Oliveira, C.A.; Longo, E.; Varela, J.A.; Zaghete, M.A. Synthesis and characterization of lead zirconate titanate (PZT) obtained by two chemical methods. Ceram. Int. 2014, 40, 1717–1722. [Google Scholar] [CrossRef]
  87. Khorsand Zak, A.; Majid, W.H.A.; Darroundi, M. Synthesis and characterization of sol-gel derived single- phase PZT nanoparticles in aqueous polyol solution. J. Optoelectron. Adv. Mater. 2010, 12, 1714–1719. [Google Scholar]
  88. Singh, A.P.; Mishra, S.K.; Pandey, D.; Prasad, C.D.; Lal, R. Low-temperature synthesis of chemically homogeneous lead zirconate titanate (PZT) powders by a semi-wet method. J. Mater. Sci. 1993, 28, 5050–5055. [Google Scholar] [CrossRef]
  89. Jin, W.; Wang, Z.; Huang, H.; Hu, X.; He, Y.; Li, M.; Li, L.; Gao, Y.; Hu, Y.; Gu, H. High-performance piezoelectric energy harvesting of vertically aligned Pb(Zr,Ti)O3 nanorod arrays. RSC Adv. 2018, 8, 7422–7427. [Google Scholar] [CrossRef] [Green Version]
  90. Robertson, J.; Varlow, B.R. Non-linear ferroelectric composite dielectric materials. IEEE Trans. Dielectr. Electr. Insul. 2005, 12, 779–790. [Google Scholar] [CrossRef]
  91. Chen, Z.; Li, J.; Liu, C.; Liu, Y.; Zhu, J.; Lao, C. Preparation of high solid loading and low viscosity ceramic slurries for photopolymerization-based 3D printing. Ceram. Int. 2019, 45, 11549–11557. [Google Scholar] [CrossRef]
  92. Cheverton, M.; Singh, P.; Smith, L.S.; Chan, K.P.; Brewer, J.A. Ceramic-polymer additive manufacturing system for ultrasound transducers. In Proceedings of the 23rd Annual International Solid Freeform Fabrication Symposium—An Additive Manufacturing Conference, SFF 2012, Austin, TX, USA, 6–8 August 2012; pp. 863–875. [Google Scholar] [CrossRef]
  93. Sakamoto, W.K.; De Souza, E.; Das-Gupta, D.K. Electroactive properties of flexible piezoelectric composites. Mater. Res. 2001, 4, 201–204. [Google Scholar] [CrossRef]
  94. Dang, Z.-M.; Yuan, J.-K.; Zha, J.-W.; Zhou, T.; Li, S.-T.; Hu, G.-H. Fundamentals, processes and applications of high-permittivity polymer–matrix composites. Prog. Mater. Sci. 2012, 57, 660–723. [Google Scholar] [CrossRef]
  95. Kao, K.C. Dielectric Phenomena in Solids; With Emphasis on Physical Concepts of Electronic Processes; Elsevier Academic Press: San Diego, CA, USA, 2004. [Google Scholar]
  96. Hanner, K.A.; Safari, A.; Newnham, R.E.; Runt, J. Thin film 0–3 polymer/piezoelectric ceramic composites: Piezoelectric paints. Ferroelectrics 1989, 100, 255–260. [Google Scholar] [CrossRef]
Figure 1. SEM images of piezoelectric ceramic particles used in this study (magnification ×50,000): (A) BTO; (B) KNN7; (C) KNN3.5; (D) PZT.
Jcs 06 00212 g001
Figure 2. XRD patterns of ceramic powders (as received) used in this study at room temperature.
Jcs 06 00212 g002
Figure 3. Viscosity values of 10 vol.% BTO/photopolymer suspensions dispersed with different solvents.
Jcs 06 00212 g003
Figure 4. Curing depths of 10 vol.% BTO/photopolymer suspensions dispersed with different solvents.
Jcs 06 00212 g004
Figure 5. SEM images of cross-sections of solidified 10 vol.% BTO/photopolymer suspensions dispersed with different solvents: (A) acetone (mag. ×20,000); (B) acetone (mag. ×50,000); (C) isopropyl alcohol (mag. ×20,000); (D) isopropyl alcohol (mag. ×50,000); (E) ethanol (mag. ×20,000); (F) ethanol (mag. ×50,000). Red circles show areas without particles.
Jcs 06 00212 g005
Figure 6. Dielectric properties of 10 vol.% BTO/photopolymer suspensions dispersed with different solvents: (A) dielectric constant; (B) dielectric loss.
Jcs 06 00212 g006
Figure 7. Viscosity values of ceramic/photopolymer suspensions over the shear rate: (A) 10 vol.% ceramic; (B) 20 vol.% ceramic; (C) 30 vol.% ceramic.
Jcs 06 00212 g007
Figure 8. Curing depths of piezoelectric composites made with (A) BTO, (B) KNN7, (C) KNN3.5, or (D) PZT.
Jcs 06 00212 g008
Figure 9. SEM images of cross-sections of solidified piezoelectric composites made with 30 vol.% of (A) BTO (magnification ×50,000), (B) KNN7 (magnification ×50,000), (C) KNN3.5 (magnification ×20,000), or (D) PZT (magnification ×20,000). Red circles show voids without particles and yellow arrows indicate places of missing particles dropped during composite breakage.
Jcs 06 00212 g009
Figure 10. Dielectric constant values (relative permittivity) at different frequencies at room temperature for piezoelectric composites filled with (A) BTO, (B) KNN7, (C) KNN3.5, or (D) PZT.
Jcs 06 00212 g010
Figure 11. Dielectric loss (dissipation factor tan (δ)) values at different frequencies at room temperature for piezoelectric composites filled with (A) BTO, (B) KNN7, (C) KNN3.5, or (D) PZT.
Jcs 06 00212 g011
Publisher’s Note: MDPI stays neutral with regard to jurisdictional claims in published maps and institutional affiliations.

