Nanocomposites of Copper Trimesinate and Graphene Oxide as Sorbents for the Solid-Phase Extraction of Organic Dyes
Abstract
:1. Introduction
2. Materials and Methods
2.1. Materials
2.2. Characterization Techniques
2.3. Synthesis of the Sorbent
2.3.1. Synthesis of Graphene Oxide
2.3.2. Synthesis of Nanocomposite
2.4. Dye Adsorption Study
2.4.1. Study of the Dependence of Sorption on the Initial Dye Concentration
2.4.2. Study of the Dependence of Sorption on Contact Time
2.4.3. Study of the Dependence of Sorption on the pH
2.4.4. Determining the Number of Work Cycles
3. Results
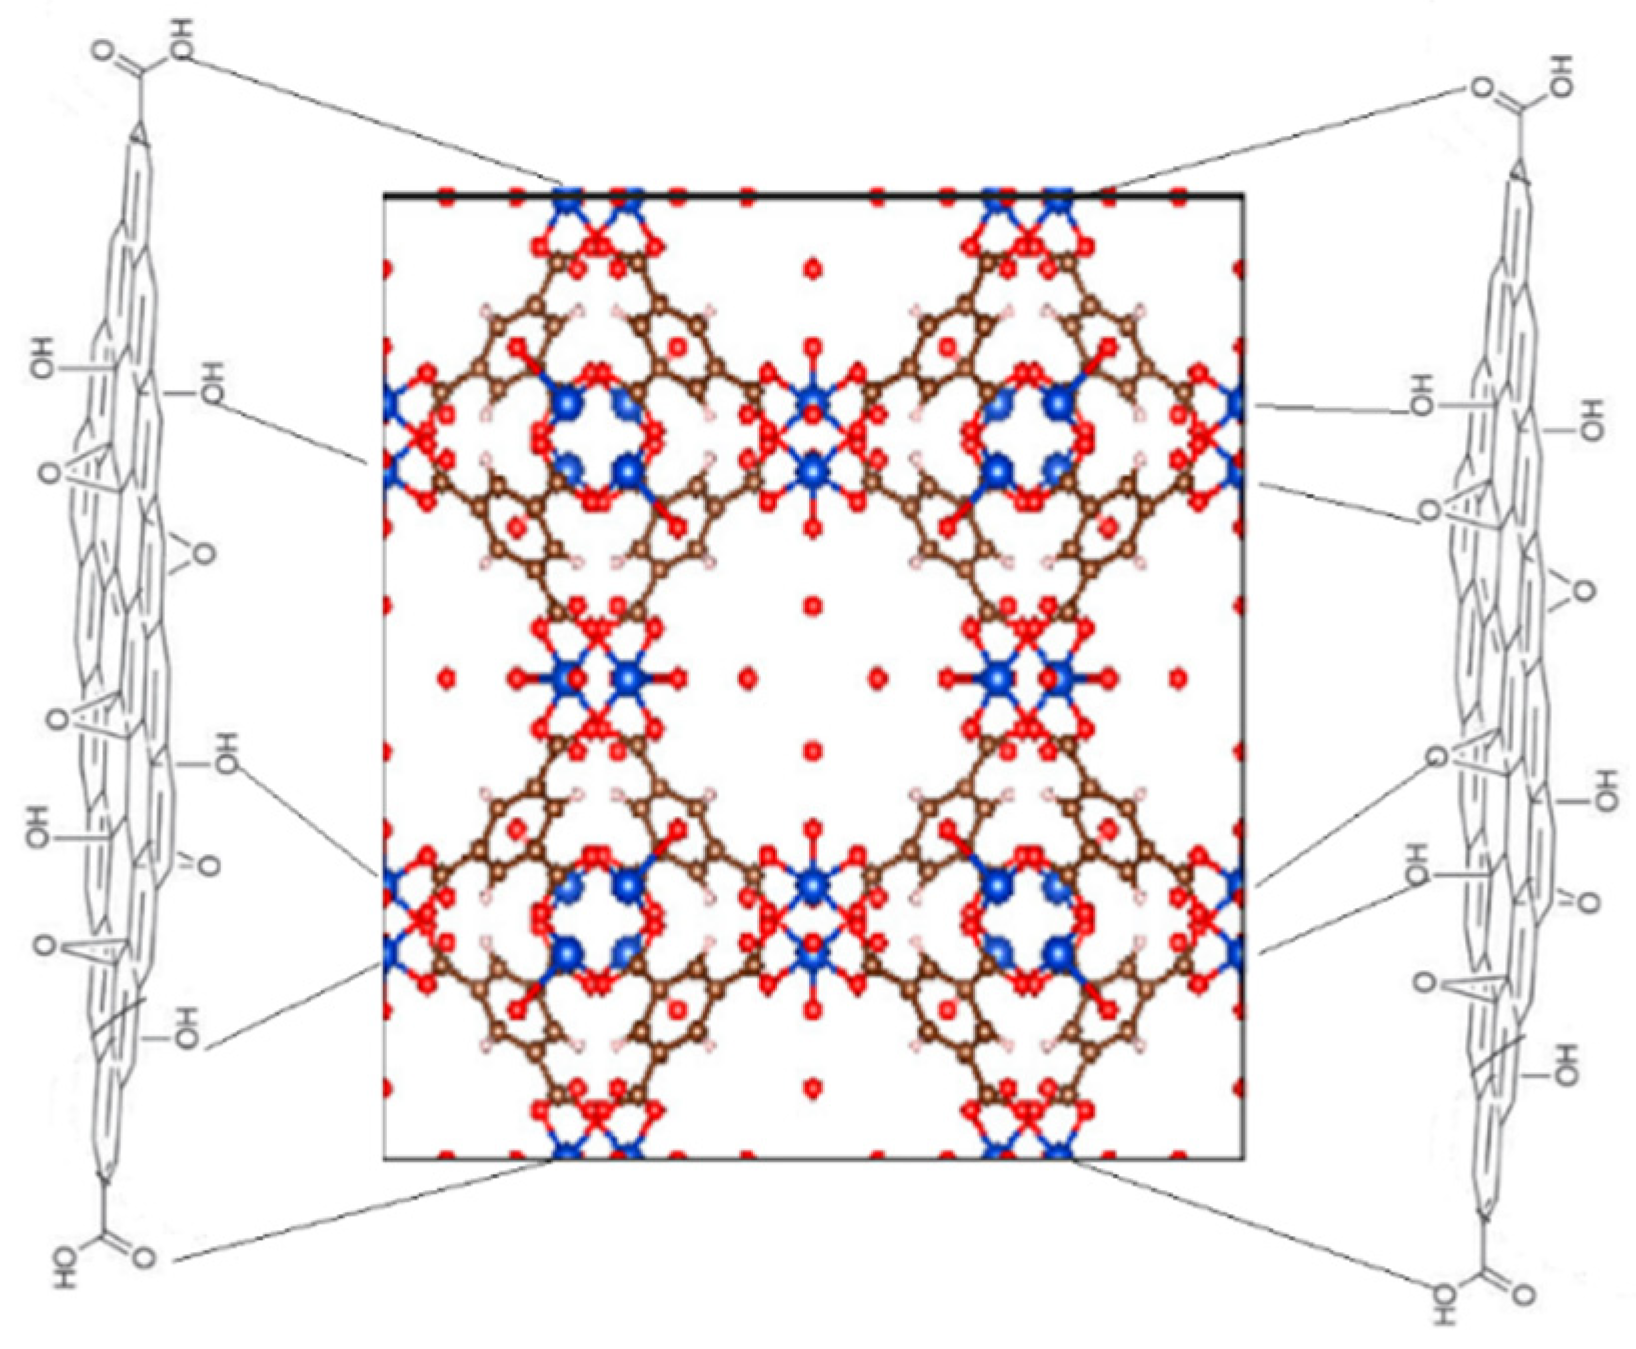
3.1. Synthesis and Characterization of the Sorbent
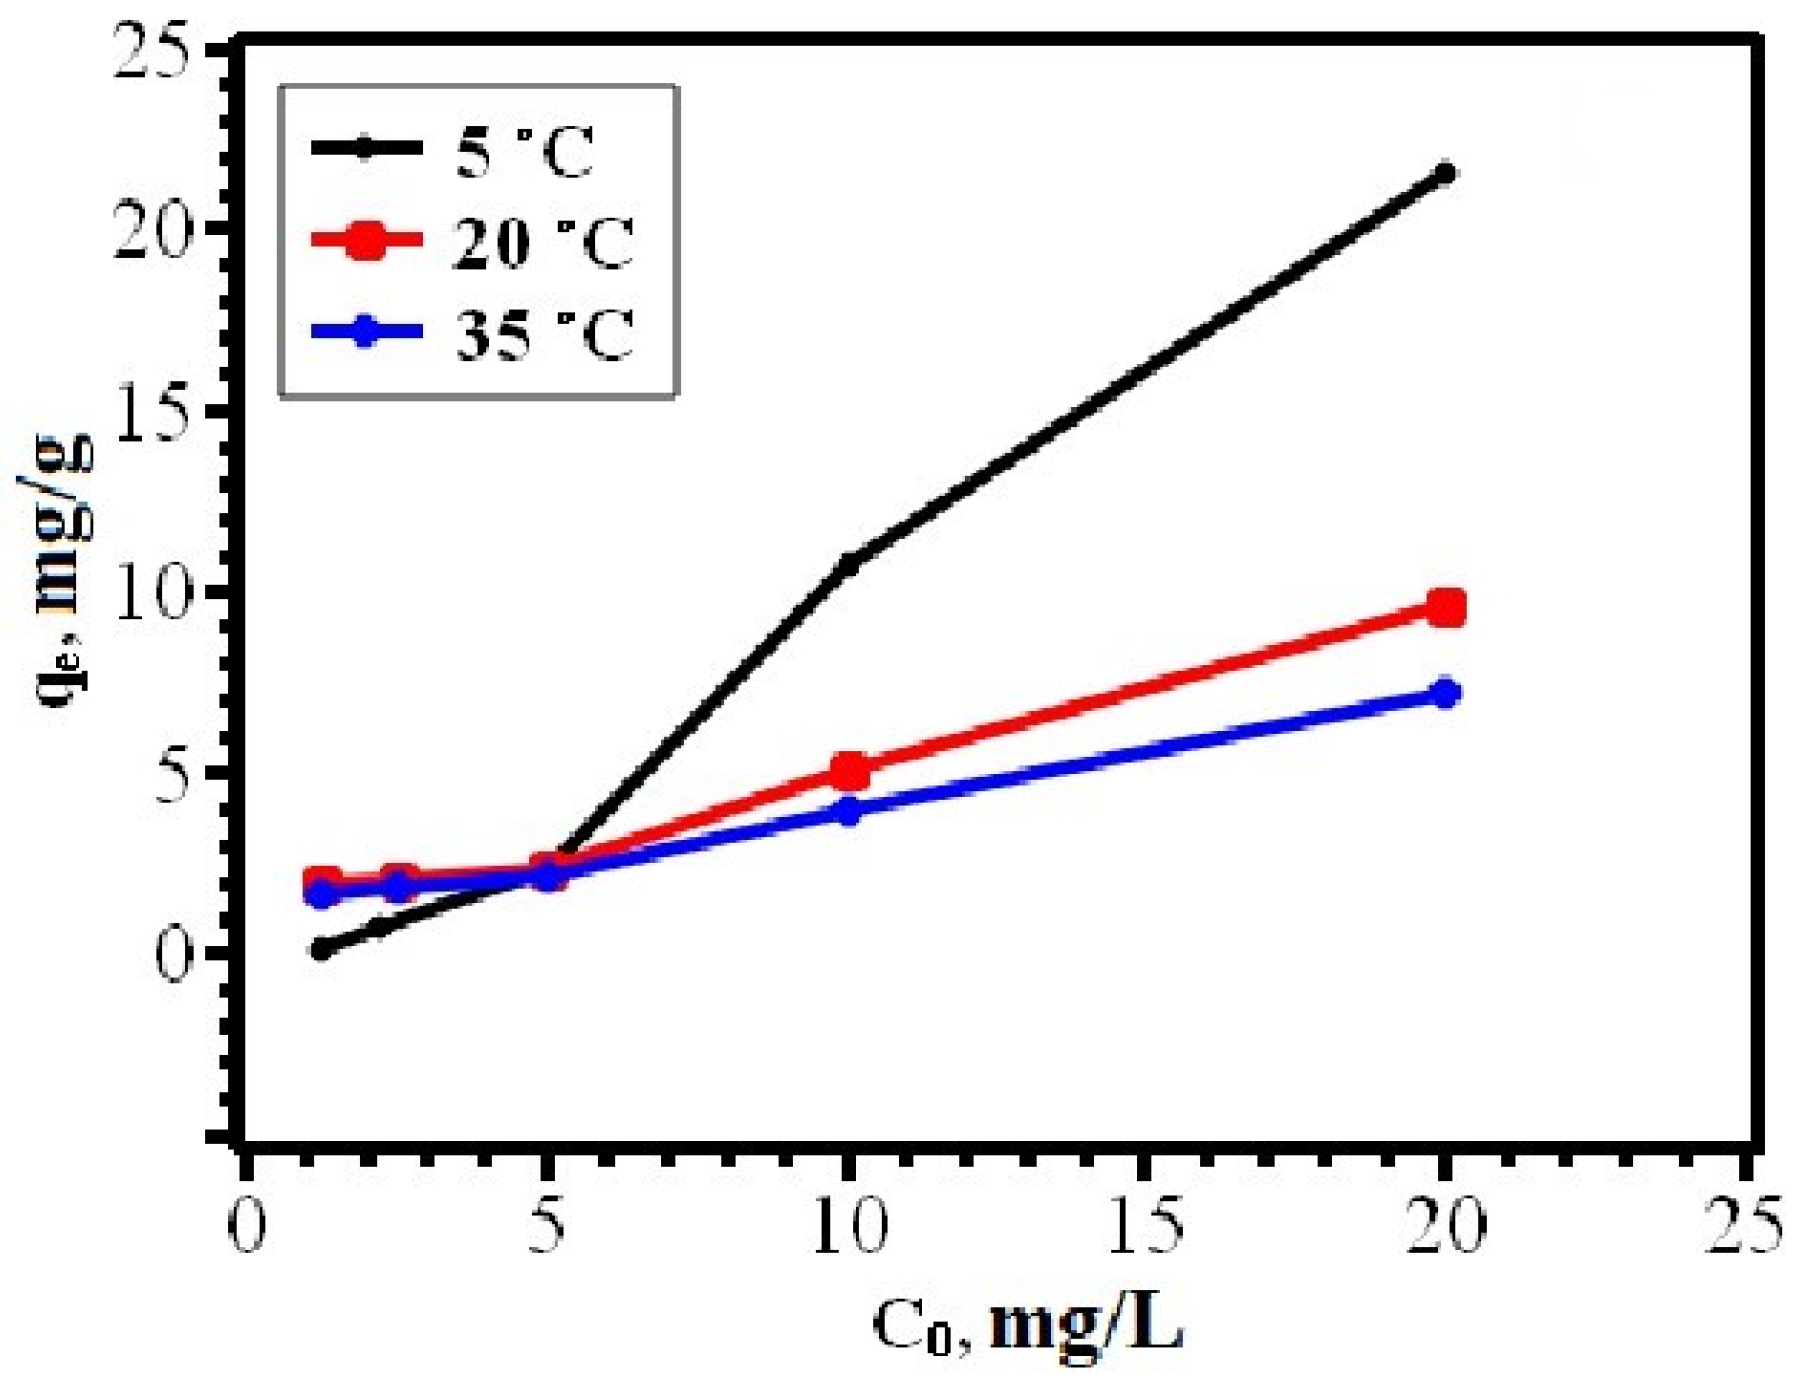
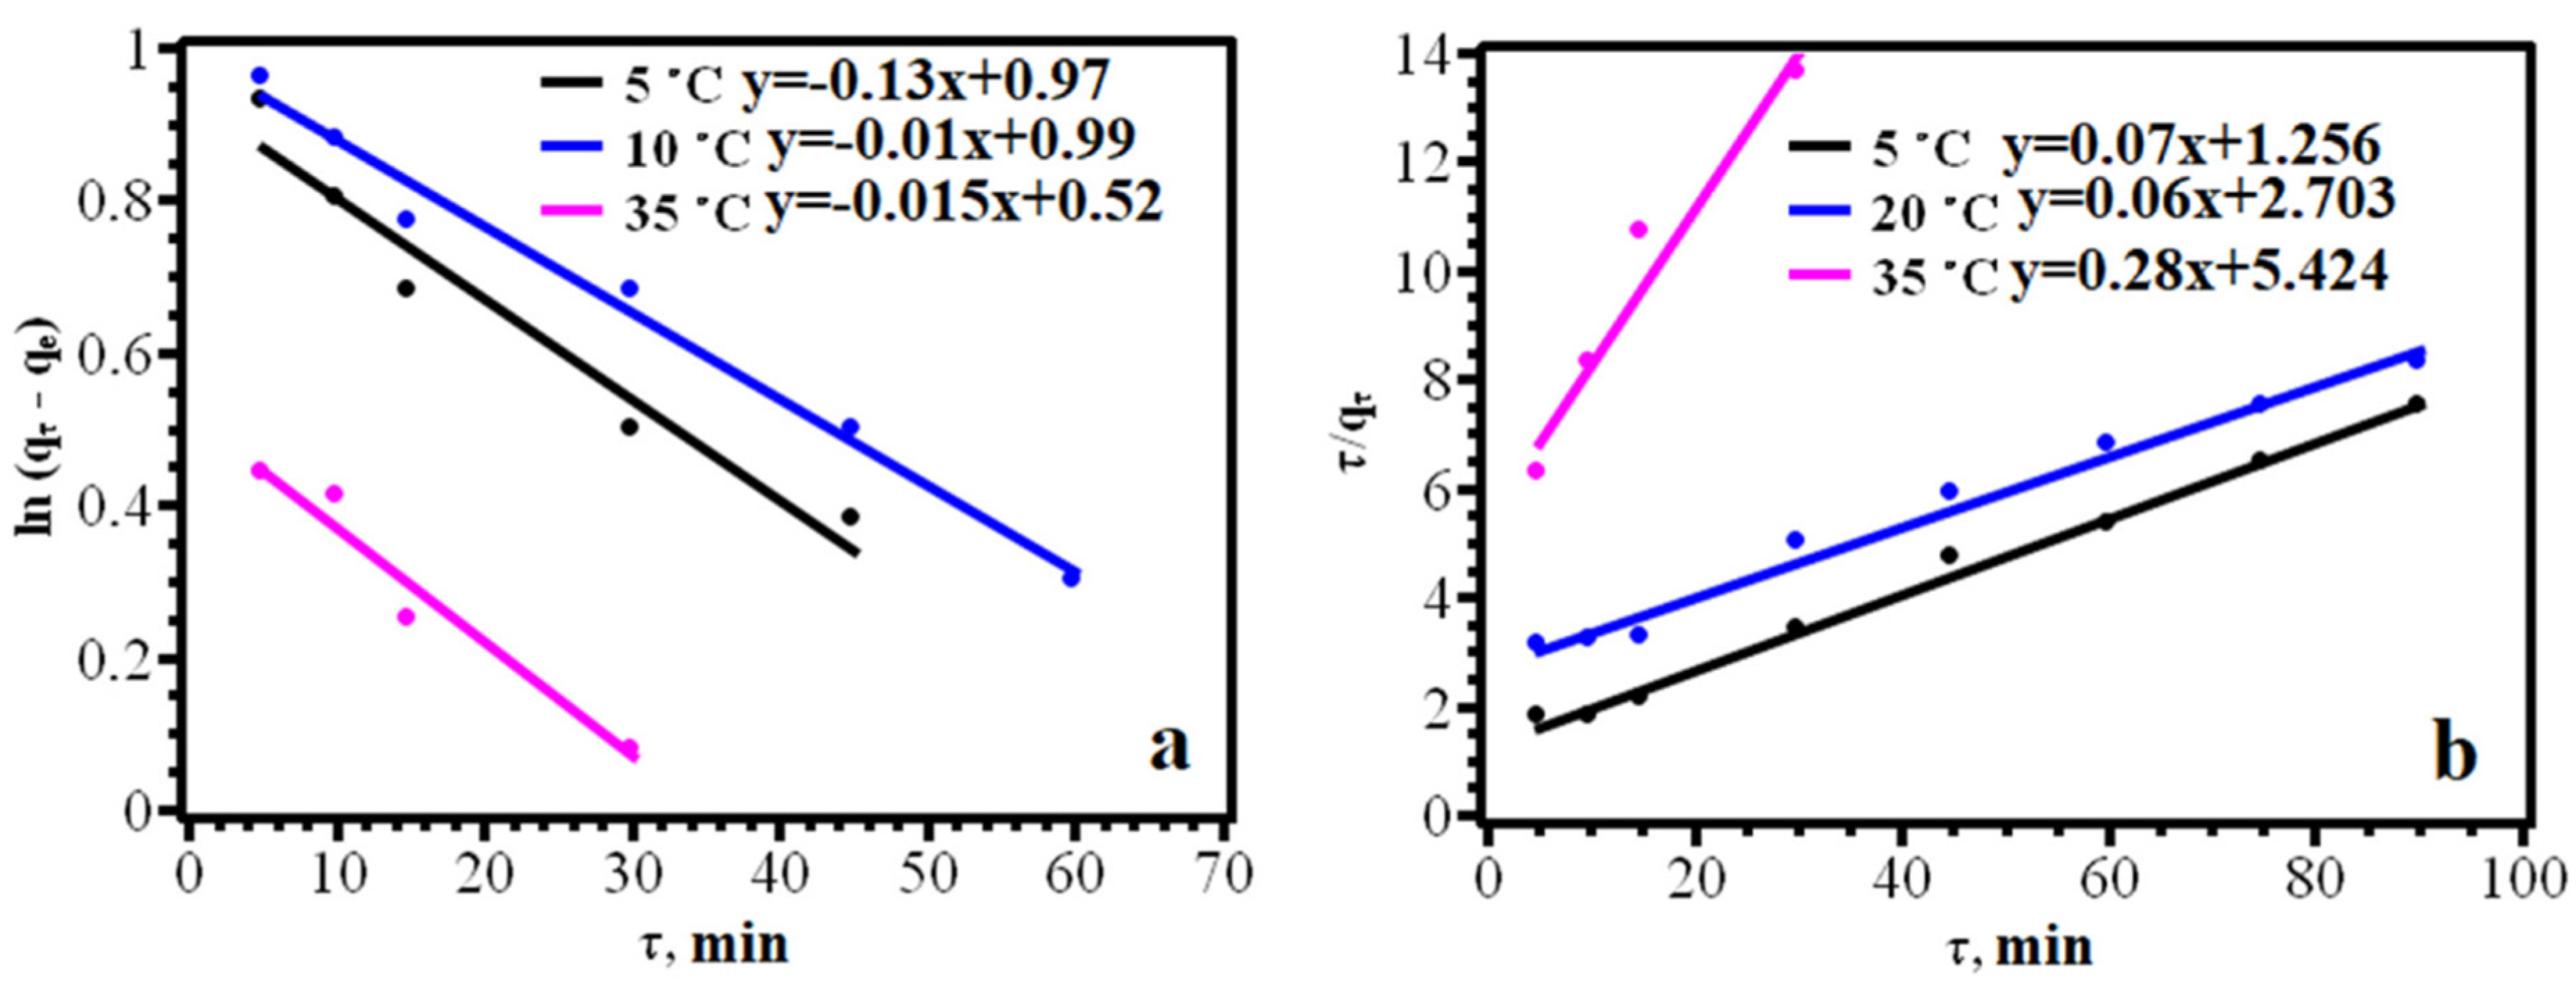
3.2. Adsorption of Dyes on the Sorbent
4. Conclusions
Author Contributions
Funding
Institutional Review Board Statement
Informed Consent Statement
Data Availability Statement
Conflicts of Interest
References
- Abe, F.R.; Mendonça, J.N.; Moraes, L.A.; de Oliveira, G.A.; Gravato, C.; Soares, A.M.; de Oliveira, D.P. Toxicological and behavioral responses as a tool to assess the effects of natural and synthetic dyes on zebrafish early life. Chemosphere 2017, 178, 282–290. [Google Scholar] [CrossRef] [PubMed]
- Li, J.; Wang, L.; Liu, Y.; Song, Y.; Zeng, P.; Zhang, Y. The research trends of metal-organic frameworks in environmental science: A review based on bibliometric analysis. Environ. Sci. Pollut. Res. 2020, 27, 19265–19284. [Google Scholar] [CrossRef] [PubMed]
- Pavithra, K.G.; Kumar, P.S.; Jaikumar, V.; Rajan, P.S. Removal of colorants from wastewater: A review on sources and treatment strategies. J. Ind. Eng. Chem. 2019, 75, 1–19. [Google Scholar] [CrossRef]
- Gorbunova, M.O.; Bayan, E.M.; Shevchenko, A.V.; Kulyaginova, M.S. Digital colorimetric determination of chlorides in water using gas extraction and methyl orange. Anal. Kontrol 2017, 21, 274–280. [Google Scholar] [CrossRef] [Green Version]
- Khan, M.A.; Khan, M.I.; Zafar, S. Removal of different anionic dyes from aqueous solution by anion exchange membrane. Membr. Water Treat. 2017, 8, 259–277. [Google Scholar] [CrossRef]
- Zwane, S.; Masheane, M.L.; Kuvarega, A.T.; Vilakati, G.D.; Mamba, B.B.; Nyoni, H.; Mhlanga, S.D.; Dlamini, D.S. Polyethersulfone/Chromolaena odorata (PES/CO) adsorptive membranes for removal of Congo red from water. J. Water Process. Eng. 2019, 30, 100498. [Google Scholar] [CrossRef]
- Xiao, X.Z.; Dai, T.T.; Guo, J.; Wu, J.H. Flowerlike Brochantite Nanoplate Superstructures for Catalytic Wet Peroxide Oxidation of Congo Red. ACS Appl. Nano Mater. 2019, 2, 4159–4168. [Google Scholar] [CrossRef]
- Khan, J.; Sayed, M.; Ali, F.; Khan, H.M. Removal of Acid Yellow 17 Dye by Fenton Oxidation Process. Z. Phys. Chem. 2018, 232, 507–525. [Google Scholar] [CrossRef]
- Rashed, M.N.; Eltaher, M.A.; Abdou, A.N.A. Adsorption and photocatalysis for methyl orange and Cd removal from wastewater using TiO2/sewage sludge-based activated carbon nanocomposites. R. Soc. Open Sci. 2017, 4, 170834. [Google Scholar] [CrossRef] [Green Version]
- Xu, R.; Su, M.; Liu, Y.; Chen, Z.; Ji, C.; Yang, M.; Chang, X.; Chen, D. Comparative study on the removal of different-type organic pollutants on hierarchical tetragonal bismutite microspheres: Adsorption, degradation and mechanism. J. Clean. Prod. 2020, 242, 118366. [Google Scholar] [CrossRef]
- Tran, V.A.; Vu, K.B.; Vo, T.-T.-T.; Le, V.T.; Do, H.H.; Bach, L.G.; Lee, S.-W. Experimental and computational investigation on interaction mechanism of Rhodamine B adsorption and photodegradation by zeolite imidazole frameworks-8. Appl. Surf. Sci. 2021, 538, 148065. [Google Scholar] [CrossRef]
- Abdellah, M.H.; Nosier, S.A.; El-Shazly, A.H.; Mubarak, A.A. Photocatalytic decolorization of methylene blue using TiO2/UV system enhanced by air sparging. Alex. Eng. J. 2018, 57, 3727. [Google Scholar] [CrossRef]
- Garcia-Segura, S.; Ocon, J.D.; Chong, M.N. Electrochemical oxidation remediation of real wastewater effluents—A review. Process Saf. Environ. 2018, 113, 48–67. [Google Scholar] [CrossRef]
- Pacheco-Alvarez, M.O.A.; Picos, A.; Perez-Segura, T.; Peralta-Hernandez, J.M. Proposal for highly efficient electrochemical discoloration and degradation of azo dyes with parallel arrangement electrodes. J. Electroanal. Chem. 2019, 838, 195–203. [Google Scholar] [CrossRef]
- Gomaa, O.M.; Fapetu, S.; Kyazze, G.; Keshavarz, T. Probing the mechanism of simultaneous bioenergy production and biodegradation process of Congo red in microbial fuel cells. J. Chem. Technol. Biotechnol. 2019, 94, 2092–2097. [Google Scholar] [CrossRef]
- Shanmugam, S.; Ulaganathan, P.; Swaminathan, K.; Sadhasivam, S.; Wu, Y.R. Enhanced biodegradation and detoxification of malachite green by Trichoderma asperellum laccase: Degradation pathway and product analysis. Int. Biodeter. Biodegr. 2017, 125, 258–268. [Google Scholar] [CrossRef]
- Castañeda-Díaz, J.; Pavón-Silva, T.; Gutiérrez-Segura, E.; Colín-Cruz, A. Electrocoagulation-Adsorption to Remove Anionic and Cationic Dyes from Aqueous Solution by PV-Energy. J. Chem. 2017, 2017, 5184590. [Google Scholar] [CrossRef] [Green Version]
- Kristianto, H.; Rahman, H.; Prasetyo, S.; Sugih, A.K. Removal of Congo red aqueous solution using Leucaena leucocephala seed’s extract as natural coagulant. Appl. Water Sci. 2019, 9, 88. [Google Scholar] [CrossRef] [Green Version]
- Gadekar, R.; Ahammed, M.M. Coagulation/flocculation process for dye removal using water treatment residuals: Modelling through artificial neural networks. Desalin. Water Treat. 2016, 57, 26392–26400. [Google Scholar] [CrossRef]
- Lu, L.; Wu, J.; Wang, J.; Liu, J.Q.; Li, B.H.; Singh, A.; Kumar, A.; Batten, S.R. An uncommon 3D 3,3,4,8-c Cd(II) metal-organic framework for highly efficient luminescent sensing and organic dye adsorption: Experimental and theoretical insight. CrystEngComm 2017, 19, 7057–7067. [Google Scholar] [CrossRef]
- Wang, C.K.; Xing, F.F.; Bai, Y.L.; Zhao, Y.M.; Li, M.X.; Zhu, S.R. Synthesis, structure of semi-rigid tetracarboxylate Cu(II) porous coordination polymers and their versatile high efficiency catalytic dye degradation in neutral aqueous solution. Cryst. Growth Des. 2016, 16, 2277–2288. [Google Scholar] [CrossRef]
- Wang, X.; Ye, N. Recent advances in metal-organic frameworks and covalent organic frameworks for sample preparation and chromatographic analysis. Electrophoresis 2017, 38, 3059–3078. [Google Scholar] [CrossRef] [PubMed]
- Uflyand, I.E.; Zhinzhilo, V.A.; Nikolaevskaya, V.O.; Kharisov, B.I.; Oliva González, C.M.; Kharissova, O.V. Recent strategies to improve MOF performance in solid phase extraction of organic dyes. Microchem. J. 2021, 168, 106387. [Google Scholar] [CrossRef]
- Chui, S.S.-Y.; Lo, S.M.-F.; Charmant, J.P.H.; Guy Orpen, A.; Williams, I.D. A Chemically Functionalizable Nanoporous Material [Cu3(TMA)2(H2O)3]n. Science 1999, 283, 1148–1150. [Google Scholar] [CrossRef]
- Gascon, J.; Aguado, S.; Kapteijn, F. Manufacture of dense coatings of Cu3(BTC)2 (HKUST-1) on α-alumina. Microporous Mesoporous Mater. 2008, 113, 132–138. [Google Scholar] [CrossRef]
- Mustafa, D.; Breynaert, E.; Bajpe, S.R.; Martens, J.A.; Kirschhock, C.E.A. Stability improvement of Cu3(BTC)2 metal–organic frameworks under steaming conditions by encapsulation of a Keggin polyoxometalate. Chem. Commun. 2011, 47, 8037–8039. [Google Scholar] [CrossRef] [Green Version]
- Seo, Y.K.; Hundal, G.; Jang, I.T.; Hwang, Y.K.; Jun, C.H.; Chang, J.-S. Microwave synthesis of hybrid inorganic–organic materials including porous Cu3(BTC)2 from Cu(II)-trimesate mixture. Microporous Mesoporous Mater. 2009, 119, 331–337. [Google Scholar] [CrossRef]
- Chen, J.; Yu, T.; Xiao, H.; Zhou, G.; Weng, L.; Tu, B.; Zhao, D. Synthesis and Structure of a New 3D Porous Cu(II)–Benzene-1,3,5-tricarboxylate Coordination Polymer, [Cu2(OH)(BTC)(H2O)]n·2nH2O. Chem. Lett. 2003, 32, 590–591. [Google Scholar] [CrossRef]
- Mao, Y.; Shi, L.; Huang, H.; Yu, Q.; Ye, Z.; Peng, X. Mesoporous separation membranes of {[Cu(BTC–H2)2·(H2O)2]·3H2O} nanobelts synthesized by ultrasonication at room temperature. CrystEngComm 2013, 15, 265–270. [Google Scholar] [CrossRef]
- Zornoza, B.; Seoane, B.; Zamaro, J.M.; Téllez, C.; Coronas, J. Combination of MOFs and zeolites for mixed-matrix membranes. ChemPhysChem 2011, 12, 2781–2785. [Google Scholar] [CrossRef]
- Uflyand, I.E.; Naumkina, V.N.; Zhinzhilo, V.A. Nanocomposites of Graphene Oxide and Metal-Organic Frameworks. Russ. J. Appl. Chem. 2021, 94, 1453–1468. [Google Scholar] [CrossRef]
- Zheng, M.; Xu, L.; Chen, C.; Labiadh, L.; Yuan, B.; Fu, M.-L. MOFs and GO-based composites as deliberated materials for the adsorption of various water contaminants. Separ. Purif. Technol. 2022, 294, 121187. [Google Scholar] [CrossRef]
- Hummers, W.S., Jr.; Offeman, R.E. Preparation of Graphitic Oxide. J. Am. Chem. Soc. 1958, 80, 1339. [Google Scholar] [CrossRef]
- Novikova, A.A.; Burlakova, V.E.; Varavka, V.N.; Uflyand, I.E.; Drogan, E.G.; Irkha, V.A. Influence of glycerol dispersions of graphene oxide on the friction of rough steel surfaces. J. Mol. Liq. 2019, 284, 1–11. [Google Scholar] [CrossRef]
- Rauf, M.A. Solvatochromic behavior on the absorption and fluorescence spectra of Rose Bengal dye in various solvents. Spectrochim. Acta Part A Mol. Biomol. Spectrosc. 2009, 72, 133–137. [Google Scholar] [CrossRef]
- Naser, J.A. Adsorption kinetic of malachite green dye from aqueous solutions by electrospun nanofiber Mat. Orient. J. Chem. 2017, 33, 3121–3129. [Google Scholar] [CrossRef]
- Latif, I.K.; Abdullah, H.M.; Saleem, M.H. Magnetic conductive hydrogel nanocomposites as drug carrier. Nanosci. Nanotechnol. 2016, 6, 48–58. [Google Scholar]
- Baidya, K.S.; Kumar, U. Adsorption of brilliant green dye from aqueous solution onto chemically modified areca nut husk. S. Afr. J. Chem. Eng. 2021, 35, 33–43. [Google Scholar]
- Rehman, R.; Muhammad, S.J.; Arshad, M. Brilliant green and acid orange 74 dyes removal from water by Pinus roxburghii leaves in naturally benign way: An application of green chemistry. J. Chem. 2019, 2019, 3573704. [Google Scholar] [CrossRef] [Green Version]
- Jaspal, D.; Malhotra, S.; Malviya, A. Column Studies for the Adsorption of Brilliant Green, Fast Green FCF and Phenol Red Dyes on De-Oiled Soya and Bottom Ash. Asian J. Chem. 2012, 24, 5082–5086. [Google Scholar]
- Simonin, J.-P. On the comparison of pseudo-first order and pseudo-second order rate laws in the modeling of adsorption kinetics. Chem. Eng. J. 2016, 300, 254–263. [Google Scholar] [CrossRef] [Green Version]
- Pehlivan, E.; Arslan, G. Comparison of adsorption capacity of young brown coals and humic acids prepared from different coal mines in Anatolia. J. Hazard. Mater. B 2006, 138, 401–408. [Google Scholar] [CrossRef] [PubMed]
- Shahriary, L.; Athawale, A.A. Graphene oxide synthesized by using modified Hummers approach. Int. J. Renew. Energy Environ. Eng. 2014, 2, 58–63. [Google Scholar]
- Lian, P.; Zhu, X.; Liang, S.; Li, Z.; Yang, W.; Wang, H. Large reversible capacity of high quality graphene sheets as an anode material for lithium-ion batteries. Electrochim. Acta 2010, 55, 3909–3914. [Google Scholar] [CrossRef]
- Manoratne, C.H.; Rosa, S.R.D.; Kottegoda, I.R.M. XRD-HTA, UV Visible, FTIR and SEM interpretation of reduced graphene oxide synthesized from high purity vein graphite. Mater. Sci. Res. India 2017, 14, 19–30. [Google Scholar] [CrossRef]
- Seredych, M.; Petit, C.; Tamashausky, A.V.; Bandosz, T.J. Role of graphite precursor in the performance of graphite oxides as ammonia adsorbents. Carbon 2009, 47, 445–456. [Google Scholar] [CrossRef]
- Domán, A.; Klébert, S.; Madarász, J.; Sáfrán, G.; Wang, Y.; László, K. Graphene Oxide Protected Copper Benzene-1,3,5-Tricarboxylate for Clean Energy Gas Adsorption. Nanomaterials 2020, 10, 1182. [Google Scholar] [CrossRef]




| Name | Molecular Structure | λmax (nm) | Ref. |
|---|---|---|---|
| RB | 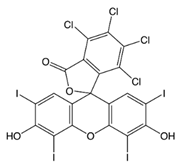 | 546 | [35] |
| MG | 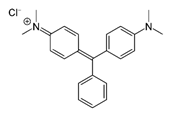 | 617 | [36,37] |
| IC |  | 610 (600) | [37] |
| BG | 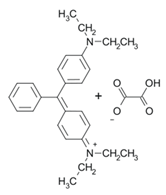 | 625 | [38,39] |
| CV | 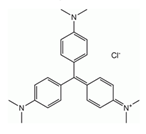 | 590 (594) | [40] |
| Sample | SBET (m2/g) | Vtotal, (cm3/g) | Vmicro (cm3/g) | Average Pore Radius (Å) |
|---|---|---|---|---|
| MOF | 1562.3 | 0.85 | 0.61 | 10.9 |
| GO | 562 | - | - | 6.2 |
| Nanocomposite (5% GO) | 762 | 0.85 | 0.6 | 6.5 |
| Nanocomposite (10% GO) | 713 | 0.85 | 0.6 | 6.6 |
| Nanocomposite (20% GO) | 689 | 0.85 | 0.6 | 6.8 |
| Model | Sorbate | Constants | T (K) | ||
|---|---|---|---|---|---|
| 283 | 293 | 308 | |||
| Nanocomposite with 5% GO | |||||
| Langmuir | CV | qmax (mg/g) | 90.9 | 74.3 | 53.1 |
| KL (L/mg) | 0.036 | 0.013 | 0.010 | ||
| R2 | 0.992 | 0.980 | 0.883 | ||
| RB | qmax (mg/g) | 29.0 | 21.4 | 19.6 | |
| KL (L/mg) | 3.31 | 2.20 | 2.02 | ||
| R2 | 0.959 | 0.765 | 0.855 | ||
| MG | qmax (mg/g) | 37.00 | 29.4 | 18.8 | |
| KL (L/mg) | 0.03 | 0.11 | 0.53 | ||
| R2 | 0.890 | 0.983 | 0.964 | ||
| BG | qmax (mg/g) | 35.5 | 29.2 | 27.1 | |
| KL (L/mg) | 1.29 | 1.11 | 0.76 | ||
| R2 | 0.938 | 0.949 | 0.918 | ||
| IC | qmax (mg/g) | 27.6 | 17.5 | 12.4 | |
| KL (L/mg) | 0.78 | 0.66 | 0.60 | ||
| R2 | 0.814 | 0.756 | 0.737 | ||
| Freundlich | CV | 1/n | 0.997 | 0.73 | 0.63 |
| KF (mg1−1/n/g·L−1/n) | 0.11 | 0.32 | 0.35 | ||
| R2 | 0.951 | 0.913 | 0.965 | ||
| RB | 1/n | 0.71 | 0.75 | 0.78 | |
| KF (mg1−1/n/g·L−1/n) | 0.10 | 0.07 | 0.08 | ||
| R2 | 0.972 | 0.969 | 0.966 | ||
| MG | 1/n | 0.53 | 0.64 | 0.60 | |
| KF (mg1−1/n/g·L−1/n) | 0.85 | 0.20 | 0.10 | ||
| R2 | 0.945 | 0.960 | 0.930 | ||
| BG | 1/n | 0.84 | 0.65 | 0.58 | |
| KF (mg1−1/n/g·L−1/n) | 0.16 | 0.22 | 0.24 | ||
| R2 | 0.956 | 0.939 | 0.998 | ||
| IC | 1/n | 0.90 | 0.53 | 0.32 | |
| KF (mg1−1/n/g·L−1/n) | 0.10 | 0.20 | 0.40 | ||
| R2 | 0.911 | 0.979 | 0.919 | ||
| Nanocomposite with 10% GO | |||||
| Langmuir | CV | qmax (mg/g) | 27.27 | 22.46 | 21.45 |
| KL (L/mg) | 0.13 | 0.18 | 0.17 | ||
| R2 | 0.806 | 0.795 | 0.768 | ||
| RB | qmax (mg/g) | 34.88 | 32.41 | 30.54 | |
| KL (L/mg) | 0.13 | 0.14 | 0.12 | ||
| R2 | 0.973 | 0.934 | 0.924 | ||
| MG | qmax (mg/g) | 9.03 | 8.67 | 8.01 | |
| KL (L/mg) | 0.19 | 0.18 | 0.17 | ||
| R2 | 0.876 | 0.847 | 0.879 | ||
| BG | qmax (mg/g) | 32.71 | 29.04 | 20.50 | |
| KL (L/mg) | 0.06 | 0.05 | 0.07 | ||
| R2 | 0.942 | 0.917 | 0.913 | ||
| IC | qmax (mg/g) | 18.05 | 15.40 | 15.10 | |
| KL (L/mg) | 0.04 | 0.02 | 0.015 | ||
| R2 | 0.869 | 0.910 | 0.923 | ||
| Freundlich | CV | 1/n | 0.60 | 0.62 | 0.63 |
| KF (mg1−1/n/g·L−1/n) | 2.51 | 2.46 | 2.34 | ||
| R2 | 0.990 | 0.991 | 0.989 | ||
| RB | 1/n | 0.58 | 0.55 | 0.53 | |
| KF (mg1−1/n/g·L−1/n) | 1.16 | 1.12 | 1.08 | ||
| R2 | 0.844 | 0.797 | 0.776 | ||
| MG | 1/n | 0.55 | 0.54 | 0.53 | |
| KF (mg1−1/n/g·L−1/n) | 1.99 | 1.79 | 1.67 | ||
| R2 | 0.936 | 0.939 | 0.940 | ||
| BG | 1/n | 0.69 | 0.65 | 0.60 | |
| KF (mg1−1/n/g·L−1/n) | 1.27 | 1.13 | 1.04 | ||
| R2 | 0.961 | 0.939 | 0.910 | ||
| IC | 1/n | 0.61 | 0.51 | 0.49 | |
| KF (mg1−1/n/g·L−1/n) | 1.85 | 1.35 | 1.08 | ||
| R2 | 0.981 | 0.994 | 0.998 | ||
| Nanocomposite with 20% GO | |||||
| Langmuir | CV | qmax (mg/g) | 30.77 | 24.75 | 23.56 |
| KL (L/mg) | 0.18 | 0.21 | 0.14 | ||
| R2 | 0.998 | 0.957 | 0.967 | ||
| RB | qmax (mg/g) | 30.78 | 21.44 | 18.04 | |
| KL (L/mg) | 0.21 | 0.28 | 0.32 | ||
| R2 | 0.922 | 0.823 | 0.851 | ||
| MG | qmax (mg/g) | 24.75 | 16.00 | 13.76 | |
| KL (L/mg) | 0.06 | 0.17 | 0.20 | ||
| R2 | 0.945 | 0.946 | 0.961 | ||
| BG | qmax (mg/g) | 27.47 | 18.81 | 16.64 | |
| KL (L/mg) | 0.13 | 0.16 | 0.17 | ||
| R2 | 0.977 | 0.953 | 0.975 | ||
| IC | qmax (mg/g) | 14.88 | 13.04 | 12.05 | |
| KL (L/mg) | 0.12 | 0.11 | 0.10 | ||
| R2 | 0.819 | 0.886 | 0.970 | ||
| Freundlich | CV | 1/n | 0.75 | 0.70 | 0.69 |
| KF (mg1−1/n/g·L−1/n) | 3.142 | 3.050 | 2.268 | ||
| R2 | 0.984 | 0.993 | 0.985 | ||
| RB | 1/n | 0.53 | 0.55 | 0.56 | |
| KF (mg1−1/n/g·L−1/n) | 3.370 | 2.838 | 2.532 | ||
| R2 | 0.998 | 0.996 | 0.994 | ||
| MG | 1/n | 0.81 | 0.80 | 0.82 | |
| KF (mg1−1/n/g·L−1/n) | 1.390 | 1.333 | 1.290 | ||
| R2 | 0.999 | 0.998 | 0.999 | ||
| BG | 1/n | 0.73 | 0.60 | 0.58 | |
| KF (mg1−1/n/g·L−1/n) | 3.005 | 2.950 | 2.803 | ||
| R2 | 0.947 | 0.979 | 0.973 | ||
| IC | 1/n | 0.55 | 0.60 | 0.75 | |
| KF (mg1−1/n/g·L−1/n) | 1.853 | 1.501 | 1.030 | ||
| R2 | 0.984 | 0.996 | 0.992 | ||
| Dye | T (K) | Ce (mg/g) | Time to Reach Equilibrium (min) | R2 | k1 (min−1) | k2 × 10−3 (g/mg min) | |
|---|---|---|---|---|---|---|---|
| Pseudo-First Order | Pseudo-Second Order | ||||||
| Nanocomposite with 5% GO | |||||||
| IC | 278 | 14.05 | 90 | 0.950 | 0.990 | 0.60 | 0.36 |
| 293 | 14.63 | 90 | 0.985 | 0.982 | 0.65 | 0.34 | |
| 308 | 18.01 | 90 | 0.955 | 0.951 | 0.81 | 1.66 | |
| BG | 278 | 8.88 | 90 | 0.988 | 0.988 | 0.68 | 2.03 |
| 293 | 9.56 | 90 | 0.982 | 0.972 | 0.81 | 1.59 | |
| 308 | 11.28 | 90 | 0.990 | 0.938 | 0.55 | 1.45 | |
| CV | 278 | 6.64 | 90 | 0.987 | 0.995 | 0.68 | 1.19 |
| 293 | 7.94 | 90 | 0.976 | 0.998 | 0.60 | 1.52 | |
| 308 | 9.86 | 90 | 0.960 | 0.962 | 0.65 | 1.76 | |
| RB | 278 | 5.10 | 90 | 0.966 | 0.889 | 0.61 | 1.02 |
| 293 | 5.18 | 90 | 0.974 | 0.895 | 0.51 | 0.98 | |
| 308 | 5.65 | 90 | 0.996 | 0.995 | 0.34 | 0.86 | |
| MG | 278 | 14.50 | 90 | 0.923 | 0.963 | 0.45 | 2.24 |
| 293 | 15.38 | 90 | 0.996 | 0.998 | 0.60 | 5.69 | |
| 308 | 17.94 | 90 | 0.958 | 0.994 | 0.62 | 19.61 | |
| Nanocomposite with 10% GO | |||||||
| IC | 278 | 14.88 | 90 | 0.952 | 0.955 | 0.55 | 1.35 |
| 293 | 16.10 | 90 | 0.980 | 0925 | 0.73 | 1.26 | |
| 308 | 16.54 | 90 | 0.901 | 0.972 | 1.11 | 13.40 | |
| BG | 278 | 10.36 | 90 | 0.995 | 0.922 | 0.40 | 1.33 |
| 293 | 10.96 | 90 | 0.994 | 0.976 | 0.55 | 1.65 | |
| 308 | 11.16 | 90 | 0.988 | 0.946 | 0.65 | 1.94 | |
| CV | 278 | 6.30 | 90 | 0.990 | 0.941 | 0.67 | 0.77 |
| 293 | 6.57 | 90 | 0.988 | 0.929 | 0.70 | 0.76 | |
| 308 | 6.72 | 90 | 0.986 | 0.948 | 0.73 | 0.75 | |
| RB | 278 | 4.76 | 90 | 0.938 | 0.995 | 0.60 | 2.80 |
| 293 | 5.08 | 90 | 0.951 | 0.996 | 0.61 | 2.77 | |
| 308 | 5.20 | 90 | 0.957 | 0.992 | 0.63 | 2.74 | |
| MG | 278 | 15.54 | 90 | 0.992 | 0.968 | 0.60 | 3.81 |
| 293 | 15.90 | 90 | 0.961 | 0.977 | 0.93 | 5.58 | |
| 308 | 16.70 | 90 | 0.977 | 0.917 | 0.41 | 4.55 | |
| Nanocomposite with 20% GO | |||||||
| IC | 278 | 12.92 | 90 | 0.955 | 0.928 | 0.65 | 1.18 |
| 293 | 12.98 | 90 | 0.936 | 0.967 | 0.61 | 1.05 | |
| 308 | 13.04 | 90 | 0.938 | 0.972 | 0.51 | 1.01 | |
| BG | 278 | 8.80 | 90 | 0.964 | 0.964 | 0.73 | 1.49 |
| 293 | 10.26 | 90 | 0.900 | 0.975 | 0.60 | 1.70 | |
| 308 | 12.00 | 90 | 0.951 | 0.855 | 0.70 | 1.10 | |
| CV | 278 | 6.00 | 90 | 0.953 | 0.953 | 0.63 | 0.69 |
| 293 | 6.70 | 90 | 0.938 | 0.955 | 0.68 | 0.76 | |
| 308 | 7.70 | 90 | 0.924 | 0.962 | 0.70 | 0.82 | |
| RB | 278 | 4.42 | 90 | 0.988 | 0.963 | 0.87 | 0.80 |
| 293 | 4.70 | 90 | 0.978 | 0.977 | 0.61 | 0.71 | |
| 308 | 4.95 | 90 | 0.967 | 0.984 | 0.53 | 0.65 | |
| MG | 278 | 10.50 | 90 | 0.850 | 0.950 | 0.31 | 1.23 |
| 293 | 10.70 | 90 | 0.873 | 0.971 | 0.35 | 1.25 | |
| 308 | 11.20 | 90 | 0.965 | 0.889 | 0.47 | 1.36 | |
| Sorbate | T, K | Kc | ΔG0 (kJ/mol) | ΔH0 (kJ/mol) | ΔS0 (J/mol K) |
|---|---|---|---|---|---|
| Nanocomposite with 5% GO | |||||
| CV | 278 | 1.420 | −2.513 | 0.12 | 12.1 |
| 293 | 1.512 | −2.189 | |||
| 308 | 1.705 | −2.103 | |||
| RB | 278 | 1.592 | −4.089 | 0.67 | 1.57 |
| 293 | 1.680 | −4.203 | |||
| 308 | 1.769 | −4.115 | |||
| MG | 278 | 1.873 | −5.835 | −0.93 | 1.86 |
| 293 | 2.315 | −6.112 | |||
| 308 | 2.562 | −4.768 | |||
| BG | 278 | 0.425 | −2.123 | 0.84 | 0.42 |
| 293 | 0.769 | −1.912 | |||
| 308 | 0.913 | −1.105 | |||
| IC | 278 | 2.440 | −5.636 | −1.28 | 10.6 |
| 293 | 2.211 | −5.356 | |||
| 308 | 0.280 | −0.7 | |||
| Nanocomposite with 10% GO | |||||
| CV | 278 | 1.470 | −3.398 | 0.810 | 8.94 |
| 293 | 1.408 | −3.430 | |||
| 308 | 1.374 | −3.518 | |||
| RB | 278 | 1.857 | −4.292 | 0.727 | 12.24 |
| 293 | 1.771 | −4.314 | |||
| 308 | 1.739 | −4.453 | |||
| MG | 278 | 1.928 | −4.456 | 0.715 | 8.11 |
| 293 | 1.662 | −4.049 | |||
| 308 | 1.555 | −3.982 | |||
| BG | 278 | 0.621 | −1.435 | 0.694 | 6.53 |
| 293 | 0.501 | −1.220 | |||
| 308 | 0.460 | −1.178 | |||
| IC | 278 | 1.071 | −2.476 | 0.702 | 6.74 |
| 293 | 0.510 | −1.242 | |||
| 308 | 0.374 | −0.958 | |||
| Nanocomposite with 20% GO | |||||
| CV | 278 | 1.541 | −3.562 | 0.732 | 8.98 |
| 293 | 1.379 | −3.359 | |||
| 308 | 1.162 | −2.976 | |||
| RB | 278 | 1.953 | −4.514 | 0.577 | 17.53 |
| 293 | 1.873 | −4.560 | |||
| 308 | 1.805 | −4.622 | |||
| MG | 278 | 1.717 | −3.968 | 0.725 | 16.09 |
| 293 | 1.638 | −3.990 | |||
| 308 | 1.571 | −4.023 | |||
| BG | 278 | 0.934 | −2.159 | 0.754 | 7.90 |
| 293 | 0.641 | −1.561 | |||
| 308 | 0.289 | −0.740 | |||
| IC | 278 | 0.092 | −0.213 | 0.781 | 2.01 |
| 293 | 0.079 | −0.192 | |||
| 308 | 0.065 | −0.166 | |||
| BG | pH | 2 | 3 | 4 | 5 | 6 | 7 | 8 | ||
| R (%) | 51.7 | 51.9 | 51.9 | 51.9 | 52 | 52.2 | 52.2 | |||
| CV | pH | 2 | 3 | 4 | 5 | 6 | 7 | 8 | 9 | 10 |
| R (%) | 48.3 | 50.4 | 57.2 | 60.3 | 60.3 | 60.3 | 50.7 | 43.2 | 30.1 | |
| RB | pH | 4 | 5 | 6 | 7 | 8 | 9 | 10 | ||
| R (%) | 60.3 | 68.2 | 74.1 | 74.1 | 74.1 | 74.1 | 74.0 | 73.8 | 73.6 | |
| MG | pH | 4 | 5 | 6 | 7 | 8 | 9 | 10 | ||
| R (%) | 23 | 23 | 23.1 | 23.1 | 23.1 | 23.1 | 23.1 | |||
| IC | pH | 4 | 5 | 6 | 7 | 8 | 9 | 10 | ||
| R (%) | 25 | 25.3 | 25.4 | 25.6 | 25.6 | 25.5 | 24 | |||
| CV | Cycle | 1 | 2 | 3 | 4 | 5 |
| 5% GO | R, % | 60.3 | 55.7 | 51.1 | 46.2 | 39.4 |
| CV | Cycle | 1 | 2 | 3 | 4 | 5 |
| 10% GO | R, % | 67.6 | 67.4 | 67.1 | 66.4 | 65.2 |
| CV | Cycle | 1 | 2 | 3 | 4 | 5 |
| 20% GO | R, % | 76.5 | 76.1 | 75.8 | 75.2 | 73.1 |
| BG | Cycle | 1 | 2 | 3 | 4 | 5 |
| 5% GO | R, % | 52.2 | 48.6 | 44.2 | 38.7 | 32.1 |
| BG | Cycle | 1 | 2 | 3 | 4 | 5 |
| 10% GO | R, % | 45.4 | 45.2 | 44.6 | 40.1 | 38.7 |
| BG | Cycle | 1 | 2 | 3 | 4 | 5 |
| 20% GO | R, % | 42.7 | 42.1 | 41.5 | 40.1 | 38.6 |
| RB | Cycle | 1 | 2 | 3 | 4 | 5 |
| 5% GO | R, % | 74.2 | 72.3 | 70.4 | 68.1 | 60.2 |
| RB | Cycle | 1 | 2 | 3 | 4 | 5 |
| 10% GO | R, % | 74.7 | 74.2 | 73.8 | 78.2 | 72.6 |
| RB | Cycle | 1 | 2 | 3 | 4 | 5 |
| 20% GO | R, % | 76.6 | 76.1 | 75.4 | 70.3 | 68.6 |
| MG | Cycle | 1 | 2 | 3 | 4 | 5 |
| 5% GO | R, % | 23.1 | 22.4 | 21.6 | 20.1 | 18.1 |
| MG | Cycle | 1 | 2 | 3 | 4 | 5 |
| 10% GO | R, % | 20.6 | 20.5 | 20.3 | 20.1 | 19.8 |
| MG | Cycle | 1 | 2 | 3 | 4 | 5 |
| 20% GO | R, % | 46.6 | 46.2 | 45.2 | 41.4 | 38.2 |
| IC | Cycle | 1 | 2 | 3 | 4 | 5 |
| 5% GO | R, % | 25.7 | 25.6 | 25.5 | 25.3 | 25.1 |
| IC | Cycle | 1 | 2 | 3 | 4 | 5 |
| 10% GO | Cycle | 35.2 | 35.0 | 34.8 | 34.1 | 33.3 |
| Dye | GO Content in the Composite (%) | Dye Nature | qmax (mg/g) | R (%) | Limit of Detection (mg/L) | Limit of Quantification (mg/L) | Accuracy Score (Systematic Error) ±Δc (%) | Accuracy Rate (Error Characteristic) ±Δ (%) |
|---|---|---|---|---|---|---|---|---|
| IC | 5% | Anionic | 196.0 | 25.6 | 0.625 | 0.625–10 | 3.1 ± 2% | 4.2 ± 2% |
| 10% | Anionic | 105.6 | 35.4 | 0.3 | 0.3–12.4 | 3.1 ± 2% | 4.2 ± 2% | |
| 20% | Anionic | 187.5 | 35.4 | 0.625 | 0.625–7.5 | 3.1 ± 2% | 4.2 ± 2% | |
| BG | 5% | Cationic | 74.8 | 55.6 | 0.3 | 0.3–20 | 3.4 ± 3% | 3.7 ± 3% |
| 10% | Cationic | 128 | 48.2 | 0.3 | 0.3–20 | 3.4 ± 3% | 3.7 ± 3% | |
| 20% | Cationic | 130 | 56.0 | 0.3 | 0.3–20 | 3.4 ± 3% | 3.7 ± 3% | |
| MG | 5% | Cationic | 89.3 | 27.5 | 0.625 | 0.625–15.2 | 5.1 ± 2% | 2.9 ± 2% |
| 10% | Cationic | 51.5 | 22.3 | 1.25 | 1.25–20 | 5.1 ± 2% | 2.9 ± 2% | |
| 20% | Cationic | 233.6 | 47.5 | 0.625 | 0.625–20 | 5.1 ± 2% | 2.9 ± 2% | |
| RB | 5% | Neutral | 84.0 | 74.5 | 0.3 | 0.3–20 | 2.9 ± 4% | 2.1 ± 3% |
| 10% | Neutral | 304.0 | 76.2 | 0.3 | 0.3–20 | 2.9 ± 4% | 2.1 ± 3% | |
| 20% | Neutral | 345.6 | 77.9 | 0.3 | 0.3–20 | 2.9 ± 4% | 2.1 ± 3% | |
| CV | 5% | Cationic | 93.0 | 68.5 | 0.3 | 0.3–20 | 3.7 ± 2% | 3.5 ± 2% |
| 10% | Cationic | 380.4 | 68.5 | 0.3 | 0.3–20 | 3.7 ± 2% | 3.5 ± 2% | |
| 20% | Cationic | 393.0 | 70.0 | 0.3 | 0.3–20 | 3.7 ± 2% | 3.5 ± 2% |
Publisher’s Note: MDPI stays neutral with regard to jurisdictional claims in published maps and institutional affiliations. |
© 2022 by the authors. Licensee MDPI, Basel, Switzerland. This article is an open access article distributed under the terms and conditions of the Creative Commons Attribution (CC BY) license (https://creativecommons.org/licenses/by/4.0/).
Share and Cite
Uflyand, I.E.; Naumkina, V.N.; Zhinzhilo, V.A. Nanocomposites of Copper Trimesinate and Graphene Oxide as Sorbents for the Solid-Phase Extraction of Organic Dyes. J. Compos. Sci. 2022, 6, 215. https://doi.org/10.3390/jcs6070215
Uflyand IE, Naumkina VN, Zhinzhilo VA. Nanocomposites of Copper Trimesinate and Graphene Oxide as Sorbents for the Solid-Phase Extraction of Organic Dyes. Journal of Composites Science. 2022; 6(7):215. https://doi.org/10.3390/jcs6070215
Chicago/Turabian StyleUflyand, Igor E., Victoria N. Naumkina, and Vladimir A. Zhinzhilo. 2022. "Nanocomposites of Copper Trimesinate and Graphene Oxide as Sorbents for the Solid-Phase Extraction of Organic Dyes" Journal of Composites Science 6, no. 7: 215. https://doi.org/10.3390/jcs6070215
APA StyleUflyand, I. E., Naumkina, V. N., & Zhinzhilo, V. A. (2022). Nanocomposites of Copper Trimesinate and Graphene Oxide as Sorbents for the Solid-Phase Extraction of Organic Dyes. Journal of Composites Science, 6(7), 215. https://doi.org/10.3390/jcs6070215


