Article

Analysis of Stress Intensity Factor of a Fibre Embedded in a Matrix

1
AMADE, Polytechnic School, University of Girona, 17003 Girona, Spain
2
IMDEA Materials Institute, 28906 Getafe, Spain
*
Authors to whom correspondence should be addressed.
J. Compos. Sci. 2023, 7(1), 22; https://doi.org/10.3390/jcs7010022
Submission received: 25 November 2022 / Revised: 20 December 2022 / Accepted: 6 January 2023 / Published: 10 January 2023
(This article belongs to the Special Issue Discontinuous Fiber Composites, Volume III)

Abstract

:
The analytical or numerical determination of the stress intensity factor (SIF) in cracked bodies usually assumes the body to be isolated. However, in fibre-reinforced composites, the fibre, which is the main load-carrying component, is embedded in a matrix. To clarify the effect the embedding matrix has on the SIF of the fibre, we propose a 3D computational model of an orthotropic fibre embedded in an isotropic matrix, and compute the SIF using the J-integral method. A parametric analysis based on dimensionless variables explores the effect of the fibre–matrix stiffness ratio as well as the effect of the degree of elastic orthotropy of the fibre. The results show that the SIF is strongly influenced by both factors, and that the matrix reduces the SIF by limiting the crack opening.

1. Introduction

Composites reinforced with technical fibres (carbon, glass, etc.) exhibit the best mechanical performance among structural materials in terms of specific properties (stiffness and strength-to-weight ratio) and are currently used in many industries such as aerospace or wind turbines. However, their low fracture toughness translates into brittle behaviour that often leads to catastrophic failure without prior damage symptoms [1]. Understanding the strength and toughness of composites is the subject of current research. In particular, how the tensile strength of fibres translates into that of the composite still requires clarification [2].
In spite of the small diameter of these technical fibres, typically below 15 microns, their very high strength leads to Irwin’s lengths much smaller than the diameter; that is, they behave like brittle materials. In this scenario, the stress intensity factor, SIF or K I , which depends on the existing surface flaws, geometry, and fibre toughness (referred to as critical SIF or K I C ) governs the fibre strength [3].
The critical SIF of fibres has been investigated by combining experimental methods with some type of numerical approach to determine the SIF [4,5,6,7,8,9,10,11,12,13,14,15,16,17,18,19,20]. For instance, Ogihara et al. [4] introduced various types of notches with straight fronts on carbon fibre mono-filaments using a focused ion beam machining system. Then, the authors used the virtual crack closure method to calculate the SIF of the free carbon fibre under tensile load in both isotropic and orthotropic cases to perform the data reduction in the experimental results. Herraez et al. [5] used a different numerical approach based on the J-integral to compute the SIF for different crack lengths. Then, they characterised the strength and toughness of carbon AS4, E-glass, and Kevlar KM2 via tensile tests on notched and un-notched fibres. In both cases, the SIF was computed assuming a free mono-filament, so the effect of the matrix was neglected.
A single fibre in a composite under longitudinal tension can be idealised as a cylinder embedded in a homogeneous material, the matrix, which is loaded axially. Currently, there are numerical and analytical results available in the literature concerning the SIF of isotropic cracked bars, rods, or beams with cylindrical cross-sections, loaded in tension or bending, and either under static or fatigue loading [6,7,8,9,10,11,12,13,14,15,16,17,18,19,20]. Nonetheless, to the authors’ best knowledge, no previous work has been carried out that accounts for the effect an embedding material may have on the SIF.
As a result, this current study employs high-fidelity computational micromechanics modelling to compute the SIF along the crack front of a straight-edge crack in a fibre subjected to tension loading while embedded in an isotropic matrix. First, the method is validated by comparing the results of a free isotropic fibre with previously published results. Following that, a parametric study is carried out to investigate the effect of the fibre–matrix stiffness ratio on the SIF. Finally, we investigate how the longitudinal-to-transverse stiffness ratio of the fibre influences the SIF. The findings presented in this paper contribute to a better understanding of the fracture of elastic bodies that extends beyond composite materials. Furthermore, this work provides closed-form equations to describe the SIF for cylindrical-shaped components with a crack surrounded by an elastic and homogeneous medium. These equations are applicable in other practical cases, such as the glass fibre composite rebars reinforcing concrete.

2. Methodology

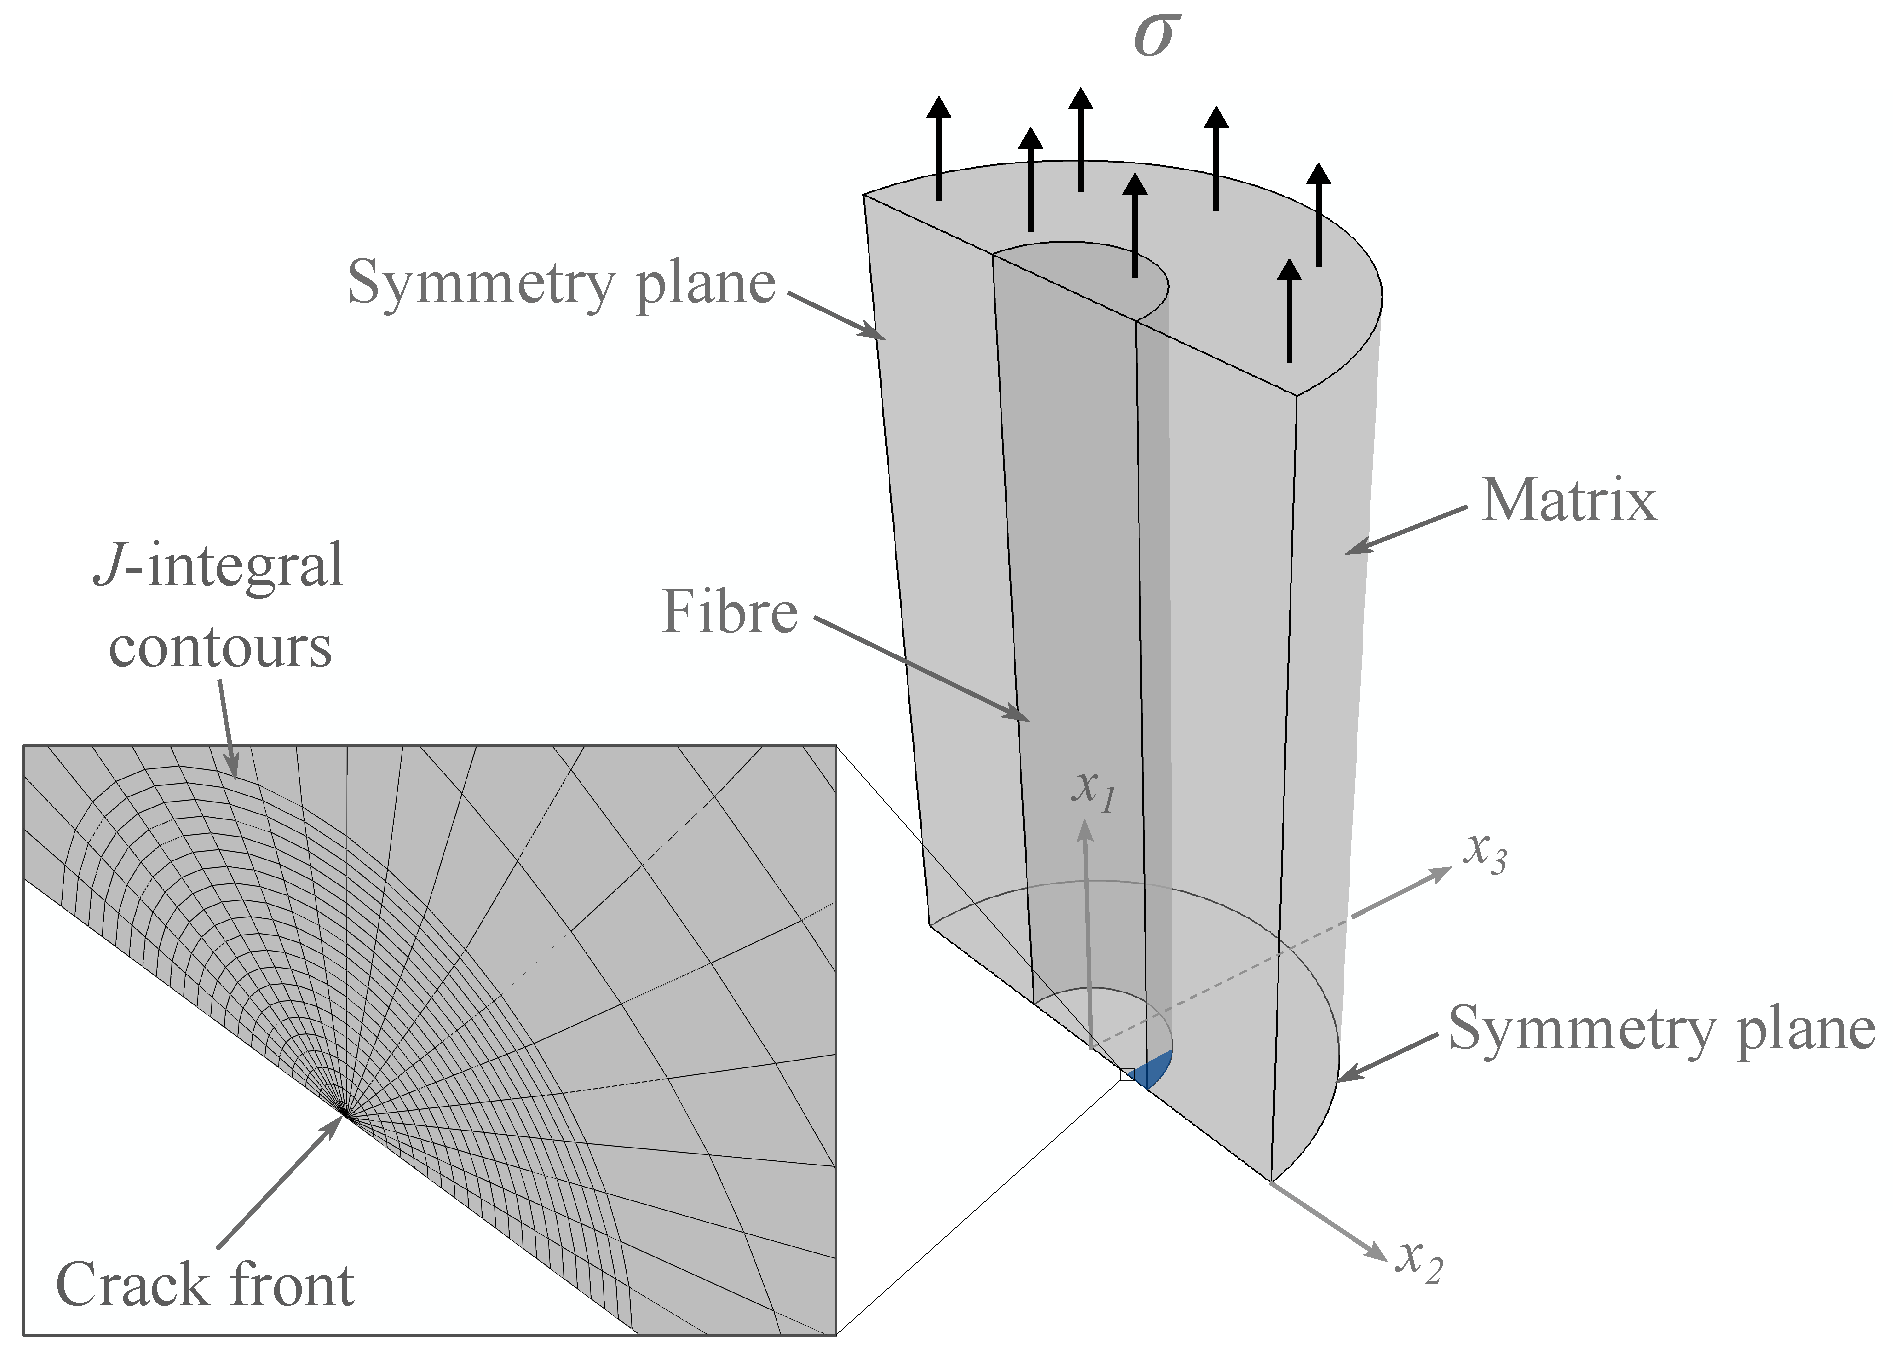
2.1. Numerical Evaluation of SIF

This work relies on a computational micromechanics simulation performed in Abaqus Standard [21]. The model consisted of a notched fibre embedded in an isotropic matrix subjected to a tensile axial force (Figure 1a), while the lateral surface area was free from stresses. The fibre included a straight-fronted edge crack at x 1 = L / 2 , with varying depths (a) as indicated by the grey area in Figure 1b. Matrix and fibres are modelled as elastic materials with a perfect fibre/matrix adhesion using tie constraints at the interface.
The size of the model was decided based on a parametric study that targeted the best trade-off between computational effort and accuracy. The axial length, L, had to be long enough to guarantee that the remote stresses at the upper and bottom faces were not influenced by the presence of the crack. This led to L = 10 D , where D is the fibre diameter. We selected a large enough thickness of the surrounding matrix, t, to avoid severe deformation in the boundaries of the matrix around the crack region. This criterion prevailed over achieving a realistic fibre volume fraction and led to t = D .
To reduce the computational costs, only one-quarter of the model was simulated by taking advantage of the symmetry boundary conditions along the x 1 x 2 and x 2 x 3 planes (Figure 1a). A uniform normal traction stress ( σ = 1 ) was imposed in the upper part of the model. Since the model is linear, SIF and remote stress are proportional. The fibre and matrix were meshed separately. We used a swept and structured mesh around the crack tip to enrich the discretization and capture the high stress gradients therein (Figure 2). The element size, after a convergence study, varied in the range of D / 1500 (at crack tip) to D / 100 (in far-field). To account for the stress singularity, quadratic isoparametric elements (C3D20) with the inverse square root singularity were used at the crack tip.
The stress intensity factor evaluation was carried out using the J-integral [22] method. In this approach, the energy release rate is obtained by integration along the contour Γ around the crack tip (Figure 3) as follows:
J = Γ W d x 1 t · u x 2 d s
where x 1 and x 2 are rectangular coordinates to the crack front, x 1 being perpendicular to the crack surface, W is the elastic strain density, t is the traction vector, u is the displacement vector, and d s is an increment of arc length along any contour Γ . Due to the geometry of the model, the J-integral values are not constant along the crack front. Thus, this work concentrated on the maximum value attained at the crack tip (point A in Figure 1b).
For linear elastic problems of crack opening in mode I, the J-integral equals the energy release rate ( G I ). The path independence [22] of J-integral was verified and a total of 21 concentric contours surrounding the crack tip were used, as shown in Figure 2 (magnified area). For an isotropic material, the stress intensity factor in mode I, K I , can be calculated from the J-integral as follows:
J = K 1 2 ( 1 ν 2 ) E
where E is the fibre Young’s modulus and ν the Poisson’s ratio. For an orthotropic material, the J-integral and the K I are related through the following [23]:
J = K I 2 a 11 a 22 2 a 22 a 11 + 2 a 12 + a 66 2 a 11 1 / 2
where a i j stands for the compliance tensor of the orthotropic solid under plane strain
a 11 = 1 E 11 , a 22 = 1 E 22 , a 66 = 1 G 12 , a 12 = ν 12 E 11
and E 11 and E 22 are the fibre Young’s modulus in longitudinal and transverse directions, respectively, and G 12 is the fibre shear’s modulus. Finally, the non-dimensional stress intensity factor ( K ^ I ) is calculated as follows:
K ^ I = K I σ π a
where σ is the far-field stress.

2.2. Non-Dimensional Parametric Analysis

For an embedded isotropic fibre, the independent elastic constants that have an effect on the SIF are the modulus of elasticity and the Poisson’s ratio of the fibre, E f and ν f , and of the matrix, E m and ν m . We performed a non-dimensional analysis based on the definition of the parameter α , representing the fibre-to-matrix stiffness ratio:
α = E 1 f E m E 1 f + E m
with α ranging between α = 1 (stiffness of the fibre negligible with respect to the matrix, E f E m ) and α = 1 ( E f E m , which corresponds to the free fibre). For α = 0 , the fibre and matrix have the same modulus of elasticity, so this case corresponds to a homogeneous cylindrical material with an internal crack.
In an orthotropic fibre, the number of elastic constants increases to nine: modulus of elasticity ( E 1 f , E 2 f , E 3 f ) , Poisson’s ratios ( ν 12 f , ν 13 f , ν 23 f ) , and shearing moduli ( G 12 f , G 13 f , G 23 f ) . The subscripts 1, 2, and 3 refer to longitudinal and the two transverse directions, respectively. For the sake of simplicity, the fibre was considered transversely isotropic ( E 2 f = E 3 f , ν 12 f = ν 13 f , G 12 f = G 13 f ), and some of the elastic constants took a fixed value ( ν 12 f = 0.3 , ν 23 f = 0.4 , G 12 f = 11.3 , ν 12 f = ν m = 0.3 ) [24]. Therefore, the elastic constants involved in the parametric study were E 1 f , E 2 f , and E m , which were combined in the non-dimensional parameters α , defined above in Equation (6), and β :
β = E 1 f E 2 f E 1 f + E 2 f
where β ranges between β = 1 ( E 1 f E 2 f ) and β = 1 ( E 1 f E 2 f ). The case β = 0 corresponds to the isotropic fibre.
Due to the positive definiteness of the strain energy, the elasticity tensor (compliance matrix) in linear elastic materials must be positive definite [25]. To ensure this, some constraints must be applied to the engineering elastic constants:
E > 0 , G > 0 , 1 < ν < 0.5
for isotropic elasticity, and
E 1 , E 2 , E 3 , G 12 , G 13 , G 23 > 0 ν 12 < E 1 E 2 1 / 2 ν 13 < E 1 E 3 1 / 2 ν 23 < E 2 E 3 1 / 2 1 ν 12 ν 12 ν 23 ν 32 ν 31 ν 13 2 ν 21 ν 32 ν 13 > 0
for the orthotropic elastic case. These constrains arise due to thermodynamic admissibility; their violation leads to a non-positive strain energy for certain load cases. Based on the linear elastic conditions, stability restricts β to 0.5 β < 1 .

3. Results and Discussion

The numerical approach was verified using two cases of isolated cylindrical bars for which the corresponding SIF has been previously published (free isotropic bar with a surface crack [4,6,26] and a bar with internal crack [27]). This verification is described in the Appendix A.

3.1. Isotropic Fibre Embedded in a Matrix

Figure 4a plots the evolution of the non-dimensional SIF for an isotropic fibre embedded in a matrix for different fibre/matrix stiffness ratios ( α equal to −0.95, −0.5, 0.0, 0.5, 0.8, 0.95, and 0.98) and relative crack lengths ( a / D equal to 0.07, 0.1, 0.2, 0.3, 0.4, and 0.45). The SIFs of an isotropic free fibre (grey continuous line) were added as a baseline, for comparison. The trend is that an increase in matrix stiffness (decrease in α ) leads to a significant drop in the SIF of the cracked fibre, especially for longer cracks. Even for a low stiffness matrix ( α = 0.98 or E m = 0.01 E f ), the SIF is reduced by −7% when a / D = 0.2 or by −25% when a / D = 0.4, with respect to the free fibre case. Figure 4b depicts the relative change in SIF for different fibre–matrix stiffness ratios ( α ) compared to the free fibre.
Figure 5 shows the maximum non-dimensional crack mouth opening displacement (CMOD) for the embedded fibre with α being equal to 0.98 and −0.95, as well as that of the free fibre (grey continuous line) for reference. The trends of the curves are very similar to those of the SIF and indicate that the surrounding material restricts the crack opening even in the case of a low stiffness matrix. In fact, the CMOD is negligible when the matrix stiffness is large compared with that of the fibre ( α = −0.95, Figure 5). Note that the CMOD shown in Figure 5) corresponds to a unit remote stress.
The non-dimensional SIF for an isotropic fibre embedded in a matrix as a function of the α parameter can be approximated by the following equation, which was obtained by fitting the results of this investigation as follows:
K ^ I = A + B a D + C a D 2 A = A 1 + A 2 1 α A 3 B = B 1 + B 2 α 1 α B 3 C = C 1 + C 2 1 α C 3
The use of this equation produces data that deviate by less than 2.8 % from any of the FE data points we have examined. The values of the coefficients of Equation (10) are listed in Table 1. The usefulness of this equation extends to elastic cylindrical cracked bars surrounded by a homogeneous and isotropic material, provided that the elastic constraints specified in the previous section are respected.

3.2. Orthotropic Free Fibre

Figure 6a shows the non-dimensional SIF for an orthotropic free fibre for different longitudinal/transverse stiffness ratios ( β equal to −0.5, 0.0, 0.5, 0.8, 0.9, and 0.99) and relative crack lengths ( a / D equal to 0.07, 0.1, 0.2, 0.3, 0.4, and 0.45). The case β = 0 corresponds to the free fibre with isotropic modulus (the fibre is not completely isotropic as ν 23 = 0.4 and ν 12 = ν 13 = 0.3 ). The explored range of β involves transverse modulus, E 2 f , ranging from three times the longitudinal modulus ( β = 0.5 ) to being negligible ( β = 1 ). The curves indicate that the degree of orthotropy has a strong influence on the SIF, and that the trend is opposite depending on whether the transverse modulus is smaller ( β > 0 ) or larger ( β > 0 ) than the axial modulus. For example, for β = 0.5 ( E 2 f = 3 E 1 f ), the SIF is increased by +30% over the isotropic case; while β = 0.5 ( E 2 f = 0.33 E 1 f ) involves a decrease of −25%. The relative change in the SIF of orthotripc fibres with respect to the isotropic case does not depend significantly on the crack length (Figure 6b).
The finite element results of the non-dimensional SIF for an orthotropic free fibre were fitted to the following equation:
K ^ I = 0.9257 + A + B a D + C a D 2 + D a D 3 A = A 1 β + A 2 β 2 + A 3 β 3 + A 4 β 4 B = B 1 + B 2 β 1 + B 3 β 2 + B 4 β 3 C = C 1 + C 2 β + C 3 β 2 D = D 1 + D 2 β
This equation produces data that deviate by less than 2.0% from any of the FE data points we have examined. The values of the coefficients of Equation (11) are listed in Table 2. The application of this equation can be extended to elastic cylindrical cracked bars with orthotropic properties provided that the elastic constraints specified in Equation (9) are met.

3.3. Orthotropic Fibre Embedded in a Matrix

This subsection presents the effect a surrounding material has on the SIF of an orthotropic cracked fibre. This study involves both parameters α and β ( β equal to −0.5, 0.0, 0.5, 0.8, and 0.9). We investigated two cases of fibre–matrix stiffness ratios: α equal to −0.95 and 0.95.
The outcome of this study (Figure 7a,b) reinforces the trends presented in the previous cases: (i) the presence of the matrix reduces the SIF and this effect scales with the stiffness of the matrix, and (ii) the degree of orthotropy of the fibre has a strong influence on the SIF, increasing or decreasing it depending on whether the transverse stiffness is higher or lower, respectively, than the axial stiffness. The strong effect of surrounding material on the SIF should be attributed to the constraints imposed by the matrix on the crack opening (Figure 5).
The complete set of results presented is directly applicable to the understanding of failure in unidirectional fiber-reinforced composites. For instance, a widely-used structural carbon composite combines an AS4 carbon fibre with an epoxy matrix. For that case, α = 0.95 and β = 0.89 (carbon fibres are non-isotropic [1]). An epoxy reinforced with glass fibres (i.e., S2/MTM44-1) corresponds to the case α = 0.91 and β = 0.0 (glass fibres are elastically isotropic).
However, the computational model relies on a significant simplification of the physics of the problem. Fibre (albeit not carbon fibres) and matrix are considered homogeneous elastic materials. The fibre is considered to be surrounded by a homogeneous material with the mechanical properties of the matrix. In reality, the fibre is surrounded by a heterogeneous material including nearby fibres which will lead to a higher equivalent stiffness of the embedding material, accentuating the crack opening constraint we have described and, thus, further reducing the SIF. The matrix is assumed to surround the fibre while most probably penetrating the small surface notches or defects in the fibres, thus further constraining the crack opening and reducing the SIF.
In spite of these simplifications, analytical or numerical models of fibre failure and/or fragmentation in a composite, relying on the stress intensity factor, will benefit from the information presented. For example, current fragmentation models rely on the experimental characterization of the fibre strength using a Weibull distribution. This characterization is performed on dry isolated fibres. The present work demonstrates that this characterization cannot be transferred to the fragmentation model while ignoring the effect of the matrix.
In addition, the situation described in this investigation, a cylindrical surface-notched specimen surrounded by a material of different stiffness, goes beyond the field of fibre-reinforced composites.
The computational FEM model developed here can be extended to include material non-linearities. In particular, the model can be refined to allow for more accurate modelling of micro-mechanisms by introducing fibre–matrix interface debonding and/or matrix plasticity. The impact of these phenomena will be explored in a future paper.

4. Conclusions

This work presented a computational micromechanics analysis of the stress intensity factor of a single fibre with a straight-fronted edge crack. The fibre was considered elastic and either isotropic or orthotropic, and free or embedded in an elastic material of different stiffness. The study was performed using non-dimensional variables for the fibre–matrix stiffness ratio and fibre longitudinal/transverse stiffness ratio. Only the modulus of elasticity of fibre and matrix were explored, the rest of the elastic parameters were kept constant throughout the study. The stress intensity factor evaluation was carried out using the J-integral.
Embedding the fibre in an elastic matrix reduced the SIF over the free-fibre case. The higher the matrix stiffness was, the more substantial the decrease in SIF. This effect is due to the constraint of the matrix over the crack opening. For instance, for the model with a very low stiffness matrix ( E m = 0.01 E f ), the SIF is reduced by −7% at a / D = 0.2 or by −25% at a / D = 0.4, with respect to the free-fibre case. We proposed a general non-dimensional equation for the non-dimensional SIF as a function of the non-dimensional crack length and the ratio between the stiffness of the cracked cylinder and that of the surrounding material.
The elastic orthotropy of the fibre greatly affected the SIF in that it increased for the case of a transverse stiffness higher than that of the axial, and decreased for the opposite case. For example, for a fibre with E 2 f = 3 E 1 f , the SIF is increased by +30% over the isotropic case ( E 2 f = E 1 f ); while a fibre with E 2 f = 0.33 E 1 f involves a decrease of −25%. An equation obtained by fitting was also provided for this case.
Although the study presented here was motivated by an interest in improving the understanding of fibre failure in fibre-reinforced composite materials, the findings and the equations also provide a contribution to the broader field of SIF in elastic cracked bodies.

Author Contributions

Conceptualization, M.B., C.L., C.G. and J.C.; methodology, M.B., C.G., D.T. and J.C.; software, M.B.; validation, M.B., J.M.G., C.G. and J.C.; formal analysis, M.B., C.G. and J.C.; investigation, M.B., J.C., D.T., J.M.G. and C.G.; resources, J.C. and D.T.; data curation, M.B., J.M.G., D.T. and J.C.; writing—original draft preparation, M.B.; writing—review and editing, M.B., J.C., D.T., J.M.G. and C.G.; visualization, M.B. and J.M.G.; supervision, C.L., C.G. and J.C.; project administration, C.L., J.C. and C.G.; funding acquisition, J.C. and C.L. All authors have read and agreed to the published version of the manuscript.

Funding

This research was funded through the Spanish MCIN/AEI PID2021-126989OB-I00/10.13039/501100011033/FEDER, UE.

Institutional Review Board Statement

Not applicable.

Informed Consent Statement

Not applicable.

Data Availability Statement

Not applicable.

Acknowledgments

This paper is dedicated to the memory of the late Claudio Lopes. The authors would like to express their gratitude for all his work and help. The research leading to this publication received financial support from the Spanish Ministry of Science, Innovation and Universities through projects MAT2015-69491-C3-2-R, PID2021-126989OB-I00 and FPI grant BES-2016–076544.

Conflicts of Interest

The authors declare no conflict of interest.

Appendix A. Verification of the Finite Element Model

We verified the computational approach to determine the SIF described in the Methodology section using two cases with previously published results [4,6,26,27].

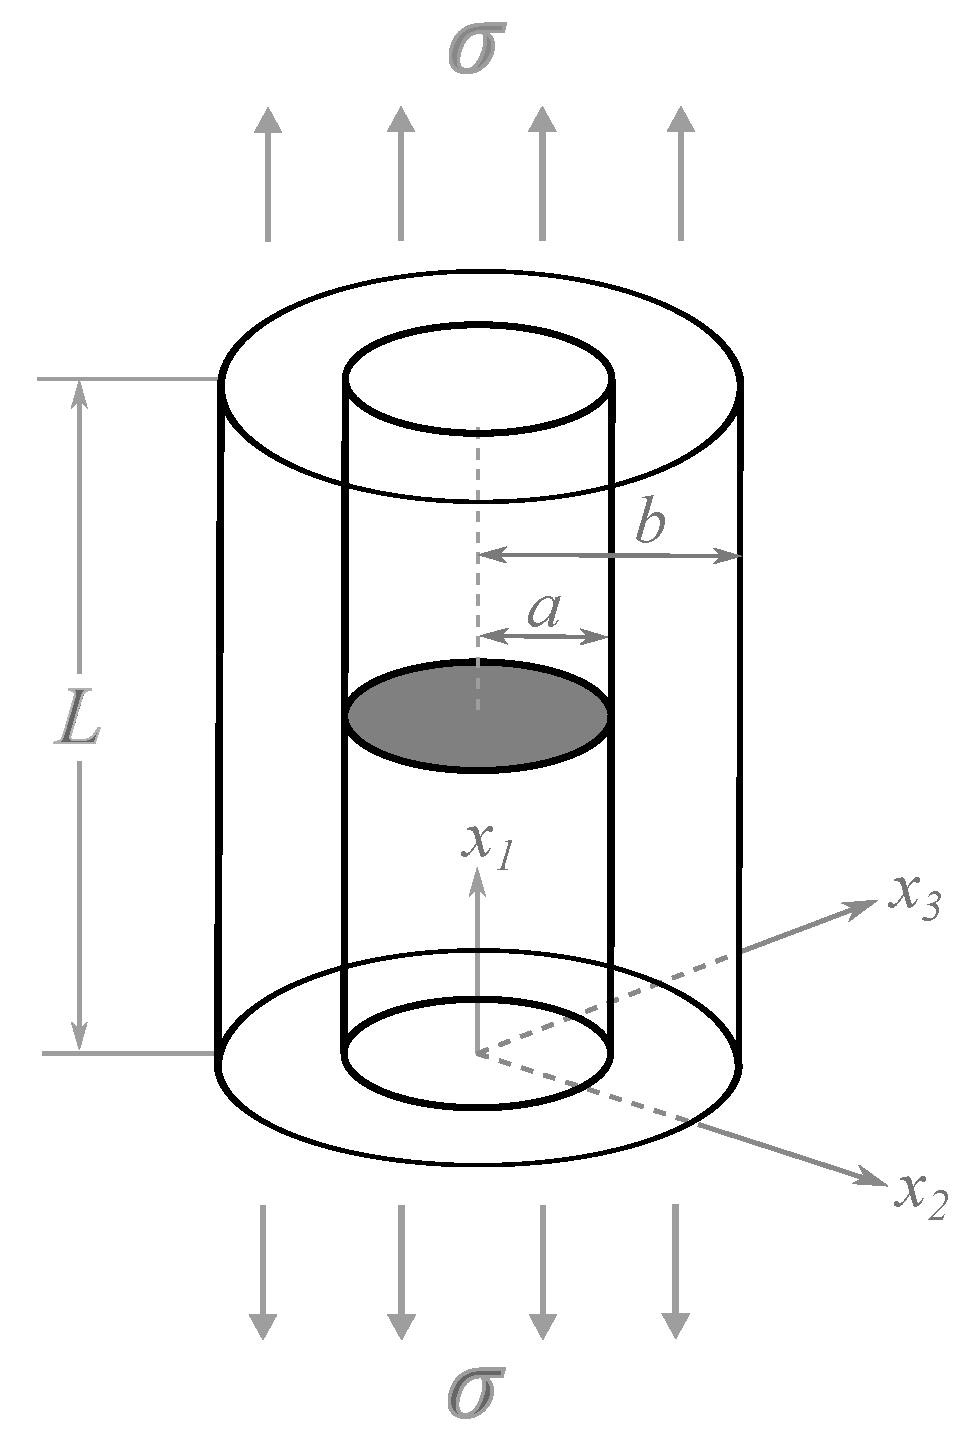
Appendix A.1. Free Fibre Model

First, the SIF results of the FEM model for a single isotropic free fibre (no mesh/material surrounding it) were compared with the literature (Astiz and Elices [26], Daoud et al. [6], and Ogihara et al. [4]), obtaining a good agreement (Figure A1). Our dimensionless SIF data was fitted using the following equation:
K I σ π a = 1.023 + 0.4448 a D 1.4 a D 2 + 13.23 a D 3
Figure A1. Comparison of the non-dimensional stress intensity factor of an isotropic free fibre subjected to uniform tension obtained in this work (FEM), with Astiz [26], Daoud et al. [6], and Ogihara et al. [4].
Jcs 07 00022 g0a1

Appendix A.2. Embedded Fibre Model with Very Low Stiffness Matrix

Second, the complete computational model, including fibre and the embedding matrix, was used to reproduce the free fibre case. To that purpose, the stiffness of the matrix was defined to be close to 0 ( α = 0.999999 ). Notice that an exact value of zero cannot be given since the finite element material model needs a non-zero stiffness. Figure A2 compares the results of the computational model (dots) with Equation (A1) and demonstrates that the embedded fibre model captures this case well.
Figure A2. Non-dimensional SIF of an isotropic free fibre resulting from a computational model of the isolated fibre (line) and with embedding material of nearly zero stiffness (dots).
Jcs 07 00022 g0a2

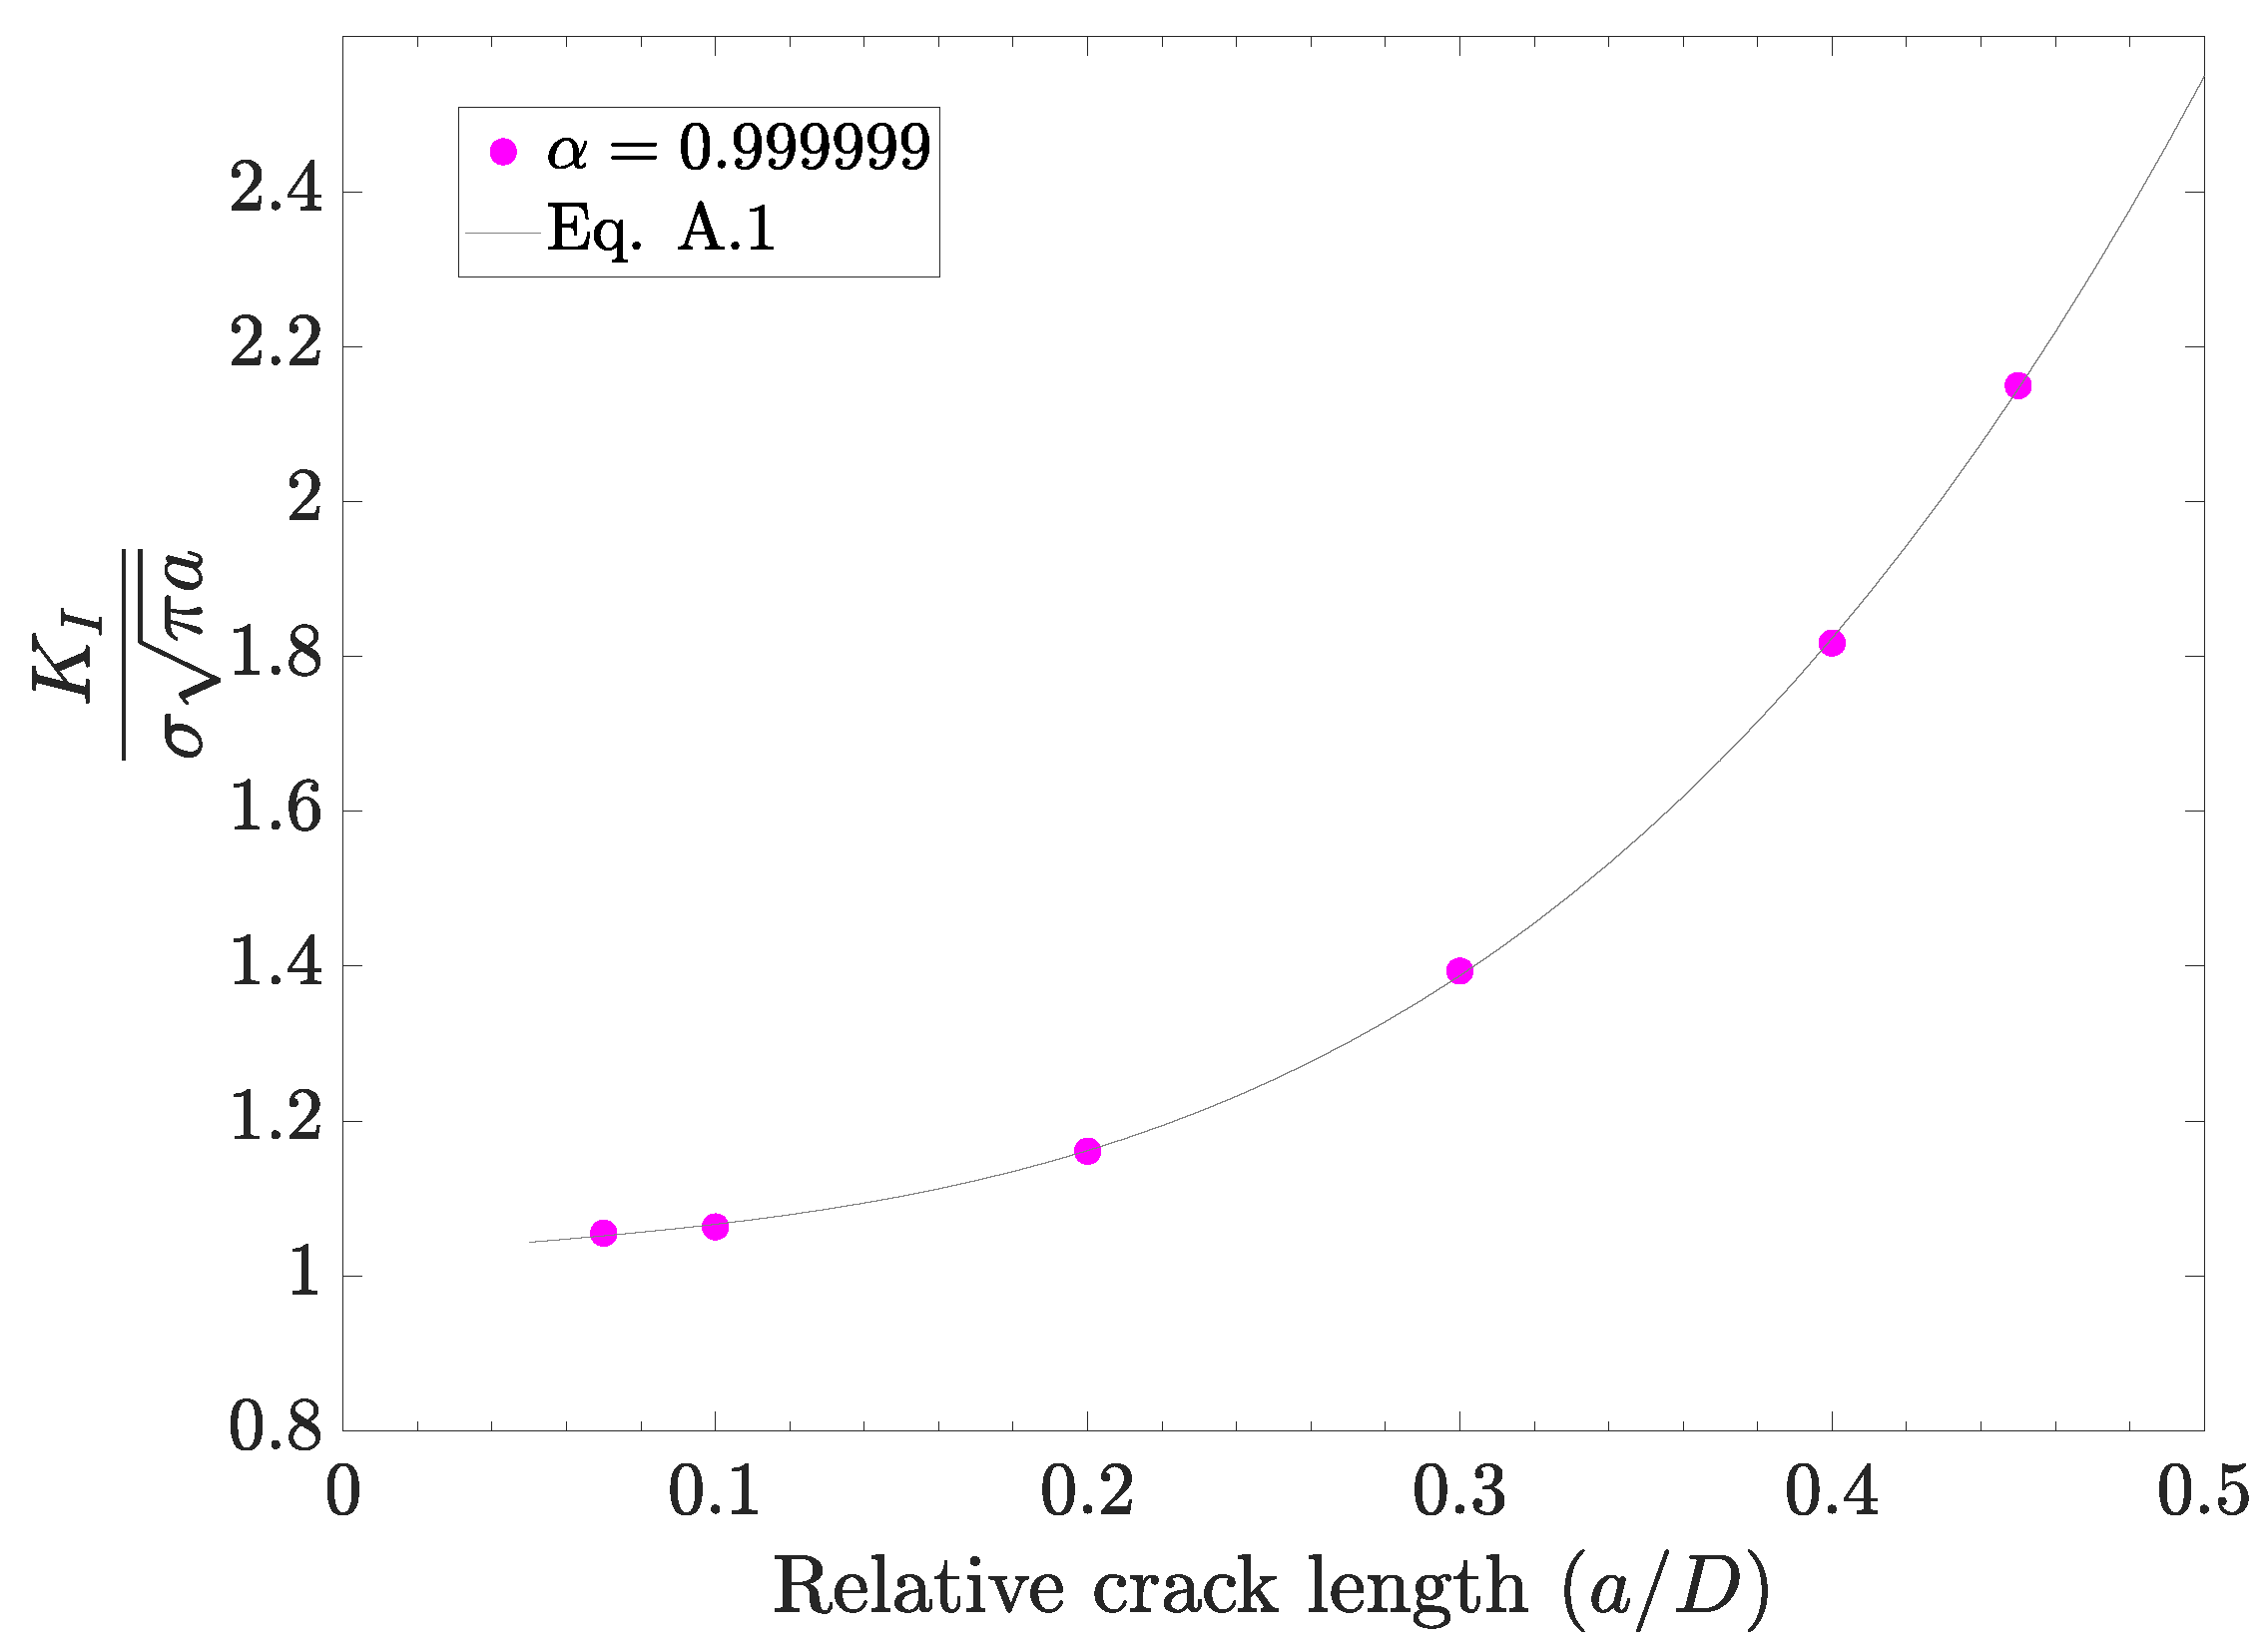
Appendix A.3. Comparison with an Analytical Model

The third verification case consisted of a cylinder with an internal circular crack under axial tension, for which an analytical model exists [27]. To reproduce this case, the computational model was defined so that the fibre and the matrix had the same elastic properties and the whole fibre cross-section acted as the crack (grey area in Figure A3).
Figure A3. Geometric illustration of a model consisting of a broken fibre embedded in a matrix as a solid cylinder with central circular crack. The fibre is broken in the middle ( x 1 = L / 2 ) and shown as the grey area.
Jcs 07 00022 g0a3
The analytical SIF solution for this crack geometry is given [27] as follows:
K I = 2 π 6 π a F a / b
where
F a / b = 1 0.5 a / b + 0.148 a / b 3 1 a / b
in which a is the crack radius and b is the radius of the cylinder. The SIF and crack opening at center (COAC) were calculated for both analytical and FE models and compared, showing a good agreement (SIF = 2.59 and COAC = 0.051 for analytical model, whereas SIF = 2.53 and COAC = 0.051 for the FE model). These three verification cases demonstrate the reliability of the proposed computational approach.

References

  1. Rangappa, S.M.; Satishkumar, T.P.; Cuadrado, M.M.; Siengchin, S.; Barile, C. An experimental study of the influence of inclusions on the fatigue properties of steel. Eng. Fract. Mech. 1974, 6, 759–805. [Google Scholar]
  2. Breite, C.; Melnikov, A.; Turon, A.; de Morais, A.B.; Otero, F.; Mesquita, F.; Costa, J.; Mayugo, J.A.; Guerrero, J.M.; Gorbatikh, L.; et al. Blind benchmarking of seven longitudinal tensile failure models for two virtual unidirectional composites. Compos. Sci. Technol. 2021, 202, 108555. [Google Scholar] [CrossRef]
  3. Paris, P.; Erdogan, F. A Critical Analysis of Crack Propagation Laws. ASME J. Basic Eng. 1963, 85, 528–533. [Google Scholar] [CrossRef]
  4. Ogihara, S.; Imafuku, Y.; Yamamoto, R.; Kogo, K. Direct evaluation of fracture toughness in a carbon fiber. In Proceedings of the 17th International Conference on Composite Materials, ICCM-17, Edinburgh, UK, 27–31 July 2009. [Google Scholar]
  5. Herraez, M.; Fernandez, A.; Lopes, C.S.; Gonzalez, C. Strength and toughness of structural fibres for composite material reinforcement. Phil. Trans. R. Soc. A 2016, 374, 20150274. [Google Scholar] [CrossRef] [PubMed] [Green Version]
  6. Daoud, O.E.K.; Cartwright, D.J.; Carney, M. Strain-energy release rate for a single-edge-cracked circular bar in tension. J. Strain Anal. Eng. Des. 1978, 13, 83–89. [Google Scholar] [CrossRef]
  7. Bush, J. Stress intensity factors for single-edge-crack solid and hollow round bars loaded in tension. J. Test. Eval. 1981, 9, 216–223. [Google Scholar]
  8. Ouchterlony, F. Extension of the compliance and stress intensity formulas for the single edge crack round bar in bending. Fracfure Mech. Ceram. Rocks Concr. 1981, 745, 237–256. [Google Scholar]
  9. Carpinteri, A. Stiffness loss and fracture resistance of a cracked beam with circular cross-section. Meccanica 1983, 18, 156–162. [Google Scholar] [CrossRef]
  10. Mackay, T.L.; Alperin, B.J. Stress intensity factors for fatigue cracking in high-strength bolts. Eng. Fract. Mech. 1985, 21, 391–397. [Google Scholar] [CrossRef]
  11. Athanassiadis, A.; Boissknot, J.M.; Brevet, P.; Francois, D.; Raharinaivo, A. Linear elastic fracture mechanics computations of cracked cylindrical tensioned bodies. Int. J. Fract. 1981, 17, 553–566. [Google Scholar] [CrossRef]
  12. Salah el din, A.S.; Lovegrove, J.M. Stress intensity factors for fatigue cracking of round bars. Int. J. Fatigue 1981, 3, 117–123. [Google Scholar] [CrossRef]
  13. Daoud, O.E.K.; Cartwright, D.J. Strain energy release rates for a straight-fronted edge crack in a circular bar subject to bending. Eng. Fract. Mech. 1984, 19, 701–707. [Google Scholar] [CrossRef]
  14. Erjian, S. Stress intensity factors for edge cracks in round bars. Eng. Fract. Mech. 1990, 34, 813–816. [Google Scholar] [CrossRef]
  15. Trantina, G.G.; de Lorenzi, H.G.; Wilkening, W.W. Three-dimensional elastic-plastic finite element analysis of small surface cracks. Eng. Fract. Mech. 1983, 18, 925–938. [Google Scholar] [CrossRef]
  16. Daoud, O.E.K.; Cartwright, D.J. Strain energy release rate for a circular-arc edge crack in a bar under tension or bending. J. Strain Anal. 1985, 20, 53–58. [Google Scholar] [CrossRef]
  17. Raju, I.S.; Newman, J.C. Stress intensity factors for circumferential surface cracks in pipes and rods. Fract. Mech. 1986, 905, 789–805. [Google Scholar]
  18. Nord, K.J.; Chung, T.J. Fracture and surface flaws in smooth’and threaded round bars. Int. J. Fract. 1986, 30, 47–55. [Google Scholar] [CrossRef]
  19. Caspers, M.; Mattheck, C.; Munz, D. Fatigue crack propagation in cylindrical bars. Z. Werkstofftech. 1986, 17, 327–333. [Google Scholar] [CrossRef]
  20. Ng, C.K.; Fenner, D.N. Stress intensity factors for an edge cracked circular bar in tension and bending. Int. J. Fract. 1988, 36, 291–303. [Google Scholar] [CrossRef]
  21. Dassault Systemes/SIMULIA. ABAQUS Version 2020 Documentation; ABAQUS, Inc.: Palo Alto, CA, USA, 2020. [Google Scholar]
  22. Rice, J.R. A Path Independent Integral and the Approximate Analysis of Strain Concentration by Notches and Cracks. J. Appl. Mech. 1968, 35, 379–386. [Google Scholar] [CrossRef] [Green Version]
  23. Sih, G.C.; Paris, P.C.; Irwin, G.R. On cracks in rectilinearly anisotropic bodies. Int. J. Fract. 1965, 189–203. [Google Scholar] [CrossRef]
  24. Barzegar, M.; Costa, J.; Lopes, C.S. High-fidelity computational micromechanics of first-fibre failure in unidirectional composites: Deformation mechanisms and stress concentration factors. Int. J. Solids Struct. 2020, 204–205, 18–33. [Google Scholar] [CrossRef]
  25. Lempriere, B.M. Poisson’s ratio in orthotropic materials. AIAA J. 1968, 2226–2227. [Google Scholar] [CrossRef]
  26. Astiz, M.A. An incompatible singular elastic element for two- and threedimensional crack problems. Int. J. Fract. 1986, 31, 105–124. [Google Scholar] [CrossRef]
  27. Tada, H.; Paris, P.C.; Irwin, G.R. The Analysis of Cracks Handbook; ASME Press: New York, NY, USA, 2000. [Google Scholar]
Figure 1. (a) 3D geometry of a notched fibre with straight-fronted edge crack (indicated in grey) embedded in a matrix; (b) fibre cross-section at crack plane.
Jcs 07 00022 g001
Figure 2. FE model with details of the boundary conditions and finite-element meshing of the crack tip region.
Jcs 07 00022 g002
Figure 3. Definition of the contour path around the crack tip to compute the J-integral.
Jcs 07 00022 g003
Figure 4. (a) Non-dimensional SIF for an isotropic fibre embedded in a matrix for different fibre–matrix stiffness ratios, α . The dots refer to the FEM results and the dashed lines to the fitting curves according to Equation (10). The continuous grey curve corresponds to the SIF for a free fibre ( α = 1 ). (b) Relative reduction of the non-dimensional SIF for an isotropic fibre embedded in a matrix with respect to the free fibre (continuous grey line).
Jcs 07 00022 g004
Figure 5. Non-dimensional CMOD for an isotropic fibre embedded in a matrix for different fibre–matrix stiffness ratios, α . The continuous grey curve corresponds to the CMOD for a free fibre ( α = 1 ).
Jcs 07 00022 g005
Figure 6. (a) Comparison of non-dimensional stress intensity factor of an orthotropic free fibre for different longitudinal/transverse stiffness ratios, β . The dots refer to the FEM results and the dashed lines indicate the fitting results. (b) Percentage of non-dimensional stress intensity factor changes of an orthotropic free fibre for different longitudinal/transverse stiffness ratio, β . The percentage change was calculated with respect to the model with β = 0 ( E 1 = E 2 ) as the reference.
Jcs 07 00022 g006
Figure 7. Comparison of non-dimensional stress intensity factor of an orthotropic fibre embedded in a matrix, for different fibre longitudinal/transverse stiffness ratios ( β ) at fibre–matrix stiffness ratios: (a) α = 0.95 and (b) α = 0.95 .
Jcs 07 00022 g007
Table 1. Coefficients for the fitting equation given in Equation (10).
Coefficients of Equation (10)
A 1 1.187 B 1 −0.4268 C 1 −0.4647
A 2 −0.4349 B 2 −0.1893 C 2 0.7246
A 3 −0.3255 B 3 −0.07555 C 3 0.4295
Table 2. Coefficients for the fitting of equation given in Equation (11).
Coefficients of Equation (11)
A 1 −0.9022 B 1 0.932 C 1 −4.647 D 1 17.67
A 2 0.3677 B 2 −0.7516 C 2 4.415 D 2 −10.7
A 3 1.833 B 3 1.81 C 3 −1.928
A 4 −1.993 B 4 −1.727
Disclaimer/Publisher’s Note: The statements, opinions and data contained in all publications are solely those of the individual author(s) and contributor(s) and not of MDPI and/or the editor(s). MDPI and/or the editor(s) disclaim responsibility for any injury to people or property resulting from any ideas, methods, instructions or products referred to in the content.

