Review

Effects of Low-Velocity-Impact on Facesheet-Core Debonding of Natural-Core Composite Sandwich Structures—A Review of Experimental Research

by
Michael Ong
and
Arlindo Silva
*
Faculty of Engineering Product Design, Singapore University of Technology and Design, 8 Somapah Road, Singapore 487372, Singapore
*
Author to whom correspondence should be addressed.
J. Compos. Sci. 2024, 8(1), 23; https://doi.org/10.3390/jcs8010023
Submission received: 12 October 2023 / Revised: 8 November 2023 / Accepted: 28 November 2023 / Published: 9 January 2024
(This article belongs to the Special Issue Discontinuous Fiber Composites, Volume III)

Abstract

:
Sandwich composites are often used as primary load-bearing structures in various industries like aviation, wind, and marine due to their high strength-to-weight and stiffness-to-weight ratios, but they are vulnerable to damage from Low-velocity-impact (LVI) events like dropped tools, hail, and birdstrikes. This often manifests in the form of Facesheet-Core-Debonding (FCD) and is often termed Barely-Visible-Impact-Damage (BVID), which is difficult to detect and can considerably reduce mechanical properties. In general, a balsa core sandwich is especially vulnerable to FCD under LVI as it has poorer adhesion than synthetic core materials. A cork core sandwich does show promise in absorbing LVI with low permanent indentation depth. This paper also reviews surface treatment/modification as a means of improving the adhesion of composite core and fiber materials: key concepts involved, a comparison of surface free energies of various materials, and research literature on surface modification of cork, glass, and carbon fibers. Since both balsa and cork have a relatively low surface free energy compared to other materials, this paper concludes that it may be possible to use surface modification techniques to boost adhesion and thus FCD on balsa or cork sandwich composites under LVI, which has not been covered by existing research literature.

1. Introduction

Sandwich composites are being increasingly used in primary load-bearing structures due to their high strength-to-weight and stiffness-to-weight ratios, such as in wind turbine spar caps [1] and aerospace structures [2].
As such, they are subject to low-velocity impacts both in the manufacturing process and in service, such as dropped tools [3], hail strikes, debris, and bird strikes during aircraft takeoff and landing [2].
This often results in facesheet-core debonding in sandwich structures, which can considerably reduce strength and is also difficult to detect visually. This is also difficult to prevent, as low-velocity impacts like hail strikes and dropped tools are difficult to prevent [2]. As such, this is the focus of this review paper.
Meanwhile, there is much interest in using natural materials in composites due to their ready availability, lower cost, and lower environmental impact than synthetic materials. While there is much research on using natural fibers in fiber composites, balsa has already been used as a sandwich core material since the 1940s, while cork has been recently commercially introduced as a core material. These are covered in Section 4, Section 5, Section 6 and Section 7 of this review paper.
Section 8 briefly covers the vacuum-assisted resin infusion fabrication process that is commonly used for wind turbine blades and marine applications that balsa is normally used for Section 9, Section 10 and Section 11 discusses surface treatment/modification as a means of improving the adhesion of composite core and fiber materials, especially since balsa and cork have a relatively low surface free energy compared to other materials. It briefly covers the concept of substrate surface free energy, means of measuring and deriving it, and a list of the surface free energy of various materials before covering research literature on various surface treatment methods used on composite materials, such as liquid chemical and reactive gas (e.g., various types of plasma treatment, flame, UV). It finishes by suggesting criteria for a suitable surface treatment in a composite processing facility.
Section 12 and Section 13 briefly outline the various failure modes of composites and sandwich composites and how impacts are categorized by velocity. It then goes on to discuss various research studies that compare the effect of low-velocity impact damage on sandwich composites made with balsa, cork, and various thermoplastic foams. Debonding was found to be a more dominant damage mode for balsa due to poorer facesheet/core adhesion between balsa and the resin matrix.

2. Composites Usage, Environmental Impact and Recyclable Composites

With much higher strength-to-weight ratios than aluminum or steel, fiber-reinforced polymer matrix composites (or fiber composites) are increasingly being used in various industries such as aviation, marine, wind, and automotive.
Currently, most composites in commercial use worldwide are thermoset composites [4]. The huge increase in composite use in several industries in the last 20–30 years, plus the current lack of a commercially feasible method for recycling these composites, has also brought about the need to develop recyclable composites [5]. This can be seen by several significant trends within the last 20–30 years:
  • Legislation promoting end-of-life recycling of vehicle parts, such as the European Guideline 2000/53/EG which sets a target that 85% of a vehicle’s weight should be recyclable by 2005 and 95% by 2015 [6].
  • Large increase in composite use in the automotive and aviation industries, due to the need to reduce vehicle weight, fuel consumption, and CO2 emissions, and therefore reduce operating costs and comply with legislation to reduce emissions, such as the Kyoto Protocol [6]. In particular, the proportion of composites used in aircraft has grown from 10–12% (1990—Airbus A330 and Boeing 777) to over 50% by weight (2010s—Boeing 787 and Airbus A350) in just 20 years [7,8].
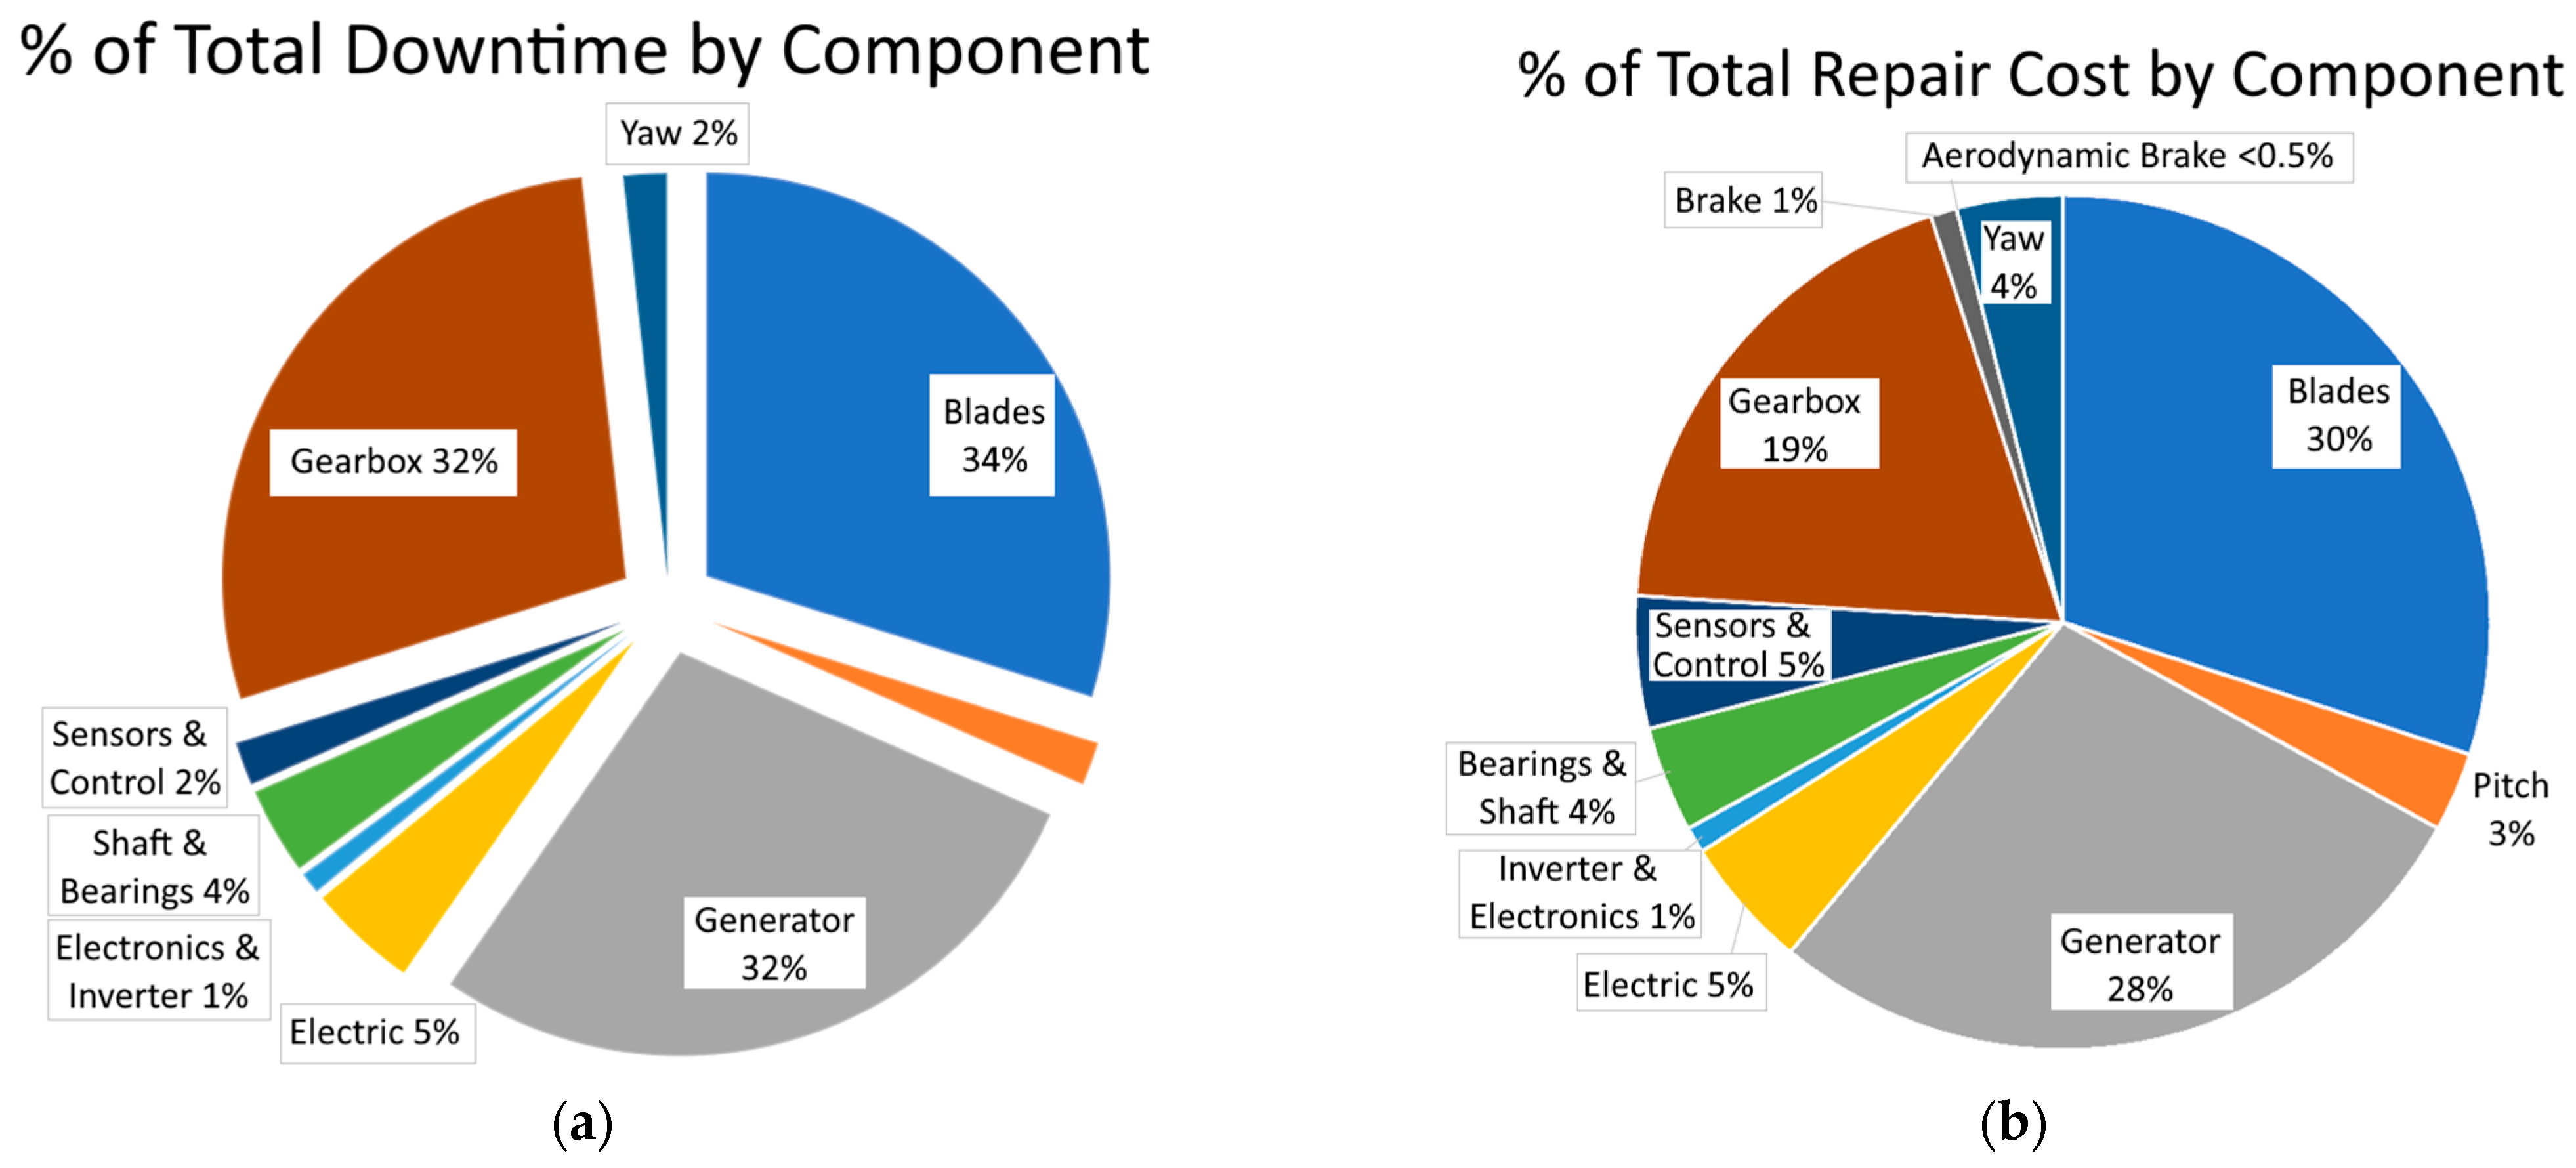
  • Massive growth of the wind industry as the technology matures and costs have decreased: from 6.4 GW in 1996 to 837 GW in 2021 [9]. Tower height, turbine blade, and rotor diameters have also greatly increased, as shown in Figure 1. Wind turbine blades also traditionally use balsa core sandwich composites, which is covered more in detail in Section 4.
  • Lack of commercially feasible methods to recycle thermoset composites combined with a wave of decommissioned wind turbine blades [10] and airliners containing composite parts. As shown in Figure 2a, composite parts are often landfilled as a result, taking up scarce landfill space.
Most decommissioned composite wind turbine blades [10] are currently landfilled and take up a lot of scarce landfill space [11]. Moreover, many of these airliners contain composite parts and this trend has accelerated during the COVID-19 pandemic. [10] This problem will only get worse as the quantity, size and proportion of composites used increases in these industries.
As a result, this has prompted much research on lowering the environmental impact of composites—both for recyclable thermoplastic matrix materials and replacing synthetic materials with natural materials.
Figure 1. The largest turbine blades dwarf airliners and approach the size of the Eiffel Tower. Growth is also much faster than expected—the 2020 prediction that turbines would reach 220 m rotor diameter and 12 MW in 2022 was exceeded by Vestas V236-15.0 MW in 2022. (a) Infographic showing wind turbine growth with time. Adapted from [12], (b) Size comparison of the Eiffel Tower, largest airliner in commercial service & largest wind turbine of 2021. Info from [13].
Jcs 08 00023 g001
Figure 2. (a) Decommissioned wind turbine blades awaiting landfilling. Note the tractor at top right for scale. Adapted from [14], used with author’s permission. (b) Scrapping of a Boeing 777 airliner during the Covid pandemic. Picture from [15], used with author’s permission.
Jcs 08 00023 g002

3. Natural Materials in Composites

At the same time, there is much interest in using natural materials in composites due to their biodegradability, ready availability, and low cost. They also typically have a lower environmental impact than synthetic materials [16].
So far, much research has been conducted on using cellulose-based natural fibers such as hemp, flax, jute, sisal, pineapple, kenaf, and ramie as substitutes for aramid, glass, or carbon fibers as composite reinforcements [6,16]. Some, like hemp, jute, and kenaf, have traditionally been used to make twine, ropes, and sack materials for centuries.
Lignocellulosic natural fibers often have a lower density and cost, and require an average of 50% less energy to produce than aramid, glass, or carbon fibers [17]. This makes them suitable in applications where strength to weight is not the most critical factor.
On the other hand, cellulosic natural fibers have their disadvantages, such as flammability and poor adhesion at the interface between fiber and matrix, leading to poor mechanical properties of laminates [18]. Hence, much research has gone into physical and chemical methods of improving adhesion, which will be covered more in detail later in Section 9.
So far, natural fibers have been used in some commercial car parts, such as the 1996 Mercedes E-class featured jute-epoxy door panels [19], and the BMW 7-series sedan lower door panel made from natural fiber-acrylic copolymer [20].
At the same time, balsa has been used as a sandwich core material for many years, long before the advent of carbon fiber and glass fiber composite laminates. One such famous example is the main wing structure of the 1940s DH98 Mosquito aircraft, comprised of birch facesheets glued to a balsa core [3]. This gave it a much lighter structure than other aircraft built from metal and directly contributed to its impressive speed, range and combat record in World War 2 [21].
Today, balsa is not commonly used for aircraft structures, as a CFRP-honeycomb sandwich is often preferred. It is still commonly used for many wind turbine blades.

Wind Turbine Blades

With the growth of the wind industry, the vast majority of balsa produced is used as a sandwich core for wind turbine blades [22].
Wind turbine blades are subject to huge and variable aerodynamic and centrifugal loads and vibrations. Blade weight must also be controlled closely so as to maintain balance among the three blades in a turbine [23].
As such, they are one of the most failure-prone components on a wind turbine, and incur some of the highest component repair costs and downtime, as shown in Figure 3.

4. Balsa

Balsa (Ochroma Pyramidale) is a tree that is native to the Amazon region, with Ecuador being the largest producer of balsa [25]. Most balsa wood used commercially is harvested from plantations, particularly from Ecuador. It is a relatively fast-growing tree and can be harvested within 5–8 years [26].

4.1. Balsa Wood Applications

Due to its fast growth, balsa wood has very low density, making it the lightest commercial timber [27].
Balsa is the lightest commercial timber, with wood grades of varying densities of around 100–280 kg m−3 available, with lighter grades of between 130–160 kg m−3 often used for gliders and wind turbines. It is compatible with co-curing and will absorb resin when impregnated [28,29,30].
Balsa wood is largely comprised of cellulose. [31] found that balsa fibers are comprised of 44.62% α-cellulose, 16.60% lignin, and 2.29% wax content.
The mechanical properties of balsa are highly directional and are strongest in the wood grain direction. Therefore, as shown in Figure 4a, balsa is often cut in an A-grain manner (tangential to the wood rings, or grain) as end-grain blocks, and thus the grain is aligned with the thickness direction of the sandwich and perpendicular to the planes of the facesheets. While this maximizes compressive strength, it also means that vertical cracks can grow along the wood grain direction between wood grains [32]. End-grain blocks are then joined together using glass fiber scrim cloth for handling purposes, as shown in Figure 5.
While synthetic alternatives such as thermoplastic (e.g., PET, PVC, PMI) foam with varying densities have appeared over the years, end-grain balsa is still a popular core material for wind turbine blades, gliders, and other applications due to its low cost and better mechanical properties than most foams [35]. Balsa production also requires less energy and produces less CO2 than these synthetic foams [32].
It is beyond the scope of this paper to discuss mechanical properties of balsa wood in detail or how various factors like moisture, humidity and temperature affect it. More detailed explanations can be found at [35].

4.2. Coated Balsa for Reduced Resin Uptake

Within the last 5 years, some balsa suppliers have introduced proprietary surface coatings on their end-grain balsa products that greatly reduce resin uptake, such as Corelite’s Balsasud PC-11, Gurit’s Balsaflex Lite and 3A Composites’ Baltek SealX. These coatings do so by restricting resin to the balsa surface and prevent it from entering the vessels within the balsa wood thickness (Figure 6).
Due to their proprietary nature, very little information is openly available as to the composition of these coatings. Table 1 summarizes the marketing literature of various coated balsa:
Currently, there is little or no open literature on the effects of these coatings on the mechanical properties of these balsa core sandwich panels, or comparing the sandwich mechanical properties of coated balsa cores versus uncoated balsa cores. Ref. [35] states qualitatively that while coated balsa core generally has weaker bonding strength than un-coated balsa, its higher consistency means that design strength and safety factors can remain unchanged [35].

5. Cork and Cork Agglomerates

Cork is derived from the periderm (bark) of the cork oak (Quercus suber) tree, which grows in Mediterranean countries like Tunisia, Portugal, and Spain [38,39]. While it is best known for wine bottle corks (plugs for sealing wine bottles), it was commonly used for many other uses such as insulation and gaskets before being displaced in the 1940s by cheaper petroleum-derived plastics. However, with the current emphasis on sustainability, cork has experienced a comeback [38,39].
Cork is largely comprised of the chemical compound Suberin, which gives it a rubbery feel as well as many of its desirable properties like excellent damping and fire resistance [40]. Cork has been used as a thermal ablative on spacecraft since the 1970s [35]. Depending on the treatment method and the age of the tree, cork has a density of between 120–240 kg m−3 [40].
As shown in Figure 7, Cork has an alveolar cellular structure. [40] states that these cells when viewed radially resemble polygons of between 4 to 9 sides (with 5, 6, & 7 sided being most common), and its cell walls are mostly formed by suberin, lignin, and cellulose. The proportions of suberin, lignin and polysaccharides such as cellulose & hemicellulose vary with several factors, such as geographic origin, soil & growth conditions, age (virgin or reproduction) and genetics [40]. A ballpark reference figure for chemical composition is suberin (45%), lignin (27%), polysaccharides (12%), ceroids (6%), and tannins (6%) [41].
Due to the flexibility of suberin, cell wall corrugations are able to act as folding paths that allow cell walls to bend and fold at high strains without experiencing damage. This causes cork to have a very low or negative Poisson’s ratio [42,43].
It is beyond the scope of this paper to discuss the compressive stress strains of cork by itself. A more detailed explanation can be found at [40,43].
Suberin is a glyceridic polyester comprising linear long-chain fatty acids and alcohols assembled into ribbon-like structures. This allows for the bending and collapse of cell walls, giving cork its elastic properties as well as fire resistance, vibration damping [44,45], and impact resistance, which will be covered more in detail in Section 5.1 and Section 13. These desirable qualities make cork suitable as a composite core material.
Typically, cork is harvested from cork oak trees between 9 to 15 years, depending on the region where they are grown. Cork planks are typically left to dry and stabilize first till water content is around 6–10% [45].
Cork left over from the wine cork production processes, such as in Figure 7b, are often ground up into granules, cleaned using steam, and then dried using hot air in circulating driers until the desired moisture level is reached. The granules are then processed into expanded cork or cork agglomerate products [46,47].
Figure 7. (a) Diagram of cork cellular structure. Picture from [43], used with publisher’s permission. (b) A piece of cork bark punch—after wine corks have been punched from it. Such cork bark punches are typically ground into granules and formed into agglomerates. Picture from [48], used with publisher’s permission. (c,d) SEM micrograph of cork cells viewed from the (a) radial and (b) tangential directions. Picture adapted from [47] with publisher’s permission.
Jcs 08 00023 g007
In the agglomeration process, granules of varying sizes are mixed together with a binder before being poured into molds. The binders can be dextrin, casein, gelatin, or urea-formaldehyde based, but currently are typically polyurethane based [49].
The molds containing the granules and binders may be heated either by an oven or by high-frequency radio frequency heating systems. After removal from the mold, the agglomerate is cooled and stabilized before sanding and cutting to the desired thickness. Surface finishes and decoration are then applied to the finished cork sheet [47].
Expanded cork is made using virgin cork that is too resinous to be used for wine corks. Virgin cork is granulated and then bonded together using superheated steam at 300–370 °C and 40 kPa in a steam boiler. This causes the cork cells to swell and release suberin, which acts as a binder to bond the granules together. It is typically used as thermal insulation for buildings but has a higher cost than synthetic materials like EPS and XPS [50].

5.1. Effect of Low-Velocity Impact on Non-Sandwich Cork Agglomerates

Various papers in the research literature cover low-velocity impact on cork agglomerates by itself, in the context of cork as a potential helmet liner material. Refs. [51,52] agrees that cork agglomerates show promise as an impact-absorbing material. Cork agglomerates were generally able to withstand higher impact forces than thermoplastic foams such as EPS, recover their initial dimensions after impact, and absorb multiple impacts thereafter [51,52].
Ref. [52] identified a key impact damage mechanism to adiabatic compression of air within cork cells by heating up the binder holding the cells, increasing the binder’s viscosity, and reducing its adhesion. Cork granule separation occurs upon binder failure. Cork grain size (smaller is better), binder used, and temperature at impact (lower is better) were key factors determining the impact performance of cork agglomerates [52].
Ref. [53] found that for an impact energy/thickness ratio range of between 200–1200 J/m, the energy-absorption capability of cork agglomerate is not dependent on specimen thickness. There was also some dispersion in maximum levels of force, displacement, and strain due to natural variances [53].
While there are other research papers covering higher velocity impacts on cork agglomerates and cork sandwich structures, higher velocity impacts are not the focus of this review paper as they tend to produce local perforations that are easily detected [2].
There are several papers in the research literature that cover the Low-Velocity Impact (LVI) testing of Corecork in composite structures, such as [54,55], as well as non-Corecork cork agglomerates using epoxy as a binder, such as [56,57]. They are covered more in detail in Table 14.

5.2. Co-Cured Cork Agglomerates

In recent years, Amorim S.A. of Portugal has released Corecork™, a commercially available cork agglomerate product that is compatible with co-curing by typical composite fabrication processes—hand layup, vacuum bagging, vacuum infusion, and resin transfer molding.
Prior to that, cork agglomerates were secondarily bonded to the facesheets, as seen in [56,57]. While it is also possible to cure Corecork™ with composite resins such as epoxy or vinyl ester before using secondary bonding to join it to facesheets, there is little practical reason to do so given that it can be co-cured. The author is not aware of any such papers in research literature using such an approach.
It is available in different grades, as shown in Table 2. There is no information available on the processing of these commercial products.

6. Comparison of Cork Agglomerates and Balsa

As can be seen from Table 2, cork has a higher density than balsa. This is especially so after it has been co-cured with resin.
Corecork datasheets give a resin uptake of between 170–270 g/mm m2. While balsa datasheets typically do not state resin absorption figures, a ballpark of 140–150 g/mm m2 for uncoated balsa can be inferred from Baltek and Gurit’s figures given in Table 1 earlier, while coated balsa has even less resin uptake. This is also consistent with [54], which found that Corecork NL10 and NL20 both absorbed more resin than balsa in their experimental work [54].

7. Sandwich Composite Manufacturing Processes

Fiber composite sandwich structures are typically fabricated by one of three processes [62]. Table 3 shows a brief comparison between the three methods:
Co-curing is the most desirable fabrication method. It saves on complexity and potential alignment issues in the manufacturing process. More importantly, all interfaces are chemically crosslinked and there are no adhesion-bonded interfaces between pieces. Adhesion-bonded interfaces are weaker due to interdiffusion of the adhesive and laminate when adhesive joints cure [62,63].

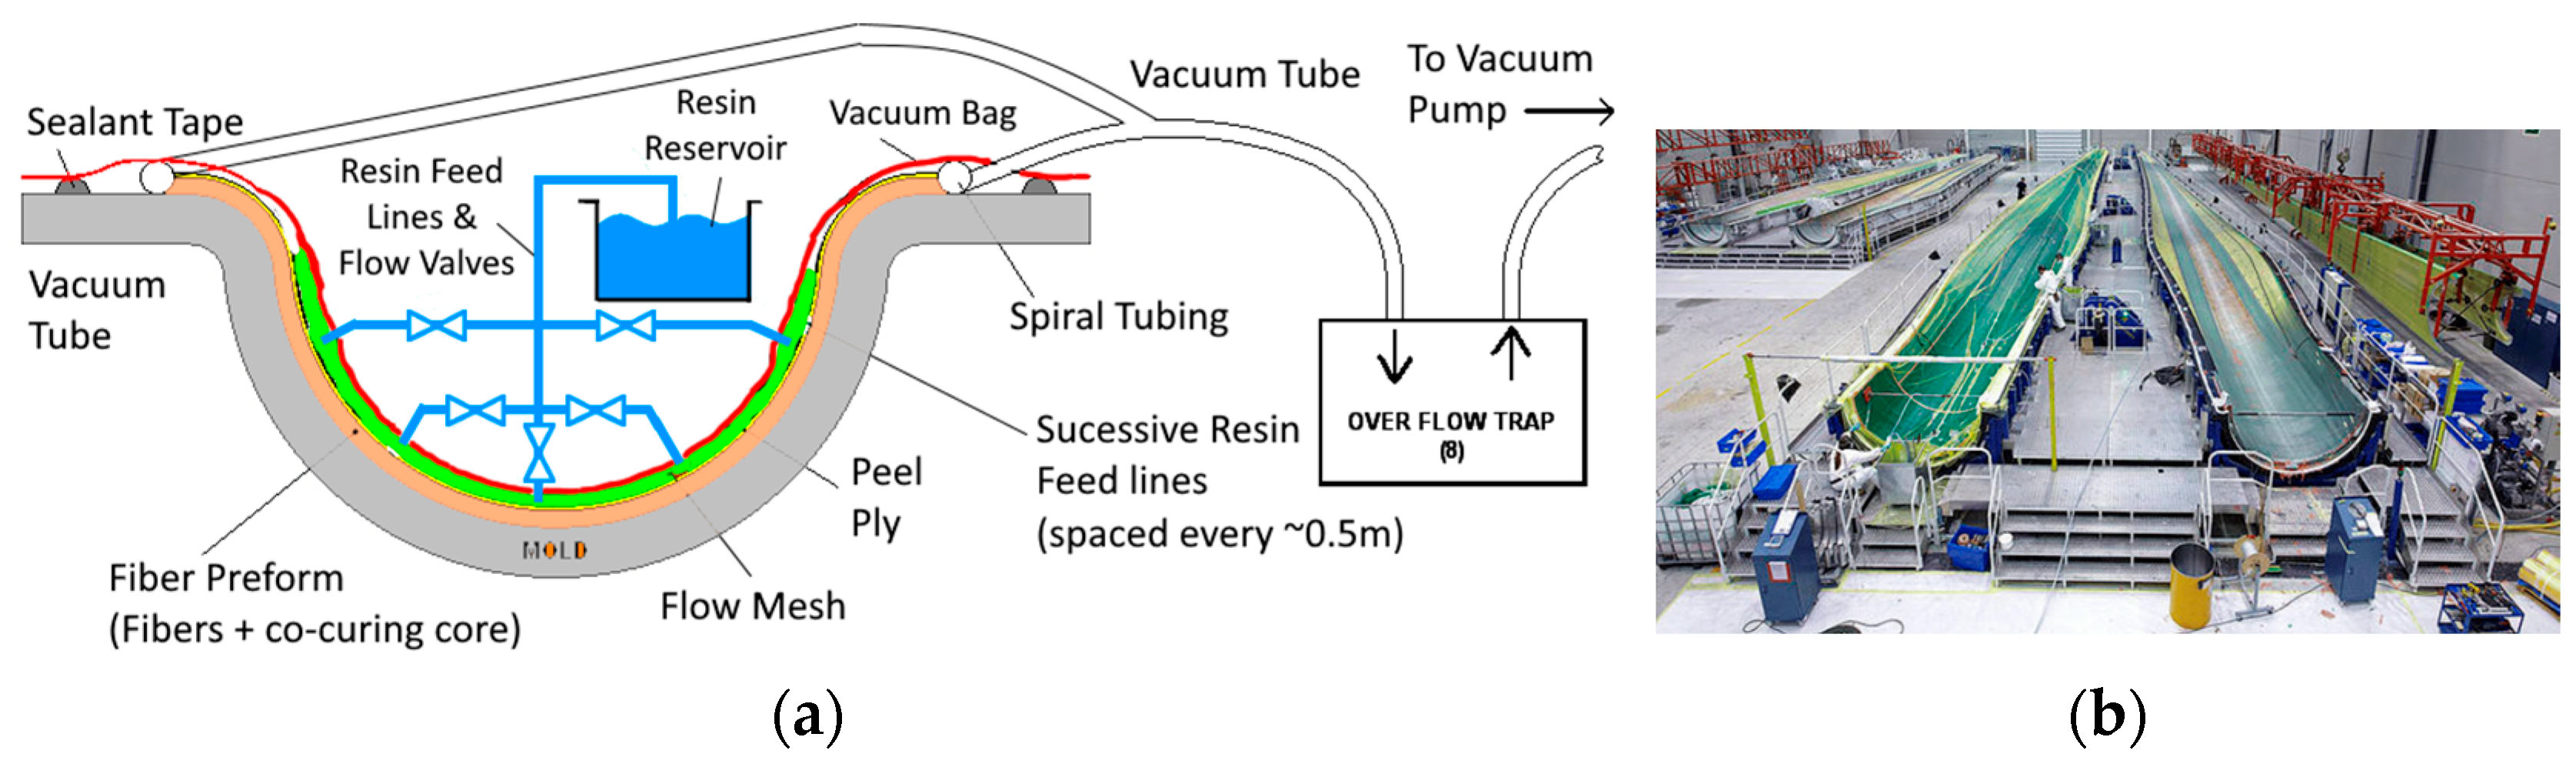
Vacuum Assisted Resin Infusion for Large Composite Structures

Large non-aerospace composite structures, such as wind turbine blades and composite boat hulls, are often made using the Vacuum Assisted Resin Infusion (VARI) process. The VARI process is also referred to as vacuum-assisted resin transfer molding (VARTM) or vacuum infusion (VI). Variations of the VARI process also exist, such as the Seeman Composite Resin Infusion Process [64].
The VARI process utilizes a vacuum pump to suck low-viscosity liquid resin into a fiber preform enclosed in a vacuum bagged 1 sided mold, as shown in Figure 8 [65]. The resin is cured in the mold under vacuum. After the resin has cured, the post-curing of resins (heating of resins at a specific temperature and duration) is also performed using heated molds or heated blankets to ensure complete resin cure [66].
VARI is well suited for fabricating many large composite structures such as marine hulls and wind turbine blades as it offers the best balance of quality vs. cost, compared to other fabrication methods such as prepregs, resin transfer molding (RTM) and hand layup, and filament winding [67]. While many prepregs offer better quality and are commonly used for aerostructures, they typically have much higher costs than resin infusion [68].
Moreover, the vacuum bag can be sealed and leaks plugged before the resin is mixed, reducing the defect rate. An added plus is that since volatile organic compounds (VOCs) such as styrenes are largely confined inside the enclosed mold, levels of airbone VOCs are significantly lower, reducing health hazards for workers [68,69].
Figure 8. Vacuum Infusion fabrication. (a) Vacuum Infusion schematic. Own diagram. (b) Vacuum Infusion of a wind turbine blade. Picture from [70].
Jcs 08 00023 g008

8. Importance of Adhesion in Composites and Sandwich Structures

When a load is applied to a fiber composite, the stress is transferred from one fiber filament to another through the matrix material. If a fiber-resin bond is weak, the load transfer will be negatively affected, or even break bonds between the resin matrix and fiber filaments [47].
An especially common failure mode in sandwich structures is facesheet–core debonding or local separation of the facesheet and core due to a loss of adhesion at the interface. More will be covered below in Section 12.

9. Methods of Boosting Adhesion—Surface and Bulk Treatment of Materials

Surface modifications/treatments to promote adhesion are carried out in many other industries, such as label printing and electronics potting. They function by cleaning up surface contaminants and adding radicalized functional groups that promote bonding [71,72].
It is also worth noting that not all surface modifications are for the purpose of boosting adhesion. Some in fact decrease adhesion by making the surface more hydrophobic. This is often the case for reactive gas treatments using fluorine-based gases [73].
While it is beyond the scope of this review paper to cover the various theories involved in surface treatment, this paper covers a few key concepts that serve as a useful guide for gauging effectiveness.

9.1. Surface Free Energy

The surface free energy of a substrate is the dominant parameter affecting the wettability and adhesion strength of an adhesive resin.
In order to ensure effective adhesion between a liquid resin and a solid substrate, the liquid resin needs to spread spontaneously over the substrate surface and ensure contact in order to form mechanical and chemical bonds with the substrate surface. This requires that the surface free energy of the substrate be higher than the liquid surface tension of the resin in order to overcome it [74].
A general rule of thumb in industry is that a substrate’s surface free energy must exceed the liquid surface tension by at least 10 mN/m in order for spontaneous spreading and effective adhesion to occur [72].

9.2. Measuring Surface Free Energy

The surface free energy of a surface cannot be measured directly but can be determined based on indirect measurement methods and calculations based on various theoretical approaches. There is often no agreement on the most reliable method [75].
There are numerous methods of measuring surface free energy on a solid, such as the Washburn method of capillary rise, tensiometry [76], wicking, spreading time, intermediate gas chromatography [77], dyne pens [78], and contact angle. Each of these methods has its own strengths and disadvantages and is suited for different types of materials. The most common of these methods are dyne pens and contact angle measurements, which are commonly used for assessing the effectiveness of surface treatment on non-powder solids [75].
What is common with all these methods is that the sample is contaminated with introduced gas or liquid and thus cannot be used after that, so it is not possible to measure the surface energy on the final product itself.
Dyne pens are often used in industry. They are normally supplied as a kit with several pens containing different “inks” (liquids with dye markers added) of known surface tension, typically between 30–60 mN/m. These pens are used to mark the surface under measurement to see if the ink wets out the surface [78].
Dyne pens have the advantage of being quick, cheap, convenient, and easy to use. Their disadvantage is that they only provide a pass/fail level and results are not quantifiable—it is subjective as it is based on user interpretation of how the inks react to the surface [78,79].

Deriving Surface Free Energy from Contact Angle Measurements

Droplet Contact angle measurements are one of the most common means of measurement data for calculating surface free energy [80]. Using liquids of known surface tension, droplets of between 2–10 uL are placed onto a surface and then images of the drop are taken using suitable camera recording equipment.
Typically, the sessile drop method is used, with water as the main fluid due to its ready availability. Table 4 classifies surfaces based on their wettability with water. Different levels of wetting are also shown in Figure 9.
After obtaining contact angle measurement data, there are several different methods of calculating surface free energy based on contact angle measurements. Table 5 shows some common methods used in the context of surface treatment of natural materials:
The Extended Fowkes or Owens–Wendt–Rable–Kaeble Equation is most often used in the research literature on surface treatment, followed by the Wu Equation. These methods split the surface free energy into two components: polar and dispersive (or nonpolar). Often, water is used as the polar fluid, with diiodomethane often used as the dispersive fluid. Other fluids like glycerol (polar) may also be used.
There are other methods, such as Cassie–Baxter, Van Oss, and Zisman equations, but they are typically not used in the context of surface treatment of composite or natural materials. Readers may refer to the Appendix A for more details about such materials.
Polar groups in the substrate and liquid are attracted to each other via dipole–dipole interactions, and likewise, dispersive (non-polar) groups in the substrate and liquid are attracted to each other by dispersive, or Van der Waals forces. Dipole–dipole interactions are much stronger than dispersive forces [89].

9.3. Surface-Free Energies of Various Materials

Table 6 shows the surface free energies of certain substrate materials, of which some are used in composites and sandwich composites:
As can be seen, different measurement methods produce different results, and generally should not be compared to one another. For cork, different research papers do produce differing surface energy values, either due to different types of cork being used, or different measurement and/or calculation methods.
There is some debate in the research literature as to what is the best method of measurement and surface free energy calculation for cork. Cordeiro et al. note when comparing their results with other literature that inverse gas chromatography (IGC) appears to produce higher dispersive surface energy values for both cellulosic fibers as well as cork [77].
Chanut et al. argue that sessile drop contact angle measurement is not particularly effective since Abenojar and Gomes’ measurements have different results, but agree that all measurements show that cork has low dispersive, polar, and total surface energy. That said, Chanut et al. do not go into detail about whether the differences in Gomes and Abenojar’s measurements are due to methodology or different cork samples being used. That said, these authors all agree that cork has a relatively low surface free energy, especially in terms of its polar component.
Please note that none of the above measurements of cork agglomerates are on Corecork. The authors are not aware of any available surface free energy data for any grade of Corecork, either released by Amorim or in the openly available research literature. At the same time, the authors are not aware of any surface free energy measurements of polymethacrylimide (PMI) in the research literature.
Since epoxy is a polar resin due to polar groups such as amines and epoxides [99], the low values of γ S p in Table 6 for cork (0–11 mN/m) and balsa (5 mN/m) suggest that the epoxy-cork and epoxy-balsa bond is relatively weaker than PVC and PMI [100].
At the same time, it also suggests that epoxy-cork and epoxy-balsa bond strength shows much potential to be improved through surface modification methods to increase γ S p , the polar component of surface free energy.

9.4. Need for Surface Treatments on Natural Fibers

Cellulose-based fibers have a highly polar surface due to hydroxyl (OH) groups, which readily form bonds with polar matrix materials. However, fibers are usually covered with pectin and other waxy substances, which hinder hydroxyl groups from binding with polar matrices. Moreover, the highly polar fiber surface leads to hydrophilic behavior and attracts moisture, which, in addition to fiber swelling, hinders interface adhesion [101]. Poor adhesion then leads to poor mechanical properties [18].
Therefore, surface treatment is necessary for cellulose-based fibers to achieve good adhesion: by preserving polar functional groups yet preventing swelling due to moisture uptake [101].

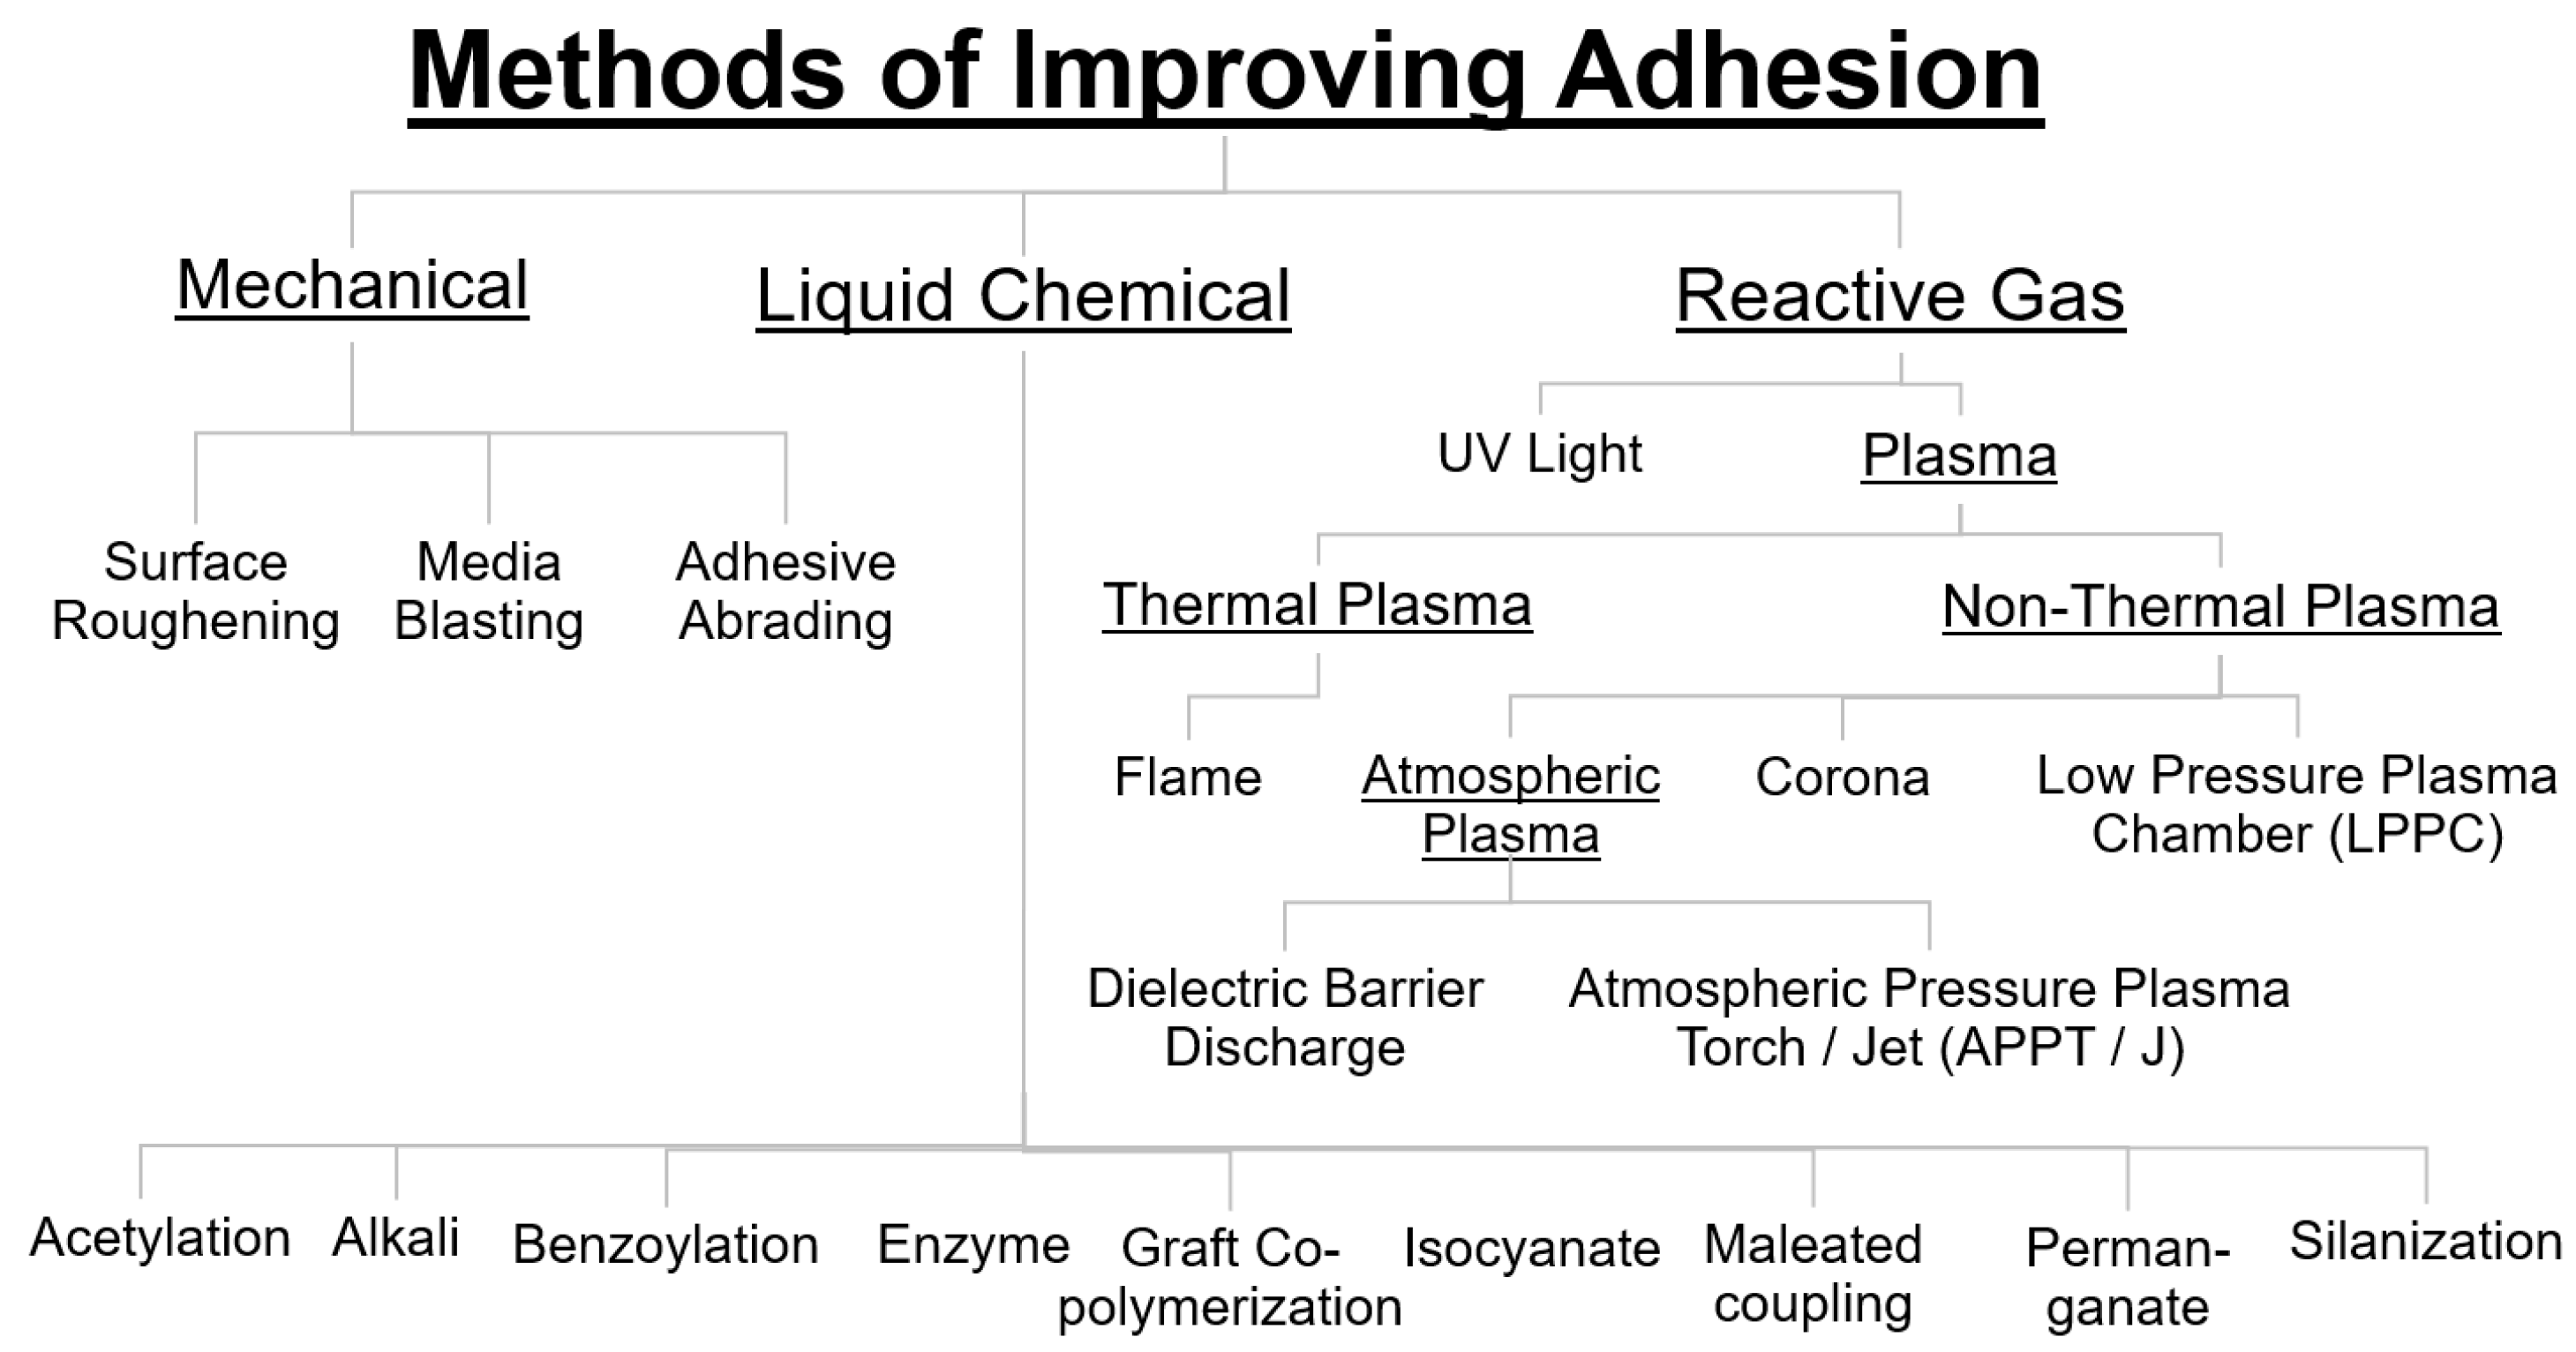
9.5. Methods to Improve Adhesion: Bulk and Surface Treatments

Multiple methods to improve adhesion exist. Figure 10 shows a diagram categorizing commercially available surface modification processes. This list is by no means exhaustive, since there is much research ongoing in the field of surface modification, and new methods, such as microwave plasma, are currently being developed [78].
Ref. [71] divides them into a few main categories: physical (mechanical) surface treatments, liquid chemical treatments, and reactive gas surface treatments. They are not mutually exclusive—it is possible to combine methods, such as in solvent welding for PVC pipes: mechanical sanding is conducted before the application of primer (a chemical treatment method) on a mating pipe and fitting surfaces [104].

9.5.1. Mechanical Surface Treatments—Surface Roughening

Surface roughening processes like media blasting and sandpaper aim to increase the surface area of a surface before adhesion and abrade off possible contaminants.
While these processes are relatively simple, straightforward, and low cost, they are relatively ineffective in boosting adhesion by themselves as there is no chemical activation of the surface. They are often used in conjunction with chemical primers and other adhesive methods to boost adhesion [71].

9.5.2. Surface Chemical Activation

Surface Chemical Activation methods typically aim to break molecular bonds at the surface to add polar functionalization groups to the surface, such as hydroxyl (OH), NOx C-O, C-OH, and COOH groups at the surface [98], and therefore boost the polar component of the surface’s free energy.
This is because most adhesives, such as epoxy, such as epoxy, and many paints and inks are polar, and adding polar groups aids dipole–dipole attraction between polar groups on the surfaces and adhesives and thus promotes strong adhesion [89]. These can be subdivided into liquid chemical and reactive gas treatments, both of which are covered below.

9.5.3. Surface Modification of Glass and Carbon Fibers

Both glass fibers and post-carbonized carbon fibers typically feature chemically inert surfaces. As such, they typically have low polar components of surface free energy, they do not bond well with epoxies and other matrix resins used in fiber composite materials. Therefore, various surface treatments, referred to as “sizings” or “size”, are often applied to them during the manufacturing process to improve fiber–matrix adhesion [105,106].
The role of sizings is to protect otherwise fragile fibers during processing, reduce fuzzy behavior, ensure good wetting of fibers when the resin is added and thus yield a low void content, and optimize stress transfer between fiber and matrix by maximizing their interaction [105].
Surface treatments for both carbon and glass fibers in general aid adhesion by altering the surface chemistry of fibers to aid in forming chemical bonding with matrix and increasing the roughness and thus surface area of individual fibers. However, there is a limit that roughness can be increased before fibers are damaged and tensile strength is affected [106].
Carbon fiber consists of crystallized graphitic basal planes with non-polar surfaces. It is chemically inert due to the high-temperature carbonization/graphitization occurring during the manufacturing process. Thus surface treatment is necessary to boost adhesion [107].
Oxidation of carbon fibers is often used to boost the polar component of its surface free energy and thus make it more hydrophilic. This can be achieved using oxidative reactive gases such as air, O2, O3, or CO2, or liquid oxidizing agents such as HNO3, HSO4, H2O2, NaOCl, KMnO4, RuO4, NaClO3, Na2Cr2O7, and NaIO4 [107].
For glass fibers, sizing typically takes the form of silanization. Much research literature exists on the use of different silane chemistries and silane application methods on glass fibers. Currently, many glass fiber manufacturers mention the use of sizing agents in their datasheets, although the exact type of silane coatings used are trade secrets and rarely disclosed in these datasheets [105,108].

9.6. Liquid Chemical Treatments

Natural fibers often contain waxes that hinder adhesion between matrix and fiber. Therefore, they are often treated with alkalis like NaOH to remove waxes and other contaminants, as well as improve the fiber interfaces for adhesion [109].
Moreover, natural fibers are especially prone to absorbing moisture due to the presence of amorphous regions as well as polar groups such as hydroxyls, which form hydrogen bonds with moisture and thus hinder adhesion with the intended matrix [110].
Table 7 shows some of the liquid chemical treatments used on natural fibers and their functions.
That said, liquid chemical surface treatments have significant disadvantages. They generate a significant amount of chemical waste, which often requires hazardous waste disposal. Furthermore, additional processing steps such as washing, rinsing, and drying are required, of which some examples can be seen in Table 8. These are often time-consuming and potentially hazardous, thus making these processes unfeasible for composites processing facilities [71].

9.6.1. Liquid Chemical Treatments of Cork and Balsa

While there are many papers on the chemical treatment of natural fibers, there are very few if any open research literature on the chemical treatment of cork or balsa with the purpose of improving the adhesion of cork or balsa to typical composite fibers (such as carbon fiber, glass fiber, natural fibers or aramids) or typical composite resins such as epoxy, polyester or vinyl ester. None in particular cover the effects of surface treatment on impact damage on cork or balsa.
Table 8 shows some chemical treatment methods applied to cork, balsa, and various composite core and fiber materials in the literature. These are all bulk and not surface treatment methods:
It is important to note that in both [112] (extruded mixture of cork and PP) and [95], silanization of cork did increase contact angle (reduce surface energy) in both cases. While neither paper conducted tests to explain what might have happened at the chemical level, the increase in contact angle for both papers does suggest that silanization is not an effective surface treatment for improving the adhesion of cork.
However, the mechanical test results differ: extruded cork-PP had a tensile stress increase of 6% and no change in Charpy performance, while cork-epoxy had a decreased peel test strength of 13%. This suggests that the polarity of the resin is also important—epoxy is polar, while PP as a long-chain hydrocarbon is relatively nonpolar.

9.6.2. Suitability of Liquid Chemical Treatments in a Composite Processing Environment

As can be seen from Table 8, these chemical processes typically require long process times and large quantities of chemicals, some of which are potentially hazardous or require specialized equipment. As such, chemical treatment processes are typically not feasible to be used in a composites processing environment where fibers and core materials are often used as received.

9.7. Reactive Gas Surface Treatments—Thermal and Nonthermal Plasma and UV for Surface Activation

Reactive Gas Surface Treatments work by imparting energy to gas and radicalizing it into plasma.
Plasma is often referred to as the fourth state of matter—in addition to solids, liquids, and gases. Plasma is a mixture of energized charged particles, electrons, and ionized atoms/molecules that become highly electrically conductive such that its behavior is dominated by long-range electric and magnetic fields [116].
The chemistry of plasma is complex and involves many elementary reactions in the gaseous phase. Homogenous reactions occur due to inelastic collisions between electrons and heavy species or collisions between heavy species. As there are too many to list here, please refer to “Table 2 (a): Gas phase reactions involving electrons and heavy species” in [117] for a more complete list.
Heterogenous reactions occur due to plasma species and the solid surface. The solid surface is either immersed in or in contact with the plasma. These are covered in Table 9. Processing of semiconductor materials is highly dependent on these heterogenous reactions.
Reactive gas surface treatments are an attractive alternative to liquid chemical treatments in that they do not use chemicals or generate liquid chemical waste.
Plasma treatments have a temporary nature and the effect of such treatments decreases with time, as shown in Figure 11 [118]. Therefore, most plasma treatments are done just before adhesion, in order to retain maximum effectiveness [71].
As shown in Figure 10, they can be categorized by how the gas is radicalized: thermal plasmas, UV, and Plasma Treatments.
Much research has been conducted for the aerospace industry on the surface treatment of cured carbon fiber laminates before secondary (adhesive) bonding to honeycomb cores [119]. However, it is less common to find research literature covering plasma surface treatments on individual fibers, and even less so for co-cured sandwich core materials.
While this paper focuses on the use of plasma treatments as a means for boosting adhesion, reactive gas treatments have other uses too. There is much research on reactive gas treatments for sterilization and killing of pathogens in food items, such as atmospheric plasma used on meat before packaging [120,121] and UV-C light being used on a wide range of fresh produce like red peppers [122] and button mushrooms [123].

9.7.1. UV Light Treatment

UV light treatment is often used for the inactivation of pathogens and cleaning applications as it is very effective at decomposing organic materials without affecting inorganic particles. This includes water treatment [124], decontamination of food surfaces [125], biomedical applications, atomic cleaning of silicon wafers, quartz and ceramic surfaces, and optical surfaces, among many others [126].
UV light treatment tends to operate by radicalizing oxygen molecules in ambient air, thus forming O3+ ozone. These O3+ molecules react with hydrocarbon contaminants, as well as form oxygen-containing functional groups on the surface, depending on the frequency of the UV light and the absorption bands of oxygen, ozone, and hydrocarbons [127,128].
That said, precleaning is required prior to UV being used as a final cleaning step, and UV is limited mainly to the removal of organic contaminants. Many inorganic contaminant particles do not undergo photosensitive oxidation and thus cannot be removed by UV [126].
Most UV lamps used in surface treatment tend to be of two wavelengths: 184.9 and 245.4 nm. It is therefore common to combine the 2 UV frequencies to create a continuous loop of surface cleaning [126]:
  • Ozone generation: O2 + hv (184.9 nm) → O * + O *;
  • Ozonolysis: O3 + hv (253.7 nm) → O * + O2;
    Contaminants + hv (200–300 nm) → Ions, free radicals, excited, and neutral molecules;
  • Contaminant destruction and removal: Hydrocarbons and nitrogen-containing species react with excited substances and free radicals and are decomposed into simpler volatile materials H2O, CO2, and NOx.
While the photonic energy of 245.4 nm UV light is sufficient to dissociate an O2 molecule into two ground state O atoms, O2 exhibits very weak absorption at and just below 245.4 nm, hence there is relatively little absorption. However, as wavelength decreases, the absorption coefficient increases rapidly [127].
Most research on UV focuses on surface cleaning applications. Relatively few research studies exist on UV surface treatment as a means to boost adhesion.
One final consideration is that UV light also causes damage to organic materials such as plastics. As such, it may not be a good choice for the surface treatment of organic materials, especially natural core materials for sandwich composites [126].

9.7.2. Thermal Plasmas: Flame Treatment

Thermal plasmas (TP) are characterized by an equilibrium or near equality between electrons, ions, and neutrals.
Thermal Plasma is often used to refer to flame surface treatment. Flame treating was first developed in the 1950s to improve the wetting and adhesion properties of polyolefin and other polymer films. Since the 1970s, it has also found usage in the surface treatment of other items such as paperboard, car body parts, and blow-molded bottles [129,130].
Obviously, flame treatment has its limitations. Open flames and high-temperature sources in an industrial environment are potential safety hazards [131], especially if solvent vapors are present, plus not all materials are suitable for flame treatment as they may end up melting or even catching fire [73]. Flame treatment is also sensitive to changes in process conditions, such as the fuel/air ratio chemistry of the fuel gases supplied [130,132].
As such, there is little, if any research literature on the use of flame or other thermal plasmas for surface treatment of cork, balsa, or non-prepreg glass or carbon fibers.
That said, flame surface treatment has its advantages too, if material degradation is not an issue. It promises higher treatment levels and far higher speeds than non-thermal plasmas [130].
Ref. [129] found that flame-treated PP is more highly oxidized after washing with water, more stable, and more hydrophilic than corona-treated PP. This is because corona discharges are dominated by O-atom radical reactions leading to the formation of water-soluble Lightweight-Molecular-Oxidised-Materials (LMWOM), while flame treatment was dominated by OH-radical reactions that caused oxidation on the surface without forming LMWOM [129].
Takeda et al. found that flame treatment induced the formation of SiO2 and oxygen-containing functional groups that improved adhesive/substrate adhesion in secondarily bonded CFRP prepreg lap joint specimens, causing them to fail through substrate failure rather than delaminations [121]. Whether flame treatment has a similar effect on non-prepreg dry fibers and core materials remains to be seen.

9.7.3. Non-Thermal Plasma Treatments

Non-thermal plasma treatment works by applying an electric potential difference between two electrodes set at a certain distance. The voltage is sufficiently high to cause electrical breakdown of the gas—which becomes electrically conductive [117].
Lower voltages are required to achieve electrical breakdown at low pressures, and this typically appears as a glow discharge at low pressure, while higher voltages are needed at atmospheric pressure. Electrical breakdown at higher pressures typically results in the formation of hot filamentary arcs unless a dielectric barrier is applied at one or both electrodes [133].
There are 2 main categories of non-thermal plasma treatment: Low Pressure Plasma Chamber, in which the electrodes and item to be treated are placed in a vacuum chamber, and atmospheric pressure nonthermal plasma treatments, where electrodes & the item to be treated are placed in the open [117]. Figure 12 shows some forms of atmospheric pressure nonthermal plasma treatment.
Table 10 shows a comparison of the advantages and disadvantages of both systems:

9.8. Reactive Gas Surface Treatments of Composites Materials

Table 11 summarizes the effects of reactive gas surface treatments on cork, as well as some common composite materials like carbon and glass fibers. So far, there is no openly available research literature on the use of reactive gas surface treatments on balsa.
Table 11. Summary of some reactive gas treatment methods of composite fibers and cork in literature. Note: SFE stands for Surface Free Energy and CA stands for Contact Angle.
Fiber/Core/WhoTreatment MethodKey Findings
Cork sheets 200 × 100 × 12 mm *
[95]
Atmospheric Pressure Plasma Treatment—
  • APPT machine (Plasma Treat GmBH, Steinhagen, Germany) Model number not given
  • Frequency 17 kHz, Discharge Tension 20 kV.
  • Working gas: Air Plasma at 200 kPa.
  • Platform speed 5 mm/min.
  • Rotating torch nozzle @ 1900 rpm,
  • distance between sample and nozzle = 8 mm.
Araldite 2020 epoxy (Huntsman Advanced Materials, Pamplona, Spain) applied to cork samples after surface treatment and left to cure. No fibers involved.
Treated vs. untreated cork:
CA: Increased polar (23 vs. 0 mN/m), dispersive (31 vs. 18 mN/m) and total surface energy (54 vs. 18 mN/m).
ATR-FTIR: Increases in OH, ArC-O-C-al and ArC-H peaks
Pull-off test: Decrease in pull-off strength from 1.45 to 1.3 MPa.
APPT specimens fail due to cohesive failure of cork, while untreated specimens show adhesive failure in different areas.
Peel Test: 34% increase in peel strength
Cork sheets 200 × 100 × 12 mm *
[95]
Low-Pressure Plasma Chamber—
  • PDC-002 (Harrick Plasma, Ithaca, NY, USA)
  • Working gas: Air Plasma at 60 Pa, flow rate 1 L min−1.
  • Optimized time and power: 40 s @ 29.6 W
Araldite 2020 epoxy similar to APPT treated cork above.
Treated vs. untreated cork:
CA: Increased polar (18 vs. 0 mN/m), dispersive (30 vs. 18 mN/m), and total surface energy (48 vs. 18 mN/m).
ATR-FTIR: Similar to APPT-treated cork as shown above.
Pull-off test: Decrease in pull-off strength from 1.45 to 1.41 MPa.
LPPC specimens fail due to cohesive failure of cork, while untreated specimens fail due to adhesive failure at different areas.
Peel Test: 15% increase in peel strength
Cork
[97]
DBD plasma treatment—No mention of Frequency and voltage, as well as if any working gas used. Power—750 W, velocity of 5m min−1.
Number of passes varied for dosage
1 pass—300 W min m−2.
2 pass—600 W min m−2.
4 pass—1200 W min m−2.
8 pass—2400 W min m−2.
16 pass—4800 W min m−2.
Droplet Contact Angle Measurements conducted using water, glycerol, and diidomethane.
No adhesion of resins or other materials to cork was carried out in this paper. Mechanical testing of plasma-treated cork was also not carried out in this paper.
Treated vs. untreated:
DBD plasma treatment increases cork surface energy significantly. Calculated SFE based on CA:
Jcs 08 00023 i001
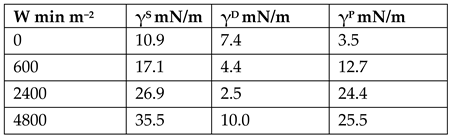
ATIR/FTIR: Untreated vs. 2400 W: Increase in 1735 cm−1 (carbonyl), 1357 (C-N) peaks
EDS (15 kV voltage, Si(Li) detector,): Increase of O/C ratio from 0.33 to 0.36
DSC and SEM: Did not detect any major structural change in cork material after plasma treatment.
Cured Carbon fiber prepregs
[119]
Adhesive bonding of CF Prepregs into single lap-joint specimens.
Toray T800S/3900-2B prepreg, nominal thk 0.19 mm, 8 plies in quasi isotropic layup—already cured at 180 °C and 0.64 MPa for 2 h. After curing, demold and wipe surface clean with MEK solvent before flame treatment.
LPG flame (1000 °C) treatment process (ITRO) applied on CFRP plates: 1, 6, or 12 passes. To avoid overheating, plates
left to cool for 1 min after every 2 passes.
Control: Plate surface sanded before bonding
Bonding: Within 24 h after ITRO, sandwich film adhesive between two CFRP panels and cure in autoclave for 2 h at 177 °C and 0.31 MPa.
ITRO causes formation of SiO2 film and oxygen-containing functional groups, improving adhesion across the adhesive–substrate interface.
No ATR-FTIR or contact angle measurements done.
XPS: % of O and Si increase steadily with number of passes, % of C and F decreases steadily.
Max apparent shear strength at 12 passes (18 MPa) compared to untreated (7 MPa) and sanded (19 MPa).
Dominant failure mode changes from
interfacial failure to substrate failure as the number of passes increases.
Glass Fibers
[136]
Glass Fiber Reinforced Laminated Veneer Lumber Composites made by Hot Pressing
Materials: Poplar Veneer and Plain weave E-glass 500 g/m2
Adhesive: phenol formaldehyde (PF)
Custom DBD Air Plasma Setup
Treatment carried out on Glass Fibers
Speed: 8 m/min
Power levels: 1.5, 3, 4.5, 6 kW
Hot press parameters: Pressing speed 1.5 min/mm at 130 °C and pressure 1.2 MPa
Optimal results found at 4.5 kW power level. Overtreatment occurs at 6 kW, Fractographic analysis shows bare GF fiber surface exposed (excessive etching) and residual resin exists independently of fiber (undesirable).
Up to 4.5 kW, Fracture model changes with power level from interfacial failure to combination of resin interlayer and interface failure
4.5 kW compared to untreated specimens:
-
Increased O/C ratio from 0.26 to 0.46, no further increase at 6 kW
-
Large increase in C=O and O-C=O
-
17.68% increase in polar surface free energy, 35.9% and 33% decrease in water and PF contact angle respectively
-
functional groups, (decrease at 6 kW)
-
Modulus of Rupture increase 36%
-
Modulus of Elasticity increase 16%
-
Shear Strength of 1.1 MPa vs 0.25 MPa—>400% increase
ATR-FTIR: No significant difference found in IR spectrum of glass fiber before and after plasma modification at all power levels
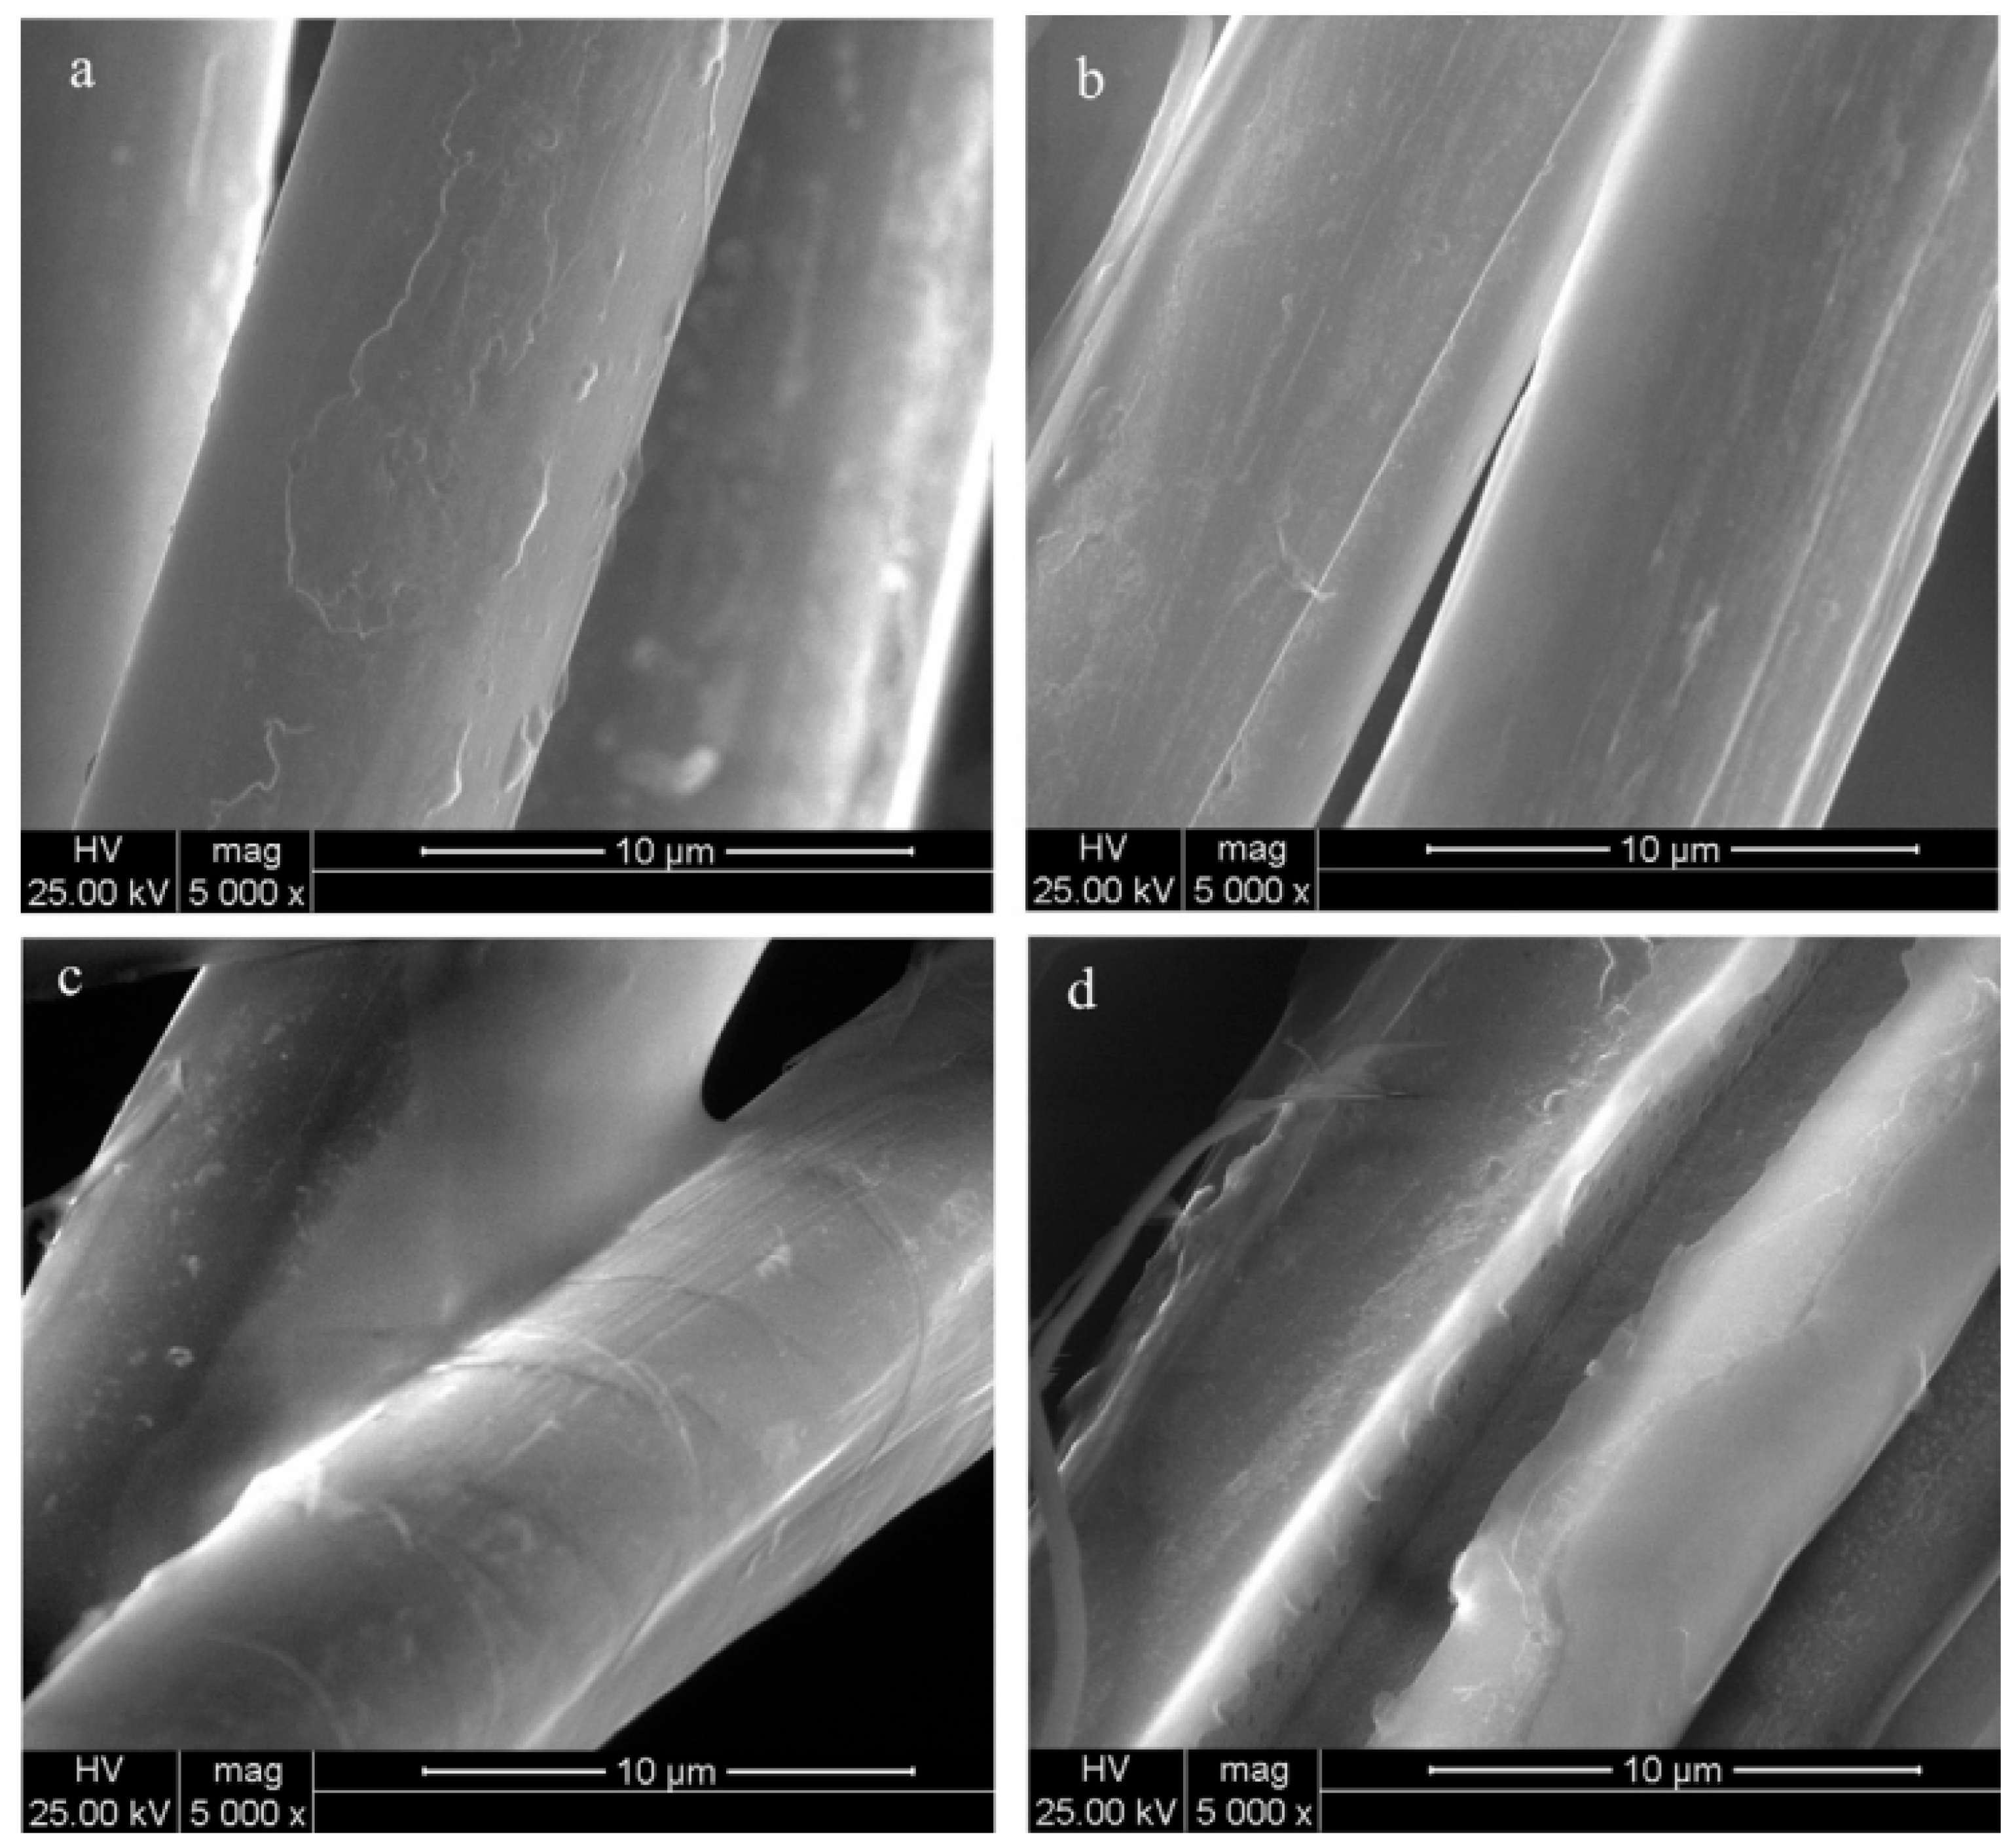
Aramid Fibers (Twaron)
[91] (Figure 13)
Clean with acetone at room temperature before DBD plasma treatment
DBD Plasma parameters:
Steel Electrode ⌀ 4.7 cm
Dielectric barrier: 1 mm thick Quartz
Discharge power (power density) 143.5 W (27.6 W/cm3)
Discharge gas (pressure): Air (1atm)
Treatment levels: Untreated, 6 s, 12 s, 18 s
Adhesion of PPESK thermoplastic resin to fibers after treatment.
12 s found to be optimal treatment time, overtreatment occurs at 18 s.
SFE is highest at 18 s, while XPS and SEM data show optimum at 12 s and deterioration at 18 s.
Jcs 08 00023 i002

Jcs 08 00023 i003
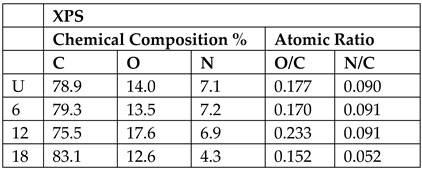
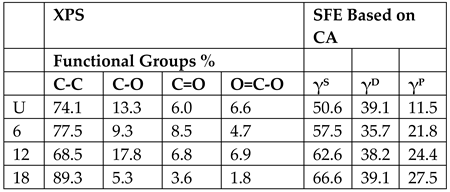
Mechanical tests not done.
Note that for *, it was not explcititly mentioned whether the cork sheet was an agglomerate. It can be inferred that this is a cork agglomerate as most cork sheets are typically agglomerate products.
Based on this, a few main conclusions can be determined:
  • It is possible to use reactive gas surface treatments to boost polar components of surface free energy levels of glass fibers, carbon fibers, cured thermoset, and thermoplastic fiber laminates and cork core materials.
  • For secondarily bonded composite samples, failures occur due to substrate failure rather than adhesive failures.
  • It is possible to overtreat specimens, and therefore an optimal limit should be found for each material and process.
  • Deriving Surface Free Energy based on Contact Angle measurements is not able to detect overtreatment. Therefore, other methods like XPS, SEM, and ATR-FTIR also need to be used to determine an optimal level of treatment.
Ref. [136] found that the overtreatment of glass fibers at 6 kW by DBD Air plasma caused the bare fiber surface to be exposed and residual resin to exist independently of fiber. The authors are not aware of other literature covering the effects of overtreatment on the mechanical properties of composite materials.

10. Considerations for Choosing Appropriate Surface Treatment Methods for a Composites Processing Environment

Figure 14 shows some of the quantifiable variables involved in surface treatment of composite laminates, as well as the most likely methods of measuring them.
Chemical treatments to promote adhesion are often carried out by manufacturers of fibers and core materials but are generally not feasible for composite processing facilities (which use fibers and core materials to manufacture composite products) due to the long processing times, liquid chemical disposal issues, and potentially hazardous nature of such treatments.
Reactive gas surface treatments hold more promise in this regard as they do not use liquid chemicals. However, due to their temporary nature, it is generally not feasible to carry out surface treatment at the fiber or core manufacturer’s facilities. It would need to be carried out at the processing facility just before the application of resin.
A typical composite processing facility doing a wet layup, vacuum bagging, or vacuum infusion would normally handle fiber in the form of woven or unidirectional fabrics, as well as core materials, matrix resins, and solvents, some of which are flammable.
To create a preform, many layers of fabrics and/or cores would be required, which would mean a high surface area. Both fabrics and core materials can be laid flat, which means that there is no need to handle complex geometry in the surface treatment process.
As such, a good surface treatment technique would need to incorporate the following qualities:
  • Environmentally friendly—Minimal or no chemical usage.
  • Safety.
  • No ignition hazard—composites processing facilities use large quantities of potentially flammable resins and solvents like acetone.
  • Minimal or no toxicity.
  • Compact—does not require much space.
  • Ease of use.
  • Inexpensive.
  • Ability to process samples of large area.
  • Effective in terms of improving adhesion and/or removing contaminants such as dirt and moisture.
  • Fast—low processing time.
  • No requirement for processing complex geometry.
At a practical level, these constraints would rule out thermal plasma and flame surface treatment due to the potential ignition hazard, and may well rule out batch treatment methods that cannot treat large samples, such as low-pressure plasma chambers. Furthermore, the effects of processing facility conditions, such as air temperature and humidity may also affect surface treatment effectiveness and are often not covered in research literature.
Further research is needed to determine the relationship between these variables outlined in Figure 14 to determine the most suitable method of surface treatment of fibers and core materials, and the viability of such methods.
The need for tests like contact angle, SEM, XPS, and ATR-FTIR to determine optimal treatment levels is another practical constraint. Many composite processing facilities do not possess such equipment or expertise to conduct these tests and interpret data.

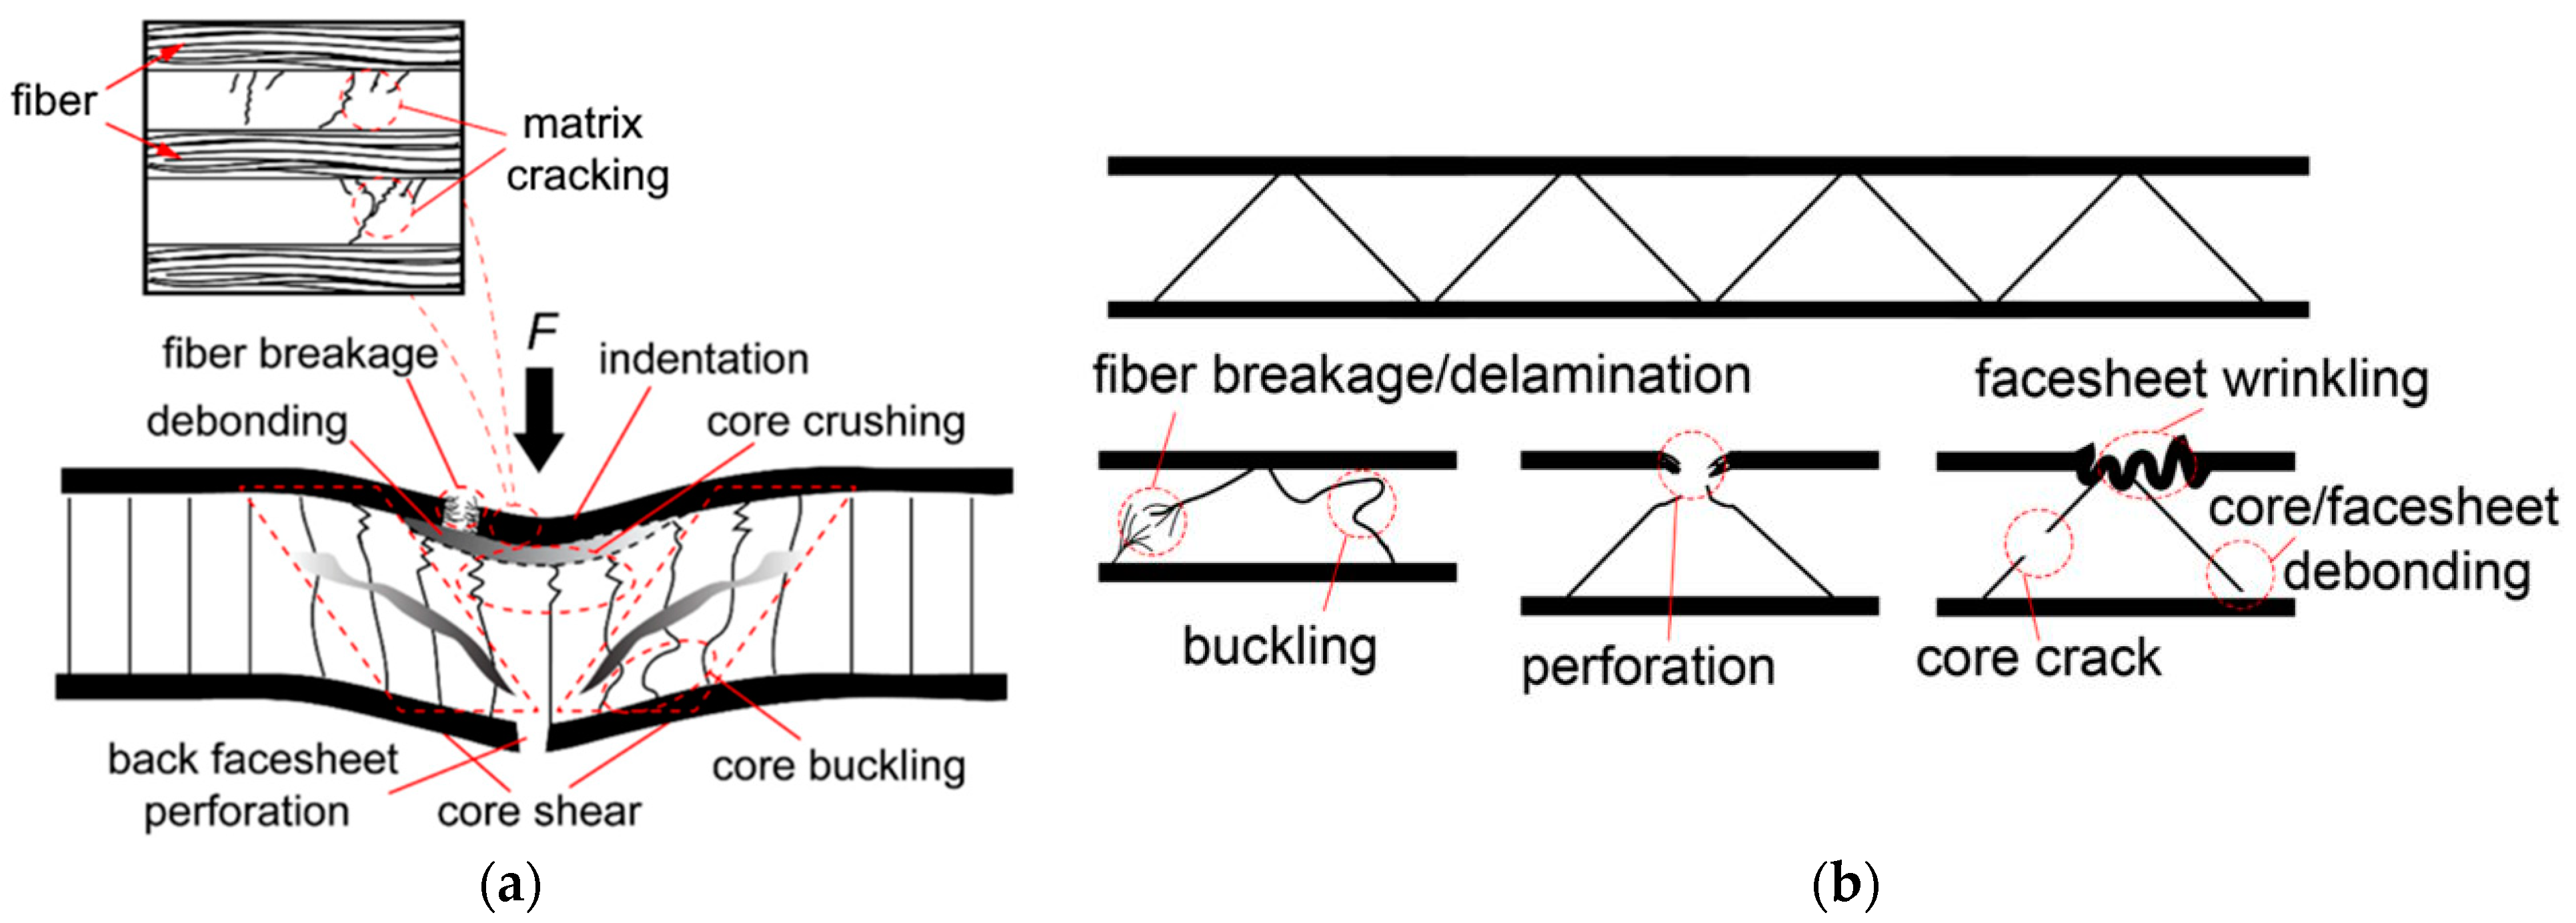
11. Composite Laminates and Sandwich Composite Failure Modes

Monolithic composite laminates have these failure modes [137].
  • Matrix cracking parallel to the fibers.
  • Delamination/Debonding between layers due to interlaminar stress.
  • Fibers in tension fiber breakage and in compression fiber buckling.
This review paper focuses low-velocity impact damage of composite sandwich structures, especially facesheet-core debonding. Facesheet-core debonding is especially serious because they are easily triggered by impacts such as bird strikes and waves which are difficult to prevent, negatively affect the mechanical properties of the plate, and are difficult to visually detect [2,138].
Failure modes are not mutually exclusive: failure in one mode may trigger off and or interact with other failure modes, potentially resulting in overall catastrophic failure [139].

Delamination and Facesheet-Core Debonding

Delamination, or separation of layers, is one of the most common failure modes in fiber composite laminates and composite sandwich panels. This can either be in the form of fabric layers separating within the facesheet, or facesheet core debonding. This occurs when the interlaminar shear strength between layers or bond strength is exceeded [140].
Of the above failure modes, sandwich panels are especially susceptible to facesheet-core debonding as the facesheet and the core material have very different properties, such as Young’s modulus, Poisson’s ratio, and coefficient of thermal expansion. This is especially so under transverse forces and transverse impact forces in particular since these transverse forces cause interlaminar shear stresses at the facesheet-core interface [141].

12. Susceptibility of Fiber and Sandwich Composites to Impact Damage

Impact damage is a major weak point for composites, and much research has gone into this area. Table 12 shows why impact damage is a much greater concern for composites than metals for the following reasons:
Impacts typically occur in the transverse direction, i.e., perpendicular to the plane of the fiber laminate. These transverse forces typically cause interlaminar shear stresses in the plane of the laminate [141]. Since fiber composite laminates typically do not have fibers in the transverse direction, transverse damage resistance is usually poor [137].

12.1. Different Types of Failure Modes on Composites

Figure 15 shows the various failure modes of sandwich composites:
Of these failure modes, debonding at the facesheet-core interface is one of the most common because of the difference in mechanical properties between the facesheet and core.

12.2. Facesheet-Core Debonding and Barely Visible Impact Damage (BVID)

Facesheet-core debonding refers to the local separation of the facesheet and core due to a loss of adhesion at the interface. This is largely due to the difference in elastic moduli and thicknesses of the facesheet and core [144]. This local separation then acts as a delamination crack which can then spread to other parts of the structure [141].
Facesheet–core debonding is especially serious because they are easily triggered by impacts such as bird strikes and waves which are difficult to prevent, negatively affect the mechanical properties of the plate, and are difficult to visually detect. Therefore, it, as well as other internal defects that are difficult to visually detect, are often termed Barely Visible Impact Damage (BVID) [2]. BVID often takes the form of matrix cracking and delaminations between layers [137].

12.3. Effects of Low and High Impact Velocities on Barely-Visible Impact Damage (BVID)

Researchers typically classify impact by velocity ranges: low velocity 1–10 ms−1, intermediate velocity 50–1000 ms−1, ballistic/high velocity 1–2 kms−1, and hypersonic velocity 2–5 kms−1 [145].
Most research literature generally accepts 1–10 ms−1 as the velocity range for low-velocity impact [137,145,146] due to the testing methods typically employed, e.g., drop weight tower, Izod, and Charpy [146].
BVID typically does not occur at higher velocities. This is because, at higher impact velocities, the stress wave propagates so rapidly through the material that the structure has insufficient time to respond, therefore deformation of the structure is localized to a small area, resulting in localized perforations. These localized perforations are relatively easy to detect [142,147,148].
In contrast, [142] defines Low-velocity impact (LVI) as impacts in which the entire structure deforms due to shock waves propagating to the boundary and are reflected back several times [142]. Due to the much longer contact duration, the entire structure responds quasi-statically to the impact and thus more energy is absorbed. Also, the effect of loading rate is relatively low in the LVI velocity range and thus can be safely neglected [143].
Therefore, BVID research tends to largely focus on LVI and not higher velocity impacts [149]. Hence, this review focuses on LVI because medium- and high-velocity impacts tend to result in localized perforations.
The shape of the impactor also affects the type of impact damage caused under LVI damage. As shown by Figure 16, sharp impactors tend to cause more surface damage while blunt impactors tend to cause more internal delaminations. As a result, LVI testing typically uses blunt impactors.
Composite impact test standards have also evolved with time. Initially, the Charpy test method for impact testing of metals was used but was found to be unsuitable for composites because the short and thick test specimen geometry often does not reflect the long and planar nature of composite panels, and absorbed energy varies with specimen geometry [150]. Subsequently, drop weight impact testing was adopted. Presently, the standards ASTM D7136M and D7766M for drop weight impact testing of composite and sandwich composite impact testing, respectively, are often used since their introduction in the late 2000s. D7136 and D7766M generally specify the use of a hemispherical impactor [151,152].
Figure 16. (a) (Left to right) Hemispherical, Ogive, and Pointed Impactors. Photo adapted from [153] (b) Hemispherical impactor shapes cause more delamination than sharper impactors under low-velocity impact. Adapted from [154], used with publisher’s permission.
Jcs 08 00023 g016

12.4. Experimental Results of Low-Velocity Impact (LVI) on Balsa Core Composite Sandwich Structures

Table 13 summarizes experiments LVI impact of balsa core composite sandwich structures. To the authors’ knowledge, there are no studies on the effect of surface treatment on a balsa sandwich, or impact damage on a surface-treated balsa sandwich.
Table 13. Summary of research literature covering low-velocity impact of balsa core composite sandwich structures. Balsa that is arranged in end-grain (grain perpendicular to the plane of the sandwich panel) is labeled accordingly. Note the following acronyms: NG—Not Given. SB—secondary bonding, VARI—vacuum-assisted resin infusion, FSNT—final sandwich nominal thickness, EG—End-Grain, NEG—Non-End-Grain, SB—secondary bonding of already cured facesheet and cores, NS—no standard explicitly followed, DWT—drop weight tower, HI—hemispherical impactor tip, 4PB—4 point bending, QSI—quasi-static indentation, CAI—Compression After Impact.
Who/FabricationTest MethodKey Findings
[155]
Co-cured vacuum bagging
-
Facesheet: 4 layers E-glass/Epoxy Prepreg, total 1mm thick
-
Core: 9.5 mm thk Balsa, density 96 kg/m3
EG balsa and NEG Balsa
Cured in Vacuum press: temperature 135 °C, pressure 344 kPa for 20 min, followed by post-curing in oven at 80 °C for 5 h.
NS, Instron Dynatup 9250HV DWT
⌀ 50.8 mm HI mass 7.7 kg
Energy levels—17 J, 26 J, 35 J
Specimen size 100 × 100 × 11.5 m, exposed opening ⌀ 76.2 mm
Also done:
CAI on damaged area, NS.
Cst rate 0.05 mm/s in thickness direction with ⌀ 20.5 mm steel cylinder
Jcs 08 00023 i004
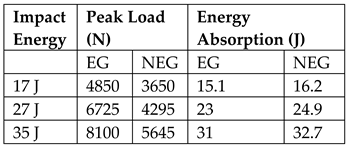
Above table shows that EGB core sandwich can withstand higher impact loads but has less energy absorption than regular balsa cores.
EGB core sandwich retained higher CAI residual strength than regular balsa core.
17 J impact energy causes large (40–52%) reduction in residual strength for both EGB and Regular core sandwich.
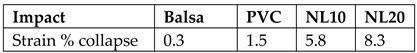
[156]
Method: Co-cured VARI, FSNT: 11.5 mm:
-
Facesheet: 2 plies +45/−45 biaxial stitch bonded non-crimp E-glass fabric, 780 g/m2
-
Core: PVC foam 62 kg/m3 or EG Balsa 157 kg/m3
-
Matrix: Epoxy (type not given)
NS, CEAST Fractovis Plus, exposed opening ⌀ 76.2 mm
⌀ 12.7 mm HI with mass 5 kg
See Figure 17
Balsa more prone to debonding than PVC as balsa has poor interface with glass/epoxy.
Balsa has a linear elastic response until the point of initial localized failure, followed by drop in stress level as buckling occurs in weakest sites.
[55]
Method: Co-cured vacuum bagging, FSNT: 35.53–36.97 mm
-
Facesheet: 4 layers LT800 E-glass 0/90 Biaxial
-
Core:
Corecork NL10, thk 30 mm
Corecork NL20, thk 30 mm
Divinycell H100 PVC foam 100 kg/m3, thk 30 mm
Baltek 100 EG Balsa 153 kg/m3, thk 31.7 mm
-
Resin: Crystic 489 PA isophtalic polyester with Butanox M-50 hardener
Cured NL10 laminate displayed weird smell, suggesting curing issues
ASTM D7136, Rosand IFW 5 HV DWT
Impact energies: 50, 100, 150, 200, 300 J
Specimen size 150 × 150 mm2
Also done:
  • ASTM C393 4PB
  • ASTM D6264 QSI
Jcs 08 00023 i005
Poor adhesion between balsa and Glass/epoxy layer—facesheet is easily ripped off from the core material during quasi-static indentation.
PVC and NL20: Load increases linearly until rupture of 1st facesheet around 12–13 kN and 10 mm displacement.
Authors remark that Cork behaves similarly to a piece of rubber or spring in that it almost regains its original shape after compressive force is released.
[157]
Method: SB under vacuum, FSNT: 28.2 mm
-
Facesheet: Carbon-epoxy prepreg, either Unidirectional UD 8 ply or 4 ply 5H Satin weave carbon-epoxy AGP370-5H/3501-6S (total 1.3 mm thick)
-
Core:
Baltek CK57 Balsa 25.4 mm thick
PVC foam H250 Divinycell 25.4 mm thick
Aluminium Honeycomb
-
Matrix NG
NS, DWT model NG
Impact energies: 7.8–108 J
Specimen size 150 × 150 mm2
Also done:
  • ASTM C393 4PB
  • ASTM D6264 QSI
Minimum energy required for debonding to occur:
UD + Balsa: 15 J, Woven + Balsa: 9 J
UD + PVC: 30–35 J
UD + Al honeycomb: 9 J
Balsa core sandwiches perform well under static loading, but are weak at impact loading as low fracture toughness along grain direction leads to catastrophic core failure and thus debonding at non-impacted facesheet.
PVC core Sandwiches tend to absorb more energy through indentation and are more stable than balsa cores. Debonding tends to occur at impacted Facesheet.
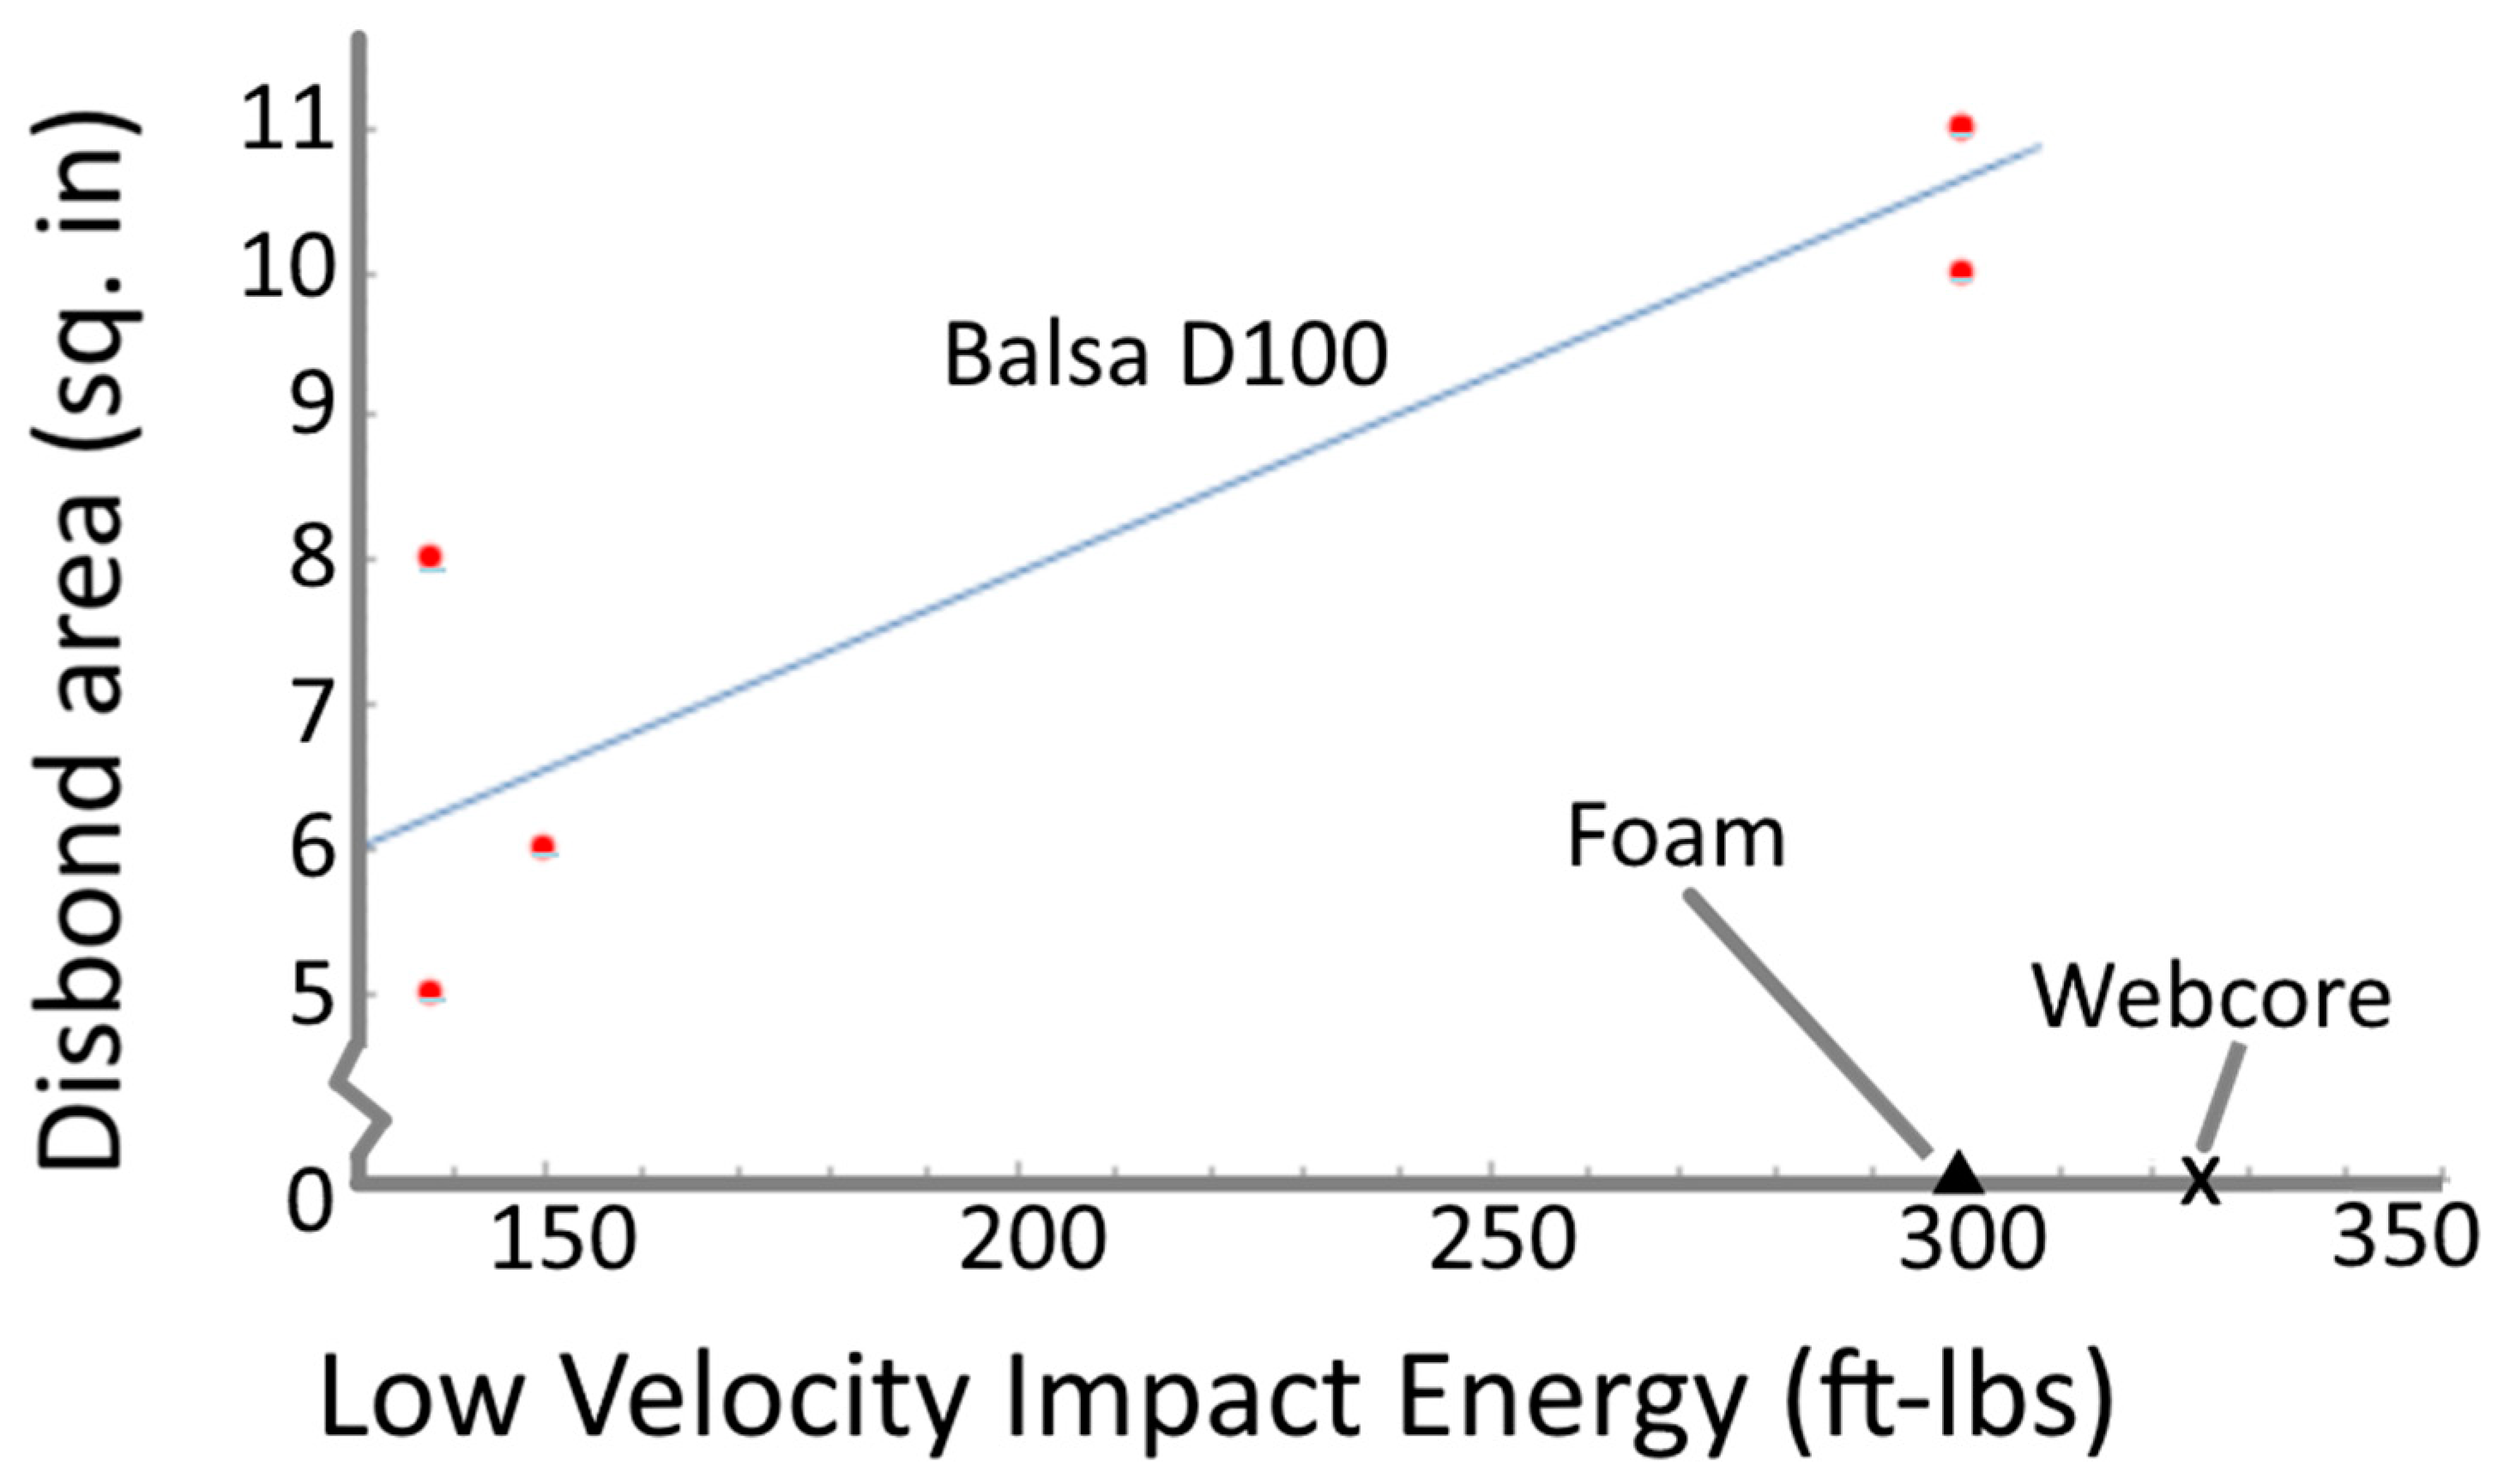
[158]
Co-cured SCRIMP (patented VARI derivative method)
Each Facesheet: E-glass 810 g/m2 Woven Roving, (number of layers and direction not given) nominal thk 3 mm
Core: 1″ thk. Either
-
EG Balsa D100 9.5 lbs/ft3 (152 kg/m3) or
-
HY80 PVC Foam
-
Webcore—HY80 reinforced with 45 deg oriented glass webs every 1 square inch
Resin: Derakane 510A VE resin
Some samples have intentionally created facesheet-core disbond
NS, DWT model not given,
⌀ 101.4 mm spherical steel impactor, height 6 ft, 25 and 50 lbs (energy levels—150 ft-lbs (203.4 J) and 300 ft-lbs (407.7 J)
Thereafter: CAI, NS. End loading of plates at 0.1 in/min rate
Balsa showed higher compression after impact capacity, better local crushing and local shearing but lesser resistance to disbonds than foam.
All Foam specimens did not exhibit any delamination or core crushing, but balsa exhibited delamination for both impact damage and release agents.
Balsa compression after impact load capacity is dependent on delamination size—higher size means less load capacity. It does not matter whether the delamination is due to impact or existing disbonds.
Webcore did not experience any delaminations due to impact.
Refer to Figure 18 for graph on disbond area
[159]
Method: SB with hot press machine:
-
Facesheet: 4 plies UD E-glass/PP Prepregs 0°/90°/0°/90°
Core: Baltek SB100 EG Balsa, 153 kg/m3, thk 15 mm (FSNT 16.64 mm) or 25 mm (FSNT: 26.48 mm)
-
Matrix: Araldite LY564 resin and 3487 BD hardener
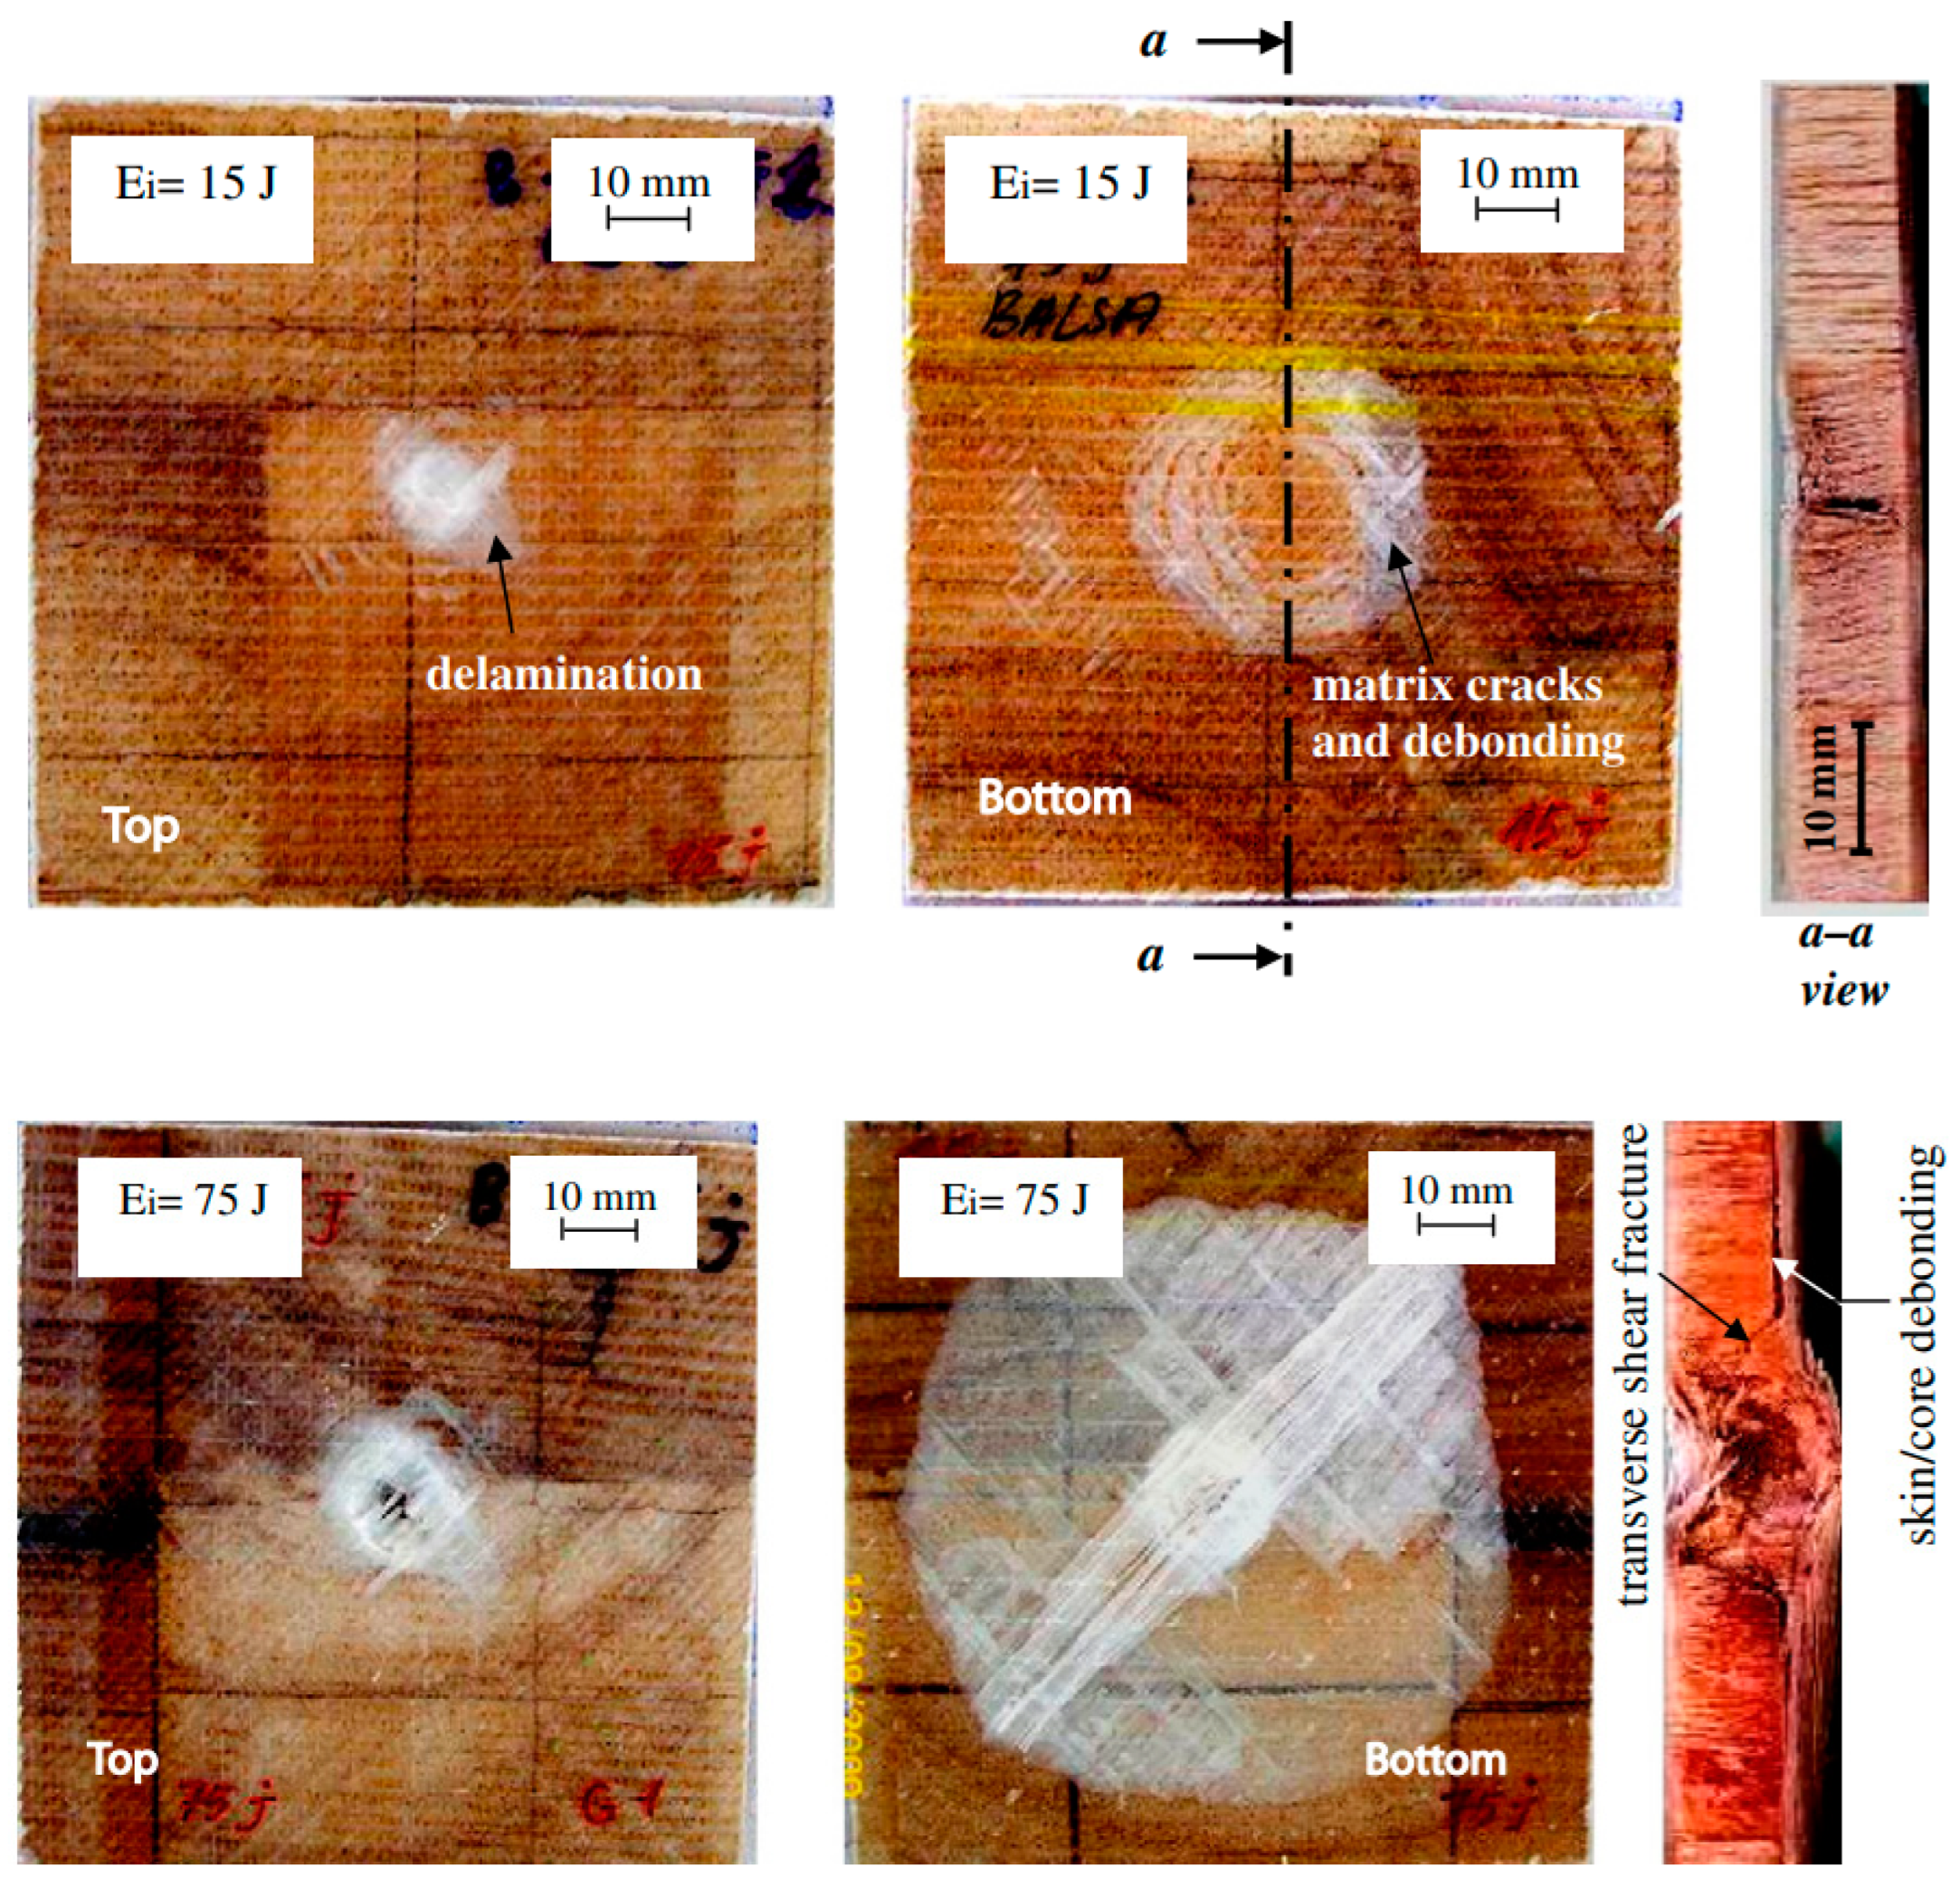
NS, CEAST Fractovis Plus 7526.000, exposed opening ⌀ 76.2 mm
⌀ 12.7 mm HI with mass 4.926 kg
Main damage modes: fiber fractures at top and bottom facesheets, delaminations between thermoplastic facesheets, transverse fractures of balsa wood core. Refer to Figure 19
Except for the first 5 impacts, the maximum contact force of the sandwich composite specimens decreases with each subsequent impact
Number of repeated 10 J impacts required to fracture laminate: 38 (15 mm), 98 (25 mm)
Several conclusions can be made from the above research literature:
  • Debonding can occur for balsa core sandwiches even at low LVI energy levels, and severity increases with increasing LVI energy levels [159].
  • Both end-grain and non-end grain Balsa cores show poor adhesion to fiber layers and are therefore prone to debonding during LVI [156,159] and static indentation [55].
  • Synthetic foams such as PVC are less susceptible to debonding than end-grain and non-end-grain balsa [156,157,158].
  • Delamination is the dominant damage mode, particularly at higher impact energy levels [156].
  • Delamination occurs more significantly at the non-impacted than the impacted side for balsa core sandwiches for all cases and impact energies. This is in contrast to PVC foam which is more prone to front facesheet debonding [156].
This seems to suggest that facesheet-core debonding caused by poor interface adhesion is indeed serious a problem both for end-grain and non-end-grain balsa. This appears to agree with [160] on interfacial toughness which showed that PVC cores with glass-epoxy facesheets (2700 J/m2) showed significantly higher interfacial toughness than balsa cores (1400–1860 J/m2) with glass/polyester sandwich panels [160]. However, the study does not show whether the difference is due to differences in core or resin.

12.5. Low Velocity Impact of Cork Core Sandwich Structures

Table 14 summarizes some of the research literature on cork-cored sandwich composites. These cork-cored sandwich composites cover both self-made cork agglomerate as well as commercially available Corecork. To the best of the authors’ knowledge, there is no studies on the effect of low-velocity impact on sandwich panels using any kind of surface-treated cork.
As shown in Figure 19, refs. [56,57] report a small permanent damage area for cork, much smaller than that of PMI foam. This is consistent with Ptak et al.’s findings of cork agglomerates being able to largely recover their initial dimensions and absorb multiple impacts.
In [53], the increasing difference in performance as impact energy increases suggests cork is better at absorbing energy than fiber layers at higher energy LVI levels.
So far, this is little mention of facesheet-core debonding of Corecork or other cork agglomerates under impact, as compared to balsa.

12.6. Effects of Surface Treatment on Low-Velocity Impact (LVI) Damage on Laminates

To the author’s knowledge, there are no papers in the open research literature on the effects of surface treatment on the LVI performance of monolithic or sandwich laminates.
That said, fiber metal laminates (FMLs) are also known to experience debonding at the interface between fiber and metal layers. As FMLs have become a major research area, papers have been written on the effects of surface treatment on LVI performance on fiber metal laminates (FMLs), such as refs. [162,163,164]. This is beyond the scope of this review paper.

13. Conclusions

Facesheet-core debonding caused by low-velocity impact (LVI) damage is indeed a serious problem that affects composite sandwich structures as it considerably reduces mechanical properties and is also difficult to detect visually, but LVI events like hail strikes and dropped tools are difficult to prevent [2].
Boosting the LVI performance of balsa core sandwich would greatly improve the quality of all balsa core-sandwich applications, in particular that of wind turbine blades, which take up the vast majority of balsa core sandwich usage [165]. Wind turbine blades are often subject to high cyclic stresses, and impact loads and are extremely costly and difficult to repair or replace.
This is especially so for balsa core sandwiches, which are very prone to back skin facesheet/core debonding due to poor interface adhesion between balsa and epoxy [156,159]. On the other hand, cork exhibits lesser permanent damage area under low-velocity impact than balsa or thermoplastic foams, due to its ability to elastically absorb impact and rebound.
Both balsa and cork have low free surface energy in both dispersive and polar components. This suggests that using surface modification/treatment methods on cork and balsa can potentially be very helpful in boosting adhesion and and potentially boost LVI performance.
While there are many ways of boosting adhesion, reactive gas surface treatment methods appear to be the most feasible for usage in a composites processing environment due to the relatively fast processing times and lack of liquid chemical usage. Research literature shows that reactive gas surface treatment has also been shown to improve adhesion on dry carbon and glass fibers, cured thermoplastic and thermoset prepreg fiber laminates, and dry cork.
That said, it is difficult to draw a correlation between surface treatment variables, fabrication process parameters, and mechanical properties at present as this is not covered much in the open research literature. This is especially true for the following, of which there is little or no information in open research literature:
  • Surface Treatment of Core Materials—balsa, and Amorim Corecork cork core
  • Effects of surface treatment on co-curing sandwich composite fabrication process –Vacuum Assisted Resin Infusion and Vacuum Bagging
Therefore, much further research is needed in these areas.

Author Contributions

Conceptualisation: A.S. & M.O. Compilation: M.O. Writing—Original draft preparation: M.O. Supervision: A.S. Project Administration: A.S. Writing—review & editing: A.S. All authors and read and agreed to the published version of the manuscript.

Funding

This research received no external funding.

Data Availability Statement

No new data were created or analyzed in this study. Data sharing is not applicable to this article.

Conflicts of Interest

The authors declare no conflicts of interest.

Appendix A

Table A1. These calculation methods are not commonly used in the context of surface treatment of fiber composite or natural materials. Please refer to Table 5 for calculation methods that are often used for surface treatment of fiber composite or natural materials.
Equation Name EquationRemarks
Cassie/Cassie Baxter Equation [166,167]cos θc = f1 cos θ1f2, with f1 + f2 ≥ 1
where:
-
f1 and f2 refers the fractional projected area of materials under the drop. Typically f1 refers to the solid, and f2 refers to air
-
θc is the predicted Cassie–Baxter contact angle, θ1 is the contact angle on a smooth surface of the solid
Typically used for superhydrophobic surfaces, and surfaces manufactured using lithography, micromachining, etching, or similar techniques. Not commonly used for surface treatment of composite or natural materials.
Simplified form cos θc = f1 cos θ – (1 – f)
is valid for flat-topped pillar geometry without any penetration of the liquid.
Van Oss Acid-Base Equation
[87,168]
According to the Lewis acid-base theory, polar interactions occur when an electron acceptor (+) is attracted to an electron donor (−). These form the geometric mean.
             γ S L = γ L + γ S 2 [ ( γ L D γ s D ) 1 2 + ( γ L γ s + ) 1 2 + ( γ L γ s + ) 1 2 ]
γSL is then substituted into Young’s Equation γ S = γ S L + γ L c o s θ to obtain γ S
Since 2 of the Van Oss theory’s 3 parameters deal with polar interaction, this theory works best for organometallic surfaces, inorganic surfaces, and surfaces containing ions.
Not often used in practice, largely because of very limited choice of test liquids with known basic and acidic fractions.
Young’s Equation
[87,88]
                                                 γ S = γ S L + γ L c o s θ
where:
-
θ is the droplet contact angle in degrees,
-
γS is the Surface Free Energy of the solid in mN/m
-
γSL is the Interfacial Tension between solid and liquid in mN/m
-
γL is the Surface Tension of the Liquid in mN/m
-
Most other calculation methods are based on Young’s equation.
Valid for 3 phase systems in thermodynamic equilibrium for ideal (smooth and chemically homogenous) solids and pure liquids.
Not to be confused with the Young Laplace fit, which describes the sustained capillary pressure difference at the interface between two static fluids.
Zisman Equation
[87,169]
The surface energy of a solid is based on the highest surface tension liquid (real or imaginary) that completely wets out the solid, i.e., gives a contact angle of 0°:
e.g., for Polyethylene (PE):
Jcs 08 00023 i009
Then draw a best fit line of the cosine of contact angle against liquid surface tension (mN/m) of the liquids with non-zero contact angles, and see where the best fit line intersects the y = 0 mark.
That intersection marks the highest surface tension liquid, and thus the surface free energy of the solid.
Not used for surface treatment of natural materials.
Only measures 1 parameter—the overall surface tension of the solid surface.
At least 5 liquids are required to conduct measurements.
Generally, Zisman theory works best for non-polar surfaces, such as polyethylene or polypropylene.
Unsuitable for polar surfaces. Since surface treatment typically increases the polar component of surface free energy, it is not used for assessing effectiveness of surface treatment.

References

  1. Mishnaevsky, L.; Branner, K.; Petersen, H.N.; Beauson, J.; McGugan, M.; Sørensen, B.F. Materials for Wind Turbine Blades: An Overview. Materials 2017, 10, 1285. [Google Scholar] [CrossRef] [PubMed]
  2. Anderson, T.; Madenci, E. Experimental investigation of low-velocity impact characteristics of sandwich composites. Compos. Struct. 2000, 50, 239–247. [Google Scholar] [CrossRef]
  3. Castanie, B.; Bouvet, C.; Ginot, M. Review of composite sandwich structure in aeronautic applications. Compos. Part C Open Access 2020, 1, 100004. [Google Scholar] [CrossRef]
  4. Vicard, C.; De Almeida, O.; Cantarel, A.; Bernhart, G. Experimental study of polymerization and crystallization kinetics of polyamide 6 obtained by anionic ring opening polymerization of ε-caprolactam. Polymer 2017, 132, 88–97. [Google Scholar] [CrossRef]
  5. Zhang, J.; Chevali, V.S.; Wang, H.; Wang, C.-H. Current status of carbon fibre and carbon fibre composites recycling. Compos. Part B Eng. 2020, 193, 108053. [Google Scholar] [CrossRef]
  6. Koronis, G.; Silva, A.; Fontul, M. Green composites: A review of adequate materials for automotive applications. Compos. Part B Eng. 2013, 44, 120–127. [Google Scholar] [CrossRef]
  7. Marsh, G. Composites in commercial jets. Reinf. Plast. 2015, 59, 190–193. [Google Scholar] [CrossRef]
  8. Griffiths, B. Boeing Sets Pace for Composite Usage in Large Civil Aircraft. Available online: https://www.compositesworld.com/articles/boeing-sets-pace-for-composite-usage-in-large-civil-aircraft (accessed on 30 May 2022).
  9. Global Wind Energy Council. A Gust of Growth in China Makes 2020 a Record Year for Wind Energy. Available online: https://gwec.net/a-gust-of-growth-in-china-makes-2020-a-record-year-for-wind-energy/ (accessed on 1 May 2023).
  10. Krauklis, A.E.; Karl, C.W.; Gagani, A.I.; Jørgensen, J.K. Composite Material Recycling Technology—State-of-the-Art and Sustainable Development for the 2020s. J. Compos. Sci. 2021, 5, 28. [Google Scholar] [CrossRef]
  11. Beauson, J.; Laurent, A.; Rudolph, D.P.; Pagh Jensen, J. The complex end-of-life of wind turbine blades: A review of the European context. Renew. Sustain. Energy Rev. 2022, 155, 111847. [Google Scholar] [CrossRef]
  12. Bošnjaković, M.; Katinić, M.; Santa, R.; Marić, D. Wind Turbine Technology Trends. Appl. Sci. 2022, 12, 8653. [Google Scholar] [CrossRef]
  13. Ferrell, M. Why Are Floating Wind Turbines So Huge? Available online: https://undecidedmf.com/why-are-floating-wind-turbines-so-huge/ (accessed on 10 December 2022).
  14. Rasmussen, B. Fragments of wind turbine blades await burial at the Casper Regional Landfill in Wyoming. Bloom. Green 2020. [Google Scholar]
  15. Hunt, A. Jetphotos. Available online: https://www.jetphotos.com/photo/10343202 (accessed on 1 November 2023).
  16. Sanjay, M.; Arpitha, G.; Naik, L.L.; Gopalakrishna, K.; Yogesha, B. Applications of natural fibers and its composites: An overview. Nat. Resour. 2016, 7, 108–114. [Google Scholar] [CrossRef]
  17. Azwa, Z.N.; Yousif, B.F.; Manalo, A.C.; Karunasena, W. A review on the degradability of polymeric composites based on natural fibres. Mater. Des. 2013, 47, 424–442. [Google Scholar] [CrossRef]
  18. Venkateshwaran, N.; Elaya Perumal, A.; Arunsundaranayagam, D. Fiber surface treatment and its effect on mechanical and visco-elastic behaviour of banana/epoxy composite. Mater. Des. 2013, 47, 151–159. [Google Scholar] [CrossRef]
  19. Suddell, B.C.; Evans, W.J. Natural Fiber Composites in Automotive Applications; CRC Press: Boca Raton, FL, USA, 2005; pp. 231–259. [Google Scholar]
  20. Stewart, R. Automotive composites offer lighter solutions. Reinf. Plast. 2010, 54, 22–28. [Google Scholar] [CrossRef]
  21. Wilkinson, S. The Miraculous Mosquito: De Havilland’s versatile Wooden Wonder racked up an admirable combat record within a remarkably short timespan. In Aviation History; HistoryNet LLC: Arlington, VA, USA, 2015. [Google Scholar]
  22. Alfredo Rodriguez Zunino, M.N.S.T.F. Gone with the Wind: China’s Balsa Wood Consumption is Exposing Flaws in Peru’s Forest Regulations & Enforcement Regime. In Forest Trends Association; Forest Trends Association: Washington, DC, USA, 2022; p. 27. [Google Scholar]
  23. Shohag, M.A.S.; Hammel, E.C.; Olawale, D.O.; Okoli, O.I. Damage mitigation techniques in wind turbine blades: A review. Wind Eng. 2017, 41, 185–210. [Google Scholar] [CrossRef]
  24. Lee, J.-K.; Park, J.-Y.; Oh, K.-Y.; Ju, S.; Lee, J.-S. Transformation algorithm of wind turbine blade moment signals for blade condition monitoring. Renew. Energy 2015, 79, 209–218. [Google Scholar] [CrossRef]
  25. Argus Media Group. Ecuador Balsa Wood Exports for Wind Turbines Decline. 2022. Available online: https://www.argusmedia.com/en/news/2350426-ecuador-balsa-wood-exports-for-wind-turbines-decline (accessed on 1 November 2023).
  26. Borrega, M.; Ahvenainen, P.; Serimaa, R.; Gibson, L. Composition and structure of balsa (Ochroma pyramidale) wood. Wood Sci. Technol. 2015, 49, 403–420. [Google Scholar] [CrossRef]
  27. Toubia, E.A.; Emami, S.; Klosterman, D. Degradation mechanisms of balsa wood and PVC foam sandwich core composites due to freeze/thaw exposure in saline solution. J. Sandw. Struct. Mater. 2019, 21, 990–1008. [Google Scholar] [CrossRef]
  28. 3A-Composites. BALTEK®® SealX: Closing the Gap on foam Core Material; 3A Composites: Steinhausen, Switzerland, 2020. [Google Scholar]
  29. Corelite. CoreLite Unveils Next-Generation PC11 Pro Coating for BALSASUD®® Core. Available online: https://www.corelitecomposites.com/blogs/post/CoreLite-Unveils-Next-Generation-PC11-Pro-Coating-for-BALSASUD%C2%AE-Core (accessed on 10 December 2022).
  30. Gurit. Balsaflex Lite. Available online: https://gurit.com/wp-content/uploads/2023/01/Core-Lite-flyer_v1_web.pdf (accessed on 30 March 2023).
  31. Purnawati, R.; Febrianto, F.; J Wistara, I.N.; Nikmatin, S.; Hidayat, W.; Lee, S.H.; Kim, N.H. Physical and Chemical Properties of Kapok (Ceiba pentandra) and Balsa (Ochroma pyramidale) Fibers. J. Korean Wood Sci. Technol. 2018, 46, 393–401. [Google Scholar] [CrossRef]
  32. Galos, J.; Das, R.; Sutcliffe, M.P.; Mouritz, A.P. Review of balsa core sandwich composite structures. Mater. Des. 2022, 221, 111013. [Google Scholar] [CrossRef]
  33. PT Sibalsa Indonesia Balsa. End Grain Balsa—Sibalsa. Available online: https://sibalsa.id/end-grain-balsa/ (accessed on 1 November 2023).
  34. Rogers, C. Core Material Reference. Available online: https://explorecomposites.com/materials-library/core-ref/ (accessed on 30 May 2023).
  35. Ma, W.; Elkin, R. Sandwich Structural Composites: Theory and Practice; CRC Press: Boca Raton, FL, USA, 2021. [Google Scholar]
  36. Wang, Z.; Jia, C.; Xiang, H.; Zhu, M. Palladium Nanoparticle-Loaded Mesostructural Natural Woods for Efficient Water Treatment. Polymers 2023, 15, 658. [Google Scholar] [CrossRef] [PubMed]
  37. Ardian, M. Lighter, Stiffer & Stronger: Sandwich Composites. Available online: https://sutd-composites.blogspot.com/2023/12/lighter-stiffer-stronger-sandwich.html (accessed on 1 November 2023).
  38. Taylor, D. The Dawn of the Age of Plastics. Available online: https://undark.org/2019/02/22/dawn-age-plastics/ (accessed on 1 November 2023).
  39. ThermalCork Solutions. Cork Insulation FAQs. Available online: https://thermalcorksolutions.com/cork-insulation-faqs/ (accessed on 1 November 2023).
  40. Silva, S.P.; Sabino, M.A.; Fernandes, E.M.; Correlo, V.M.; Boesel, L.F.; Reis, R.L. Cork: Properties, capabilities and applications. Int. Mater. Rev. 2005, 50, 345–365. [Google Scholar] [CrossRef]
  41. Antunes, A.; Pereira, J.; Paiva, N.; Ferra, J.; Martins, J.; Carvalho, L.; Barros-Timmons, A.; Magalhães, F.D. Effects of resin content on mechanical properties of cork-based panels bound with melamine-urea-formaldehyde and polyurethane binders. Int. J. Adhes. Adhes. 2020, 101, 102632. [Google Scholar] [CrossRef]
  42. Sergi, C.; Sarasini, F.; Russo, P.; Vitiello, L.; Barbero, E.; Sanchez-Saez, S.; Tirillò, J. Effect of temperature on the low-velocity impact response of environmentally friendly cork sandwich structures. J. Sandw. Struct. Mater. 2021, 24, 1099–1121. [Google Scholar] [CrossRef]
  43. Sergi, C.; Sarasini, F.; Tirillò, J. The Compressive Behavior and Crashworthiness of Cork: A Review. Polymers 2022, 14, 134. [Google Scholar] [CrossRef] [PubMed]
  44. Azevedo, J.; Lopes, P.; Mateus, N.; de Freitas, V. Cork, a Natural Choice to Wine? Foods 2022, 11, 2638. [Google Scholar] [CrossRef] [PubMed]
  45. Pereira, H. The Rationale behind Cork Properties: A Review of Structure and Chemistry. BioResources 2015, 10. [Google Scholar] [CrossRef]
  46. Pereira, H. Introduction. In Cork; Pereira, H., Ed.; Elsevier Science B.V.: Amsterdam, The Netherlands, 2007; pp. 1–3. [Google Scholar]
  47. APCOR. Composite Agglomerates. Available online: https://www.apcor.pt/en/cork/processing/industrial-path/composite-agglomerates/ (accessed on 1 November 2023).
  48. Flor-Montalvo, F.J.; Martínez-Cámara, E.; García-Alcaraz, J.L.; Jiménez-Macías, E.; Latorre-Biel, J.-I.; Blanco-Fernández, J. Environmental Impact Analysis of Natural Cork Stopper Manufacturing. Agriculture 2022, 12, 636. [Google Scholar] [CrossRef]
  49. Crouvisier-Urion, K.; Bellat, J.-P.; Gougeon, R.D.; Karbowiak, T. Mechanical properties of agglomerated cork stoppers for sparkling wines: Influence of adhesive and cork particle size. Compos. Struct. 2018, 203, 789–796. [Google Scholar] [CrossRef]
  50. Correia, J.M.D.; Serra, G.F.; Alves de Sousa, R.J.; Pereira, A.B.; Fernandes, F.A.O. Expanded (Black) Cork for the Development of an Eco-Friendly Surfboard: Environmental Impact and Mechanical Properties. Sustainability 2022, 14, 668. [Google Scholar] [CrossRef]
  51. Ptak, M.; Kaczynski, P.; Fernandes, F.A.O.; de Sousa, R.J.A. Assessing impact velocity and temperature effects on crashworthiness properties of cork material. Int. J. Impact Eng. 2017, 106, 238–248. [Google Scholar] [CrossRef]
  52. Sanchez-Saez, S.; García-Castillo, S.K.; Barbero, E.; Cirne, J. Dynamic crushing behaviour of agglomerated cork. Mater. Des. 2015, 65, 743–748. [Google Scholar] [CrossRef]
  53. Arteiro, A.; Reis, A.L.M.A.; Nóvoa, P.J.R.O.; Silva, L.F.M.; Zupan, M.; Marques, A.T. Low velocity impact and flexural performance of sandwich structures with cork and polymer foam cores. Ciência Tecnol. Dos Mater. 2013, 25, 79–84. [Google Scholar] [CrossRef]
  54. Castilho, T.; Sutherland, L.; Soares, C.G. Impact resistance of marine sandwich composites. In Maritime Technology and Engineering; Taylor & Francis Group: London, UK, 2015; pp. 607–618. [Google Scholar]
  55. Ivañez, I.; Sánchez-Saez, S.; Garcia-Castillo, S.K.; Barbero, E.; Amaro, A.; Reis, P.N.B. High-velocity impact behaviour of damaged sandwich plates with agglomerated cork core. Compos. Struct. 2020, 248, 112520. [Google Scholar] [CrossRef]
  56. Silva, J.M.; Devezas, T.C.; Silva, A.; Gil, L.; Nunes, C.; Franco, N. Exploring the use of Cork Based Composites for Aerospace Applications. Mater. Sci. Forum 2010, 636–637, 260–265. [Google Scholar] [CrossRef]
  57. Walsh, J.; Kim, H.-I.; Suhr, J. Low velocity impact resistance and energy absorption of environmentally friendly expanded cork core-carbon fiber sandwich composites. Compos. Part A Appl. Sci. Manuf. 2017, 101, 290–296. [Google Scholar] [CrossRef]
  58. Amorim Cork Composites. Corecork NL20 Datasheet. Available online: https://amorimcorkcomposites.com/media/4203/mds-nl20-en.pdf (accessed on 1 November 2023).
  59. 3A Composites. BALTEK SB Balsa TDS. Available online: https://www.3accorematerials.com/uploads/documents/TDS-BALTEK-SB-E_1106.pdf (accessed on 1 June 2023).
  60. Corelite. Balsasud Product Data Sheet. Available online: https://www.corelitecomposites.com/files/BALSASUD%20Core%20Data%20Sheet.pdf (accessed on 1 November 2023).
  61. Gurit, A.G. Gurit Balsaflex Balsa Wood Core Material Full General Datasheet. Available online: http://www.guritbalsa.com/images/documents/balsaflex/Balsaflex-TDS.pdf (accessed on 1 June 2023).
  62. Schmid Fuertes, T.A.; Kruse, T.; Körwien, T.; Geistbeck, M. Bonding of CFRP primary aerospace structures—Discussion of the certification boundary conditions and related technology fields addressing the needs for development. Compos. Interfaces 2015, 22, 795–808. [Google Scholar] [CrossRef]
  63. Dillingham, R.G. Composite bond inspection. In Structural Integrity and Durability of Advanced Composites; Beaumont, P.W.R., Soutis, C., Hodzic, A., Eds.; Woodhead Publishing: Sawston, UK, 2015; pp. 695–706. [Google Scholar]
  64. Seemann, W.H., I; Tunis, G.C., III; Perrella, A.P.; Haraldsson, R.K.; Everitt, W.E.; Pearson, E.A. Large Composite Structures Incorporating a Resin Distribution Network. U.S. Patent 5,721,034, 24 February 1998. [Google Scholar]
  65. FibreGlast. Vacuum Infusion Complete Guide. Available online: https://www.fibreglast.com/product/vacuum-infusion-Guide/Learning_Center (accessed on 1 June 2023).
  66. Cairns, D.; Skramstad, J.; Mandell, J. Evaluation of hand lay-up and resin transfer molding in composite wind turbine blade structures. In Proceedings of the 20th 2001 ASME Wind Energy Symposium, Bozeman, MT, USA, 11–14 January 1999. [Google Scholar]
  67. Loos, A.C. Low-cost fabrication of advanced polymeric composites by resin infusion processes. Adv. Compos. Mater. 2001, 10, 99–106. [Google Scholar] [CrossRef]
  68. Modi, D.; Correia, N.; Johnson, M.; Long, A.; Rudd, C.; Robitaille, F. Active control of the vacuum infusion process. Compos. Part A Appl. Sci. Manuf. 2007, 38, 1271–1287. [Google Scholar] [CrossRef]
  69. Di Tomasso, C.; József Gombos, Z.; Summerscales, J. Styrene emissions during gel-coating of composites. J. Clean. Prod. 2014, 83, 317–328. [Google Scholar] [CrossRef]
  70. Cortés, E.; Sánchez, F.; O’Carroll, A.; Madramany, B.; Hardiman, M.; Young, T.M. On the Material Characterisation of Wind Turbine Blade Coatings: The Effect of Interphase Coating–Laminate Adhesion on Rain Erosion Performance. Materials 2017, 10, 1146. [Google Scholar] [CrossRef] [PubMed]
  71. Gilliam, M. Polymer surface treatment and coating technologies. In Handbook of Manufacturing Engineering and Technology; Springer: Berlin/Heidelberg, Germany, 2015; pp. 99–124. [Google Scholar]
  72. Ellsworth-Adhesives. Webinar: How Plasma and Flame Surface Treating Improve Adhesive Bonding. 2018. Available online: https://www.ellsworth.com/resources/insights/webinars/how-plasma-and-flame-surface-treating-improve-adhesive-bonding/ (accessed on 1 May 2023).
  73. Zille, A.; Oliveira, F.R.; Souto, A.P. Plasma treatment in textile industry. Plasma Process. Polym. 2015, 12, 98–131. [Google Scholar] [CrossRef]
  74. Lewarchik, R. A Guide to Providing Initial and Long-Lasting Coating Adhesion. Available online: https://www.ulprospector.com/knowledge/10127/pc-a-guide-to-providing-perfect-coating-adhesion/ (accessed on 30 May 2023).
  75. Schuster, J.M.; Schvezov, C.E.; Rosenberger, M.R. Analysis of the Results of Surface Free Energy Measurement of Ti6Al4V by Different Methods. Procedia Mater. Sci. 2015, 8, 732–741. [Google Scholar] [CrossRef]
  76. Tsutsumi, K.; Abe, Y. Determination of dispersive and nondispersive components of the surface free energy of glass fibers. Colloid Polym. Sci. 1989, 267, 637–642. [Google Scholar] [CrossRef]
  77. Cordeiro, N.; Neto, C.P.; Gandini, A.; Belgacem, M.N. Characterization of the Cork Surface by Inverse Gas Chromatography. J. Colloid Interface Sci. 1995, 174, 246–249. [Google Scholar] [CrossRef]
  78. Brighton Science. Common Surface Energy Tests: Dyne Inks; Brighton Science: Cinncinati, OH, USA, 2016. [Google Scholar]
  79. Watts, J.F. Surface Characterization and Its Role in Adhesion Science and Technology. In Handbook of Adhesion Technology; da Silva, L.F.M., Öchsner, A., Adams, R.D., Eds.; Springer International Publishing: New York, NY, USA, 2018; pp. 197–226. [Google Scholar]
  80. Brighton Science. Manufacturer’s Roadmap to Eliminating Adhesion Issues in Production: The Path to Overcoming Adhesion Challenges; Brighton Science: Cinncinati, OH, USA, 2022. [Google Scholar]
  81. Förch, R.; Schönherr, H.; Jenkins, A.T.A. Surface Design: Applications in Bioscience and Nanotechnology; John Wiley & Sons: Hoboken, NJ, USA, 2009. [Google Scholar]
  82. Lauren, S. Contact Angle—What Is It and How Do You Measure It? Available online: https://content.biolinscientific.com/contact-angle-what-is-it-and-how-to-measure-it (accessed on 15 October 2023).
  83. Owens, D.K.; Wendt, R.C. Estimation of the surface free energy of polymers. J. Appl. Polym. Sci. 1969, 13, 1741–1747. [Google Scholar] [CrossRef]
  84. CR—For Krüss GmbH. So You Want to Measure Surface Energy? In Models for Surface Free Energy Calculation; Krüss GmbH: Hamburg, Germany, 1999. [Google Scholar]
  85. Fowkes, F.M. Attractive forces at interfaces. Ind. Eng. Chem. 1964, 56, 40–52. [Google Scholar] [CrossRef]
  86. Wu, S. Calculation of interfacial tension in polymer systems. J. Polym. Sci. Part C: Polym. Symp. 1971, 34, 19–30. [Google Scholar] [CrossRef]
  87. FT—For Krüss GmbH. Practical Contact Angle Measurement (5). Available online: https://www.google.com/url?sa=t&rct=j&q=&esrc=s&source=web&cd=&cad=rja&uact=8&ved=2ahUKEwjl8NuQmL6DAxV4slYBHZpCA_QQFnoECAoQAQ&url=http%3A%2F%2Fing.univaq.it%2Ffioravanti%2Fchimica%2FCorso%2520Chimica%2520delle%2520Superfici%2520ed%2520Interfasi%2FLaboratorio%2FReferences%2520laboratorio%2FKruss_01.pdf&usg=AOvVaw1wmShPZb3EQn5hMC4LsPL5&opi=89978449 (accessed on 15 October 2023).
  88. Young, T. III. An essay on the cohesion of fluids. Philos. Trans. R. Soc. Lond. 1805, 95, 65–87. [Google Scholar]
  89. Brighton Science. What Is the Difference between Surface Free Energy and Surface Energy? Available online: https://www.brighton-science.com/blog/what-is-the-difference-between-surface-free-energy-and-surface-energy (accessed on 30 May 2023).
  90. Liu, L.; Huang, Y.D.; Zhang, Z.Q.; Jiang, Z.X.; Wu, L.N. Ultrasonic treatment of aramid fiber surface and its effect on the interface of aramid/epoxy composites. Appl. Surf. Sci. 2008, 254, 2594–2599. [Google Scholar] [CrossRef]
  91. Jia, C.; Chen, P.; Liu, W.; Li, B.; Wang, Q. Surface treatment of aramid fiber by air dielectric barrier discharge plasma at atmospheric pressure. Appl. Surf. Sci. 2011, 257, 4165–4170. [Google Scholar] [CrossRef]
  92. Gindl, M.; Tschegg, S. Significance of the Acidity of Wood to the Surface Free Energy Components of Different Wood Species. Langmuir 2002, 18, 3209–3212. [Google Scholar] [CrossRef]
  93. Pukánszky, B.; Fekete, E. Adhesion and Surface Modification. In Mineral Fillers in Thermoplastics I: Raw Materials and Processing; Jancar, J., Fekete, E., Hornsby, P.R., Jancar, J., Pukánszky, B., Rothon, R.N., Eds.; Springer: Berlin/Heidelberg, Germany, 1999; pp. 109–153. [Google Scholar]
  94. Lee, Y.-S.; Lee, B.-K. Surface properties of oxyfluorinated PAN-based carbon fibers. Carbon 2002, 40, 2461–2468. [Google Scholar] [CrossRef]
  95. Abenojar, J.; Barbosa, A.Q.; Ballesteros, Y.; del Real, J.C.; da Silva, L.F.M.; Martínez, M.A. Effect of surface treatments on natural cork: Surface energy, adhesion, and acoustic insulation. Wood Sci. Technol. 2014, 48, 207–224. [Google Scholar] [CrossRef]
  96. Gomes, C.M.C.P.S.; Fernandes, A.C.; de Almeida, B.d.J.V.S. The Surface Tension of Cork from Contact Angle Measurements. J. Colloid Interface Sci. 1993, 156, 195–201. [Google Scholar] [CrossRef]
  97. Silva, E.A.; Oliveira, F.R.; Carmo, S.N.; Steffens, F.; Souto, A.P. Characterization of natural cork agglomerate functionalised by plasma treatment. In Proceedings of the International Conference on Natural Fibers, Guimarães, Portugal, 9–11 June 2013. [Google Scholar]
  98. Park, S.-J.; Jin, J.-S. Effect of silane coupling agent on mechanical interfacial properties of glass fiber-reinforced unsaturated polyester composites. J. Polym. Sci. Part B Polym. Phys. 2003, 41, 55–62. [Google Scholar] [CrossRef]
  99. Lancaster, J.F. 3—The use of adhesives for making structural joints. In Metallurgy of Welding, 6th ed.; Lancaster, J.F., Ed.; Woodhead Publishing: Sawston, UK, 1999; pp. 54–84. [Google Scholar]
  100. Thomas, R.; Sinturel, C.; Thomas, S.; Sadek El Akiaby, E.M. Introduction, in Micro- and Nanostructured Epoxy/Rubber Blends; Wiley-VCH: Weinheim, Germany, 2014; pp. 1–30. [Google Scholar]
  101. Bellmann, C.; Caspari, A.; Albrecht, V.; Doan, T.T.L.; Mäder, E.; Luxbacher, T.; Kohl, R. Electrokinetic properties of natural fibres. Colloids Surf. A Physicochem. Eng. Asp. 2005, 267, 19–23. [Google Scholar] [CrossRef]
  102. Kalia, S.; Kaith, B.S.; Kaur, I. Pretreatments of natural fibers and their application as reinforcing material in polymer composites—A review. Polym. Eng. Sci. 2009, 49, 1253–1272. [Google Scholar] [CrossRef]
  103. Ferreira, D.P.; Cruz, J.; Fangueiro, R. Chapter 1—Surface modification of natural fibers in polymer composites. In Green Composites for Automotive Applications; Koronis, G., Silva, A., Eds.; Woodhead Publishing: Sawston, UK, 2019; pp. 3–41. [Google Scholar]
  104. Enercon Industries Corp. Corona vs. Plasma. Available online: https://www.enerconind.com/plasma-treating/library/tech-papers-articles/corona-vs-plasma.aspx (accessed on 30 May 2023).
  105. Petersen, H.N. Investigation of Sizing—From Glass Fibre Surface to Composite Interface; Technical University of Denmark, Kongens: Lyngby, Denmark, 2017. [Google Scholar]
  106. Tiwari, S.; Bijwe, J. Surface treatment of carbon fibers-a review. Procedia Technol. 2014, 14, 505–512. [Google Scholar] [CrossRef]
  107. Park, S.-J.; Meng, L.-Y. Surface Treatment and Sizing of Carbon Fibers. In Carbon Fibers; Springer: Dordrecht, The Netherlands, 2015; pp. 101–133. [Google Scholar]
  108. Thomason, J.L. Glass fibre sizing: A review. Compos. Part A Appl. Sci. Manuf. 2019, 127, 105619. [Google Scholar] [CrossRef]
  109. Seboka, N. Jute reinforced PLA bio composite for the production of ceiling fan blades. Indian Text. J. 2021, 74–82. [Google Scholar]
  110. Godara, S.S. Effect of chemical modification of fiber surface on natural fiber composites: A review. Mater. Today Proc. 2019, 18, 3428–3434. [Google Scholar]
  111. Faruk, O.; Bledzki, A.K.; Fink, H.-P.; Sain, M. Biocomposites reinforced with natural fibers: 2000–2010. Prog. Polym. Sci. 2012, 37, 1552–1596. [Google Scholar] [CrossRef]
  112. Ben Abdallah, F.; Ben Cheikh, R.; Baklouti, M.; Denchev, Z.; Cunha, A.M. Effect of surface treatment in cork reinforced composites. J. Polym. Res. 2010, 17, 519–528. [Google Scholar] [CrossRef]
  113. Tran, M.Q.; Ho, K.K.C.; Kalinka, G.; Shaffer, M.S.P.; Bismarck, A. Carbon fibre reinforced poly(vinylidene fluoride): Impact of matrix modification on fibre/polymer adhesion. Compos. Sci. Technol. 2008, 68, 1766–1776. [Google Scholar] [CrossRef]
  114. He, J.M.; Huang, Y.D. Effect of silane-coupling agents on interfacial properties of CF/PI composites. J. Appl. Polym. Sci. 2007, 106, 2231–2237. [Google Scholar] [CrossRef]
  115. Bassyouni, M.; Gutub, S.A. Materials Selection Strategy and Surface Treatment of Polymer Composites for Wind Turbine Blades Fabrication. Polym. Polym. Compos. 2013, 21, 463–472. [Google Scholar] [CrossRef]
  116. Barnes, B.K.; Ouro-Koura, H.; Derickson, J.; Lebarty, S.; Omidokun, J.; Bane, N.; Suleiman, O.; Omagamre, E.; Fotouhi, M.J.; Ogunmolasuyi, A. Plasma generation by household microwave oven for surface modification and other emerging applications. Am. J. Phys. 2021, 89, 372–382. [Google Scholar] [CrossRef]
  117. Nehra, V.; Kumar, A.; Dwivedi, H. Atmospheric non-thermal plasma sources. Int. J. Eng. 2008, 2, 53–68. [Google Scholar]
  118. Henniker-Plasma. Let’s Talk About… How Long Plasma Treatment Lasts? Henniker Plasma. 2020. Available online: https://plasmatreatment.co.uk/knowledge-base/knowledge-articles/142-let-s-talk-about-how-long-plasma-treatment-lasts (accessed on 27 December 2022).
  119. Takeda, T.; Yasuoka, T.; Hoshi, H.; Sugimoto, S.; Iwahori, Y. Effectiveness of flame-based surface treatment for adhesive bonding of carbon fiber reinforced epoxy matrix composites. Compos. Part A Appl. Sci. Manuf. 2019, 119, 30–37. [Google Scholar] [CrossRef]
  120. Nasiru, M.M.; Frimpong, E.B.; Muhammad, U.; Qian, J.; Mustapha, A.T.; Yan, W.; Zhuang, H.; Zhang, J. Dielectric barrier discharge cold atmospheric plasma: Influence of processing parameters on microbial inactivation in meat and meat products. Compr. Rev. Food Sci. Food Saf. 2021, 20, 2626–2659. [Google Scholar] [CrossRef] [PubMed]
  121. Fröhling, A.; Durek, J.; Schnabel, U.; Ehlbeck, J.; Bolling, J.; Schlüter, O. Indirect plasma treatment of fresh pork: Decontamination efficiency and effects on quality attributes. Innov. Food Sci. Emerg. Technol. 2012, 16, 381–390. [Google Scholar] [CrossRef]
  122. Ha, J.-W.; Kang, D.-H. Simultaneous near-infrared radiant heating and UV radiation for inactivating Escherichia coli O157: H7 and Salmonella enterica serovar Typhimurium in powdered red pepper (Capsicum annuum L.). Appl. Environ. Microbiol. 2013, 79, 6568–6575. [Google Scholar] [CrossRef]
  123. Guan, W.; Fan, X.; Yan, R. Effects of UV-C treatment on inactivation of Escherichia coli O157: H7, microbial loads, and quality of button mushrooms. Postharvest Biol. Technol. 2012, 64, 119–125. [Google Scholar] [CrossRef]
  124. Song, K.; Mohseni, M.; Taghipour, F. Application of ultraviolet light-emitting diodes (UV-LEDs) for water disinfection: A review. Water Res. 2016, 94, 341–349. [Google Scholar] [CrossRef] [PubMed]
  125. Gómez-López, V.M.; Jubinville, E.; Rodríguez-López, M.I.; Trudel-Ferland, M.; Bouchard, S.; Jean, J. Inactivation of foodborne viruses by UV light: A review. Foods 2021, 10, 3141. [Google Scholar] [CrossRef] [PubMed]
  126. Kohli, R. Chapter 9—Applications of UV-Ozone Cleaning Technique for Removal of Surface Contaminants. In Developments in Surface Contamination and Cleaning: Applications of Cleaning Techniques; Kohli, R., Mittal, K.L., Eds.; Elsevier: Amsterdam, The Netherlands, 2019; pp. 355–390. [Google Scholar]
  127. Vig, J.R. UV/ozone cleaning of surfaces. J. Vac. Sci. Technol. A 1985, 3, 1027–1034. [Google Scholar] [CrossRef]
  128. Takacs, G.A.; Miri, M.J.; Kovach, T. Vacuum UV Surface Photo-Oxidation of Polymeric and Other Materials for Improving Adhesion: A Critical Review. Prog. Adhes. Adhes. 2021, 6, 559–585. [Google Scholar]
  129. Strobel, M.; Jones, V.; Lyons, C.S.; Ulsh, M.; Kushner, M.J.; Dorai, R.; Branch, M.C. A comparison of corona-treated and flame-treated polypropylene films. Plasmas Polym. 2003, 8, 61–95. [Google Scholar] [CrossRef]
  130. Flynn Burner Corp. Flame Plasma Surface Treating—What’s it All About. In Proceedings of the Tappi PLACE, St. Louis, MO, USA, 16–19 September 2007. [Google Scholar]
  131. Farris, S.; Pozzoli, S.; Biagioni, P.; Duó, L.; Mancinelli, S.; Piergiovanni, L. The fundamentals of flame treatment for the surface activation of polyolefin polymers—A review. Polymer 2010, 51, 3591–3605. [Google Scholar] [CrossRef]
  132. Strobel, M.; Branch, M.C.; Ulsh, M.; Kapaun, R.S.; Kirk, S.; Lyons, C.S. Flame surface modification of polypropylene film. J. Adhes. Sci. Technol. 1996, 10, 515–539. [Google Scholar] [CrossRef]
  133. Bárdos, L.; Baránková, H. Plasma processes at atmospheric and low pressures. Vacuum 2008, 83, 522–527. [Google Scholar] [CrossRef]
  134. Domonkos, M.; Tichá, P.; Trejbal, J.; Demo, P. Applications of Cold Atmospheric Pressure Plasma Technology in Medicine, Agriculture and Food Industry. Appl. Sci. 2021, 11, 4809. [Google Scholar] [CrossRef]
  135. Thierry Corp. Atmospheric Plasma vs. Low Pressure Plasma. Available online: https://www.thierry-corp.com/plasma-knowledgebase/atmospheric-plasma-vs-low-pressure-plasma (accessed on 30 May 2023).
  136. Zhang, W.; Yang, P.; Cao, Y.; Yu, P.; Chen, M.; Zhou, X. Evaluation of fiber surface modification via air plasma on the interfacial behavior of glass fiber reinforced laminated veneer lumber composites. Constr. Build. Mater. 2020, 233, 117315. [Google Scholar] [CrossRef]
  137. Richardson, M.O.W.; Wisheart, M.J. Review of low-velocity impact properties of composite materials. Compos. Part A Appl. Sci. Manuf. 1996, 27, 1123–1131. [Google Scholar] [CrossRef]
  138. Vadakke, V.; Carlsson, L.A. Experimental investigation of compression failure of sandwich specimens with face/core debond. Compos. Part B Eng. 2004, 35, 583–590. [Google Scholar] [CrossRef]
  139. Vitale, J.P.; Francucci, G.; Xiong, J.; Stocchi, A. Failure mode maps of natural and synthetic fiber reinforced composite sandwich panels. Compos. Part A Appl. Sci. Manuf. 2017, 94, 217–225. [Google Scholar] [CrossRef]
  140. Zhu, S.; Chai, G.B. Effect of adhesive in sandwich panels subjected to low-velocity impact. Proc. Inst. Mech. Eng. Part L J. Mater. Des. Appl. 2011, 225, 171–181. [Google Scholar] [CrossRef]
  141. Goswami, S.; Becker, W. The effect of facesheet/core delamination in sandwich structures under transverse loading. Compos. Struct. 2001, 54, 515–521. [Google Scholar] [CrossRef]
  142. Abrate, S. Impact on Laminated Composite Materials. Appl. Mech. Rev. 1991, 44, 155–190. [Google Scholar] [CrossRef]
  143. Kueh, A.B.H.; Abo Sabah, S.H.; Qader, D.N.; Drahman, S.H.; Amran, M. Single and repetitive low-velocity impact responses of sandwich composite structures with different skin and core considerations: A review. Case Stud. Constr. Mater. 2023, 18, e01908. [Google Scholar] [CrossRef]
  144. Burlayenko, V.N.; Sadowski, T. Linear and Nonlinear Dynamic Analyses of Sandwich Panels with Face Sheet-to-Core Debonding. Shock Vib. 2018, 2018, 5715863. [Google Scholar] [CrossRef]
  145. Ismail, K.I.; Sultan, M.T.H.; Shah, A.U.M.; Jawaid, M.; Safri, S.N.A. Low velocity impact and compression after impact properties of hybrid bio-composites modified with multi-walled carbon nanotubes. Compos. Part B Eng. 2019, 163, 455–463. [Google Scholar] [CrossRef]
  146. Cantwell, W.J.; Morton, J. The impact resistance of composite materials—a review. Composites 1991, 22, 347–362. [Google Scholar] [CrossRef]
  147. Robinson, P.; Davies, G. Impactor mass and specimen geometry effects in low velocity impact of laminated composites. Int. J. Impact Eng. 1992, 12, 189–207. [Google Scholar] [CrossRef]
  148. Davies, G.; Robinson, P. Predicting failure by debonding/delamination. In Debonding/Delamination of Composites 28 p (SEE N 93-21507 07-24); AGARD: Gárdony, Hungary, 1992. [Google Scholar]
  149. Ismail, M.F.; Sultan, M.T.H.; Hamdan, A.; Shah, A.U.M.; Jawaid, M. Low velocity impact behaviour and post-impact characteristics of kenaf/glass hybrid composites with various weight ratios. J. Mater. Res. Technol. 2019, 8, 2662–2673. [Google Scholar] [CrossRef]
  150. Adams, D. Impact Testing of Composite Materials. 2012. Available online: https://www.compositesworld.com/articles/impact-testing-of-composite-materials (accessed on 1 September 2023).
  151. ASTM International. ASTM D7136/D7136M-15; ASTM D7136/D7136M-15 Standard Test Method for Measuring the Damage Resistance of a Fiber-Reinforced Polymer Matrix Composite to a Drop-Weight Impact Event. American Society for Testing Materials: West Conshohocken, PA, USA, 2015.
  152. ASTM International. ASTM D7766/D7766M-16; ASTM D7766/D7766M-16 Standard Practice for Damage Resistance Testing of Sandwich Constructions. American Society for Testing Materials: West Conshohocken, PA, USA, 2016.
  153. Mitrevski, T.; Marshall, I.H.; Thomson, R.; Jones, R.; Whittingham, B. The effect of impactor shape on the impact response of composite laminates. Compos. Struct. 2005, 67, 139–148. [Google Scholar] [CrossRef]
  154. Mitrevski, T.; Marshall, I.H.; Thomson, R. The influence of impactor shape on the damage to composite laminates. Compos. Struct. 2006, 76, 116–122. [Google Scholar] [CrossRef]
  155. Abdalslam, S. Impact Damage Analysis of Balsa Wood Sandwich Composite Materials. Master’s Thesis, Graduate School of Wayne State University, Detroit, MI, USA, 2013. [Google Scholar]
  156. Atas, C.; Sevim, C. On the impact response of sandwich composites with cores of balsa wood and PVC foam. Compos. Struct. 2010, 93, 40–48. [Google Scholar] [CrossRef]
  157. Daniel, I.M.; Abot, J.L.; Schubel, P.M.; Luo, J.J. Response and Damage Tolerance of Composite Sandwich Structures under Low Velocity Impact. Exp. Mech. 2012, 52, 37–47. [Google Scholar] [CrossRef]
  158. Kelly, J.; Hoyns, D. Effect of Impact on the Compression Response of Large Composite Sandwich Plates; Woodhead Publishing: Sawston, UK, 2000; pp. 330–336. [Google Scholar]
  159. Ozdemir, O.; Oztoprak, N.; Kandas, H. Single and repeated impact behaviors of bio-sandwich structures consisting of thermoplastic face sheets and different balsa core thicknesses. Compos. Part B Eng. 2018, 149, 49–57. [Google Scholar] [CrossRef]
  160. Cantwell, W.; Davies, P. A study of skin-core adhesion in glass fibre reinforced sandwich materials. Appl. Compos. Mater. 1996, 3, 407–420. [Google Scholar] [CrossRef]
  161. Dimassi, M.A.; John, M.; Herrmann, A.S. Investigation of the temperature dependent impact behaviour of pin reinforced foam core sandwich structures. Compos. Struct. 2018, 202, 774–782. [Google Scholar] [CrossRef]
  162. Ostapiuk, M.; Bieniaś, J.; Surowska, B. Analysis of the bending and failure of fiber metal laminates based on glass and carbon fibers. Sci. Eng. Compos. Mater. 2018, 25, 1095–1106. [Google Scholar] [CrossRef]
  163. Pärnänen, T.; Kanerva, M.; Sarlin, E.; Saarela, O. Debonding and impact damage in stainless steel fibre metal laminates prior to metal fracture. Compos. Struct. 2015, 119, 777–786. [Google Scholar] [CrossRef]
  164. Chen, Y.; Wang, Y.; Wang, H. Research Progress on Interlaminar Failure Behavior of Fiber Metal Laminates. Adv. Polym. Technol. 2020, 2020, 3097839. [Google Scholar] [CrossRef]
  165. Ferro, C. Wind Turbine Propellers Boost Balsawood Sales. Available online: https://en.unav.edu/web/global-affairs/las-helices-de-los-aerogeneradores-disparan-las-ventas-de-madera-de-balsa. (accessed on 30 May 2023).
  166. Milne, A.; Amirfazli, A. The Cassie equation: How it is meant to be used. Adv. Colloid Interface Sci. 2012, 170, 48–55. [Google Scholar] [CrossRef]
  167. Cassie, A.B.D. Contact angles. Discuss. Faraday Soc. 1948, 3, 11–16. [Google Scholar] [CrossRef]
  168. Van Oss, C.J.; Chaudhury, M.K.; Good, R.J. Interfacial Lifshitz-van der Waals and polar interactions in macroscopic systems. Chem. Rev. 1988, 88, 927–941. [Google Scholar] [CrossRef]
  169. Zisman, W.A. Relation of the Equilibrium Contact Angle to Liquid and Solid Constitution. In Contact Angle, Wettability, and Adhesion, Advances in Chemistry; American Chemical Society: Washington, DC, USA, 1964; Volume 43, pp. 1–51. [Google Scholar]
Figure 3. Wind Turbine Blades incur one of the highest downtimes, and repair costs of all wind turbine components. Both (a,b) adapted from [24]. This proportion is likely to increase with the introduction of direct drive turbines which do not have a gearbox.
Jcs 08 00023 g003
Figure 4. (a) Cross Section of Balsa Log showing how balsa blocks are cut. End grain blocks are cut from from balsa logs in an A-grain manner. B and C grain sheets are used for other purposes. Own Diagram. (b) The grain direction of end-grain balsa block is always perpendicular to the fibers when used as a core in a sandwich panel. Own diagram.
Jcs 08 00023 g004
Figure 5. End grain balsa blocks joined by scrim are joined by scrim to keep blocks together for handling purposes. (a) This scrim allows some degree of curvature. Taken from [33], used with author’s permission. (b) Glass fiber scrim on end grain balsa block. Used with author’s permission. [34].
Jcs 08 00023 g005
Figure 6. (a) SEM of Balsa wood. In balsa wood, air and resin can only pass through vessels, not rays & fibers. Adapted from [36] with permission from publisher. (b) Balsa block as seen from the side. The vessels are clearly visible. absorb resin. Adapted from [37] with author’s permission.
Jcs 08 00023 g006
Figure 9. Contact Angle measurements. The lower the droplet contact angle, the higher the wettability of a surface. Picture from.
Jcs 08 00023 g009
Figure 10. Diagram of surface treatment methods, as categorized by [71,102,103,104]. Not all methods are applicable to composite fiber and core materials.
Jcs 08 00023 g010
Figure 11. The temporary effect of surface treatment is shown by water contact angle measurements increasing over time on various thermoplastic polymers subject to the different types of plasma treatment. Dotted lines are for untreated surfaces. Adapted from [118], used with author’s permission.
Jcs 08 00023 g011
Figure 12. Schematic Diagram of Dielectric Barrier Discharge (DBD), Plasma Jet, and Corona plasma treatment systems. Adapted from [134], used with publisher’s permission.
Jcs 08 00023 g012
Figure 13. SEM image of wetting behavior of PPESK resin on Twaron fiber. (a)—untreated, (b)—6 s, (c)—12 s, (d)—18 s. Hardly any resin sticks on the fiber surface in (a), but increases at 6 s and 12 s. Resin is most evenly covered at 12 s. At 18 s, the resin is not uniformly distributed on the fiber surface. Picture from [91], used with publisher’s permission.
Jcs 08 00023 g013
Figure 14. Quantifiable Scientific Variables involved in surface treatment of sandwich panel materials and most likely methods of measuring these quantifiable variables.
Jcs 08 00023 g014
Figure 15. (a,b) Common Sandwich Composite Failure Modes under impact. Both Diagrams adapted from [143].
Jcs 08 00023 g015
Figure 17. Impact damage of Balsa core E-glass/epoxy sandwich at 15 J (top) and (bottom) 75 J. Balsa core sandwich exhibits far greater debonding area at the non-impacted side than the impacted side, and the difference increases greatly with impact energy. Adapted from [156].
Jcs 08 00023 g017
Figure 18. Graph of facesheet-core disbond area versus low-velocity impact energy on end grain balsa, foam and webcore sandwiches. Balsa exhibits shows much Adapted from [158].
Jcs 08 00023 g018
Figure 19. Post-impact photos of sandwiches with balsa core thickness of 15 mm (a) and 25 mm core (b) after impact at 10 J. Facesheet-core Debonding is the first damage mode to occur. Taken from [159], used with publisher’s permission.
Jcs 08 00023 g019
Figure 20. Cork has lesser permanent dent depth post-impact than PMI foam when not impacted by perforation. (a) note the PMI foam (bottom) acts like a plug and helps cause debonding between the non-impacted facesheet and core by pushing the non impacted facesheet. Taken from [57]. (b) force-displacement curves and (c) force-time curves.
Jcs 08 00023 g020
Table 1. Summary of balsa resin uptake reduction coatings. Data taken from Corelite (PC11) and 3A Composites (Baltek SealX) and Gurit (Balsaflex Lite) marketing literature [28,29,30]. Note the following acronyms: FP—flexible panel, RP—rigid panel, thk—thickness, NG—not given.
CoatingBaltek Al600/10 Baltek SealXBalsaflex LiteCorelite PC11Corelite PC11 Pro
Type of PanelFP 25 mm thkRP, thickness not givenBalsaflex 150 155 kg/m3 FP 25 mm thk “Typical balsa sheet of non-coated wood core”, FP, thk NG
Untreated balsa Resin uptake3500 g/m2Not given3800 g/m21900 g/m21900 g/m2
Treated balsa resin uptake1800 g/m2Not given2100 g/m21020 g/m2450 g/m2
Claimed max % reduction50%80%40%46%76%
Table 2. Datasheet properties of uncured Corecork and some balsa products. Taken from datasheets of Amorim Corecork, Corelite, 3A Composites & Gurit [58,59,60,61]. Note that NS stands for No standard given and NG stands for Not given.
Amorim CorecorkCorelite3ACompositesGurit Balsaflex
GradeStandardNL10NL20Balsasud ULBaltek SB 100110150
Property/Unit
Uncured Properties
Density/kgm−3# ISO 7322 [61],
* ASTM C271 [62],
! NS
120–180 # 170–235 #100 *148 *110–125, avg 110 !135–176, avg 155 !
Resin Uptake/kgm−3-270170NGNGNGNG
Compressive Strength/MPa# ASTM C365 [63], * ISO 844 [64]0.3 #0.5 #6.53 *9.2 *8.3 *13.0 *
Comp. Modulus/MPaASTM C365 5.1620362526 * 2130 #3518 #
Shear Strength/MPaASTM C273 [62]0.90.91.882.62.0 #2.8 #
Shear Modulus/MPaASTM C2735.95.9110187103 #163 #
Tensile Strength/MPaISO 7322>0.2 #>0.47.5 #NGNGNG
Tensile Modulus/MPaASTM C297NGNG2238NGNGNG
CTE @ RT/10−6 per °CASTM E831-06 [65]110110NGNGNGNG
Thermal Conductivity W/m.KISO 8301 0.04080.05070.048 *0.066 *NGNG
Cured Properties
Resin absorption, g/m2 mm-270170NGNGNGNG
Moisture Absorption %ASTM C272 [66]<4<4NGNGNGNG
Also, the symbols !, #, * refer to the standard that the manufacturer refers to in their datasheet when listing a certain property.
Table 3. Comparison of Sandwich Panel Fabrication Methods. Info taken from [62,63].
MethodProcessesTotal No. of ProcessesJoining Mechanism
Co curing2 fiber facesheets and core cured in the same mold, in the same process1Chemical cross-linking
Co bonding1 facesheet and core cured together, another facesheet cured separately, then both joined together with adhesives 3Adhesive bonding
Secondary bondingEach core and facesheet is cured separately, then 3 joined together with adhesives.4Adhesive bonding
Table 4. Categorization of surfaces as hydrophobic or hydrophilic based on water droplet contact angle [81].
Wettability ClassificationContact Angle and Remarks
Strongly HydrophilicClose to 0°
Less Strong hydrophilic≤90°
Hydrophobic90–150°
SuperhydrophobicAbove 150°. Water droplets simply rest on the surface without actually wetting to any significant extent.
Table 5. Summary of various methods for calculating surface energy of a surface based on droplet contact angle measurements. Methods are listed in alphabetical order, not all of them are used in the context of surface treatment of natural materials. Some others, like the Cassie–Baxter and Zisman method are not relevant to surface modification of natural or composite materials and are covered in the Appendix A.
Equation Name EquationRemarks
Extended Fowkes/OWRK
Equation
[82,83,84]
                 γ L ( 1 + c o s θ ) = 2 [ ( γ L D γ S D ) 1 2 + ( γ L P γ S P ) 1 2 ]
where:
-
θ is the droplet contact angle in degrees
-
γL is the liquid surface tension: γ L P is its polar component, and γ L D is its dispersive component in mN/m
-
γS is the solid’s surface free energy: γ S P is its polar component, and γ S D is its dispersive component in mN/m
If the dispersive fluid used has a γ L P of zero, γ S D can be easily found and the equation can be solved easily.
Also referred to as the Owens–Wendt–Rable–Kaelble (OWRK) or geometric mean method.
Requires a minimum of 1 polar and 1 dispersive fluid.
Mathematically equivalent to the Owens Wendt method, but only requires a minimum of 2 liquid measurements to find the polar and dispersive components of the solid’s surface free energy.
Fowkes Equation
[84,85]
Based on Young’s Equation γ S = γ S L + γ L c o s θ
Fowkes defines γSL by the equation below:                  γ S L = γ L + γ S 2 [ ( γ L D γ S d ) 1 2 + ( γ L P γ S P ) 1 2 ]
The Extended Fowkes method is typically used in practical calculations.
Fowkes equation interprets the dispersive and polar solid-liquid interactions as the geometric mean of the dispersive (nonpolar) and polar component of surface free energy, without elaborating in more detail.
Owens Wendt Equation
[83,84]
                 γ L ( 1 + c o s θ ) 2 ( γ L D ) 1 2 = ( γ S P ) 1 2 ( γ L P ) 1 2 γ L D 1 2 + ( γ S D ) 1 2  
Droplet measurements of at least 5 different liquids are needed.
Plot a best fit linear graph of y = γ L ( 1 + c o s θ ) 2 ( γ L D ) 1 2 , x = ( γ L P ) 1 2 γ L D 1 2 using the droplet measurements.
Surface Free Energy polar and dispersive Components can be found by using the best fit line Gradient m = ( γ S P ) 1 2 , and y intercept c = ( γ S D ) 1 2
Mathematically equivalent to the Extended Fowkes Equation shown above. Based on Good’s & Young’s Equation.
Requires a minimum of 5 different liquids.
Extended Fowkes is often preferred over Owens Wendt as it requires much less experimental data collection (2 vs. 5 liquids).
Wu Equation
[82,86]
                 [ γ L d γ s d γ L d + γ s d + γ L p γ s p γ L p + γ s p ] = 0.25 ( 1 + c o s θ )
where:
-
θ is the droplet contact angle in degrees
-
γL is the liquid surface tension: γ L p is its polar component, and γ L d is its dispersive component in mN/m
γS is the solid’s surface free energy: γ s p is its polar component, and γ s d is its dispersive component
Also referred to as the harmonic mean method. Based on Wu’s findings where OWRK method underestimated the polar interactions in molten polymers.
Requires a minimum of 1 polar and 1 dispersive fluid.
Wu equation is best used for polymers with low surface free energies of up to 30–40 mN/m.
Young’s Equation
[84,87,88]
                       γ S = γ S L + γ L c o s θ
where:
-
θ is the droplet contact angle in degrees,
-
γS is the Surface Free Energy of the solid in mN/m
-
γSL is the Interfacial Tension between solid and liquid in mN/m
-
γL is the Surface Tension of the Liquid in mN/m
-
Most other calculation methods are based on Young’s equation.
Valid for 3 phase systems in thermodynamic equilibrium for ideal (smooth and chemically homogenous) solids and pure liquids.
Not to be confused for the Young Laplace fit, which describes the sustained capillary pressure difference at the interface between two static fluids.
Table 6. Literature review compilation of surface free energies of some materials without any surface treatment. Materials are shown in alphabetical order. Common materials used in fiber composites and sandwich composites are carbon fibers, glass fibers, balsa, PMI, and PVC foam. Note: GM stands for Geometric Mean, and HM stands for Harmonic Mean.
Substrate Materials (Who) γ S D (mN/m) γ S P (mN/m)γS (mN/m)
Aramid Fibers % [90]34.38.542.8
Aramid (Twaron) Fibers ! [91]39.111.550.6
Balsa [92]42.331.7344.07
CaCO3 $ [93]54.5153.4207.9
Carbon Fiber, PAN based [94]21.40.021.4
Cork ! [95]—OWRK method on cork, likely agglomerate sheet 18~018
Cork ! [96]—First Quality Cork, measurements taken on surface perpendicular to tangential direction, taken at 24 °C25 (GM)
22 (HM)
6 (GM)
11 (HM)
31 (GM)
33 (HM)
Cork $ [77]—Cork powder (Champcork Company) ground to 25 mesh, type of cork not specified38 @ 40 °C
35 @ 50 °C
34 @ 60 °C
31 @ 70 °C
Not mentioned in paperNot Applicable
Cork ! [97]—Cork agglomerate laminated with a polymer membrane7.43.510.9
E-Glass Fibers ! [98]—E-glass fibers surface treated with silane coupling agent γ-methacryloxypropyltrimethoxysilane 31.5 @ 0.0%
29 @ 0.1%
28.5 @ 0.2%
28 @ 0.3%
~27.5 @ 0.4%
27.5 @ 0.5%
31.5 @ 0.8%
2.5 @ 0.0%
9.5 @ 0.1%
11 @ 0.2%
12.5 @ 0.3%
15 @ 0.4%
14 @ 0.5%
5 @ 0.8%
34 @ 0.0%
38.5 @ 0.1%
39.5 @ 0.2%
40.5 @ 0.3%
43 @ 0.4%
42 @ 0.5%
5 @ 0.8%
E-Glass Fibers [98]—untreated26 @ 0.0%531.5
E-Glass Fibers [98]—PVA sizing26.5733.5
E-Glass Fibers [98]—polyester sizing241337
E-Glass Fibers [98]—epoxy sizing29.59.528
PET bulk material [99]38.42.741.1
PMMA ! bulk material [93]34.35.840.1
PP ! bulk material [93]32.50.933.4
PVC ! bulk material [99]39.72.241.9
SiO2 # [93]94.7163.0257.7
Talc # [93]49.390.1139.4
Note Contact Angle measurement technique: ! → sessile drop using Goniometer, $ → Inverse Gas Chromatography, # → Gravimetric measurement, % → Micro Wilhelmy.
Table 7. Types of liquid chemical treatments used on natural fibers and their function. This paper contains the most commonly used research papers. Treatments are listed in alphabetical order.
Typical Reagents Main PurposeRemarks
Acetylation [103]Acetyl groups (CH3COO)Improve adhesion to nonpolar matrix materials (e.g., PP) by increasing hydrophobicity—replace polar OH groups near cell wall with less polar acetyl groups
Alkali Treatments [103]NaOH
-
Remove lignin, hemicellulose, wax, oils, and other compounds which hinder adhesion
-
Increase surface roughness

Increase number of reactive sites
OH functional groups on fibers replaced with O-Na groups
Benzoylation [102] Benzoyl chloride (C6HCOCl) Decrease hydrophilicity and moisture absorption of natural fibers—replace polar OH groups near cell wall with less polar benzoyl groupsNormally used in conjunction with alkali treatment
Enzyme
[111]
Various EnzymesEnzymes digest waxy layer, modify fiber itself.Tensile strength increases of 5–45% reported in abaca fibers.
Graft Copolymerization [102]VariousGrafting of monomers onto cellulose backbone of natural fibers, such as vinyl and allyl ethers
Isocyanate [102]−N=C=O functional groupActs as a coupling agent—Forms strong covalent bond with hydroxyl groups in cellulose and lignins
Maleated coupling [111]Maleic anhydrideModifies both fiber surface and polymeric matrix to improve interfacial bonding and mechanical properties. Often used on natural fibers
Permanganate treatment [102]KMnO4 solution in acetoneMnO3 ion formation leads to cellulose radical, boosts adhesion through free radical reactions with OH groups.
Silanization [102]Silane (SiH4) compoundsSilane acts as a coupling agent—which binds to matrix as well as hydroxyl groups in the fiber. Commonly used on glass and natural fibers
Table 8. Summary of some chemical treatment methods of composite fibers and cork in the research literature.
Fiber/Core/WhoTreatment MethodKey findings
Cork sheets 200 × 100 × 12 mm * [95]Silanization: dip cork in silane solution (1% aminopropyltriethoxysilane in 50 vol% ethanol/water solution adjusted to pH 8) for 30 min, then use compressed air to remove fluid and the dry cork for 3 h in oven.
Fabrication—secondary bonding with epoxy.
Treated vs. untreated cork:
Reduced total (10 vs. 18 mN/m) and dispersive (9 vs. 18 mN/m) surface energy.
Peel test strength—13% lower. Increased Young’s modulus and reduced damping.
Cork granules
[112]
Silanization: immerse in silane-methanol or silane-acetone solution for 30 min, then dry in the oven at 60 °C for 3 h.
Then mix 5 wt% with PP and extrude
Treated vs. untreated:
Contact angle: increase by 15° (methanol) and 20° (acetone). Charpy (ASTM D6110) impact energy: No change. Tensile stress: +6%
Cork granules
[112]
Alkaline treatment with NaOH: immerse cork granules for 1 h in NaOH-distilled water of varying concentrations.
Then mix 5 wt% with PP and extrude
Treated vs. untreated:
Contact angle: <1° change in both polar and dispersive, Mechanical properties: tensile strength—4–6%, tensile modulus—4–8%
Carbon Fiber
[113]
Oxidation treatment: Immerse fibers for 5 h in boiling HNO3 solutionIncrease in surface oxygen and nitrogen content and increased surface energy of fibers
Carbon Fiber
[114]
Silanization: Soak for 8 h in 1 mMol silane solution for 8 h at room temp, then wash off surface residues with deionized water, then dry at 110 °C for 10 min, then cool in vacuum desiccator
Jute Fabric
[109]
Alkali + Silane: Fabric dipped in 5% NaOH solution for 1 h, then wash with 1% HCl solution for neutralization then wash with distilled water. Then dried in oven at 70 °C for 3 h. Then soak fibers for 45 min in solution of 0.5 wt% silane coupling agent [3-(2-aminoethyl amino) propyl trimethoxysilane] in acetone. Laminates made from Alkali + Silane treated fibers exhibited 25% higher ILSS than laminates with untreated fibers
Glass and Carbon Fibers
[115]
Silanization Surface Treatment and fabrication process:
  • Carbon (CF) and glass fibers (GF) dried for 2 h at 110 °C to get rid of humidity which can cause bubbles in composite.
  • Silane A1100 solution brushed gently across fiber surfaces, then left to dry at room temperature for 5 h.
  • Fibers placed in an aluminum mold of dimensions of 250 × 90 × 4 mm
  • Hand layup fabrication: Epoxy matrix (Easy Composites, UK) of tensile strength 70 MPa brushed onto fibers and left to dry.
Mech tests: ISO 527-4 type 2 tensile tests conducted at 25 °C.
Treated vs. untreated cured laminates:
Glass Fiber: 8–10% higher Tensile strength and Young’s modulus. Attributed to the primary amine in APS Silane reacting with epoxy, plus formation of H-bonds between silanol group and oxide surfaces in silica, which leads to M-O-Si oxane bond with the fiber.
Carbon Fiber: Decreases of up to 17% in tensile strength. Attributed to the absence of reactivity and oxane bond formation between silane and CF.
* Not mentioned in the specific paper, but cork sheets of that size are typically cork agglomerates since it is difficult to find natural cork sheets of that size without naturally occurring defects.
Table 9. List of heterogenous (surface) reactions. Adapted from [117].
NameReactionsDescription
EtchingAB + Csolid → A + BCvapourMaterial erosion
AdsorptionMg + S → Ms
Rg − S → Rs
Molecules (Mg) or radicals (Rg) from a plasma come in contact with a surface (S) exposed to the plasma and are adsorbed on surfaces
DepositionAB → A + BsolidThin film formation
RecombinationS − A + A → S + A2
S − R + R1 → S + M
Atoms (A) or radicals (R) from the plasma can react with the species already adsorbed on the surface to combine and form a compound.
Metastable de-excitationS + A * → AExcited species (denoted by *) collide with a solid surface and return to the ground state.
SputteringS − B + A+ → S+ + B+ + APositive ions accelerated from the plasma towards the surface with sufficient energy can remove an atom from the surface.
PolymerizationRg + Rs → Ps
Mg + Rs → Ps
Radicals in the plasma (Rg) can react with radicals adsorbed on the surface (Rs) and form polymers (Ps).
Table 10. Comparison of advantages and disadvantages of LPPC, corona, and atmospheric plasma systems. Adapted from [73,135].
LPPCAtmospheric Plasma, Corona, and DBD
Advantages
-
Entire part treated during processing,
-
Can achieve low takt times on parts with large surface areas
-
Easier to control the concentration, composition and process chemistry of the gases in enclosed chamber under vacuum [77]
-
able to achieve higher and more uniform surface free energy levels and part cleanliness than APPT
-
works well with corrosive service gases,
-
vacuum chamber provides operator isolation if toxic/corrosive gases used
-
Allows continuous processing of parts,
-
No need for expensive vacuum chambers or pumps
-
(Corona only) No need to procure gases
-
(Except DBD) Nozzle can be easily mounted on robots for automated production
Disadvantages
-
Need for expensive vacuum chamber and pumps
-
Batch production only
-
(Except DBD) Small processing area during treatment—large takt times
-
large volume of gas required to process
-
limited selection of compatible process gases
-
Ventilation of working area required for safety
Table 12. Comparison of Impact Damage on Metals versus fiber composites. Information taken from [137] unless otherwise cited.
AspectMetalsFiber Composites
DetectabilityEasy to detect as damage is typically starts on the impacted surface [142] Difficult to detect. This is often referred to as Barely Visible Impact Damage (BVID) as damage often occurs as internal delamination or on non-impacted surface but rarely shows on impacted surface.
Energy absorption by plastic deformationHigh due to ductility of metal. Often large strains of >10% at constant yield stress before work hardening occurs. Low. Most composites are brittle, thus cannot absorb much energy by plastic deformation.
Table 14. Summary of various research literature on impact damage of cork-cored sandwich composites. Note: SB stands for secondary bonding, VARI stands for vacuum-assisted resin infusion, FSNT stands for final sandwich nominal thickness, EG stands for End-Grain, NEG stands for Non-End-Grain, SB stands for secondary bonding of already cured facesheet and cores, VARI stands for vacuum assisted resin infusion, NS stands for no standard explicitly followed, DWT stands for drop weight tower, HI stands for hemispherical impactor tip, 4PB stands for 4 point bending, and QSI stands for quasi-static indentation. NG stands for Not Given.
Who/Fabricated Sample Impact Test MethodKey Findings (U—Unimpacted)
[56]
SB under pressure, epoxy adhesive, FSNT 10.5 mm
  • Facesheet: 2 layers 0–90° CF-Epoxy prepreg
  • Core—various types:
    Self-made Cork agglomerate of epoxy + cork granules of varying sizes
    Rohacell FX PMI foam
  • SB adhesive: epoxy
ASTM D7136, Imatek DWT
Drop height 0.8 m, impact velocity 4 ms−1, Impact energy 23 J
Also done: ASTM C393 4PB
Cork has better impact performance than PMI foam:
Cork (vs. PMI foam):
Impactor rebounds (versus no rebound) and higher peak force levels (3 vs. 2kN)—indicating cork shows rapid response to transient loads.
Much less visible damage area—slight superficial dimple (vs. perforation of core material and destruction of core foam).
[53]
SB: Compress with weights without vacuum bagging, SikaForce 7888 L10 (VP) PU adhesive, FSNT 15 mm
  • Facesheet: VARI 2 layers + 45° biaxial E-glass + epoxy
  • Core—Either:
    Coarse grain cork granules
    Corecork NL25
    Rohacell FX PMI foam
    C70.75 PVC foam, 80 kg/m3
    Rigid polyether-based PUR foam, density NG
NS, Rosand IFW 5 HV DWT
Specimen size 60 × 60 mm2
Impact energies: 10, 15, 20, 25, 30, 40 J
Also done: ASTM C393 4PB
Flexural: Both cork cores exhibit lower flexural stiffness than thermoplastic foams
Impact: Cork has less damage than thermoplastic foams
-
<15 J—similar behavior for all cores
-
20–25 J—externally visible damage area is much smaller for cork than thermoplastic foams
-
>30 J—fiber failure also occurs in both PVC and cork specimens
[54]
Method: Co-cured vacuum bagging, FSNT: 35.53–36.97 mm
  • Facesheet: 4 layers LT800 E-glass 0/90 Biaxial
  • Core: Either
    Corecork NL10, thk 30 mm
    Corecork NL20, thk 30 mm
  • Divinycell H100 PVC foam 100 kg/m3, thk 30 mmBaltek 100 EG Balsa 153 kg/m3, thk 31.7 mmResin: Crystic 489 PA isophtalic polyester with Butanox M-50 hardener
Cured NL10 laminate displayed a strange smell, suggesting curing issues
ASTM D7136, Rosand IFW 5 HV
Impact energies: 50, 100, 150, 200, 300 J
Specimen size 150 × 150 mm2
Also done:
  • ASTM C393 4PB
  • ASTM D6264 QSI, HI ⌀ 16 mm and speed 0.2 mm/s
Jcs 08 00023 i006
NL20 shows complete separation of non-impacted facesheet during impact, likely due to higher strain.
Cork laminates have potential for applications with impact requirements, with the downside of lower stiffness and higher weight than balsa and thermoplastic foams.
Both NL20 and Balsa show debonding at the non-impacted facesheet and core.
Correlation of QSI and impact tests: PVC, NL20, and Balsa behave similarly: QSI max force is 150% of max force during LVI. NL10—QSI max force 66% of impact max load.
[161]
Method: Co-cured VARI
  • Facesheets: 2 layers Toho Tenax HTS40 CF non-crimp fabrics
  • Core: Either
    7 mm PET3D Core,
    10 mm PET3D Core or
    7 mm PET3D and 3 mm Corecork NL20 Core
    PET3D—150 kg/m3 PVC Foam
  • Resin: Epicote MGS RIMR035c infusion epoxy
NS, Custom drop-weight machine, HI 25.4 mm (mass not given).
Flat sandwich panels of size 330 × 200 mm clamped at 2 edges with steel bars
Impact energies—39 and 53 J
Post LVI, C-scan, and visual inspection of panels to detect damage.
High energy absorption and rebound effect of cork significantly reduces energy absorbed by the rest of the structure.
Damage: VSD—Visible Small dent, VFR—Visible Facesheet Rupture, PGD—permanent global deformation, CSC—Core shear cracks, NC—No core shear cracks detected visually or by C-scan
Jcs 08 00023 i007
[55]
Comparison of composite structures subjected to post-LVI ballistic impact.
Structures compared are monolithic Texipreg E-glass epoxy and SB E-glass sandwich with cork core.
Monolithic: [0/90]8, thk 2.6 mm
Sandwich:
Each Facesheet: [0/90]4, thk 1.3 mm
Core: 2 mm Corecork
SB done by autoclave consolidation
NS, CEAST Fractovis Plus, ⌀ 20 mm HI with mass 5.62 kg
Impact energies: 25 and 40 J
High velocity (HV) (78–201 m/s) impact tests conducted on LVI impacted specimens, projectile residual velocity after perforation measured
Perforation did not occur for both impact energies in either material. Matrix cracks were the first damage introduced by transverse impact load.
Cork Sandwich (C) vs. Monolithic (M):
LVI Peak Loads: Slightly higher (higher is better, implies less damage)
LVI absorbed energy: At 25 J: roughly equal. At 40 J: −30%. (lower is better, implies less damage)
Post perforation projectile residual velocity after ballistic impact @ 200 m/s: C: −6%, 25 J: −14%, 40 J: −20%. (lower is better, implies better energy absorption)
Lambert-Jonas Ballistic limit / areal limit density: C: 4%, 25 J: 10%, 40 J: 25% (higher is better)
[42]
comparing effect of different temperatures on LVI performance of SB sandwich structures.
SB process: Apply bio-epoxy Elan-tech ADH 46.46 and cure for 24 h under constant load
Facesheets: Hot Compression Molded Polypropylene (PP) (2.2 + 0.1 mm thk) and Polypropylene Compatibilized (PPC) (2.1 + 0.1 mm thk), +4 layers of 360 kg/m3 twill Flax/Basalt hybrid fabric.
Core—15 mm thk, using either Divinycell HP-130 PVC Closed Cell Foam 130 kg/m3, Corecork NL 10 and NL 25
ASTM D7136
HI 12.7 mm, 12.055 kg for
Impact energies: 32.5 J, 65 J, 97.5 J, 130 J
Specimen size 150 × 150 mm2
Impact energy needed to cause perforation is measured.
Embrittlement occurs in both PVC and cork synthetic cores at −40 °C, leading to a larger crack on sample back face
Average PI at 32.5 J and 65 J: Cork NL10 and NL25 display less PI depth than HP-130 at both 32.5 J and 65 J.
Perforation energy in J (higher is better):
Jcs 08 00023 i008
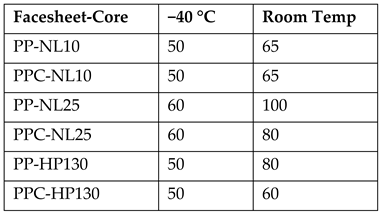
[57]
Comparison of LVI performance of cork and PMI foam sandwich.
SB: carried out at “uniform pressure”, FSNT—9.7 mm
  • Facesheet: 2 layers 0–90° CF-Epoxy prepreg
  • Core—various types:
    Self-made Expanded cork
    Rohacell FX PMI foam
  • SB adhesive: Loctite 1C-LV epoxy
ASTM D7136, Instron Dynatup 9200, HI ⌀ 12.7 mm
Impact energies: 10 J
Specimen size 150 × 150 mm2
Also done:
  • ASTM D7250 3 point bending
  • Damping—ASTM E756-05
Cork has longer average impact time than PMI foam (13 ms vs. 9.5 ms)
Both sandwiches exhibit similar planar damage areas but cork has much smaller average dent depth than PMI foam (3.4 vs. 7.1 mm). See Figure 20.
Rebound: HI rebounds past original impact point for cork, HI does not for PMI.
Damage:
-
Cork: Bottom facesheet intact and no visible facesheet-core debonding
-
PMI: piece of foam cracks off under impactor and pushes it into bottom facesheet, causing large facesheet-core debonding at bottom.
Disclaimer/Publisher’s Note: The statements, opinions and data contained in all publications are solely those of the individual author(s) and contributor(s) and not of MDPI and/or the editor(s). MDPI and/or the editor(s) disclaim responsibility for any injury to people or property resulting from any ideas, methods, instructions or products referred to in the content.

