Abstract
Polymer–matrix composites (PMCs) filled with graphene nanoplatelets (GNP) are ultralightweight combined with the ability to perform a wide range of functions. These materials are interesting for many applications in space environments, including the monitoring of degradation caused by radiation exposure. Recently, the growing interest in outer space exploration, by both unmanned probes and manned space vehicles, has encouraged research to make great strides to facilitate missions, with one goal being to monitor and limit the impact of highly damaging radiation. With this perspective, we investigate the effects of simulated space conditions on the physico-chemical, morphological, and mechanical properties of elastomeric PMCs made from a polydimethylsiloxane (PDMS) matrix embedding pristine GNP or a hybrid graphene/DNA filler with high sensitivity to ionising radiation. An analysis of the PMC stability, outgassing, and surface modification is reported for samples exposed to solar radiation under high vacuum (HV, 10−6 mbar). The experimental results highlight the mechanical stability of the PMCs with DNA-modified GNP under solar radiation exposure, whereas the surface morphology is highly affected. On the contrary, the surface properties of PMCs with pristine GNP do not vary significantly under simulated space conditions.
1. Introduction
Polymer–matrix composites (PMCs) have been extensively investigated for different applications in the fields of electronics, automotive, and spacecraft systems due to their intrinsic lightweight character combined with their tailorable mechanical, thermal, optical, and electrical properties [1]. Traditionally, PMCs used for aerospace applications include glass/polyester materials in aircraft radomes [2], carbon/epoxy, aramid/epoxy, carbon/polyimide, and carbon/thermoplastic materials for structural elements [3,4,5]. More recently, the development of high-performance PMCs has shown a steady increase due to the interest in deep space exploration missions. In fact, these long-term missions require lightweight components made from materials that must be even more performing and durable in harsh space conditions [6,7,8]. The main hazards of the space environment include high vacuum, plasma, atomic oxygen, extreme temperatures, micrometeoroids, and solar radiation [9]. Each of these factors and their combined effect can irreversibly degrade material properties, thus compromising the outcome of the mission [10,11]. Therefore, determining how the outer space environment will affect materials by exposing them to simulated conditions, in laboratory, or in-flight experiments is crucial for these applications.
Several space environment tests on PMCs have revealed that high vacuum and solar radiation are the factors that mostly interact with these materials, inducing significant modifications to their properties [12,13]. Typical volatile components for polymer matrices include low-molecular-weight fragments, absorbed gases, or additives that, under high-vacuum conditions, can dramatically contaminate and decrease the performance of spacecraft materials [13]. After outgassing, contaminants typically affect optical surfaces, such as solar cells, windows, and thermal control surfaces, altering their reflectance and transmittance in terms of both spectral and directional components [14]. Solar radiation, particularly in the ultraviolet (UV) range (100–400 nm), can cause the breakage of chemical bonds, such as C–C, C–O, and functional groups [13], thus altering thermal and optical properties. This effect is mainly observed after the exposure of the PMCs to UV radiation at short wavelengths [15,16], where the energy is sufficient to induce scission of the polymer chains into smaller fragments. As an additional effect, free radicals generated from these interactions may combine with other free radicals, leading to crosslinking [17].
The surface degradation of PMCs while exposed to UV radiation strongly depends on the wavelength, intensity, and exposure time and has been the subject of many studies. Lu et al. demonstrated that the UV intensity and inclinations influence the local degradation rates of PMCs. These effects can be numerically simulated starting from experimentally determined global degradation rates [18]. Several studies have evaluated the rate of PMC degradation induced by UV in the presence of graphene-based fillers. Zepp et al. showed that graphene can modulate the UV degradation of epoxy [19]. Shehzad et al. studied the UV photodegradation of graphene/high-density polyethylene nanocomposites and observed a decrease in the photodegradation of the polymer matrix with the increase in the graphene filler content [20]. Conversely, it was demonstrated that other types of nanoparticles, such as ZnO and nano-clays, accelerate the oxidative degradation of polymer matrices [21,22].
One critical issue of materials performance in space is resistance to high levels of radiation. Among radiation-sensitive systems, UV detectors are mostly based on wide-bandgap semiconductor materials, which are characterised by their high sensitivity, mechanical strength, and chemical inertness [23,24]. These devices show some disadvantages, such as their high cost and sophisticated manufacturing processes. Many UV detection systems are fabricated using zinc oxide nanowires [25,26], which have a high sensitivity and fast response due to their large surface-to-volume ratio and Debye length comparable to their small size [27]. However, they also have complex fabrication and measurement procedures [28,29]. Other types of materials that have been proposed for UV detection in hostile environments, such as space, are silicon-based photodetectors and photomultiplier tubes (PMTs) [30,31]. In these cases, the main limit is the need for a high-voltage power supply and a cooled photocathode, which can lead to expensive and heavy systems. Other radiation-sensitive systems based on graphene/polymer nanocomposites have been developed, such as graphene oxide/polyvinyl chloride [32] and reduced graphene oxide/polymethyl methacrylate [33]. Nonetheless, the sensitivity of these graphene-based systems is limited by gamma radiation, and they have not been tested for use in space environments.
In this work, an investigation of the effects of high vacuum and solar radiation on the properties of elastomeric PMCs containing graphene nanoplatelets is reported. In previous reports from our group, it was demonstrated that PMC films containing graphene modified with deoxyribonucleic acid (DNA) can be used as UV-sensitive surfaces. In particular, they can be used to assess the damaging effect of UV-C radiation [34,35,36,37,38,39], because of the well-known sensitivity of DNA to ionising radiation [40,41]. Graphene nanoplatelets were selected for their high mechanical strength and electrical and thermal conductivity, whereas the PDMS matrix is flexible, chemically inert, and transparent to UV at short wavelengths [42]. For sensing applications, the flexibility of the matrix is a crucial feature for the successful reconstruction of the conductive carbon network and to fabricate wearable sensors. For this reason, polysiloxane-type polymers are often employed in PMCs [43]. Here, the effects of the space environment on the properties of GNP-DNA/PDMS nanocomposites were investigated by exposing them to solar radiation in a high-vacuum (HV) environmental chamber specifically designed to simulate space conditions [44,45]. Nanocomposites with 30 wt% GNP-DNA filler, the most promising in terms of radiation sensitivity [34], were selected for the tests. The results were compared with those of 15% GNP/PDMS samples containing the same amount of graphene but no DNA. This approach was followed to determine the role of DNA in the radiation sensitivity of the nanocomposites with hybrid filler. The results of this study are crucial for assessing the stability of elastomeric graphene/PDMS nanocomposites when used in radiation monitoring applications in space.
2. Materials and Methods
2.1. Materials
Graphene nanoplatelets (GNP, grade AO-4) were purchased from Graphene Supermarket (Graphene Laboratories Inc., Ronkonkoma, NY, USA) and used as received. The nanoplatelets had lateral sizes ranging from 3 μm to 7 μm and an average thickness of 60 nm, according to the manufacturer’s datasheet. Two-component polydimethylsiloxane (PDMS, Sylgard 184) was obtained from Dow Corning (Midland, MI, USA). Double-stranded DNA (product number 74782, protein content ≤ 1%, A260nm/A280nm ≥ 1.5) and isopropyl alcohol (IPA) were purchased from Sigma-Aldrich (Milan, Italy). Ultrapure water (resistivity 18.2 MΩ cm) was supplied by a Direct-Q3 UV purification system (Millipore, Molsheim, France).
2.2. Preparation of Graphene/PDMS Nanocomposites
Elastomeric PMCs were prepared using polydimethylsiloxane (PDMS) as the matrix and unmodified GNP or DNA-functionalised GNP (hereafter indicated as GNP-DNA) as the filler. The GNP/PDMS and GNP-DNA/PDMS samples were prepared by following the same procedure. Pristine GNP was used at a concentration of 15 wt%, whereas the GNP-DNA filler was used at a concentration of 30 wt%, with a mass ratio of graphene to DNA of 1:1. Isopropyl alcohol (IPA) was used for the preparation of the GNP-DNA dispersion. The PDMS-based prepolymer was added to the GNP-DNA dispersion in a polymer-to-solvent ratio of 3:4 (w/v), and the mixture was sonicated for 1 h in a P30H Elmasonic water bath (Elma, Singen, Germany). Next, the IPA solvent was extracted from the mixture under sonication in a vacuum for 5 h using a MZ 1C vacuum pump (Vacuubrand, Wertheim, Germany). The curing agent was then added using a ratio of 10:1 (base:curing agent by weight), and the mixture was gently mixed for several minutes. Finally, the composite mixtures were casted into molds and cured in an oven at 50 °C for 72 h. The curing temperature was selected to ensure a slow polymerisation process, which enables the formation of a highly flexible material [46] and also limits the formation of microvoids. Free-standing nanocomposite samples with a lateral size of 30 mm × 30 mm and an average thickness of 5 mm were prepared (Figure 1).
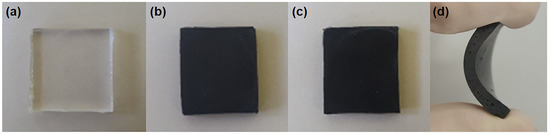
Figure 1.
PDMS-based nanocomposite samples (30 mm × 30 mm) after curing: (a) neat PDMS, (b) 15% GNP/PDMS, (c) 30% GNP-DNA/PDMS. (d) Lateral view of a flexed GNP/PDMS sample.
2.3. Tests under Simulated Space Conditions
The effects of high vacuum and solar radiation on the graphene/PDMS nanocomposites were investigated using the LARES-lab experimental setup [44,45]. This facility was developed to test the components of the LARES satellite in a simulated space environment according to the ESA standard requirements (ECSS, 2012; ECSS, 2002), and it is currently used for testing payloads and components for space applications. The testing chamber is a cubic vacuum chamber (internal edge of 60 cm), in which the sample is suspended and connected to a thermocouple (Figure 2). Five walls of the chamber are covered by a copper shroud painted with Aeroglaze Z306 (LORD Corporation, Cary, NC, USA), a vacuum-compatible black paint showing high absorptivity and emissivity (ε = 0.89, α = 0.97) [47]. A XDS5 dry scroll pump and a EXT255DX turbomolecular pump (Edwards Vacuum, Burgess Hill, West Sussex, GB) allow us to reach and maintain high-vacuum (HV) conditions at a pressure of ~10−6 mbar in the chamber. The turbomolecular pump and the pressure gauge communicate with a TIC instrument controller (connected to a personal computer and software (Edwards Vacuum, Burgess Hill, West Sussex, GB) to monitor the chamber pressure and the pump parameters. Solar radiation is simulated using a SpectroSun XT-10 simulator with the AM0 spectrum (Spectrolab, Sylmar, CA, USA) equipped with a OSRAM XBO 1000-W lamp (OSRAM, Munich, Germany) that projects a beam with constant irradiance (1366 W/m2) over a 12 × 12 cm2 surface. The lamp is positioned outside the vacuum chamber: access to light is allowed via a fused silica window with low absorption in the ultraviolet portion of the spectrum. Temperatures are recorded by platinum resistance thermometers (PT100) with two monitoring systems used to record data from up to 12 sensors.
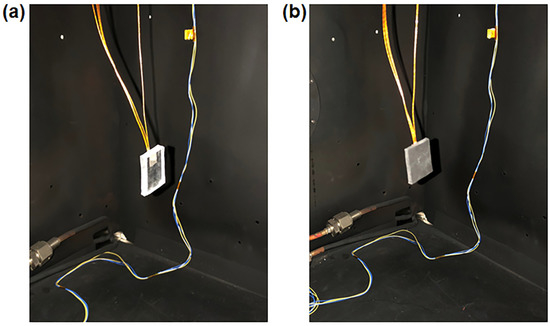
Figure 2.
Placement of a (a) neat PDMS and (b) 15% GNP/PDMS sample in the high-vacuum chamber of the LARES-lab experimental setup.
Samples of graphene/PDMS nanocomposites (30 mm × 30 mm) were tested individually. Neat PDMS samples were also tested as a reference. Each sample was weighed and immediately placed in the chamber set at the initial temperature of 20 °C. The test was run under high vacuum (~10−6 mbar) for 24 h with solar irradiation from the simulator lamp maintained for 4 h. At the end of the test, the chamber was brought to the initial ambient pressure and temperature (20 °C). Samples were weighed before and after removal from the chamber using an analytical Sartorius microbalance (model CPA225D) with an accuracy of 0.01 mg per 100 g of sample mass. The total mass loss (TML%) was calculated from the mass of the specimen measured before and after the test and expressed as a percentage of the initial specimen mass. The water vapour regained (WVR%) was calculated from the difference in the specimen mass, as measured after the test for TML and again after exposure to atmospheric conditions with humidity controlled at room temperature (23 ± 2 °C). For each type of nanocomposite, tests were also run under high vacuum but without solar irradiation to compare the effects of high vacuum and combined high vacuum/solar radiation on the materials’ properties.
2.4. Characterisation Methods
The surface electrical properties of the PMCs were measured on a PEDOT-coated glass substrate following a previously published procedure [34]. The surface resistivity was determined by electrical impedance spectroscopy (EIS) in the frequency range of 10 Hz–1 MHz using a Reference 600 Potentiostat/Galvanostat/ZRA instrument (Gamry Instruments, Warminster, PA, USA). Ten replicate measurements were carried out for each sample. Samples were measured in a custom-made ABS cell fabricated by 3D printing and designed with edges to hold two parallel electrodes (10-mm-wide copper strips) in place at the sample surface. The measurement cell was connected to the four probes of the potentiostat in a two-electrode configuration. A Faraday cage (Gamry Instruments, Warminster, PA, USA) was used to shield the measurements from undesired noise. Impedance data were fitted to a parallel RC circuit using the Gamry Echem Analyst software package. The electrical resistance (Rs) value from the fitting procedure was converted to surface resistivity () using the following equation:
where L is the distance between the two parallel electrodes, and D is the length of the electrodes in contact with the sample surface.
Surface morphology was investigated by scanning electron microscopy (SEM) with a VEGA II LSH instrument (TESCAN, Brno, Czech Republic) working at an accelerating voltage of 5 kV and a magnification of 500×. SEM images were acquired before and after the tests under simulated space conditions. MountainsMap software version 8 (Digital Surf, Besançon, France) was used to perform a three-dimensional (3D) topography reconstruction of the nanocomposite surfaces starting from pairs of SEM images acquired at two different tilt angles [48]. Specifically, images of the specimen at 0° (in-plane image) and at a tilt of 5° were used. Surface roughness (Ra) values were determined from the 3D maps by averaging the Ra values obtained for each reconstructed profile. A sampling step of 5 μm, corresponding to 115 profiles on a surface area of 575 μm × 575 μm, was used.
The thermal analysis was conducted using a DSC Pyris 1 instrument (PerkinElmer, Waltham, MA, USA) calibrated with high purity indium and tin materials. Samples (~5 mg) were sealed in aluminum pans with lids and investigated in the temperature range from −40 °C to 200 °C with a heating rate of 10 °C/min and under a constant flow of nitrogen (20 mL/min). The same heating conditions were previously applied to an empty pan to obtain a baseline that was subtracted from the sample data. Several samples (between 6 and 10) were analysed for each type of nanocomposite to ensure the reproducibility of the results. The values of peak temperature and enthalpy change (ΔH) were calculated from the DSC thermograms using the PerkinElmer Thermal Analysis software provided with the instrument.
A dynamic mechanical analysis was performed with a DMA1 instrument (Mettler Toledo, Greifensee, Switzerland) operating in a dual cantilever configuration, and the temperature was set to 25 °C. Sweep frequencies from 0.1 Hz to 100 Hz with five points for each decade were used for the test. Three rectangular specimens of 20 mm length, 6 mm width, and 4 mm thickness were cut from each material sample and tested.
The surface wettability was evaluated by contact angle (CA) measurements at the sample surface using two testing liquids (degassed ultrapure water and diiodomethane). Measurements were conducted with a DataPhysics OCA15Pro analyser (DataPhysics Instruments, Filderstadt, Germany) using the sessile drop method. A minimum of ten droplets (volume 3 μL) on different areas of the sample surface were examined. Contact angle values were determined by the Young–Laplace fitting method using DataPhysics SCA20 analysis software. The surface free energy (SFE) of the nanocomposites was calculated using the contact angle values measured with water and diiodomethane in the Owens–Wendt equation [49]:
where γs is the SFE of the solid under investigation, and γl is the SFE of the testing liquid. The apexes d and p indicate the dispersive and polar components, respectively, and θ is the measured contact angle between the solid and the testing liquid.
3. Results and Discussion
Graphene/PDMS nanocomposites were tested under a simulated space environment in order to investigate the effects of high vacuum (~10−6 mbar) and solar radiation exposure on their morphology and functional properties. Both types of nanocomposite, with unmodified GNP and GNP-DNA filler, were tested to discriminate the role of the DNA element on the materials’ responses to the harsh environmental conditions. The amount of GNP with respect to the PDMS matrix was fixed at 15 wt%, and the hybrid GNP-DNA filler was prepared using a 1:1 ratio by weight of DNA to graphene. The choice of filler concentration was based on previous results demonstrating a good response to UV radiation, in terms of the variation in the surface electrical properties, for silicone-based films containing 30 wt% GNP-DNA filler [34]. In this work, we first investigated the electrical properties of the nanocomposite films with GNP-DNA filler at concentrations in the range of 20–40 wt%. The variation of the surface electrical resistivity, as determined from EIS measurements, is reported in Figure 3. Data clearly indicate a threshold for GNP-DNA concentrations of between 20 and 30 wt% with resistivity values decreasing by 5 orders of magnitude to values below 104 Ω/sq. The 30% GNP-DNA/PDMS samples are more electrically conductive than the nanocomposites with lower filler loadings, and this is due to the higher degree of interconnections among the carbon fillers. In addition, we observed in previous work that the nanocomposites with GNP-DNA filler at 30 wt% showed the largest variation in surface resistivity upon UV exposure [34]. When increasing the GNP-DNA content to 40 wt%, the UV interaction with DNA became predominant over the radiation absorption by the graphene network, thus limiting the increase in electrical resistivity [34]. For concentrations higher than 40 wt%, the dispersion of the GNP-DNA filler in the PDMS matrix became difficult, leading to composites containing large nonhomogeneous features. Based on these results and due to their promising radiation sensitivity, the 30% GNP-DNA/PDMS nanocomposites were selected in this work for testing under a simulated space environment.
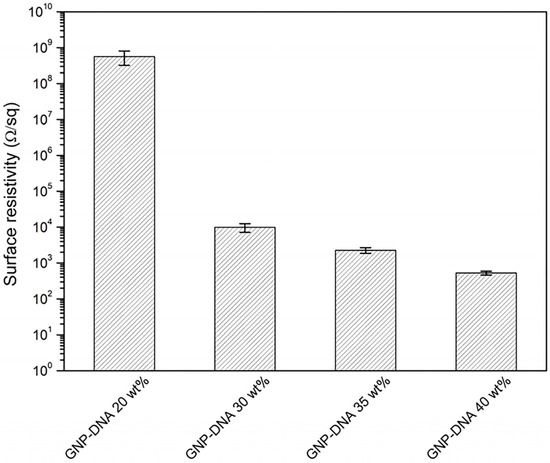
Figure 3.
Surface electrical resistivity of GNP-DNA/PDMS nanocomposites as a function of the filler concentration showing a threshold for the GNP-DNA content of between 20 and 30 wt%.
3.1. Morphology and Surface Topography Reconstruction by SEM
The morphology of the GNP-DNA/PDMS and GNP/PDMS nanocomposites was analysed by SEM before and after testing under simulated space conditions. In particular, 3D reconstruction was performed to investigate any effects on the sample surface topography. Figure 4 and Figure 5 show SEM images of the top surfaces of the nanocomposites and the corresponding 3D reconstructions performed with MountainsMap software, before and after testing under high vacuum and solar radiation exposure.
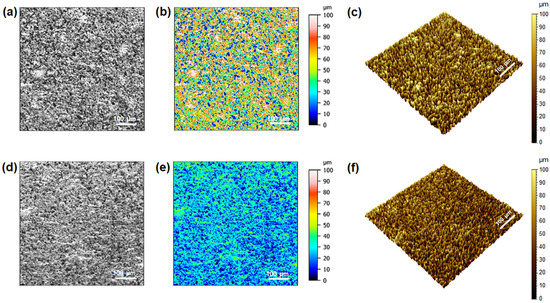
Figure 4.
SEM morphology analysis of the GNP-DNA/PDMS composite before (top) and after (bottom) exposure to simulated space conditions (HV and solar irradiation for 4 h): (a,d) SEM images at 0°; (b,e) colour maps obtained by surface topography reconstruction from image pairs at tilt angles of 0° and 5° (false colours indicate depth); (c,f) 3D rendering of the reconstructed surfaces.
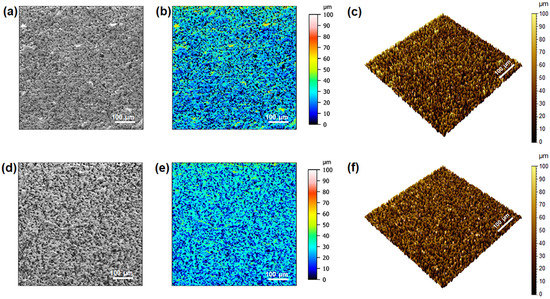
Figure 5.
SEM morphology analysis of the GNP/PDMS nanocomposite before (top) and after (bottom) exposure to simulated space conditions (HV and solar irradiation for 4 h): (a,d) SEM images at 0°; (b,e) colour maps after surface topography reconstruction from image pairs at tilt angles of 0° and 5° (false colours indicate depth); (c,f) 3D rendering of the reconstructed surfaces.
Before exposure, the GNP-DNA/PDMS sample (Figure 4a–c) showed more agglomerates and irregular features at its surface than the GNP/PDMS type (Figure 5a–c). After testing in a simulated space environment, the nanocomposite with the GNP-DNA filler (Figure 4d–f) was clearly affected by the exposure to solar radiation with its surface structure appearing much smoother than that of the nonirradiated samples (Figure 4a–c). This effect was quantified using the average surface roughness (Ra) values calculated from the 3D reconstructions of the surface topography (Table 1). The GNP/PDMS nanocomposite shows a negligible variation (−8.0%) of its surface roughness after exposure to solar radiation (Figure 5d–f), whereas a marked decrease (−59.0%) was observed for the GNP-DNA/PDMS samples (Figure 4d–f). This effect can be linked to the presence of the biological element that is highly susceptible to solar radiation damage, particularly to the ultraviolet component of the spectrum [40].

Table 1.
Average roughness values (Ra) and relative percentage variations (∆Ra/Ra) for the GNP-DNA/PDMS and GNP/PDMS nanocomposite surfaces extracted from the 3D topography reconstruction, before and after testing in a simulated space environment under high vacuum (HV ~10−6 mbar) and solar irradiation.
3.2. Thermal Analysis of Nanocomposites before and after Exposure
A thermal analysis by DSC was conducted on the graphene/silicone nanocomposites in a wide temperature range, from −40 °C to 200 °C, before and after testing in the thermal vacuum chamber. The chamber was maintained under high vacuum for 24 h, and solar irradiation was provided for 4 h intervals. Figure 6a,b show the DSC thermograms of the GNP-DNA/PDMS and GNP/PDMS nanocomposites, respectively, indicating the presence of an endothermic peak at temperatures above 140 °C only for the samples containing the DNA-modified GNP filler.
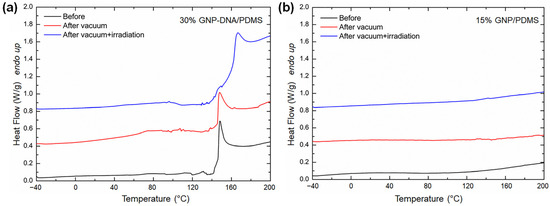
Figure 6.
DSC thermograms (heating rate 10 °C/min) for (a) 30% GNP-DNA/PDMS and (b) 15% GNP/PDMS nanocomposites before and after 24 h testing in a thermal vacuum chamber under high vacuum (~10−6 mbar) and combined high vacuum/solar irradiation (solar exposure time 4 h). Thermograms are vertically offset by 0.4 W/g for clarity.
For the nanocomposites that were not tested in a simulated space environment, the endothermic event occurred with a peak temperature of 148.3 °C. This event can be linked to the thermal degradation of the DNA element, in agreement with the DSC results for measurements on neat DNA samples in powder form [34]. Further results from the literature confirm that the decomposition temperatures of DNA in powder form are higher than those measured for DNA in solution (typically between 50 and 90 °C) and can reach values of up to 170 °C [50]. On the contrary, GNP/PDMS samples do not show thermal degradation peaks in the investigated range of temperatures (−40–200 °C) and are not affected by testing in a simulated space environment (Figure 6b). For the GNP-DNA/PDMS nanocomposites, experiments in a high vacuum environment without solar irradiation showed that the thermal stability of DNA did not change significantly, with a degradation peak occurring at 147.7 °C (Figure 6a). On the other hand, after testing under simulated space conditions including solar irradiation, the DNA decomposition peak shifted to larger values (167.1 °C), and the corresponding enthalpy change decreased significantly, from 38.7 J/g to 22.4 J/g. These variations can be ascribed to DNA crosslinking via reactive oxygen species generated by exposure to ultraviolet and blue light radiation [51,52]. The formation of DNA–polymer crosslinks results in the enhancement of the thermal stability of the GNP-DNA/PDMS nanocomposites, shifting the DNA decomposition peak to higher temperature values.
3.3. Outgassing Properties
The values of the total mass loss (TML%) and water vapour regained (WVR%) were determined by weighing the samples before and immediately after their removal from the thermal vacuum chamber. Table 2 summarises the results for neat PDMS and nanocomposite samples tested under high vacuum with and without solar irradiation. The GNP/PDMS nanocomposite was characterised by a TML value of less than 0.5%, even under solar radiation exposure, which makes it suitable for use in space environments. On the other hand, samples containing the GNP-DNA filler were characterised by a TML value exceeding the limit of 1.0% set for these applications [11]. By comparing the TML values of neat PDMS with those of the nanocomposites, it is evident that the outgassing phenomenon under solar radiation exposure can be ascribed to the filler, as the contribution of the polymer matrix was very low (TML% = 0.14). In particular, the nanocomposite with the GNP-DNA filler showed the highest total mass loss.
Table 2.
Total mass loss (TML%) and water vapour regained (WVR%) for neat PDMS, 15% GNP/PDMS, and 30% GNP-DNA/PDMS nanocomposites after exposure to a simulated space environment. High vacuum (HV): ~10−6 mbar for 24 h. Irradiation: solar spectrum for 4 h.
This result can be linked to the dehydration process promoted by high vacuum [53,54], which causes water release from the sample. Indeed, the biological DNA element is highly hydrophilic and might retain water vapour during nanocomposite assembly in Earth environments. In addition, over the course of the test under simulated space conditions, in particular under solar irradiation, the GNP-DNA/PDMS and GNP/PDMS nanocomposites reached temperature values of 94 °C and 98 °C, respectively (Figure 7).
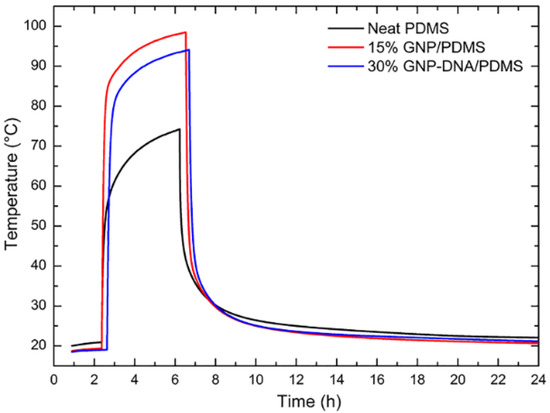
Figure 7.
Temperature profiles at the surface of neat PDMS and GNP/PDMS nanocomposites during tests under simulated solar irradiation in high vacuum (~10−6 mbar). Irradiation started 2.5 h after reaching the final pressure in the chamber.
The GNP/PDMS sample reached a higher temperature under irradiation than the GNP-DNA/PDMS nanocomposite. This is due to the much higher thermal conductivity of GNP [55] as compared to that of DNA, for which the thermal conductivity coefficient was estimated to be 0.3 W/mK [56]. The values of water vapour regained (WVR) were determined three days after the end of exposure to the simulated space environment. The results show a very low tendency for the neat PDMS and GNP/PDMS nanocomposite to absorb humidity from the surrounding environment, with WVR values of 0.04% and 0.06%, respectively. These values were not affected by exposure to solar radiation. A larger value of WVR (up to 0.25%) was measured for the GNP-DNA/PDMS sample after treatment in the thermal vacuum chamber. This value is consistent with the hydrophobicity decrease that occurs after testing and was determined from the surface wettability experiments described in the section below.
3.4. Effects of the Space Environment on Surface Wettability and SFE
The analysis of the surface wettability revealed a high degree of hydrophobicity for the PDMS-based materials with values of the water contact angle ranging from 116° ± 3° for neat PDMS to 121° ± 1° for the GNP-DNA/PDMS nanocomposites (Figure 8).
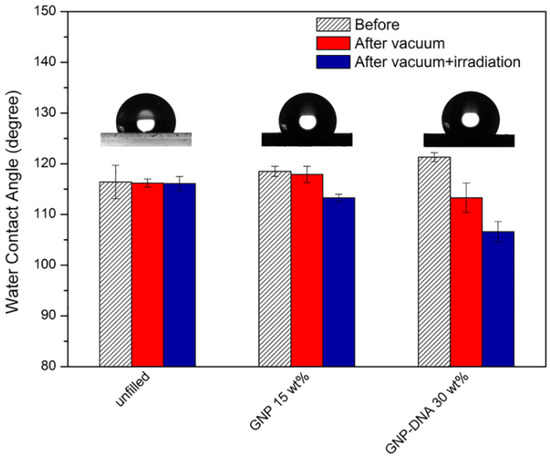
Figure 8.
Water contact angles of PDMS-based nanocomposites with 15 wt% of unmodified GNP and 30 wt% of GNP-DNA filler and comparison with neat PDMS before and after testing in a simulated space environment under high vacuum (~10−6 mbar, 24 h) with or without solar irradiation.
After testing in a simulated space environment, the neat PDMS samples showed approximately the same WCA values, whereas an increase in water wettability (decrease of WCA) was observed for both types of nanocomposite. The decrease in WCA values was larger after testing under simulated space conditions with solar irradiation, and this was particularly relevant for the nanocomposites containing the GNP-DNA filler. This behaviour can be explained by the changes induced by solar radiation exposure on the morphology of the PDMS-based nanocomposites. As discussed above, irradiation causes a decrease in the nanocomposite surface roughness (Table 1), especially for the GNP-DNA/PDMS type, which can lead to the measurement of a lower WCA value [57]. In addition, the analysis of the water vapour regained (Table 2) revealed a humidity recovery that was more significant for the GNP-DNA/PDMS nanocomposites. This phenomenon was also reflected by the lower values of WCA, i.e., increased surface wettability, which were measured for these nanocomposites after exposure to high vacuum and solar radiation.
The wettability changes in the nanocomposite samples after testing in a simulated space environment were further analysed by calculating the surface free energy (SFE) with the Owens–Wendt method [49]. Results in terms of the SFE and its dispersive and polar components are reported in Table 3. Before testing, the SFE value decreased with an increasing filler content, with a maximum value of 21.69 mJ/m2 for the sample without filler (neat PDMS) and a minimum value of 15.32 mJ/m2 for the 30% GNP-DNA/PDMS nanocomposite. The dispersive component (γd), which is related to the London or dispersive interactions among nonpolar molecules, was prevalent over the polar one (γp) in all samples.
Table 3.
Surface free energies (SFE) with dispersive (γd) and polar (γp) components for PDMS-based nanocomposites and neat PDMS before and after 24 h testing in a simulated space environment under high vacuum (HV ~10−6 mbar) and with or without solar irradiation.
After exposure to simulated space conditions, the SFE of neat PDMS did not vary significantly: this is consistent with the corresponding WCA values determined by optical tensiometry (Figure 8). On the contrary, the SFE of the PDMS-based nanocomposites showed changes both after high vacuum testing and with combined solar irradiation. In particular, the polar component of the SFE increased for both nanocomposite types and more significantly for the one with the GNP-DNA filler. These results confirm that, after testing in a simulated space environment with solar irradiation, the wettability changes in the nanocomposites can be related to radiation effects on the biological component. The increased affinity to water of the GNP-DNA/PDMS samples after testing in high vacuum combined with solar irradiation was confirmed by the marked increase in the polar component (γp) from 0 to 0.63 mJ/m2.
After observing that materials with the lowest initial SFE values (for example, those containing the GNP-DNA filler) experienced a larger outgassing phenomenon, we investigated the correlation between the SFE values of the untreated nanocomposites (before testing in the thermal vacuum chamber) and the outgassing properties of the materials after treatment under simulated space conditions. A power function was used to correlate the TML values and the initial SFE of the samples (Figure 9) using the following form:
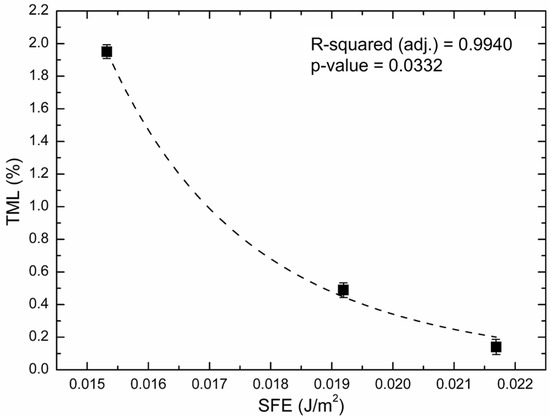
Figure 9.
Total mass loss (TML) of PDMS-based composites after experiments under simulated space conditions as a function of their initial surface free energy (SFE) determined by optical tensiometry with the Owens–Wendt method. The goodness-of-fit is indicated by the adjusted R-squared value (0.9940), and the statistical significance of the results is shown by the p-value (0.0332) from the ANOVA test.
The parameters A and B were determined by least-square regression analysis with Equation (3) in the form:
The values of A and B were found to be 2.64 × 10⁻¹² and −6.54, respectively, with an adjusted R-squared value of 0.9940. In addition, an analysis of variance (ANOVA) was performed, and a p-value of 0.0332 was found, confirming the statistical significance of the results (p < 0.05). We suggest that this type of correlation could be used to predict the outgassing properties of PDMS-based materials with different filler loadings from knowledge of their initial SFE values. This approach would be quite useful to compensate for the limited availability of TML data due to the expensive tests and equipment.
3.5. Exposure Effects on the Mechanical Properties of Nanocomposites Using DMA
The mechanical properties of the elastomeric graphene/polysiloxane nanocomposites were determined with a dynamic mechanical analysis (DMA). The results in terms of storage and loss moduli are reported in Figure 10. The storage modulus represents the stiffness of viscoelastic materials and, at room temperature, is related to the flexural modulus [58]. Figure 10a highlights larger values of the storage modulus for the GNP/PDMS sample. This can be ascribed to the mechanical interlocking caused by the presence of GNP, which restricts the polymer chain mobility [59]. A decrease in the storage modulus was observed starting from frequencies of greater than 50 Hz.
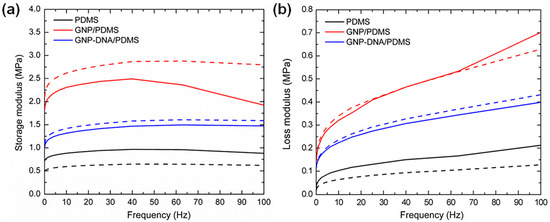
Figure 10.
Frequency dependence of the (a) storage modulus and (b) loss modulus investigated by DMA for the neat PDMS, 15% GNP/PDMS, and 30% GNP-DNA/PDMS samples before (solid lines) and after (dashed lines) treatment under simulated space conditions (high vacuum combined with solar irradiation for 4 h).
The GNP-DNA/PDMS nanocomposites showed smaller storage modulus values with respect to GNP/PDMS. This result can be explained by the lower interfacial adhesion between the GNP-DNA filler and the polymer chains [60]. In addition, the presence of GNP-DNA clusters, as highlighted by the SEM analysis and 3D reconstruction of the surface topography, might contribute to the decrease in the storage modulus. After exposure to simulated space conditions with solar irradiation, an increase in the storage modulus of the GNP/PDMS sample was observed. Indeed, solar radiation can promote the formation of free radicals in the polymer chains, as well as defects on the graphene surface, leading to major crosslinking reactions between the matrix and filler. This resulted in an overall enhancement of the interfacial adhesion in graphene/polymer nanocomposites in agreement with previous reports [61]. The improved interfacial adhesion between the matrix and filler for the GNP/PDMS sample after solar irradiation was also confirmed by the absence of storage loss decrease after 50 Hz (Figure 10a). The loss modulus is related to the capacity of the materials to dissipate energy. For composite materials, this value is affected by the strength of the filler–matrix interfacial adhesion, which facilitates more energy transfer in the form of heat [59]. In particular, the presence of GNP promotes heat conductivity, stress, and heat transfer between the filler and matrix [59]. In our study, the highest loss modulus occurred for the GNP/PDMS sample, as compared to neat PDMS and PDMS filled with GNP-DNA (Figure 10b). This result highlights the stronger filler–matrix interfacial bonding in GNP/PDMS with enhanced shear stress and energy dissipation. For the experiments conducted under simulated space conditions with solar irradiation, the variation in the loss modulus was negligible for the nanocomposites, whereas neat PDMS showed a significant loss of viscoelastic properties. Finally, the evolution of the damping factor tan δ as a function of the frequency was analyzed in DMA experiments. Figure 11 shows the frequency dependence of tan δ (the ratio between the loss modulus and storage modulus) for the PDMS-based samples before and after tests under simulated space conditions. A decrease in the damping factor occurred for the GNP/PDMS sample after the tests, confirming the increase in interfacial matrix–graphene bonding in this type of nanocomposite upon exposure to solar radiation [62]. Conversely, negligible variations for the neat PDMS and the GNP-DNA/PDMS samples were observed.
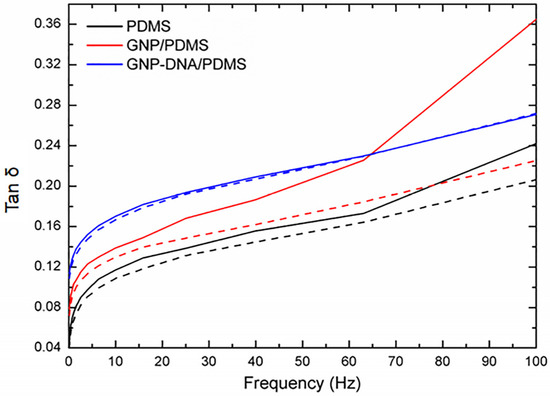
Figure 11.
Frequency dependence of tan δ investigated by DMA for the neat PDMS, 15% GNP/PDMS, and 30% GNP-DNA/PDMS samples before (solid lines) and after (dashed lines) tests under simulated space conditions (high vacuum combined with solar irradiation for 4 h).
4. Conclusions
Elastomeric composites made from PDMS filled with graphene nanoplatelets (pristine and DNA-functionalised) were realised and tested under simulated space conditions. The combined effects of high vacuum and solar radiation on the material properties were determined using complementary techniques before and after testing in a thermal vacuum chamber. SEM analysis with 3D surface reconstruction revealed a significant decrease in surface roughness after exposure only for the nanocomposite containing the DNA-GNP filler. Thermal analysis with DSC showed that the nanocomposites are thermally stable up to 140 °C. For the GNP-DNA/PDMS composites exposed to high vacuum and solar irradiation, there was a shift in the DNA degradation peak to higher temperatures. Regarding the surface wettability, solar irradiation resulted in a decrease in the WCA for the GNP-DNA/PDMS nanocomposites. Nevertheless, the nanocomposites maintained an overall hydrophobic character with values of WCA above 100°. This was also confirmed by the low values of WVR% measured after the tests in the thermal vacuum chamber. The PDMS nanocomposites with pristine GNP showed low outgassing features, even upon solar irradiation, reaching a TML% value of 0.5%, which is below the maximum required for space applications (<1% according to ECSS-Q-70-02A standard). A trend between the TML and the SFE values was found, which would possibly enable the prediction of the outgassing properties of PDMS-based composites from knowledge of their SFE values before exposure. Finally, DMA revealed no losses in the viscoelastic properties of the nanocomposites and an increase in stiffness for the GNP/PDMS type. Overall, these results are useful for the optimisation of elastomeric materials made from PDMS and graphene filler, pristine or hybridised with DNA that is highly sensitive to ionising radiation. These materials would enable the fabrication of ultralightweight and flexible radiation monitoring devices for use during space exploration missions.
Author Contributions
Conceptualization, M.G.S. and S.L.; methodology, C.P.; validation, M.G.S. and S.L.; formal analysis, E.T.; investigation, E.T. and C.P.; writing—original draft preparation, E.T.; writing—review and editing, M.G.S.; supervision, M.G.S.; funding acquisition, M.G.S. All authors have read and agreed to the published version of the manuscript.
Funding
This work was financially supported by grants from the Italian Ministry of University and Research (MIUR, Rita Levi Montalcini Programme) and from Sapienza University of Rome (grant number RM11916B88EB34A0) to M.G. Santonicola.
Institutional Review Board Statement
Not applicable.
Informed Consent Statement
Not applicable.
Data Availability Statement
Data are available from the corresponding author upon reasonable request.
Conflicts of Interest
The authors declare no conflict of interest.
References
- Kausar, A.; Rafique, I.; Muhammad, B. Aerospace application of polymer nanocomposite with carbon nanotube, graphite, graphene oxide, and nanoclay. Polym. Plast. Technol. Eng. 2017, 56, 1438–1456. [Google Scholar] [CrossRef]
- Peters, M.; Leyens, C. Aerospace and space materials. Mater. Sci. Eng. 2009, 3, 1–11. [Google Scholar]
- Ghidini, T. Materials for space exploration and settlement. Nat. Mater. 2018, 17, 846–850. [Google Scholar] [CrossRef] [PubMed]
- Naser, M.Z.; Chehab, A.I. Materials and design concepts for space-resilient structures. Prog. Aerosp. Sci. 2018, 98, 74–90. [Google Scholar] [CrossRef]
- Zaccardi, F.; Toto, E.; Rastogi, S.; La Saponara, V.; Santonicola, M.G.; Laurenzi, S. Impact of Proton Irradiation on Medium Density Polyethylene/Carbon Nanocomposites for Space Shielding Applications. Nanomaterials 2023, 13, 1288. [Google Scholar] [CrossRef]
- Kessler, M.R. Polymer Matrix Composites: A Perspective for a Special Issue of Polymer Reviews. Polym. Rev. 2012, 52, 229–233. [Google Scholar] [CrossRef]
- Mohd Nurazzi, N.; Khalina, A.; Sapuan, S.; Dayang Laila, A.; Rahmah, M.; Hanafee, Z. A Review: Fibres, Polymer Matrices and Composites. Pertanika J. Sci. Technol. 2017, 25, 4. [Google Scholar]
- Moon, J.-B.; Kim, M.-G.; Kim, C.-G.; Bhowmik, S. Improvement of tensile properties of CFRP composites under LEO space environment by applying MWNTs and thin-ply. Compos. Appl. Sci. Manuf. 2011, 42, 694–701. [Google Scholar] [CrossRef]
- Gouzman, I.; Grossman, E.; Verker, R.; Atar, N.; Bolker, A.; Eliaz, N. Advances in Polyimide-Based Materials for Space Applications. Adv. Mater. 2019, 31, 1807738. [Google Scholar] [CrossRef]
- Paesano, A.; Cohee, D.; Palmese, G. Carbon-fiber reinforced thermoplastic materials for rigidizable space systems. J. Thermoplast. Compos. Mater. 2003, 16, 139–170. [Google Scholar] [CrossRef]
- Tribble, A.C. The Space Environment: Implications for Spacecraft Design-Revised and Expanded Edition; Princeton University Press: Princeton, NJ, USA, 2003. [Google Scholar]
- Paillous, A.; Pailler, C. Degradation of multiply polymer-matrix composites induced by space environment. Compos. Part A Appl. Sci. Manuf. 1994, 25, 287–295. [Google Scholar] [CrossRef]
- Grossman, E.; Gouzman, I. Space environment effects on polymers in low earth orbit. Nucl. Instrum. Methods Phys. Res. B 2003, 208, 48–57. [Google Scholar] [CrossRef]
- Harvey, R. Spacecraft neutral self-contamination by molecular outgassing. J. Spacecr. Rockets 1976, 13, 301–305. [Google Scholar] [CrossRef]
- Kaczmarek, H.; Ołdak, D.; Malanowski, P.; Chaberska, H. Effect of short wavelength UV-irradiation on ageing of polypropylene/cellulose compositions. Polym. Degrad. Stab. 2005, 88, 189–198. [Google Scholar] [CrossRef]
- Lee, J.; Maddipatla, M.V.S.N.; Joy, A.; Vogt, B.D. Kinetics of UV Irradiation Induced Chain Scission and Cross-Linking of Coumarin-Containing Polyester Ultrathin Films. Macromolecules 2014, 47, 2891–2898. [Google Scholar] [CrossRef]
- Agarwal, C.; Kalsi, P. UV-irradiation effects on polyester nuclear track detector. Radiat. Phys. Chem. 2010, 79, 844–847. [Google Scholar] [CrossRef]
- Lu, T.; Solis-Ramos, E.; Yi, Y.; Kumosa, M. UV degradation model for polymers and polymer matrix composites. Polym. Degrad. Stab. 2018, 154, 203–210. [Google Scholar] [CrossRef]
- Zepp, R.; Ruggiero, E.; Acrey, B.; Davis, M.J.B.; Han, C.; Hsieh, H.-S.; Vilsmeier, K.; Wohlleben, W.; Sahle-Demessie, E. Fragmentation of polymer nanocomposites: Modulation by dry and wet weathering, fractionation, and nanomaterial filler. Environ. Sci. Nano 2020, 7, 1742–1758. [Google Scholar] [CrossRef] [PubMed]
- Shehzad, F.; Ahmad, M.I.; Al-Harthi, M.A. Photooxidative degradation of graphene-reinforced high-density polyethylene nanocomposites. J. Appl. Polym. Sci. 2019, 136, 47030. [Google Scholar] [CrossRef]
- Gu, X.; Chen, G.; Zhao, M.; Watson, S.S.; Nguyen, T.; Chin, J.W.; Martin, J.W. Critical role of particle/polymer interface in photostability of nano-filled polymeric coatings. J. Coat. Technol. Res. 2012, 9, 251–267. [Google Scholar] [CrossRef]
- Kumar, A.P.; Depan, D.; Tomer, N.S.; Singh, R.P. Nanoscale particles for polymer degradation and stabilization—Trends and future perspectives. Prog. Polym. Sci. 2009, 34, 479–515. [Google Scholar] [CrossRef]
- Aslam, S.; Yan, F.; Pugel, D.; Franz, D.; Miko, L.; Herrero, F.; Matsumara, M.; Babu, S.; Stahle, C. Development of ultra-high sensitivity wide-band gap UV-EUV detectors at NASA Goddard Space Flight Center. In Proceedings of the Optics and Photonics 2005, San Diego, CA, USA, 18 August 2005. [Google Scholar] [CrossRef]
- Vigué, F.; Tournié, E.; Faurie, J.-P.; Monroy, E.; Calle, F.; Muñoz, E. Visible-blind ultraviolet photodetectors based on ZnMgBeSe Schottky barrier diodes. Appl. Phys. Lett. 2001, 78, 4190–4192. [Google Scholar] [CrossRef]
- Heo, Y.W.; Kang, B.S.; Tien, L.C.; Norton, D.P.; Ren, F.; La Roche, J.R.; Pearton, S.J. UV photoresponse of single ZnO nanowires. Appl. Phys. A 2005, 80, 497–499. [Google Scholar] [CrossRef]
- Das, S.N.; Moon, K.-J.; Kar, J.P.; Choi, J.-H.; Xiong, J.; Lee, T.I.; Myoung, J.-M. ZnO single nanowire-based UV detectors. Appl. Phys. Lett. 2010, 97, 22103. [Google Scholar] [CrossRef]
- Zhai, T.; Li, L.; Wang, X.; Fang, X.; Bando, Y.; Golberg, D. Recent Developments in One-Dimensional Inorganic Nanostructures for Photodetectors. Adv. Funct. Mater. 2010, 20, 4233–4248. [Google Scholar] [CrossRef]
- Peng, L.; Hu, L.; Fang, X. Low-Dimensional Nanostructure Ultraviolet Photodetectors. Adv. Mater. 2013, 25, 5321–5328. [Google Scholar] [CrossRef]
- Bai, S.; Wu, W.; Qin, Y.; Cui, N.; Bayerl, D.J.; Wang, X. High-Performance Integrated ZnO Nanowire UV Sensors on Rigid and Flexible Substrates. Adv. Funct. Mater. 2011, 21, 4464–4469. [Google Scholar] [CrossRef]
- Garipov, G.K.; Khrenov, B.A.; Panasyuk, M.I.; Tulupov, V.I.; Shirokov, A.V.; Yashin, I.V.; Salazar, H. UV radiation from the atmosphere: Results of the MSU “Tatiana” satellite measurements. Astropart. Phys. 2005, 24, 400–408. [Google Scholar] [CrossRef]
- Shi, L.; Nihtianov, S. Comparative Study of Silicon-Based Ultraviolet Photodetectors. IEEE Sens. J. 2012, 12, 2453–2459. [Google Scholar] [CrossRef]
- Feizi, S.; Malekie, S.; Rahighi, R.; Tayyebi, A.; Ziaie, F. Evaluation of dosimetric characteristics of graphene oxide/PVC nanocomposite for gamma radiation applications. Radiochim. Acta 2017, 105, 161–170. [Google Scholar] [CrossRef]
- Feizi, S.; Mehdizadeh, A.; Hosseini, M.A.; Jafari, S.A.; Ashtari, P. Reduced graphene oxide/polymethyl methacrylate (rGO/PMMA) nanocomposite for real time gamma radiation detection. Nucl. Instrum. Methods Phys. Res. A 2019, 940, 72–77. [Google Scholar] [CrossRef]
- Toto, E.; Palombi, M.; Laurenzi, S.; Santonicola, M.G. Functional nanocomposites with graphene-DNA hybrid fillers: Synthesis and surface properties under UV irradiation. Ceram. Int. 2019, 45, 9631–9637. [Google Scholar] [CrossRef]
- Clausi, M.; Toto, E.; Botti, S.; Laurenzi, S.; La Saponara, V.; Santonicola, M.G. Direct effects of UV irradiation on graphene-based nanocomposite films revealed by electrical resistance tomography. Compos. Sci. Technol. 2019, 183, 107823. [Google Scholar] [CrossRef]
- Toto, E.; Santonicola, M.G.; Mancini, M.C.; Laurenzi, S. Ultraviolet-sensing surfaces based on hybrid nanocomposites for radiation monitoring systems. In Proceedings of the 4th IEEE International Workshop on Metrology for AeroSpace (MetroAeroSpace), Padua, Italy, 21–23 June 2017; pp. 369–373. [Google Scholar] [CrossRef]
- Toto, E.; Botti, S.; Laurenzi, S.; Santonicola, M.G. UV-induced modification of PEDOT:PSS-based nanocomposite films investigated by Raman microscopy mapping. Appl. Surf. Sci. 2020, 513, 145839. [Google Scholar] [CrossRef]
- Toto, E.; Laurenzi, S.; Santonicola, M.G. Recent trends in graphene/polymer nanocomposites for sensing devices: Synthesis and applications in environmental and human health monitoring. Polymers 2022, 14, 1030. [Google Scholar] [CrossRef]
- Santonicola, M.G.; Coscia, M.G.; Sirilli, M.; Laurenzi, S. Nanomaterial-based biosensors for a real-time detection of biological damage by UV light. In Proceedings of the Annual International Conference of the IEEE Engineering in Medicine and Biology Society, EMBS, Milan, Italy, 25–29 August 2015; pp. 4391–4394. [Google Scholar] [CrossRef]
- Bradley, M.O. Double-strand breaks in DNA caused by repair of damage due to ultraviolet light. J. Supramol. Struct. Cell. Biochem. 1981, 16, 337–343. [Google Scholar] [CrossRef] [PubMed]
- Zhang, X.; Rosenstein, B.S.; Wang, Y.; Lebwohl, M.; Mitchell, D.M.; Wei, H. Induction of 8-Oxo-7, 8-Dihydro-2’-Deoxyguanosine by Ultraviolet Radiation in Calf Thymus DNA and HeLa Cells. Photochem. Photobiol. 1997, 65, 119–124. [Google Scholar] [CrossRef]
- Borysiak, M.D.; Bielawski, K.S.; Sniadecki, N.J.; Jenkel, C.F.; Vogt, B.D.; Posner, J.D. Simple replica micromolding of biocompatible styrenic elastomers. Lab Chip 2013, 13, 2773–2784. [Google Scholar] [CrossRef]
- Wang, X.; Tang, Y.; Cheng, S.; Gao, Q.; Yuan, Y.; Li, A.; Guan, S. PDMS-based conductive elastomeric composite with 3D reduced graphene oxide conductive network for flexible strain sensor. Compos. Appl. Sci. Manuf. 2022, 161, 107113. [Google Scholar] [CrossRef]
- Paris, C.; Sindoni, G. LARES-Lab: A facility for environmental testing of satellite components and micro satellites. In Proceedings of the 2nd International Academy of Astronautics Conference on Dynamics and Control of Space Systems (DyCoSS), Rome, Italy, 24–26 March 2014; pp. 575–582. [Google Scholar]
- Santonicola, M.; Toto, E.; Maria, P.; Paris, C.; Laurenzi, S. Experimental study of solar radiation effects on carbon nanocomposite sensors in simulated space environment. In Proceedings of the 69th International Astronautical Congress, IAC, Bremen, Germany, 1–5 October 2018; pp. 1–8. [Google Scholar]
- Toto, E.; Laurenzi, S.; Santonicola, M.G. Flexible Nanocomposites Based on Polydimethylsiloxane Matrices with DNA-Modified Graphene Filler: Curing Behavior by Differential Scanning Calorimetry. Polymers 2020, 12, 2301. [Google Scholar] [CrossRef]
- Persky, M.J. Review of black surfaces for space-borne infrared systems. Rev. Sci. Instrum. 1999, 70, 2193–2217. [Google Scholar] [CrossRef]
- Mignot, C. Color (and 3D) for scanning electron microscopy. Microsc. Today 2018, 26, 12–17. [Google Scholar] [CrossRef]
- Owens, D.K.; Wendt, R. Estimation of the surface free energy of polymers. J. Appl. Polym. Sci. 1969, 13, 1741–1747. [Google Scholar] [CrossRef]
- Isarov, S.A.; Lee, P.W.; Towslee, J.H.; Hoffman, K.M.; Davis, R.D.; Maia, J.M.; Pokorski, J.K. DNA as a flame retardant additive for low-density polyethylene. Polymer 2016, 97, 504–514. [Google Scholar] [CrossRef]
- Godley, B.F.; Shamsi, F.A.; Liang, F.-Q.; Jarrett, S.G.; Davies, S.; Boulton, M. Blue Light Induces Mitochondrial DNA Damage and Free Radical Production in Epithelial Cells. J. Biol. Chem. 2005, 280, 21061–21066. [Google Scholar] [CrossRef] [PubMed]
- Peak, J.; Peak, M.; Sikorski, R.; Jones, C. Induction of DNA-protein crosslinks in human cells by ultraviolet and visible radiations: Action spectrum. Photochem. Photobiol. 1985, 41, 295–302. [Google Scholar] [CrossRef]
- Fekete, A.; Módos, K.; Hegedüs, M.; Kovács, G.; Rontó, G.; Péter, Á.; Lammer, H.; Panitz, C. DNA damage under simulated extraterrestrial conditions in bacteriophage T7. Adv. Space Res. 2005, 36, 303–310. [Google Scholar] [CrossRef]
- Hegedüs, M.; Kovács, G.; Módos, K.; Rontó, G.; Lammer, H.; Panitz, C.; Fekete, A. Exposure of phage T7 to simulated space environment: The effect of vacuum and UV-C radiation. J. Photochem. Photobiol. B Biol. 2006, 82, 94–104. [Google Scholar] [CrossRef]
- Cierpisz, M.; McPhedran, J.; He, Y.; Edrisy, A. Characterization of graphene-filled fluoropolymer coatings for condensing heat exchangers. J. Compos. Mater. 2021, 55, 4305–4320. [Google Scholar] [CrossRef]
- Savin, A.V.; Mazo, M.A.; Kikot, I.P.; Manevitch, L.I.; Onufriev, A.V. Heat conductivity of the DNA double helix. Phys. Rev. B 2011, 83, 245406. [Google Scholar] [CrossRef]
- Giljean, S.; Bigerelle, M.; Anselme, K.; Haidara, H. New insights on contact angle/roughness dependence on high surface energy materials. Appl. Surf. Sci. 2011, 257, 9631–9638. [Google Scholar] [CrossRef]
- Ashori, A.; Menbari, S.; Bahrami, R. Mechanical and thermo-mechanical properties of short carbon fiber reinforced polypropylene composites using exfoliated graphene nanoplatelets coating. J. Ind. Eng. Chem. 2016, 38, 37–42. [Google Scholar] [CrossRef]
- Tareq, M.S.; Zainuddin, S.; Woodside, E.; Syed, F. Investigation of the flexural and thermomechanical properties of nanoclay/graphene reinforced carbon fiber epoxy composites. J. Mater. Res. 2019, 34, 3678–3687. [Google Scholar] [CrossRef]
- Panwar, V.; Pal, K. Chapter 12—Dynamic Mechanical Analysis of Clay–Polymer Nanocomposites. In Clay-Polymer Nanocomposites; Jlassi, K., Chehimi, M.M., Thomas, S., Eds.; Elsevier: Amsterdam, The Netherlands, 2017; pp. 413–441. [Google Scholar] [CrossRef]
- Zubair, M.; Jose, J.; Emwas, A.-H.; Al-Harthi, M.A. Effect of modified graphene and microwave irradiation on the mechanical and thermal properties of poly(styrene-co-methyl methacrylate)/graphene nanocomposites. Surf. Interface Anal. 2014, 46, 630–639. [Google Scholar] [CrossRef]
- Bashir, M.A. Use of Dynamic Mechanical Analysis (DMA) for Characterizing Interfacial Interactions in Filled Polymers. Solids 2021, 2, 108–120. [Google Scholar] [CrossRef]


Disclaimer/Publisher’s Note: The statements, opinions and data contained in all publications are solely those of the individual author(s) and contributor(s) and not of MDPI and/or the editor(s). MDPI and/or the editor(s) disclaim responsibility for any injury to people or property resulting from any ideas, methods, instructions or products referred to in the content. |
© 2023 by the authors. Licensee MDPI, Basel, Switzerland. This article is an open access article distributed under the terms and conditions of the Creative Commons Attribution (CC BY) license (https://creativecommons.org/licenses/by/4.0/).