
Predicting Mechanical Properties of Magnesium Matrix Composites with Regression Models by Machine Learning


Abstract
:1. Introduction
2. Literature Review
2.1. Mechanical Properties of Magnesium Matrix Composites
2.2. Machine Learning Regression Algorithm Model

| Algorithm Model | Strengths | Limitations |
|---|---|---|
| Decision trees regression | Simple computation; easy to understand and interpret | Easy to overfit; neglects correlation among data |
| Extra tree regression | Computational efficiency | Similar to random forest |
| Random forest regression | It can be utilized for predicting numerical values (regression) and categorizing data (classification) without the necessity to standardize the features; clear of over-fitting. | No interpretability; performance is not good when there is a class imbalance |
| XGBoost regression | Feature preparation, such as filling in missing values or tweaking the size and span of features, is not required; it can be used for tasks like sorting data into categories, making predictions on numbers, or putting things in a specific order; it is extremely fast and highly effective for its ability to do multiple calculations simultaneously | Only for numeric features; leads to overfitting if hyperparameters are not adjusted |
3. Materials and Methods
3.1. Materials
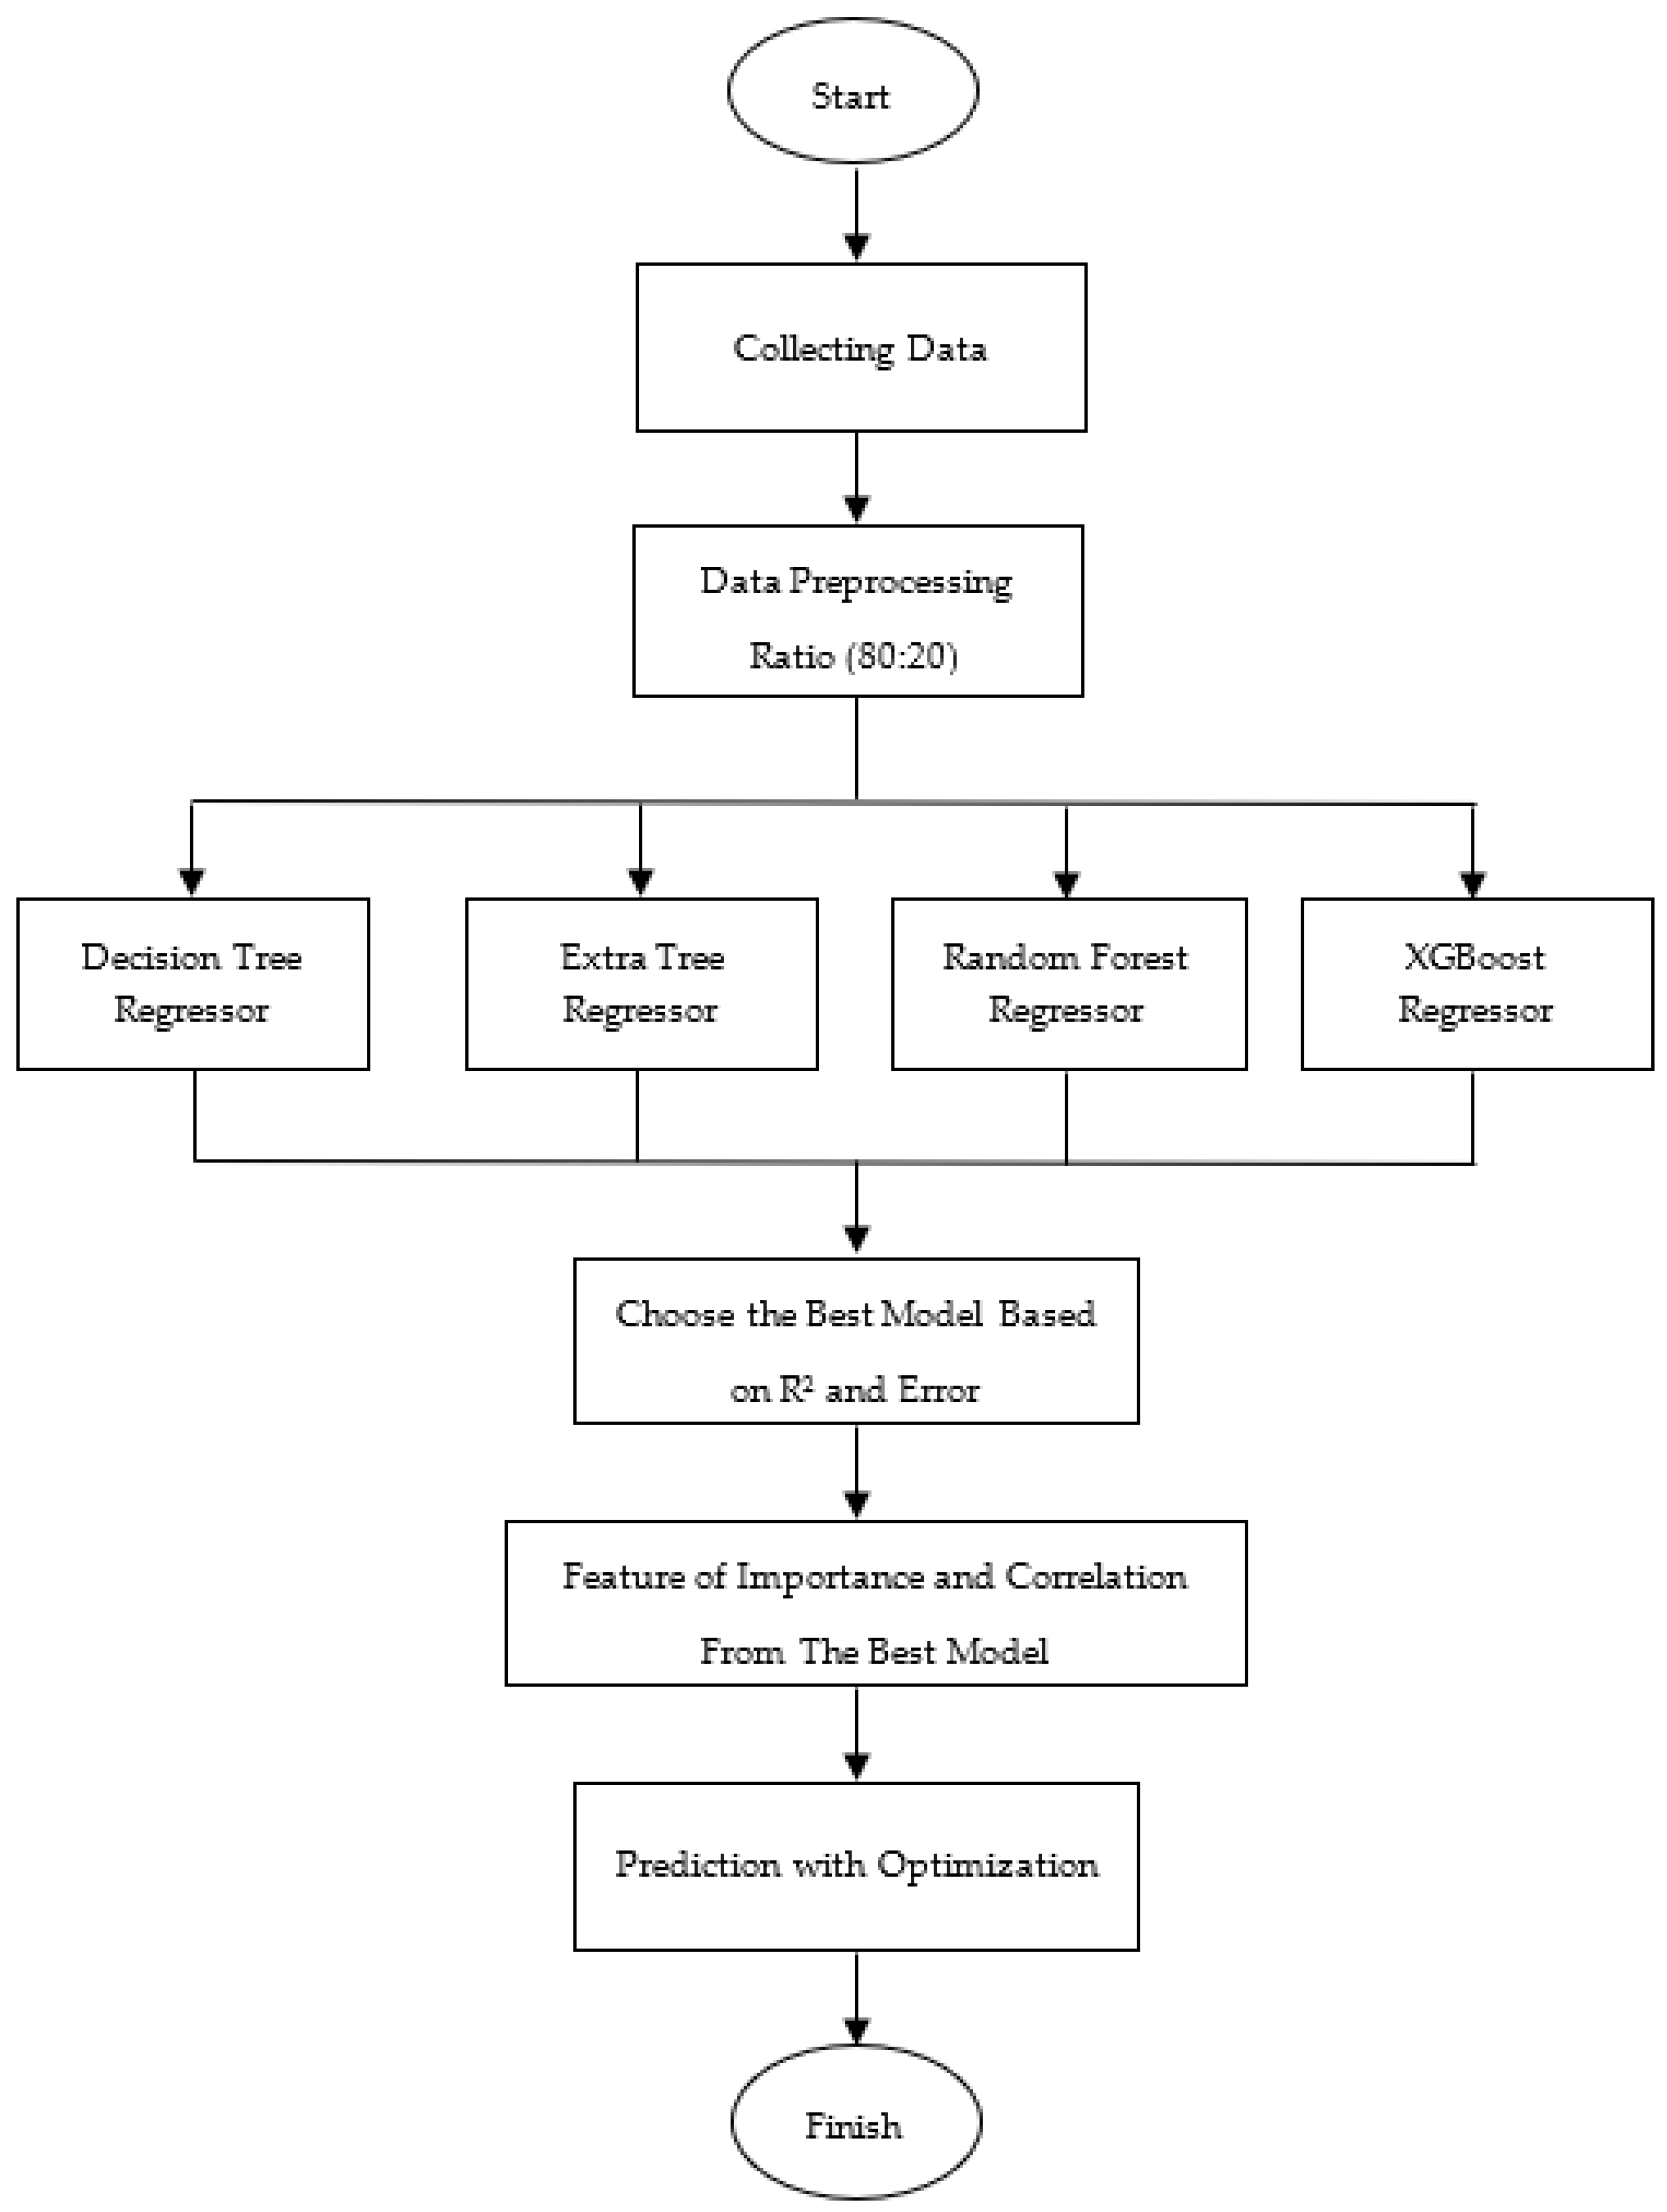
3.2. Methods
4. Results and Discussion
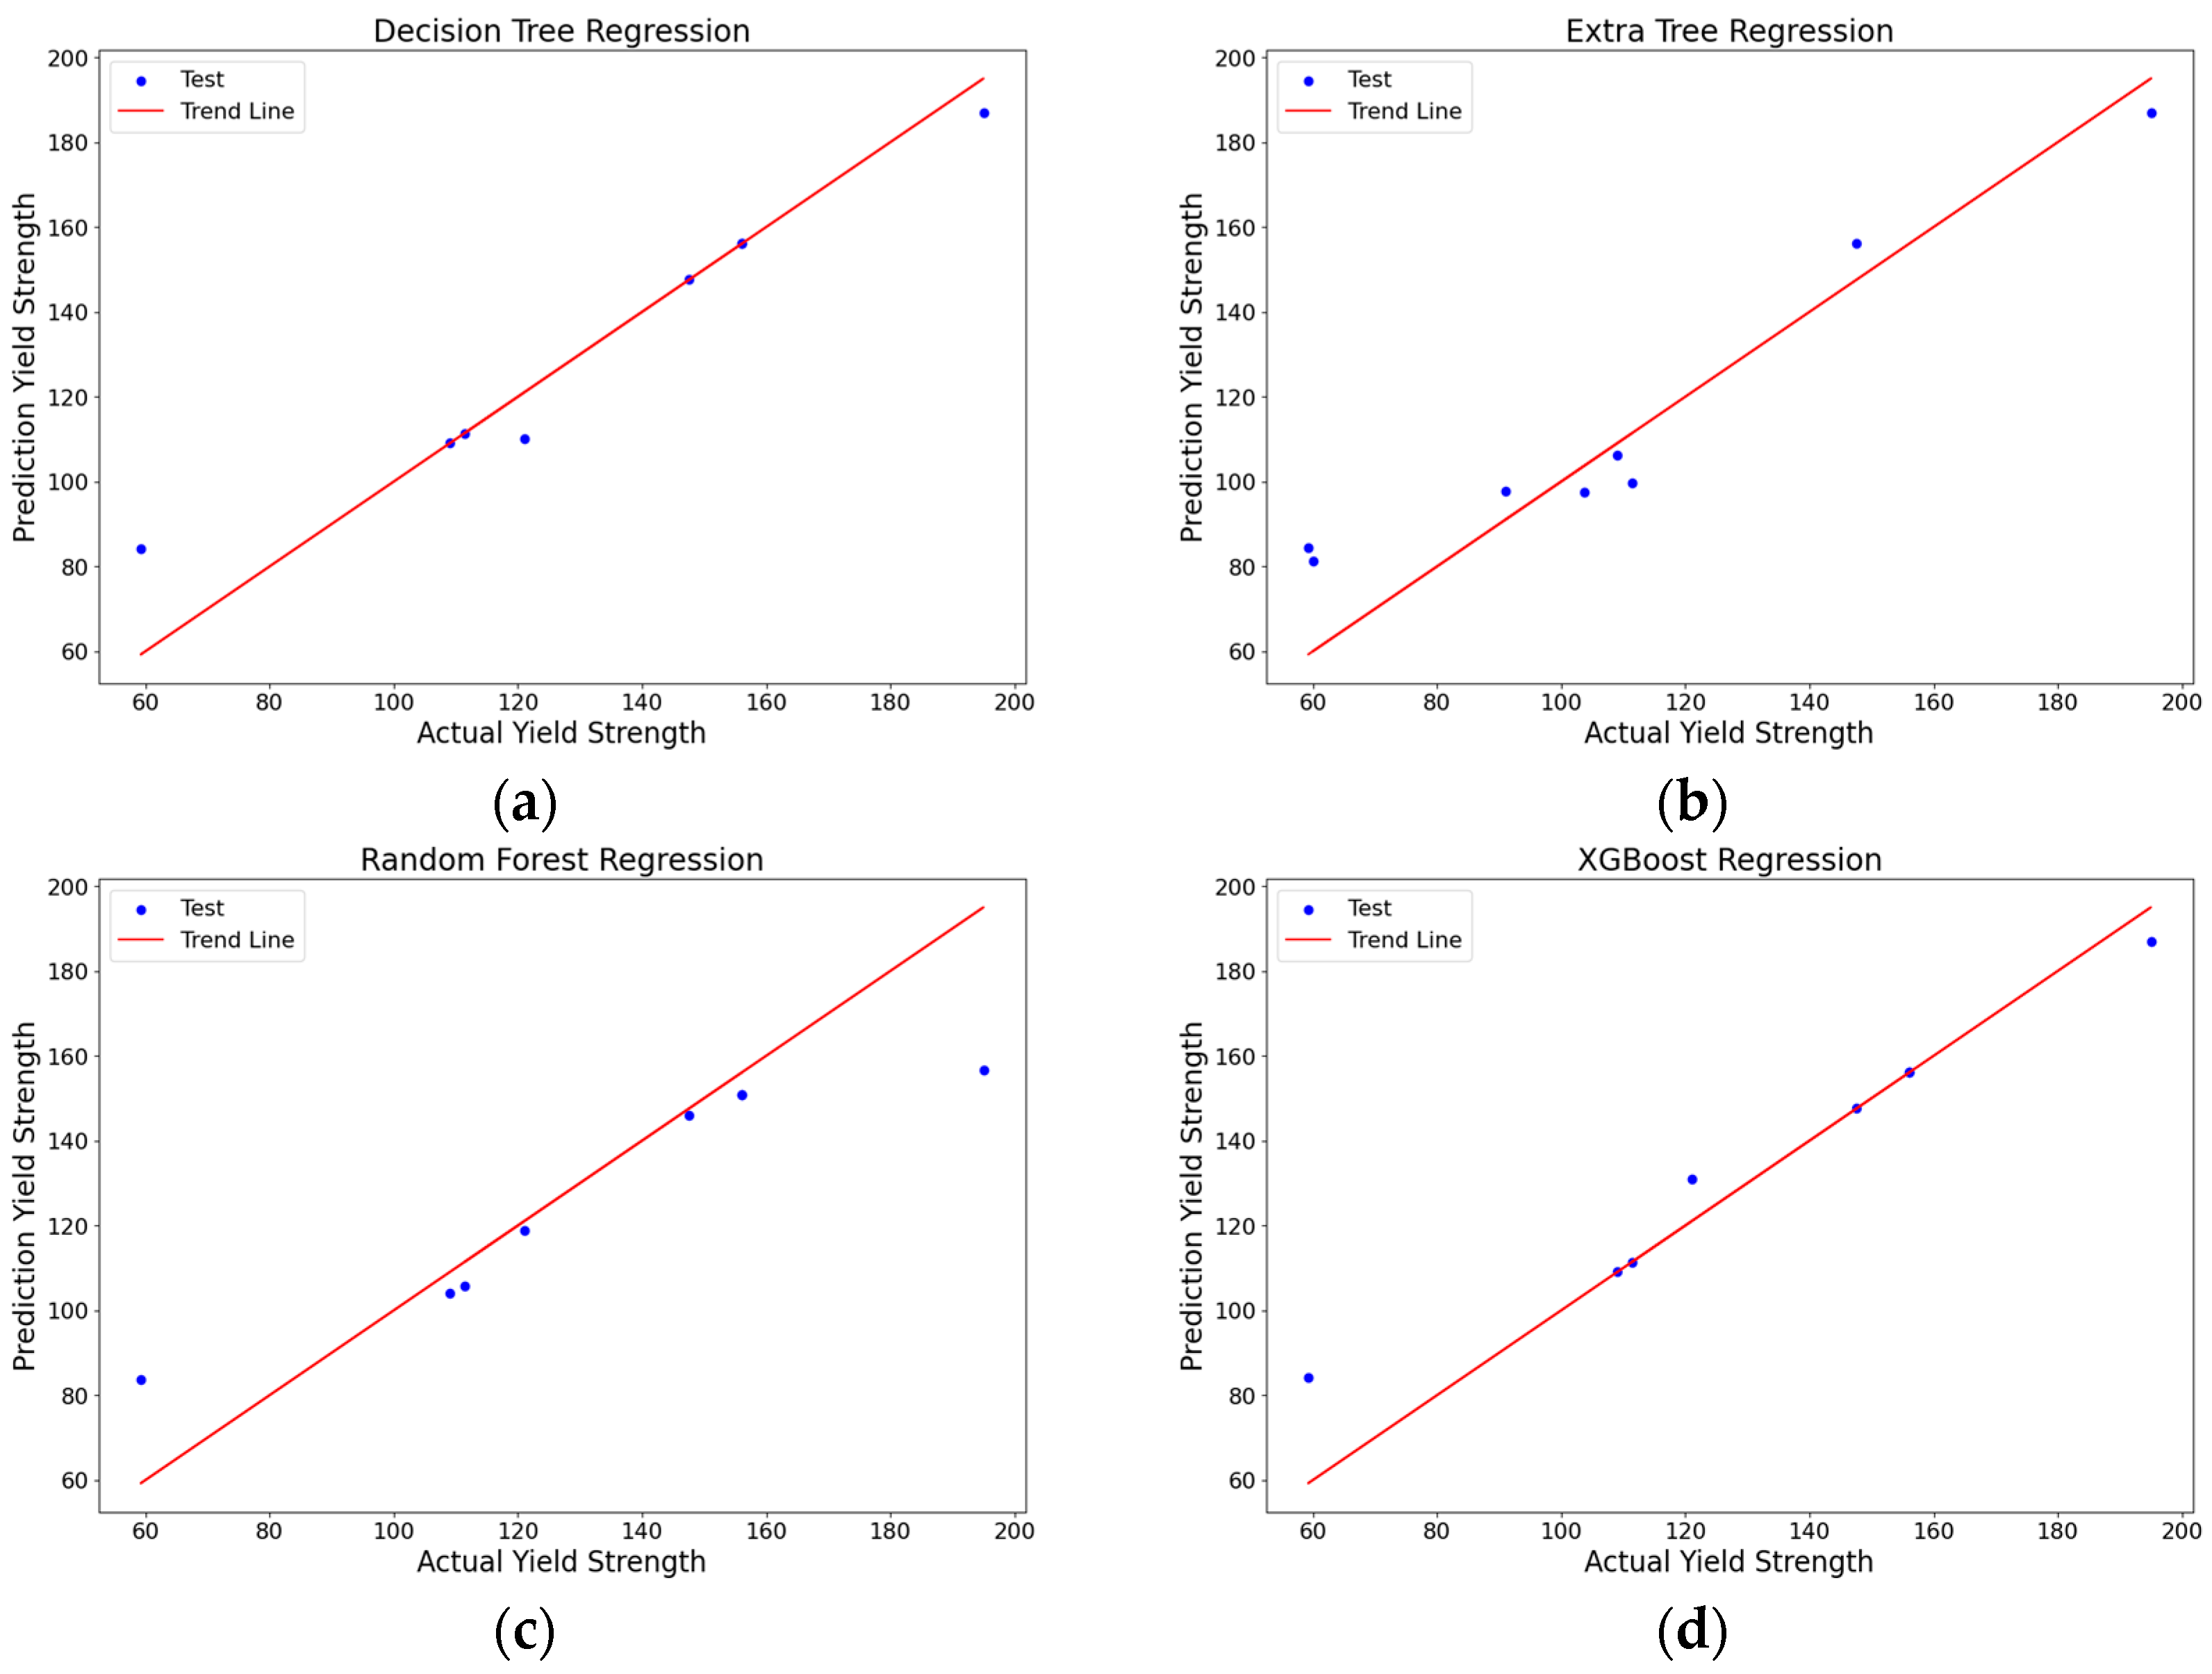
4.1. Evaluation-Based Error and R2
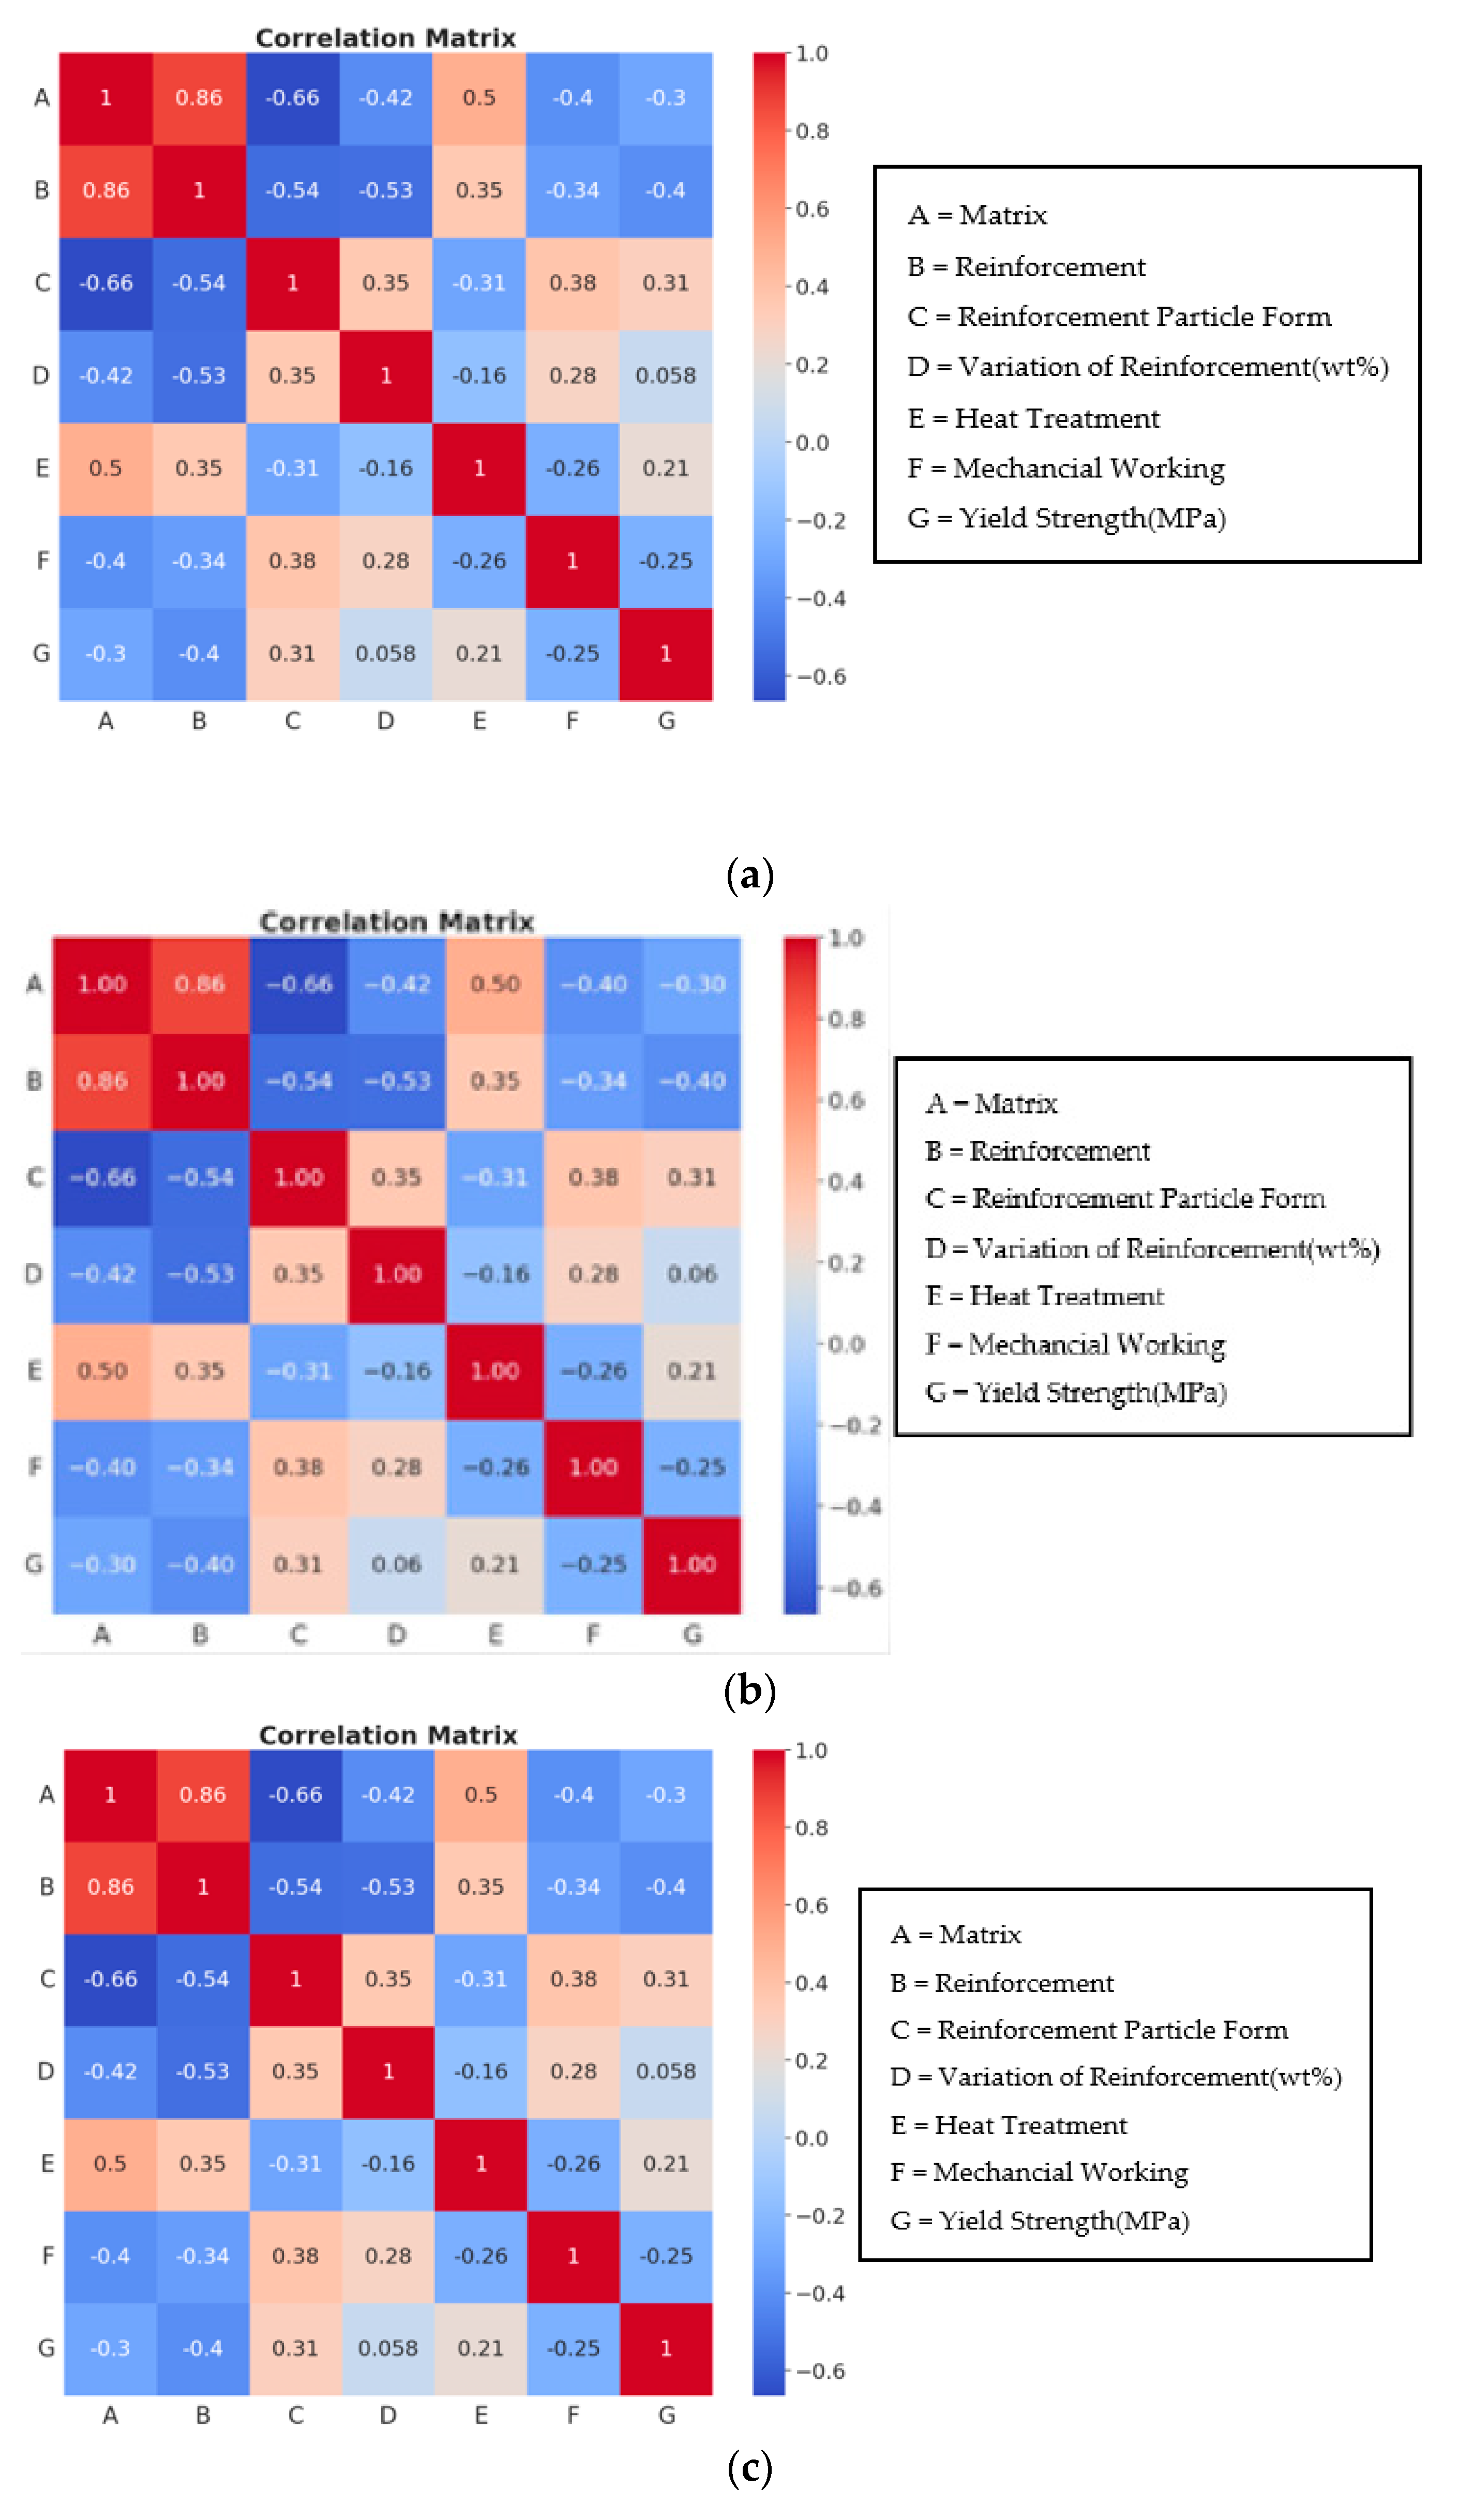
4.2. Feature of Importance and Correlation Matrix
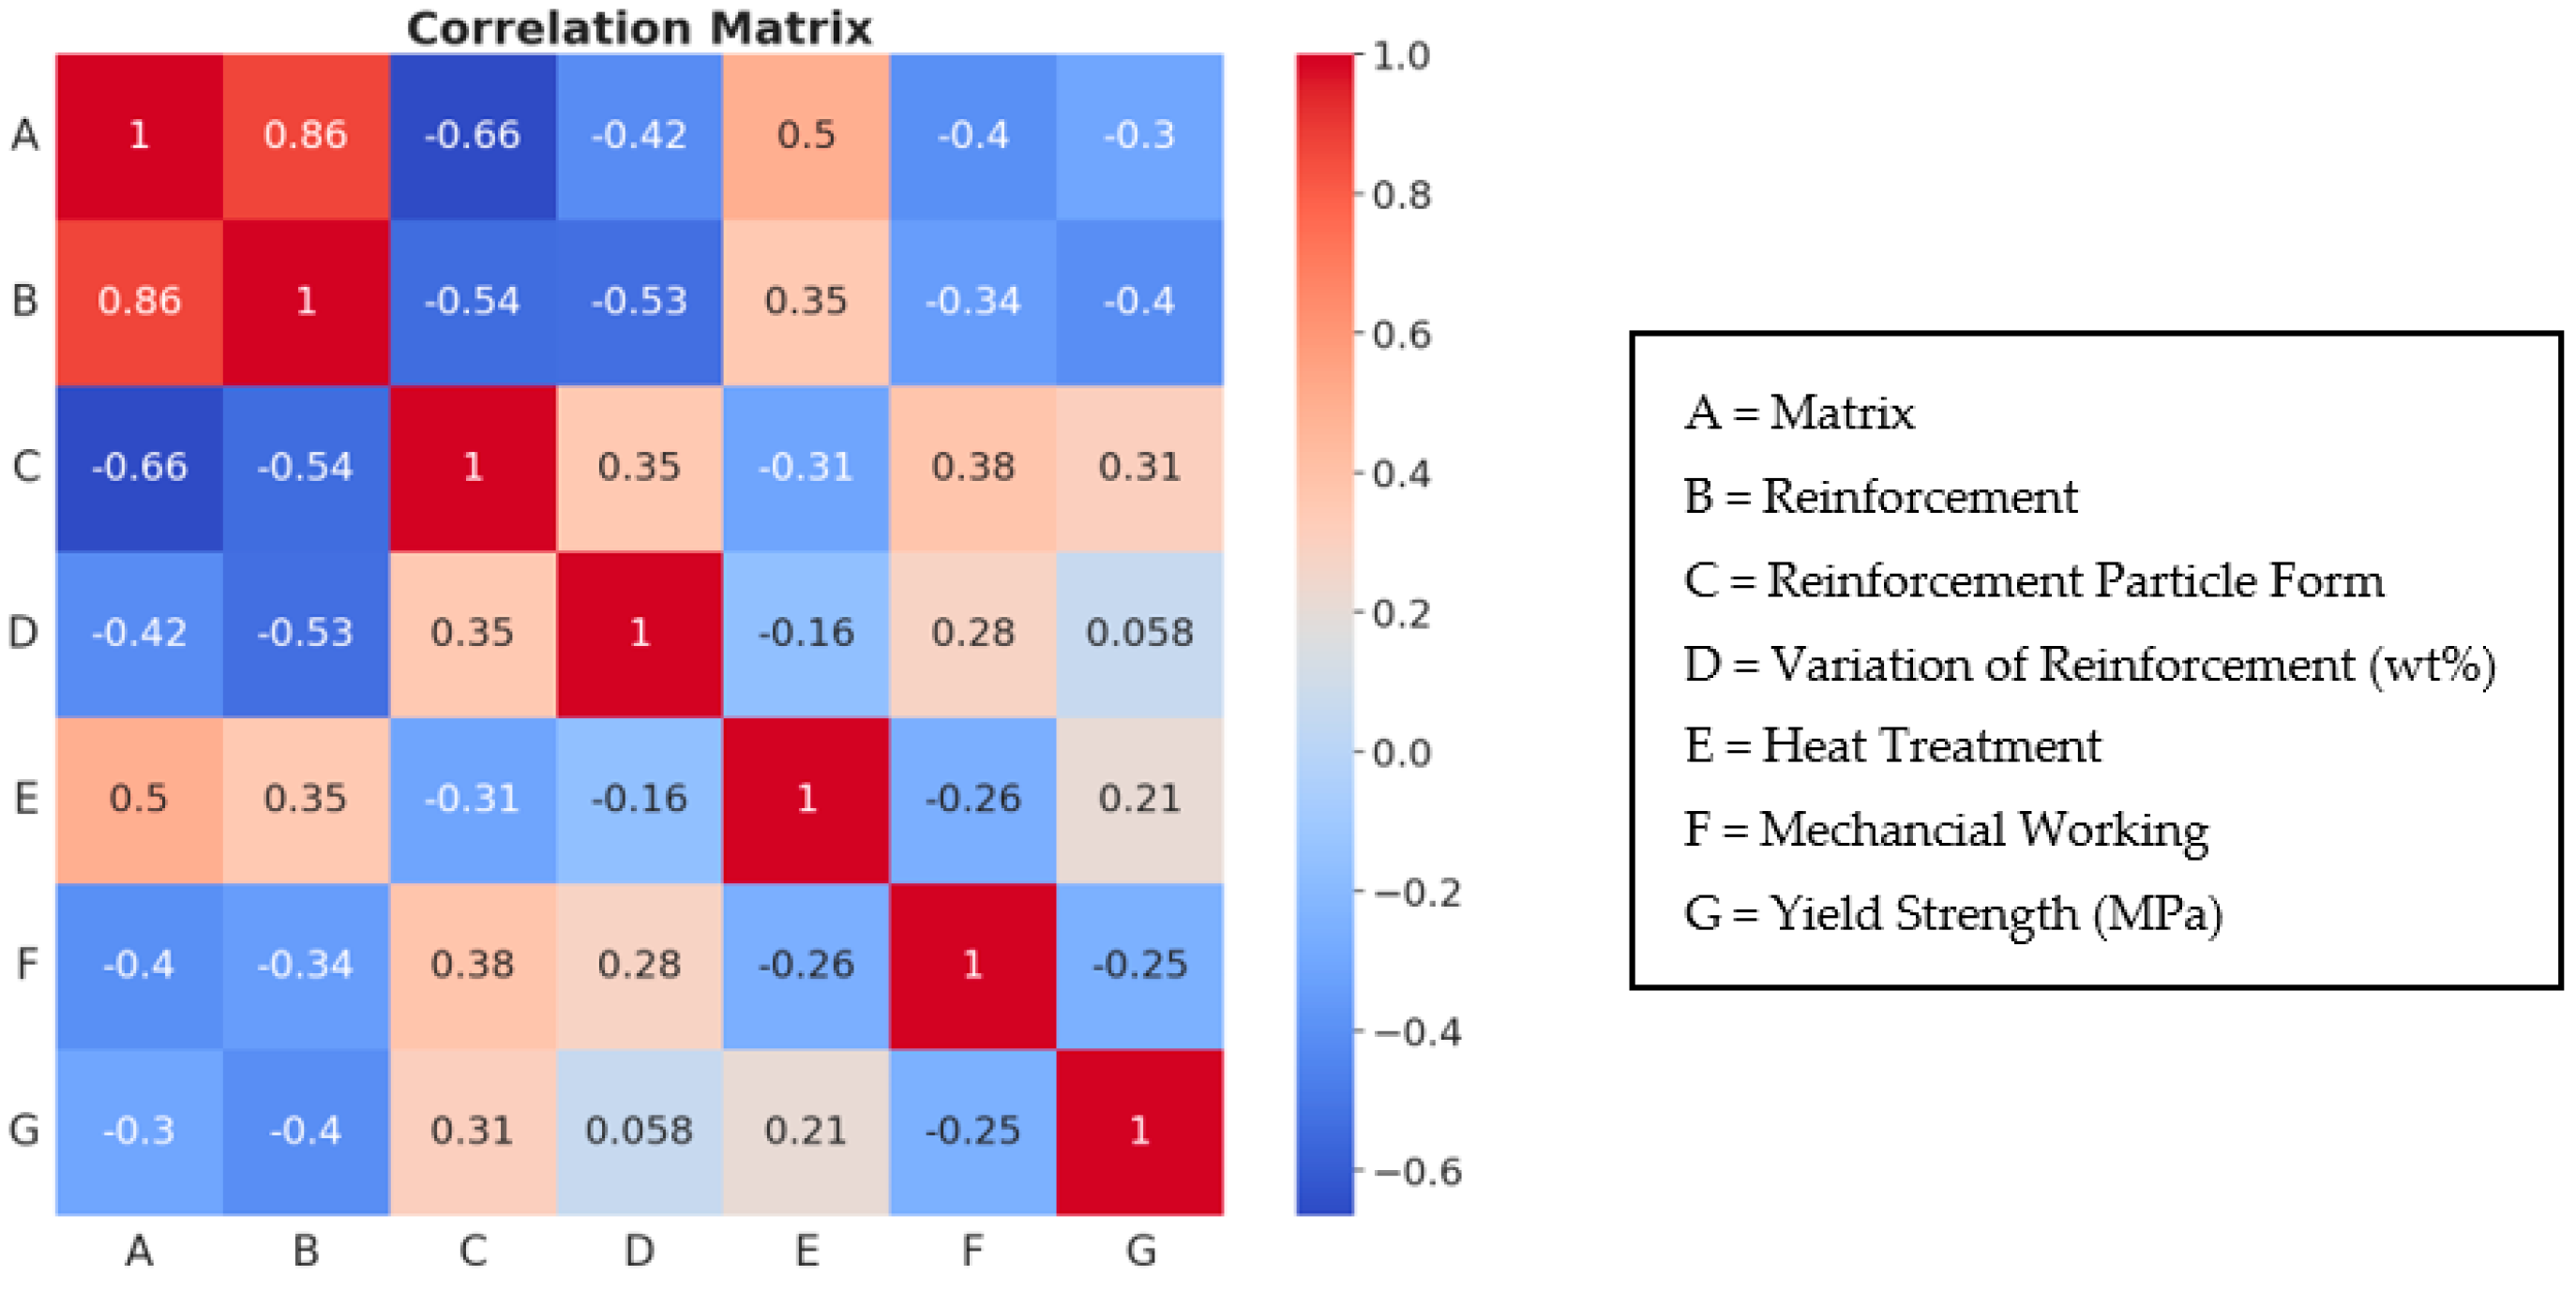
4.2.1. Feature of Importance and Correlation Matrix from the Best Model
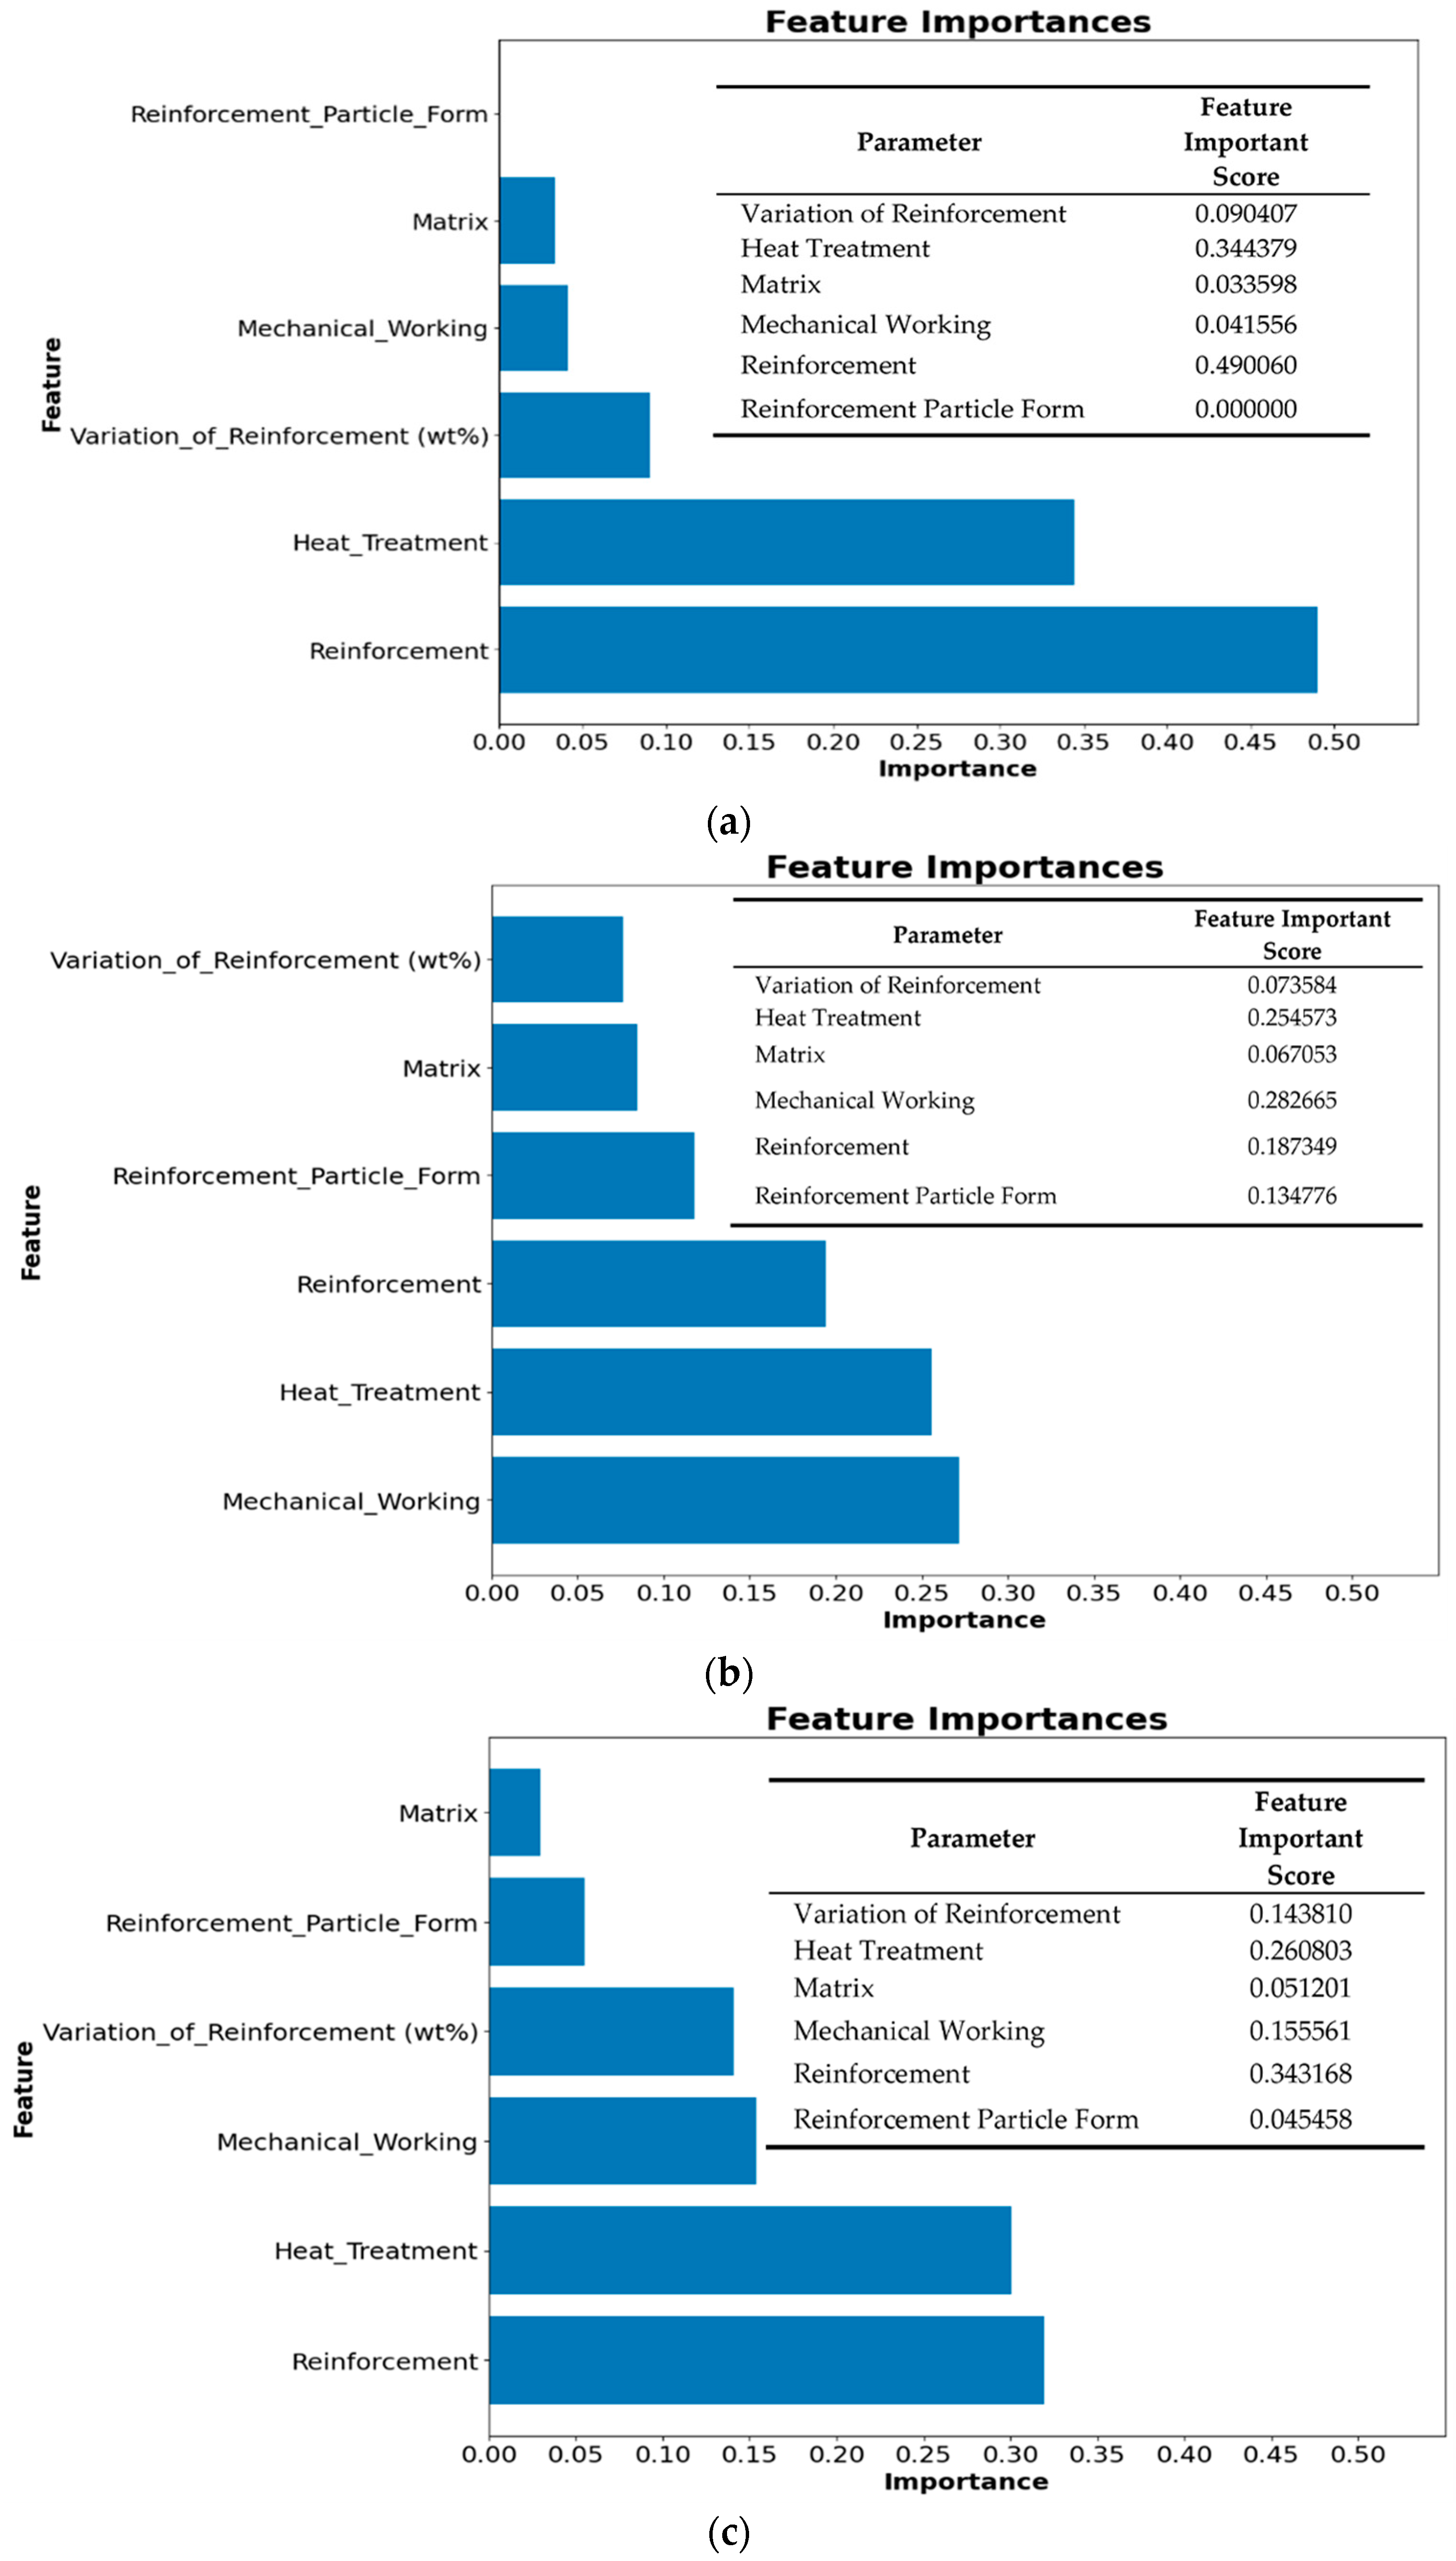
4.2.2. Feature of Importance and Correlation Matrix from Other Models
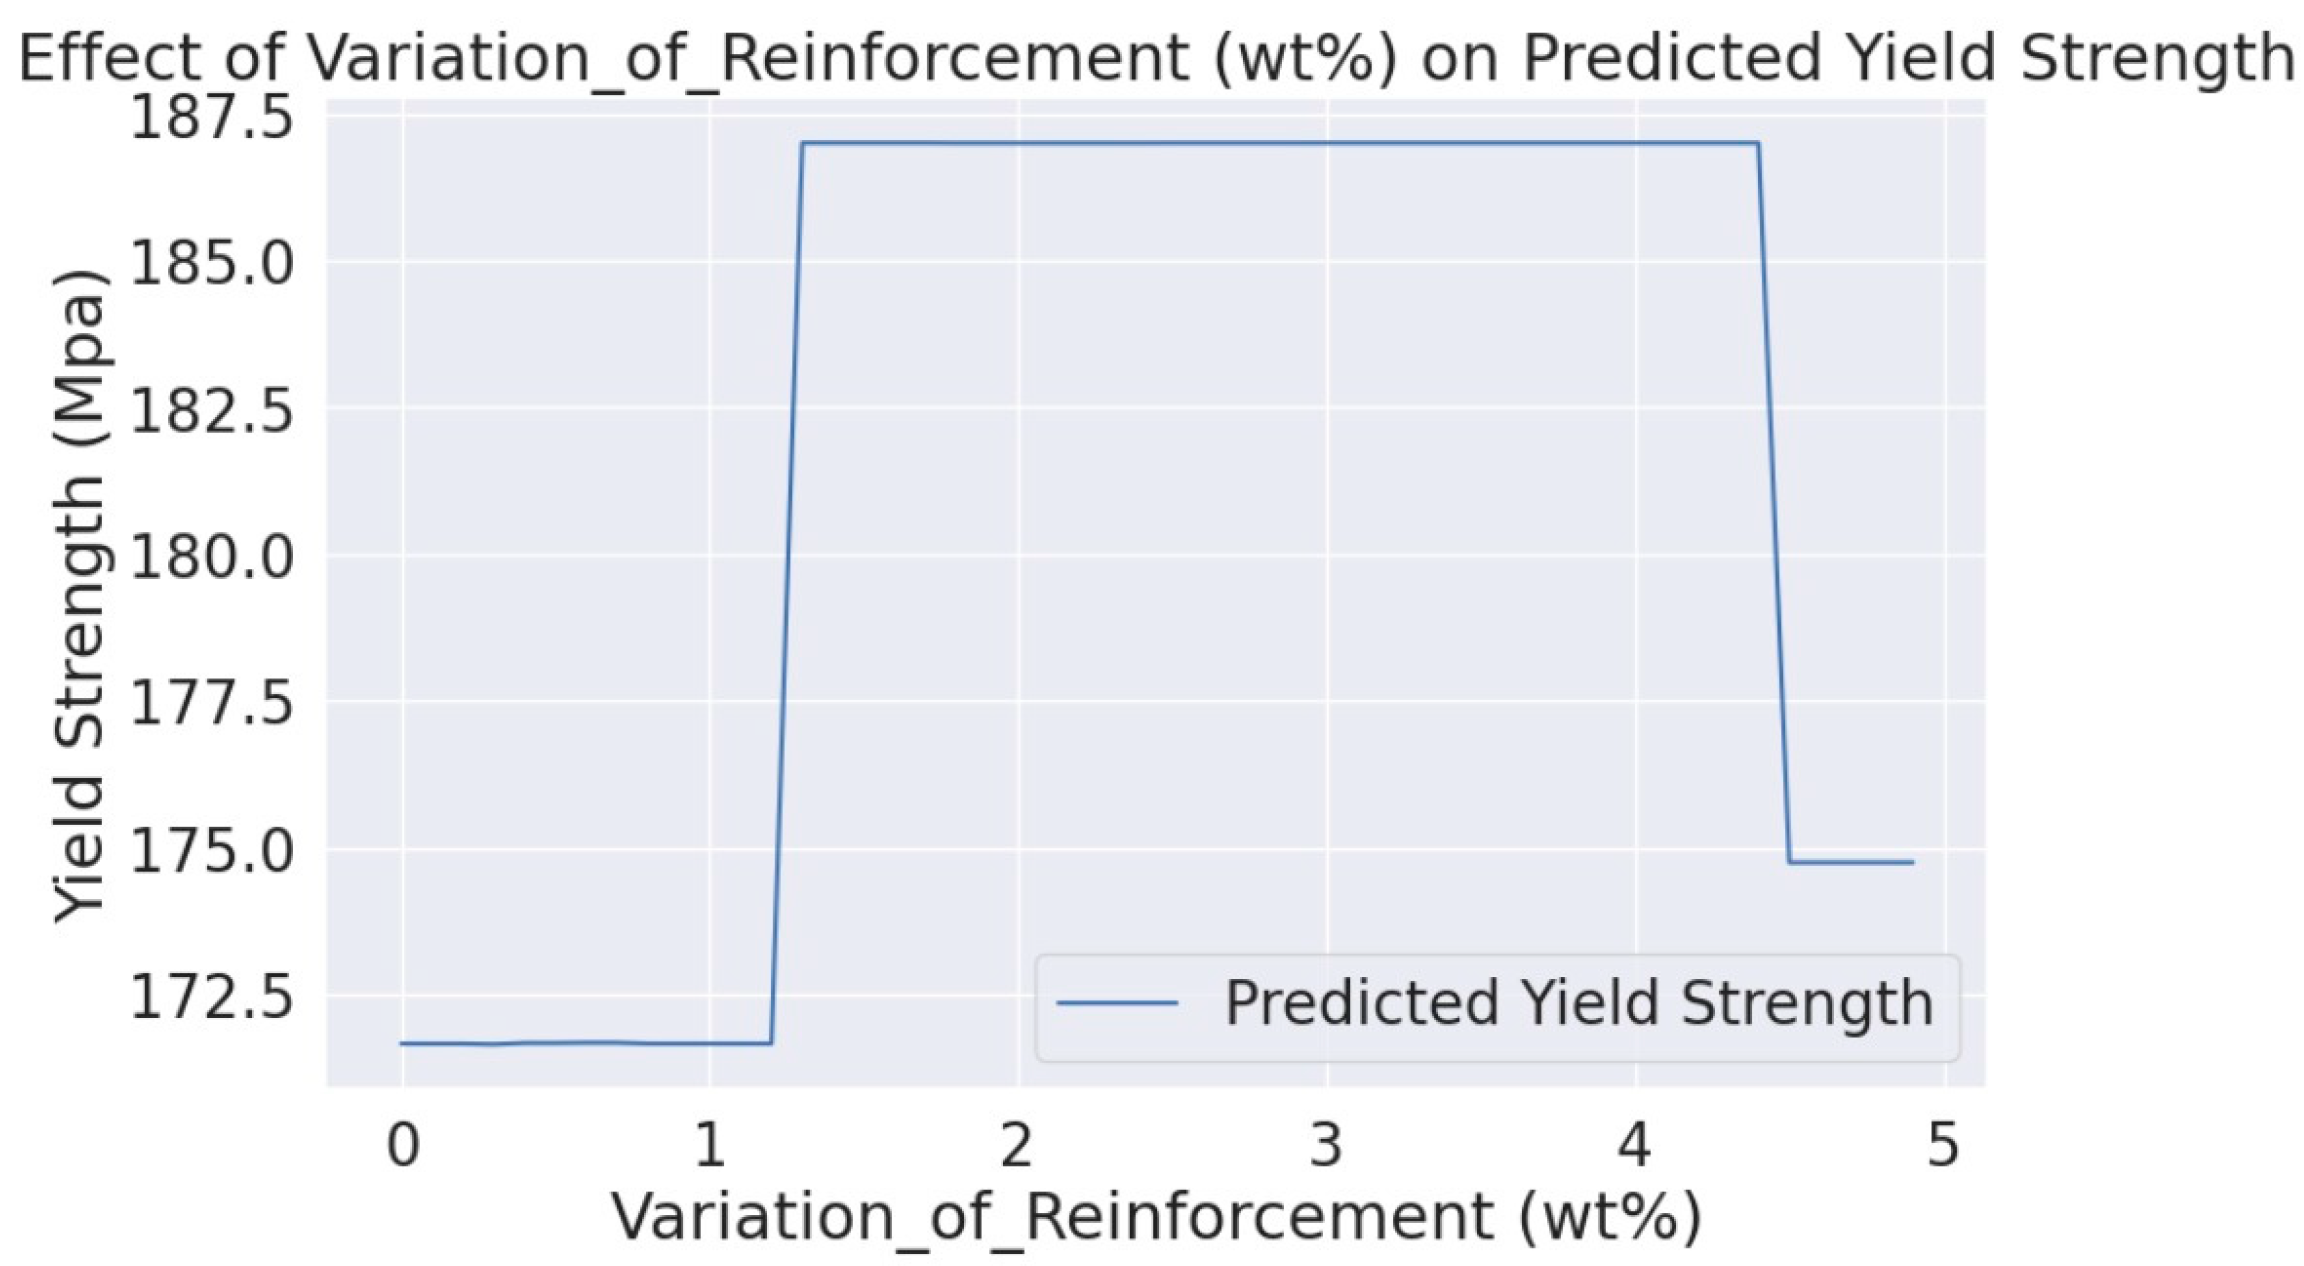
4.3. Prediction with Optimization
5. Conclusions
- 1.
- XGBoost regression proved to be the most effective model in predicting the YS of magnesium alloy composites among the four regression models. It exhibited an R² value of 0.94. Its superiority was further supported by the lowest error rates of MAE and RMSE, with values of 8.19 and 10.42, respectively.
- 2.
- Feature importance analysis revealed that the form of reinforcement particles, specifically nano-sized particles, had the most substantial influence on the mechanical properties of magnesium alloy composites. This is attributed to the increased surface/volume ratio of nano-sized particles, which enhanced the strengthening effect of the composite.
- 3.
- The optimized parameters for achieving the highest YS in magnesium alloy composites were the use of the AZ31 matrix with GNP as reinforcement, in nanoparticle form, with a 3 wt%. No heat treatment was applied, and the mechanical working was conducted at an extrusion temperature of 350 °C.
- 4.
- In the future, researchers can explore expanding this approach to different composites and parameters, enhancing model precision, and utilizing experimental results for model validation and refinement. This study will serve as a starting point toward an efficient method for predicting mechanical properties, thereby highlighting the role of machine learning in the fabrication process of magnesium composites.
Author Contributions
Funding
Institutional Review Board Statement
Informed Consent Statement
Data Availability Statement
Acknowledgments
Conflicts of Interest
References
- Huang, S.; Subramani, M.; Alemayehu, D.B. The effect of micro-sicp content on the tensile and fatigue behavior of az61 magnesium alloy matrix composites. Int. J. Met. 2021, 15, 780–793. [Google Scholar] [CrossRef]
- Jeng, S.; Abbas, A.; Ballóková, B. Effect of CNT on Microstructure, Dry Sliding Wear and Compressive Mechanical Properties of AZ61 magnesium alloy. J. Mater. Res. Technol. 2019, 8, 4273–4286. [Google Scholar] [CrossRef]
- Gupta, M.; Sharon, N.M.L. Magnesium, Magnesium Alloys, and Magnesium Composites; John Wiley & Sons, Inc.: Hoboken, NJ, USA, 2011; ISBN 9780470494172. [Google Scholar]
- Somekawa, H. Review Effect of Alloying Elements on Fracture Toughness and Ductility in Magnesium Binary Alloys; A Review. Mater. Trans. 2020, 61, 1–13. [Google Scholar] [CrossRef]
- Tan, J.; Ramakrishna, S. Applications of Magnesium and Its Alloys: A Review. Appl. Sci. 2021, 11, 6861. [Google Scholar] [CrossRef]
- Yadav, S.D.; Bhingole, P.P.; Chaudhari, G.P.; Nath, S.K.; Sommitsch, C. Hybrid Processing of AZ91 Magnesium Alloy/Nano-Al2O3 Composites. In Key Engineering Materials; Trans Tech Publications Ltd.: Stafa-Zurich, Switzerland, 2015; Volume 651–653, pp. 783–788. [Google Scholar]
- Subramani, M.; Huang, S.J.; Borodianskiy, K. Effect of SiC Nanoparticles on AZ31 Magnesium Alloy. Materials 2022, 15, 1004. [Google Scholar] [CrossRef]
- Karuppusamy, P.; Lingadurai, K.; Sivananth, V.; Arulkumar, S. A Study on Mechanical Properties of Tungsten Carbide Reinforced Magnesium Metal Matrix Composites for the Application of Piston. Int. J. Lightweight Mater. Manuf. 2021, 4, 449–459. [Google Scholar] [CrossRef]
- Huang, S.J.; Abbas, A. Effects of Tungsten Disulfide on Microstructure and Mechanical Properties of AZ91 Magnesium Alloy Manufactured by Stir Casting. J. Alloys Compd. 2020, 817, 153321. [Google Scholar] [CrossRef]
- Rashad, M.; Pan, F.; Liu, Y.; Chen, X.; Lin, H.; Pan, R.; Asif, M.; She, J. High Temperature Formability of Graphene Nanoplatelets-AZ31 Composites Fabricated by Stir-Casting Method. J. Magnes. Alloy. 2016, 4, 270–277. [Google Scholar] [CrossRef]
- Ramanujam, N.; Muthukumaran, S.; Nagesawara Rao, B.; Ramarao, M.; Mangrulkar, A.L.; Ashraff Ali, K.S.; Pugazhendhi, L.; Markos, M. Experimental Investigations on Mechanical Properties of AZ31/Eggshell Particle-Based Magnesium Composites. Adv. Mater. Sci. Eng. 2022, 2022, 4883764. [Google Scholar] [CrossRef]
- Saranu, R.; Chanamala, R.; Putti, S. Review of Magnesium Metal Matrix Composites. IOP Conf. Ser. Mater. Sci. Eng. 2020, 961, 012001. [Google Scholar] [CrossRef]
- Kaya, A.A. A Review on Developments in Magnesium Alloys. IOP Conf. Ser. Mater. Sci. Eng. 2021, 11, 289–306. [Google Scholar] [CrossRef]
- Kordijazi, A.; Zhao, T.; Zhang, J.; Alrfou, K.; Rohatgi, P. A Review of Application of Machine Learning in Design, Synthesis, and Characterization of Metal Matrix Composites: Current Status and Emerging Applications; Springer: Berlin/Heidelberg, Germany, 2021; Volume 73. [Google Scholar]
- Gomes, C.P.; Selman, B.; Gregoire, J.M. Artificial Intelligence for Materials Discovery. MRS Bull. 2019, 44, 538–544. [Google Scholar] [CrossRef]
- Chen, C.T.; Gu, G.X. Machine Learning for Composite Materials. MRS Commun. 2019, 9, 556–566. [Google Scholar] [CrossRef]
- Arora, G.S.; Saxena, K.K.; Mohammed, K.A.; Prakash, C.; Dixit, S. Manufacturing Techniques for Mg-Based Metal Matrix Composite with Different Reinforcements. Crystals 2022, 12, 945. [Google Scholar] [CrossRef]
- Samal, P.; Vundavilli, P.R.; Meher, A.; Mahapatra, M.M. Recent Progress in Aluminum Metal Matrix Composites: A Review on Processing, Mechanical and Wear Properties. J. Manuf. Process 2020, 59, 131–152. [Google Scholar] [CrossRef]
- Prasad, S.V.S.; Prasad, S.B.; Verma, K.; Mishra, R.K.; Kumar, V.; Singh, S. The Role and Significance of Magnesium in Modern Day Research-A Review. J. Magnes. Alloy. 2022, 10, 1–61. [Google Scholar] [CrossRef]
- Bhattacharya, S.; Kalita, K.; Čep, R.; Chakraborty, S. A Comparative Analysis on Prediction Performance of Regression Models during Machining of Composite Materials. Materials 2021, 14, 6689. [Google Scholar] [CrossRef]
- Huang, S.J.; Mose, M.P.; Kannaiyan, S. A Study of the Mechanical Properties of AZ61 Magnesium Composite after Equal Channel Angular Processing in Conjunction with Machine Learning. Mater. Today Commun. 2022, 33, 104707. [Google Scholar] [CrossRef]
- Song, J.; She, J.; Chen, D.; Pan, F. Latest Research Advances on Magnesium and Magnesium Alloys Worldwide. J. Magnes. Alloy. 2020, 8, 1–41. [Google Scholar] [CrossRef]
- Suresh Kumar, S.; Thirumalai Kumaran, S.; Velmurugan, G.; Perumal, A.; Sekar, S.; Uthayakumar, M. Physical and Mechanical Properties of Various Metal Matrix Composites: A Review. Mater. Today Proc. 2021, 50, 1022–1031. [Google Scholar]
- Guan, H.; Xiao, H.; Ouyang, S.; Tang, A.; Chen, X.; Tan, J.; Feng, B.; She, J.; Zheng, K.; Pan, F. A Review of the Design, Processes, and Properties of Mg-Based Composites. Nanotechnol. Rev. 2022, 11, 712–730. [Google Scholar] [CrossRef]
- Li, D.; Thomas, J.; Leroux, P. A Better Measure Yield and Tensile Strength; Nanovea: Irvine, CA, USA, 2020. [Google Scholar]
- Sharma, A.K.; Bhandari, R.; Aherwar, A.; Rimašauskiene, R. Matrix Materials Used in Composites: A Comprehensive Study. Mater. Today Proc. 2020, 21, 1559–1562. [Google Scholar] [CrossRef]
- Selvam, J.D.R.; Dinaharan, I.; Rai, R.S. Matrix and Reinforcement Materials for Metal Matrix Composites. In Encyclopedia of Materials: Composites; Elsevier: Amsterdam, The Netherlands, 2021; Volume 2, pp. 615–639. ISBN 9780128197318. [Google Scholar]
- Bohlen, J.; Cano, G.; Drozdenko, D.; Dobron, P.; Kainer, K.U.; Gall, S.; Müller, S.; Letzig, D. Processing Effects on the Formability of Magnesium Alloy Sheets. Metals 2018, 8, 147. [Google Scholar] [CrossRef]
- Rajput, R.; Raut, A.; Gangi Setti, S. Prediction of Mechanical Properties of Aluminium Metal Matrix Hybrid Composites Synthesized Using Stir Casting Process by Machine Learning. Mater. Today Proc. 2022, 59, 1735–1742. [Google Scholar] [CrossRef]
- Singh Tumrate, C.; Roy Chowdhury, S.; Mishra, D. Development of Regression Model to Predicting Yield Strength for Different Steel Grades. IOP Conf. Ser. Earth Environ. Sci. 2021, 796, 012033. [Google Scholar] [CrossRef]
- Kadam, V.S. Regression Techniques in Machine Learning & Applications: A Review. Int. J. Res. Appl. Sci. Eng. Technol. 2020, 8, 826–830. [Google Scholar] [CrossRef]
- Kwak, S.; Kim, J.; Ding, H.; Xu, X.; Chen, R.; Guo, J.; Fu, H. Machine Learning Prediction of the Mechanical Properties of γ-TiAl Alloys Produced Using Random Forest Regression Model. J. Mater. Res. Technol. 2022, 18, 520–530. [Google Scholar] [CrossRef]
- Huo, W.; Zhu, Z.; Sun, H.; Ma, B.; Yang, L. Development of Machine Learning Models for the Prediction of the Compressive Strength of Calcium-Based Geopolymers. J. Clean. Prod. 2022, 380, 135159. [Google Scholar] [CrossRef]
- Rahman, J.; Ahmed, K.S.; Khan, N.I.; Islam, K.; Mangalathu, S. Data-Driven Shear Strength Prediction of Steel Fiber Reinforced Concrete Beams Using Machine Learning Approach. Eng. Struct. 2021, 233, 111743. [Google Scholar] [CrossRef]
- Lou, Y.; Ye, Y.; Yang, Y.; Zuo, W.; Wang, G.; Strong, M.; Upadhyaya, S.; Payne, C. Individualized Empirical Baselines for Evaluating the Energy Performance of Existing Buildings. Sci. Technol. Built. Environ. 2023, 29, 19–33. [Google Scholar] [CrossRef]
- Shehadeh, A.; Alshboul, O.; Al Mamlook, R.E.; Hamedat, O. Machine Learning Models for Predicting the Residual Value of Heavy Construction Equipment: An Evaluation of Modified Decision Tree, LightGBM, and XGBoost Regression. Autom. Constr. 2021, 129, 103827. [Google Scholar] [CrossRef]
- Huang, J.S.; Liew, J.X.; Ademiloye, A.S.; Liew, K.M. Artificial Intelligence in Materials Modeling and Design. Arch. Comput. Methods Eng. 2021, 28, 3399–3413. [Google Scholar] [CrossRef]
- Ahmad, M.W.; Reynolds, J.; Rezgui, Y. Predictive Modelling for Solar Thermal Energy Systems: A Comparison of Support Vector Regression, Random Forest, Extra Trees and Regression Trees. J. Clean. Prod. 2018, 203, 810–821. [Google Scholar] [CrossRef]
- Chakraborty, P.; Rafiammal, S.S.; Tharini, C.; Jamal, D.N. Influence of Bias and Variance in Selection of Machine Learning Classifiers for Biomedical Applications. In Proceedings of the Smart Data Intelligence: Proceedings of ICSMDI 2022, Singapore, 17 August 2022; pp. 459–472. [Google Scholar]
- Chen, T.; Guestrin, C. XGBoost: A Scalable Tree Boosting System. In Proceedings of the 22nd ACM SIGKDD International Conference on Knowledge Discovery and Data Mining, San Francisco, CA, USA, 13–17 August 2016. [Google Scholar] [CrossRef]
- Liu, H.; Lang, B. Machine Learning and Deep Learning Methods for Intrusion Detection Systems: A Survey. Appl. Sci. 2019, 9, 4396. [Google Scholar] [CrossRef]
- Liu, J.; Wu, J.; Liu, S.; Li, M.; Hu, K.; Li, K. Predicting Mortality of Patients with Acute Kidney Injury in the ICU Using XGBoost Model. PLoS ONE 2021, 16, e0246306. [Google Scholar] [CrossRef] [PubMed]
- Geurts, P.; Ernst, D.; Wehenkel, L. Extremely Randomized Trees. Mach. Learn. 2006, 63, 3–42. [Google Scholar] [CrossRef]
- Huanga, S.J.; Kannaiyan, S.; Subramani, M. Effect of Nano-Nb2O5 on the Microstructure and Mechanical Properties of AZ31 Alloy Matrix Nanocomposites. Adv. Nano. Res. 2022, 13, 407–416. [Google Scholar] [CrossRef]
- Huang, S.J.; Lin, C.C.; Huang, J.Y.; Tenne, R. Mechanical Behavior Enhancement of AZ31/WS2 and AZ61/WS2 Magnesium Metal Matrix Nanocomposites. Adv. Mech. Eng. 2018, 10, 2. [Google Scholar] [CrossRef]
- Zhao, W.; Huang, S.J.; Wu, Y.J.; Kang, C.W. Particle Size and Particle Percentage Effect of AZ61/SiCp Magnesium Matrix Micro- and Nano-Composites on Their Mechanical Properties Due to Extrusion and Subsequent Annealing. Metals 2017, 7, 293. [Google Scholar] [CrossRef]
- Huang, S.J.; Hwang, Y.M.; Huang, Y.S.; Huang, C.C. Mechanical Properties Enhancement of Particle Reinforced Magnesium Matrix Composites Used for Hot Extruded Tubes. Acta Phys. Pol. A 2015, 127, 1271–1273. [Google Scholar] [CrossRef]
- Huang, S.J.; Hwang, Y.M.; Huang, Y.S. Grain Refinement of AZ61/SiCp Magnesium Matrix Composites for Tubes Extruded by Hot Extrusion Processes. In Key Engineering Materials; Trans Tech Publications Ltd.: Stafa-Zurich, Switzerland, 2013; Volume 528, pp. 135–143. [Google Scholar]
- Abbas, A.; Huang, S.J. Investigation of Severe Plastic Deformation Effects on Microstructure and Mechanical Properties of WS2/AZ91 Magnesium Metal Matrix Composites. Mater. Sci. Eng. A 2020, 780, 139211. [Google Scholar] [CrossRef]
- Abbas, A.; Huang, S.J. ECAP Effects on Microstructure and Mechanical Behavior of Annealed WS2/AZ91 Metal Matrix Composite. J. Alloys Compd. 2020, 835, 155466. [Google Scholar] [CrossRef]
- Chicco, D.; Warrens, M.J.; Jurman, G. The Coefficient of Determination R-Squared Is More Informative than SMAPE, MAE, MAPE, MSE and RMSE in Regression Analysis Evaluation. PeerJ Comput. Sci. 2021, 7, e623. [Google Scholar] [CrossRef] [PubMed]
- Fox, J. Appendices to Applied Regression Analysis, Generalized Linear Models, 3rd ed.; SAGE Publications: Los Angeles, CA, USA, 2016; ISBN 978-1-4522-0566-3. [Google Scholar]
- Nurunnisha, G.A.; Rohmattulah, A.; Maulansyah, M.R.; Sinaga, O.; Maulansyah, R. Analysis of Consumer Acceptance Factors Against Fintech at Bandung Smes. PalArch’s J. Archaeol. Egypt Egyptol. 2020, 17, 841–855. [Google Scholar]
- Rengasamy, D.; Mase, J.M.; Kumar, A.; Rothwell, B.; Torres, M.T.; Alexander, M.R.; Winkler, D.A.; Figueredo, G.P. Feature Importance in Machine Learning Models: A Fuzzy Information Fusion Approach. Neurocomputing 2022, 511, 163–174. [Google Scholar] [CrossRef]
- Wu, Q.; Miao, W.S.; Zhang, Y.D.; Gao, H.J.; Hui, D. Mechanical Properties of Nanomaterials: A Review. Nanotechnol. Rev. 2020, 9, 259–273. [Google Scholar] [CrossRef]
- Shahid Ul Islam, S.; Khan, N.Z.; Khan, M.M. Effect of Reinforcement on Magnesium-Based Composites Fabricated through Stir Casting: A Review. Mater. Today Proc. 2020, 46, 6513–6518. [Google Scholar] [CrossRef]
- Molnar, C.; König, G.; Herbinger, J.; Freiesleben, T.; Dandl, S.; Scholbeck, C.A.; Casalicchio, G.; Grosse-Wentrup, M.; Bischl, B. General Pitfalls of Model-Agnostic Interpretation Methods for Machine Learning Models. arXiv 2020, arXiv:2007.04131. [Google Scholar]
- Kazemitabar, J.; Amini, A.; Bloniarz, A.; Talwalkar, A. Variable Importance Using Decision Trees. In Proceedings of the Advances in Neural Information Processing Systems, Long Beach, CA, USA, 4–9 December 2017. [Google Scholar]
- Singh, A.; Thakur, N.; Sharma, A. A Review of Supervised Machine Learning Algorithm. In Proceedings of the 2016 3rd International Conference on Computing for Sustainable Global Development (INDIACom), New Delhi, India, 16–18 March 2016. [Google Scholar]
- Breiman, L. Random Forests. Mach. Learn. 2001, 45, 5–32. [Google Scholar] [CrossRef]
- Prashantha Kumar, H.G.; Anthony Xavior, M. Graphene Reinforced Metal Matrix Composite (GRMMC): A Review. Procedia Eng. 2014, 97, 1033–1040. [Google Scholar] [CrossRef]
- Wu, S.P.; Feng, S.Y.; Wang, J.; Li, Q.L. Effects of Extrusion Temperatures on Mechanical Properties of B4C/Al Composites. IOP Conf. Ser. Mater. Sci. Eng. 2020, 715, 012103. [Google Scholar] [CrossRef]
- Chibani, S.; Coudert, F.X. Machine Learning Approaches for the Prediction of Materials Properties. APL Mater. 2020, 8, 080701. [Google Scholar] [CrossRef]
- Patil, A.; Kiran Kumar Yadav Nartu, M.S.; Ozdemir, F.; Banerjee, R.; Gupta, R.K.; Borkar, T. Enhancement of the Mechanical Properties of Graphene Nanoplatelet (GNP) Reinforced Nickel Matrix Nanocomposites. Mater. Sci. Eng. A 2021, 817, 141324. [Google Scholar] [CrossRef]
- Lu, T.; Zhou, M.; Ren, L.; Fan, L.; Guo, Y.; Qu, X.; Zhang, H.; Lu, X.; Quan, G. Effect of Graphene Nanoplatelets Content on the Mechanical and Wear Properties of AZ31 Alloy. Metals 2020, 10, 1265. [Google Scholar] [CrossRef]


| Previous Research | Material | Key Findings | Machine Learning Models |
|---|---|---|---|
| Rutuk Rajput et al. [29] [Prediction of mechanical properties of aluminum metal matrix hybrid composites synthesized using Stir casting process by Machine learning] | Aluminum Metal Matrix Hybrid Composites | The study employed various regression algorithm models, including the four models mentioned earlier, to predict the mechanical properties of ultimate tensile strength in aluminum metal matrix hybrid composites. The best-performing model among them was the decision tree regression, which achieved an R2 value of 0.92909 | Decision Tree Regression, Random Forest Regression, Extra Tree Regression, Gradient Boost Regression, AdaBoost Regression, XGBoost Regression, and CatBoost Regression |
| Kwak et al. [32] [Machine learning prediction of the mechanical properties of γ-TiAl alloys produced using random forest regression model] | TiAl alloys | The random forest regression (RFR) machine learning algorithm was effective in predicting the mechanical properties of a directionally solidified (DS) TiAl alloy | Random Forest Regression |
| Huo et al. [33] [Development of machine learning models for the prediction of the compressive strength of calcium-based geopolymers] | Geopolymers | The study evaluated eight algorithms in three types (traditional ML algorithms, integrated tree-based ML algorithms, and a deep neural network algorithm) for their suitability in predicting compressive strength. Each algorithm was analyzed for its differences, advantages, and disadvantages. | XGBoost Model performed the most accurate |
| Matrix | Reinforcement | Source |
|---|---|---|
| AZ31 | SiC | [7] |
| AZ31 | Graphene Nanopellets | [10] |
| AZ31 | Eggshell | [11] |
| AZ31 | Nb2O5 (Niobium Pentoxide) | [44] |
| AZ61 | WS2 | [45] |
| AZ61 | SiC | [1,46,47,48] |
| AZ91 | WS2 | [9,49,50] |
| AZ91 | WC | [8] |
| Value of Coefficient of Determination (R2) | Level of Closeness |
|---|---|
| 0.82–1 | Very high |
| 0.49–0.81 | High influence |
| 0.17–0.48 | Quite strong influence |
| 0.05–0.16 | Low impact |
| 0–0.04 | Very low |
| Algorithm Model | MAE | RMSE | R2 |
|---|---|---|---|
| Decision trees regression | 8.81 | 11.36 | 0.92 |
| Extra tree regression | 11.01 | 13.37 | 0.89 |
| Random forest regression | 18.63 | 14.21 | 0.80 |
| XGBoost regression | 8.19 | 10.42 | 0.94 |
| ML Algorithm | Matrix | Reinforcement | Reinforcement Particle Form | Variation of Reinforcement (wt%) | Heat Treatment | Mechanical Working | Yield Strength |
|---|---|---|---|---|---|---|---|
| Decision tree regression | AZ31 | GNP | Nano | 3 wt% | No heat treatment | Extrusion temperature 350 °C | 187 MPa |
| Extra tree regression | AZ31 | GNP | Nano | 3 wt% | No heat treatment | Extrusion temperature 350 °C | 187 MPa |
| Random forest regression | AZ31 | GNP | Nano | 3 wt% | No heat treatment | Extrusion temperature 350 °C | 154.353 MPa |
| XGBoost regression (Best Model) | AZ31 | GNP | Nano | 3 wt% | No heat treatment | Extrusion temperature 350 °C | 186.99731 MPa |
| Matrix | Reinforcement | Reinforcement Particle Form | Variation of Reinforcement (wt%) | Heat Treatment | Mechanical Working | Yield Strength (MPa) |
|---|---|---|---|---|---|---|
| AZ31 | Graphene nanopellets | Nano | 0 wt% | No heat treatment | Extrusion temperature 350 °C | 171.67538 |
| AZ31 | Graphene nanopellets | Nano | 0.5 wt% | No heat treatment | Extrusion temperature 350 °C | 171.68613 |
| AZ31 | Graphene nanopellets | Nano | 1 wt% | No heat treatment | Extrusion temperature 350 °C | 171.67615 |
| AZ31 | Graphene nanopellets | Nano | 1.5 wt% | No heat treatment | Extrusion temperature 350 °C | 186.99875 |
| AZ31 | Graphene nanopellets | Nano | 2 wt% | No heat treatment | Extrusion temperature 350 °C | 186.99678 |
| AZ31 | Graphene nanopellets | Nano | 2.5 wt% | No heat treatment | Extrusion temperature 350 °C | 186.99678 |
| AZ31 | Graphene nanopellets | Nano | 3 wt% | No heat treatment | Extrusion temperature 350 °C | 186.99731 |
| AZ31 | Graphene nanopellets | Nano | 3.5 wt% | No heat treatment | Extrusion temperature 350 °C | 186.99731 |
| AZ31 | Graphene nanopellets | Nano | 4 wt% | No heat treatment | Extrusion temperature 350 °C | 186.99731 |
| AZ31 | Graphene nanopellets | Nano | 4.5 wt% | No heat treatment | Extrusion temperature 350 °C | 174.75705 |
Disclaimer/Publisher’s Note: The statements, opinions and data contained in all publications are solely those of the individual author(s) and contributor(s) and not of MDPI and/or the editor(s). MDPI and/or the editor(s) disclaim responsibility for any injury to people or property resulting from any ideas, methods, instructions or products referred to in the content. |
© 2023 by the authors. Licensee MDPI, Basel, Switzerland. This article is an open access article distributed under the terms and conditions of the Creative Commons Attribution (CC BY) license (https://creativecommons.org/licenses/by/4.0/).
Share and Cite
Huang, S.-J.; Adityawardhana, Y.; Sanjaya, J. Predicting Mechanical Properties of Magnesium Matrix Composites with Regression Models by Machine Learning. J. Compos. Sci. 2023, 7, 347. https://doi.org/10.3390/jcs7090347
Huang S-J, Adityawardhana Y, Sanjaya J. Predicting Mechanical Properties of Magnesium Matrix Composites with Regression Models by Machine Learning. Journal of Composites Science. 2023; 7(9):347. https://doi.org/10.3390/jcs7090347
Chicago/Turabian StyleHuang, Song-Jeng, Yudhistira Adityawardhana, and Jeffry Sanjaya. 2023. "Predicting Mechanical Properties of Magnesium Matrix Composites with Regression Models by Machine Learning" Journal of Composites Science 7, no. 9: 347. https://doi.org/10.3390/jcs7090347