Article

Predicting Mechanical Properties of Magnesium Matrix Composites with Regression Models by Machine Learning

by
Song-Jeng Huang
*,
Yudhistira Adityawardhana
* and
Jeffry Sanjaya
Department of Mechanical Engineering, National Taiwan University of Science and Technology, No. 43, Section 4, Keelung Rd., Da’an District, Taipei 10607, Taiwan
*
Authors to whom correspondence should be addressed.
J. Compos. Sci. 2023, 7(9), 347; https://doi.org/10.3390/jcs7090347
Submission received: 27 July 2023 / Revised: 16 August 2023 / Accepted: 18 August 2023 / Published: 22 August 2023
(This article belongs to the Section Metal Composites)

Abstract

:
Magnesium matrix composites have attracted significant attention due to their lightweight nature and impressive mechanical properties. However, the fabrication process for these alloy composites is often time-consuming, expensive, and labor-intensive. To overcome these challenges, this study introduces a novel use of machine learning (ML) techniques to predict the mechanical properties of magnesium matrix composites, providing an innovative and cost-effective alternative to conventional methods. Various regression models, including decision tree regression, random forest regression, extra tree regression, and XGBoost regression, were employed to forecast the yield strength of magnesium alloy composites reinforced with diverse materials. This approach leverages existing research data on matrix type, reinforcement type, heat treatment, and mechanical working. The XGBoost Regression model outperformed the others, exhibiting an R2 value of 0.94 and the lowest error rate. Feature importance analysis from the best model indicated that the reinforcement particle form had the most significant influence on the mechanical properties. Our research also identified the optimized parameters for achieving the highest yield strength at 186.99 MPa. This study successfully demonstrated the effectiveness of ML as a valuable, novel tool for optimizing the production parameters of magnesium matrix composites.

1. Introduction

Magnesium alloys are lightweight materials with many industrial applications due to their high rigidity, strength, and excellent castability. They are lighter (lower density) than other metals such as aluminum and steel, have excellent damping capacity, a high recycling rate, and exhibit good machinability. Additionally, they are a viable alternative material for aerospace and automotive components [1,2]. AE (Aluminum-Rare Earth Metal), AM (Aluminum-Manganese), AS (Aluminum-Silicon), and AZ (Aluminum-Zinc) represent types of magnesium alloy-based element systems.
AZ elements are commonly used as magnesium alloying elements because they are advantageous, inexpensive, and highly soluble. The addition of aluminum to magnesium alloys can enhance the strength and melting point of the alloy. Besides aluminum, zinc can increase magnesium alloy strength without diminishing ductility, casting fluidity, or corrosion resistance [3,4,5]. AZ Magnesium alloys can be made into metal matrix composites by incorporating ceramic reinforcements in micro and/or nanoforms, such as silicon carbide (SiC), tungsten carbide (WC), tungsten disulfide (WS2), and others [6,7,8,9]. Besides ceramic reinforcement, graphene (carbon-based material) and eggshell (biomaterial) have also been used for magnesium composite reinforcement [10,11].
In most cases, magnesium matrix composites are produced by stir casting, and additional experimental methods are being implemented to improve their mechanical properties, such as heat treatment and mechanical working (extrusion and equal channel angular pressing) [12,13]. Despite the potential for improvement via experimentation, the production of magnesium matrix composites poses some challenges, such as being time-consuming, expensive, and labor-intensive. To address this, our study introduces a novel approach that employs machine learning to overcome these challenges. This method not only conserves time and resources but also leverages the existing body of research on magnesium matrix composites by incorporating data from previous studies [14].
Machine Learning (ML) technology, a branch of artificial intelligence, is currently trending in materials research. Considered a promising tool for the design and discovery of novel materials for a variety of applications, ML offers different algorithms that can expedite composite material research [15,16]. However, the application of ML to predict the mechanical properties of magnesium matrix composites offers a fresh and innovative perspective that remains largely unexplored. It is important to note that there is no exact equation to optimize parameters for achieving these mechanical properties due to a vast array of influencing factors, including the type of reinforcement, the particle size of the reinforcement, the processing method, and the interactions among these factors [17,18,19]. These parameters add a layer of complexity that makes it challenging to create an analytical equation to calculate the yield strength of a composite based on fabrication parameters. Therefore, ML emerges as a powerful tool to tackle this challenge. It can learn from datasets of previous research, predict results, and optimize the parameters needed to maximize the mechanical properties.
Regression methods serve as one approach that can be used to predict the mechanical properties of magnesium matrix composite materials such as the yield strength of the materials. Several regression models from machine learning, such as decision tree regression, random forest regression, extra tree regression, and XGBoost regression, can be used for this purpose [20,21]. Various input parameters, including matrix type, reinforcement type, heat treatment, and mechanical working, can be used to predict mechanical properties. Therefore, in this research, ML will be employed to predict mechanical properties using the best regression model algorithm, which utilizes data from previous research. By focusing on this multiple-model strategy, this research provides a novel framework for predicting the yield strength of magnesium matrix composite.

2. Literature Review

2.1. Mechanical Properties of Magnesium Matrix Composites

Magnesium alloys are lightweight materials with low density, making them suitable for mass savings and potential replacements for traditional alloys such as steel. Moreover, these alloys exhibit high specific strength, excellent thermal conductivity, good castability, machinability, and a remarkable damping capacity [17,22,23,24]. Due to their many advantages, magnesium alloys can serve as matrix materials in composite structures, incorporating various reinforcements to enhance their strength. These reinforcements may include ceramic, carbon-based materials, and others. Furthermore, magnesium matrix composites are commonly fabricated via the stir-casting process [17]. The mechanical properties of magnesium composites can be determined by the yield strength (YS). The YS refers to the point at which a material undergoes plastic deformation and fails to revert to its initial shape once the applied stress is removed. This property is important because it characterizes the highest stress a material can withstand before experiencing permanent deformation. Engineers frequently rely on this property when evaluating materials for specific applications [25].
There are several factors that can influence the yield strength of magnesium composites. Firstly, the matrix in a composite material acts as the continuous phase and transfers stress to the reinforcement. In magnesium composites, the matrix can be made from various magnesium alloys [24,26]. Secondly, the reinforcement in a composite material is embedded within the matrix to enhance the composite’s strength. Several factors regarding the reinforcement need to be considered. First, different types of reinforcement, such as ceramic, carbon-based, and other materials, exhibit distinct properties. Secondly, the size or form of the reinforcement can also influence the composite’s strength. Thirdly, the percentage of reinforcement is another crucial factor; increasing the percentage can lead to higher yield strength [27]. Thirdly, heat treatment can influence the yield strength because this process can heat and cool a material to modify its microstructure, which in turn affects the material’s mechanical properties. In magnesium alloys, various types of heat treatment are available, such as T4, T5, and T6 [3]. Lastly, mechanical working can also influence the mechanical properties because processes such as extrusion and equal channel angular pressing (ECAP) subject a material to plastic deformation, resulting in changes in its shape and microstructure, which in turn affect the mechanical properties [28].

2.2. Machine Learning Regression Algorithm Model

Regression algorithm models are used to predict mechanical properties because these models can establish relationships between independent variables such as matrix and reinforcement and dependent variables such as mechanical properties (YS). Independent variables can be input parameters, and dependent variables can be output parameters. The independent parameters can be obtained from several factors that affect the output parameter. The output parameter, YS (Yield Strength), is a continuous variable; hence, a regression model is suitable to predict continuous output [29,30,31]. Previous research using machine learning, as shown in Table 1, provides an overview of the current state of research on magnesium matrix composites, their production techniques, and recent advancements in the use of machine learning to predict mechanical properties. The aim is to contextualize our study within the larger field and highlight the novelty of our approach.
From the review outlined in the table above, it is evident that different machine learning models can yield varied performance levels when applied to similar problems. Therefore, the adoption of multiple machine learning algorithms in this study becomes crucial for obtaining a comprehensive understanding of their potential. Notably, (“there are”) few studies that have explored the application of several machine learning models specifically to magnesium matrix composites, highlighting a significant gap in current research. There are several regression models that can be applied for prediction, including decision tree, random forest, extra tree, and XGBoost regressions. These models have been successfully utilized in previous research to predict the mechanical properties of various materials. Figure 1 displays the graphical representation of four different regression models.
The decision tree model is represented as a tree-like structure, as depicted in Figure 1a, which mirrors a flowchart with nodes symbolizing the evaluation of features, as cited in [34]. This approach has the capacity to segregate a dataset into branches that form an upside-down tree consisting of a root node, internal nodes, and leaf nodes. The root node signifies an initial decision that leads to the division of the entire data into two or more distinct groups. The internal nodes symbolize the subsequent choices made within the tree framework, while the leaf nodes represent the final outcome achieved via a series of decisions.
The decision tree regression is a variant of the decision tree model that specifically deals with complex non-linear relationships, in contrast to decision tree classification. The algorithm aims to divide the data in a manner that reduces the total sum of the squared differences between the data points and the average within each division. The algorithm transforms a multifaceted decision-making procedure into a series of more manageable decisions, which are illustrated as a tree structure [36]. The random forest regression employs the foundational concept of decision trees but takes it a step further by constructing multiple decision trees and their predictions to yield a more precise and robust estimation. It is adept at handling both classification and regression problems. As depicted in Table 2, the generalization error tends to plateau with an increase in the number of trees, indicating that random forest does not succumb to overfitting even when employing a larger number of trees [37].
The extra tree regression is an ML algorithm that is an extension of the random forest algorithm. However, similar to random forest, extra tree builds an ensemble of decision trees. While random forest uses bootstrapping to create distinct training datasets for each tree, the extra tree trains each tree on the whole training dataset, making it less likely to overfit the data than random forest [38]. XGBoost regression, an advanced iteration of the gradient boosting algorithm, is known for its rapid computation and exceptional performance. In Figure 1d, there are two types of errors highlighted: bias error and variance error. Bias error results from overly simplified model assumptions or when the model fails to account for the effect of all the features. On the other hand, variance error occurs when the model makes complex assumptions, thereby learning variables that are unrelated to the provided datasets [39]. XGBoost regression employs two strategies to mitigate these errors. It uses bagging, an ensemble learning method, to reduce variance error, and introduces gradient boosting to lower bias error. The latter involves creating a robust predictive model by amalgamating several weak models [40]. As depicted in Table 2, XGBoost regression is exceedingly fast. This speed is attributed to its combination of the gradient boosting machine concept and cause-based decision trees [36].
Table 2. Regression models with strengths and limitations [37,41,42,43].
Algorithm ModelStrengthsLimitations
Decision trees regressionSimple computation;
easy to understand and
interpret
Easy to overfit; neglects
correlation among data
Extra tree regressionComputational efficiencySimilar to random forest
Random forest regressionIt can be utilized for predicting numerical values (regression) and categorizing data (classification) without the necessity to standardize the features; clear of over-fitting.No interpretability; performance is not good when there is a class imbalance
XGBoost regressionFeature preparation, such as filling in missing values or tweaking the size and span of features, is not required; it can be used for tasks like sorting data into categories, making predictions on numbers, or putting things in a specific order; it is extremely fast and highly effective for its ability to do multiple calculations simultaneouslyOnly for numeric features; leads to overfitting if hyperparameters are not adjusted

3. Materials and Methods

3.1. Materials

In this study, we collected data from previous research papers on AZ31, AZ61, and AZ91 magnesium alloy composites with various reinforcements. All of these composites were fabricated using the stir-casting process. The data collected from previous research had different parameters to obtain the mechanical properties, so these problems can be input as parameters for ML prediction. The collected data is presented in Table 3. The data consisted of six input parameters: matrix, reinforcement, reinforcement particle form, variation of reinforcement, heat treatment, and mechanical working. Meanwhile, the output parameter was the mechanical property of the material, specifically the yield strength obtained from tensile tests. The reason to take input and output parameters was explained in Section 2. The parameter diagram is shown in Figure 2.

3.2. Methods

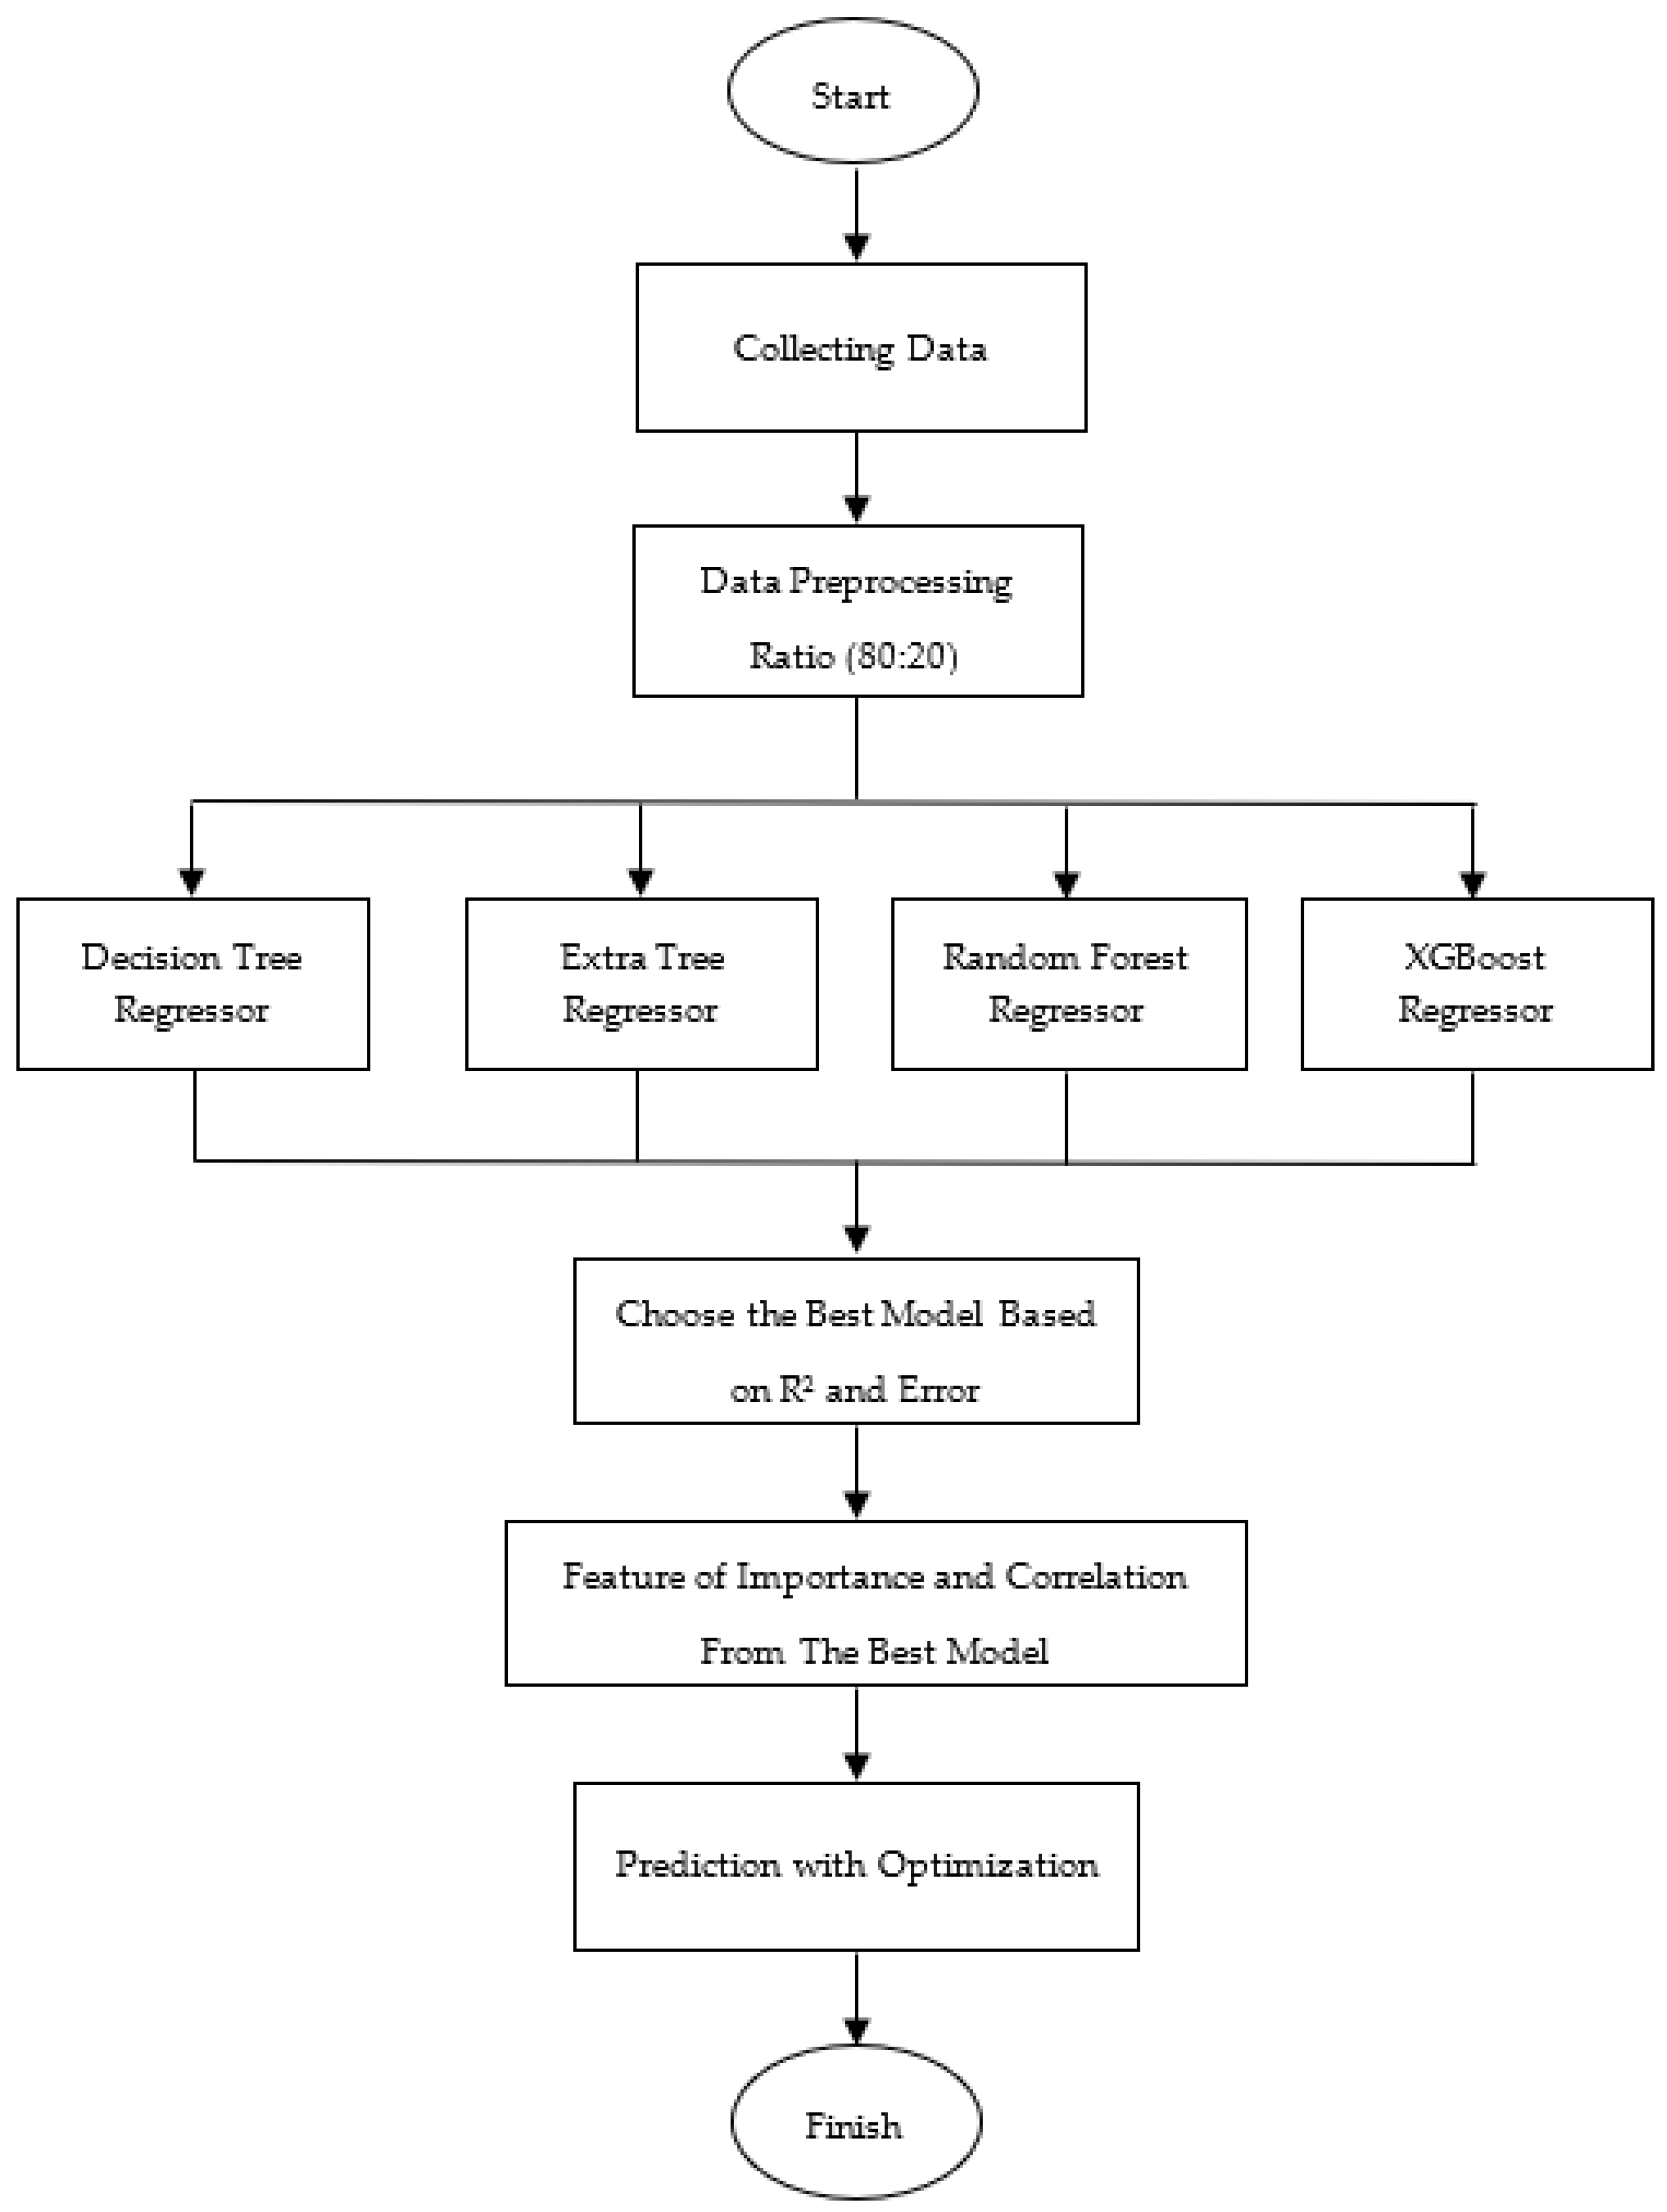
The data was analyzed using ML employing various regression methods, which were particularly adept at predicting continuous data such as mechanical properties. The dataset was split into training and testing subsets in an 80:20 ratio and subjected to 10 random cycles. The Python programming language was used to implement the regression model algorithms. In this research, we developed several regression models, namely the decision tree, extra tree, random forest, and XGBoost regressors. Figure 3 illustrates the flowchart of this study.
To determine which model offers the most accurate and reliable predictions, an evaluation of model performance was conducted. In this step, the previous regression models were assessed using various mathematical formulas. In these formulas, Xi denotes the predicted ith value, while Yi represents the actual ith value from the ground-truth dataset. The mean absolute error (MAE) was used to calculate the average of the absolute differences between the predicted and actual values, as shown in the following equation:
MAE = 1 m   i = 1 m X i Y i
Equation (2) displays the RMSE, or root mean square error, which is the average root squared difference between the actual and predicted values, while Equation (3) displays the coefficient of determination (R2 or R-squared), which can be interpreted as the proportion of the variance in the dependent variable that can be predicted from the independent variables (accuracy). Based on all model performance evaluations, the model with the highest R2 and the smallest error was chosen as the best model [16,29,51].
RMSE = 1 m i = 1 m ( X i Y i ) 2
R 2 = 1 i = 1 m ( X i Y i ) 2 i = 1 m ( Y ¯ Y i ) 2

4. Results and Discussion

4.1. Evaluation-Based Error and R2

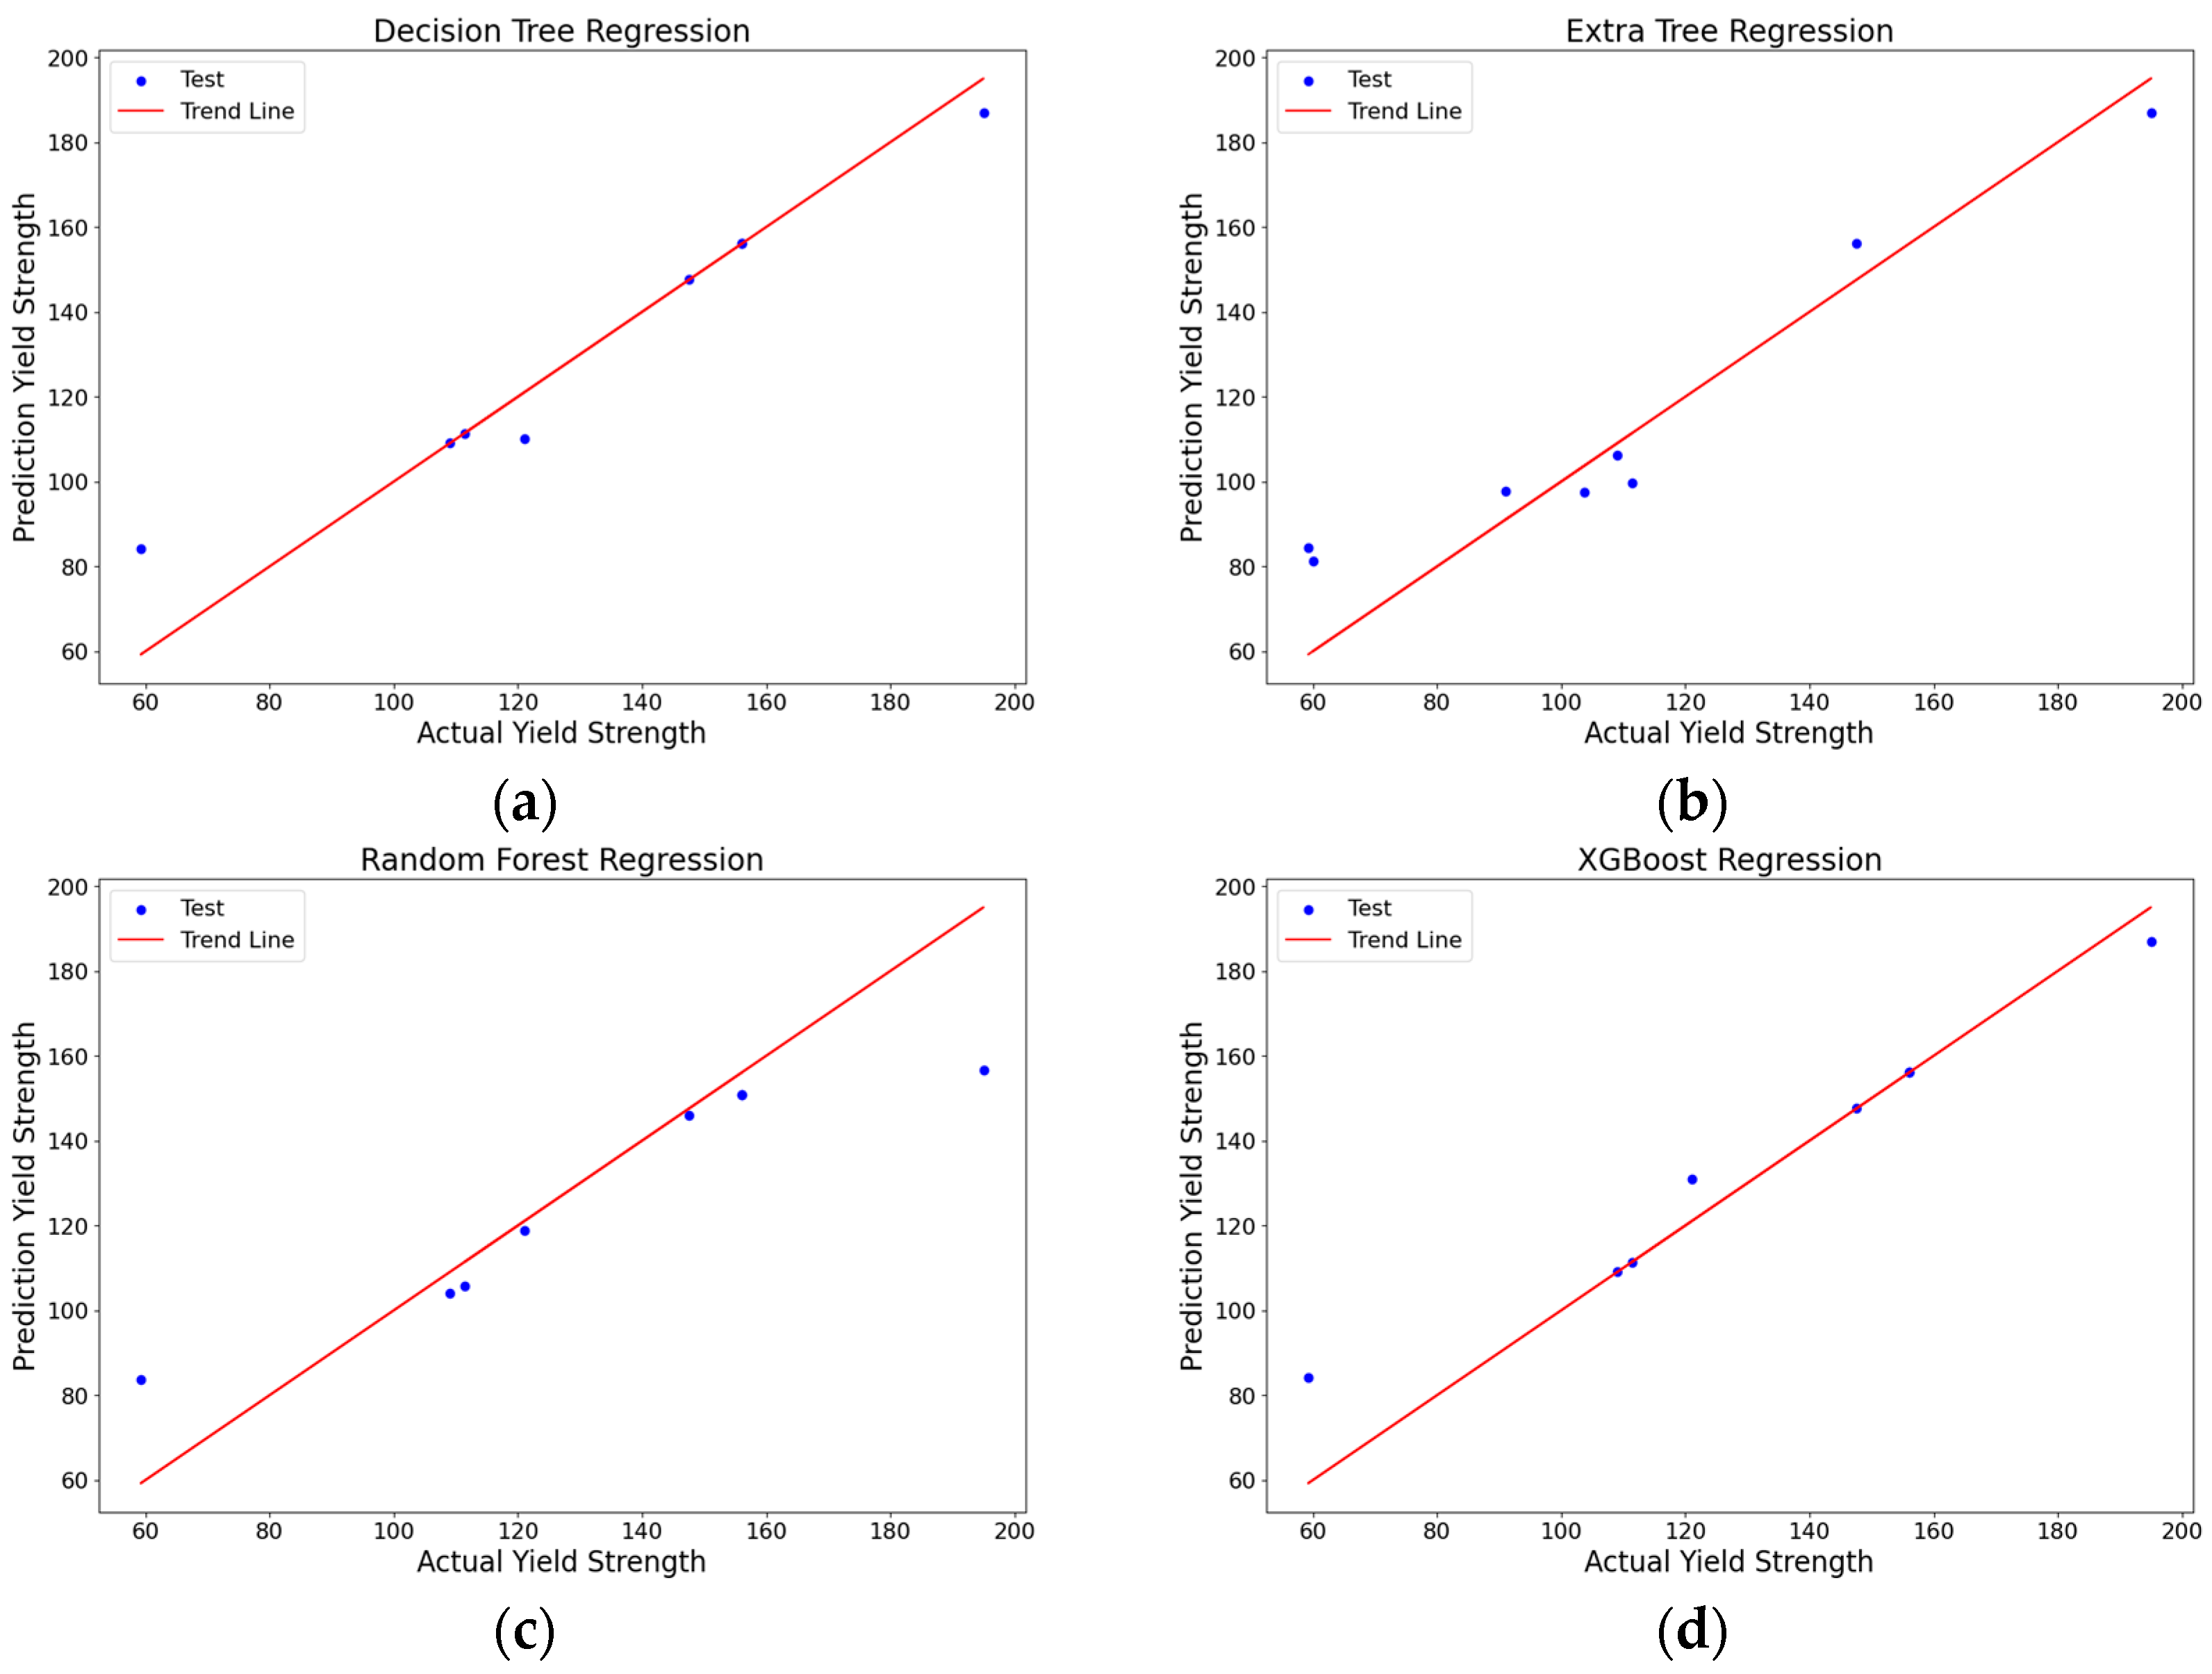
The datasets consisted of six parameter input values and one parameter output value that were predicted with four regression models. Each regression result had a different error and R2 values, and these values were used to determine the best model to predict the data. The results of the actual and predicted values of the regression models are shown in Figure 4. Each regression had a different mechanical property (YS) prediction and affected the trend line of the graph (regression line). Based on the graph, it can be seen that the test data values in Figure 4b,c are not too close to the trend line. Meanwhile, the test data values in Figure 4a,d are closer to the trend line. These results can be related to the accuracy of the data that was scored by R2 (the coefficient of determination) [52].
The quality fit of the regression models was initially assessed using R². The model with the highest accuracy was then selected as the best model. If the values of R² fall between 0 and 1, then the model partially predicts the outcome. If R² reaches 1, then the model perfectly predicts the outcome. Table 4 shows how to interpret the value of R². The closer R² is to 1, the greater the proportion of the total variation of the predicted values that is explained by the independent variable [53].
In this study, we also accommodated the error rates of each model using MAE and RMSE, as they are commonly used in ML studies. It is important to note that evaluating the performance of regression models by considering the values of these error rates individually can be misleading since each metric provides a different perspective on the errors and does not give a comprehensive overview of how well the model is performing [53]. Therefore, in addition to MAE and RMSE, we took into account the R² values. R² provides an insight into how much of the variability of the dependent variable can be explained by the model, while MAE and RMSE give perspectives on the magnitude and distribution of errors.
Table 5 shows the evaluation of four different regression models. The highest R2 in XGBoost regression was 0.94, and this model also had the smallest error-based MAE and RMSE of 8.81 and 10.42, respectively. The smallest R2 in the random forest regression was 0.80, with the biggest error-based MAE and RMSE of 18.63 and 14.21, respectively. Based on Table 3, only the random forest regression model exhibits a high level of influence, as indicated by an R2 value below 0.82. Although the other models had closeness levels higher than 0.82, the XGBoost regression model stood out as the best among all the results. It exhibited the highest R2 value and the smallest error, making it the preferred choice for data prediction. Furthermore, a value closer to 1 indicates a strong fit with close agreement between the predicted and the actual values [53].

4.2. Feature of Importance and Correlation Matrix

4.2.1. Feature of Importance and Correlation Matrix from the Best Model

A feature of importance indicates the contribution of each feature (input parameter) to the model’s output parameter [54]. The feature importance analysis from the best model (XGBoost regression) revealed that the parameter with the highest influence on the predicted mechanical properties was the reinforcement particle form. In contrast, the variation of reinforcement had the least influence. Figure 5 provides detailed information regarding the importance of the features.
The feature importance scores showed that the reinforcement particle form had a score of 0.513715, indicating its strong impact on the properties. This finding is consistent with the review paper by Haotian Guan et al. [24], which concluded that the form of reinforcement particles, whether in micro or nano size, significantly influenced the mechanical properties of magnesium composites.
The reinforcement particle form in the dataset was classified as either micro or nano. In comparison to micro-sized particles, nano-sized particles are smaller. This size difference causes nano-sized particles to have a greater surface/volume ratio. As a result, nano-sized reinforcement particles tend to result in materials with enhanced mechanical properties. This occurs due to the fact that the increased surface area permits enhanced interfacial bonding and strengthening effects, resulting in improved mechanical performance. The feature importance analysis suggested that the selection of nano-sized reinforcement particles, with their associated higher surface area to volume ratio, significantly contributes to the improvement of the material’s mechanical properties [55].
The second most influential parameter was reinforcement with a score of 0.143190. The dataset for magnesium composites included reinforcements made of various materials, each with distinct properties [56]. These materials encompassed ceramics, carbon-based materials, and biomaterials. Following reinforcement, the third most influential parameter was mechanical working, scoring 0.117660, followed by the matrix with a score of 0.102627. The fourth parameter was heat treatment with a score of 0.102301, and the fifth was the variation of reinforcement with a score of 0.020506.
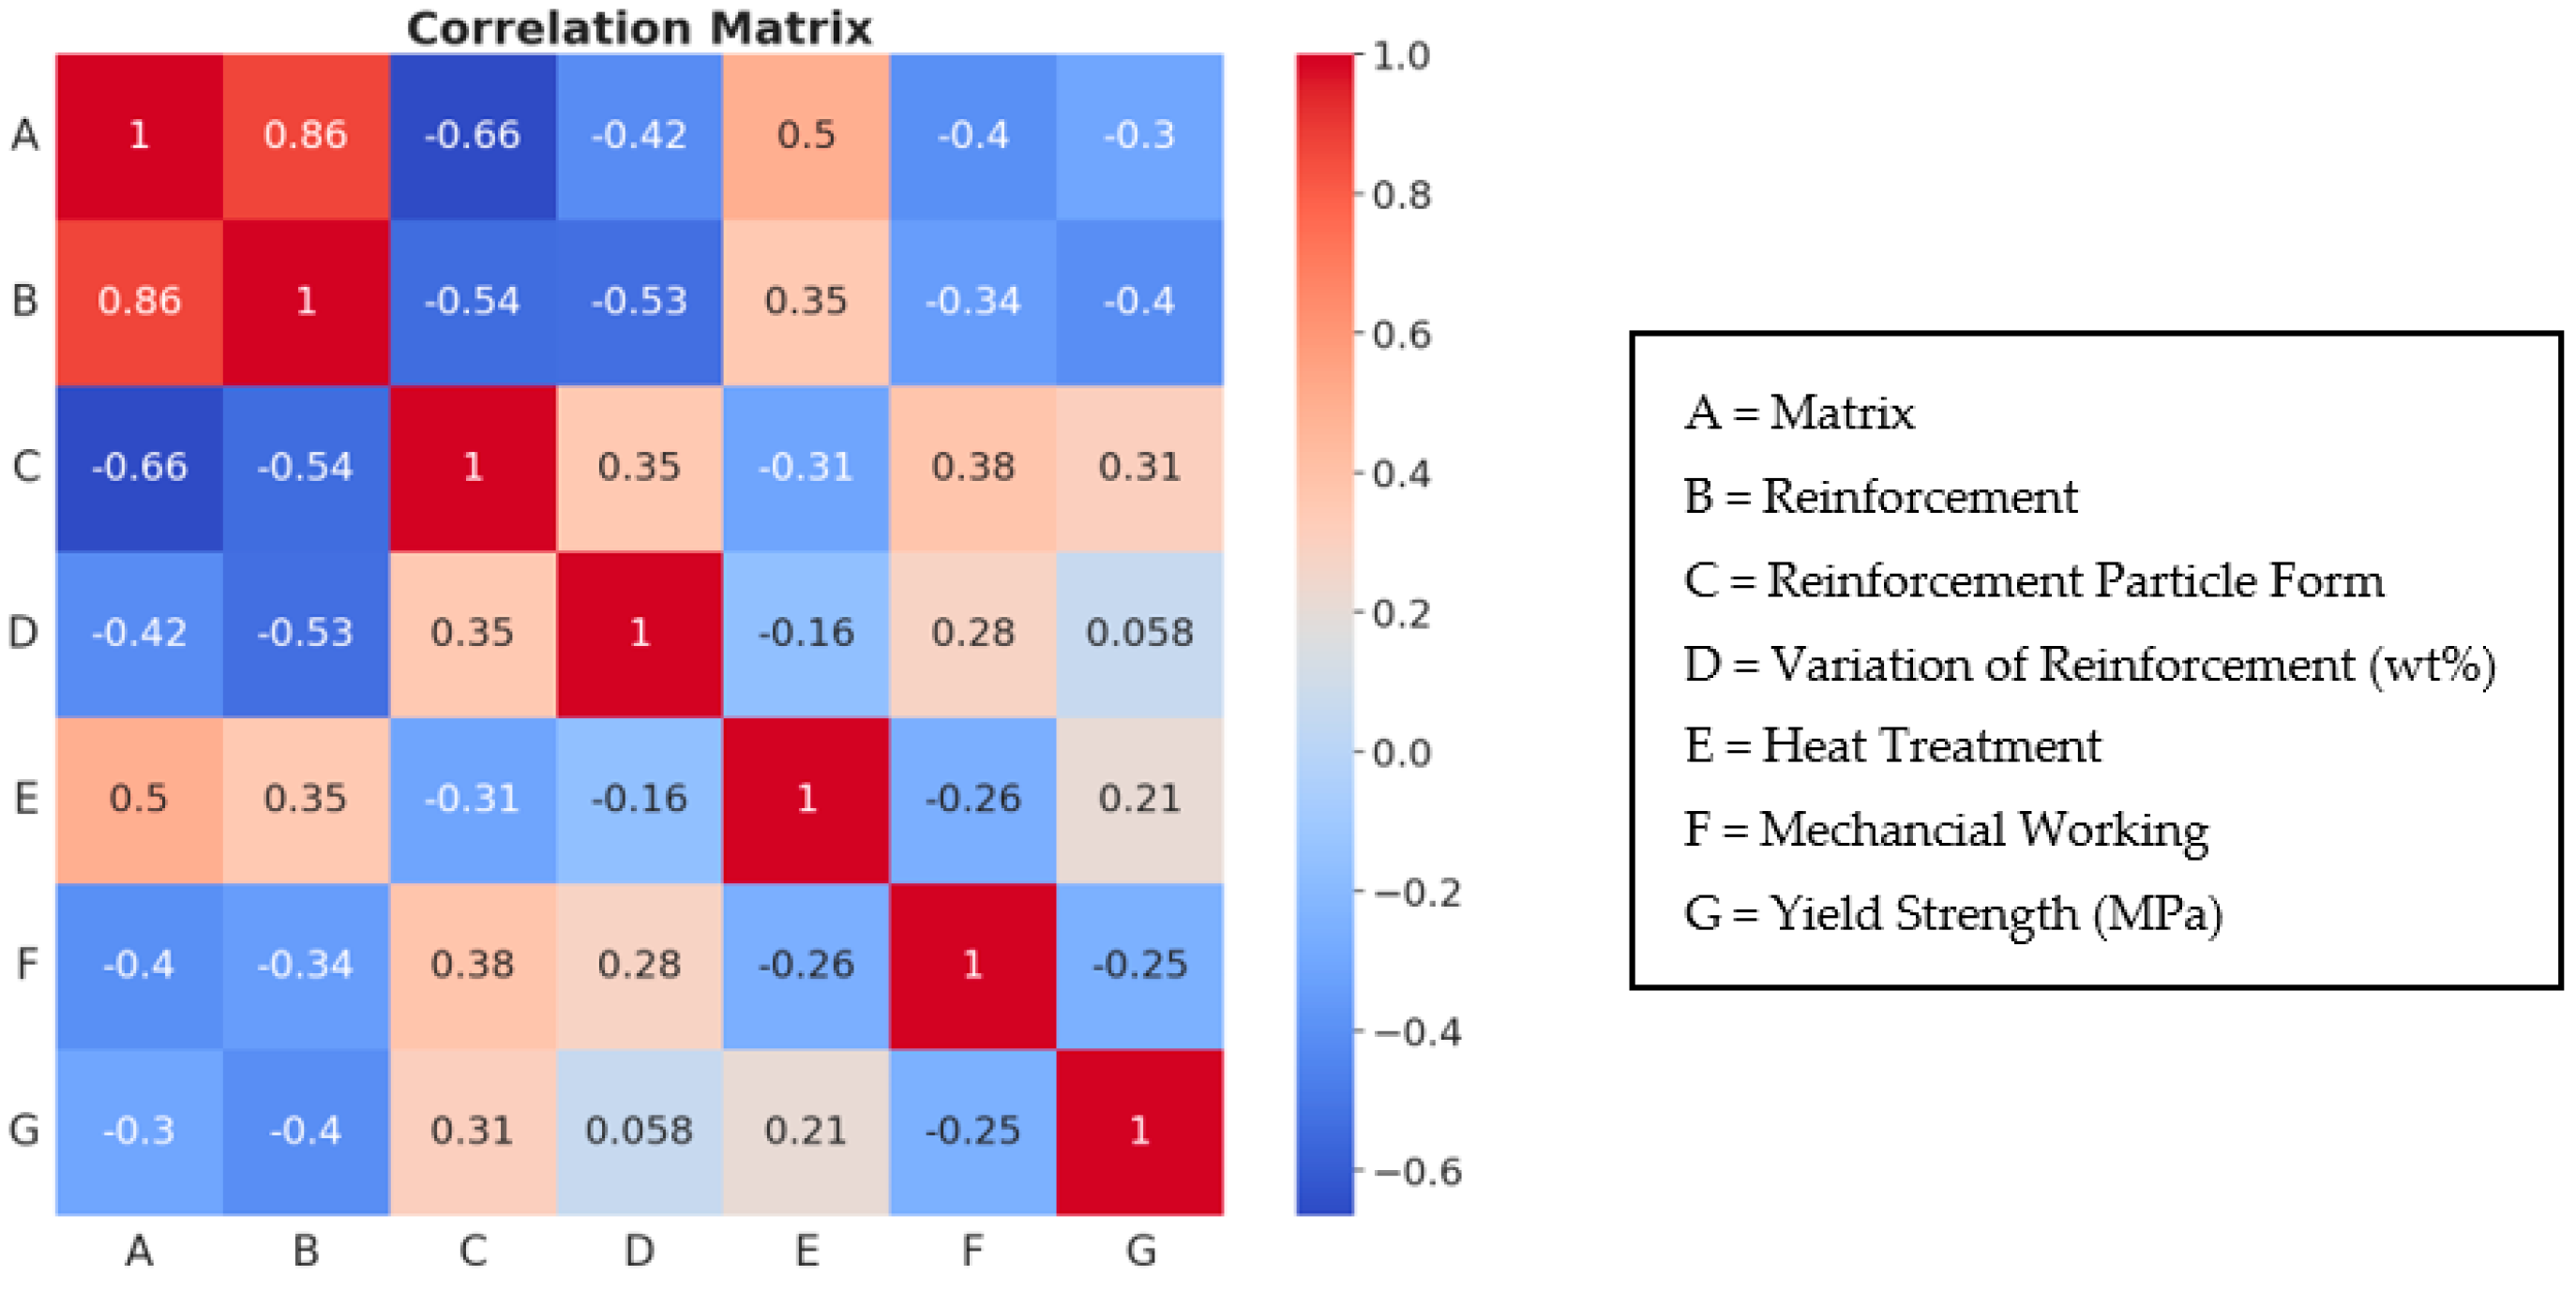
Figure 6 illustrates the correlation matrix, showcasing the correlation values among all parameters. The graph utilizes color coding to represent the values, with darker shades of red indicating a positive correlation (>0) between variables while darker shades of blue indicating a negative correlation (<0). The correlation coefficient value was approximately 1. Notably, positive correlations were observed between matrix and heat treatment, reinforcement and heat treatment, reinforcement particle form and YS, mechanical working and variation of reinforcement, heat treatment and YS, mechanical working and variation of reinforcement, as well as YS and variation of reinforcement. These positive correlations suggested a strong relationship between these variables [33].

4.2.2. Feature of Importance and Correlation Matrix from Other Models

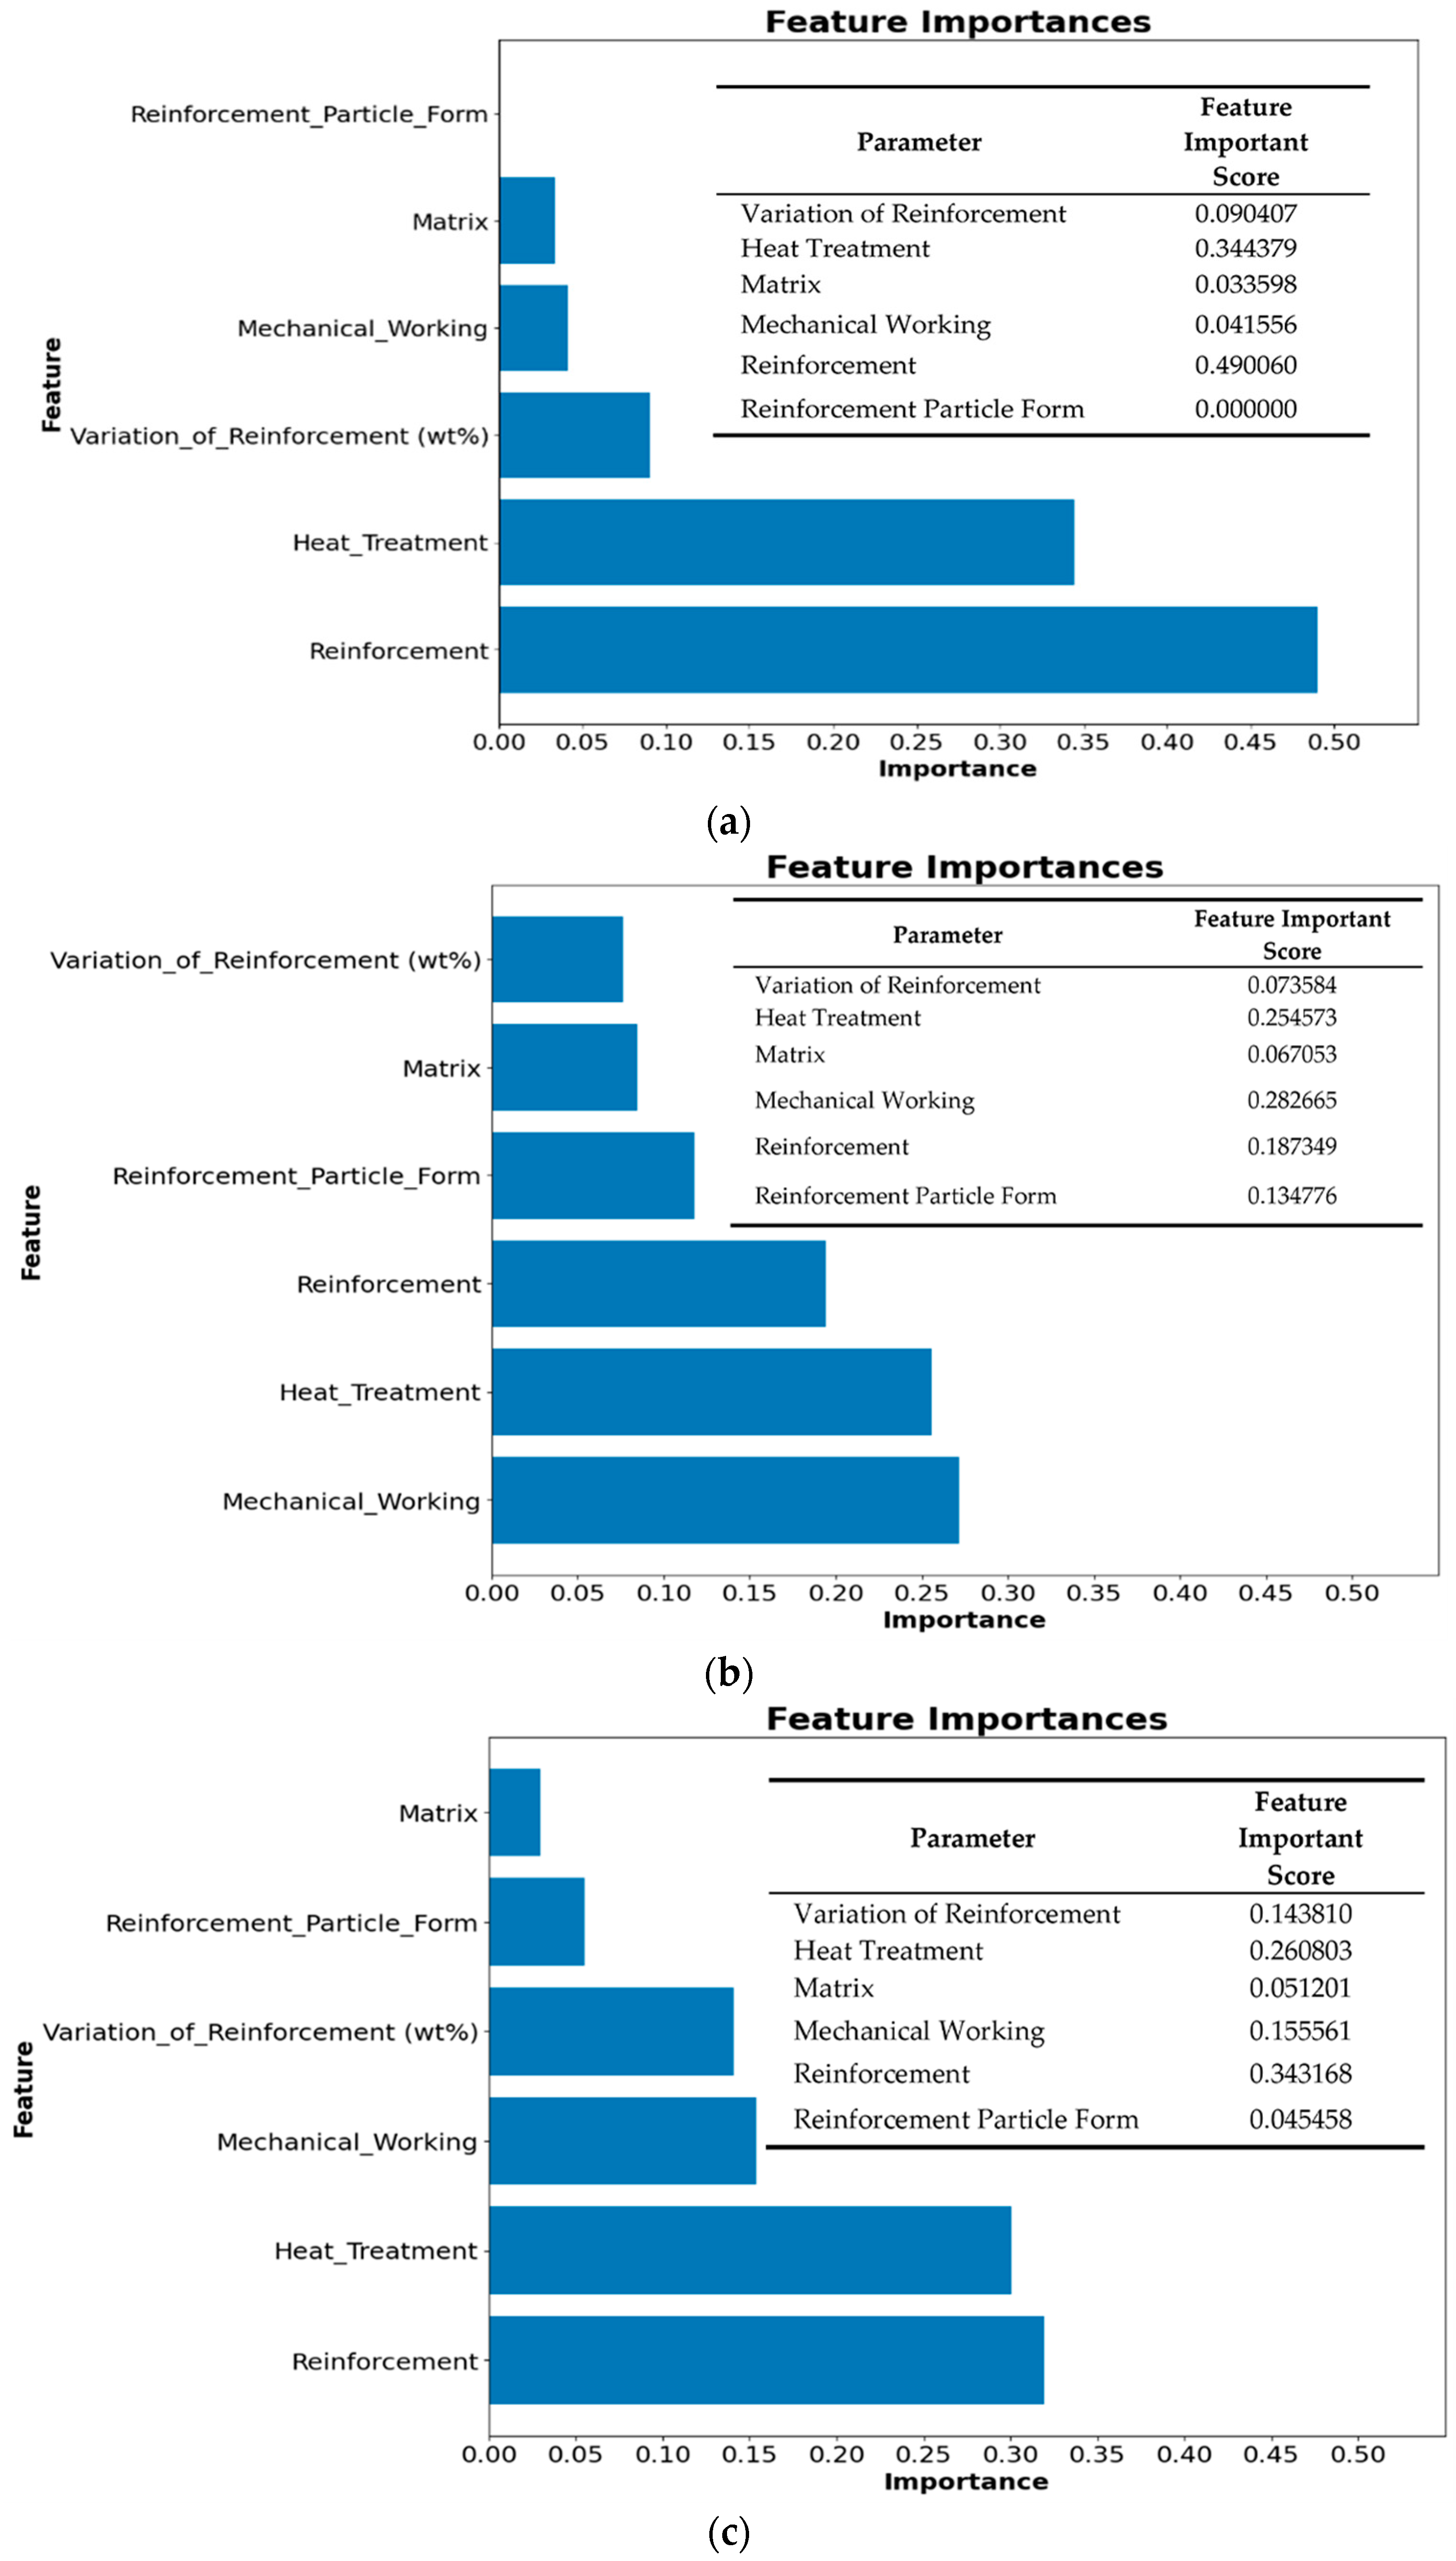
This study also explored feature importance and correlation matrices from alternative models. This approach helped validate the consistency of our feature importance results across different predictive methodologies. Figure 7 below provides a comparative analysis of feature importance as determined by multiple models. The importance values are depicted in the figure or sorted in descending order for clarity and ease of comparison. The analysis reveals that different machine learning models can produce varying rankings of feature importance. This variability arises from the distinct ways in which each model handles and interprets features [57].
In the case of Decision Tree regression, the feature ‘reinforcement’ holds the most importance, implying that slight variations in this feature can significantly impact the result. Conversely, the feature ‘reinforcement particle form’ holds the least importance. This discrepancy arises from the unique calculations and criteria used by the Decision Tree regression algorithm to determine feature importance. According to Kazemitabar J. et al. [58], in their research “Variable importance using decision trees”, the method of ‘tree weight’ was utilized, where the feature importance score for a variable was calculated by summing the impurity reductions of all nodes in the tree. As ‘reinforcement particle form’ did not appear in a split in the dataset used, its feature importance was zero, indicating that the Decision Tree model was not able to capture its relationship with the target.
In the context of Extra Trees Regression, the feature ‘variation of reinforcement’ is of utmost importance, while ‘mechanical working’ holds the least significance. The calculation of feature importance in Extra Trees Regression involves using random subsets of features, with the importance of a feature measured by averaging the reduction in the criterion across all trees in the forest. This results in a more distributed value for each feature compared to other models used [43]. Random Forest Regression exhibits a different ranking result yet again, with the ‘matrix’ feature holding the least importance, and ‘reinforcement’ the most. This can be attributed to the algorithm’s use of multiple decision trees, which can capture more complex interactions of the features [59]. These findings underscore the importance of choosing the appropriate model for data analysis, as each model interprets the feature importance differently and can therefore lead to varying interpretations of the data.
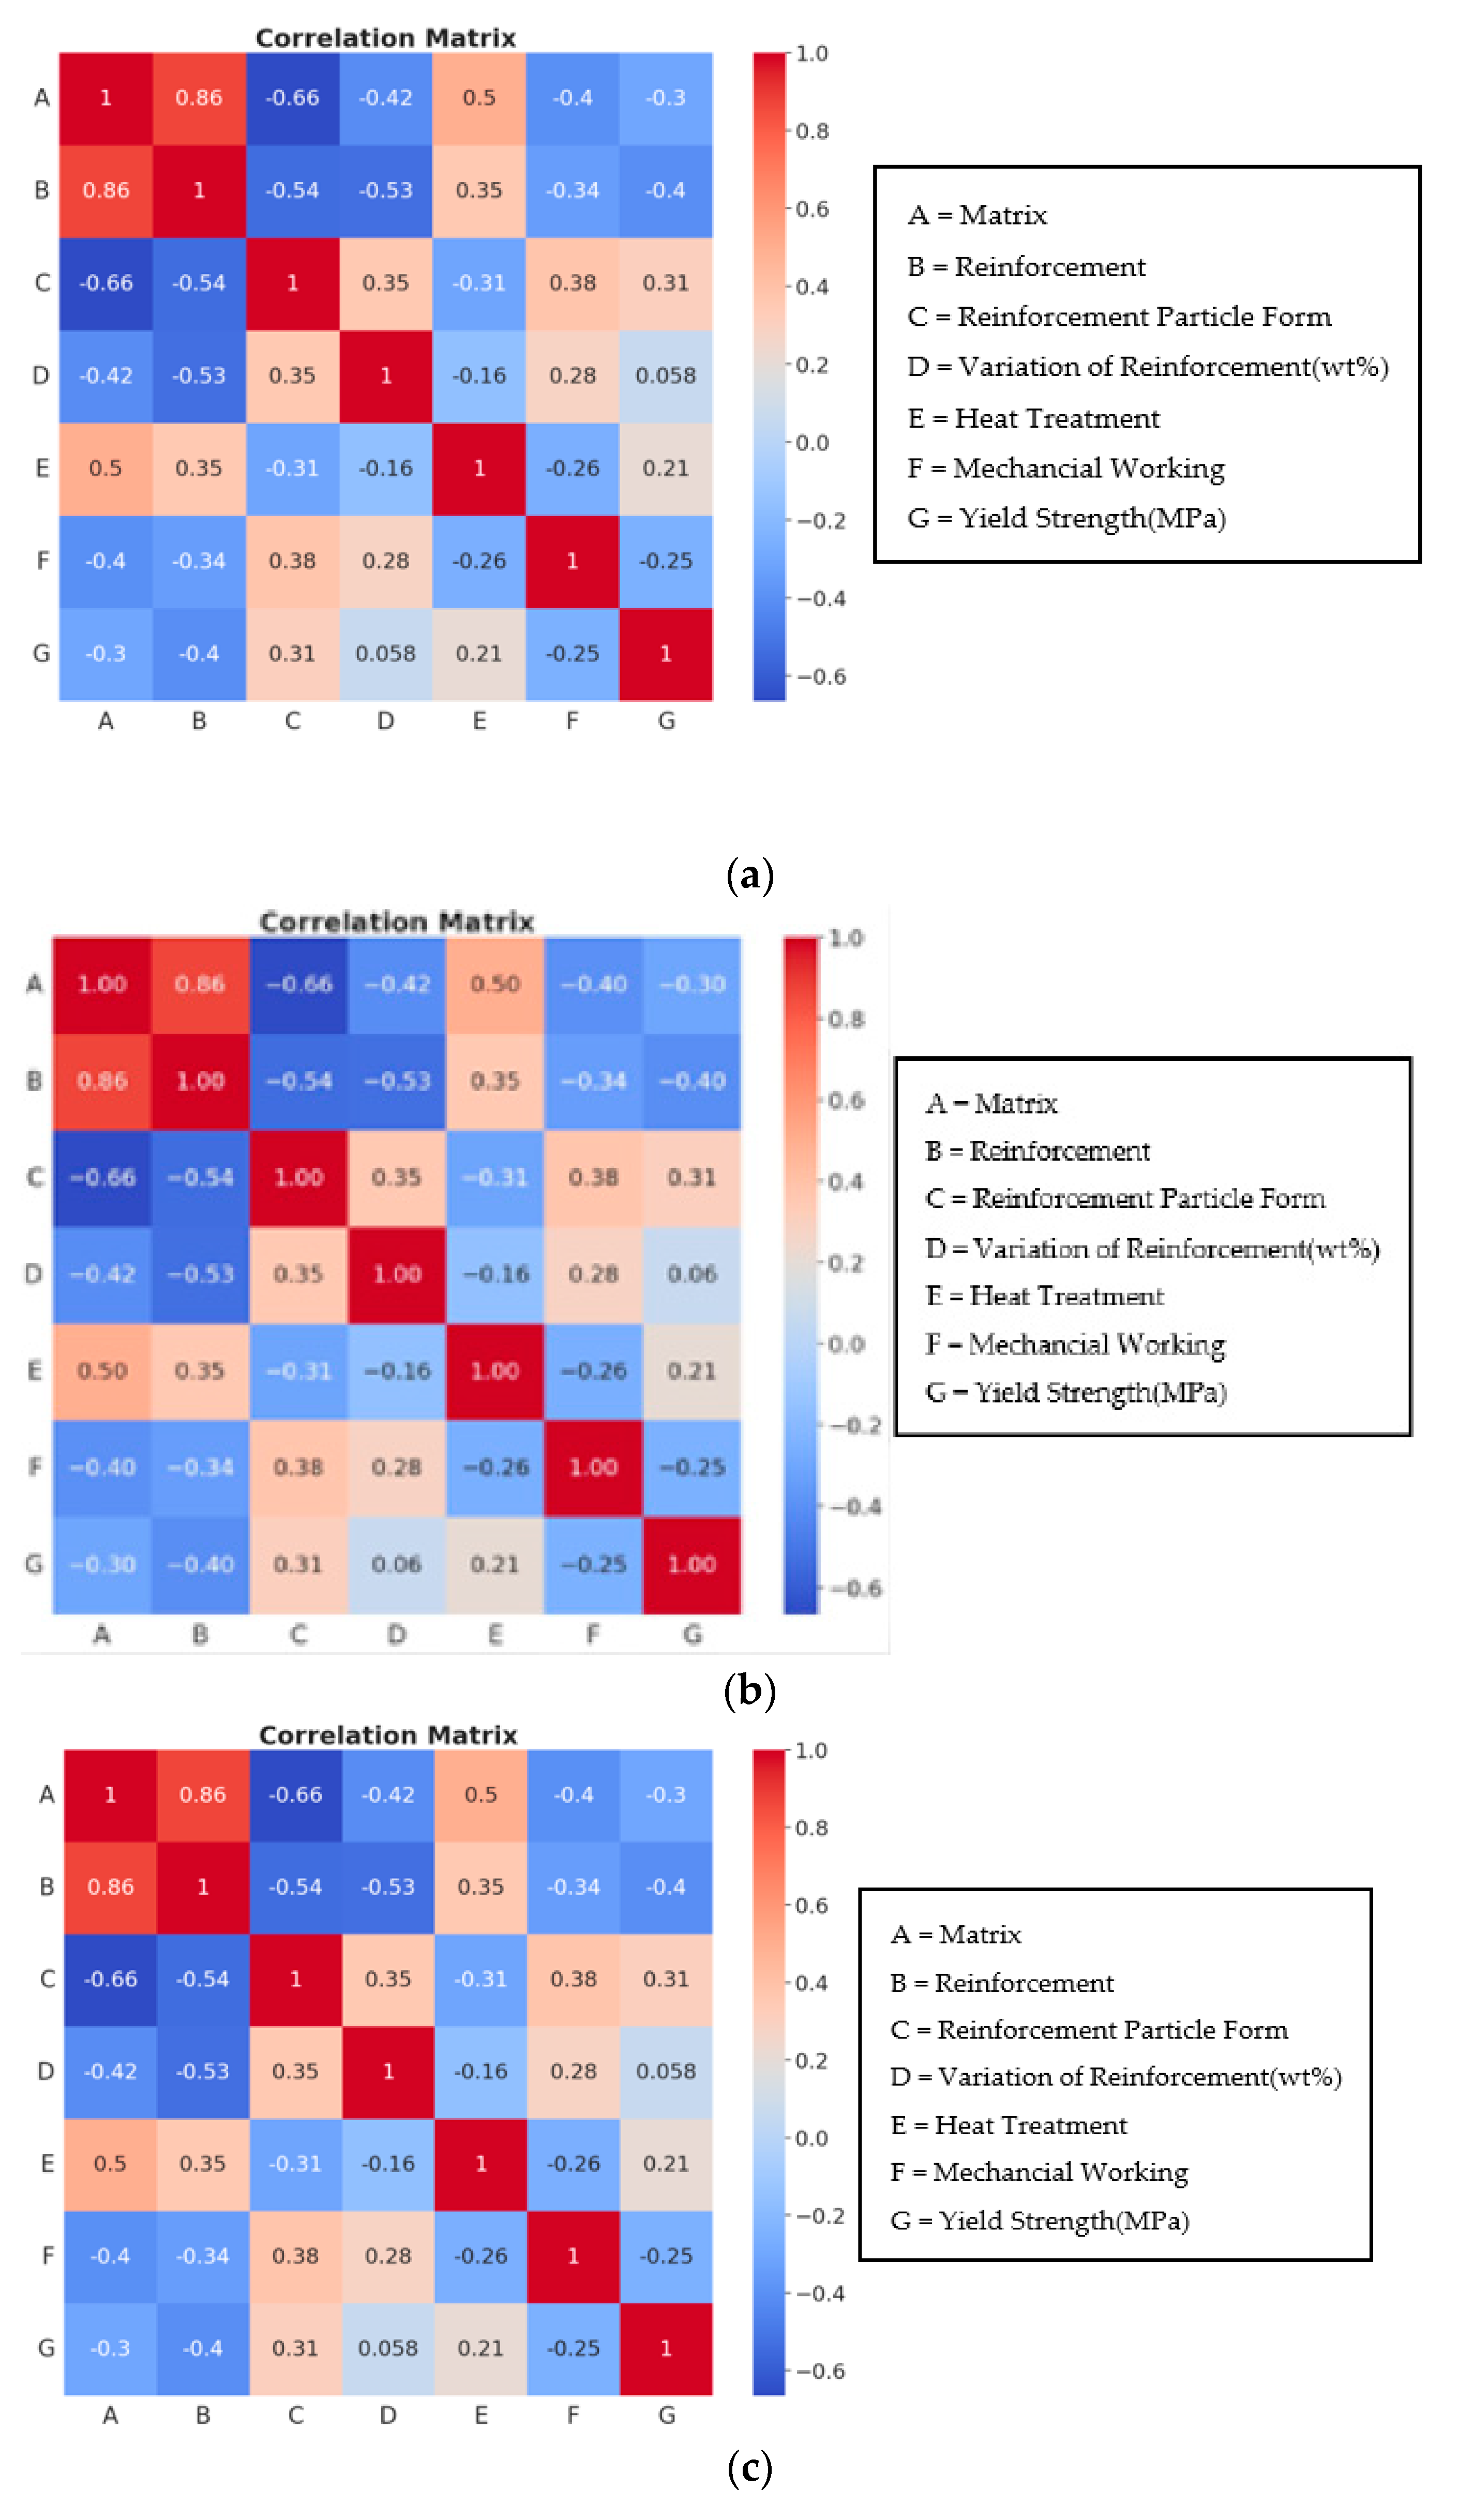
Figure 8 below shows the correlation matrix of each different algorithm used. This kind of approach is a more comprehensive way to show correlation. It can be seen that the correlation matrix of each model shown are almost the same, especially for the correlation of the matrix material and the reinforcement, which highlight the highest correlation matrix. While the lowest correlation matrix is the correlation of Variation of Reinforcement and yield strength, notice that the yield strength is the output of this study. This approach also confirms the feature importance from Figure 6 shown before.
It is notable that the correlation matrix from both the Extra Tree regression and the Random Forest regression are similar. This similarity is anticipated as both are tree-based ensemble methods that share many commonalities in their underlying algorithms [60]. While these correlations provide valuable insight into the linear relationships between the predictors and the target variable, it is important to bear in mind that they do not necessarily mirror the feature importances as shown in Figure 6. The importance of a feature in a machine learning model is not only determined by its correlation with the target variable but also by how it interacts with other features. This makes the interpretation of feature importance a multifaceted task.
However, the consistency in both the highest and lowest correlation across different machine learning models, despite slight variations in values, highlights the robustness of our findings. It underscores the strength of our multi-model approach, providing a comprehensive understanding of the various factors influencing the yield strength of magnesium matrix composites. By considering potential variations in predictions across different models, we have not only enhanced the robustness of our findings but also their credibility.

4.3. Prediction with Optimization

This study also involved predicting the optimization of materials via the regression model. It was found that the form of reinforcement particles was the most important optimizing feature to achieve the highest YS, while variation in reinforcement was the least significant. Table 6 shows that the optimal parameters for an AZ31 matrix with graphene nanopellets (GNP) as reinforcements were in nanoparticle form, with 3 wt%, without heat treatment, and an extrusion temperature of 350 °C for mechanical working. With these optimized parameters from the best model, we might achieve the highest YS predicted by the regression model, which was 186.99 MPa.
The results from the regression model support the theory of metal matrix composite material fabrication. Other research has mentioned that using graphene nanopellets in the form of particles with a certain weight percentage might increase the mechanical properties [61]. The extrusion temperature also affects the mechanical properties, as using a specific temperature for mechanical working is important [62]. However, past studies have not been able to link each parameter in order to achieve the highest yield strength. This study successfully utilizes the XGBoost Regression model to determine the optimal combination of parameters required for fabricating magnesium matrix composites using stir casting, incorporating the parameters obtained from this study. Table 6 also provides the utilization of other models to optimize the parameters.
Table 6 showcases the optimization of various parameters utilizing different machine learning (ML) models. It is noteworthy that, regardless of the ML algorithm employed, the optimized parameters and the resultant yield strength were remarkably similar. The sole exception was the random forest regression model, which predicted a somewhat lower yield strength. Despite this, the XGBoost model, recognized as the optimal model due to its predictive accuracy and confidence in its results, provided a maximum yield strength of 186.99731 MPa. This was slightly less than the yield strength predicted by the decision tree and extra tree models. This highlights that a model with higher performance does not necessarily lead to higher yield strength. Instead, a model’s performance is largely judged by its predictive accuracy [63]. Thus, this research emphasizes the importance of predictive capacity in choosing machine learning models, despite the fact that some of the outputs here have ended up with slightly different values.
It is also crucial to note that the variation of reinforcement was consistently considered a significant factor in previous research. Although this study highlighted that variation in reinforcement had the least feature importance, its potential influence on the change of the yield should not be dismissed. Therefore, this study incorporated various reinforcements under identical optimized parameters. Table 7 presents the predictive outcomes from the best-performing model.
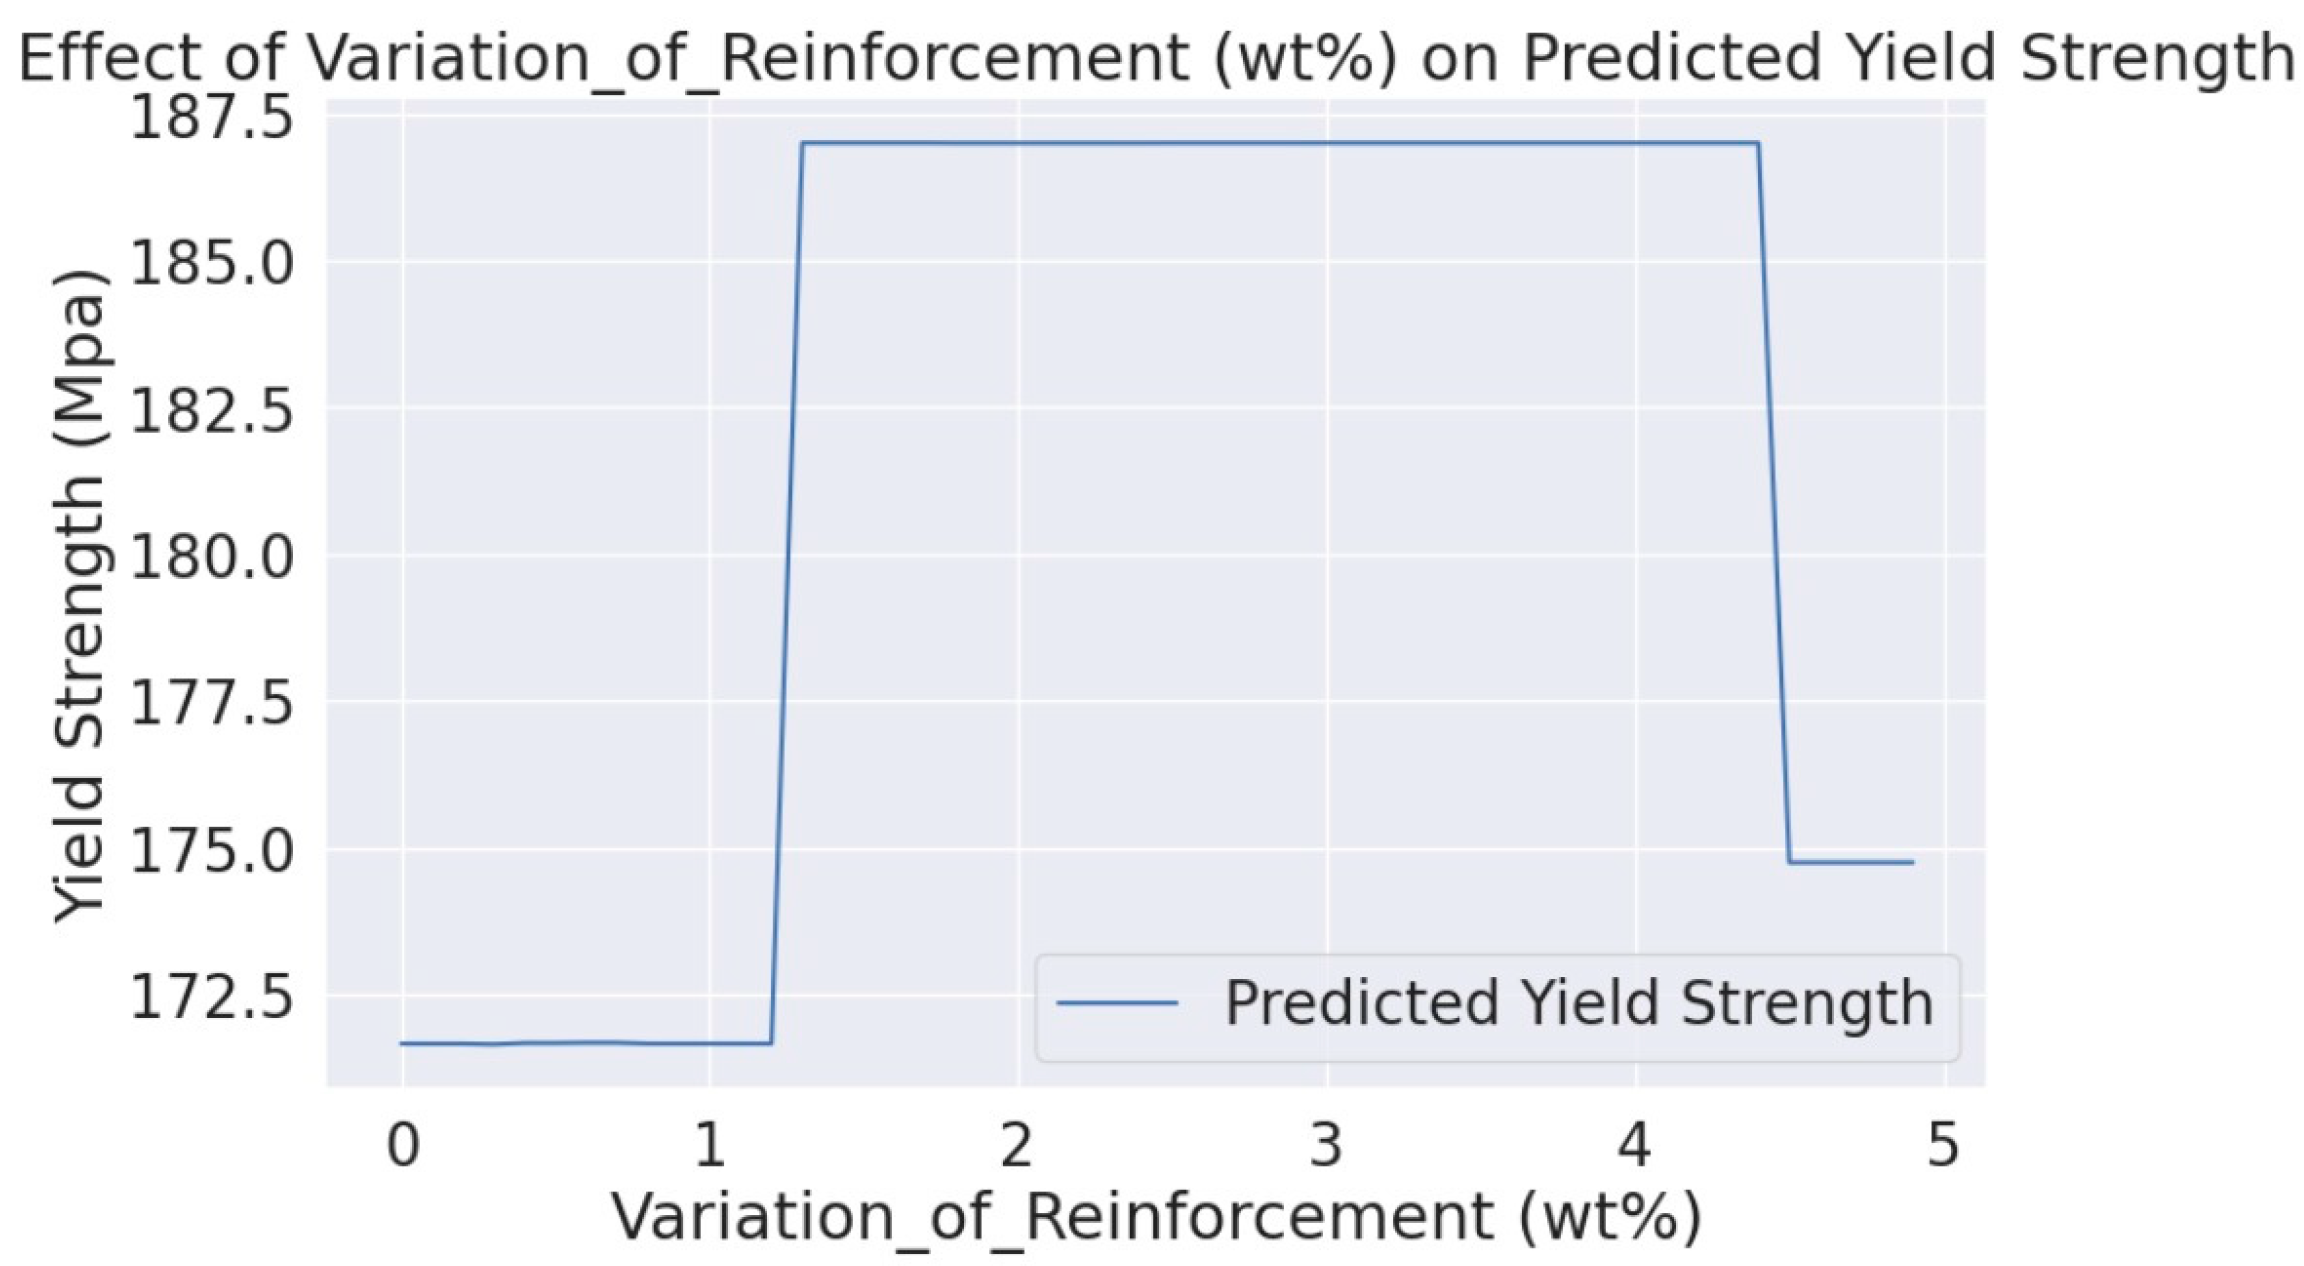
The data in the above table suggest that variations in the reinforcement percentage, especially those near the optimized parameter, only result in slight changes to the yield strength. When the reinforcement value was below 3 wt%, the optimized parameter, the yield strength results were marginally lower. Conversely, increases in the reinforcement percentage did not result in a significant change in yield strength compared to the optimized parameter. It is also crucial to acknowledge the role of Graphene Nanoplatelets (GNPs) in these composites. The incorporation of GNPs can significantly influence the microstructure of the composite, potentially causing changes in properties such as basal texture intensity [10]. Interestingly, a drop in yield strength can be observed when the GNP content is either less than 1.25% or greater than 4%. This drop is primarily attributed to weak interfacial bonding between GNPs due to the GNPs’ poor wettability.
In this study, the ML models predicted that starting from a 3% GNP content, the composite achieved its maximum yield strength of 186.99731 MPa. The yield strength remained relatively constant until it reached 4 wt% GNP content. Beyond 4 wt% GNP content, the yield strength started to decline significantly. This trend can be explained by the fact that excessive GNP content may lead to agglomeration, which further compromises the mechanical performance of the composite [64,65]. This confirms that the use of the ML algorithm will yield efficient findings for future experiments. Furthermore, the graph depicting the variation of reinforcement is shown below in Figure 9.

5. Conclusions

This study focused on predicting the mechanical properties of magnesium matrix composites with four different regression model algorithms using ML with six input parameters and one output parameter. Based on our findings, we concluded the following:
1.
XGBoost regression proved to be the most effective model in predicting the YS of magnesium alloy composites among the four regression models. It exhibited an R² value of 0.94. Its superiority was further supported by the lowest error rates of MAE and RMSE, with values of 8.19 and 10.42, respectively.
2.
Feature importance analysis revealed that the form of reinforcement particles, specifically nano-sized particles, had the most substantial influence on the mechanical properties of magnesium alloy composites. This is attributed to the increased surface/volume ratio of nano-sized particles, which enhanced the strengthening effect of the composite.
3.
The optimized parameters for achieving the highest YS in magnesium alloy composites were the use of the AZ31 matrix with GNP as reinforcement, in nanoparticle form, with a 3 wt%. No heat treatment was applied, and the mechanical working was conducted at an extrusion temperature of 350 °C.
4.
In the future, researchers can explore expanding this approach to different composites and parameters, enhancing model precision, and utilizing experimental results for model validation and refinement. This study will serve as a starting point toward an efficient method for predicting mechanical properties, thereby highlighting the role of machine learning in the fabrication process of magnesium composites.

Author Contributions

Conceptualization, S.-J.H., validation, S.-J.H. and Y.A.; formal analysis, S.-J.H., Y.A. and J.S.; resources, Y.A. and J.S.; writing—original draft preparation, Y.A. and J.S.; writing—review and editing, S.-J.H. and Y.A.; visualization, Y.A. and J.S.; supervision, S.-J.H.; All authors have read and agreed to the published version of the manuscript.

Funding

The Ministry of Science and Technology, Taiwan (MOST111-2221-E-011-096-MY3), for providing financial support.

Institutional Review Board Statement

Not applicable.

Informed Consent Statement

Not applicable.

Data Availability Statement

The data presented in this study are available in the article.

Acknowledgments

The authors would like to thank the Ministry of Science and Technology, Taiwan for providing financial support.

Conflicts of Interest

The authors declare no conflict of interest.

References

  1. Huang, S.; Subramani, M.; Alemayehu, D.B. The effect of micro-sicp content on the tensile and fatigue behavior of az61 magnesium alloy matrix composites. Int. J. Met. 2021, 15, 780–793. [Google Scholar] [CrossRef]
  2. Jeng, S.; Abbas, A.; Ballóková, B. Effect of CNT on Microstructure, Dry Sliding Wear and Compressive Mechanical Properties of AZ61 magnesium alloy. J. Mater. Res. Technol. 2019, 8, 4273–4286. [Google Scholar] [CrossRef]
  3. Gupta, M.; Sharon, N.M.L. Magnesium, Magnesium Alloys, and Magnesium Composites; John Wiley & Sons, Inc.: Hoboken, NJ, USA, 2011; ISBN 9780470494172. [Google Scholar]
  4. Somekawa, H. Review Effect of Alloying Elements on Fracture Toughness and Ductility in Magnesium Binary Alloys; A Review. Mater. Trans. 2020, 61, 1–13. [Google Scholar] [CrossRef]
  5. Tan, J.; Ramakrishna, S. Applications of Magnesium and Its Alloys: A Review. Appl. Sci. 2021, 11, 6861. [Google Scholar] [CrossRef]
  6. Yadav, S.D.; Bhingole, P.P.; Chaudhari, G.P.; Nath, S.K.; Sommitsch, C. Hybrid Processing of AZ91 Magnesium Alloy/Nano-Al2O3 Composites. In Key Engineering Materials; Trans Tech Publications Ltd.: Stafa-Zurich, Switzerland, 2015; Volume 651–653, pp. 783–788. [Google Scholar]
  7. Subramani, M.; Huang, S.J.; Borodianskiy, K. Effect of SiC Nanoparticles on AZ31 Magnesium Alloy. Materials 2022, 15, 1004. [Google Scholar] [CrossRef]
  8. Karuppusamy, P.; Lingadurai, K.; Sivananth, V.; Arulkumar, S. A Study on Mechanical Properties of Tungsten Carbide Reinforced Magnesium Metal Matrix Composites for the Application of Piston. Int. J. Lightweight Mater. Manuf. 2021, 4, 449–459. [Google Scholar] [CrossRef]
  9. Huang, S.J.; Abbas, A. Effects of Tungsten Disulfide on Microstructure and Mechanical Properties of AZ91 Magnesium Alloy Manufactured by Stir Casting. J. Alloys Compd. 2020, 817, 153321. [Google Scholar] [CrossRef]
  10. Rashad, M.; Pan, F.; Liu, Y.; Chen, X.; Lin, H.; Pan, R.; Asif, M.; She, J. High Temperature Formability of Graphene Nanoplatelets-AZ31 Composites Fabricated by Stir-Casting Method. J. Magnes. Alloy. 2016, 4, 270–277. [Google Scholar] [CrossRef]
  11. Ramanujam, N.; Muthukumaran, S.; Nagesawara Rao, B.; Ramarao, M.; Mangrulkar, A.L.; Ashraff Ali, K.S.; Pugazhendhi, L.; Markos, M. Experimental Investigations on Mechanical Properties of AZ31/Eggshell Particle-Based Magnesium Composites. Adv. Mater. Sci. Eng. 2022, 2022, 4883764. [Google Scholar] [CrossRef]
  12. Saranu, R.; Chanamala, R.; Putti, S. Review of Magnesium Metal Matrix Composites. IOP Conf. Ser. Mater. Sci. Eng. 2020, 961, 012001. [Google Scholar] [CrossRef]
  13. Kaya, A.A. A Review on Developments in Magnesium Alloys. IOP Conf. Ser. Mater. Sci. Eng. 2021, 11, 289–306. [Google Scholar] [CrossRef]
  14. Kordijazi, A.; Zhao, T.; Zhang, J.; Alrfou, K.; Rohatgi, P. A Review of Application of Machine Learning in Design, Synthesis, and Characterization of Metal Matrix Composites: Current Status and Emerging Applications; Springer: Berlin/Heidelberg, Germany, 2021; Volume 73. [Google Scholar]
  15. Gomes, C.P.; Selman, B.; Gregoire, J.M. Artificial Intelligence for Materials Discovery. MRS Bull. 2019, 44, 538–544. [Google Scholar] [CrossRef]
  16. Chen, C.T.; Gu, G.X. Machine Learning for Composite Materials. MRS Commun. 2019, 9, 556–566. [Google Scholar] [CrossRef]
  17. Arora, G.S.; Saxena, K.K.; Mohammed, K.A.; Prakash, C.; Dixit, S. Manufacturing Techniques for Mg-Based Metal Matrix Composite with Different Reinforcements. Crystals 2022, 12, 945. [Google Scholar] [CrossRef]
  18. Samal, P.; Vundavilli, P.R.; Meher, A.; Mahapatra, M.M. Recent Progress in Aluminum Metal Matrix Composites: A Review on Processing, Mechanical and Wear Properties. J. Manuf. Process 2020, 59, 131–152. [Google Scholar] [CrossRef]
  19. Prasad, S.V.S.; Prasad, S.B.; Verma, K.; Mishra, R.K.; Kumar, V.; Singh, S. The Role and Significance of Magnesium in Modern Day Research-A Review. J. Magnes. Alloy. 2022, 10, 1–61. [Google Scholar] [CrossRef]
  20. Bhattacharya, S.; Kalita, K.; Čep, R.; Chakraborty, S. A Comparative Analysis on Prediction Performance of Regression Models during Machining of Composite Materials. Materials 2021, 14, 6689. [Google Scholar] [CrossRef]
  21. Huang, S.J.; Mose, M.P.; Kannaiyan, S. A Study of the Mechanical Properties of AZ61 Magnesium Composite after Equal Channel Angular Processing in Conjunction with Machine Learning. Mater. Today Commun. 2022, 33, 104707. [Google Scholar] [CrossRef]
  22. Song, J.; She, J.; Chen, D.; Pan, F. Latest Research Advances on Magnesium and Magnesium Alloys Worldwide. J. Magnes. Alloy. 2020, 8, 1–41. [Google Scholar] [CrossRef]
  23. Suresh Kumar, S.; Thirumalai Kumaran, S.; Velmurugan, G.; Perumal, A.; Sekar, S.; Uthayakumar, M. Physical and Mechanical Properties of Various Metal Matrix Composites: A Review. Mater. Today Proc. 2021, 50, 1022–1031. [Google Scholar]
  24. Guan, H.; Xiao, H.; Ouyang, S.; Tang, A.; Chen, X.; Tan, J.; Feng, B.; She, J.; Zheng, K.; Pan, F. A Review of the Design, Processes, and Properties of Mg-Based Composites. Nanotechnol. Rev. 2022, 11, 712–730. [Google Scholar] [CrossRef]
  25. Li, D.; Thomas, J.; Leroux, P. A Better Measure Yield and Tensile Strength; Nanovea: Irvine, CA, USA, 2020. [Google Scholar]
  26. Sharma, A.K.; Bhandari, R.; Aherwar, A.; Rimašauskiene, R. Matrix Materials Used in Composites: A Comprehensive Study. Mater. Today Proc. 2020, 21, 1559–1562. [Google Scholar] [CrossRef]
  27. Selvam, J.D.R.; Dinaharan, I.; Rai, R.S. Matrix and Reinforcement Materials for Metal Matrix Composites. In Encyclopedia of Materials: Composites; Elsevier: Amsterdam, The Netherlands, 2021; Volume 2, pp. 615–639. ISBN 9780128197318. [Google Scholar]
  28. Bohlen, J.; Cano, G.; Drozdenko, D.; Dobron, P.; Kainer, K.U.; Gall, S.; Müller, S.; Letzig, D. Processing Effects on the Formability of Magnesium Alloy Sheets. Metals 2018, 8, 147. [Google Scholar] [CrossRef]
  29. Rajput, R.; Raut, A.; Gangi Setti, S. Prediction of Mechanical Properties of Aluminium Metal Matrix Hybrid Composites Synthesized Using Stir Casting Process by Machine Learning. Mater. Today Proc. 2022, 59, 1735–1742. [Google Scholar] [CrossRef]
  30. Singh Tumrate, C.; Roy Chowdhury, S.; Mishra, D. Development of Regression Model to Predicting Yield Strength for Different Steel Grades. IOP Conf. Ser. Earth Environ. Sci. 2021, 796, 012033. [Google Scholar] [CrossRef]
  31. Kadam, V.S. Regression Techniques in Machine Learning & Applications: A Review. Int. J. Res. Appl. Sci. Eng. Technol. 2020, 8, 826–830. [Google Scholar] [CrossRef]
  32. Kwak, S.; Kim, J.; Ding, H.; Xu, X.; Chen, R.; Guo, J.; Fu, H. Machine Learning Prediction of the Mechanical Properties of γ-TiAl Alloys Produced Using Random Forest Regression Model. J. Mater. Res. Technol. 2022, 18, 520–530. [Google Scholar] [CrossRef]
  33. Huo, W.; Zhu, Z.; Sun, H.; Ma, B.; Yang, L. Development of Machine Learning Models for the Prediction of the Compressive Strength of Calcium-Based Geopolymers. J. Clean. Prod. 2022, 380, 135159. [Google Scholar] [CrossRef]
  34. Rahman, J.; Ahmed, K.S.; Khan, N.I.; Islam, K.; Mangalathu, S. Data-Driven Shear Strength Prediction of Steel Fiber Reinforced Concrete Beams Using Machine Learning Approach. Eng. Struct. 2021, 233, 111743. [Google Scholar] [CrossRef]
  35. Lou, Y.; Ye, Y.; Yang, Y.; Zuo, W.; Wang, G.; Strong, M.; Upadhyaya, S.; Payne, C. Individualized Empirical Baselines for Evaluating the Energy Performance of Existing Buildings. Sci. Technol. Built. Environ. 2023, 29, 19–33. [Google Scholar] [CrossRef]
  36. Shehadeh, A.; Alshboul, O.; Al Mamlook, R.E.; Hamedat, O. Machine Learning Models for Predicting the Residual Value of Heavy Construction Equipment: An Evaluation of Modified Decision Tree, LightGBM, and XGBoost Regression. Autom. Constr. 2021, 129, 103827. [Google Scholar] [CrossRef]
  37. Huang, J.S.; Liew, J.X.; Ademiloye, A.S.; Liew, K.M. Artificial Intelligence in Materials Modeling and Design. Arch. Comput. Methods Eng. 2021, 28, 3399–3413. [Google Scholar] [CrossRef]
  38. Ahmad, M.W.; Reynolds, J.; Rezgui, Y. Predictive Modelling for Solar Thermal Energy Systems: A Comparison of Support Vector Regression, Random Forest, Extra Trees and Regression Trees. J. Clean. Prod. 2018, 203, 810–821. [Google Scholar] [CrossRef]
  39. Chakraborty, P.; Rafiammal, S.S.; Tharini, C.; Jamal, D.N. Influence of Bias and Variance in Selection of Machine Learning Classifiers for Biomedical Applications. In Proceedings of the Smart Data Intelligence: Proceedings of ICSMDI 2022, Singapore, 17 August 2022; pp. 459–472. [Google Scholar]
  40. Chen, T.; Guestrin, C. XGBoost: A Scalable Tree Boosting System. In Proceedings of the 22nd ACM SIGKDD International Conference on Knowledge Discovery and Data Mining, San Francisco, CA, USA, 13–17 August 2016. [Google Scholar] [CrossRef]
  41. Liu, H.; Lang, B. Machine Learning and Deep Learning Methods for Intrusion Detection Systems: A Survey. Appl. Sci. 2019, 9, 4396. [Google Scholar] [CrossRef]
  42. Liu, J.; Wu, J.; Liu, S.; Li, M.; Hu, K.; Li, K. Predicting Mortality of Patients with Acute Kidney Injury in the ICU Using XGBoost Model. PLoS ONE 2021, 16, e0246306. [Google Scholar] [CrossRef] [PubMed]
  43. Geurts, P.; Ernst, D.; Wehenkel, L. Extremely Randomized Trees. Mach. Learn. 2006, 63, 3–42. [Google Scholar] [CrossRef]
  44. Huanga, S.J.; Kannaiyan, S.; Subramani, M. Effect of Nano-Nb2O5 on the Microstructure and Mechanical Properties of AZ31 Alloy Matrix Nanocomposites. Adv. Nano. Res. 2022, 13, 407–416. [Google Scholar] [CrossRef]
  45. Huang, S.J.; Lin, C.C.; Huang, J.Y.; Tenne, R. Mechanical Behavior Enhancement of AZ31/WS2 and AZ61/WS2 Magnesium Metal Matrix Nanocomposites. Adv. Mech. Eng. 2018, 10, 2. [Google Scholar] [CrossRef]
  46. Zhao, W.; Huang, S.J.; Wu, Y.J.; Kang, C.W. Particle Size and Particle Percentage Effect of AZ61/SiCp Magnesium Matrix Micro- and Nano-Composites on Their Mechanical Properties Due to Extrusion and Subsequent Annealing. Metals 2017, 7, 293. [Google Scholar] [CrossRef]
  47. Huang, S.J.; Hwang, Y.M.; Huang, Y.S.; Huang, C.C. Mechanical Properties Enhancement of Particle Reinforced Magnesium Matrix Composites Used for Hot Extruded Tubes. Acta Phys. Pol. A 2015, 127, 1271–1273. [Google Scholar] [CrossRef]
  48. Huang, S.J.; Hwang, Y.M.; Huang, Y.S. Grain Refinement of AZ61/SiCp Magnesium Matrix Composites for Tubes Extruded by Hot Extrusion Processes. In Key Engineering Materials; Trans Tech Publications Ltd.: Stafa-Zurich, Switzerland, 2013; Volume 528, pp. 135–143. [Google Scholar]
  49. Abbas, A.; Huang, S.J. Investigation of Severe Plastic Deformation Effects on Microstructure and Mechanical Properties of WS2/AZ91 Magnesium Metal Matrix Composites. Mater. Sci. Eng. A 2020, 780, 139211. [Google Scholar] [CrossRef]
  50. Abbas, A.; Huang, S.J. ECAP Effects on Microstructure and Mechanical Behavior of Annealed WS2/AZ91 Metal Matrix Composite. J. Alloys Compd. 2020, 835, 155466. [Google Scholar] [CrossRef]
  51. Chicco, D.; Warrens, M.J.; Jurman, G. The Coefficient of Determination R-Squared Is More Informative than SMAPE, MAE, MAPE, MSE and RMSE in Regression Analysis Evaluation. PeerJ Comput. Sci. 2021, 7, e623. [Google Scholar] [CrossRef] [PubMed]
  52. Fox, J. Appendices to Applied Regression Analysis, Generalized Linear Models, 3rd ed.; SAGE Publications: Los Angeles, CA, USA, 2016; ISBN 978-1-4522-0566-3. [Google Scholar]
  53. Nurunnisha, G.A.; Rohmattulah, A.; Maulansyah, M.R.; Sinaga, O.; Maulansyah, R. Analysis of Consumer Acceptance Factors Against Fintech at Bandung Smes. PalArch’s J. Archaeol. Egypt Egyptol. 2020, 17, 841–855. [Google Scholar]
  54. Rengasamy, D.; Mase, J.M.; Kumar, A.; Rothwell, B.; Torres, M.T.; Alexander, M.R.; Winkler, D.A.; Figueredo, G.P. Feature Importance in Machine Learning Models: A Fuzzy Information Fusion Approach. Neurocomputing 2022, 511, 163–174. [Google Scholar] [CrossRef]
  55. Wu, Q.; Miao, W.S.; Zhang, Y.D.; Gao, H.J.; Hui, D. Mechanical Properties of Nanomaterials: A Review. Nanotechnol. Rev. 2020, 9, 259–273. [Google Scholar] [CrossRef]
  56. Shahid Ul Islam, S.; Khan, N.Z.; Khan, M.M. Effect of Reinforcement on Magnesium-Based Composites Fabricated through Stir Casting: A Review. Mater. Today Proc. 2020, 46, 6513–6518. [Google Scholar] [CrossRef]
  57. Molnar, C.; König, G.; Herbinger, J.; Freiesleben, T.; Dandl, S.; Scholbeck, C.A.; Casalicchio, G.; Grosse-Wentrup, M.; Bischl, B. General Pitfalls of Model-Agnostic Interpretation Methods for Machine Learning Models. arXiv 2020, arXiv:2007.04131. [Google Scholar]
  58. Kazemitabar, J.; Amini, A.; Bloniarz, A.; Talwalkar, A. Variable Importance Using Decision Trees. In Proceedings of the Advances in Neural Information Processing Systems, Long Beach, CA, USA, 4–9 December 2017. [Google Scholar]
  59. Singh, A.; Thakur, N.; Sharma, A. A Review of Supervised Machine Learning Algorithm. In Proceedings of the 2016 3rd International Conference on Computing for Sustainable Global Development (INDIACom), New Delhi, India, 16–18 March 2016. [Google Scholar]
  60. Breiman, L. Random Forests. Mach. Learn. 2001, 45, 5–32. [Google Scholar] [CrossRef]
  61. Prashantha Kumar, H.G.; Anthony Xavior, M. Graphene Reinforced Metal Matrix Composite (GRMMC): A Review. Procedia Eng. 2014, 97, 1033–1040. [Google Scholar] [CrossRef]
  62. Wu, S.P.; Feng, S.Y.; Wang, J.; Li, Q.L. Effects of Extrusion Temperatures on Mechanical Properties of B4C/Al Composites. IOP Conf. Ser. Mater. Sci. Eng. 2020, 715, 012103. [Google Scholar] [CrossRef]
  63. Chibani, S.; Coudert, F.X. Machine Learning Approaches for the Prediction of Materials Properties. APL Mater. 2020, 8, 080701. [Google Scholar] [CrossRef]
  64. Patil, A.; Kiran Kumar Yadav Nartu, M.S.; Ozdemir, F.; Banerjee, R.; Gupta, R.K.; Borkar, T. Enhancement of the Mechanical Properties of Graphene Nanoplatelet (GNP) Reinforced Nickel Matrix Nanocomposites. Mater. Sci. Eng. A 2021, 817, 141324. [Google Scholar] [CrossRef]
  65. Lu, T.; Zhou, M.; Ren, L.; Fan, L.; Guo, Y.; Qu, X.; Zhang, H.; Lu, X.; Quan, G. Effect of Graphene Nanoplatelets Content on the Mechanical and Wear Properties of AZ31 Alloy. Metals 2020, 10, 1265. [Google Scholar] [CrossRef]
Figure 1. Graphical representation of regression models: (a) decision trees regression, (b) extra tree regression, (c) random forest regression, and (d) XGBoost regression [34,35].
Jcs 07 00347 g001
Figure 2. Diagram of input and output parameters.
Jcs 07 00347 g002
Figure 3. Flowchart of this study.
Jcs 07 00347 g003
Figure 4. Graph of Predicted Yield Strength vs. Actual Yield Strength with different regression models: (a) Decision Trees Regression, (b) Extra Tree Regression, (c) Random Forest Regression, and (d) XGBoost Regression.
Jcs 07 00347 g004
Figure 5. Feature of importance.
Jcs 07 00347 g005
Figure 6. Correlation Matrix.
Jcs 07 00347 g006
Figure 7. Feature importance results from other models: (a) Decision Tree Regression, (b) Extra Tree Regression, and (c) Random Forest Regression.
Jcs 07 00347 g007
Figure 8. Correlation Matrix with other models: (a) Decision Tree Regression, (b) Extra Tree Regression, and (c) Random Forest Regression.
Jcs 07 00347 g008
Figure 9. Variation of Reinforcement vs. YS with Optimized Parameter.
Jcs 07 00347 g009
Table 1. Previous research using Machine Learning.
Previous ResearchMaterialKey FindingsMachine Learning
Models
Rutuk Rajput et al. [29]
[Prediction of mechanical properties of aluminum metal matrix hybrid composites synthesized using Stir casting process by Machine learning]
Aluminum Metal Matrix Hybrid
Composites
The study employed various regression algorithm models, including the four models mentioned earlier, to predict the mechanical properties of ultimate tensile strength in aluminum metal matrix hybrid composites. The best-performing model among them was the decision tree regression, which achieved an R2 value of 0.92909Decision Tree Regression, Random Forest Regression, Extra Tree Regression, Gradient Boost Regression, AdaBoost Regression, XGBoost Regression, and CatBoost Regression
Kwak et al. [32]
[Machine learning prediction of the mechanical properties of γ-TiAl alloys produced using random forest regression model]
TiAl alloysThe random forest regression (RFR) machine learning algorithm was effective in predicting the mechanical properties of a directionally solidified (DS) TiAl alloyRandom Forest Regression
Huo et al. [33]
[Development of machine learning models for the prediction of the compressive strength of calcium-based geopolymers]
GeopolymersThe study evaluated eight algorithms in three types (traditional ML algorithms, integrated tree-based ML algorithms, and a deep neural network algorithm) for their suitability in predicting compressive strength. Each algorithm was analyzed for its differences, advantages, and disadvantages.XGBoost Model performed the most accurate
Table 3. The data from previous literature.
MatrixReinforcementSource
AZ31SiC[7]
AZ31Graphene Nanopellets[10]
AZ31Eggshell[11]
AZ31Nb2O5 (Niobium Pentoxide)[44]
AZ61WS2[45]
AZ61SiC[1,46,47,48]
AZ91WS2[9,49,50]
AZ91WC[8]
Table 4. Interpretation of coefficient determination [53].
Value of Coefficient of Determination (R2)Level of Closeness
0.82–1Very high
0.49–0.81High influence
0.17–0.48Quite strong influence
0.05–0.16Low impact
0–0.04Very low
Table 5. Evaluation of four different regression models.
Algorithm ModelMAERMSER2
Decision trees regression8.8111.360.92
Extra tree regression11.0113.370.89
Random forest regression18.6314.210.80
XGBoost regression8.1910.420.94
Table 6. Predictions with optimization from the best model and other models using ML algorithm.
ML AlgorithmMatrix ReinforcementReinforcement Particle FormVariation of Reinforcement (wt%)Heat Treatment Mechanical Working Yield Strength
Decision tree regressionAZ31GNPNano3 wt%No heat treatmentExtrusion temperature 350 °C187 MPa
Extra tree regressionAZ31GNPNano3 wt%No heat treatmentExtrusion temperature 350 °C187 MPa
Random forest regressionAZ31GNPNano3 wt%No heat treatmentExtrusion temperature 350 °C154.353 MPa
XGBoost regression
(Best Model)
AZ31GNPNano3 wt%No heat treatmentExtrusion temperature 350 °C186.99731 MPa
Table 7. Prediction with variation of reinforcement (wt%) with optimized parameters from the best model.
Matrix ReinforcementReinforcement Particle FormVariation of Reinforcement (wt%)Heat Treatment Mechanical Working Yield Strength (MPa)
AZ31 Graphene nanopelletsNano0 wt%No heat treatmentExtrusion temperature 350 °C171.67538
AZ31 Graphene nanopelletsNano0.5 wt%No heat treatmentExtrusion temperature 350 °C171.68613
AZ31Graphene nanopelletsNano1 wt%No heat treatmentExtrusion temperature 350 °C171.67615
AZ31Graphene nanopelletsNano1.5 wt%No heat treatmentExtrusion temperature 350 °C186.99875
AZ31Graphene nanopelletsNano2 wt%No heat treatmentExtrusion temperature 350 °C186.99678
AZ31Graphene nanopelletsNano2.5 wt%No heat treatmentExtrusion temperature 350 °C186.99678
AZ31Graphene nanopelletsNano3 wt%No heat treatmentExtrusion temperature 350 °C186.99731
AZ31Graphene nanopelletsNano3.5 wt%No heat treatmentExtrusion temperature 350 °C186.99731
AZ31Graphene nanopelletsNano4 wt%No heat treatmentExtrusion temperature 350 °C186.99731
AZ31Graphene nanopelletsNano4.5 wt%No heat treatmentExtrusion temperature 350 °C174.75705
Disclaimer/Publisher’s Note: The statements, opinions and data contained in all publications are solely those of the individual author(s) and contributor(s) and not of MDPI and/or the editor(s). MDPI and/or the editor(s) disclaim responsibility for any injury to people or property resulting from any ideas, methods, instructions or products referred to in the content.