Article

Adsorption of Acid Yellow 23 Dye on Organobentonite/Alginate Hydrogel Beads in a Fixed-Bed Column

by
Daniela Rivera-Arenas
1,
Iván F. Macías-Quiroga
2,
María T. Dávila-Arias
1,
Jorge J. Vélez-Upegui
3 and
Nancy R. Sanabria-González
1,*
1
Departamento de Ingeniería Química, Universidad Nacional de Colombia Sede Manizales, Campus La Nubia, km 9 vía al Aeropuerto, Manizales 170003, Colombia
2
Departamento de Física y Química, Universidad Nacional de Colombia Sede Manizales, Campus La Nubia, km 9 vía al Aeropuerto, Manizales 170003, Colombia
3
Departamento de Ingeniería Civil, Universidad Nacional de Colombia Sede Manizales, Campus Palogrande, Carrera 27 # 64-60, Manizales 170001, Colombia
*
Author to whom correspondence should be addressed.
J. Compos. Sci. 2023, 7(9), 362; https://doi.org/10.3390/jcs7090362
Submission received: 7 August 2023 / Revised: 21 August 2023 / Accepted: 29 August 2023 / Published: 30 August 2023
(This article belongs to the Topic Recent Advances in Hydrogels)

Abstract

:
This research evaluates the use of organoclay/alginate hydrogels in removing Acid Yellow 23 in a fixed-bed column and contributes to the application of these composites in the context of the adsorption of anionic dyes that are present in wastewater. An organobentonite (OBent) was synthesized and encapsulated in an alginate matrix, using Ca2+ ions as a crosslinking agent. Experiments in fixed-bed columns showed that breakthrough and exhaustion times were longer with increasing bed height, which decreased with increases in flow rate and initial dye concentration. The Thomas, Yoon–Nelson, and Adams–Bohart models were well fitted to the experimental data for the breakthrough curves with high Adj. R2 correlation coefficients and low values of χ2. The theoretical adsorption capacity of the organobentonite/alginate hydrogel calculated from the Thomas model was 0.50 ± 0.01 mg/g (equivalent to 30.97 mg/g OBent), and this was obtained by using a 15 cm (10.10 g) bed height, 1 mL/min flow rate, and a 45 mg/L input dye concentration. The bed was regenerated with a 0.5 M NaOH solution, and the reuse of the saturated column bed was studied for two adsorption–desorption cycles. The results obtained in this study suggest the potential use of an organoclay/alginate hydrogel for the adsorption of pollutants in continuous systems.

Graphical Abstract

1. Introduction

The textile and dyeing industry generates 20% of the world’s wastewater, and it has become the second-largest polluter of freshwater globally [1,2]. Dyes that are incorporated into water sources reduce photosynthetic activity, decrease dissolved oxygen concentration, and increase chemical oxygen demand, thus generating adverse effects on aquatic ecosystems [3]. Dyes are highly toxic and potentially carcinogenic, and they are associated with various diseases in animals and humans, thus causing damage to the tissues of certain organs and the central nervous system [4,5,6].
Azo dyes are the most common type of synthetic dyes that are used in the food and textile industry, and they are characterized by the presence of one or more –N=N– functional groups, which are associated with one or more aromatic rings and may also contain sulfonic acid substituent groups [7]. Acid Yellow 23 (AY-23) is a widely used azo dye in the textile (as a dye for wool and silk), foodstuff, pharmaceutical, and cosmetic industries [8,9]. Although AY-23 is used in the food (also known as tartrazine or FD&C Yellow No. 5), drug, and cosmetic industries, the FDA requires all products containing this dye to identify it on their labels because certain people may suffer allergies when intaking this additive [10].
Different physical and chemical processes—such as coagulation–flocculation [11,12], polymer membranes [13], adsorption [14,15,16], ozonation [17], electrocoagulation [18], and Fenton and photo-Fenton processes [19], among others—have been applied to remove azo dyes from effluents. Due to its simplicity, high efficiency, and scale up over a wide range of concentrations, adsorption technology has received a great deal of attention among the available treatments [14]. Different adsorbent materials that can remove dyes from water—such as clays/zeolites and their composites, as well as agricultural solid wastes, biochar, and activated carbon (the latter being one of the most efficient, although its cost is high)—have been explored [20,21].
Clays and their modified derivatives are a group of adsorbent materials that can remove dyes from aqueous media [21,22]. The interest in clays results from their natural abundance, the specific surface area associated with their layered structure, and the possibility of physical or chemical modification to increase the affinity for particular adsorbates [23]. Organoclays are synthesized through exchange with organic cations, generally quaternary ammonium salts [24], which improve the adsorption capacity for anionic [25], acid [26,27], and reactive dyes [28]. Although organoclays have proven to be efficient in the adsorption of different pollutants [29,30,31,32], these materials are obtained as powder and, after adsorption, they must be separated by filtration (0.22–0.45 μm membrane) to avoid the formation of colloidal suspensions [23]. Polymer–clay nanocomposites (PCNCs), which are composed of clay particles dispersed in a polymeric matrix [33], have been proposed for applications in the biochemical [34], pharmaceutical, and environmental fields [35]. The polymer matrix can be formed by a variety of polymers, including homopolymers, copolymers, cross-linked polymers, networks of polymers, block copolymers, and by the mixtures of two or more polymers. Natural (such as bentonite and other smectites), modified (such as pillared clays and organoclays), and synthetic clay minerals are all suitable for producing PCNCs [33].
Alginate is a natural polysaccharide [36] that can form hydrogels through ionic cross-linking with metal ions such as Ca2+ [37,38]. By incorporating or encapsulating organoclay in an alginate matrix, it has been possible to form organoclay/alginate composite microspheres or hybrid materials [23,39,40]. Alginate–clay composite materials have been used for applications such as controlled drug delivery [41], pervaporation separation membranes [42], flame-retardant polyurethane foams [43], the adsorption of methylene blue and Congo red dyes [44], and the removal of pentachlorophenol and safranin from aqueous solutions [35].
For the specific case of organoclay–alginate hydrogels, these compounds have been used in the removal of cationic dyes such as methylene blue [23,39,45,46]; anionic dyes such as methyl orange [23], Allura red [47], acid green B, and direct pink 3B [40]; and ionic such as ClO4, Sr2+, Cu2+, and Cr6+ [48,49]. Results of the above studies indicate that organoclay-alginate composites are promising adsorbents for the remediation of the aqueous solutions contaminated with dyes and metal ions. In addition, reuse tests have also shown that the adsorption capacity persists between three and six successive adsorption–desorption cycles [39,49].
In the reviewed literature, the studies on removing cationic and anionic dyes with organoclay/alginate hydrogels were performed by batch discontinuous adsorption [23,39,40,45,46,47]. This is the first investigation focused on the adsorption of an anionic dye with organobentonite that is encapsulated in an alginate matrix on a fixed-bed column. Initially, the hydrogel beads were evaluated in batch adsorption tests of the Acid Yellow 23 dye, where the effect of the concentration of organoclay in the composite and the pH of the solution were studied. Subsequently, fixed-bed column experiments were performed to assess the influence of bed height, feed flow rate, and initial dye concentration. To analyze the dynamic adsorption behavior of AY-23, breakthrough curves were fitted using a nonlinear regression to the Thomas, Yoon–Nelson, and Adams–Bohart models. In addition, the regeneration of the bed was studied, and adsorbent reuse tests were carried out. Finally, at the best adsorption conditions of the dye in a fixed-bed column, tests were carried out to remove AY-23 contained in a real wastewater sample.

2. Materials and Methods

2.1. Reagents and Materials

The Acid Yellow 23 synthetic azo-dye (C16H9N4Na3O9S2, 534.36 g/mol, CAS No. 1934-21-0) with ≥85% purity was purchased from Sigma-Aldrich (Darmstadt, Germany). Cationic surfactant hexadecyltrimethylammonium bromide (HDTMA-Br, CH3(CH2)15NBr(CH3)3, 364.46 g/mol, CAS No. 57-09-0, purity > 98.0%) was purchased from PanReac AppliChem (Barcelona, Spain). Sodium alginate (C6H9NaO7, 216.12 g/mol, CAS No. 9005-38-3, >91% purity) was purchased from Loba Chemie Pvt. Ltd. (Mumbai, India).
Raw bentonite was collected from a mine operated by Gea Minerales S.A.S. in Armero-Guayabal (Tolima, Colombia). This bentonite’s chemical and mineralogical composition has been previously published [50].

2.2. Preparation of the Organobentonite/Sodium Alginate Beads

The clay fraction (≤2 μm) was obtained by a conventional sedimentation following Stokes’ law, and this was, subsequently, exchanged with a NaCl solution [50,51]. Purified sodium bentonite (symbolized as Na-Bent), with a cation exchange capacity (CEC) of 63.02 cmol(+)/kg, was used for the synthesis of the organoclay.
The intercalation of the Na-Bent with HDTMA-Br was carried out according to a previous study [52] and, for the modification, an amount of surfactant that was 1.5 times the cation exchange capacity of clay was used.
The preparation diagram of the hydrogel beads is shown in Figure 1. For this, six solutions of sodium alginate (Na-Alg) were prepared in distilled water at 60 °C (1 g/100 mL), and the mixtures were magnetically shaken for 1 h at 250 rpm. Then, the Na-Alg solutions were cooled to room temperature, whereupon a specific amount of organoclay (OBent) was added, such that the final suspensions had concentrations of 0 (blank), 2, 4, 6, 8, and 10 wt.%. After mixing the organoclay with a Na-Alg solution for 1 h, the suspension was dropwise added into a CaCl2 solution (4 wt.% at 20 ± 1 °C) via a Pasteur pipette. The hydrogel beads were immersed in a CaCl2 solution for 3 h to ensure Ca2+ cross-linking. Then, they were repeatedly washed with distilled water to remove excess chloride ions. The hydrogel beads were labeled Obent(wt.%)/Alg, where wt.% corresponded to the mass percentage of the organobentonite used to synthesize the material. The blank corresponds to the alginate-only hydrogel beads, which were labeled as Alg-Hydrogel.

2.3. Characterization of the Adsorbents

The X-ray diffraction patterns for Na-Bent, Obent, Na-Alg, and the Obent/Alg hydrogel were taken on a Rigaku Mini-flex II Diffractometer when under Cu-Kα radiation of 30 kV and 15 mA, as well as a 0.05° 2θ step and 2 s/step. For this analysis, the hydrogel beads were dried at 40 °C until a constant weight was achieved [35], then crushed and sieved in a 100 mesh (<149 μm).
The mean diameters and bead-size distribution of the hydrogel beads were obtained from digitized photographs captured with ImageJ software (Version 1.53t), which was developed at the National Institute of Health (Bethesda, MD, USA). For each image, the diameter of 80 hydrogel beads was measured.
The water content in the Obent/Alg hydrogel was determined by drying beads at 40 °C up to a constant weight, and this was achieved following the procedure that used alginate-encapsulated pillared clays [35]. Water content (WC) was calculated with Equation (1):
W a t e r   c o n t e n t   ( % ) = W w W d W w × 100
where W w and W d are, respectively, the weight of hydrogel beads before and after drying.
Swelling studies were performed using dried hydrogel beads at 40 °C as the starting material. A known hydrogel mass was immersed in 100 mL of distilled water for 12 h, the water was then removed by decantation, and the mass of wet beads was determined [35]. The swelling capacity of hydrogel beads was determined from Equation (2):
S w e l l i n g   c a p a c i t y   ( % ) = W s W d W d × 100
where W d is the hydrogel’s initial (dry) weight and W s is the weight of the hydrogel when swollen.
The zero-point charge (pHzpc) of the organoclay/alginate hydrogel was determined by introducing a fixed mass of 2.0 g of hydrogel into 50 mL solutions with an initial pH (pHi) between 3 and 11. Suspensions were then stirred for 24 h at room temperature (18 ± 2 °C), and the final pH was measured again. The pHzpc value was determined from the plot of the ΔpH vs. pHi [53].

2.4. Batch Adsorption Tests

The batch adsorption tests of AY-23 on hydrogel beads were carried out to establish the operating conditions for the column tests. The effect of organoclay concentration on the Obent(wt.%)/Alg hydrogel beads (2–10 wt.%) and pH (4–8) was analyzed. Tests were carried out in Erlenmeyer flasks containing 100 mL of a 30 mg/L aqueous dye solution at a fixed pH to which a given mass of the hydrogel beads was added. The pH of the solutions was measured with an SI Analytics Lab 845 pH-meter, and it was adjusted with 0.1 M of HCl and 0.1 M of NaOH. All tests were performed in ambient conditions (20 ± 1 °C and 78 kPa atmospheric pressure) for 4 h, and the stirring speed was kept at 250 rpm.
The concentration of AY-23 in an aqueous solution was determined in a UV-Vis spectrophotometer (Genesys 150, Thermo Scientific, Madison, WI, USA) by measuring the absorbance of the samples (0.75 mL) at 428 nm. The dye removal efficiency was calculated using Equation (3):
R e m o v a l   ( % ) = C 0 C t C 0 × 100
where C 0 and C t represent the initial and remaining AY-23 concentrations at a given time (t), respectively.

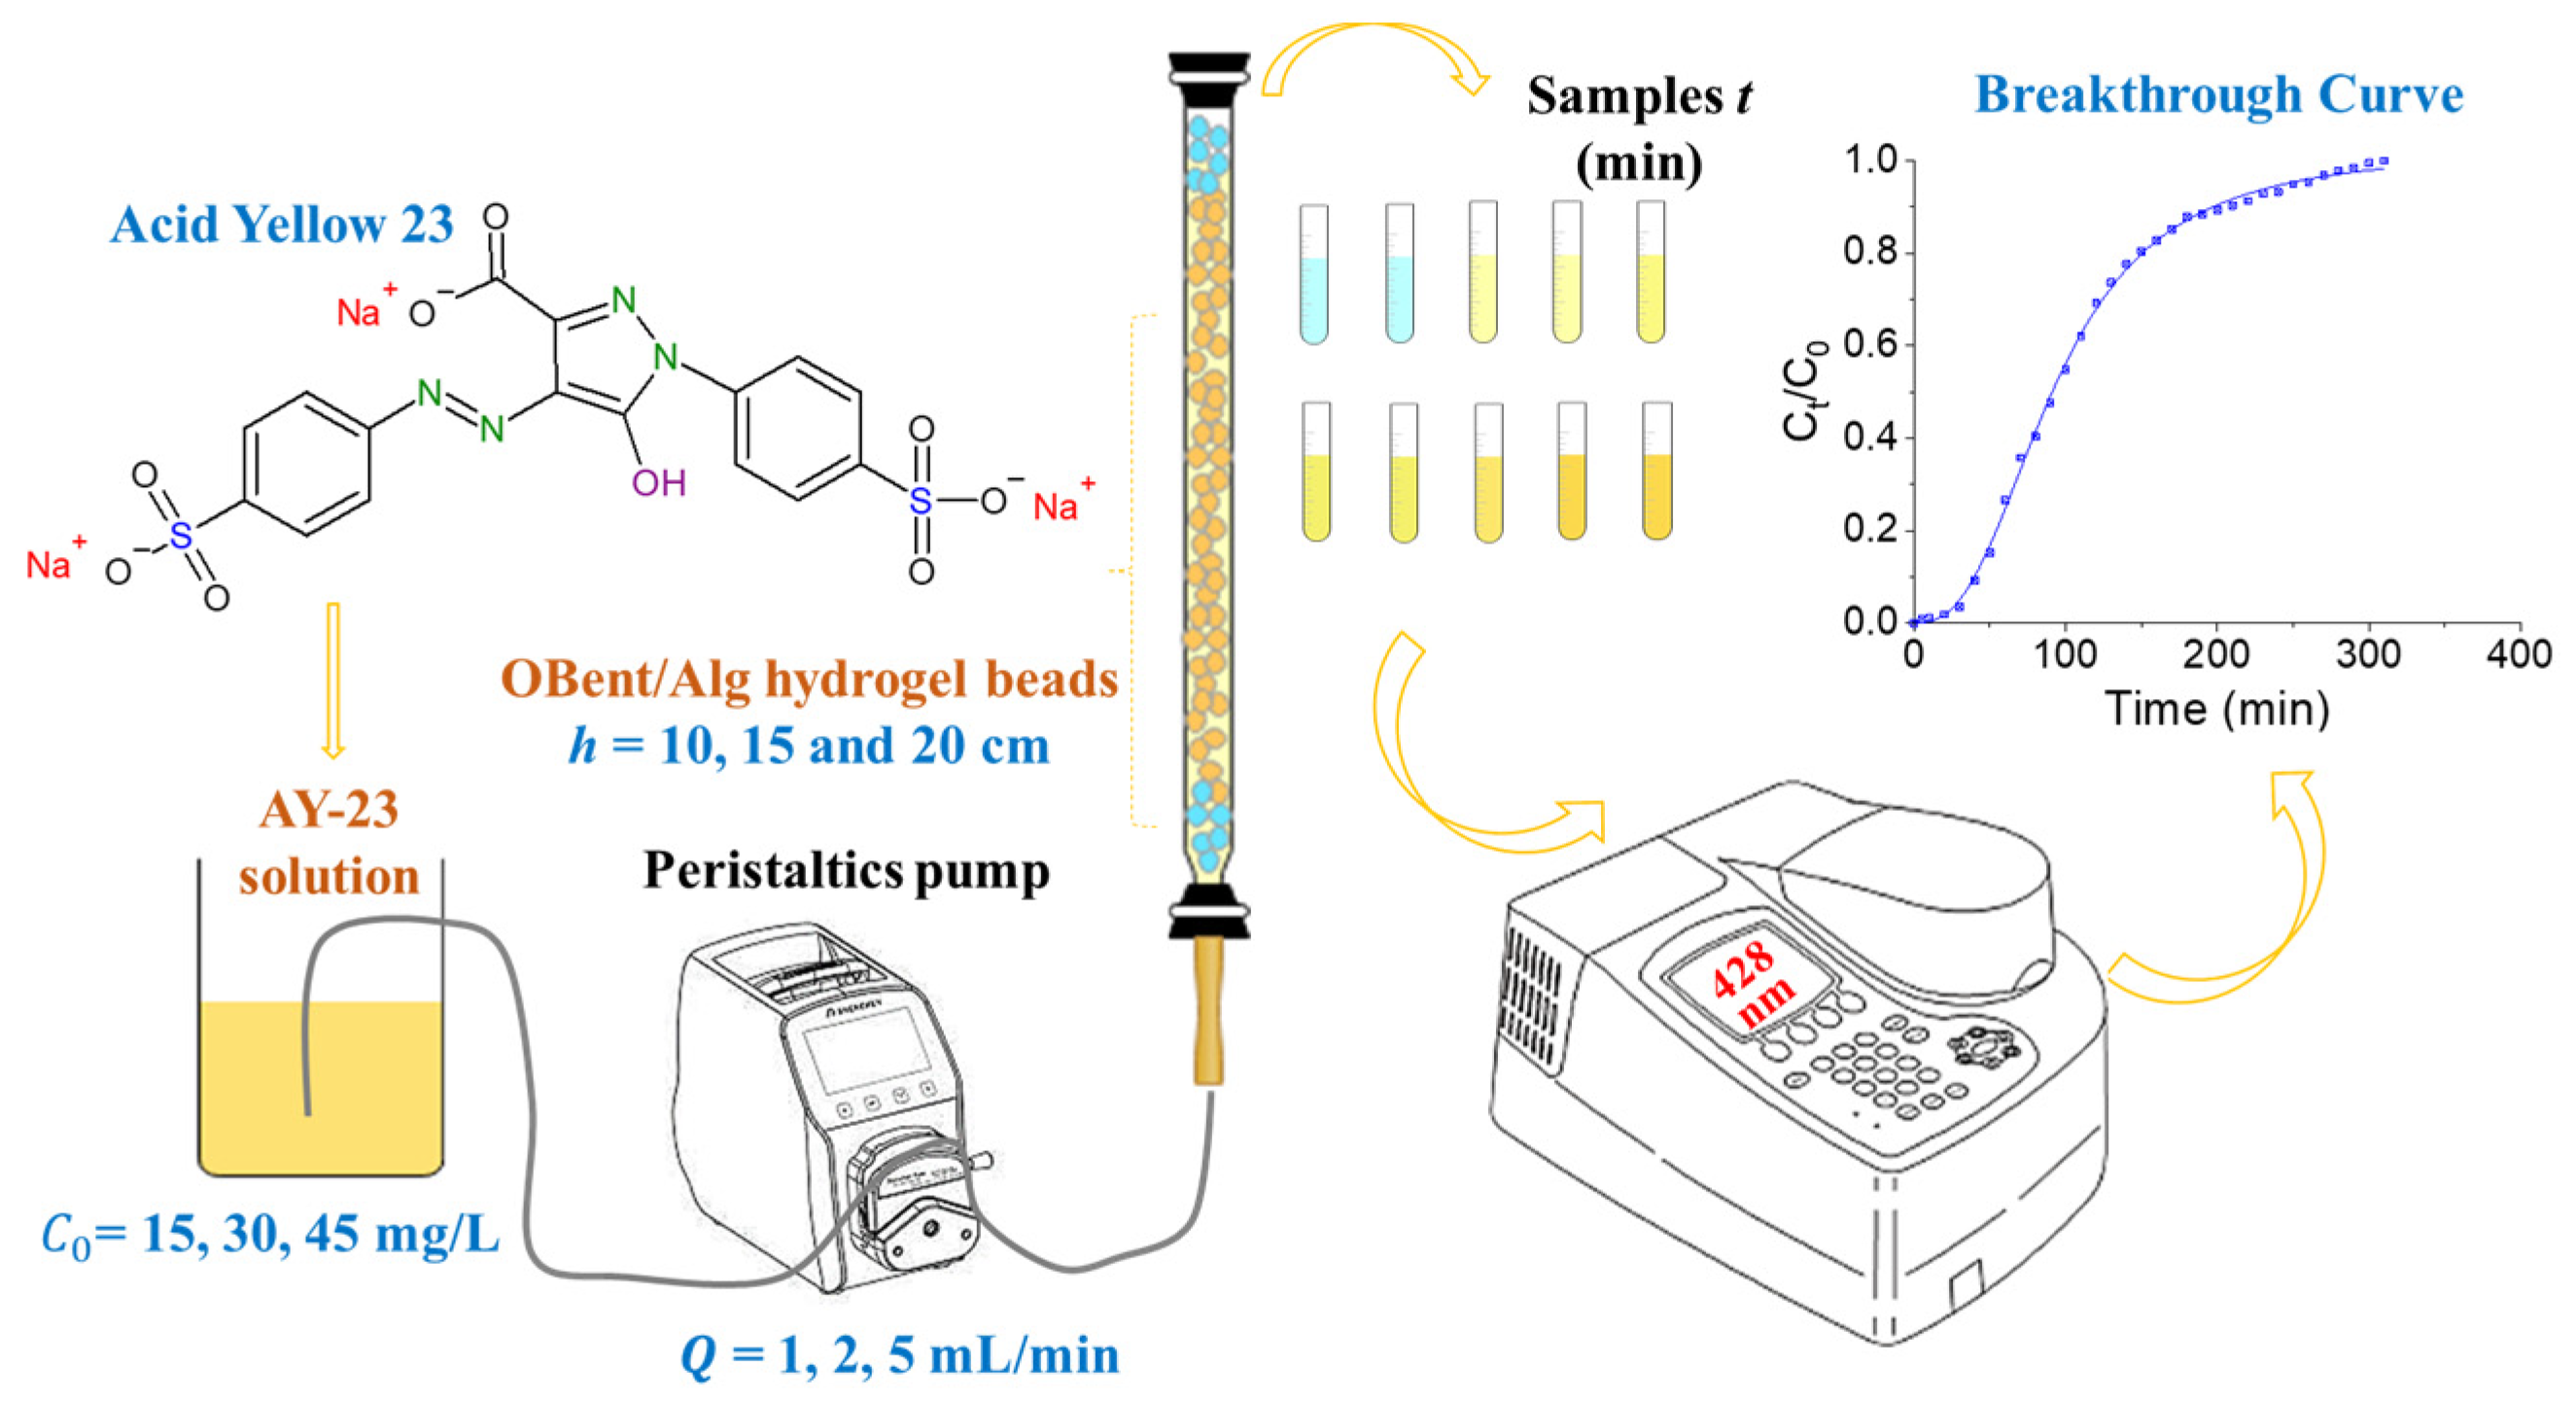
2.5. Fixed-Bed Column Adsorption Tests

The continuous adsorption experiments of AY-23 were performed in a fixed bed in a glass column with a length of 25 cm and diameter of 1.2 cm, which was packed with a specified number of OBent/Alg hydrogel beads (Figure 2). A peristaltic pump with a silicone hose was connected to the bottom of the column to feed the dye solution. To guarantee a continuous flow rate at the inlet and outlet of the column, 1.0 cm diameter glass beads were placed at both ends of the hydrogel bed. Before each experiment, water was pumped through the column to remove air bubbles from the fixed bed. All tests were performed in ambient conditions (20 ± 1 °C) while the initial pH of the dye solution was adjusted to a specific value. Samples were taken at the top of the column at time intervals (until bed saturation), and the dye concentration was quantified by measuring the absorbance at 428 nm.
The parameters evaluated in the adsorption of AY-23 in a fixed bed were as follows: the effect of the bed height ( h = 10, 15, and 20 cm of the hydrogel beads), feed flow rate ( Q = 1, 2, and 5 mL/min), and initial dye concentration in the feed ( C 0 = 15, 30, and 45 mg/L). The breakthrough curves were obtained by plotting C t / C 0 (mg/L) vs. t (min), where C t is the effluent dye concentration, C 0 is the influent dye concentration, and t is the service time [54].
For each fixed-bed adsorption test, the respective breakthrough curve was processed, and the following parameters were determined:
Breakthrough time ( t b , min): the time that elapsed for the AY-23 concentration in the effluent to reach a 10% concentration in the influent ( C t / C 0   = 0.1) [55].
Exhaustion time ( t e , min): the time elapsed for the AY-23 concentration in the effluent to reach a 95% concentration in the influent ( C t / C 0 = 0.95) [56,57].
The volume of treated effluent ( V t , mL): calculated by Equation (4):
V t = Q × t e
where Q is the volumetric flow rate (mL/min) and t e is the exhaustion time (min) [53,54].
The total column capacity ( q t o t a l , mg): obtained from the area under the curve of the adsorbed concentration ( C a d , mg/L) versus time (t, min). Calculated by Equation (5):
q t o t a l = Q 1000 t = 0 t = t t o t a l C a d d t
where C a d is calculated from the difference between dye concentrations in the influent and effluent, i.e., C a d = C 0 C t . The total time ( t t o t a l , min) corresponds to the total continuous adsorption time [53,54,58].
The maximum adsorption capacity of the hydrogel beads ( q m , mg/g): corresponds to the amount of dye that was adsorbed ( q t o t a l ) per mass (m, g) of the adsorbent at the end of the total flow time [53,54]. q m was obtained from Equation (6):
q m = q t o t a l m
The total amount of adsorbate retained in the column ( W t o t a l , mg): calculated from Equation (7) [54]:
W t o t a l = C o × Q × t t o t a l 1000
The concentration of adsorbate remaining in the solution when equilibrium was reached ( C e , mg/L): obtained from Equation (8) [57]:
C e = W t o t a l q t o t a l V t
The total amount of adsorbate removed in the column ( R , %): calculated by Equation (9) [53,54]:
R   ( % ) = q t o t a l W t o t a l × 100
To analyze the dynamic behavior of AY-23 adsorption, the experimental data of C t / C 0 vs. t (min) were fitted to the Thomas, Yoon–Nelson, and Adams–Bohart models (Table 1). Nonlinear data fitting to the models was performed with OriginLab®-Pro-8.1 software (OriginLab Corporation, Northampton, MA, USA).

2.6. Desorption Studies and Reuse of the Adsorbent

The AY-23 desorption experiments on hydrogel beads recovered from the column adsorption were performed in batch mode under continuous stirring (250 rpm). The solvents used for the dye desorption were 0.5 M of HCl and 0.5 M of NaOH. After stirring the suspension (200 g hydrogel/L solvent) for 2 h, hydrogel beads were separated by filtration, washed several times with distilled water, and reused in new continuous dye adsorption. The percentage of dye desorption was calculated by Equation (13):
D e s o r p t i o n   ( % ) = m d e s m a d s × 100
where m d e s (mg) and m a d s (mg) are the amounts of desorbed and adsorbed AY-23, respectively.
Under the best batch desorption conditions, fixed-bed tests and two continuous adsorption cycles were performed.

2.7. Adsorption in Real Wastewater Matrix

The real wastewater sample was taken from effluent from a food company in Manizales (Caldas, Colombia). This sample was provided under confidentiality, and the presence of the dye and other compounds such as gelatin, citric acid, sodium citrate, sodium benzoate, sucralose, and acesulfame-K were guaranteed. The integrated sample was collected from a wash tank and stored at 4 °C before use. The physicochemical characteristics of the sample were determined by following the Standard Methods (SM) for the Examination of Water and Wastewater [61]. Fixed-bed column adsorption tests with the real wastewater matrix were performed under the best adsorption conditions obtained with the aqueous dye solution prepared in the laboratory (synthetic sample of AY-23).

3. Results and Discussion

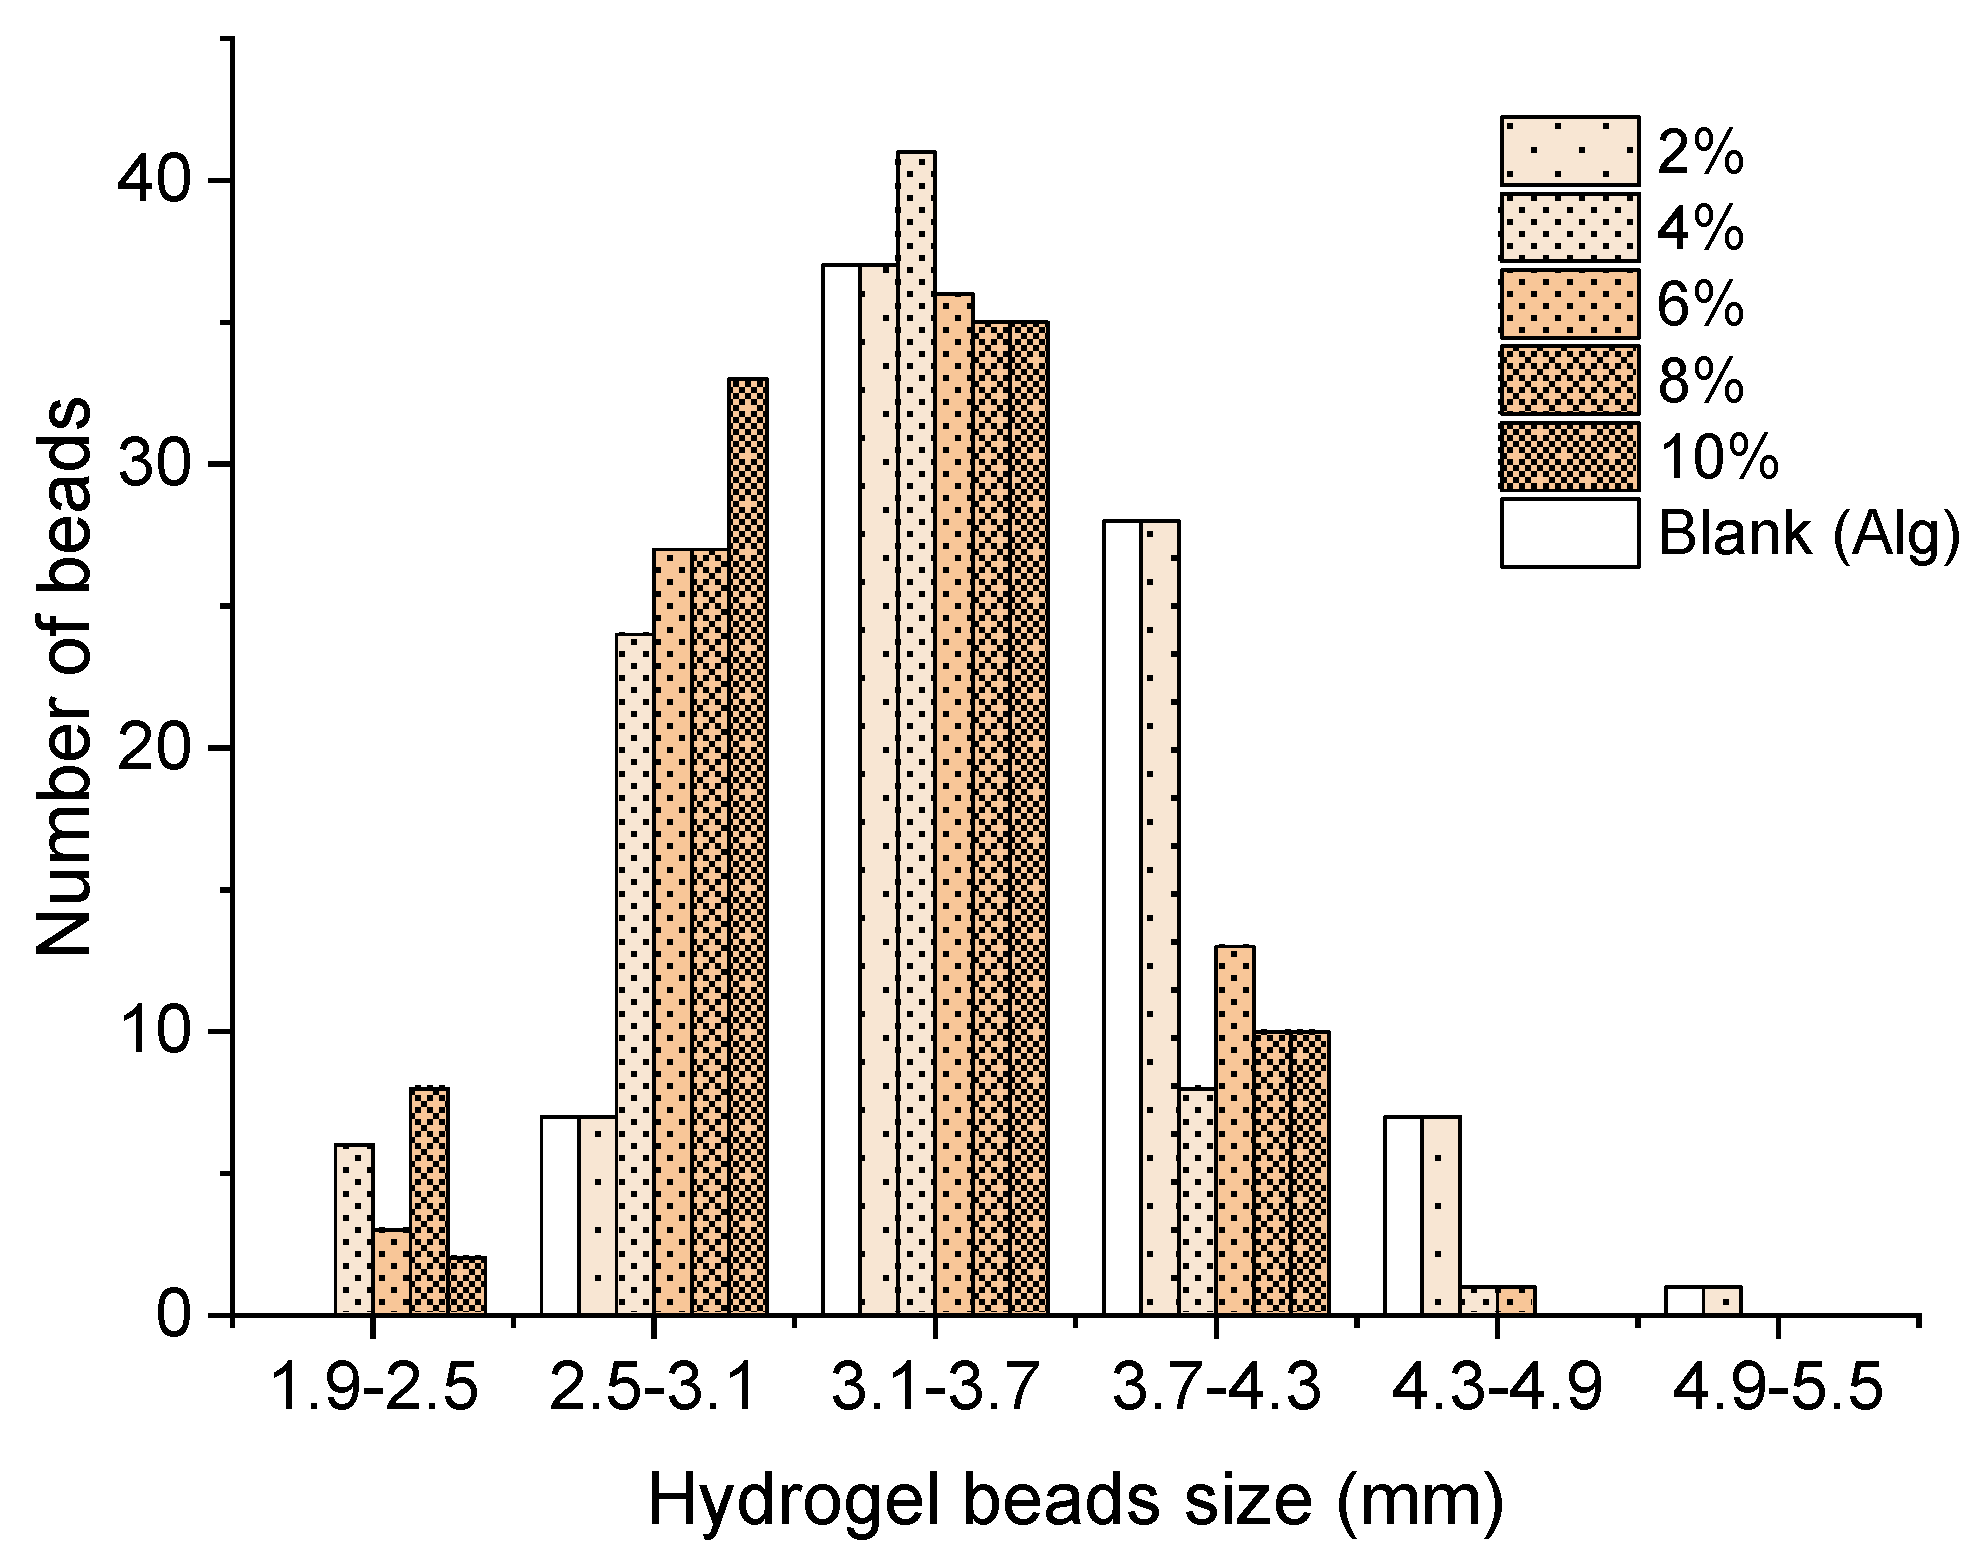
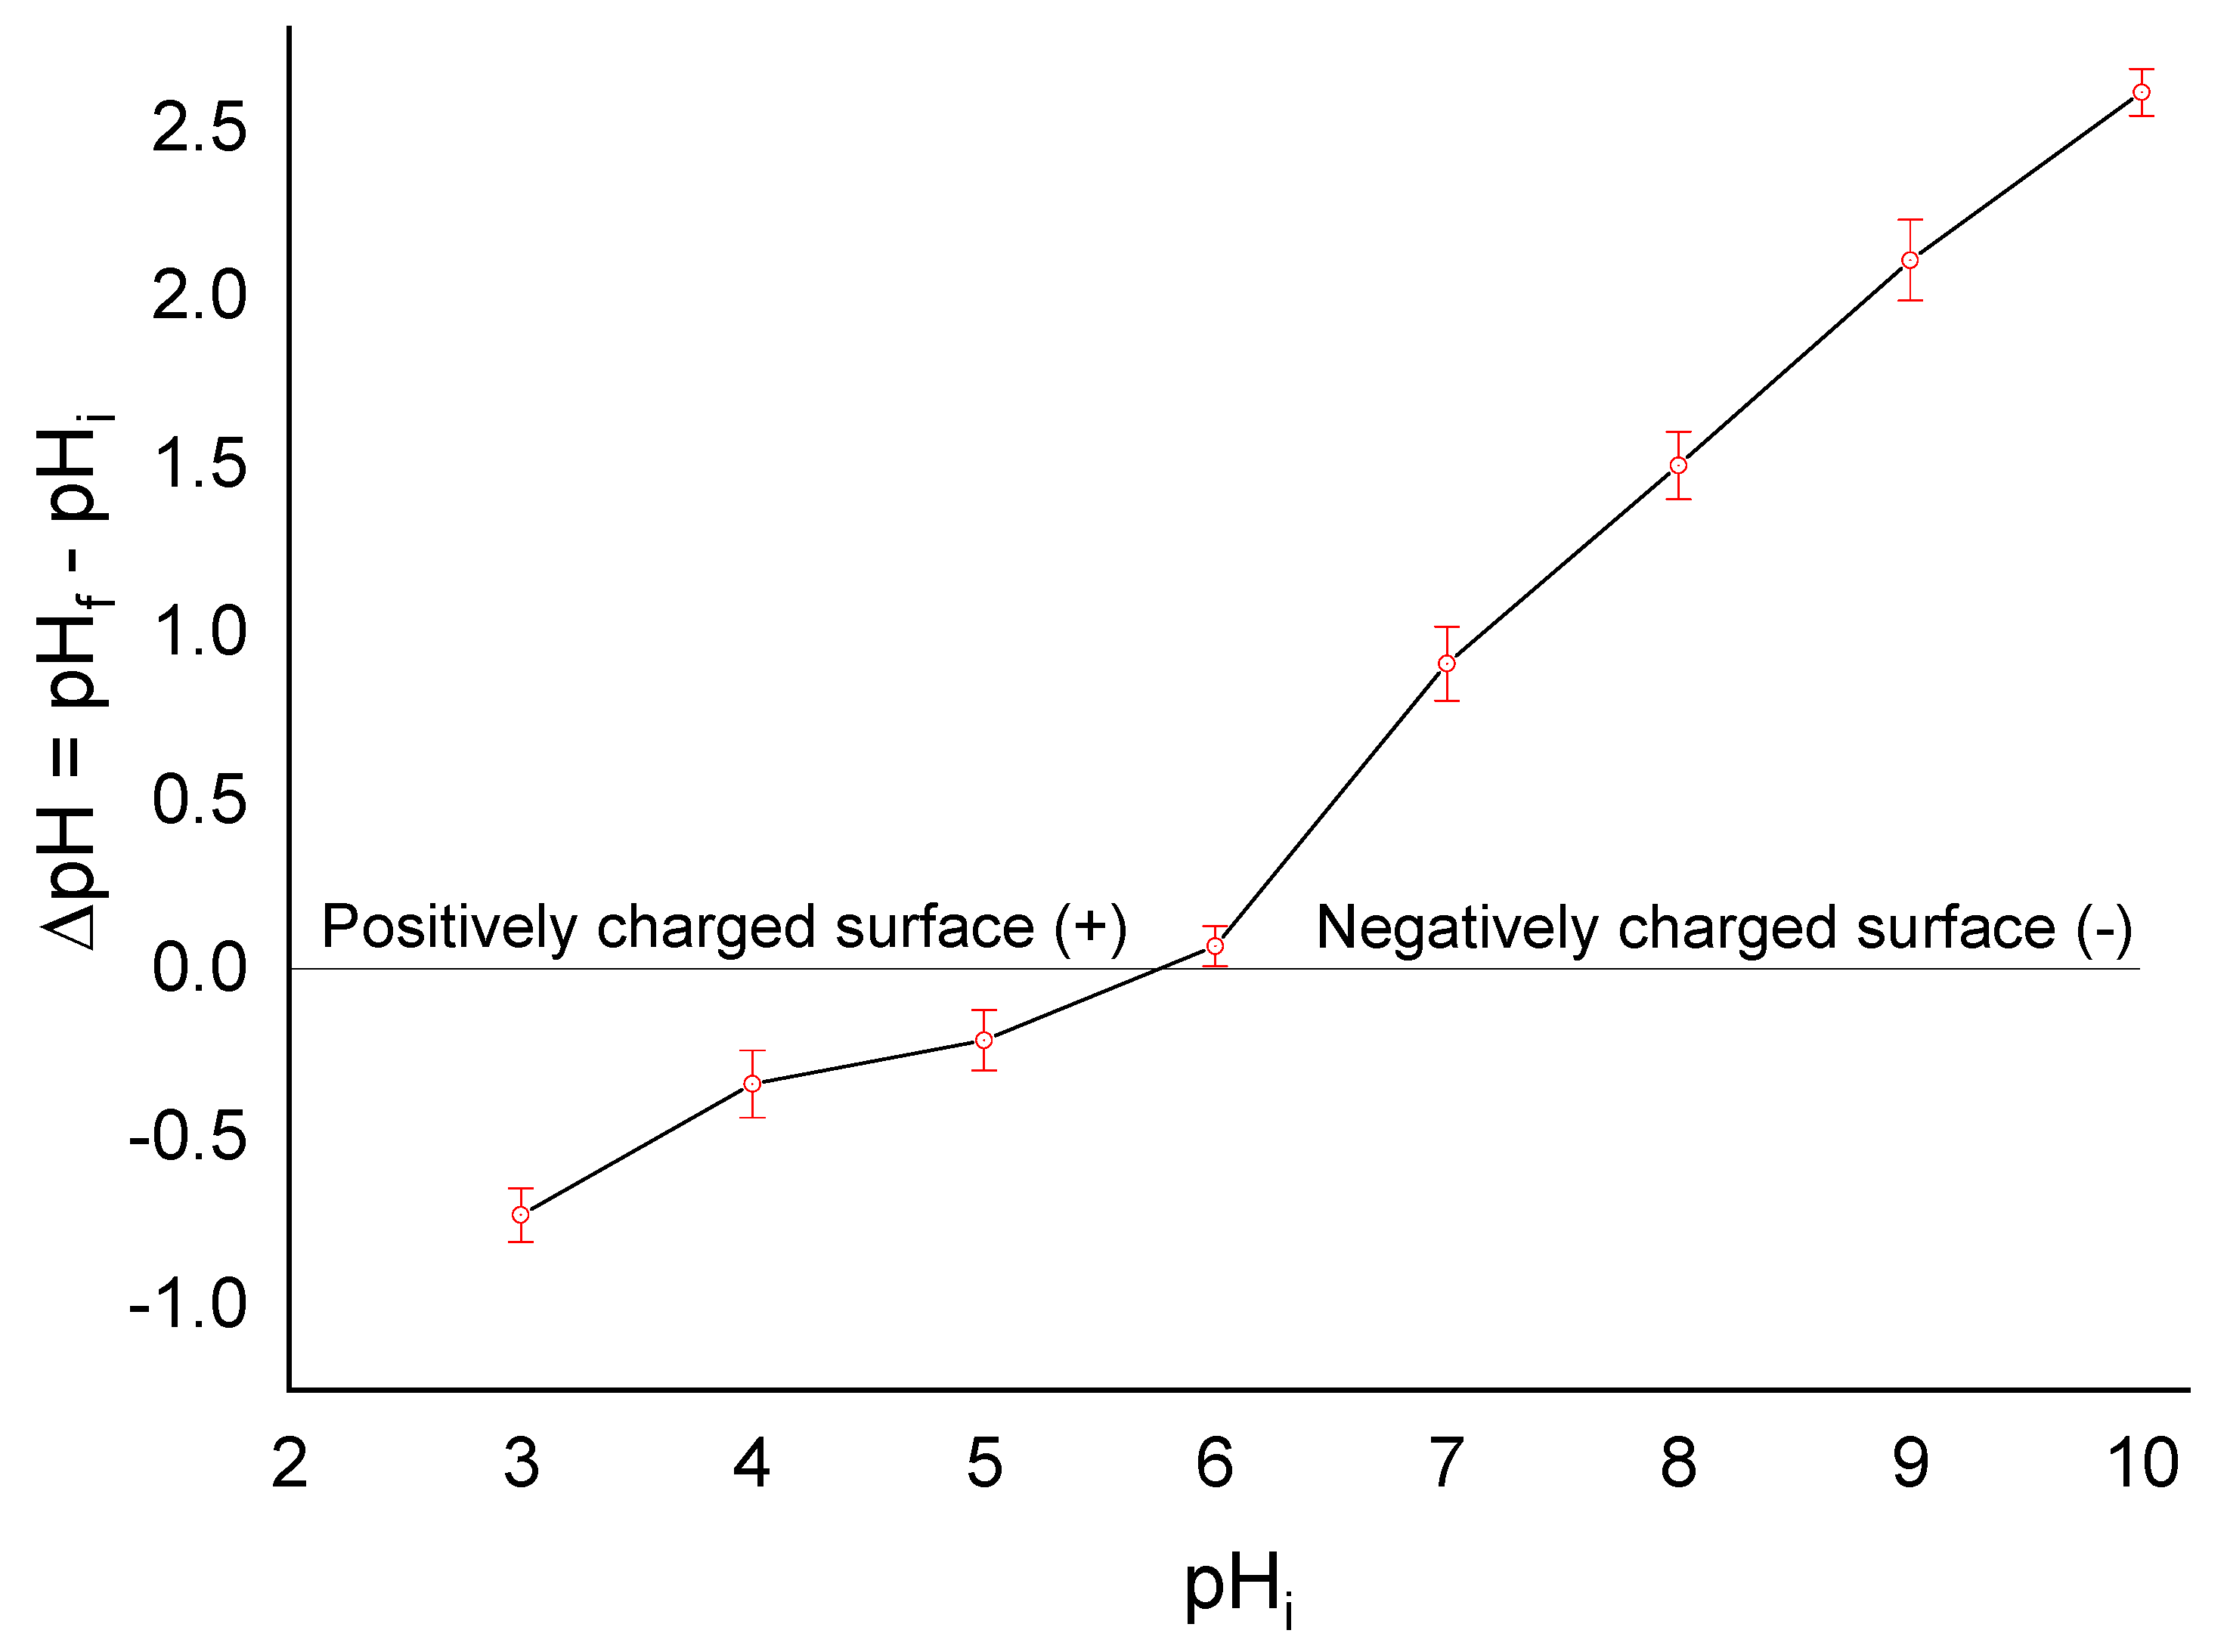
3.1. Adsorbent Characterization

The XRD patterns of sodium bentonite, organobentonite, sodium alginate powder, and the organoclay/alginate hydrogels are shown in Figure 3. The structural modification of the clay by cation exchange with the surfactant was confirmed by the change in reflection 001 from a d-value of 14.8 Å (2θ = 5.48°) in Na-Bent to 19.3 Å (2θ = 4.62°) in Obent. The basal spacing value of 19.3 Å in the organoclay suggests a structural arrangement of the surfactant alkyl chains between the bilayer (at 17.7 Å) and pseudo-trimolecular layer (at 21.7 Å) [62,63]. The diffraction pattern of sodium alginate exhibited three diffraction peaks at 2θ = 12.7, 22.8, and 39.6°, which were assigned to the (110) plane from the polyguluronate unit, the 200 plane from polymannuronate, and the other from an amorphous halo [64,65]. The characteristic signal of organobentonite was preserved in the OBent(2%)/Alg hydrogel. However, the intensity decrease in this signal was associated with the semi-crystalline nature of the alginate.
The size distribution of the hydrogel beads is shown in Figure 4. Although all beads were prepared by dripping the alginate or organoclay/alginate suspension with the same Pasteur pipette, the size of hydrogels varied between 2.0 and 5.1 mm. A total of 46% of the beads measured a diameter between 3.1 and 3.7 mm, regardless of the amount of organoclay contained in them.
Table 2 shows data for the average bead mass, moisture content, and swelling capacity for the OBent/Alg hydrogel, which was prepared with 2, 4, 6, and 10 wt.% organobentonite. The average mass of a bead with a diameter between 3.1 and 3.7 mm increased as the amount of organoclay in the hydrogel increased, such as rising from 38.8 ± 0.4 mg in the OBent(2%)/Alg to 63.9 ± 0.5 mg in the OBent(10%)/Alg. The average water content in the beads decreased from 94.2 ± 0.5 to 91.8 ± 0.9% when increasing the organoclay concentration from 2 to 10 wt.%. However, the swelling capacity remained practically constant in all hydrogel beads, with an average of 133.32 ± 0.65%, and this was independent of the organoclay concentration. The high swelling capacity of the hydrogels results from these polymeric material’s ability to absorb high amounts of water in their three-dimensional structure [66].
The zero-point charge (pHzpc) in the OBent/Alg hydrogel beads (Figure 5) slightly varied with the concentration of the organoclay, whereby it increased from 5.5 in OBent(2%)/Alg to 5.7 in OBent(10%)/Alg, with an average of 5.6 ± 0.1. The zero-point charge was defined as the pH of the solution, at which the charge of the positive surface sites was equal to that of the negative ones, i.e., the adsorbent net surface charge had zero value [67]. Acid Yellow 23 dye is a trisodium salt that dissociates in an aqueous solution to form the C16H9N4O9S23− anion. Therefore, the AY-23 anions were electrostatically adsorbed when pH < pHzpc.

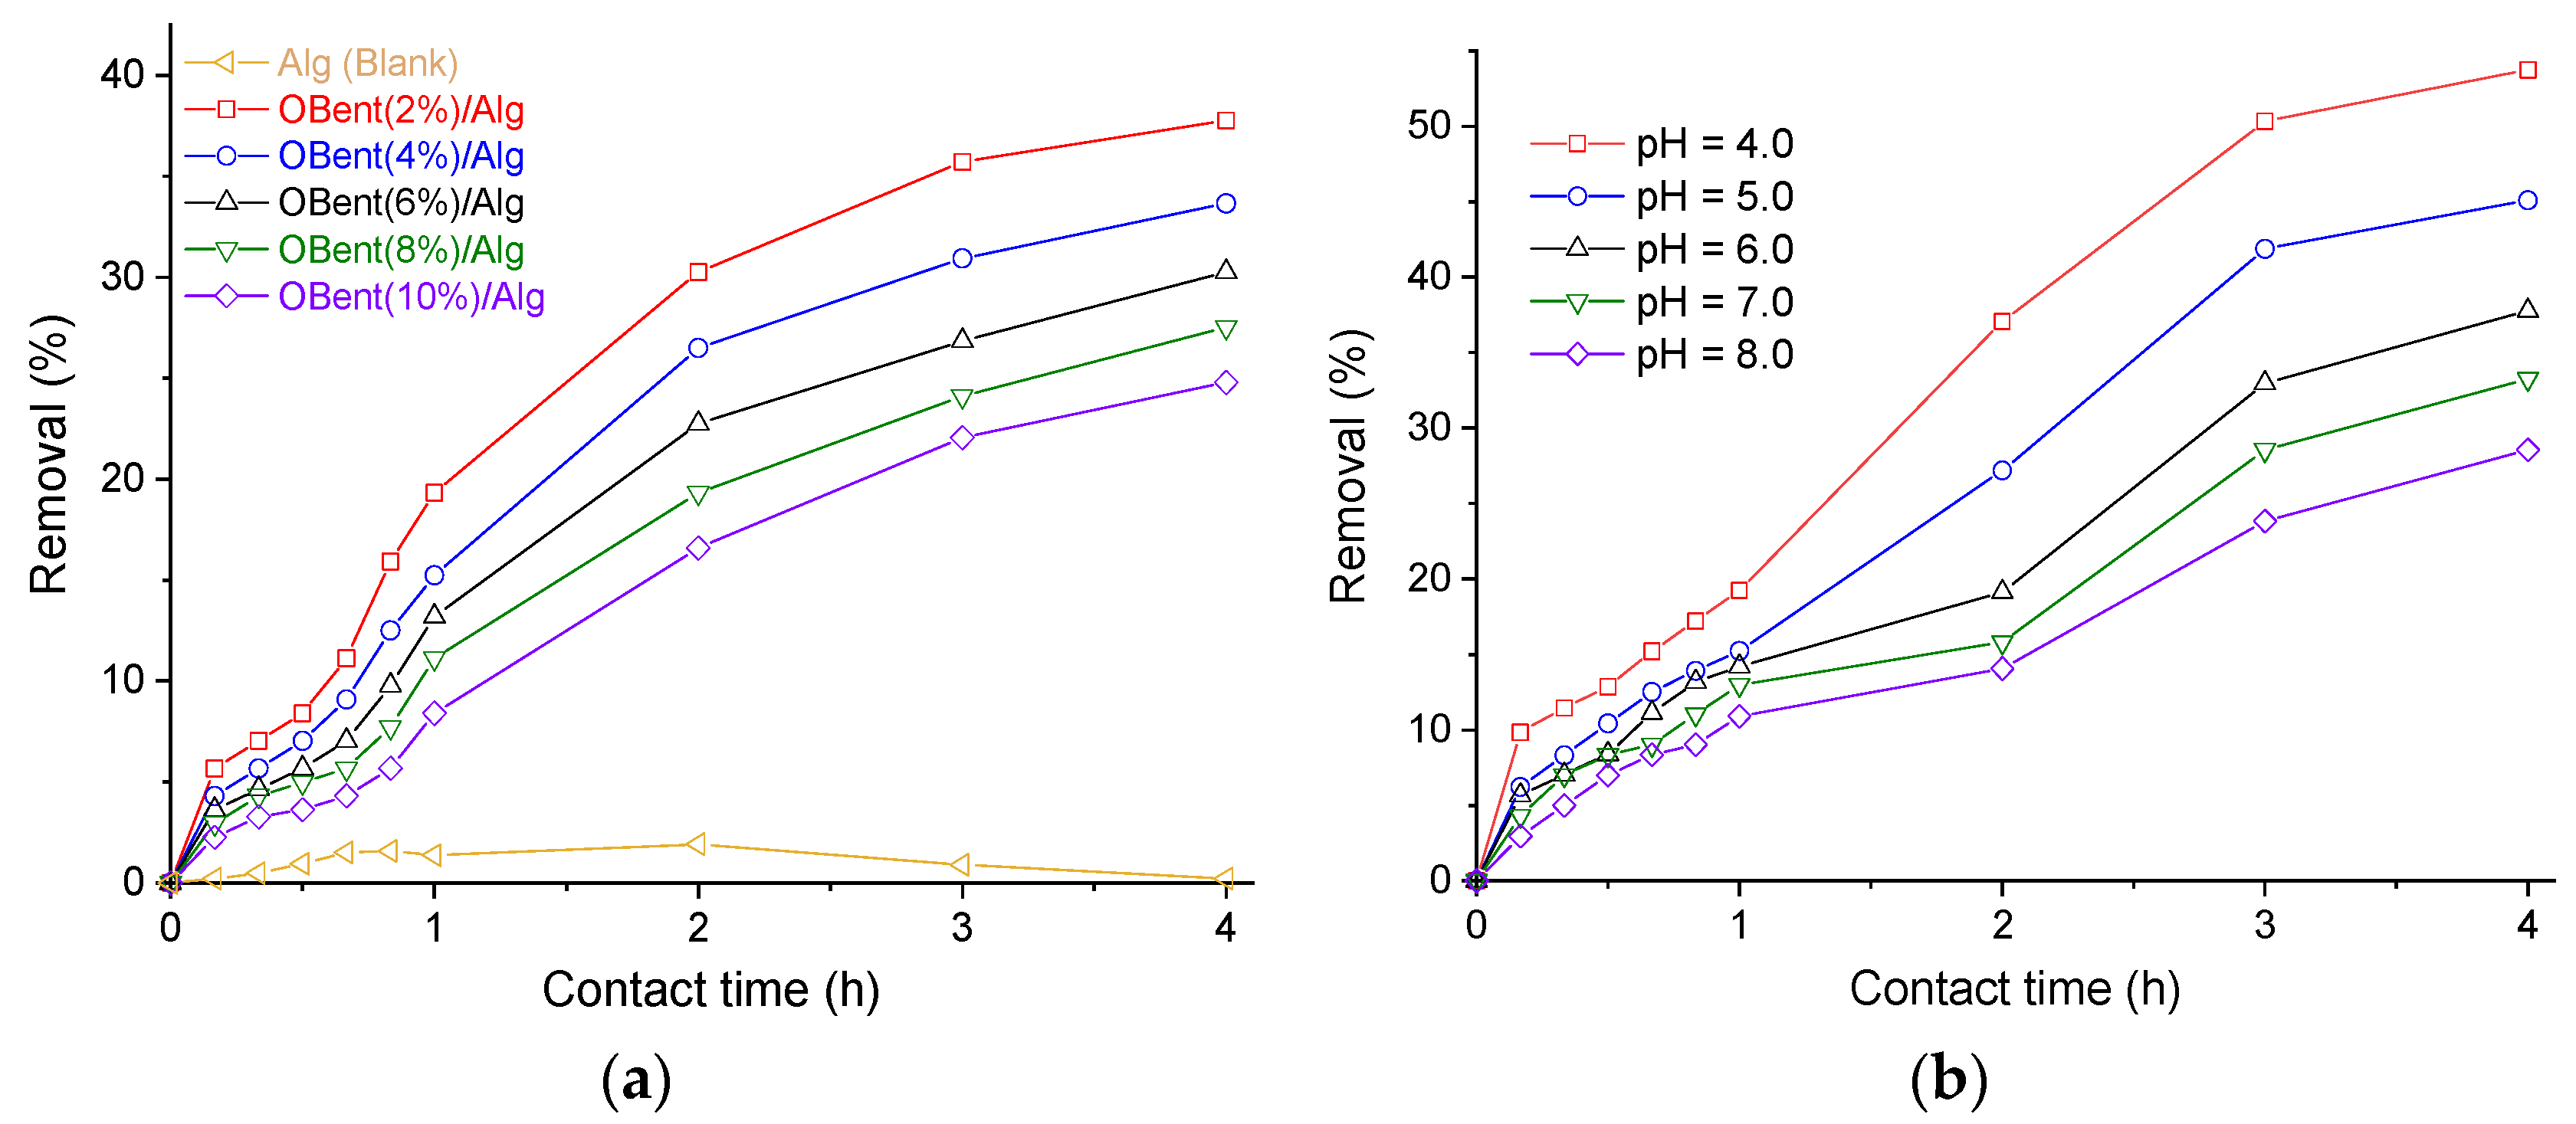
3.2. Batch Adsorption Tests

In order to establish certain operating conditions for the column tests, batch experiments were performed on dye removal to evaluate the effect of the organobentonite concentration in the hydrogel beads (Figure 6a) and pH solution (Figure 6b). The effect of the concentration of the organoclay in the beads was studied under the optimal adsorption conditions of AY-23 on a HDTMA-Br-modified Colombian bentonite that was found in a previous study (30 mg/L of dye, pH = 6.0, and 38.04 g of adsorbent) [52].
As the amount of organobentonite in the hydrogel beads increases, the dye adsorption capacity decreases considerably, such as decreasing from 37.76% in OBent(2%)/Alg to 24.79% in OBent(10%)/Alg (Figure 6a). This result can be attributed to diffusional limitations since dye molecules must pass through the hydrogel surface to be electrostatically adsorbed by the organoclay. At a higher concentration of organoclay within the hydrogel, there is a possibility that the modified clay mineral particles agglomerate, and that the adsorption capacity of the dye decreases. Alginate beads without organoclay (blank) showed a limited removal of the dye (<2.0%), suggesting that the adsorption was carried out by the organoclay and not by the matrix in which it was encapsulated. It is important to highlight that the bentonite was modified with a cationic surfactant so as to incorporate positively charged sites for electrostatic anionic dye adsorption, and that the alginate matrix cannot adsorb negatively charged species. A similar result was found in the removal of methyl orange in an aqueous solution on organobentonite/alginate beads since the adsorption capacity of the dye decreased with a growing amount of organobentonite in the encapsulated beads [23].
The effect of pH on the removal of AY-23 was measured in the hydrogel beads with 2 wt.% organobentonite since they showed the highest efficiency in dye adsorption. Batch tests were carried out by adjusting the initial pH of the dye solution to 4.0, 5.0, 6.0, 7.0, and 8.0 units, and the results of these are shown in Figure 6b. The highest dye adsorption occurred at pH 4.0 and 5.0, and since the pHzpc of OBent(2%)/Alg hydrogel was 5.5, the pH values < pHzpc favored the removal of AY-23 anions (see Figure 5). In general, the dye adsorption decreased with increased pH, whereby it decreased from 53.74% at pH = 4.0 to 28.55% at pH = 8.0. Similar results in the effect of pH were obtained in the removal of other cationic (methylene blue) and anionic (Congo red) dyes when using alginate/natural bentonite beads [44], as well as in the selective adsorption of fluoride ions on nanohydroxyapatite that were encapsulated in alginate [68].

3.3. Fixed-Bed Column Adsorption Tests

In the batch tests with OBent(2%)/Alg beads at pH 4.0 and 5.0, the highest dye removals were obtained (see Figure 6b). At the above pH values and at an intermediate one (pH = 4.5), adsorption tests in a fixed-bed column were carried out (Figure 7) under the following conditions: h = 15 cm, Q = 1 mL/min and C 0 = 30 mg/L. Breakthrough curves at pH 4.0, 4.5 and 5.0 were processed, yielding AY-23 removals of 40.53, 39.72, and 37.96%, respectively.
The following AY-23 adsorption tests on the fixed-bed column were performed with OBent (2%)/Alg hydrogel beads, and the pH of the dye solution was adjusted to 4.5 since, for this pH, the dye removal in the column only decreased by 2.0% when concerning the value obtained at pH = 4.0. The effects of bed height, solution flow rate, and initial dye concentration were studied using fixed-bed columns under different conditions. Breakthrough curves for the different test conditions were obtained (Figure 8), and the adsorption parameters are summarized in Table 3.
Breakdown time ( t b , min) and exhaustion time ( t e , min) were obtained by the interpolation of the C t / C 0 vs. t plot using OriginLab®-Pro-8.1 software (Interpolar/Extrapolar Y of X tool). With the breakthrough time ( t b ) and volumetric flow rate ( Q , mL/min), the volume of treated effluent ( V t , mL) was calculated via Equation (4).
To determine the total adsorption capacity of the column ( q t o t a l , mg/g), Equation (5) was used. First, C a d s vs. t was calculated and plotted in TableCurve 2Dv5.01 software (SYSTAT Software Inc., Chicago, IL, USA), and the “Curve-Fill All Equation” option was selected. Then, an equation with a coefficient of determination R2 > 0.9993 was selected, and the area under the curve (integral of Equation (5)) was obtained. The maximum adsorption capacity ( q m , mg/g), the total amount of dye retained in the column ( W t o t a l , mg), the equilibrium adsorbate concentration ( C e , mg/L), and the total amount of dye removed in the column (R, %) were calculated through Equations (6), (7), (8), and (9), respectively.
The adsorption capacity ( q m ) increased from 0.416 to 0.485 mg/g when the bed height increased from 10 to 20 cm (Figure 8a). The higher amount of adsorbent and adsorption sites available explained the increase in AY-23 adsorption capacity with the bed height. In the adsorption of methylene blue on a citrus peel that was encapsulated in calcium alginate, similar results were obtained in removing the dye as a function of bed height [53].
When the flow rate increased from 1 to 5 mL/min (Figure 8b), the adsorption capacity decreased from 0.460 to 0.053 mg/g. This was due to reduced contact time between the dye and hydrogel beads at higher flow rates. Since the adsorption rate was diffusion controlled, an early breakdown occurred, causing the saturation to be reached faster, thus leading to a low adsorption capacity of the bed [69].
Increasing the dye concentration in the influent generated a higher driving force for mass transfer such that adsorbent saturation occurred more rapidly. As a result, both exhaust time ( t e ) and treated volume ( V t ) were reduced [57]. By increasing the dye concentration from 15 mg/L to 45 mg/L (Figure 8c), the adsorption capacity increased from 0.345 to 0.557 mg/g. A similar tendency was found in the fixed-bed adsorption study of the Drimarine Black CL-B dye in an aqueous solution when using a lignocellulosic residue (peanut husk) immobilized on sodium alginate [70].

3.4. Breakthrough Curve Modelling

The breakthrough curves were analyzed under different conditions and fitted to the Thomas, Yoon–Nelson, and Adams–Bohart models. The kinetic parameters of each model were determined with a nonlinear regression of the data using OriginLab®-Pro-8.1 software (Table 4, Table 5 and Table 6).
The adjusted coefficient of determination (Adj. R2) and the reduced chi-square value (χ2) were selected as measures of the fit quality in the breakthrough curves [71,72]. These two statistical parameters eliminated the adverse effects of the degrees of freedom [72] since the Thomas, Yoon–Nelson, and Adams–Bohart models included different numbers of parameters. High Adj. R2 (close to 1.0) and low χ2 (close to zero) values were associated with the fact that the models’ curves were a good fit of the experimental data [72].
The Adj. R2 value obtained by fitting the experimental data of the breakthrough curves to the Thomas nonlinear model were equal to those found in the Yoon–Nelson model, i.e., the Adj. R2 was greater than 0.9575, except for the test with a flow rate of 5 mL/min where the Adj. R2 was 0.8177 (Table 4 and Table 5). For the Adams–Bohart model, an Adj. R2 between 0.9555 and 0.9999 and a χ2 < 1.36 × 10⁻³ was found (Table 6), indicating a good fit of the experimental data to this model.
Both external (fluid-film) and intraparticle (solid) mass-transfer resistance were ignored in the Thomas model. This indicates that the surface reaction between the adsorbate and the unused capacity of the adsorbent controlled the adsorption rate [73]. The kinetic constant values, K T h , reduced as the bed height increased because the adsorbent–adsorbate interactions could occur faster in a greater amount of adsorbent. Therefore, the adsorption capacity increased from 0.3640 to 0.4558 mg/g when the bed height increased from 10 to 20 cm.
For the highest flow rate (5 mL/min), high normalized concentration ( C t / C 0 ) values were observed at the beginning of the continuous adsorption. Consequently, the dye concentration in the effluent increased rapidly, and the bed became saturated. As the flow rate increased, so too did the Thomas constant, K T h . This behavior may be attributed to the insufficient residence time of the dye in the column.
As the initial dye concentration increased, the value of K T h decreased because the driving force for the adsorption is the concentration difference of the AY-23 between the adsorbents and solution. The highest adsorption capacity ( q 0 = 0.4998 mg/g) obtained with the Thomas model was for a bed height of 15 cm, with the lowest flow rate (1 mL/min) and the highest initial dye concentration (45 mg/L).
Considering that the OBent(2%)/Alg swollen hydrogel contains approx. 1.50 ± 0.03% OBent, and that for a bed height of 15 cm (10.10 g), the amount of active phase is 0.1515 g, the adsorption capacity of the organoclay on the hydrogel is given by Equation (14):
A d s o r t i o n   C a p a c i t y = 0.4998   m g   d y e g   h y d r o g e l × ( 10.10   g   h y d r o g e l 0.1515   g   O B e n t ) = 33.32   m g   d y e g   O B e n t
The maximum adsorption capacity obtained for the organoclay powder when using the Langmuir model was 40.79 mg/g [52]. Therefore, the OBent(2%)/Alg hydrogel retained 81.69% of the adsorption capacity of the organobentonite powder, although the experimental conditions of both tests were different. The advantage of using OBent(2%)/Alg hydrogel beads was that no filtration step was required, which in the case of powdered organobentonite, was performed with 0.45 μm of cellulose filters. Furthermore, using hydrogels as an adsorbent material allows for their use in continuous processes [74].
The maximum dye adsorption capacity of the hydrogel prepared in this study was compared with other alginate composites, and the results are shown in Table 5. There are no adsorption studies of Acid Yellow 23 on organobentonite/alginate hydrogels, and most of the research has focused on the adsorption of cationic dyes on other types of alginate composites. Only one investigation has studied the adsorption of an anionic dye (Allura red) on an organoclay/alginate composite in a batch system [47]. In the adsorption kinetic study of Allura red, the adsorption capacities were 0.478 and 0.509 mg/g for the wet and dry composite, respectively. The maximum adsorption capacity obtained with the Langmuir model for batch experiments with the dry composite was 7.0 mg/L [47]. The results of this study are similar to those obtained in the Allura red adsorption, although the q m values in the batch process were higher than those for the fixed-bed column process [53].
Table 5. Comparison of the adsorption capacity of the dyes on alginate composites.
AdsorbentDyeTypeProcess q m , mg/gRef.
Alginate encapsulated pillared claySafranineCationicBatch268.5[35]
Alginate/natural bentonite (1/3)Methylene blueCationicBatch550.92[44]
Congo redAnionicBatch111.07
Alginate–organobentonite composite (1/3)Methylene blueCationicBatch670.54[45]
Organoclay–alginate matrixAllura redAnionicBatch5.7–7.0[47]
Citrus peels–calcium alginateMethylene blueCationicBatch964.54[53]
Column31.45
Cellulose nanocrystal–alginateMethylene blueCationicColumn255.5[54]
Activated bentonite/alginate compositeMethylene blueCationicBatch780.59[75]
Crystal violetCationic546.53
Activated carbon–bentonite–alginateMethylene blueCationicBatch756.97[76]
Organobentonite/alginate hydrogelAcid Yellow 23AnionicColumn0.50This study
The Yoon–Nelson model assumes that the decrease in the probability of each adsorbate is proportional to the probability of its adsorption and breakthrough on the adsorbent [57,58,77]. As shown in Table 6, the rate constant Yoon–Nelson ( K Y N ) decreased while the τ increased as the bed height was augmented. As the bed height (and thus adsorbent mass) increases, more adsorbent particles will be available in the column to interact with the solute, thus requiring a longer period to reach a 50% breakthrough.
Table 6. Parameters of the Yoon–Nelson model under different conditions.
h
cm
Q
mL/min
C 0
mg/mL
K YN
1/min
τ
min
R 2 A d j .   R 2 χ 2
1010.0300.0291 ± 0.002395.7365 ± 2.99600.96650.96550.0044
1510.0300.0263 ± 0.0020140.2932 ± 3.30000.96850.96760.0047
2010.0300.0262 ± 0.0016198.8837 ± 2.66720.98150.98110.0031
1510.0300.0263 ± 0.0020140.2932 ± 3.30000.96850.96760.0047
1520.0300.0558 ± 0.006961.8320 ± 2.52040.95750.95580.0059
1550.0300.0568 ± 0.013821.3060 ± 4.14850.81770.80550.0171
1510.0150.0185 ± 0.0008220.2752 ± 2.80970.98460.98430.0024
1510.0300.0263 ± 0.0020140.2932 ± 3.30000.96850.96760.0047
1510.0450.0340 ± 0.0028112.1453 ± 2.71880.97250.97170.0042
The constant K Y N increased and the τ (time required for C t / C o = 0.5) decreased with the increasing flow rate and the dye’s initial concentration. The increase in K Y N with a growing flow rate or initial dye concentration indicated a decrease in the mass-transfer resistance, and the decrease in the τ indicated a faster saturation of the adsorption bed. The mass-transfer resistance was proportional to the axial dispersion and thickness of the liquid film on the particle surface [78]. Considering that the flow rates were so low, it is reasonable to assume that the axial dispersion was minimal in a such situation [78,79]. Therefore, increasing the Q and C o allowed for the driving force of the mass transfer in the liquid film to rise.
The Adams–Bohart model assumes that the adsorption rate is proportional to both the adsorbate concentration and the residual capacity of the adsorbent in the initial part ( C t / C 0 < 0.5) of the breakthrough curve [73,80]. The results of modeling the experimental rupture curves with the Adams–Bohart model are presented in Figure 8. This approach was focused on the estimation of characteristic parameters, such as the adsorption capacity per unit bed volume ( N 0 ) and the kinetic constant ( K A B ) from the Adams–Bohart model (Table 7).
The N 0 and K A B values increased and decreased, respectively, when increasing the bed height and initial dye concentration due to the saturation of the adsorbent sites [81]. The values of K A B were affected by the flow rate, and they increased with an augmented flow rate. This indicated that the overall system kinetics was dominated by external mass transfer in the initial part of adsorption in the fixed bed [82]. The adsorption mechanism of AY-23 on the organobentonite/alginate hydrogels may occur due to the electrostatic interactions between the cationic groups of the organoclay and the dye anions (Figure 9). In addition, the removal due to the interactions between the hydrophobic alkyl chain of the organoclay with the hydrophobic part of the dye molecule has been suggested previously [40,47,83,84].

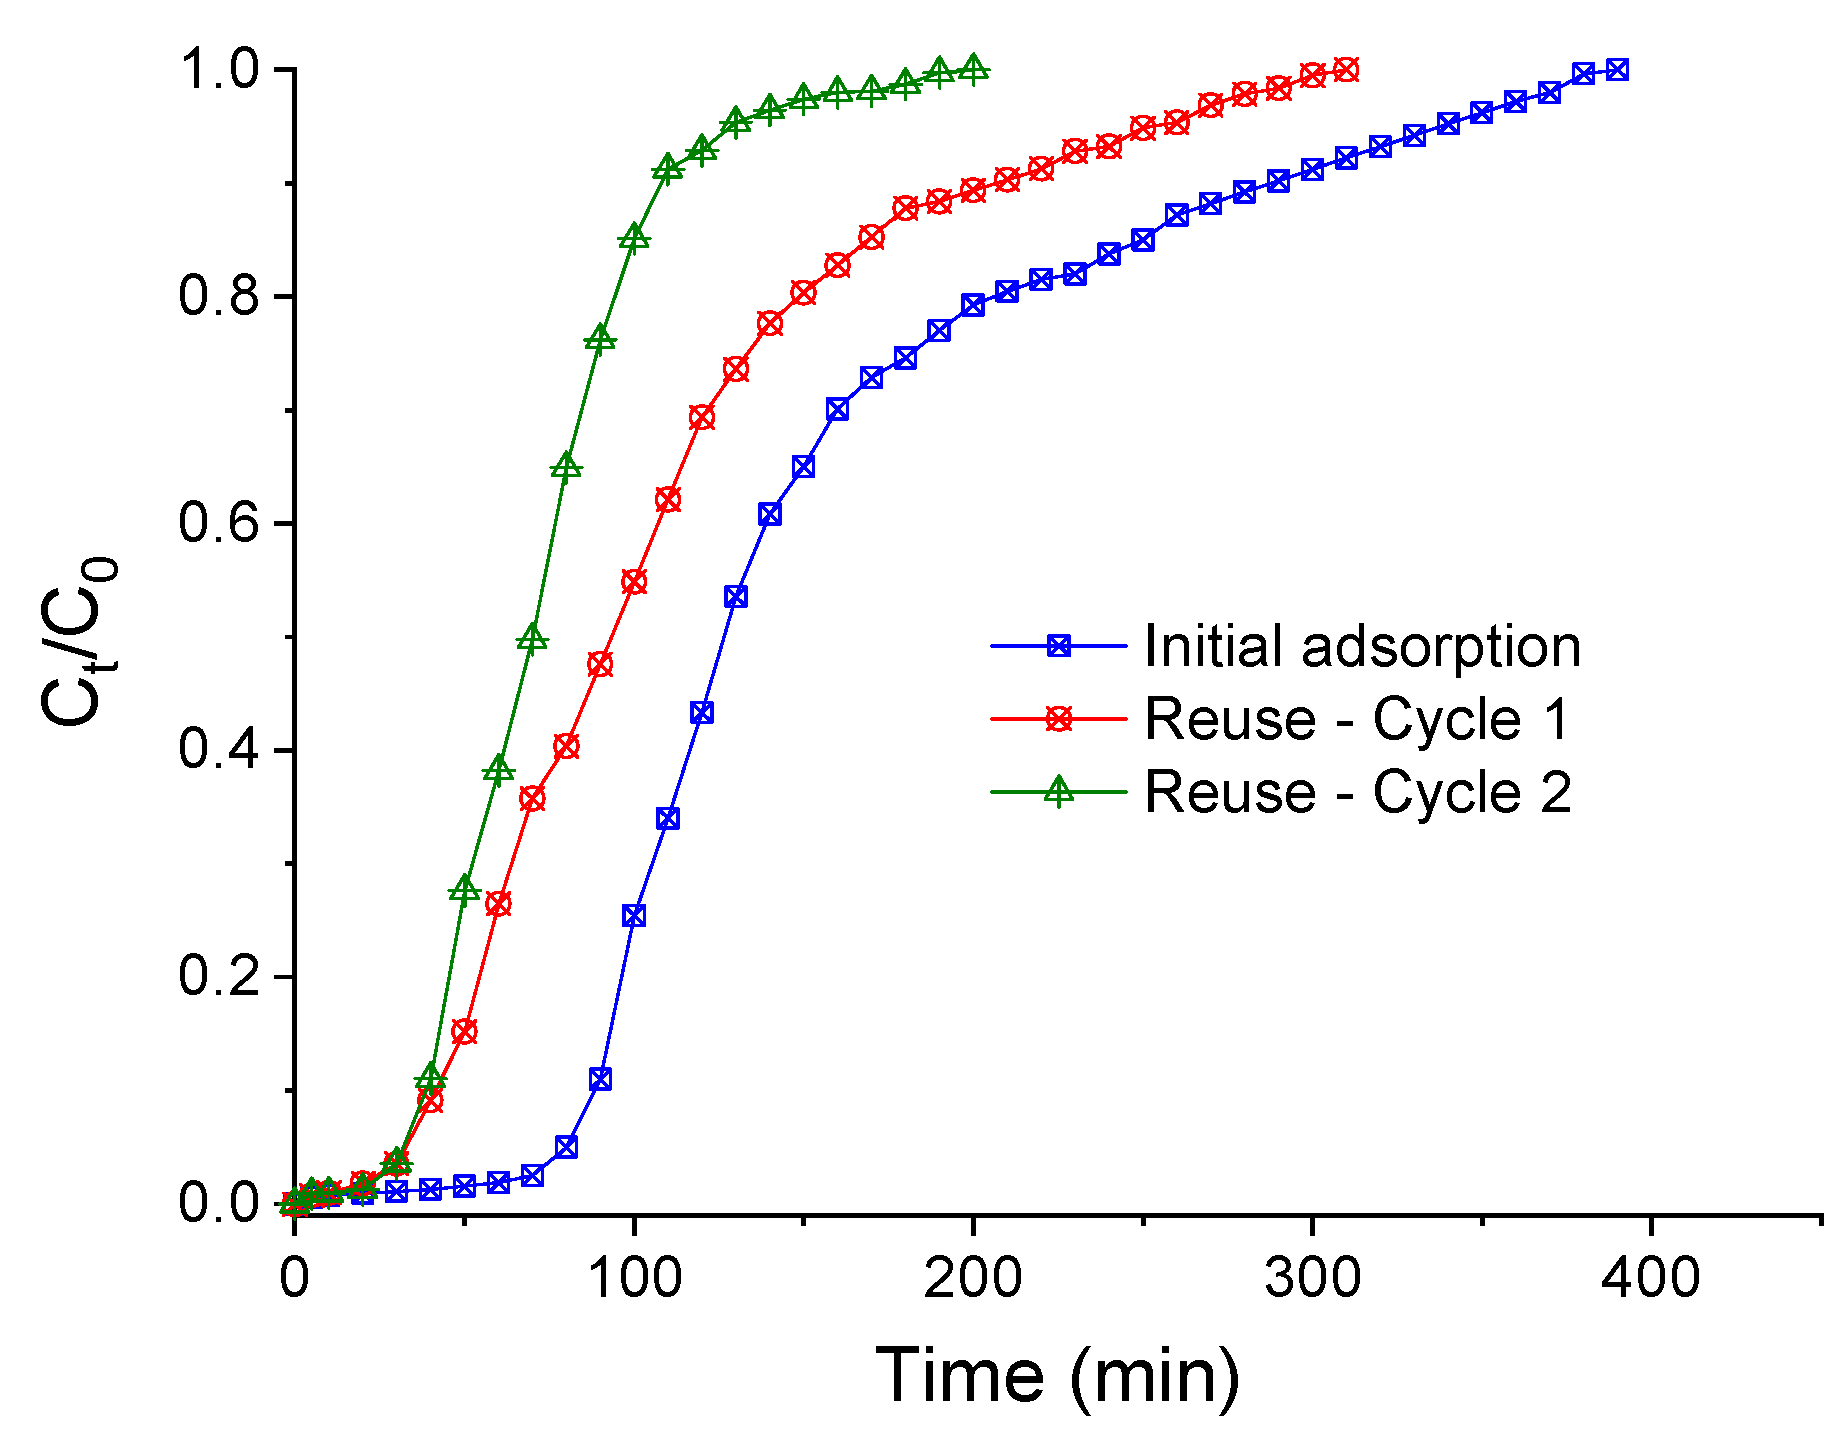
3.5. Desorption Studies and Adsorbent Reuse

Regeneration is an essential factor that impacts an adsorbent’s reusability and efficiency [85]. Hydrogel beads from the fixed-bed test with h = 15 cm, Q = 1 cm/min, and C 0 = 30 mg/L were used for the desorption tests, which exhibited a high adsorption capacity ( q m = 0.460 mg/L, see Table 3).
The highest desorption of AY-23 in the batch tests was obtained with the aqueous solution of NaOH (Figure 10). The aqueous solution’s pH affected the desorption, going from 76.61% with 0.5 M of NaOH (pH = 13.7) to 17.45% with 0.5 M of HCl (pH = 0.3). It is important to consider that the desorption conditions are opposite to those for the adsorption of an anionic dye. Desorption was favored when the pH of the solution was higher than the pHzpc of the adsorbent, i.e., at pH > 5.5.
In addition to the batch-desorption tests, a desorption cycle was performed in the fixed-bed column with 0.5 M of NaOH. After desorption, distilled water was passed through the bed, and two new adsorption cycles were performed. Breakthrough curves for the initial adsorption and reuse of the adsorbent are shown in Figure 11, and the adsorption parameters are summarized in Table 8. The adsorbent in its first use in the fixed bed achieved a dye removal of 39.72% and, with the first and second reuse cycles, the removal became 31.75 and 25.65%, which corresponds to approximately 79.93 and 64.56% of the initially removed adsorbate.

3.6. Fixed-Bed Column Adsorption of a Real Wastewater Matrix

The presence of the AY-23 dye in the wastewater sample was verified with the visible spectrum (Figure 12). The λmax for the AY-23 solution was 428 nm, and the sample presented a broad absorption band centered at this value. The initial concentration of AY-23 in the wastewater sample was 11.37 mg/L, obtained from the absorbance vs. concentration calibration curve.
The results of the physicochemical characterization of the wastewater matrix are summarized in Table 9. The total organic carbon (TOC) concentration in the sample was very high compared to the carbon content contributed by the dye (11.37 mg/L AY-23, equivalent to 4.1 mg/L TOC). The TOC content was mainly due to the presence of gelatin, citric acid, sodium citrate, sodium benzoate, sucralose, and acesulfame-K, which also contribute to the chemical and biological oxygen demand of the sample.
The initial pH of the wastewater sample was 7.4, and for the adsorption tests, it was acidified with 0.1 M of HCl solution. Adsorption tests were performed at pH = 4.5, using a bed height of 15 cm and a flow rate of 1 mL/min (Figure 13). The adsorption parameters for the breakthrough curves are summarized in Table 10. The mean q m value for the adsorption of the dye present in the wastewater sample using the OBent(2%)/Alg hydrogel was 0.336 ± 0.005 mg/g. The q m value was lower than that obtained in tests with the same bed height and flow rate at different dye concentrations (15, 30, and 45 mg/L); this is because the wastewater matrix has a lower dye concentration ( C 0 = 11.37 mg/L), and the driving force for mass transfer decreases. Furthermore, at pH 4.5, the dissociation of citric acid, sodium citrate, and sodium benzoate generates anions that could adsorb on the active sites of the OBent(2%)/Alg hydrogel, decreasing the adsorption capacity of the dye. The total amount of dye removed in the column ( R , %) for the three continuous adsorption tests with the wastewater matrix was 44.696 ± 0.545%, and this value is in the upper range of the R calculated in this study for the synthetic dye solutions (See Table 3).
The adsorption results obtained with the wastewater sample were compared with those obtained in a fixed-bed column study using free and immobilized Nelumbo nucifera leaf adsorbent to remove Congo red from industrial effluent [86]. The decolorization efficiencies of Congo red adsorption were 76.25% and 62.18%, higher values than in this study. The average COD and BOD removals were 86.91 and 91.96%, respectively [86]. In this study, the COD and BOD reductions were 36.09 + 1.02% and 22.64 + 1.51%, indicating that, in addition to AY-23 dye adsorption, the removal of other organic compounds present in the actual wastewater sample was achieved.

4. Conclusions

The modification of the bentonite with the cationic surfactant hexadecyltrimethylammonium bromide (HDTMA-Br) changed the value of the basal spacing d001 from 14.8 to 19.3 Å, which suggests there is a structural arrangement in the surfactant alkyl chains between the bilayer and pseudo-trimolecular layer. The encapsulation of the organoclay in the alginate matrix did not change the basal spacing in the hydrogel. However, there was a decrease in the intensity of this signal in the XRD pattern, and this was associated with the semi-crystalline nature of the alginate.
Evaluating some of adsorption parameters in the batch mode of Acid Yellow 23 on the OBent/Alg hydrogel allowed for an establishment of the operating ranges for the fixed-bed column tests. The dye removal decreased as the concentration of the organoclay in the hydrogel increased from 2 to 10 wt.%. The highest dye adsorption occurred at pH 4.0–5.0 with the hydrogel containing 2 wt.% organoclay.
The experimental data of the breakthrough curves were well-fitted to the Yoon–Nelson, Thomas, and Adams–Bohart models, and the parameters of each model were determined by using nonlinear fitting. When using the Thomas model, the maximum adsorption capacity ( q 0 = 0.4998 mg/g) was obtained for an average bed height (15 cm), the lowest flow rate (1 mL/min), and the highest initial dye concentration (45 mg/L). The concentration of organoclay in the hydrogel, q 0 , was equivalent to 33.32 mg/g of OBent. Therefore, the OBent(2%)/Alg hydrogel was retained at 81.69% of the adsorption capacity of the powdered organoclay. However, the experimental conditions of both tests differed (i.e., the batch adsorption for the powdered OBent and continuous adsorption for the hydrogel).
The Acid Yellow 23 dye adsorbed in the OBent(2%)/Alg hydrogel can be desorbed by using a 0.5 M NaOH solution as a solvent. After two cycles of continuous reuse of the adsorbent material, it retained 64.56% of the initial dye removal capacity, guaranteeing the adsorbent material’s reusability. The results obtained in this study suggest the potential of organoclay/alginate hydrogel for the removal of anionic dyes in a fixed-bed column.
The OBent(2%)/Alg hydrogel removed the AY-23 dye contained in a real wastewater sample, suggesting the applicability of the composite for the adsorption of pollutants in continuous systems.

Author Contributions

Conceptualization, M.T.D.-A., J.J.V.-U. and N.R.S.-G.; methodology, D.R.-A. and I.F.M.-Q.; investigation, D.R.-A., I.F.M.-Q. and N.R.S.-G.; formal analysis, D.R.-A., I.F.M.-Q., M.T.D.-A., J.J.V.-U. and N.R.S.-G.; writing—original draft preparation, I.F.M.-Q. and N.R.S.-G.; writing—review and editing, I.F.M.-Q. and N.R.S.-G.; supervision, M.T.D.-A. and J.J.V.-U.; project administration, N.R.S.-G.; funding acquisition, M.T.D.-A., J.J.V.-U. and N.R.S.-G. All authors have read and agreed to the published version of the manuscript.

Funding

This study was partially funded by the Faculty of Engineering and Architecture of the Universidad Nacional de Colombia Sede Manizales, through the Hermes project code 46078.

Data Availability Statement

The data that support the findings of this study are available from the corresponding author upon reasonable request.

Acknowledgments

The authors would like to acknowledge the “Laboratorio de Fisicoquímica Avanzada” of the Universidad Nacional de Colombia Sede Manizales for the experimental support for this research.

Conflicts of Interest

The authors declare no conflict of interest.

References

  1. Yao, H.-Y.; Guo, H.; Shen, F.; Li, T.; Show, D.-Y.; Ling, M.; Yan, Y.-G.; Show, K.-Y.; Lee, D.-J. Anaerobic-aerobic treatment of high-strength and recalcitrant textile dyeing effluents. Bioresour. Technol. 2023, 379, 129060. [Google Scholar] [CrossRef] [PubMed]
  2. Khan, A.A.; Gul, J.; Naqvi, S.R.; Ali, I.; Farooq, W.; Liaqat, R.; AlMohamadi, H.; Štěpanec, L.; Juchelková, D. Recent progress in microalgae-derived biochar for the treatment of textile industry wastewater. Chemosphere 2022, 306, 135565. [Google Scholar] [CrossRef] [PubMed]
  3. Al-Tohamy, R.; Ali, S.S.; Li, F.; Okasha, K.M.; Mahmoud, Y.A.G.; Elsamahy, T.; Jiao, H.; Fu, Y.; Sun, J. A critical review on the treatment of dye-containing wastewater: Ecotoxicological and health concerns of textile dyes and possible remediation approaches for environmental safety. Ecotoxicol. Environ. Saf. 2022, 231, 113160. [Google Scholar] [CrossRef] [PubMed]
  4. Sharma, B.; Dangi, A.K.; Shukla, P. Contemporary enzyme based technologies for bioremediation: A review. J. Environ. Manag. 2018, 210, 10–22. [Google Scholar] [CrossRef]
  5. Lellis, B.; Fávaro-Polonio, C.Z.; Pamphile, J.A.; Polonio, J.C. Effects of textile dyes on health and the environment and bioremediation potential of living organisms. Biotechnol. Res. Innov. 2019, 3, 275–290. [Google Scholar] [CrossRef]
  6. Khan, S.; Malik, A. Toxicity evaluation of textile effluents and role of native soil bacterium in biodegradation of a textile dye. Environ. Sci. Pollut. Res. 2018, 25, 4446–4458. [Google Scholar] [CrossRef]
  7. Behnajady, M.A.; Modirshahla, N.; Ghanbary, F. A kinetic model for the decolorization of C.I. Acid Yellow 23 by Fenton process. J. Hazard. Mater. 2007, 148, 98–102. [Google Scholar] [CrossRef]
  8. Daneshvar, N.; Khataee, A.R.; Amani Ghadim, A.R.; Rasoulifard, M.H. Decolorization of C.I. Acid Yellow 23 solution by electrocoagulation process: Investigation of operational parameters and evaluation of specific electrical energy consumption (SEEC). J. Hazard. Mater. 2007, 148, 566–572. [Google Scholar] [CrossRef]
  9. Wu, L.; Lv, X.; Zhang, Y.; Xin, Q.; Zou, Y.; Li, X. Tartrazine exposure results in histological damage, oxidative stress, immune disorders and gut microbiota dysbiosis in juvenile crucian carp (Carassius carassius). Aquat. Toxicol. 2021, 241, 105998. [Google Scholar] [CrossRef]
  10. US FDA. How Safe Are Color Additives? U.S. Food and Drug Administration. 2021. Available online: https://www.fda.gov/consumers/consumer-updates/how-safe-are-color-additives (accessed on 7 July 2023).
  11. Georgiou, D.; Aivazidis, A.; Hatiras, J.; Gimouhopoulos, K. Treatment of cotton textile wastewater using lime and ferrous sulfate. Water Res. 2003, 37, 2248–2250. [Google Scholar] [CrossRef]
  12. Liang, C.-Z.; Sun, S.-P.; Li, F.-Y.; Ong, Y.-K.; Chung, T.-S. Treatment of highly concentrated wastewater containing multiple synthetic dyes by a combined process of coagulation/flocculation and nanofiltration. J. Membr. Sci. 2014, 469, 306–315. [Google Scholar] [CrossRef]
  13. Zhang, Y.; Wei, S.; Hu, Y.; Sun, S. Membrane technology in wastewater treatment enhanced by functional nanomaterials. J. Clean. Prod. 2018, 197, 339–348. [Google Scholar] [CrossRef]
  14. Hosny, N.M.; Gomaa, I.; Elmahgary, M.G. Adsorption of polluted dyes from water by transition metal oxides: A review. Appl. Surf. Sci. 2023, 15, 100395. [Google Scholar] [CrossRef]
  15. Osagie, C.; Othmani, A.; Ghosh, S.; Malloum, A.; Kashitarash Esfahani, Z.; Ahmadi, S. Dyes adsorption from aqueous media through the nanotechnology: Az review. J. Mater. Res. Technol. 2021, 14, 2195–2218. [Google Scholar] [CrossRef]
  16. Kyzas, G.Z.; Matis, K.A. Nanoadsorbents for pollutants removal: A review. J. Mol. Liq. 2015, 203, 159–168. [Google Scholar] [CrossRef]
  17. Colindres, P.; Yee-Madeira, H.; Reguera, E. Removal of Reactive Black 5 from aqueous solution by ozone for water reuse in textile dyeing processes. Desalination 2010, 258, 154–158. [Google Scholar] [CrossRef]
  18. Bener, S.; Bulca, Ö.; Palas, B.; Tekin, G.; Atalay, S.; Ersöz, G. Electrocoagulation process for the treatment of real textile wastewater: Effect of operative conditions on the organic carbon removal and kinetic study. Process Saf. Environ. Prot. 2019, 129, 47–54. [Google Scholar] [CrossRef]
  19. Modirshahla, N.; Behnajady, M.A.; Ghanbary, F. Decolorization and mineralization of C.I. Acid Yellow 23 by Fenton and photo-Fenton processes. Dyes Pigment. 2007, 73, 305–310. [Google Scholar] [CrossRef]
  20. Zhou, Y.; Lu, J.; Zhou, Y.; Liu, Y. Recent advances for dyes removal using novel adsorbents: A review. Environ. Pollut. 2019, 252, 352–365. [Google Scholar] [CrossRef]
  21. Dhar, A.K.; Himu, H.A.; Bhattacharjee, M.; Mostufa, M.G.; Parvin, F. Insights on applications of bentonite clays for the removal of dyes and heavy metals from wastewater: A review. Environ. Sci. Pollut. Res. 2023, 30, 5440–5474. [Google Scholar] [CrossRef]
  22. Zhu, R.; Chen, Q.; Zhou, Q.; Xi, Y.; Zhu, J.; He, H. Adsorbents based on montmorillonite for contaminant removal from water: A review. Appl. Clay Sci. 2016, 123, 239–258. [Google Scholar] [CrossRef]
  23. Belhouchat, N.; Zaghouane-Boudiaf, H.; Viseras, C. Removal of anionic and cationic dyes from aqueous solution with activated organo-bentonite/sodium alginate encapsulated beads. Appl. Clay Sci. 2017, 135, 9–15. [Google Scholar] [CrossRef]
  24. Yílmaz, N.; Yapar, S. Adsorption properties of tetradecyl- and hexadecyl trimethylammonium bentonites. Appl. Clay Sci. 2004, 27, 223–228. [Google Scholar] [CrossRef]
  25. Kausar, A.; Iqbal, M.; Javed, A.; Aftab, K.; Nazli, Z.-i.-H.; Bhatti, H.N.; Nouren, S. Dyes adsorption using clay and modified clay: A review. J. Mol. Liq. 2018, 256, 395–407. [Google Scholar] [CrossRef]
  26. Luo, Z.; Gao, M.; Ye, Y.; Yang, S. Modification of reduced-charge montmorillonites by a series of Gemini surfactants: Characterization and application in methyl orange removal. Appl. Surf. Sci. 2015, 324, 807–816. [Google Scholar] [CrossRef]
  27. Mullassery, M.D.; Fernandez, N.B.; Anirudhan, T.S. Adsorptive removal of acid red from aqueous solutions by cationic surfactant-modified bentonite clay. Desalin. Water Treat. 2015, 56, 1929–1939. [Google Scholar] [CrossRef]
  28. Brito, D.F.; da Silva Filho, E.C.; Fonseca, M.G.; Jaber, M. Organophilic bentonites obtained by microwave heating as adsorbents for anionic dyes. J. Environ. Chem. Eng. 2018, 6, 7080–7090. [Google Scholar] [CrossRef]
  29. De Farias, M.B.; Silva, M.G.C.; Vieira, M.G.A. Adsorption of bisphenol A from aqueous solution onto organoclay: Experimental design, kinetic, equilibrium and thermodynamic study. Powder Technol. 2022, 395, 695–707. [Google Scholar] [CrossRef]
  30. Maia, G.S.; de Andrade, J.R.; da Silva, M.G.C.; Vieira, M.G.A. Adsorption of diclofenac sodium onto commercial organoclay: Kinetic, equilibrium and thermodynamic study. Powder Technol. 2019, 345, 140–150. [Google Scholar] [CrossRef]
  31. Park, Y.; Ayoko, G.A.; Kurdi, R.; Horváth, E.; Kristóf, J.; Frost, R.L. Adsorption of phenolic compounds by organoclays: Implications for the removal of organic pollutants from aqueous media. J. Colloid Interface Sci. 2013, 406, 196–208. [Google Scholar] [CrossRef]
  32. Elemen, S.; Akçakoca Kumbasar, E.P.; Yapar, S. Modeling the adsorption of textile dye on organoclay using an artificial neural network. Dyes Pigment. 2012, 95, 102–111. [Google Scholar] [CrossRef]
  33. Viseras, C.; Aguzzi, C.; Cerezo, P.; Bedmar, M.C. Biopolymer-clay nanocomposites for controlled drug delivery. Mater. Sci. Technol. 2008, 24, 1020–1026. [Google Scholar] [CrossRef]
  34. Chang, M.Y.; Kao, H.C.; Juang, R.S. Thermal inactivation and reactivity of beta-glucosidase immobilized on chitosan-clay composite. Int. J. Biol. Macromol. 2008, 43, 48–53. [Google Scholar] [CrossRef] [PubMed]
  35. Lezehari, M.; Basly, J.-P.; Baudu, M.; Bouras, O. Alginate encapsulated pillared clays: Removal of a neutral/anionic biocide (pentachlorophenol) and a cationic dye (safranine) from aqueous solutions. Colloids Surf. A Physicochem. Eng. Asp. 2010, 366, 88–94. [Google Scholar] [CrossRef]
  36. Govan, J.R.W.; Fyfe, J.A.M.; Jarman, T.R. Isolation of alginate-producing mutants of Pseudomonas fluorescens, Pseudomonas putida and Pseudomonas mendocina. Microbiology 1981, 125, 217–220. [Google Scholar] [CrossRef] [PubMed]
  37. Edathil, A.A.; Pal, P.; Banat, F. Alginate clay hybrid composite adsorbents for the reclamation of industrial lean methyldiethanolamine solutions. Appl. Clay Sci. 2018, 156, 213–223. [Google Scholar] [CrossRef]
  38. Russo, R.; Malinconico, M.; Santagata, G. Effect of cross-linking with calcium ions on the physical properties of alginate films. Biomacromolecules 2007, 8, 3193–3197. [Google Scholar] [CrossRef] [PubMed]
  39. Djebri, N.; Boutahala, M.; Chelali, N.-E.; Boukhalfa, N.; Zeroual, L. Enhanced removal of cationic dye by calcium alginate/organobentonite beads: Modeling, kinetics, equilibriums, thermodynamic and reusability studies. Int. J. Biol. Macromol. 2016, 92, 1277–1287. [Google Scholar] [CrossRef]
  40. Abou Taleb, M.F.; Hegazy, D.E.; Ismail, S.A. Radiation synthesis, characterization and dye adsorption of alginate–organophilic montmorillonite nanocomposite. Carbohydr. Polym. 2012, 87, 2263–2269. [Google Scholar] [CrossRef]
  41. Oliveira, A.S.; Alcântara, A.C.S.; Pergher, S.B.C. Bionanocomposite systems based on montmorillonite and biopolymers for the controlled release of olanzapine. Mater. Sci. Eng. C 2017, 75, 1250–1258. [Google Scholar] [CrossRef]
  42. Bhat, S.D.; Aminabhavi, T.M. Novel sodium alginate–Na+MMT hybrid composite membranes for pervaporation dehydration of isopropanol, 1,4-dioxane and tetrahydrofuran. Sep. Purif. Technol. 2006, 51, 85–94. [Google Scholar] [CrossRef]
  43. Chen, H.-B.; Shen, P.; Chen, M.-J.; Zhao, H.-B.; Schiraldi, D.A. Highly efficient flame retardant polyurethane foam with alginate/clay aerogel coating. ACS Appl. Mater. Interfaces 2016, 8, 32557–32564. [Google Scholar] [CrossRef]
  44. Oussalah, A.; Boukerroui, A.; Aichour, A.; Djellouli, B. Cationic and anionic dyes removal by low-cost hybrid alginate/natural bentonite composite beads: Adsorption and reusability studies. Int. J. Biol. Macromol. 2019, 124, 854–862. [Google Scholar] [CrossRef] [PubMed]
  45. Oussalah, A.; Boukerroui, A. Removal of cationic dye using alginate–organobentonite composite beads. Euro-Mediterr. J. Environ. Integr. 2020, 5, 55. [Google Scholar] [CrossRef]
  46. Wang, Y.; Wang, W.; Wang, A. Efficient adsorption of methylene blue on an alginate-based nanocomposite hydrogel enhanced by organo-illite/smectite clay. Chem. Eng. J. 2013, 228, 132–139. [Google Scholar] [CrossRef]
  47. Saavedra-Labastida, E.; Díaz-Nava, M.C.; Illescas, J.; Muro, C. Comparison of the removal of an anionic dye from aqueous solutions by adsorption with organically modified clays and their composites. Water Air Soil Pollut. 2019, 230, 88. [Google Scholar] [CrossRef]
  48. Luo, W.; Huang, Q.; Antwi, P.; Guo, B.; Sasaki, K. Synergistic effect of ClO4 and Sr2+ adsorption on alginate-encapsulated organo-montmorillonite beads: Implication for radionuclide immobilization. J. Colloid Interface Sci. 2020, 560, 338–348. [Google Scholar] [CrossRef]
  49. Santoso, S.P.; Kurniawan, A.; Angkawijaya, A.E.; Shuwanto, H.; Warmadewanthi, I.D.A.A.; Hsieh, C.-W.; Hsu, H.-Y.; Soetaredjo, F.E.; Ismadji, S.; Cheng, K.-C. Removal of heavy metals from water by macro-mesoporous calcium alginate–exfoliated clay composite sponges. Chem. Eng. J. 2023, 452, 139261. [Google Scholar] [CrossRef]
  50. Macías-Quiroga, I.F.; Giraldo-Gómez, G.I.; Sanabria-González, N.R. Characterization of colombian clay and its potential use as adsorbent. Sci. World J. 2018, 2018, 5969178. [Google Scholar] [CrossRef]
  51. Shah, L.A.; da Silva Valenzuela, M.d.G.; Ehsan, A.M.; Valenzuela Díaz, F.R.; Khattak, N.S. Characterization of Pakistani purified bentonite suitable for possible pharmaceutical application. Appl. Clay Sci. 2013, 83–84, 50–55. [Google Scholar] [CrossRef]
  52. Otavo-Loaiza, R.A.; Sanabria-González, N.R.; Giraldo-Gómez, G.I. Tartrazine removal from aqueous solution by HDTMA-Br-modified colombian bentonite. Sci. World. J. 2019, 2019, 2042563. [Google Scholar] [CrossRef] [PubMed]
  53. Aichour, A.; Zaghouane-Boudiaf, H.; Mohamed Zuki, F.B.; Kheireddine Aroua, M.; Ibbora, C.V. Low-cost, biodegradable and highly effective adsorbents for batch and column fixed bed adsorption processes of methylene blue. J. Environ. Chem. Eng. 2019, 7, 103409. [Google Scholar] [CrossRef]
  54. Mohammed, N.; Grishkewich, N.; Waeijen, H.A.; Berry, R.M.; Tam, K.C. Continuous flow adsorption of methylene blue by cellulose nanocrystal-alginate hydrogel beads in fixed bed columns. Carbohydr. Polym. 2016, 136, 1194–1202. [Google Scholar] [CrossRef] [PubMed]
  55. Yu, F.; Pan, J.; Li, Y.; Yang, Y.; Zhang, Z.; Nie, J.; Ma, J. Batch and continuous fixed-bed column adsorption of tetracycline by biochar/MOFs derivative covered with κ-carrageenan/calcium alginate hydrogels. J. Environ. Chem. Eng. 2022, 10, 107996. [Google Scholar] [CrossRef]
  56. Kutty, S.R.M.; Almahbashi, N.M.Y.; Nazrin, A.A.M.; Malek, M.A.; Noor, A.; Baloo, L.; Ghaleb, A.A.S. Adsorption kinetics of colour removal from palm oil mill effluent using wastewater sludge carbon in column studies. Heliyon 2019, 5, e02439. [Google Scholar] [CrossRef] [PubMed]
  57. Salehi, E.; Yarali, M.; Ebadi Amooghin, A. Comparison of adsorption properties of activated carbons with different crops residues as precursors for gold cyanide recovery: An Iranian gold industry guide. Iran. J. Chem. Chem. Eng. 2020, 39, 213–229. [Google Scholar] [CrossRef]
  58. Harripersadth, C.; Musonge, P. The dynamic behaviour of a binary adsorbent in a fixed bed column for the removal of Pb2+ ions from contaminated water bodies. Sustainability 2022, 14, 7662. [Google Scholar] [CrossRef]
  59. Han, R.; Wang, Y.; Zou, W.; Wang, Y.; Shi, J. Comparison of linear and nonlinear analysis in estimating the Thomas model parameters for methylene blue adsorption onto natural zeolite in fixed-bed column. J. Hazard. Mater. 2007, 145, 331–335. [Google Scholar] [CrossRef]
  60. Omitola, O.B.; Abonyi, M.N.; Akpomie, K.G.; Dawodu, F.A. Adams-Bohart, Yoon-Nelson, and Thomas modeling of the fix-bed continuous column adsorption of amoxicillin onto silver nanoparticle-maize leaf composite. Appl. Water Sci. 2022, 12, 94. [Google Scholar] [CrossRef]
  61. APHA. Standard Methods for Examination of Water and Wastewater, 22nd ed.; American Public Health Association: Washington, DC, USA, 2012. [Google Scholar]
  62. Abbas, A.; Sallam, A.S.; Usman, A.R.A.; Al-Wabel, M.I. Organoclay-based nanoparticles from montmorillonite and natural clay deposits: Synthesis, characteristics, and application for MTBE removal. Appl. Clay Sci. 2017, 142, 21–29. [Google Scholar] [CrossRef]
  63. Xi, Y.; Ding, Z.; He, H.; Frost, R.L. Structure of organoclays—An X-ray diffraction and thermogravimetric analysis study. J. Colloid Interface Sci. 2004, 277, 116–120. [Google Scholar] [CrossRef] [PubMed]
  64. Sundarrajan, P.; Eswaran, P.; Marimuthu, A.; Subhadra, L.B.; Kannaiyan, P. One pot synthesis and characterization of alginate stabilized semiconductor sanoparticles. Bull. Korean Chem. Soc. 2012, 33, 3218–3224. [Google Scholar] [CrossRef]
  65. Shameem, A.; Devendran, P.; Siva, V.; Venkatesh, K.S.; Manikandan, A.; Bahadur, S.A.; Nallamuthu, N. Dielectric investigation of NaLiS nanoparticles ñoaded on alginate polymer matrix synthesized by single pot microwave irradiation. J. Inorg. Organomet. Polym. Mater. 2018, 28, 671–678. [Google Scholar] [CrossRef]
  66. Da Silva Fernandes, R.; de Moura, M.R.; Glenn, G.M.; Aouada, F.A. Thermal, microstructural, and spectroscopic analysis of Ca2+ alginate/clay nanocomposite hydrogel beads. J. Mol. Liq. 2018, 265, 327–336. [Google Scholar] [CrossRef]
  67. Kragović, M.; Stojmenović, M.; Petrović, J.; Loredo, J.; Pašalić, S.; Nedeljković, A.; Ristović, I. Influence of alginate encapsulation on point of zero charge (pHpzc) and thermodynamic properties of the natural and Fe(III)—Modified zeolite. Procedia Manuf. 2019, 32, 286–293. [Google Scholar] [CrossRef]
  68. Pandi, K.; Viswanathan, N. Synthesis of alginate bioencapsulated nano-hydroxyapatite composite for selective fluoride sorption. Carbohydr. Polym. 2014, 112, 662–667. [Google Scholar] [CrossRef] [PubMed]
  69. Taty-Costodes, V.C.; Fauduet, H.; Porte, C.; Ho, Y.-S. Removal of lead (II) ions from synthetic and real effluents using immobilized Pinus sylvestris sawdust: Adsorption on a fixed-bed column. J. Hazard. Mater. 2005, 123, 135–144. [Google Scholar] [CrossRef] [PubMed]
  70. Noreen, S.; Bhatti, H.N.; Nausheen, S.; Sadaf, S.; Ashfaq, M. Batch and fixed bed adsorption study for the removal of Drimarine Black CL-B dye from aqueous solution using a lignocellulosic waste: A cost affective adsorbent. Ind. Crops Prod. 2013, 50, 568–579. [Google Scholar] [CrossRef]
  71. Hu, Q.; Xie, Y.; Zhang, Z. Modification of breakthrough models in a continuous-flow fixed-bed column: Mathematical characteristics of breakthrough curves and rate profiles. Sep. Purif. Technol. 2020, 238, 116399. [Google Scholar] [CrossRef]
  72. Hu, Q.; Huang, Q.; Yang, D.; Liu, H. Prediction of breakthrough curves in a fixed-bed column based on normalized Gudermannian and error functions. J. Mol. Liq. 2021, 323, 115061. [Google Scholar] [CrossRef]
  73. Shanmugam, D.; Alagappan, M.; Rajan, R.K. Bench-scale packed bed sorption of Cibacron blue F3GA using lucrative algal biomass. Alex. Eng. J. 2016, 55, 2995–3003. [Google Scholar] [CrossRef]
  74. Manja, K.; Majda Sfiligoj, S. Polymer nanocomposite hydrogels for water purification. In Nanocomposites; Farzad, E., Ed.; IntechOpen: Rijeka, Croatia, 2012; Chapter 7; pp. 161–185. [Google Scholar]
  75. Aichour, A.; Zaghouane-Boudiaf, H. Synthesis and characterization of hybrid activated bentonite/alginate composite to improve its effective elimination of dyes stuff from wastewater. Appl. Water Sci. 2020, 10, 146. [Google Scholar] [CrossRef]
  76. Benhouria, A.; Islam, M.A.; Zaghouane-Boudiaf, H.; Boutahala, M.; Hameed, B.H. Calcium alginate–bentonite–activated carbon composite beads as highly effective adsorbent for methylene blue. Chem. Eng. J. 2015, 270, 621–630. [Google Scholar] [CrossRef]
  77. Yoon, Y.H.; Nelson, J.H. Application of gas adsorption kinetics I. A theoretical model for respirator cartridge service life. Am. Ind. Hyg. Assoc. J. 1984, 45, 509–516. [Google Scholar] [CrossRef]
  78. Malkoc, E.; Nuhoglu, Y.; Dundar, M. Adsorption of chromium(VI) on pomace—An olive oil industry waste: Batch and column studies. J. Hazard. Mater. 2006, 138, 142–151. [Google Scholar] [CrossRef] [PubMed]
  79. Mitra, T.; Singha, B.; Bar, N.; Das, S.K. Removal of Pb(II) ions from aqueous solution using water hyacinth root by fixed-bed column and ANN modeling. J. Hazard. Mater. 2014, 273, 94–103. [Google Scholar] [CrossRef]
  80. Padmesh, T.V.N.; Vijayaraghavan, K.; Sekaran, G.; Velan, M. Biosorption of acid blue 15 using fresh water macroalga Azolla filiculoides: Batch and column studies. Dyes Pigment. 2006, 71, 77–82. [Google Scholar] [CrossRef]
  81. Saadi, Z.; Saadi, R.; Fazaeli, R. Fixed-bed adsorption dynamics of Pb (II) adsorption from aqueous solution using nanostructured γ-alumina. J. Nanostruct. Chem. 2013, 3, 48. [Google Scholar] [CrossRef]
  82. Aksu, Z.; Gönen, F. Biosorption of phenol by immobilized activated sludge in a continuous packed bed: Prediction of breakthrough curves. Process Biochem. 2004, 39, 599–613. [Google Scholar] [CrossRef]
  83. Özcan, A.; Ömeroğlu, Ç.; Erdoğan, Y.; Özcan, A.S. Modification of bentonite with a cationic surfactant: An adsorption study of textile dye Reactive Blue 19. J. Hazard. Mater. 2007, 140, 173–179. [Google Scholar] [CrossRef]
  84. Chatterjee, S.; Lee, D.S.; Lee, M.W.; Woo, S.H. Congo red adsorption from aqueous solutions by using chitosan hydrogel beads impregnated with nonionic or anionic surfactant. Bioresour. Technol. 2009, 100, 3862–3868. [Google Scholar] [CrossRef] [PubMed]
  85. Gkika, D.A.; Mitropoulos, A.C.; Kyzas, G.Z. Why reuse spent adsorbents? The latest challenges and limitations. Sci. Total Environ. 2022, 822, 153612. [Google Scholar] [CrossRef] [PubMed]
  86. Parimelazhagan, V.; Jeppu, G.; Rampal, N. Continuous fixed-bed column studies on Congo red dye adsorption-desorption using free and immobilized Nelumbo nucifera leaf adsorbent. Polymers 2022, 14, 54. [Google Scholar]
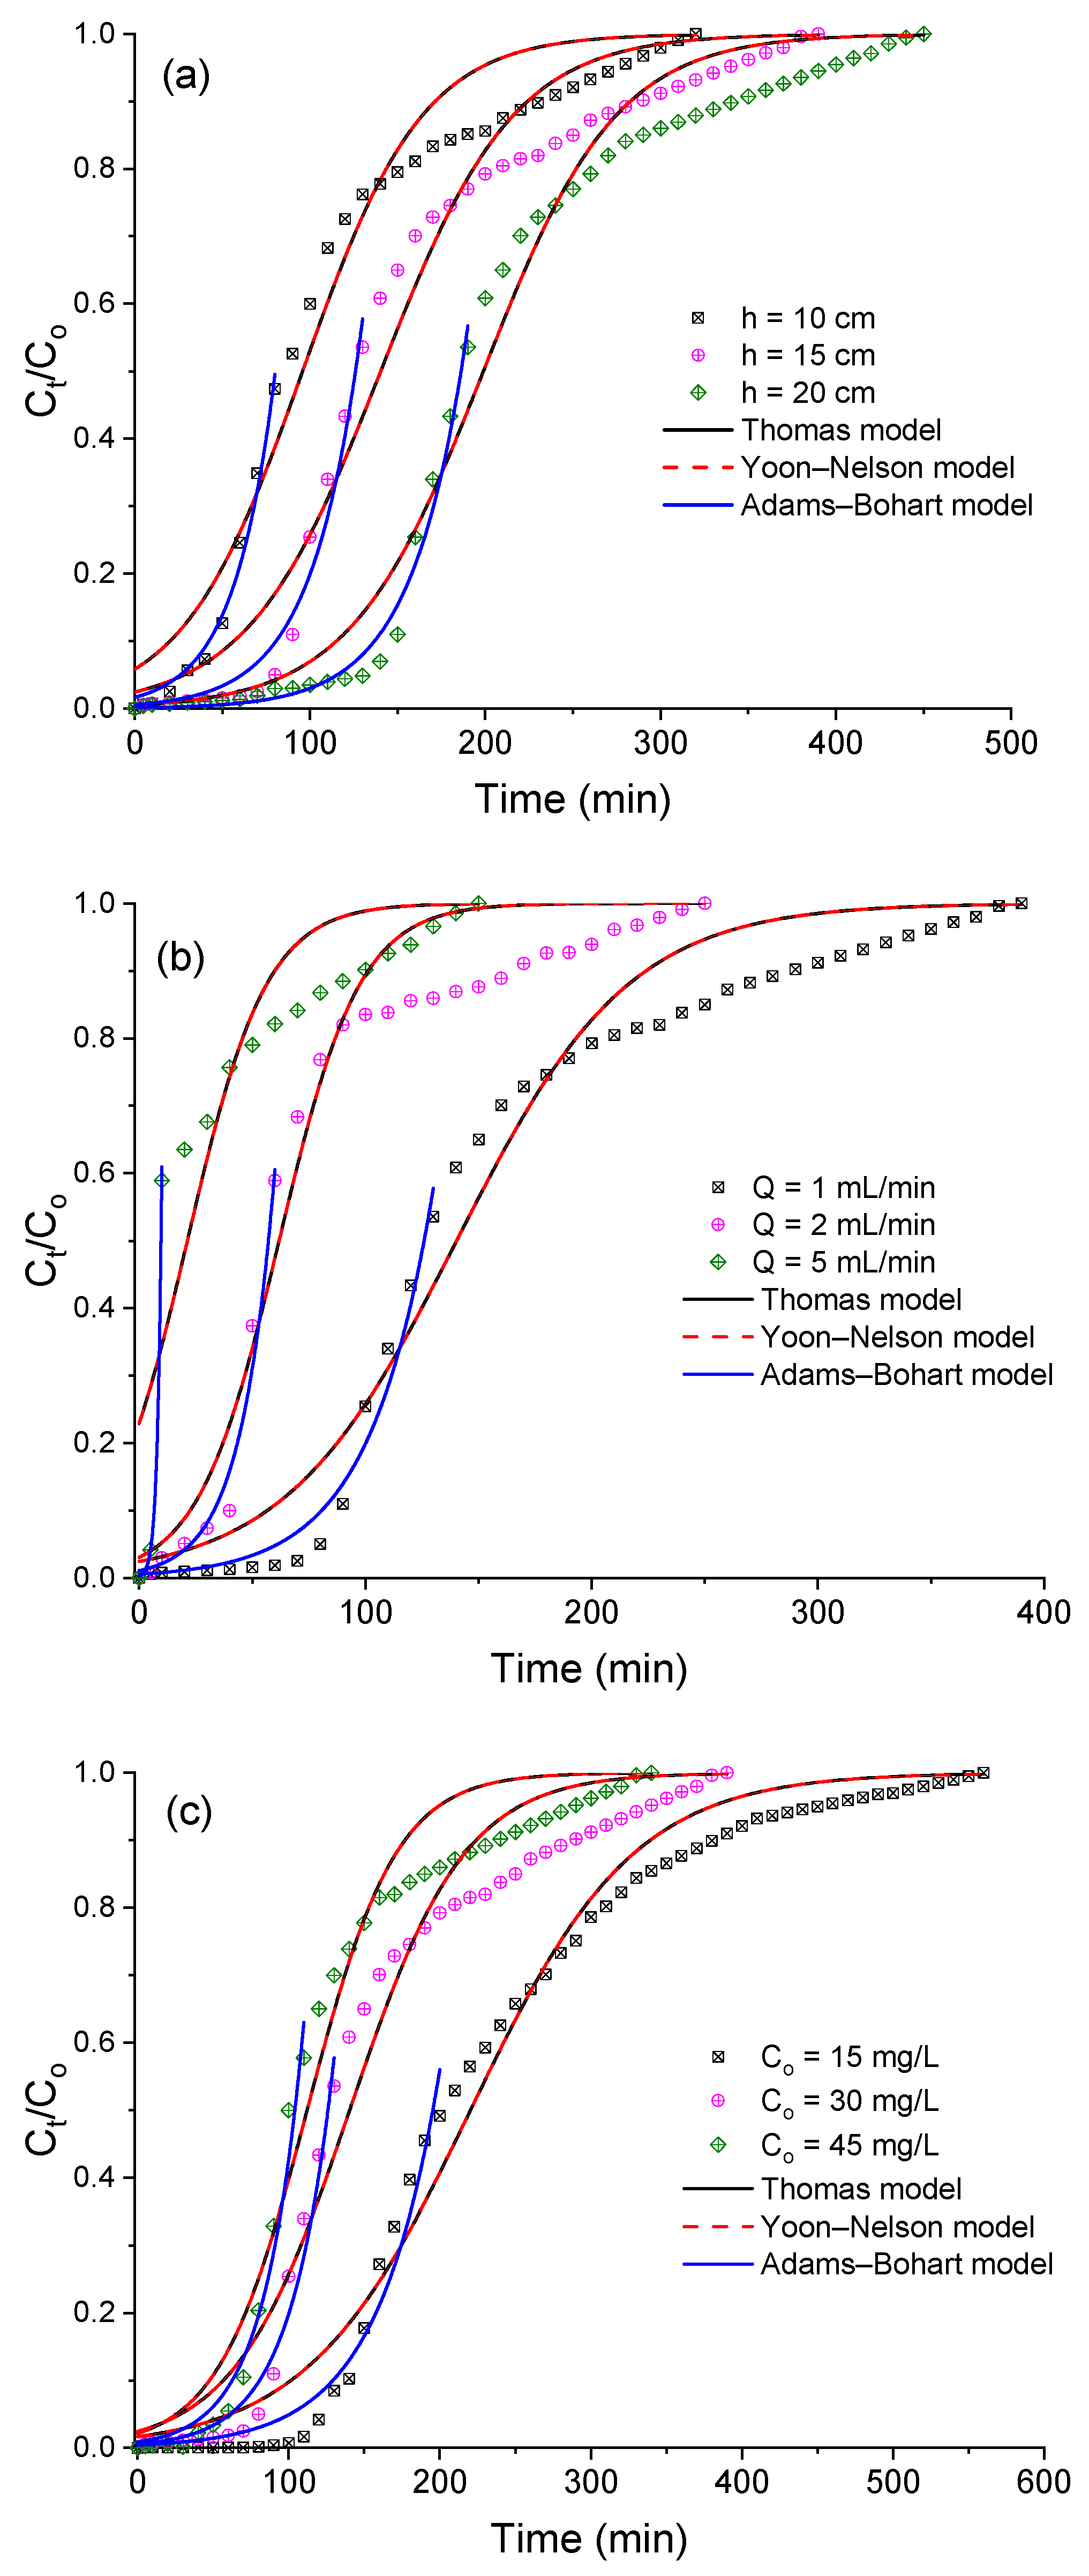
Figure 1. Diagram for preparation of the organobentonite/alginate hydrogel beads.
Jcs 07 00362 g001
Figure 2. Schematic diagram of the fixed-bed adsorption column tests when using hydrogel beads as the adsorbent.
Jcs 07 00362 g002
Figure 3. XRD patterns of sodium bentonite, organobentonite, sodium alginate, and the organobentonite/alginate hydrogel.
Jcs 07 00362 g003
Figure 4. Size distribution (diameter) of the organobentonite/alginate hydrogel beads.
Jcs 07 00362 g004
Figure 5. Determination of the zero-point charge of the organobentonite/alginate hydrogel beads.
Jcs 07 00362 g005
Figure 6. (a) Effect of the organoclay concentration in hydrogel beads on AY-23 adsorption at pH = 6.0 and (b) the effect of pH on AY-23 adsorption when using OBent(2%)/Alg hydrogel beads. Conditions: [dye] = 30 mg/L, volume = 50 mL, organobentonite mass in hydrogel beads = 38.04 ± 0.4 mg, and stirring speed = 250 rpm.
Jcs 07 00362 g006
Figure 7. Breakthrough curves of the AY-23 adsorption on OBent(2%)/Alg at different pHs. Conditions: h = 15 cm, Q = 1.0 mL/min, C 0 = 30 mg/L.
Jcs 07 00362 g007
Figure 8. Breakthrough curves of the AY-23 adsorption on OBent(2%)/Alg at different conditions. (a) Effect of bed height, C 0 = 30 mg/L, pH = 4.5, and Q = 1.0 mL/min; (b) effect of flow rate, C 0 = 30 mg/L, pH = 4.5, and h = 15 cm; and (c) effect of initial dye concentration, pH = 4.5, Q = 1.0 mL/min, and h = 15 cm. Nonlinear fit of the experimental fixed-bed adsorption data to the Thomas (____), Yoon–Nelson (---), and Adams–Bohart (---) models.
Jcs 07 00362 g008
Figure 9. Schematic illustration of the adsorption mechanism of anionic dyes on the organoclay/alginate hydrogel.
Jcs 07 00362 g009
Figure 10. Batch mode desorption of the AY-23 with different solvents.
Jcs 07 00362 g010
Figure 11. Breakthrough curve of the AY-23 adsorption on OBent(2%)/Alg. Adsorbent regeneration with 0.5 M of NaOH and two adsorption cycles (reuse). Conditions: h = 15 cm, Q = 1.0 mL/min, C 0 = 30 mg/L, and pH = 4.5.
Jcs 07 00362 g011
Figure 12. Visible absorption spectra of AY-23 dye solution and a wastewater sample.
Jcs 07 00362 g012
Figure 13. Breakthrough curve for the adsorption of AY-23 present in the wastewater sample using OBent(2%)/Alg hydrogel beads. Conditions: h = 15 cm, Q = 1.0 mL/min, and pH = 4.5.
Jcs 07 00362 g013
Table 1. Models for the analysis of the breakthrough curves.
Model–EquationParametersRef.
Thomas
C t C 0 = 1 1 + e x p [ ( K T h q 0 m Q ) K T h C 0 t ]
Equation (10)
C 0 = influent dye concentration, mg/L
C t = effluent dye concentration (mg/L) at time t
t = time, min
K T h = Thomas rate constant, mL/mg min
q 0   = adsorption capacity, mg/g
Q = volumetric flow rate, mL/min
m   = adsorbent amount, g
[59]
Yoon–Nelson
C t C 0 = 1 1 + e x p ( K Y N ( τ t ) )
Equation (11)
K Y N = Yoon–Nelson rate constant, 1/min
τ = time required for C t / C o = 0.5, min
[60]
Adams–Bohart
C t C 0 = e x p ( K A B C 0 t K A B N 0 h v )
Equation (12)
K A B = Adams–Bohart rate constant, L/mg min
N 0 = adsorption capacity per unit volume of the bed, mg/L
h = height of the bed, cm
v = linear flow velocity, cm/min
[60]
Table 2. Average mass, water content, and swelling capacity of the organobentonite/alginate hydrogel beads.
Parameter aOBent(2%)/AlgOBent(4%)/AlgOBent(6%)/AlgOBent(10%)/Alg
Mass, mg38.8 ± 0.442.7 ± 0.448.3 ± 0.363.9 ± 0.5
Water content, %94.3 ± 0.593.6 ± 0.592.1 ± 0.691.8 ± 0.9
Swelling capacity, %133.3 ± 0.7133.3 ± 0.6133.3 ± 0.8133.3 ± 0.5
a For these analyzes, 100 hydrogel beads with a diameter between 3.1–3.7 mm were used.
Table 3. Adsorption parameters of the AY-23 on OBent(2%)/Alg hydrogel beads in a fixed-bed.
h
cm
m
g
Q
mL/min
C o
mg/L
t b
min
t e
min
V t
mL
t t o t a l
min
q t o t a l
mg
q m
mg/g
W t o t a l
mg
C e
mg/L
R
%
106.5513045.030274.843274.8433203.2800.4169.62522.99434.168
1510.1013088.333337.909337.9093904.6480.46011.73720.87139.724
2013.65130147.500395.004395.0044506.3430.48513.50118.12046.981
1510.1013088.333337.909337.9093904.6480.46011.70120.87139.724
1510.1023040.000204.934409.8682503.8640.38315.00327.17125.758
1510.105305.512125.699628.4941500.5300.05322.50534.9672.355
1510.10115138.483449.401449.4015603.4830.3458.40410.94041.469
1510.1013088.333337.909337.9093904.6480.46011.70720.87139.724
1510.1014569.057287.910287.9103405.6220.55715.30633.61536.745
Table 4. Parameters of the Thomas model under different conditions.
h
cm
Q
mL/min
C 0
mg/mL
K Th
mL/mg min
q 0
mg/g
R 2 A d j .   R 2 χ 2
1010.0300.9684 ± 0.07580.3640 ± 0.01140.96550.96650.0044
1510.0300.8748 ± 0.06710.4169 ± 0.00980.96760.96850.0047
2010.0300.8738 ± 0.05400.4558 ± 0.00610.98110.98150.0031
1510.0300.8748 ± 0.06710.4169 ± 0.00980.96760.96850.0047
1520.0301.8612 ± 0.230003675 ± 0.01500.95580.95750.0059
1550.0301.8962 ± 0.46030.3163 ± 0.06160.80550.81770.0171
1510.0151.2320 ± 0.05670.3273 ± 0.00420.98430.98460.0024
1510.0300.8748 ± 0.06710.4169 ± 0.00980.96760.96850.0047
1510.0450.7548 ± 0.06710.4998 ± 0.01210.97170.97250.0042
Table 7. Parameters of the Adams–Bohart model under different conditions.
h
cm
v
cm/min
Q
mL/min
C 0
mg/mL
K A B
mL/mg min
N 0
mg/L
R 2 A d j .   R 2 χ 2
100.88410.0300.0014 ± 9.6 × 10−5256.0382 ± 4.81540.98510.98334.58 × 10−4
150.88410.0300.0012 ± 1.3 × 10−4257.1605 ± 4.43980.96610.96351.17 × 10−3
200.88410.0300.0011 ± 6.4 × 10−5275.0142 ± 2.54320.98510.97685.57 × 10−4
150.88410.0300.0012 ± 1.0 × 10−4257.1605 ± 4.43980.96610.96351.17 × 10−3
151.76820.0300.0022 ± 2.5 × 10−4238.7197 ± 5.25330.97430.97011.36 × 10−3
154.42150.0300.0179 ± 4.6 × 10−496.5801 ± 0.23160.99990.99998.19 × 10−6
150.88410.0150.0016 ± 1.3 × 10−4197.8971 ± 3.16160.95760.95551.23 × 10−3
150.88410.0300.0012 ± 1.3 × 10−4257.1605 ± 4.43980.96610.96351.17 × 10−3
150.88410.0450.0086 ± 7.4 × 10−5323.3084 ± 5.48460.97160.96901.26 × 10−3
Table 8. Adsorption parameters of the AY-23 on the OBent(2%)/Alg hydrogel beads. The initial adsorption and adsorbent reuses.
Test t b
min
t e
min
V t o t a l
mL
t t o t a l
min
q t o t a l
mg
q m
mg/g
W t o t a l
mg
C e
mg/L
R
%
Initial adsorption88.333337.909337.9093904.6480.46011.73720.87139.724
Reuse–Cycle 141.402252.871252.8733103.0460.3029.30024.73431.750
Reuse–Cycle 238.588128.599128.5992001.5390.1526.00134.69125.645
Table 9. Physicochemical characteristics of real wastewater matrix.
ParameterStandard Method
(SM)
Wastewater Sample
(before Adsorption)
Wastewater Sample (after Adsorption)
pH4500-H+ B7.4 ± 0.17.5 ± 0.2
Conductivity (μS/cm)2510-B510 ± 10303 ± 8
COD (mg O2/L)5220-D825 ± 35527 ± 14
BOD5 (mg O2/L)5210-B348 ± 21269 ± 11
TOC, mg C/L5310-B318 ± 12235 ± 8
Acid Yellow 23, mg/L 11.37 ± 0.03<0.13 *
* This concentration is reached at less than 130 min of continuous adsorption.
Table 10. Adsorption parameters of AY-23 present in the wastewater sample using OBent(2%)/Alg hydrogel beads.
Test t b
min
t e
min
V t o t a l
mL
q t o t a l
mg
q m
mg/g
W t o t a l
mg
C e
mg/L
R
%
Initial170.498503.768503.7683.4510.3427.6188.27245.301
Duplicate169.337498.462498.4623.3830.3357.5958.49944.543
Triplicate169.139496.838496.8383.3550.3327.5838.50944.244
Disclaimer/Publisher’s Note: The statements, opinions and data contained in all publications are solely those of the individual author(s) and contributor(s) and not of MDPI and/or the editor(s). MDPI and/or the editor(s) disclaim responsibility for any injury to people or property resulting from any ideas, methods, instructions or products referred to in the content.

