Article

Ternary Composite of Polymer, Fullerene and Fluorinated Multi-Walled Carbon Nanotubes as the Active Layer of Organic Solar Cells

by
Elena S. Kobeleva
1,
Mikhail N. Uvarov
1,
Natalia V. Kravets
1,2,
Aina V. Kulikova
1,2,
Vladimir A. Zinovyev
3,
Olga A. Gurova
4,
Vitalii I. Sysoev
4,
Anastasiya M. Kondranova
4,
Maxim S. Kazantsev
5,
Konstantin M. Degtyarenko
6,
Anna G. Matveeva
1,7 and
Leonid V. Kulik
1,*
1
V. V. Voevodsky Institute of Chemical Kinetics and Combustion of the Siberian Branch of the Russian Academy of Sciences, 630090 Novosibirsk, Russia
2
Novosibirsk State University, 630090 Novosibirsk, Russia
3
A. V. Rzhanov Institute of Semiconductor Physics of the Siberian Branch of the Russian Academy of Sciences, 630090 Novosibirsk, Russia
4
A. V. Nikolaev Institute of Inorganic Chemistry of the Siberian Branch of the Russian Academy of Sciences, 630090 Novosibirsk, Russia
5
N. N. Vorozhtsov Novosibirsk Institute of Organic Chemistry of the Siberian Branch of the Russian Academy of Sciences, 630090 Novosibirsk, Russia
6
Siberian Physico-Technical Institute, Tomsk State University, 634050 Tomsk, Russia
7
Institute of Solid State Chemistry and Mechanochemistry of the Siberian Branch of the Russian Academy of Sciences, 630090 Novosibirsk, Russia
*
Author to whom correspondence should be addressed.
J. Compos. Sci. 2024, 8(1), 3; https://doi.org/10.3390/jcs8010003
Submission received: 20 November 2023 / Accepted: 15 December 2023 / Published: 19 December 2023
(This article belongs to the Section Carbon Composites)

Abstract

:
Fluorinated multi-walled carbon nanotubes are implemented as the third component of the active layer of organic solar cells. The addition of approximately 1% weight fraction of these nanotubes into PCDTBT/PC60BM polymer/fullerene active layer leads to a noticeable increase in the main photovoltaic parameters of the solar cells, including their stability. Presumably, the origins of this influence are optimizing the donor/acceptor composite morphology and reinforcing its structure with fluorinated multi-walled carbon nanotubes. This hypothesis is supported by the dramatic influence of the fluorinated multi-walled carbon nanotube additive on the kinetics of the decay of the EPR signal of light-induced charges in the PCDTBT/PC60BM composite.

1. Introduction

Recent advances of organic photovoltaics have brought the power conversion efficiency (PCE) of organic solar cells beyond 19% [1,2,3,4], which is already close to that of wide-spread silicon solar cells. However, the stability of organic solar cells is still incomparable with that of their inorganic counterparts. Thus, the degradation of solar cells, in particular of their active layer, becomes the major problem hampering the development of organic photovoltaics.
Typically, the active layer of organic solar cells is a composite of interpenetrating donor and acceptor materials (bulk heterojunction or BHJ), with the domain size of each material in the order of several tens of nanometers [5,6,7]. Several light-induced degradation processes of materials which occur in the functional layers of organic solar cells (OSCs) have been described in reviews [8,9,10]. The polymer/fullerene-based OSCs have been extensively studied during the last decade [11,12]. In particular, the PCDTBT:PCBM composite became one of the benchmark active layers of OSCs, with good operational stability and a high PCE of 7.5% [13]. In the literature, several mechanisms of photodegradation have been revealed for PCDTBT:PCBM-based OSCs. The most significant of the processes are as follows: (i) photooxidation of both PCDTBT [14] and PCBM [15], (ii) cross-linking reactions of PCDTBT with formation of stable radicals [16], (iii) photodimerization of PCBM [17], and (iv) instability of nanomorphology of polymer/fullerene composite [6]. To inhibit these degradation pathways and improve OSCs’ stability, a third component could be introduced into donor/acceptor composite [10,18,19]. Carbon nanotubes (CNTs) also have been widely applied as a third component in ternary OSCs [20,21,22], in which semiconducting CNTs may serve both as electron donor and acceptor material [23] and also as an “armature” to fix the nanomorphology of the active layer [24]. In addition, CNTs can be used in thermoelectric devices [25]. In particular, functionalization of multi-walled CNTs (MWCNTs) via nitrogen doping can switch their semiconducting behavior from p-type to n-type in the composite with thermoelectric polymer [26].
The presence of metallic CNTs in the unsorted mixture of carbon nanotubes becomes a problematic feature when CNTs are used as a component of the active layer of OSCs. This is because metallic CNTs make shortcuts between the cathode and the anode of the OSC, thus reducing the main photovoltaic parameters: open circuit voltage VOC, short circuit current JSC, fill factor FF, and PCE. Thus, metallic CNTs inside the active layer of OSC should be avoided. For single-walled CNTs (SWCNTs), there are two main strategies for eliminating metallic CNTs. The first strategy is physical separation of metallic and semiconducting CNTs via a suitable technique, typically centrifugation [22]. The second strategy involves chemical functionalization of CNTs, which converts metallic CNTs into semiconducting ones [27]. Fluorination is a straightforward and relatively simple method of covalent functionalization of CNTs [28]. For multi-walled CNTs, physical separation of metallic and semiconducting CNTs is impossible because SWCNTs of both types usually coexist inside one MWCNT. For this reason, MWCNTs are rarely used as a component of the active layer of OSCs.
In the present study, we tested the possibility of fluorination of MWCNTs and the influence of admixture of fluorinated MWCNTs into the active layer of OSCs on their performance. We found a moderate increase in the main photovoltaic parameters upon introducing F-MWCNTs as a third component into the classical polymer/fullerene composite PCDTBT/PCBM. This also led to increased operational stability of OSCs. In contrast, admixture of untreated (non-fluorinated) MWCNTs into the same active layer resulted in poorer photovoltaic devices. Presumably, the origins of the positive action on the photovoltaic performance of fluorinated MWCNTs are in the optimization of the donor/acceptor composite morphology and reinforcement of its structure. Since direct characterization of 3D morphology was not possible for the composites under study, the light-induced EPR technique was used to obtain indirect support for the above suggestion.

2. Materials and Methods

2.1. Preparation of Fluorinated Nanotubes and Their Suspensions

Arrays of vertically aligned MWCNTs were obtained in an automated flow-through gas-phase chemical CVD reactor, with thermal decomposition of reaction mixture vapors on the surface of silicon substrates. A 2% ferrocene solution in a toluene–acetonitrile mixture of 50/50 wt.% was used as a precursor. The nanotubes prepared via this method [29] are referred to as MW0.
Further, the obtained arrays of nanotubes were ground in a planetary mill for 30 s while cooled with liquid nitrogen (77 K). Then, they were subjected to annealing at 300 °C in air for 1 h, to mild fluorination in BrF3 vapors for 1 day, and to drying in nitrogen flow for another 1 day. Hereafter, these nanotubes are referred to as F-MWCNTs.
The suspensions were prepared by adding 0.3 mg of nanotubes (F-MWCNTs) into 1.5 mL of chlorobenzene. The solution was subjected to ultrasonic treatment for about 30 min. Then, it was stirred with a Bio vortex V1 BIOSAN and treated with ultrasound for another 10 min. Polymer PCDTBT (Ossila) and fullerene acceptor PC60BM (Ossila) were added to the resulting suspension; the total concentration was 20 mg/mL and the mass ratio was 1:1. Then, a solution of polymer and fullerene without nanotubes was prepared with a total concentration of 20 mg/mL and a mass ratio of 1:1. After that, the solutions were mixed to obtain solutions with a concentration of 20 mg/mL PCDTBT/PC60BM and F-MWCNTs fractions of 2%, 1%, 0.5%, and 0.25% relative to the polymer mass. Solutions were heated to 50 °C. Then, all solutions were stirred using the Bio vortex V1 BIOSAN. Before deposition, prepared solutions were placed in an ultrasonic bath for a few minutes and stirred using Bio vortex V1 BIOSAN. Also, to compare the F-MWCNTs and untreated MWCNTs, a solution of PCDTBT/PC60BM/MW0 with a MW0 fraction of 1% was made using the same technique.

2.2. Scanning Electron Microscopy

SEM images of the arrays of fluorinated nanotubes were obtained using a SU1000 FlexSEM II scanning electron microscope (Hitachi, Tokyo, Japan). Nanotube arrays were appropriately fixed on a specimen stub with conductive tape. Sample observation was performed using a secondary electron detector at an electron beam energy of 15 keV.

2.3. UV/Vis Absorption Spectra

The optical absorption density spectra of the PCDTBT/PC60BM/F-MWCNTs thin film samples with various ratios of F-MWCNTs to polymer were recorded with an Ocean Optics USB-650 spectrophotometer.

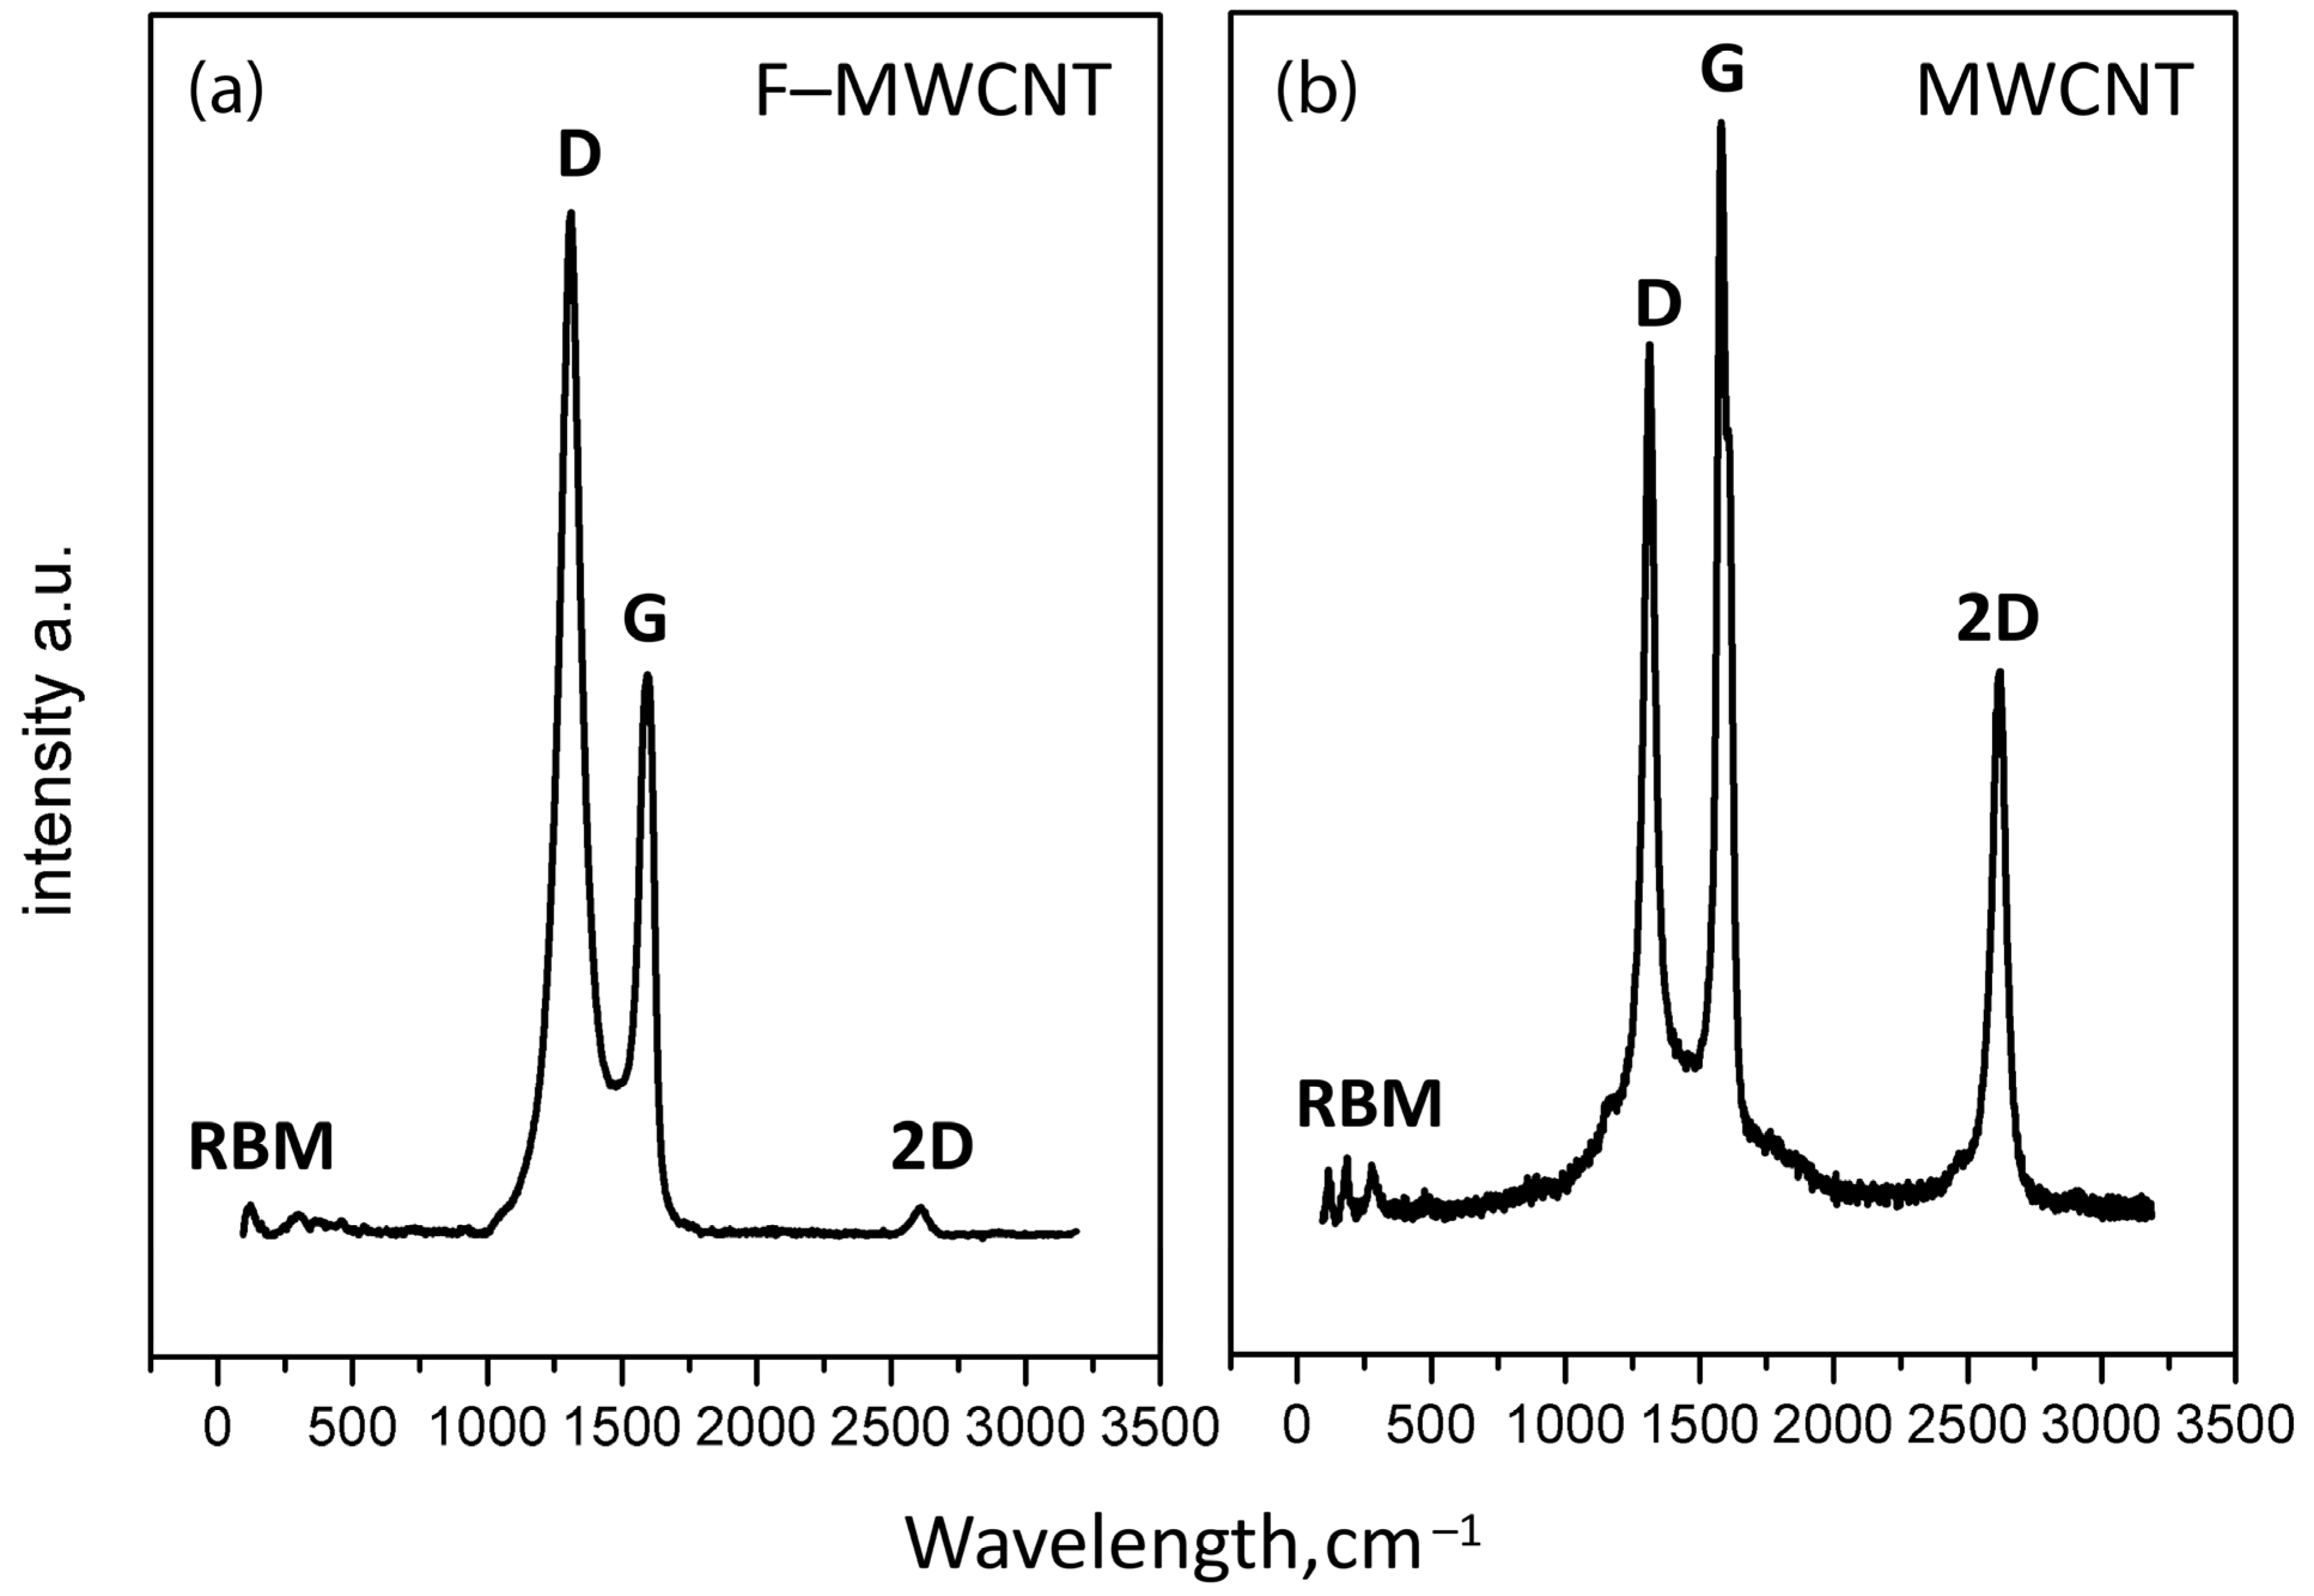
2.4. Raman Spectroscopy

Raman spectra were measured using a Bruker Senterra Dispersive Raman Microscope, with 785 nm excitation, dispersion through a 1200 lines/mm grating, and detection with an Andor CCD camera. The spectrometer was operated using a slit-type aperture of 50 × 1000 µm, with a spectral resolution of approximately 3 cm−1. A modified Olympus BX51 microscope with a long working distance 50× objective was used. The output powers used were 10 mW and 100 mW for samples MWCNTs and F-MWCNTs, respectively. Spectra were the result of five scans with 10 s of integration time.

2.5. Device Fabrication and Characterization

Photovoltaic cells of conventional architectures ITO/PEDOT:PSS/Active layer/LiF/Al or ITO/PEDOT:PSS/Active layer/Au, where ITO is indium tin oxide (anode), PEDOT:PSS is a hole-conducting layer, LiF is an electron-transport layer, and Al (or Au) is a cathode, were manufactured using the following procedure.
The ITO substrates (Ossila) were cleaned mechanically in a detergent solution, followed by ultrasound treatment in distilled water, acetone, and ethanol. Then, the substrates were dried, under pure airflow, and cleaned with Oxygen Plasma setup Atto (Diner, Germany) under pressure of 0.3 torr. The PEDOT:PSS (Ossila) was filtered through a hydrophilic filter made of polytetrafluoroethylene (PTFE) with a pore size of 0.45 μm and deposited via centrifugation onto pre-cleaned ITO substrates at 5000 rpm for 30 s, followed by annealing at 140 °C for 10 min at 100 torr.
The active layer was deposited from solutions via centrifugation at 1000 rpm for 120 s. After the deposition of the active layer, the cell was annealed at 90 °C for 10 min at 100 torr. The electrically conductive layer LiF and the Al or Au cathode were deposited in a high vacuum (10−3 Pa) onto the composite via thermal evaporation (with a deposition rate of 20 Å s−1).
Current-voltage was measured with a Ossila Solar Cell I–V Test System. The light-emitting diode CREE XM-L U3 with a color temperature of 5000 K was used as the light source. Its illumination intensity 35 mW/cm2 was measured with Solo2 Gentec Electro-Optics Inc. (Quebec, QC, Canada).The area of the electrode was 0.045 cm2. No mask was used for illuminating the cell during measurement.

2.6. Photo-CELIV Measurements

The photo-CELIV technique was applied to determine the characteristic values of light-induced charge carrier mobility μ within the active layers of OPV devices. The theory developed by Juska et al. [30] describes a feature of transient current of an OPV device with the application of a linear increase in voltage. The main idea of this method is that the maximum of the current, which is observed at the delay value tmax, is related to the thickness of the active layer d:
t m a x = d 2 3 μ A ,
where A is the voltage increase rate, A = d V d t .
The photo-CELIV experiments were performed using the conventional OPV devices with PCDTBT/PC60BM active layer manufactured as described above, with optional addition of 2, 1, 0.5, and 0.25 wt.% of F-MWCNTs. The photoinduced charges within their active layers were generated with light flashes of 532 nm with a duration of 10 ns (second harmonics of Nd-YAG laser Surelite I-10). After the laser flash, the voltage was increased with a rate of 0.15 V/μs, and the voltage offset was set within the range between 0.15 V and 0.2 V to observe the most pronounced feature of the photocurrent. The thickness of the active layer (about 100 nm) was determined using AFM profilometry.

2.7. Cyclic Voltammetry

Cyclic voltammetry (CVA) measurement was performed in a dry CH2Cl2 solution with a computer-controlled P-8nano potentiostat/galvanostat (Elins, Russia) in combination with a three-electrode cell (Gamry), and 0.1 M tetrabyty-lammonium hexafluorophosphate was used as supporting electrolyte. The Pt, Pt wire, and Ag/AgCl were used as working, counter, and reference electrodes, respectively. The reference electrode was calibrated by measuring the redox potentials of ferrocene. F-MWCNTs were dispersed in toluene in the ultrasound bath and then drop-casted from this suspension onto the working electrode. The LUMO energy levels were estimated using the reduction potentials measured vs. Fc/Fc+ in the cyclic voltammograms according to the work [31].

2.8. Atomic Force Microscopy

The surface morphology of the thin composite films was observed with atomic-force microscopy, and the data microscope was Integra Aura, NT-MDT (Moscow, Russia). To determine the thicknesses of the PCDTBT:PC60BM composite film, a scratch was made with a sharp stainless-steel needle and the surface profile around the scratch was measured.

2.9. Degradation of OPV Devices

To study the photodegradation effects, the devices were continuously illuminated using a 50 mW/cm2 OSRAM LED visible light source, measured with Solo2 Genetic Electro-Optics Inc. with a PH-100SiUV detector. The temperature was approximately 30 °C. The relative humidity was approximately 25%. The illumination was performed simultaneously for a series of samples. The samples were placed on a disk, rotating at a frequency of 5 rpm for equal light power absorption. The cells were exposed continuously to 1 sun illumination for 1248 h at open-circuit.

2.10. Light-Induced EPR

To prepare PCDTBT/PC60BM and PCDTBT/PC60BM/F-MWCNT samples for EPR, the same chlorobenzene solutions were used that were used previously for solar cell fabrication. The blends were spin-coated on glass plate of 0.25 mm thickness with 1000 rpm, which resulted in composite films with thicknesses of about 100 nm. These glass plates were cut into pieces and placed into EPR tubes. Before EPR measurement, the samples were annealed at 100 °C for 10 min in vacuum.
Continuous wave (CW) EPR and ESE measurements were carried out on an X-band ELEXSYS ESP-580E EPR spectrometer equipped with an ER 4118 X-MD-5 dielectric cavity inside an Oxford Instruments CF 935 cryostat. Temperature was kept at 85 K with cold nitrogen gas flow. To measure the light-induced EPR (LEPR) signal, the samples inside the EPR resonator were irradiated for 30 s with a diode laser with a wavelength 630 nm, output power 30 mW, to generate paramagnetic species in the composite. Then, the light was switched off and the kinetics of EPR signal decay at a constant magnetic field was measured. Lowering the temperature was needed to tune the characteristic time of recombination of the light-induced charges in the composites under study, in order to move it to the range accessible to the LEPR technique (from seconds to minutes).

3. Results and Discussion

3.1. Characterization of Fluorinated MWCNTs

The results of the element analysis of F-MWCNTs are presented in Table 1. As can be seen, they are mainly composed of carbon and fluorine with a high atomic F/C ratio of 0.51. Traces of bromine probably originated from a residual amount of fluorinating agent BrF3 absorbed by F-MWCNTs.
According to the results of CVA, F-MWCNTs demonstrated a wide irreversible peak of reduction with E1/2 of −0.65 V (Figure 1). The LUMO energy, evaluated from the potential of the onset of reduction, was approximately −4.32 eV. This value is close to the LUMO energy level of fluorinated SWCNT [28].
From the SEM image of MW0 (Figure 2a) the characteristic range of the nanotube diameter 20–80 nm in the arrays can be deduced. Their length, about 100 μm, is determined to the height of the arrays [29]. Grinding of the nanotubes results in their shortening to about 1 μm and formation of additional shapeless pieces, presumably consisting of amorphous carbon (Figure 2b).
Raman spectrum of the MW0 arrays (Figure 3b) showed D, G, and 2D bands and radial breathing mode (RBM). The G band corresponds to the vibration of defect-free graphene-like nanotube structures. Relatively low amplitude of D band compared to G indicates low number of structural defects. During the fluorination of the MWCNTs, the mode D band grows (Figure 3a) due to an increase in the number of defects. The appearance of RBM in Raman spectra at several hundred cm−1 indicates the presence on SWCNT or few-walled carbon nanotubes [32] in both MW0 and F-MWCNT.

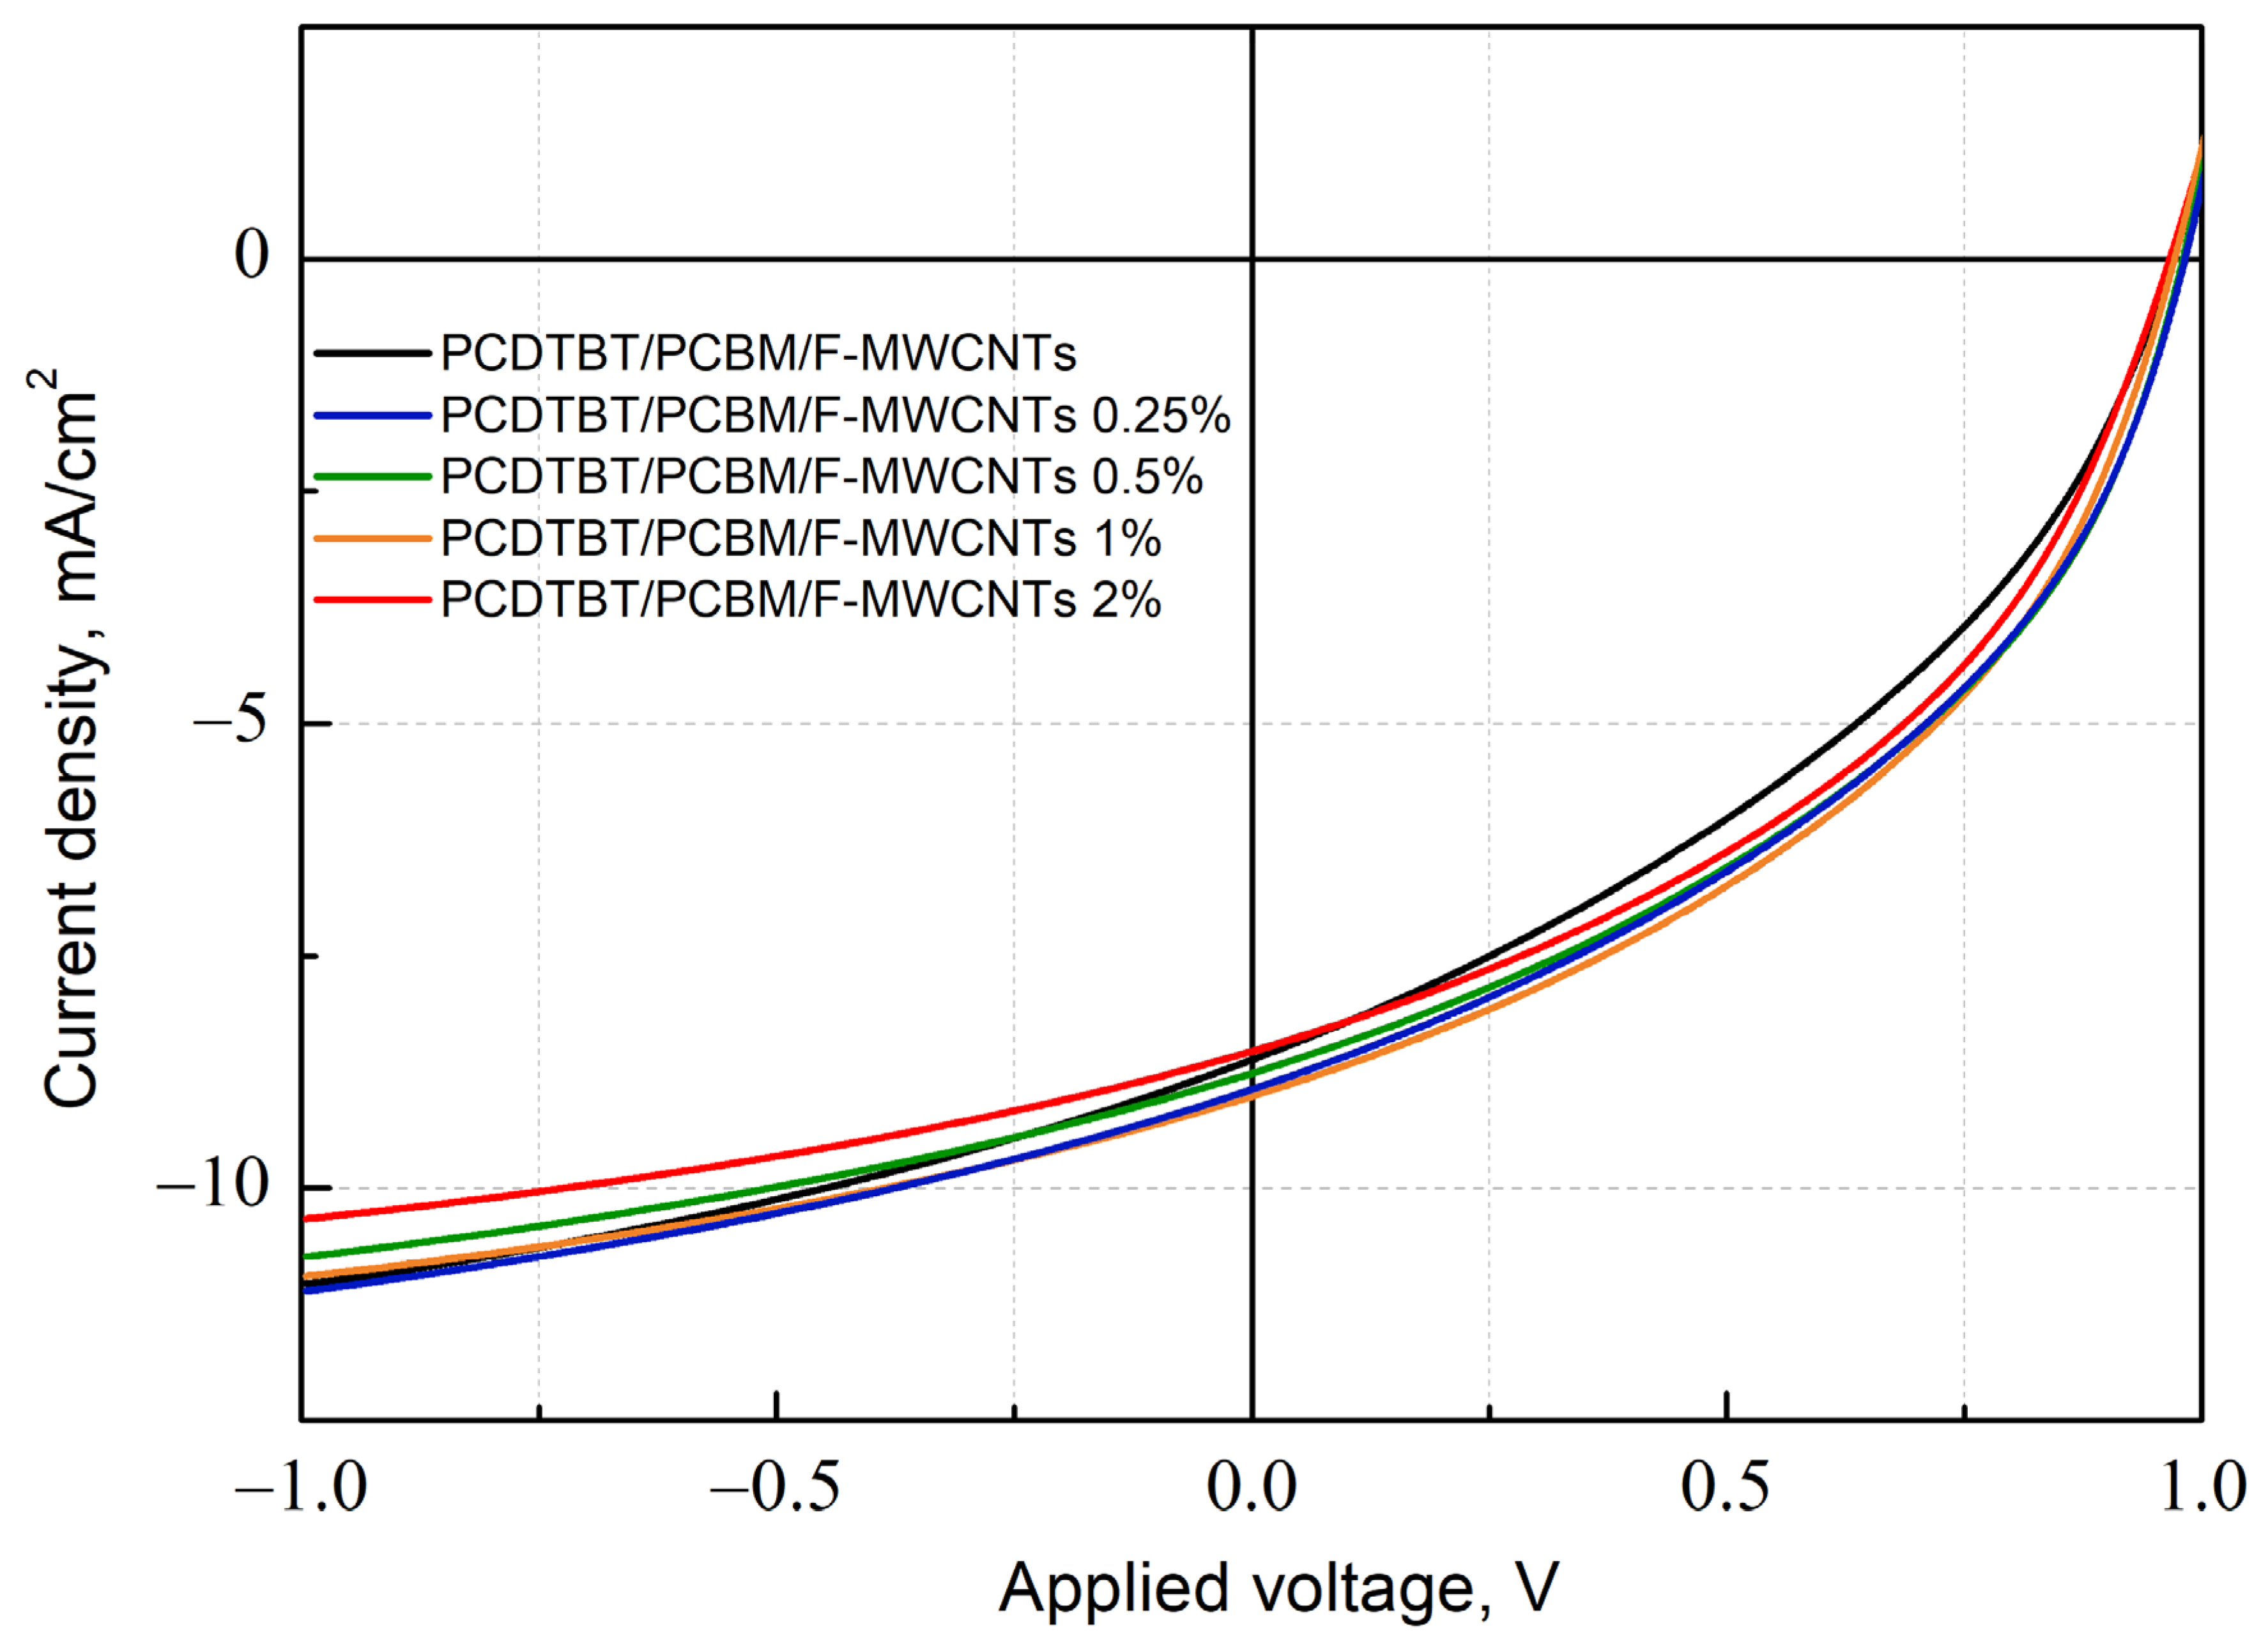
3.2. Effect of Fluorinated MWCNTs Additive on OPV Device Performance

Photovoltaic cells with architecture ITO/PEDOT:PSS/Active Layer/LiF/Al with pure PCDTBT/PC60BM composite and g composite with 2%, 1%, and 0.5% F-MWCNTs additives were manufactured to study the effect of the addition of fluorinated F-MWCNTs (Table 2). When measuring the current-voltage characteristics (see Figure 4), it was observed that in the case of the addition of F-MWCNTs to the composite, FF, Jsc, and PCE are improved, compared to the pure PCDTBT/PC60BM composite, while Voc decreased slightly. At 2% F-MWCNT loading, Jsc starts to decrease. Presumably, this is caused by F-MWCNT aggregation at high loading. Notably, all photovoltaic parameters except FF decreased when untreated nanotubes MW0 were added (see Figure S2 in the Supporting Information for representative IV-curves). Optical absorption spectra of the thin films prepared analogously to the active layer are shown at Figure S2 in the Supporting Information. For the F-MWCNTs weight fraction within 2%, no significant change of the light absorption occurs. Slight variation of the intensity of these spectra is probably caused by the minor change in the thickness of the composite films.
The effective charge mobility was measured in OPV based on pristine composite PCDTBT/PC60BM and composites, doped by 2%, 1%, 0.5%, and 0.25% F-MWCNTs of the polymer mass. The representative photo-CELIV traces are shown in Figure 5. The photoinduced traces were calculated as the difference of the traces with laser pulse and the dark traces. As can be seen in Table 3, the addition of F-MWCNTs does not noticeably affect the charge mobility in the active layer. Some irregularity of the dependence of the mobility on F-MWCNT loading is probably caused by variation of the active layer thickness across the surface of the solar cells. In any case, no systematic increase of the effective mobility with F-MWCNT loading is observed. This allows to suggest that added F-MWCNTs do not participate in charge transfer themselves. Instead, addition of F-MWCNT can optimize the morphology of the active layer, which leads to an improvement in the characteristics of the devices, similarly to fluorinated SWCNT [28].

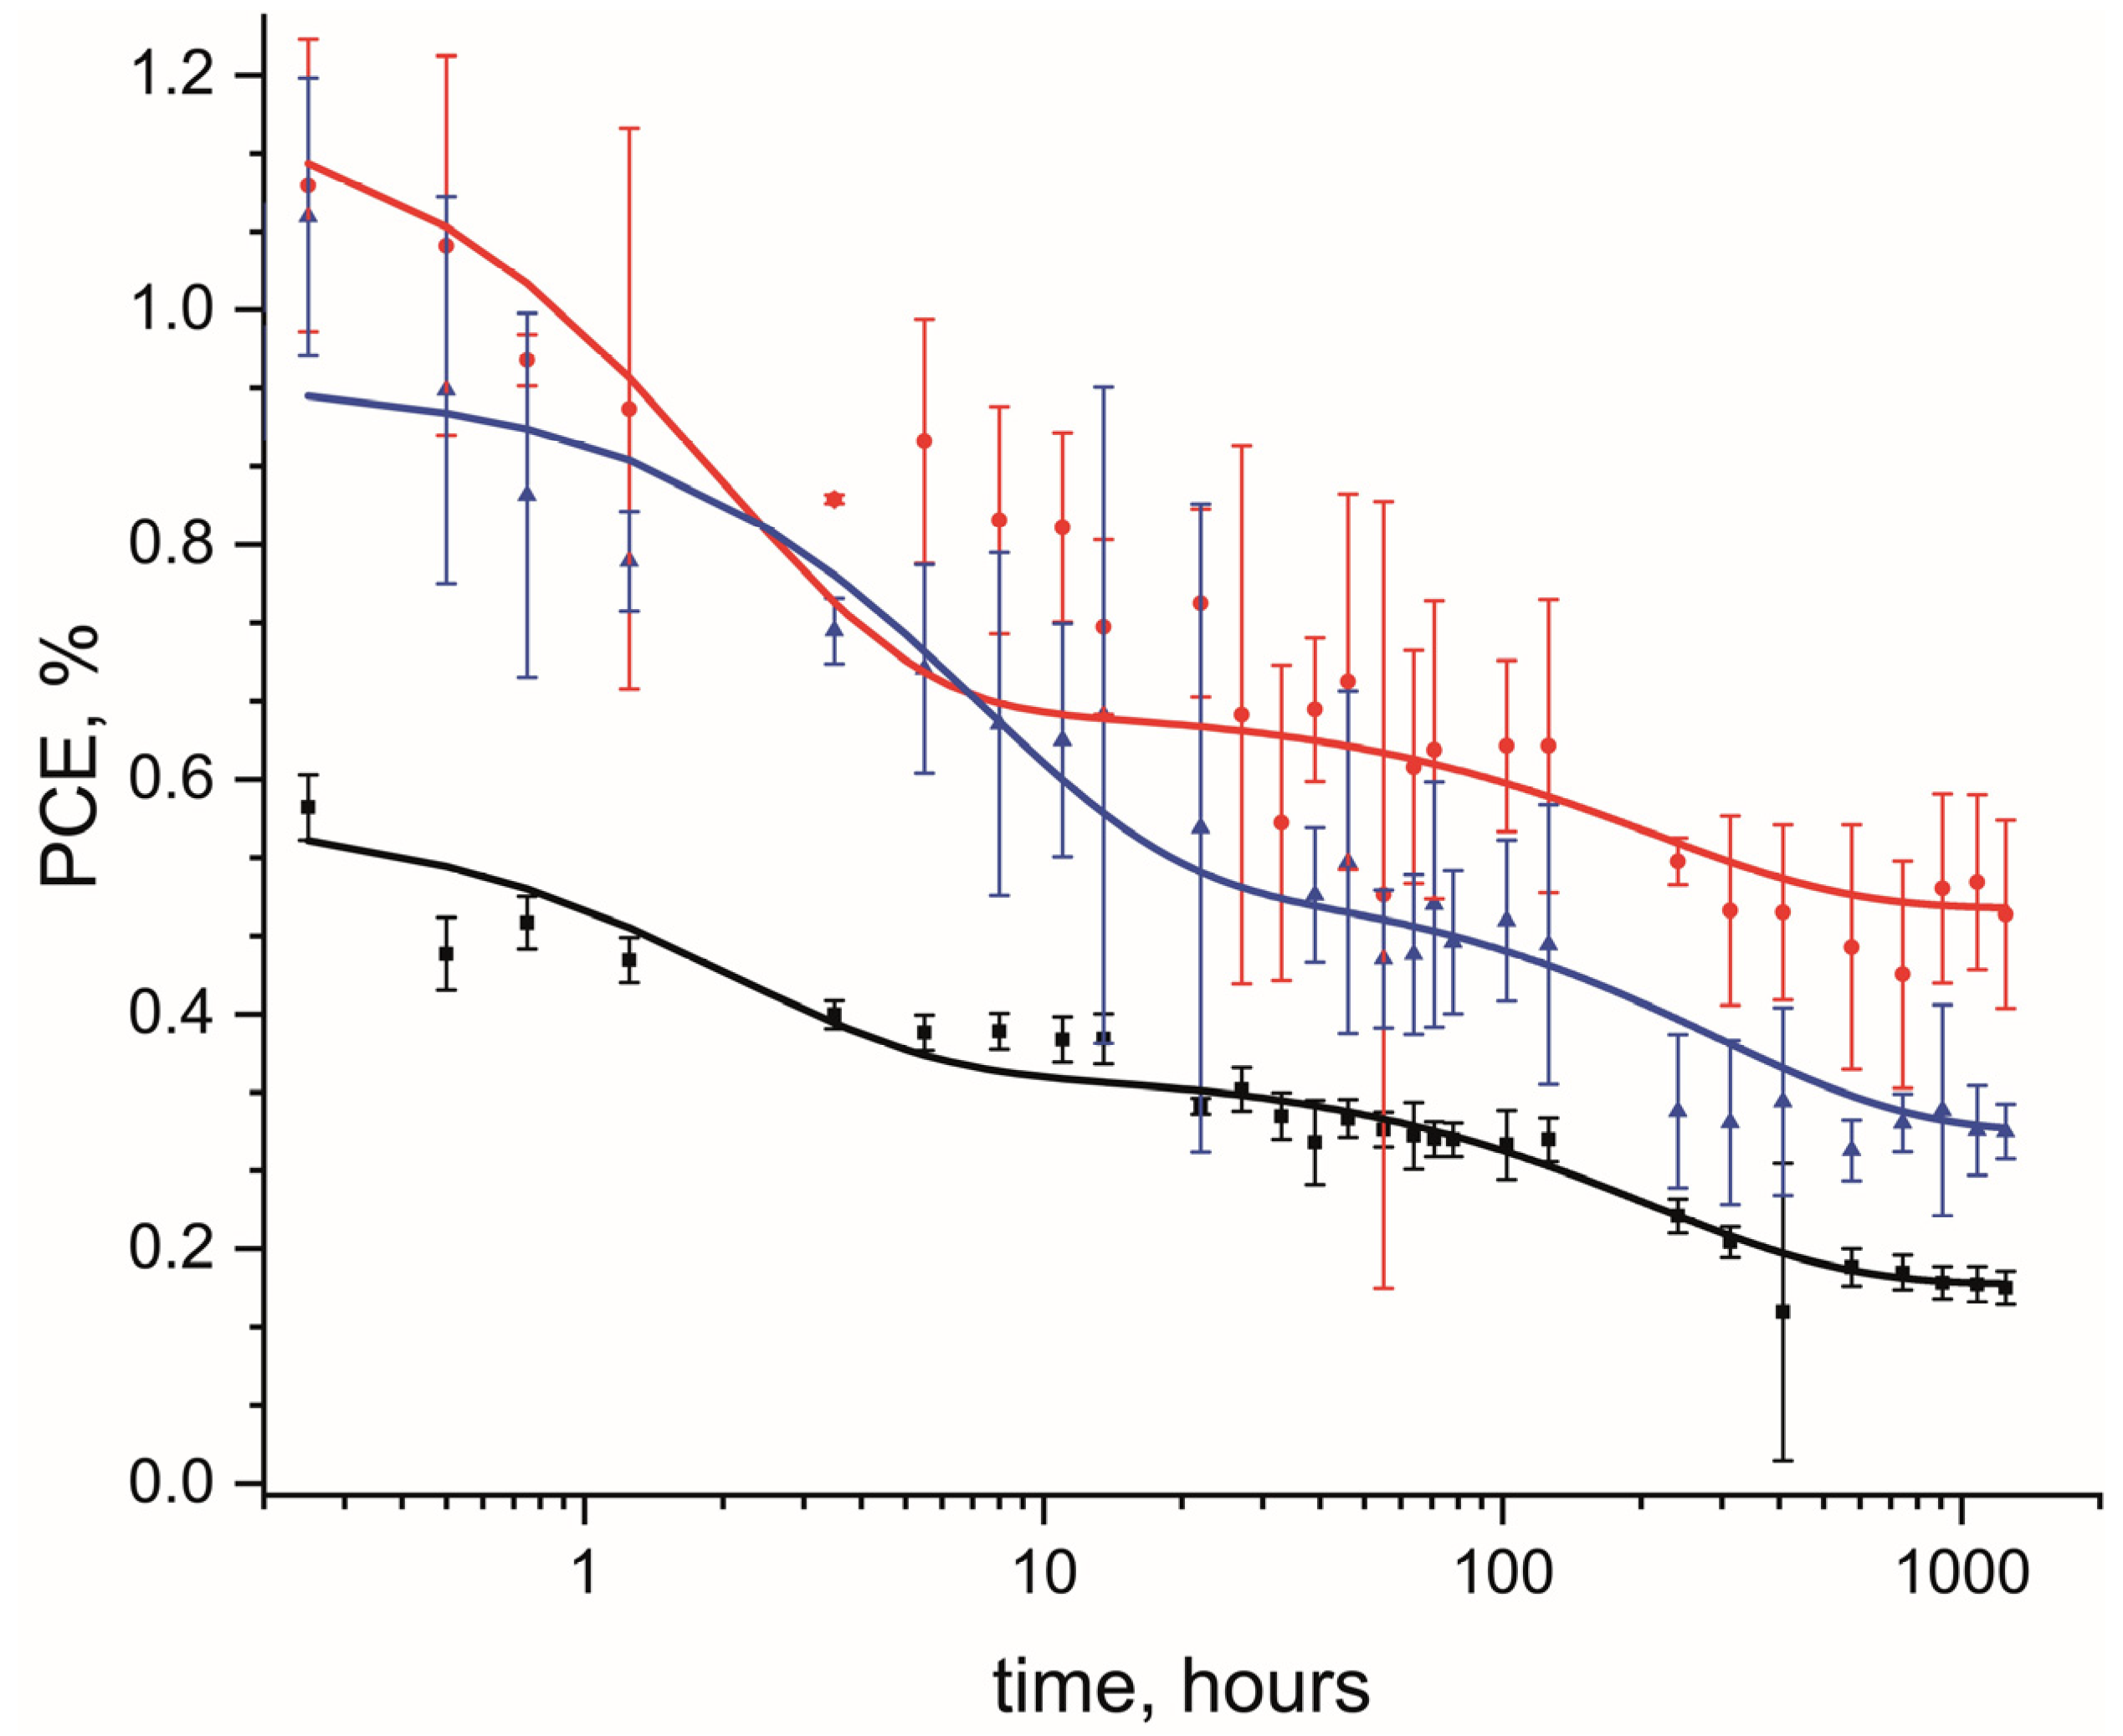
3.3. The Effect of the Addition of Fluorinated MWCNTs on Long-Term Stability of OPV Devices

The devices with addition of F-MWCNTs (2%, 1%, 0.5%) with an Au as cathode material were made to collect the long-term photostability data (see Figure 6). We chose a gold cathode instead of the commonly used aluminum cathode to avoid the contribution of electrode degradation to the overall degradation of the solar cells. The data were compared for devices without additives. The obtained kinetics were approximated using biexponential dependences with t1 and t2 time constants which are responsible for fast and slow processes, respectively:
P C E ( t ) = A 1 e x p ( t t 1 ) + A 2 e x p ( t t 2 ) + P C E
For the device with 0.5% F-MWCNTs admixture, their effect on the photovoltaic parameters was small; therefore, the corresponding data are not shown at Figure 6. However, higher concentrations of F-MWCNTs produced noticeable effect. Figure 6 demonstrates a comparison of the devices without F-MWCNTs admixture and with addition of 1% or 2% F-MWCNTs to the active layer. To make the fast initial degradation visible, logarithmic scale for the abscissa axis is used. For devices of all types, PCE value drops significantly during several hours of initial photodegradation. However, the long-term PCE value increases nearly two-fold and three-fold for the devices with 1% and 2 % F-MWCNTs additive, respectively.
The initial photovoltaic parameters of solar cells with architecture ITO/PEDOT:PSS/Active Layer/Au (measured before photodegradation) are shown in Table S1. The large drop of PCE in these cells, compared to the cells with aluminum electrode, is caused mainly by the VOC drop. This is expected, since the work function of gold is significantly larger than that of aluminum and is not optimal for polymer/fullerene solar cells [33]. As can be seen from Table S1, F-MWCNT additives improves all photovoltaic parameters for the cells with gold cathodes. Surprisingly, untreated MWCNTs additive MW0 improves them to higher extent. However, the PCE of such cells is still lower than that of the cells with aluminum electrodes. In addition, the cells with non-fluorinated MWCNTs additive degrade much faster than those with F-MWCNT additives, as can be derived from Table 4.
The LEPR technique was used to trace the difference of light-induced processes in PCDTBT/PC60BM composites with and without F-MWCNT additive. Light-minus-dark EPR spectra of thin films of PCDTBT/PC60BM and PCDTBT/PC60B/F-MWCNTs 2% composites on flat glass substrate are very similar (see Supporting Information, Figure S3). They are also similar to the spectra of the thicker PCDTBT/PC60BM film on the walls of EPR tube, which consists of two lines [34]. The line at lower and higher magnetic fields belong to the hole on PCDTBT and electrons on PC60BM, respectively. The latter line is stronger; therefore, it was chosen for measuring LEPR decay.
It is firmly established that LEPR signal intensity is proportional to the total charge concentration in the donor/acceptor blend, and the decay of this signal is determined by non-geminate recombination, which is in turn limited by charge diffusion [34,35,36,37]. LEPR decay kinetics can be quantitatively analyzed within a multiple trapping (MT) model. If the exponential distribution of trapping energy g(E) = (1/E0)exp(−E/E0) is assumed, the dependence of the charge concentration ρ on the time t after switching the light off has the following form:
ρ(t) = ρ(0)/[1 + Ct]α,
where C is a constant in frequency units determined by the parameters of MT model and α = kT/E0 [38]. Thus, from analyzing the temporal dependence of LEPR decay, E0 can be measured, which corresponds to the magnitude of the characteristic energetic disorder experienced by charge carriers in the donor/acceptor blend. Although the low-temperature LEPR spectra of PCDTBT/PC60BM and PCDTBT/PC60BM/F-MWCNT composites (Figure S3) are nearly identical, their decay traces are quite different (Figure 7). First, the LEPR signal for the composite with F-MWCNT decays noticeably faster. Fast charge recombination is detrimental for functional solar cells. However, in the present case, the measurements are performed on the isolated donor/acceptor composites, in absence of the electrodes. In this case, all photoinduced charge will inevitably recombine, and their fast recombination implies unconstraint charge diffusion in the vicinity of the donor/acceptor interface. Second, numerical simulation according to Equation (3) yields α = 0.58 for the composite with F-MWCNT, which is much larger than α = 0.196 obtained for the PCDTBT/PC60BM composite. This difference translates into a difference of E0: 37 meV and 12.5 meV for the PCDTBT/PC60BM and PCDTBT/PC60BM/F-MWCNT composites, respectively. The former value is typical for polymer/fullerene bulk heterojunction composites [34,35,39,40]. The much smaller value for PCDTBT/PC60BM/F-MWCNT composite testifies the change in the nanomorphology of PCDTBT and/or PC60BM introduced by F-MWCNTs. Presumably, F-MWCNTs, due to their regular structure, impose the ordering effect on the rest of the composite and thus suppress the energetic disorder. This, in turn, facilitates charge separation and movement towards electrodes in the PCDTBT/PC60BM/F-MWCNT composite in the functional solar cell.

4. Conclusions

A method of producing F-MWCNTs was developed. The addition of F-MWCNTs with a weight fraction in the range of 0.25–2% to the active layer leads to the enhancement of the devices’ properties: FF, Jsc, and PCE. Generally, such addition increases PCE by approximately 20%. The enhancement of devices’ properties presumably occurs due to the modification of the morphology of the active layer caused by adding MWCNTs. Reducing the energetic disorder for charge transfer in PCDTBT/PC60BM composite with F-MWCNTs addition provides indirect evidence of modification of the nanomorphology of this composite by F-MWCNTs.
Furthermore, the addition of F-MWCNTs improves the efficiency of cells’ work at times over 1200 h, likely by stabilizing the thermodynamically unstable morphology of the bulk heterojunction active layer and reinforcing it. Thus, fluorinated MWCNTs appear to be a promising material for organic photovoltaics.

Supplementary Materials

The following supporting information can be downloaded at: https://www.mdpi.com/article/10.3390/jcs8010003/s1, Figure S1. UV/Vis absorption spectra of PCDTBT:PC60BM films with different amount of F-MWCNT additive. Figure S2. Current density-voltage characteristics of the organic solar cell devices with addition of untreated MWCNTs. Figure S3. Light-minus-dark EPR spectra of PCDTBT/PC60BM and PCDTBT/PC60B/F-MWCNTs 2% composites. Table S1. Initial photovoltaic parameters of solar cells with architecture ITO/PEDOT:PSS/Active Layer/Au.

Author Contributions

Conceptualization, L.V.K. and E.S.K.; Methodology, L.V.K.; Software, M.N.U.; Formal Analysis, N.V.K.; Investigation, E.S.K., N.V.K., A.V.K., V.A.Z., A.M.K., M.S.K. and K.M.D.; Resources, O.A.G. and A.G.M.; Data Curation, N.V.K.; Writing—Original Draft Preparation, E.S.K., N.V.K. and A.V.K.; Writing—Review and Editing, L.V.K.; Visualization, E.S.K.; Supervision, L.V.K.; Project Administration, L.V.K.; Funding Acquisition, V.I.S. and L.V.K. All authors have read and agreed to the published version of the manuscript.

Funding

This work was supported by RSF grant № 23-73-00072 (processing of carbon nanotubes, fabrication and testing of organic solar cells, LEPR and photo-CELIV measurements).

Data Availability Statement

The data presented in this study are available on request from the corresponding author.

Acknowledgments

The authors would like to acknowledge the Multi-Access Chemical Service Center SB RAS for SEM images and Raman spectra measurement. The authors acknowledge the Ministry of Science and Higher Education of the Russian Federation, project № 122040800263-6 (CVA measurements) and 121031700314-5 (preparation of arrays of vertically aligned MWCNTs).

Conflicts of Interest

The authors declare no conflict of interest.

References

  1. Gao, W.; Qi, F.; Peng, Z.; Lin, F.R.; Jiang, K.; Zhong, C.; Kaminsky, W.; Guan, Z.; Lee, C.; Marks, T.J.; et al. Achieving 19% Power Conversion Efficiency in Planar-Mixed Heterojunction Organic Solar Cells Using a Pseudosymmetric Electron Acceptor. Adv. Mater. 2022, 34, 2202089. [Google Scholar] [CrossRef] [PubMed]
  2. Bi, P.; Zhang, S.; Chen, Z.; Xu, Y.; Cui, Y.; Zhang, T.; Ren, J.; Qin, J.; Hong, L.; Hao, X.; et al. Reduced Non-Radiative Charge Recombination Enables Organic Photovoltaic Cell Approaching 19% Efficiency. Joule 2021, 5, 2408–2419. [Google Scholar] [CrossRef]
  3. Cui, Y.; Xu, Y.; Yao, H.; Bi, P.; Hong, L.; Zhang, J.; Zu, Y.; Zhang, T.; Qin, J.; Ren, J.; et al. Single-Junction Organic Photovoltaic Cell with 19% Efficiency. Adv. Mater. 2021, 33, 2102420. [Google Scholar] [CrossRef] [PubMed]
  4. Zhang, G.; Lin, F.R.; Qi, F.; Heumüller, T.; Distler, A.; Egelhaaf, H.-J.; Li, N.; Chow, P.C.Y.; Brabec, C.J.; Jen, A.K.-Y.; et al. Renewed Prospects for Organic Photovoltaics. Chem. Rev. 2022, 122, 14180–14274. [Google Scholar] [CrossRef] [PubMed]
  5. Deibel, C.; Strobel, T.; Dyakonov, V. Role of the Charge Transfer State in Organic Donor-Acceptor Solar Cells. Adv. Mater. 2010, 22, 4097–4111. [Google Scholar] [CrossRef] [PubMed]
  6. Lee, H.; Park, C.; Sin, D.H.; Park, J.H.; Cho, K. Recent Advances in Morphology Optimization for Organic Photovoltaics. Adv. Mater. 2018, 30, 1800453. [Google Scholar] [CrossRef]
  7. Thompson, B.C.; Fréchet, J.M.J. Polymer–Fullerene Composite Solar Cells. Angew. Chem. Int. Ed. 2008, 47, 58–77. [Google Scholar] [CrossRef]
  8. Kim, Y.; Park, B.N. Electrical Signature of Ultrasound-Induced Anisotropic Self-Assembly of Poly(3-Hexylthiophene) (P3HT) during Channel Formation. Appl. Sci. 2020, 10, 6886. [Google Scholar] [CrossRef]
  9. Duan, L.; Uddin, A. Progress in Stability of Organic Solar Cells. Adv. Sci. 2020, 7, 1903259. [Google Scholar] [CrossRef]
  10. Li, Y.; Liu, K.-K.; Lin, F.R.; Jen, A.K.-Y. Improving the Stability of Organic Solar Cells: From Materials to Devices. Sol. RRL 2023, 7, 2300531. [Google Scholar] [CrossRef]
  11. Yan, L.; Ma, C.-Q. Degradation of Polymer Solar Cells: Knowledge Learned from the Polymer:Fullerene Solar Cells. Energy Technol. 2021, 9, 2000920. [Google Scholar] [CrossRef]
  12. Doumon, N.Y.; Wang, G.; Chiechi, R.C.; Koster, L.J.A. Relating Polymer Chemical Structure to the Stability of Polymer: Fullerene Solar Cells. J. Mater. Chem. C 2017, 5, 6611–6619. [Google Scholar] [CrossRef]
  13. Ciammaruchi, L.; Oliveira, R.; Charas, A.; Tulus; von Hauff, E.; Polino, G.; Brunetti, F.; Hansson, R.; Moons, E.; Krassas, M.; et al. Stability of Organic Solar Cells with PCDTBT Donor Polymer: An Interlaboratory Study. J. Mater. Res. 2018, 33, 1909–1924. [Google Scholar] [CrossRef]
  14. Rivaton, A.; Tournebize, A.; Gaume, J.; Bussière, P.-O.; Gardette, J.-L.; Therias, S. Photostability of Organic Materials Used in Polymer Solar Cells: Photostability of Polymer Solar Cells. Polym. Int. 2014, 63, 1335–1345. [Google Scholar] [CrossRef]
  15. Blazinic, V.; Ericsson, L.K.E.; Muntean, S.A.; Moons, E. Photo-Degradation in Air of Spin-Coated PC60BM and PC70BM Films. Synth. Met. 2018, 241, 26–30. [Google Scholar] [CrossRef]
  16. Yamilova, O.R.; Martynov, I.V.; Brandvold, A.S.; Klimovich, I.V.; Balzer, A.H.; Akkuratov, A.V.; Kusnetsov, I.E.; Stingelin, N.; Troshin, P.A. What Is Killing Organic Photovoltaics: Light-Induced Crosslinking as a General Degradation Pathway of Organic Conjugated Molecules. Adv. Energy Mater. 2020, 10, 1903163. [Google Scholar] [CrossRef]
  17. Kim, T.; Younts, R.; Lee, W.; Lee, S.; Gundogdu, K.; Kim, B.J. Impact of the Photo-Induced Degradation of Electron Acceptors on the Photophysics, Charge Transport and Device Performance of All-Polymer and Fullerene–Polymer Solar Cells. J. Mater. Chem. A 2017, 5, 22170–22179. [Google Scholar] [CrossRef]
  18. de Zerio, A.D.; Müller, C. Glass Forming Acceptor Alloys for Highly Efficient and Thermally Stable Ternary Organic Solar Cells. Adv. Energy Mater. 2018, 8, 1702741. [Google Scholar] [CrossRef]
  19. Fraga Domínguez, I.; Distler, A.; Lüer, L. Stability of Organic Solar Cells: The Influence of Nanostructured Carbon Materials. Adv. Energy Mater. 2017, 7, 1601320. [Google Scholar] [CrossRef]
  20. Bati, A.S.R.; Yu, L.; Batmunkh, M.; Shapter, J.G. Recent Advances in Applications of Sorted Single-Walled Carbon Nanotubes. Adv. Funct. Mater. 2019, 29, 1902273. [Google Scholar] [CrossRef]
  21. Muchuweni, E.; Mombeshora, E.T.; Martincigh, B.S.; Nyamori, V.O. Recent Applications of Carbon Nanotubes in Organic Solar Cells. Front. Chem. 2022, 9, 733552. [Google Scholar] [CrossRef] [PubMed]
  22. Wei, X.; Li, S.; Wang, W.; Zhang, X.; Zhou, W.; Xie, S.; Liu, H. Recent Advances in Structure Separation of Single-Wall Carbon Nanotubes and Their Application in Optics, Electronics, and Optoelectronics. Adv. Sci. 2022, 9, 2200054. [Google Scholar] [CrossRef] [PubMed]
  23. Shastry, T.A.; Hartnett, P.E.; Wasielewski, M.R.; Marks, T.J.; Hersam, M.C. Ternary Polymer–Perylenediimide–Carbon Nanotube Photovoltaics with High Efficiency and Stability under Super-Solar Irradiation. ACS Energy Lett. 2016, 1, 548–555. [Google Scholar] [CrossRef]
  24. Salim, T.; Lee, H.-W.; Wong, L.H.; Oh, J.H.; Bao, Z.; Lam, Y.M. Semiconducting Carbon Nanotubes for Improved Efficiency and Thermal Stability of Polymer-Fullerene Solar Cells. Adv. Funct. Mater. 2016, 26, 51–65. [Google Scholar] [CrossRef]
  25. Blackburn, J.L.; Ferguson, A.J.; Cho, C.; Grunlan, J.C. Carbon-Nanotube-Based Thermoelectric Materials and Devices. Adv. Mater. 2018, 30, 1704386. [Google Scholar] [CrossRef] [PubMed]
  26. Krause, B.; Konidakis, I.; Arjmand, M.; Sundararaj, U.; Fuge, R.; Liebscher, M.; Hampel, S.; Klaus, M.; Serpetzoglou, E.; Stratakis, E.; et al. Nitrogen-Doped Carbon Nanotube/Polypropylene Composites with Negative Seebeck Coefficient. J. Compos. Sci. 2020, 4, 14. [Google Scholar] [CrossRef]
  27. El-Moussawi, Z.; Nourdine, A.; Flandin, L. A Key Progress in Introducing Single Walled Carbon Nanotubes to Photovoltaic Devices. Appl. Nanosci. 2022, 12, 2277–2290. [Google Scholar] [CrossRef]
  28. Kobeleva, E.S.; Uvarov, M.N.; Kravets, N.V.; Ponomarev, S.A.; Gurova, O.A.; Okotrub, A.V.; Kazantzev, M.S.; Degtyarenko, K.M.; Kulik, L.V. Fluorinated Carbon Nanotubes as Nonvolatile Additive to the Active Layer of Polymer/Fullerene Solar Cells. Fuller. Nanotub. Carbon Nanostructures 2023, 31, 464–473. [Google Scholar] [CrossRef]
  29. Okotrub, A.V.; Gorodetskiy, D.V.; Gusel’nikov, A.V.; Kondranova, A.M.; Bulusheva, L.G.; Korabovska, M.; Meija, R.; Erts, D. Distribution of Iron Nanoparticles in Arrays of Vertically Aligned Carbon Nanotubes Grown by Chemical Vapor Deposition. Materials 2022, 15, 6639. [Google Scholar] [CrossRef]
  30. Juška, G.; Arlauskas, K.; Viliūnas, M.; Kočka, J. Extraction Current Transients: New Method of Study of Charge Transport in Microcrystalline Silicon. Phys. Rev. Lett. 2000, 84, 4946–4949. [Google Scholar] [CrossRef]
  31. Gagne, R.R.; Koval, C.A.; Lisensky, G.C. Ferrocene as an Internal Standard for Electrochemical Measurements. Inorg. Chem. 1980, 19, 2854–2855. [Google Scholar] [CrossRef]
  32. Kamalakannan, R.; Ganesan, K.; Ilango, S.; Thirumurugan, N.; Singh, V.N.; Kamruddin, M.; Mehta, B.R.; Tyagi, A.K. The Role of Structural Defects on the Transport Properties of a Few-Walled Carbon Nanotube Networks. Appl. Phys. Lett. 2011, 98, 192105. [Google Scholar] [CrossRef]
  33. Mihailetchi, V.D.; Koster, L.J.A.; Blom, P.W.M. Effect of Metal Electrodes on the Performance of Polymer:Fullerene Bulk Heterojunction Solar Cells. Appl. Phys. Lett. 2004, 85, 970–972. [Google Scholar] [CrossRef]
  34. Kobeleva, E.S.; Popov, A.A.; Baranov, D.S.; Uvarov, M.N.; Nevostruev, D.A.; Degtyarenko, K.M.; Gadirov, R.M.; Sukhikh, A.S.; Kulik, L.V. Origin of Poor Photovoltaic Performance of Bis(Tetracyanoantrathiophene) Non-Fullerene Acceptor. Chem. Phys. 2021, 546, 111162. [Google Scholar] [CrossRef]
  35. Popov, A.A.; Uvarov, M.N.; Kulik, L.V. Mode of Action of the Third Component in Ternary Organic Photovoltaic Blend PBDB-T/ITIC:PC70BM Revealed by EPR Spectroscopy. Synth. Met. 2021, 277, 116783. [Google Scholar] [CrossRef]
  36. Marumoto, K.; Takeuchi, N.; Ozaki, T.; Kuroda, S. ESR Studies of Photogenerated Polarons in Regioregular Poly(3-Alkylthiophene)–Fullerene Composite. Synth. Met. 2002, 129, 239–247. [Google Scholar] [CrossRef]
  37. Lukina, E.A.; Uvarov, M.N.; Kulik, L.V. Charge Recombination in P3HT/PC70BM Composite Studied by Light-Induced EPR. J. Phys. Chem. C 2014, 118, 18307–18314. [Google Scholar] [CrossRef]
  38. Tachiya, M.; Seki, K. Theory of Bulk Electron-Hole Recombination in a Medium with Energetic Disorder. Phys. Rev. B 2010, 82, 085201. [Google Scholar] [CrossRef]
  39. Ho, C.H.Y.; Dong, Q.; Yin, H.; Leung, W.W.K.; Yang, Q.; Lee, H.K.H.; Tsang, S.W.; So, S.K. Impact of Solvent Additive on Carrier Transport in Polymer:Fullerene Bulk Heterojunction Photovoltaic Cells. Adv. Mater. Interfaces 2015, 2, 1500166. [Google Scholar] [CrossRef]
  40. Yuan, J.; Zhang, C.; Qiu, B.; Liu, W.; So, S.K.; Mainville, M.; Leclerc, M.; Shoaee, S.; Neher, D.; Zou, Y. Effects of Energetic Disorder in Bulk Heterojunction Organic Solar Cells. Energy Environ. Sci. 2022, 15, 2806–2818. [Google Scholar] [CrossRef]
Figure 1. Cyclic voltammograms of F-MWCNTs as thin films drop-casted from toluene in CH2Cl2 solution.
Jcs 08 00003 g001
Figure 2. SEM images of MW0 (a) and F-MWCNTs (b) on the conductive tape.
Jcs 08 00003 g002
Figure 3. Raman spectra of MW0 (a) and F-MWCNTs (b).
Jcs 08 00003 g003
Figure 4. Current density–voltage characteristics of the organic solar cell devices with architecture ITO/PEDOT:PSS/Active layer/LiF/Al.
Jcs 08 00003 g004
Figure 5. Photo-CELIV transient currents obtained for OPV devices with the active layers of the pure composite PCDTBT/PC60BM or that with F-MWCNTs. Red lines—dark traces, black lines—traces with laser pulse, blue lines—photoinduced traces. The latter were user to determine the effective charge mobility.
Jcs 08 00003 g005
Figure 6. PCE of solar cells with architecture ITO/PEDOT:PSS/Active Layer/Au comprising PCDTBT/PC60BM BHJ photoactive layers with fluorinated MWCNTs admixture as a function of the time of aging in air under illumination (black—without additive, blue—with addition of 1% F-MWCNTs, red—with addition of 2% F-MWCNTs). Symbols—averaged experimental values of PCE, lines—biexponential approximation. Error bars show statistical scattering of the PCE values over four pixels.
Jcs 08 00003 g006
Figure 7. Light-induced EPR decay traces for PCDTBT/PC60BM (top) and PCDTBT/PC60B/F-MWCNTs 2% (bottom) composites. Black lines—experimental data, red lines—numerical approximation. Note the difference of the abscissa axis scale between the top and the bottom panes. Temperature 85 K, modulation amplitude 3 G, microwave power 6.3 mW. Eight traces were averaged for each sample to improve signal-to-noise ratio.
Jcs 08 00003 g007
Table 1. Elemental composition of F-MWCNTs according to energy dispersive spectroscopy data.
ElementWeight, %Atomic Weight, %
C54.7966.38
O3.012.74
F39.7330.43
Br2.470.45
Table 2. Photovoltaic parameters of solar cells with architecture ITO/PEDOT:PSS/Active Layer/LiF/Al. Statistics are compiled from six pixels. The value for the best pixel and the averaged value of the parameters with their standard deviation are presented.
Voc, VJsc, mA/cm2FF, %PCE, %
PCDTBT/PC60BM0.983
0.977 ± 0.006
8.61
8.50 ± 0.20
38.1
37.5 ± 0.5
3.18
3.11 ± 0.09
PCDTBT/PC60BM/F-MWCNTs 0.25%0.983
0.981 ± 0.002
8.93
8.90 ± 0.10
40.9
40.0 ± 1.0
3.59
3.50 ± 0.10
PCDTBT/PC60BM/F-MWCNTs 0.5%0.980
0.979 ± 0.002
8.76
8.80 ± 0.10
41.7
41.2 ± 0.7
3.59
3.54 ± 0.07
PCDTBT/PC60BM/F-MWCNTs 1%0.977
0.973 ± 0.004
9.00
8.90 ± 0.20
41.9
41.0 ± 0.9
3.67
3.50 ± 0.10
PCDTBT/PC60BM/F-MWCNTs 2%0.966
0.965 ± 0.002
8.52
8.30 ± 0.20
42.0
41.6 ± 0.6
3.46
3.30 ± 0.10
PCDTBT/PC60BM/MW0 1%0.897
0.890 ± 0.010
7.44
7.40 ± 0.20
41.3
40.6 ± 0.5
2.75
2.69 ± 0.08
Table 3. Photo-CELIV transient current parameters obtained for OPV devices with the PCDTBT: PC60BM active layer with various amounts of F-MWCNTs admixture.
Active Layertmax, usµ, cm2/Vs
PCDTBT/PC60BM2.57.1 × 10−5
PCDTBT/PC60BM/F-MWCNTs 0.25%3.04.9 × 10−5
PCDTBT/PC60BM/F-MWCNTs 0.5%2.38.4 × 10−5
PCDTBT/PC60BM/F-MWCNTs 1%3.34.1 × 10−5
PCDTBT/PC60BM/F-MWCNTs 2%2.95.4 × 10−5
Table 4. Parameters of degradation kinetics of OSCs with architecture ITO/PEDOT:PSS/Active Layer/Au with different active layers.
Active LayerA1/A2t1, ht2, hPCE, %
PCDTBT/PC60BM1.31.7 210 0.16
PCDTBT/PC60BM/F-MWCNTs 0.5%1.09.9 305 0.22
PCDTBT/PC60BM/F-MWCNTs 1%1.77.1293 0.29
PCDTBT/PC60BM/F-MWCNTs 2%0.62.0214 0.45
PCDTBT/PC60BM/MWCNTs 1%2.20.7 223 0.13
Disclaimer/Publisher’s Note: The statements, opinions and data contained in all publications are solely those of the individual author(s) and contributor(s) and not of MDPI and/or the editor(s). MDPI and/or the editor(s) disclaim responsibility for any injury to people or property resulting from any ideas, methods, instructions or products referred to in the content.

