Article

The Impact of 3D Printing Technology on the Improvement of External Wall Thermal Efficiency—An Experimental Study

Department of Energy Conversion Engineering, Faculty of Mechanical and Power Engineering, Wroclaw University of Science and Technology, 27 Wybrzeze Wyspianskiego Street, 50-370 Wroclaw, Poland
*
Author to whom correspondence should be addressed.
J. Compos. Sci. 2024, 8(10), 389; https://doi.org/10.3390/jcs8100389
Submission received: 15 August 2024 / Revised: 20 September 2024 / Accepted: 24 September 2024 / Published: 30 September 2024
(This article belongs to the Special Issue Sustainable Composite Construction Materials, Volume II)

Abstract

:
Three-dimensional printing technology continues to evolve, enabling new applications in manufacturing. Extensive research in the field of biomimetics underscores the significant impact of the internal geometry of building envelopes on their thermal performance. Although 3D printing holds great promise for improving thermal efficiency in construction, its full potential has yet to be realized, and the thermal performance of printed building components remains unexplored. The aim of this paper is to experimentally examine the thermal insulation characteristics of prototype cellular materials created using 3D additive manufacturing technologies (SLS and DLP). This study concentrates on exploring advanced thermal insulation solutions that could enhance the energy efficiency of buildings, cooling systems, appliances, or equipment. To this end, virtual models of sandwich composites with an open-cell foam core modeled after a Kelvin cell were created. They were characterized by a constant porosity of 0.95 and a pore diameter of the inner core of the composites of 6 mm. The independent variables included the different material from which the composites were made, the non-uniform number of layers in the composite (one, two, three, and five layers) and the total thickness of the composite (20, 40, 60, 80, and 100 mm). The impact of three independent parameters defining the prototype composite on its thermal insulation properties was assessed, including the heat flux (q) and the heat transfer coefficient (U). According to the experimental tests, a five-layer composite with a thickness of 100 mm made of soybean oil-based resin obtained the lowest coefficient with a value of U = 0.147 W/m2·K.

1. Introduction

The construction sector faces significant challenges, driven by both the need to decarbonize and the need to build new facilities, especially in rapidly developing regions of the world. In addition, a significant proportion of buildings in developed countries do not meet modern energy standards. Their refurbishment and renovation are therefore crucial. It should be noted that it is difficult to apply thick layers of traditional insulation materials in older buildings [1]. It is therefore important to develop thin, high-performance materials. In addition, the need to preserve the appearance of historic buildings requires the use of unobtrusive technologies and methods [2], such as internal insulation and transparent insulation layers. Importantly, in many developing countries there is a growing demand for new buildings that must be both low cost and energy efficient [3]. This calls for innovative materials that are easy to manufacture, inexpensive, and yet meet energy efficiency standards. These challenges are driving researchers to search intensively for innovative solutions, particularly in the areas of building materials and thermal insulation [2,3].
One of the key issues pointing to the need for innovative approaches is certainly the decarbonization of construction. Reducing CO2 emissions has become one of the most important challenges for the construction sector [1]. The construction sector is responsible for a large proportion of global greenhouse gas emissions, mainly through the production of materials such as cement and steel, but also through the operation of buildings. In addition, and very importantly, modern buildings need to be much more energy efficient, so thermal insulation plays a key role in reducing the energy needed to heat and cool buildings, which also has a direct impact on CO2 emissions [4]. Recently, there has also been a noticeable increase in demand for insulation materials with a low carbon footprint, which can include wood wool, hemp, or insulation based on industrial waste [5,6]. In addition, the development of materials that can be produced locally from available resources, namely the aforementioned materials from agricultural or industrial waste, can significantly reduce the cost and carbon footprint of transportation.
New approaches to construction are increasingly incorporating the principles of a closed-loop economy [7]. Insulation needs to be designed with material reuse in mind, meaning that the materials used should be easy to disassemble and recycle. Biodegradable and non-toxic materials are also becoming increasingly important. To meet all these challenges, technologies such as 3D printing are being developed to create personalized, precisely tailored insulation solutions [8]. This has the potential to revolutionize the way buildings are insulated, both during construction and renovation [9]. With the capabilities of additive manufacturing (AM) or 3D printing, it is possible to achieve complex internal material geometries that would be difficult to achieve with conventional construction techniques [10]. This flexibility in design, as well as the significant decrease in the cost of 3D printing, has led researchers around the world to take an interest in this technology as a tool [11]. Three-dimensional printing has been identified as a future development in the construction sector due to its potential to support sustainable design [12] and the fact that it can be used to produce polymers and products based on recycled polymers [13]. By adjusting the internal geometry and varying the percentage of infill, 3D printing can optimize thermal conductivity while producing lighter components that can be used, for example, in energy-efficient building renovations [14,15]. Since the building envelope accounts for 50–60% of the total heat transfer, improving thermal insulation is a cost-effective strategy for improving energy efficiency [16].

1.1. The Potential of 3DP for Energy Efficiency in Buildings

The energy efficiency of buildings is mainly related to the energy loss due to heat transfer through exterior walls, including opaque elements (although a large amount of heat penetrates through thermally weaker transparent elements, this is not the subject of this article). Measures to improve the thermal efficiency of exterior walls focus on reducing the heat transfer coefficient (U-value), which is a key thermophysical characteristic of a building’s energy balance. By using insulation materials with low thermal conductivity, it is possible to achieve high thermal resistance (R-values) and consequently low U-values. The total thermal resistance of a building component is the sum of the conduction resistance (Rj) and the internal and external surface resistances (Rs,i and Rs,e, respectively) according to Equation (1) [17].
R t o t = R s , i + j R j + R s , e
where the conduction resistance is determined by the ratio of the thickness (sj) and the thermal conductivity (λj) of the j-th material, as shown in Formula (2):
R j = s j λ j
Therefore, the U-value can be obtained as the inverse of the total thermal resistance (Equation (3)):
U = 1 R t o t
Heat transfer processes can be significantly influenced by both the structure and materials of the building envelope. Researchers have demonstrated in their studies [18,19,20,21] that 3D printing is an extremely effective tool for creating nature-inspired shapes that can significantly affect the thermal efficiency of a building’s exterior walls.
Given this, it may be interesting to integrate the benefits of 3D printing with those of low-carbon-footprint insulation materials. The research proposed in this article could be a starting point for future developments in the field of energy conservation in buildings, for example. The problems associated with the need for effective thermal insulation are not unique to the construction industry. The benefits of reducing heat flow through partitions are also measurable in other industries. Consider cold rooms, both domestic refrigerators and industrial cold stores [22]. High-performance wall insulation allows the desired internal temperature to be reached more quickly and with less cooling power required to maintain it. Another example is the thermal insulation of spacecraft and probes sent into space [23,24]. Extreme conditions in space, ranging from a few Kelvins to several thousand and more, threaten the proper functioning of electronic components and sensitive instruments.
In such cases, the demands on insulation are very high—it is necessary to ensure minimal heat transfer while maintaining low weight and high mechanical strength.
The above examples show that the demand for effective thermal insulation in many areas of engineering is high and shows no sign of changing. The desire to increase the energy efficiency of equipment and buildings, coupled with the possibility of achieving significant environmental and economic benefits, combined with an analysis of the thermal insulation solutions currently available on the market, is driving the search for new insulation materials and the improvement of existing ones [25]. The range of possible applications for 3D-printed insulation structures is broad.
Three-dimensional printing is also a promising new technology for building construction. While 3D printing of houses is still in the distant future, 3D printing of prefabricated structures (shafts, chambers, supports, and columns), functional architecture (benches, tables, and fountains), or decoration (monuments, facade ornaments, and stucco) is currently within reach. For these forms, 3DCP technology is already beginning to establish itself on the market [24], as seen in Table 1.
Suntharalingam et al. [32] determined the heat transfer coefficient U for 32 different 3DPC wall configurations (with and without cavity insulation) using verified finite element models. In papers [43,44,45,46,47], the authors used additive manufacturing to create layered structures with architectural cores. They showed that the properties of cellular materials are determined by the solid components and the spatial configuration of voids and solids, i.e., the cellular architecture. Changing the cellular architecture provides unlimited possibilities to achieve desired material properties [47]. Composites with a layered structure are commonly used [46,48], with a low-density core and rigid layers outside the core. The core can be formed into closed or open foam structures or periodic structures. They can have a vacuum inside or be filled with air, liquid, phase change materials (solid or liquid), waste, and biodegradable materials [49]. Islam et al. [50] investigated PLA filament thermal insulation materials using FDM printing technology. The authors showed that they have good insulating properties as evidenced by the thermal conductivity values obtained in thermal tests ranging from 0.037 W/(m K) to 0.070 W/(m K). De Rubeis et al. [18,19,20,21] investigated the insulating capacity of blocks printed from PLA filaments using FDM technology. They showed a significant effect of the complexity of the internal geometry of the block structure and the type of waste material used (polystyrene, wood sawdust, wool, and hemp) placed inside the printed blocks on their thermal properties. Of all the internal structures tested, the most complex honeycomb structure showed the best insulating properties (U = 1.22 W/(m2·K)). In addition, filling the honeycomb block with waste insulation materials significantly improved its insulating properties, reducing the transmission coefficient to 0.53 W/(m2·K), or about 57%.
The structure of cellular and porous bodies is the subject of continuous research by scientists and engineers. Modern analytical techniques allow a better understanding of their properties. The range of materials from which they can be made is also constantly expanding, offering new possibilities for their application [49].

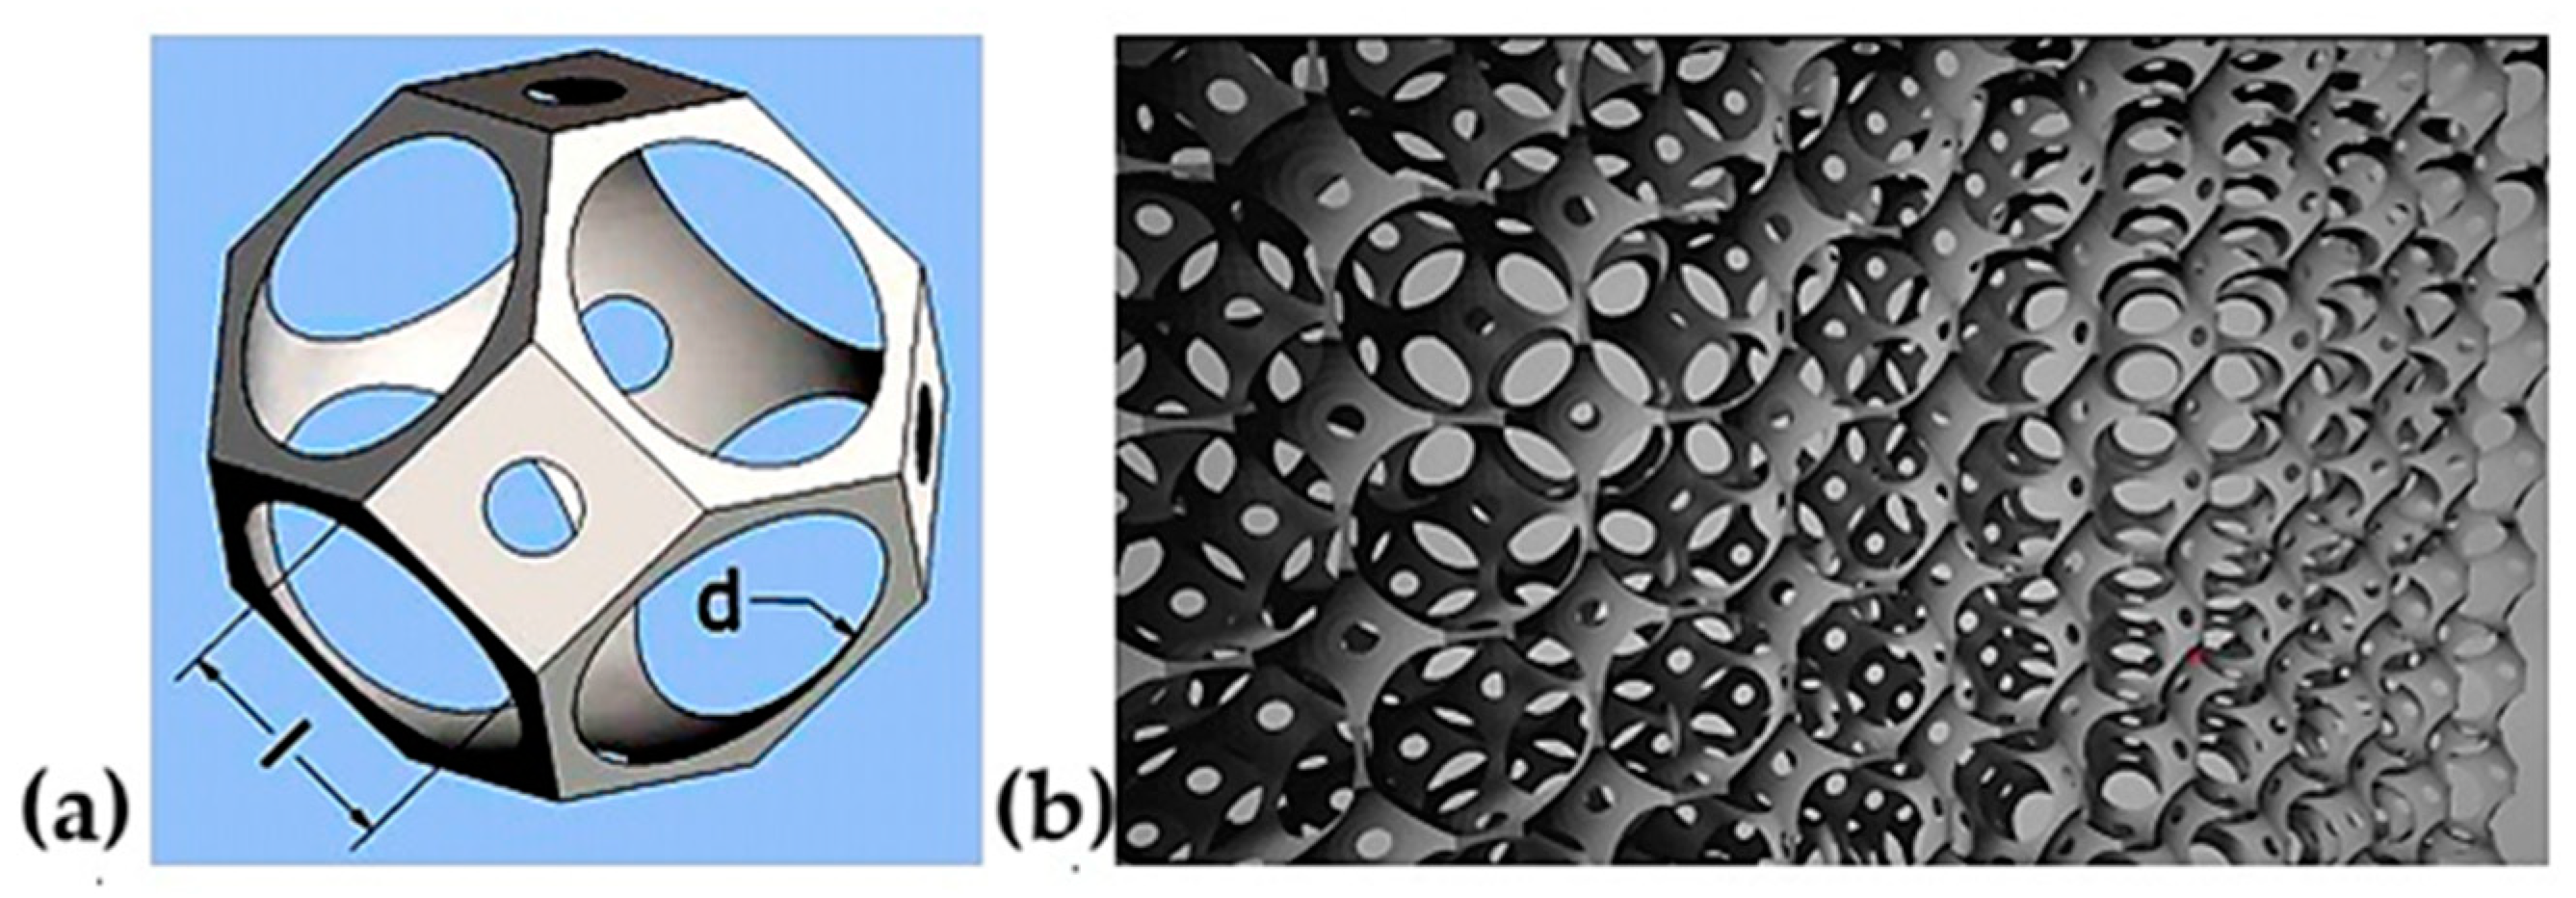
1.2. A Virtual Model of a Sandwich Composite with a Kelvin Cell Foam Core

The study of the structure of cellular materials began in the 1760s when Robert Hook used the term “cell” to describe the structure of cork [51]. Later, William Thomson (Lord Kelvin) defined a single cell of a cellular material structure as a tetracahedron, which was later named Kelvin’s tetrahedron [51]. Kelvin’s tetrahedron is shown in Figure 1a. It is a solid consisting of six square faces and eight regular hexagonal faces, where each edge has the same length [52]. In order to satisfy the minimum area condition and fill the space well, the solid must be slightly deformed. The square walls must have curved edges, while the hexagonal walls must have curved faces. Figure 1b shows the Kelvin structure [51].
To create a model of the open-cell foam, two parameters were used to define it, namely l, which corresponds to the length from node to node (the length of the edge of the Kelvin tetrahedron), and dp, which is the diameter of the pores (the sphere that cuts the tetrahedron from the inside), as seen in Figure 2 [51]. In the model, the parameters that determine the shape, size, and curvature of the struts connecting the nodes have been omitted. To obtain the structure of the foam, a sphere with a diameter dp equal to the diameter of the pores was cut into the tetrahedron (Figure 2a), and the resulting solid was multiplied to form an open-cell foam model (Figure 2b).
Porosity ε is used to describe open-cell foam materials. It is defined as the ratio of the volume Vf of the fluid inside the Kelvin tetrahedron to the volume V of the entire tetrahedron [51]:
ε = V f V
Its volume V can be written with the following formula [51]:
V = 8 2 · l 3
In order to determine the porosity ε, it is still necessary to know the relations that allow the determining of the volume Vf. It can be described as the volume of the sphere that cuts out the tetrahedron Vsp, excluding the parts that are outside the area of the Kelvin tetrahedron (Figure 3) [51]:
In practice, porosity can be determined by directly reading the volume Vs of a single cell in Inventor’s iProperties tab, or by creating functions to determine the volume Vf [51].
The microscopic structure of open-cell foams has a significant impact on their thermo-physical properties. The solid matter in cellular insulation is only 2% to 4% of the volume. Therefore, the way it is distributed in the foam material greatly affects the physical properties. Pore size plays an important role in determining thermal properties. Large pore sizes increase the contribution of convection and radiation to heat transfer and therefore increase the thermal conductivity coefficient (λ). As cell dimensions are reduced, the λ coefficient decreases. However, there is a minimum pore size, beyond which an increase in the coefficient is observed due to an increase in the contribution of solid conduction [18].
To determine the properties of open-cell foams, viral models and correlations are being developed that take into account their geometry [52]. However, currently developed models that relate the geometry of foams to their properties are not yet perfect. Many studies are limited to a small range of porosities. In addition, these models are not always fully consistent with actual structures. Establishing a correct description of foam geometry is of great importance for the evaluation of heat transfer in these materials [11]. The thermal properties of foams can be improved by manipulating the distribution of material in their structure. This is very difficult to do with conventional manufacturing techniques, which is why additive techniques are seen as having great potential. Three-dimensional printers can print with high accuracy the optimal open-cell foam structures created by precisely controlling the geometry of the struts. As a result, CAD files can be generated that are ready for additive manufacturing, where there are no geometric limitations imposed by current manufacturing techniques [11].
The literature review presented here shows that there is still a lot of research potential in the use of additive technologies for the production of printed building components. Therefore, the authors of this article focused on the search for advanced thermal insulation solutions that could contribute to improving the energy efficiency of buildings, cooling systems, equipment, or installations. Therefore, the objective was to experimentally study prototypes of cellular materials produced by 3D additive technologies (SLS and DLP), and based on this, to perform an analysis of their thermal insulation properties. Based on the analysis, which of the tested materials could be used as thermal insulation was determined.

2. Materials and Methods
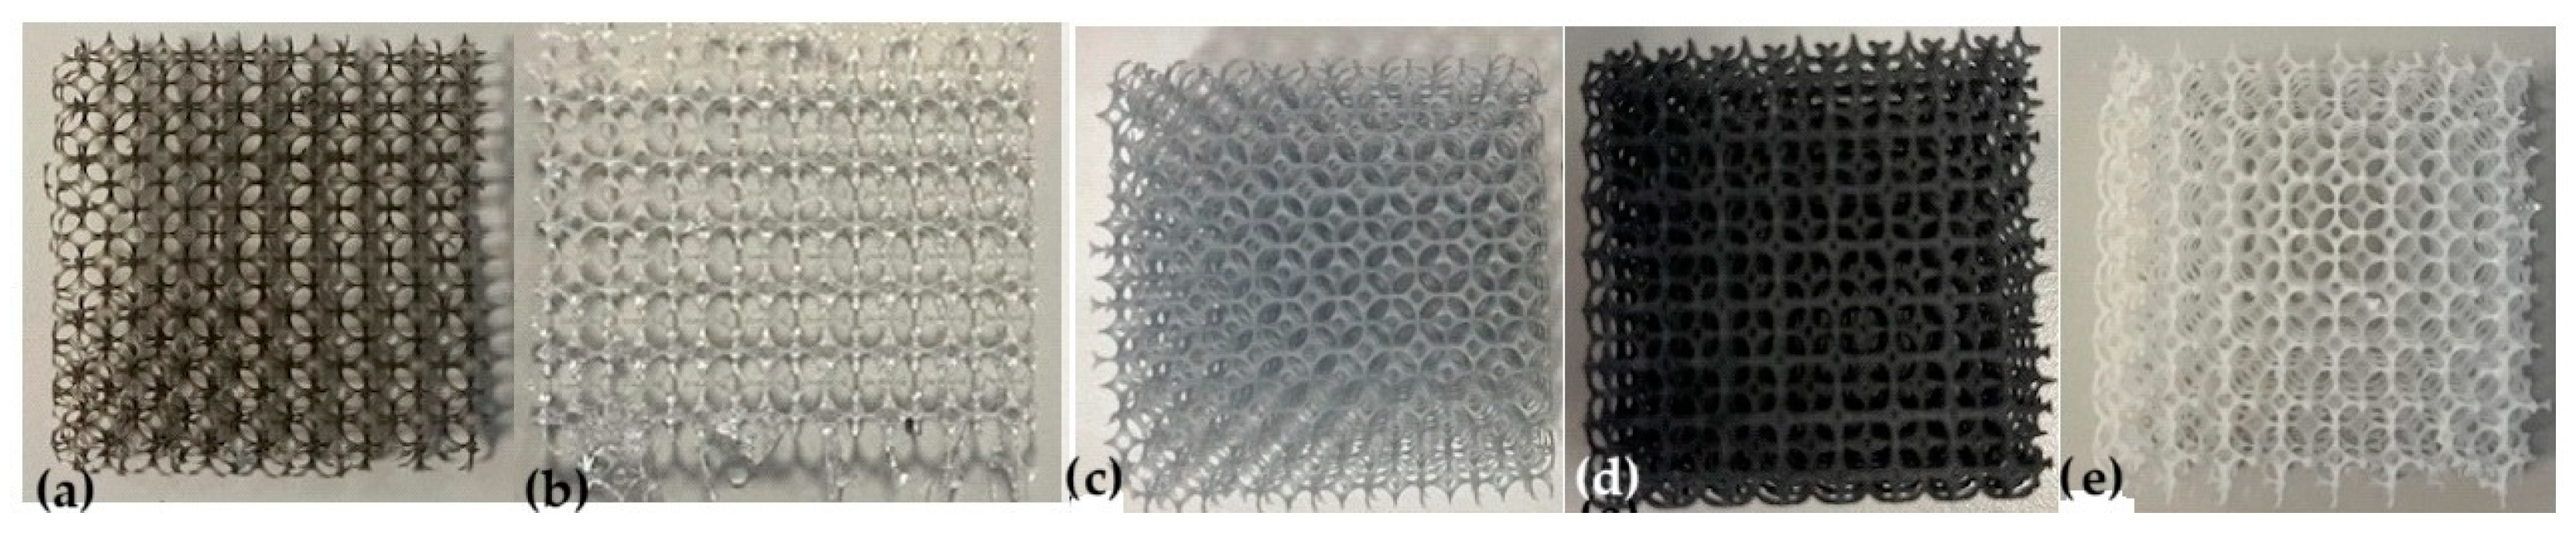
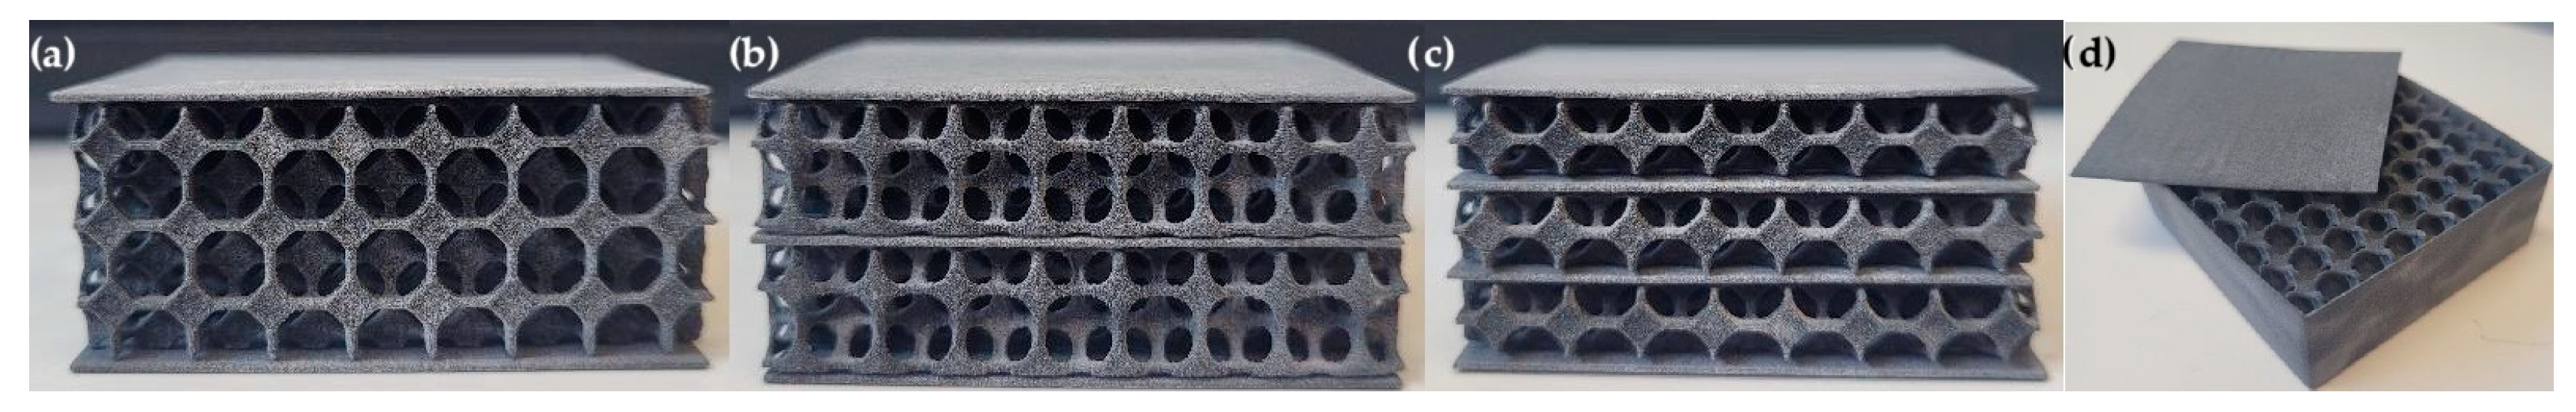
2.1. Materials

Autodesk Inventor was used to model the structure of the prototype open-cell materials. Equations (4) and (5) were entered so that the value of the material porosity ε was automatically calculated when the node spacing l and the pore diameter d were set. Based on previous studies by the authors [45,48], materials with a pore diameter d = 6 mm and a porosity ε = 0.95 produced by SLS technology from PA12 polymer (Synterit, Cracow, Poland) and by DLP technology using UV resins (Shenzhen Anycubic Technology Co., Shenzhen, China) with different emissivity, gray, black, transparent, and white based on soybean oil, were selected. In addition to the above independent variables, additional parameters such as the number of layers in the composite and its total thickness were used. In the end, 40 variants of prototype cellular composites were produced, each in triplicate, for a total of 120 samples tested. Single-layer, double-layer, and triple-layer samples were prepared with a composite thickness of 20 mm (analogous to thermal packaging or window frames; as seen in Figure 4, the total number of variants was 15 pieces in 3 replicates, i.e., a total of 45 samples), as well as single-layer composite samples with a thickness of 40, 60, and 80 mm. This made a total of 45 samples (analogous to typical window frames, whose thickness varies from 50 to about 80 mm). Single-layer and five-layer samples with a composite thickness of 100 mm (analogous to thermal insulation in buildings, refrigeration equipment, etc.)—as shown in Figure 5. The total number of specimens was 10 pieces in 3 replicates, for a total of 30 samples. Figure 6 shows the printed inner cores of the samples. On the other hand, the printed specimens also had both external and internal flat surfaces, with the layering of the composite structure made of the same material as the cellular composite cores themselves, as seen in Figure 7. A detailed description of the specimen fabrication method can be found in the authors’ previous publications [45,48].

2.2. Experimental Procedure

The tests were conducted following the ISO 9869-1:2014 standard [53,54] using a test bench available at the Faculty of Mechanical and Power Engineering, Wroclaw University of Science and Technology, within the Department of Energy Conversion Engineering. The setup included an Aisberg LP15 C15 freezer (MELIS, Poznań, Poland), an FHF04SC heat flux sensor (Hukseflux Thermal Sensors B.V., Delft, The Netherlands), 4 thermocouples (K-type thermocouple), as well as a temperature and heat flux recorder. A diagram of the setup is presented in Figure 8.
The values of thermal resistance coefficient (R) and heat transfer coefficient (U) were calculated according to the “average method” proposed in ISO 9869 [54]:
R = j = 1 n T s , i n , j T s , o u t , j j = 1 n q j
U = j = 1 n q j j = 1 n T s , i n , j T s , o u t , j
where j = 1 n T s , i n , j T s , o u t , j is the average temperature difference between the inner and outer surfaces, and j = 1 n q j is the average heat transfer density.
Based on ISO 6946 [53], the heat transfer direction was assumed to be horizontal. This assumption allowed the selection of the corresponding thermal resistance coefficients for the inner air layers Rsi = 0.13 (on the negative ambient temperature side) and the outer air layers Rse = 0.04 (on the positive ambient temperature side). In this way, the total heat transfer coefficient was determined, taking into account the external conditions on both sides of the cellular composite sample tested on the test bench.
Each test lasted approximately 24 h with a recording time step of 5 min. Measurements were taken after thermal equilibrium was reached. This state was considered achieved when the temperature fluctuation on the surface of the samples did not exceed 0.5 °C for 1 h during successive measurements. This was recorded by monitoring the stability of the measured values (q, Tg, Td). In addition, each measurement performed was repeated three times to obtain more accurate results. Samples of prototype sandwich composites were tested in boxes printed in the same manner and made of the same material as the composites. The measurement uncertainties for the samples tested were 0.03~0.04 W/(m2·K) for the coefficient heat transfer coefficient (U).

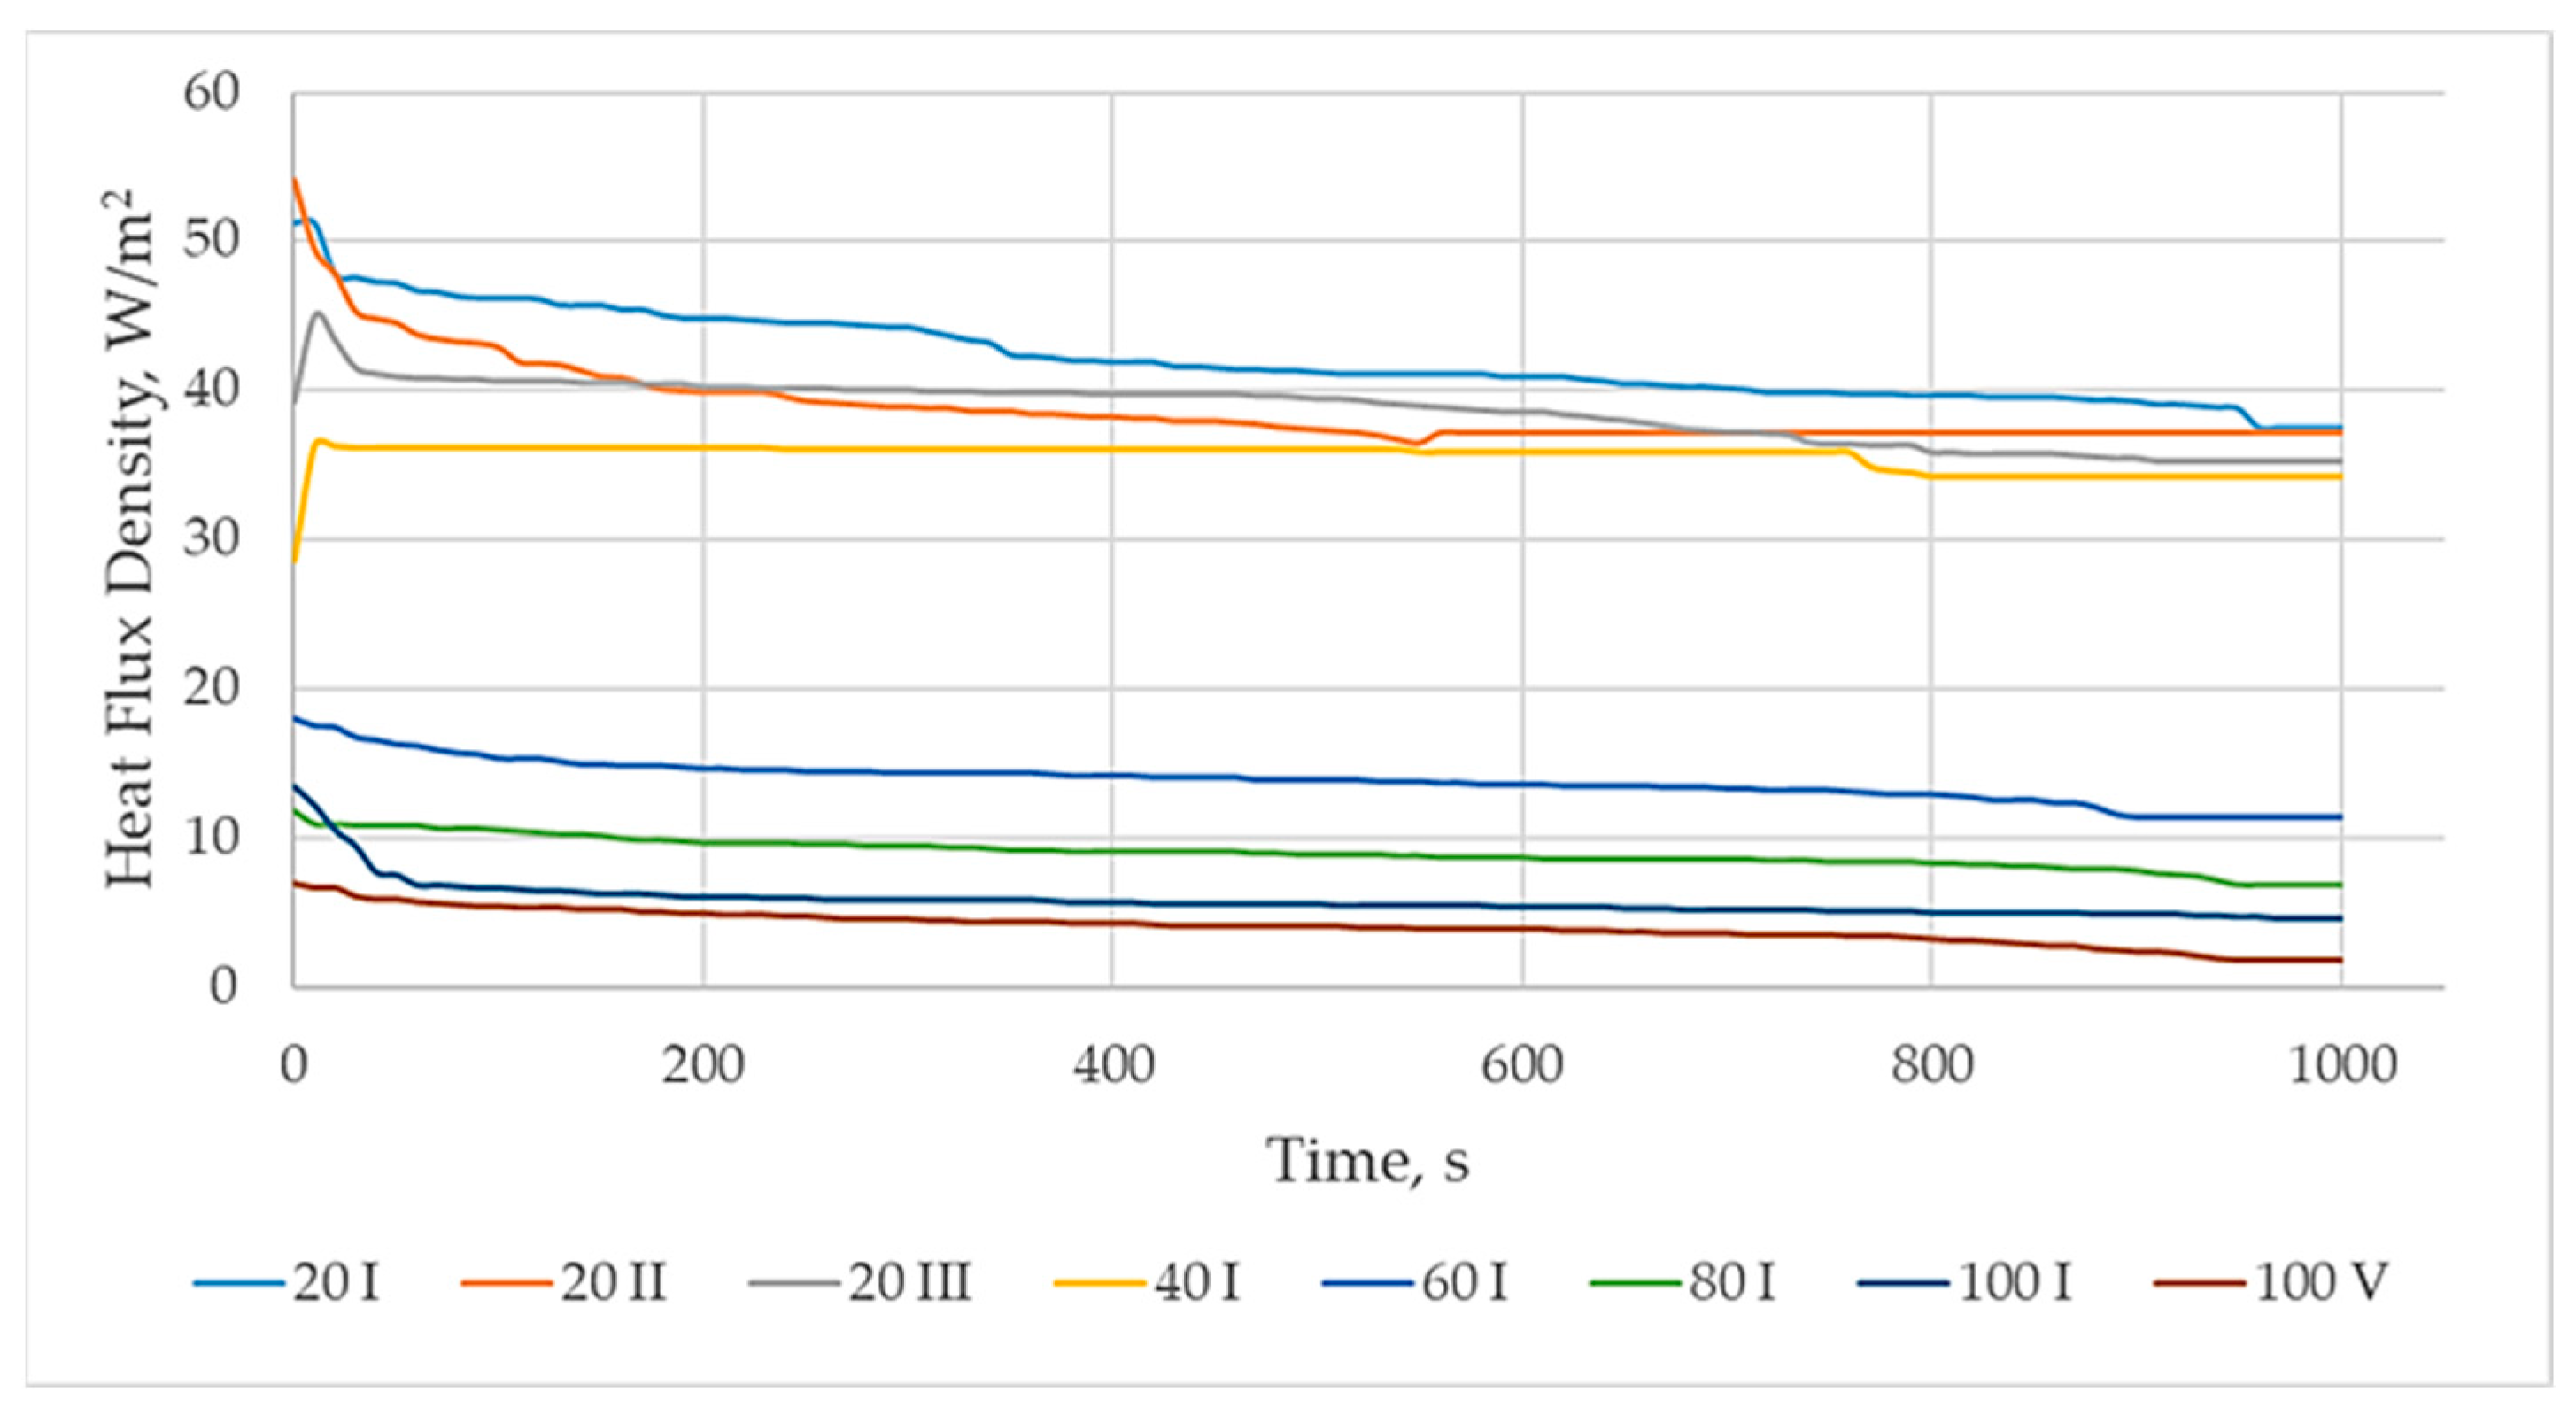
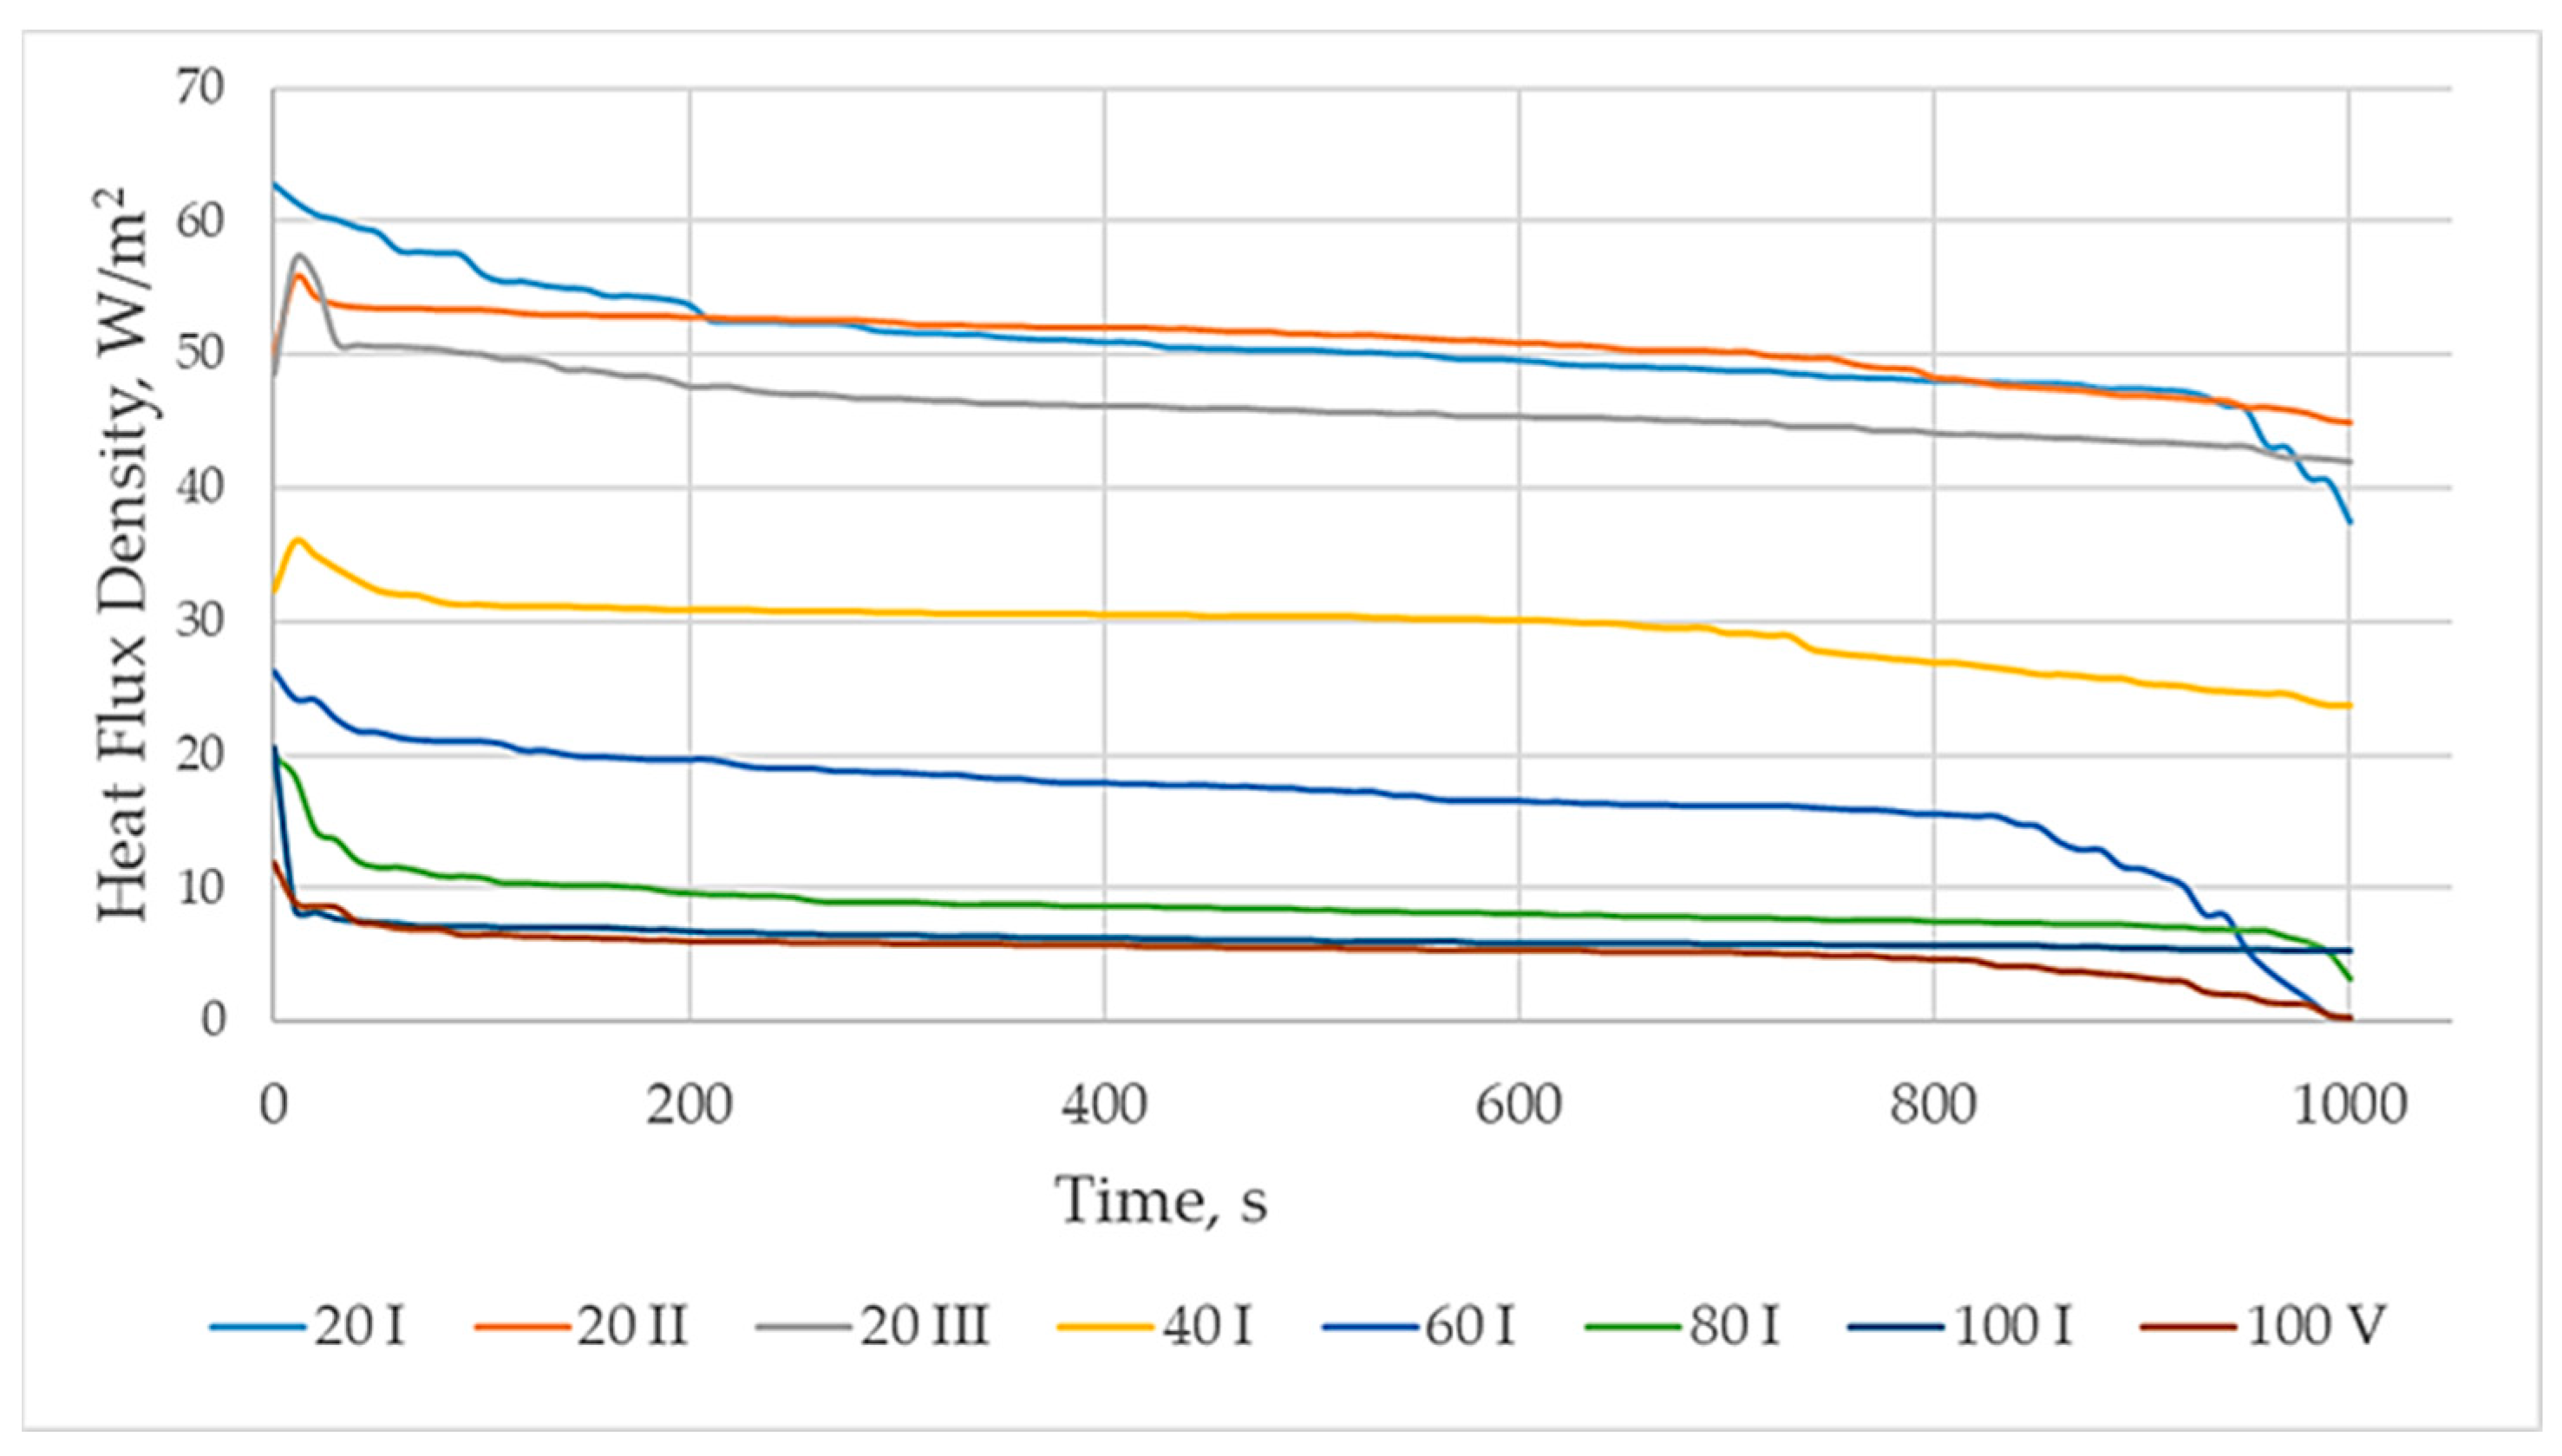
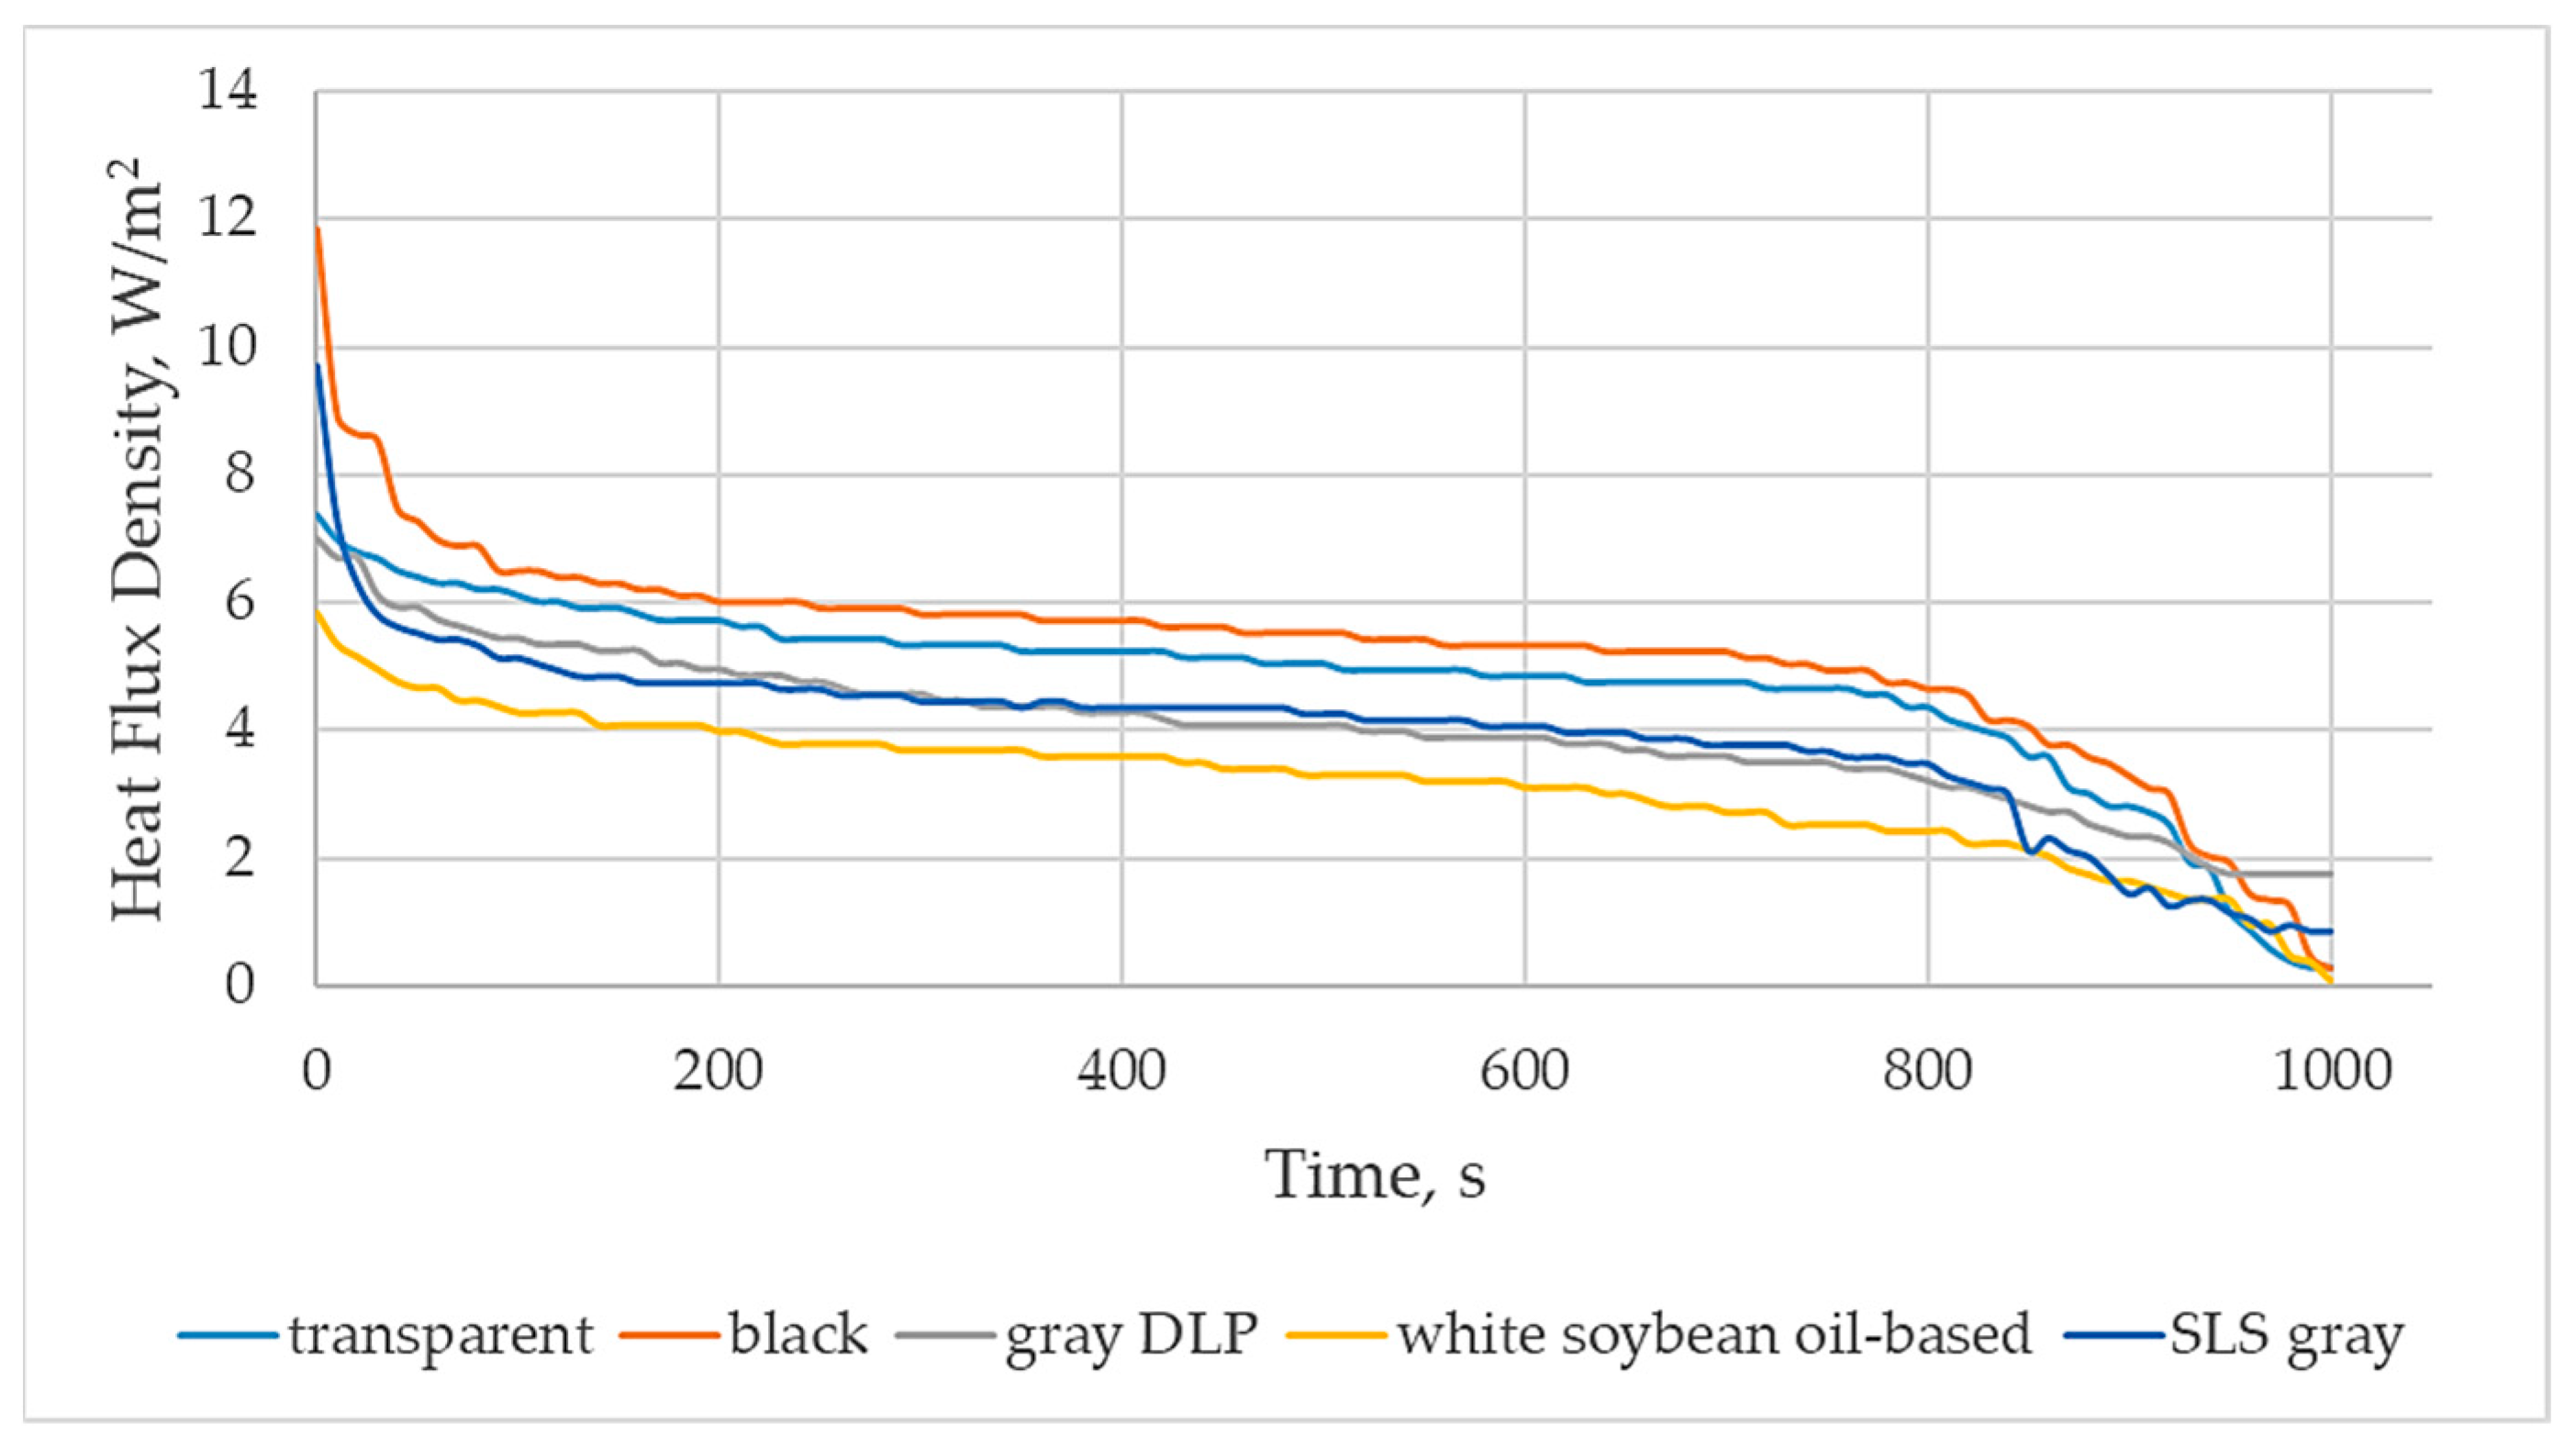
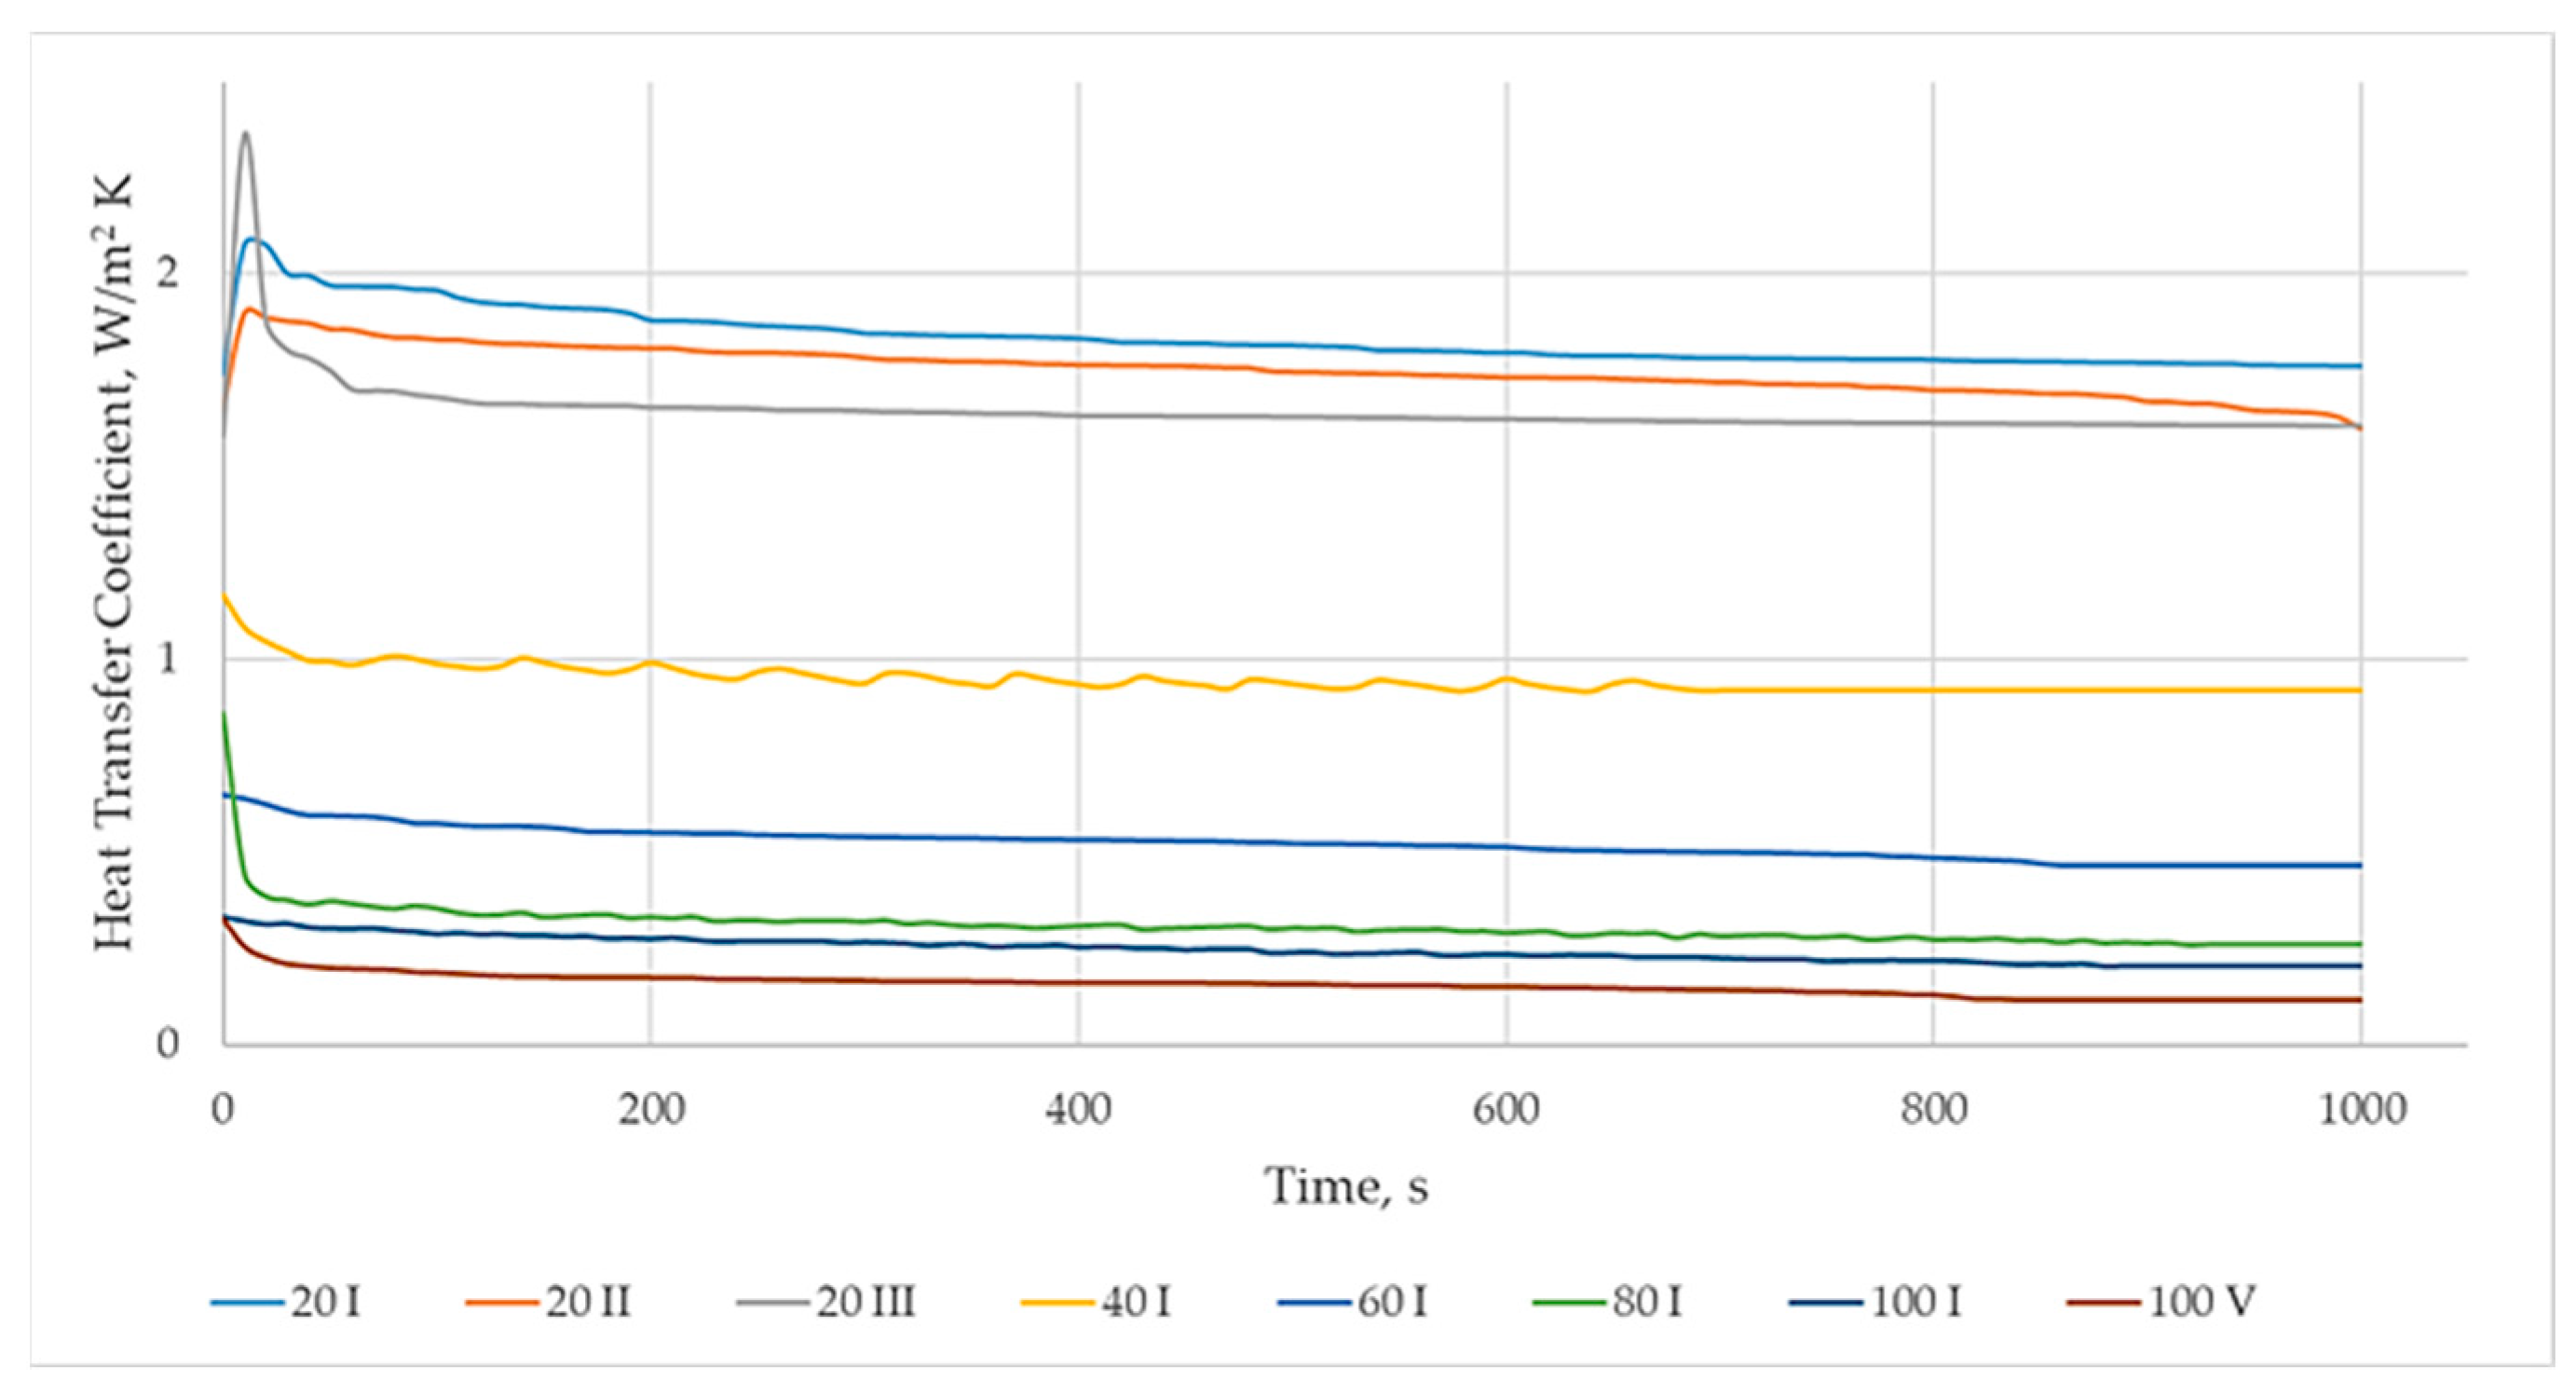
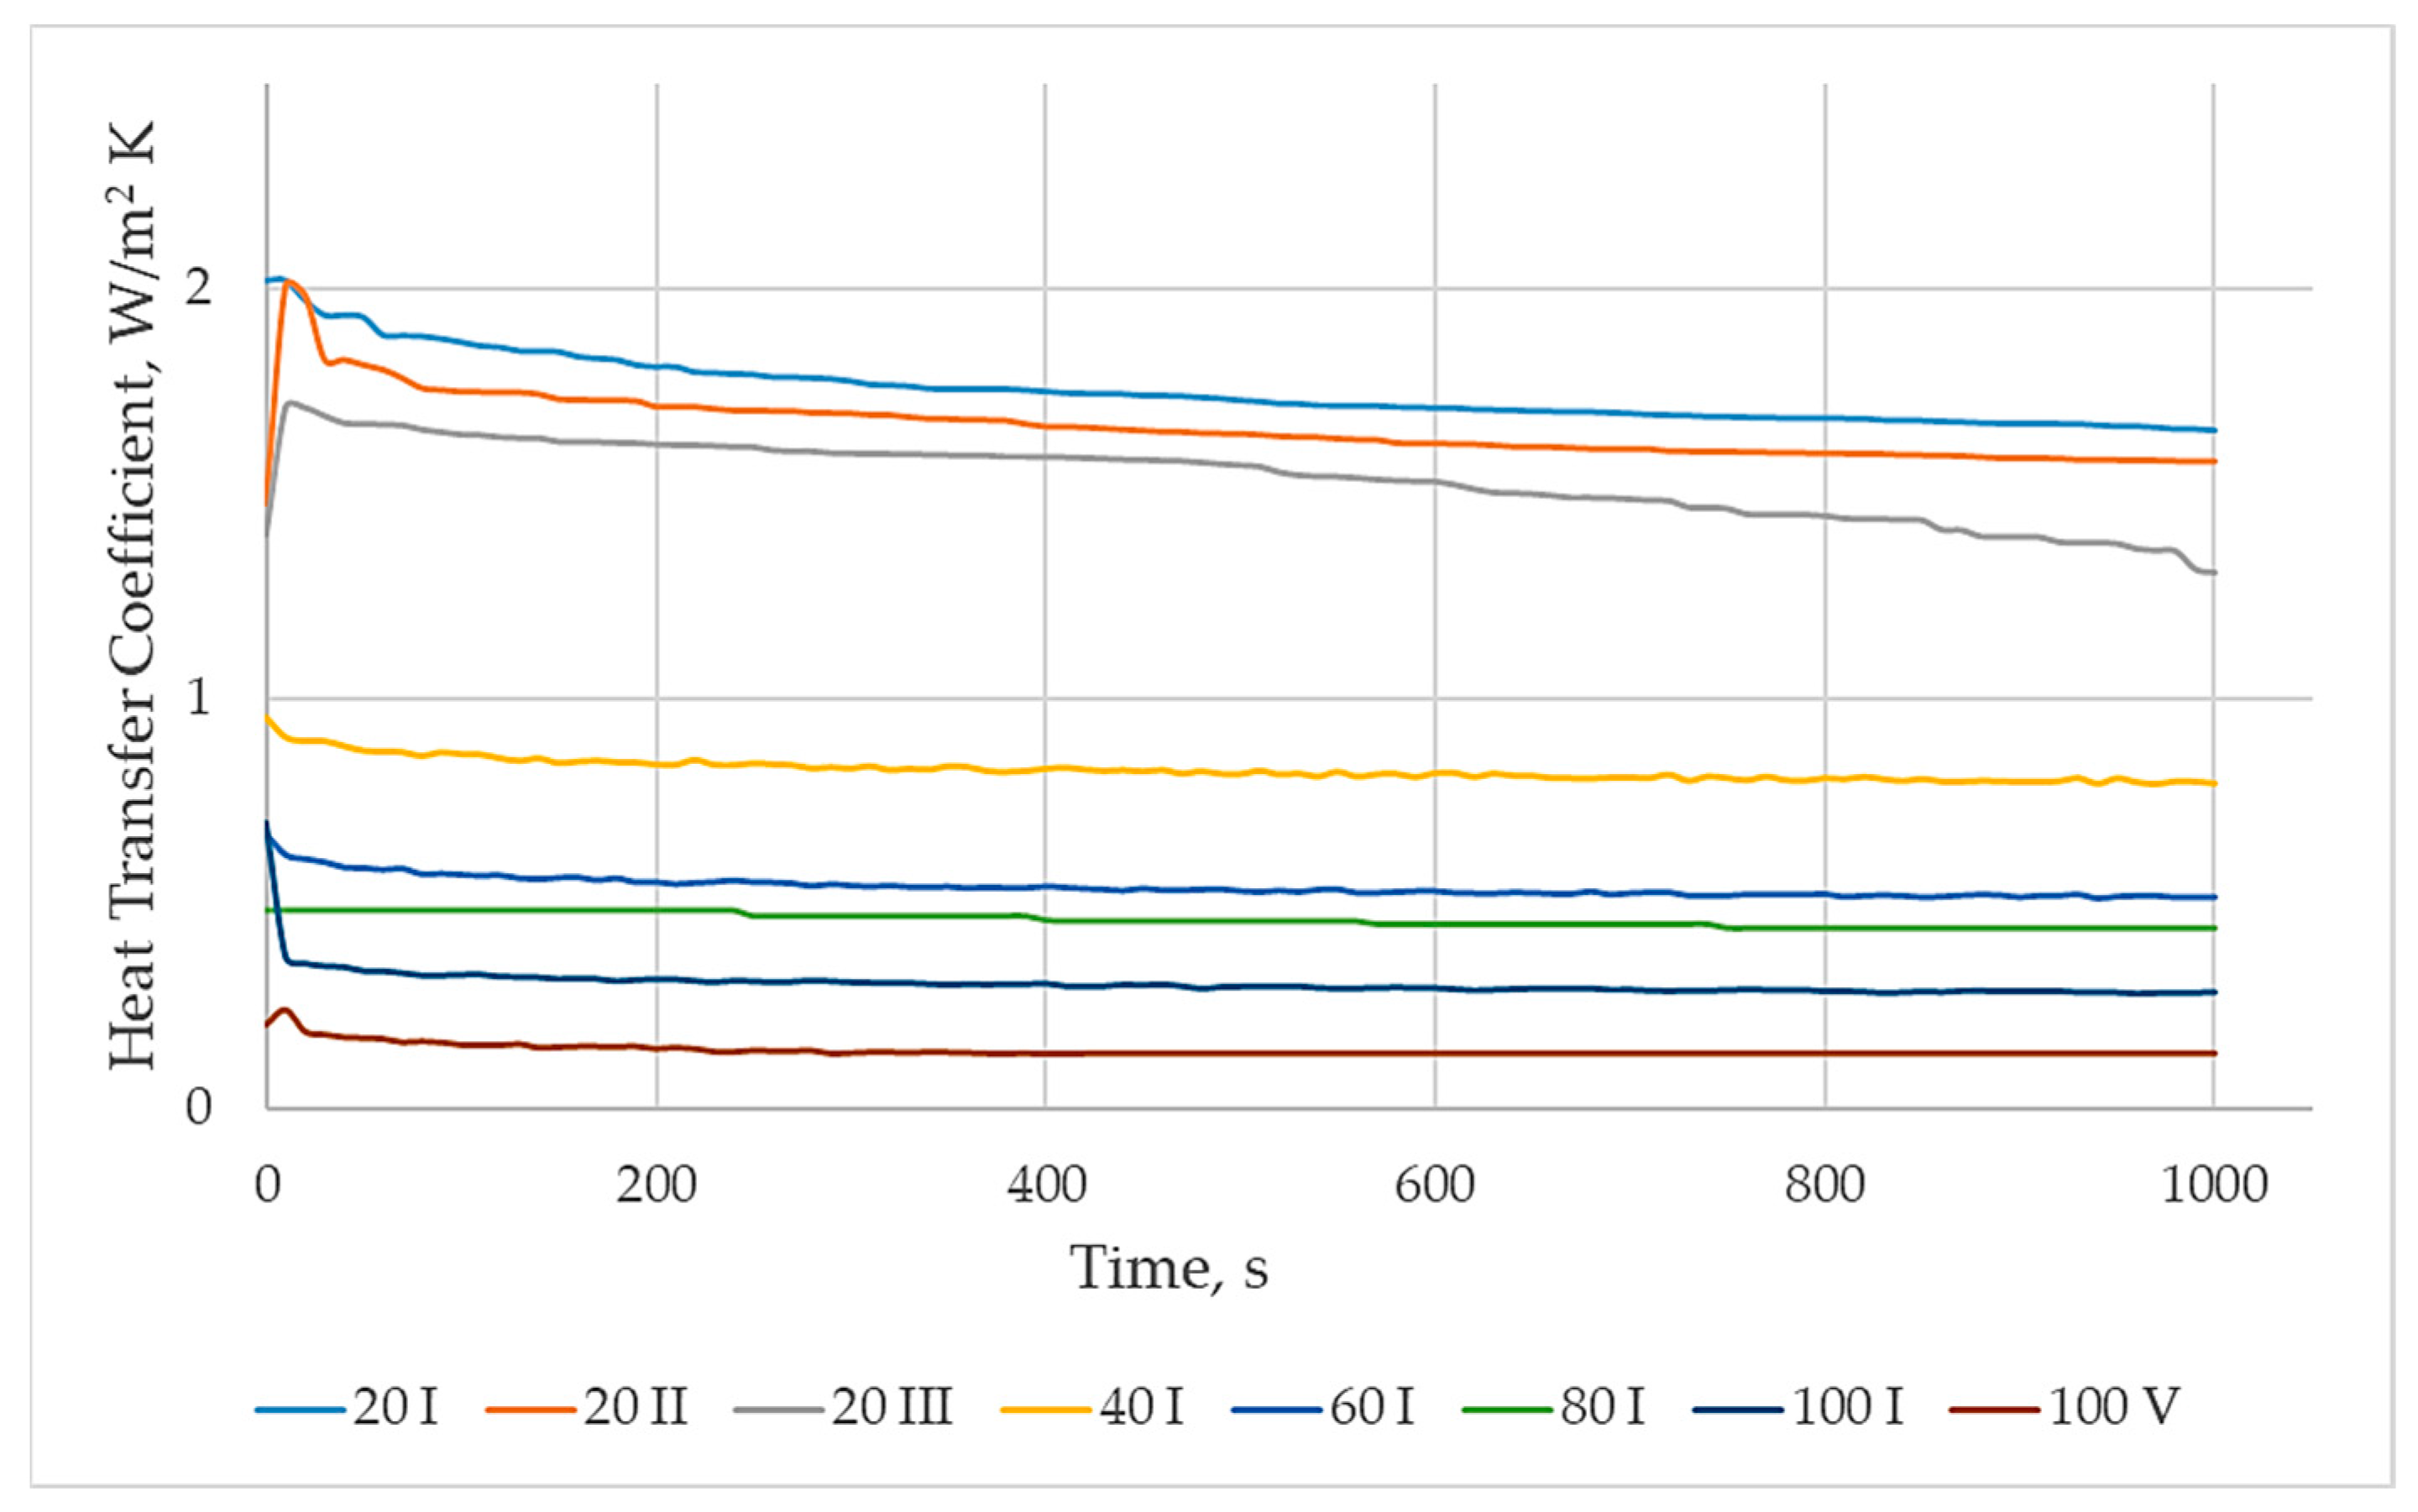
3. Results and Discussion

The purpose of the study was to evaluate the thermal properties of the printed composites for the potential use of the materials as thermal insulation, according to ISO 9869-1:2014 [54]. The results obtained were compared according to the type of resin, the number of layers, and the thickness of the composite. In each case, three series of measurements were taken and averaged under stabilized temperature conditions. The average temperature difference between the outside and inside of the cooling chamber was 10 °C.
Statistical analyses were performed using tools provided by STATISTICA 13 (TIBCO Statistica, Palo Alto, CA, USA). A significance threshold of p ≤ 0.05 was used, in accordance with common practice in thermal insulation research. The measures of position and dispersion were determined first, and their summary results are shown in Table 2, Table 3 and Table 4.
As shown in Table 2, the values of the heat transfer coefficient (U) of single, double, and triple layer composite samples with a thickness of 20 mm ranged from 1.04 to 1.87 W/(m2·K). The mean value was 1.47 W/(m2·K) and the standard deviation was 0.25 W/(m2·K). The value of the heat transfer coefficient for half of the tested samples did not exceed 1.55 W/(m2·K). The tested samples had a high kurtosis value of K = −1.09, which means that the results were clustered around the mean.
For single-layer samples with composite thicknesses ranging from 20 to 100 mm, the values of the heat transfer coefficient (U) varied from 0.14 to 1.15 W/(m2·K), with a mean of 0.59 W/(m2·K) and a standard deviation of 0.34 W/(m2·K). In this case, the value of the heat transfer coefficient for half of the tested samples did not exceed 0.55 W/(m2·K). The tested samples reached a high kurtosis value of K = −1.13, which means that the results were clustered around the mean.
On the other hand, the heat transfer coefficient (U) for single and five-layer samples with a composite thickness of 100 mm (Table 4) varied from 0.14 to 0.24 W/(m2·K), with a mean of 0.19 W/(m2·K) and a standard deviation of 0.02 W/(m2·K). The value of the heat transfer coefficient for half of the tested samples was 0.20 W/(m2·K).
Another test was to evaluate the significance of the effect of the input quantities on the insulation performance. A multi-criteria ANOVA analysis of variance was used to determine this effect. The results are presented in Table 5, Table 6 and Table 7.
The analysis of Significance Level (p) values in Table 5, Table 6 and Table 7 shows that values less than 0.05 indicate a significant effect of material type and composite layering (Table 5) and material type, composite thickness, and layering (Table 6 and Table 7) on the value of heat transfer coefficient (U) of the tested materials produced by 3D DLP printing technology.
The results of the analysis of variance (Table 5, Table 6 and Table 7) showed that there was an effect of the material type, the composite thickness, and the number of layers on the thermal performance of 3D-printed composites, as evidenced by the value of the p parameter. Based on the high value of the strength of the influence (F), the statistical significance of the interaction of linear factors was also demonstrated. It can be concluded that the thickness of the composite and the number of layers used in the experiment is a highly dominant factor compared to other input factors.
A graphical analysis of the obtained results of heat flux density (q) of the tested samples is shown in Figure 9, Figure 10, Figure 11, Figure 12 and Figure 13.
In addition, to better illustrate the effect of the material used to make the samples on the values of the heat flux (q), Figure 14 shows the variation of the heat flux (q) over time for five-layer samples with a thickness of 100 mm. The lowest values of heat flux density, from 3 to 5 W/m2, were obtained for this type of composite, which had the best energy efficiency compared to other composites.
From the results shown in Figure 9, Figure 10, Figure 11, Figure 12, Figure 13 and Figure 14 for 20 mm thick single, double and triple layer composites, it can be seen that gray resin samples prepared by DLP technology (Figure 11) had a lower value of heat flux density (q = 41 W/m2) than gray nylon samples prepared by SLS technology, i.e., q= 48 W/m2 (Figure 9). By far the lowest values of heat flux density were characterized by soybean oil-based resin triple layer samples (Figure 10) and amounted to q = 36 W/m2. Thus, the highest value of heat flux density compared to the gray and white resin samples was characterized by the transparent and black resin samples. From the results shown in Figure 9, Figure 10, Figure 11, Figure 12, Figure 13 and Figure 14, it can be further concluded that there is a relationship between the number of layers (n) in the composite and the heat flux density values obtained. Samples with n = 3 layers had lower heat flux density values than samples with n = 2 and samples with n = 1. For a single layer sample with a thickness of 40 mm, the heat flux density values are in the range of q = 27.8–35.7 W/m2, while for composite samples with thicknesses of 60 mm, 80 mm, and 100 mm, the heat flux density values were in the ranges of q = 13.8–23.2 W/m2, q = 8.8–12.7 W/m2, and q = 5.7–8.7 W/m2, respectively. The best insulation was obtained for the white resin composite and the worst for the transparent resin samples. Figure 14 shows a comparison of the variation of heat flux (q) over time for five-layer samples with a thickness of 100 mm. The lowest values of heat flux density were obtained for the soybean oil-based resin samples, which amounted to q = 3.17 W/m2. On the other hand, the highest value of heat flux density was obtained for the black resin samples, q = 5.30 W/m2.
A graphical analysis of the obtained results of heat transfer coefficient (U) values is shown in Figure 15, Figure 16, Figure 17, Figure 18, Figure 19 and Figure 20.
To better illustrate the effect of the material used to make the specimens on the values of the heat transfer coefficient (U), Figure 20 shows the variation of the heat transfer coefficient (U) for five-layer specimens with a thickness of 100 mm. The lowest values of the heat transfer coefficient (U), from 2.4 to 1.4 W/(m2·K), were obtained for this type of composite, demonstrating its best energy efficiency compared to the other composites.
From the results shown in Figure 15, Figure 16, Figure 17, Figure 18 and Figure 19 for 20 mm thick single, double, and triple layer composites, it can be seen that the gray resin samples prepared by DLP had a lower heat transfer coefficient (U = 1.10 W/(m2·K)) than the gray nylon samples prepared by SLS (U = 1.41 W/(m2·K)). On the other hand, the soybean oil-based resin samples had the lowest heat transfer coefficient (U = 1.04 W/(m2·K)) and thus the highest thermal resistance (R) coefficient compared to the gray, black, and transparent resin samples. The transparent (U = 1.53 W/(m2·K)) and black resin composites had the highest thermal transmittance and thus the lowest thermal transfer coefficient. This indicates that the soybean oil-based resin composite produced by DLP technology had the best insulating properties for a 20 mm thick sample. From the results shown in Figure 15, Figure 16, Figure 17, Figure 18 and Figure 19, it can be further concluded that there is a relationship between the number of layers (n) in the composite, the obtained values of the heat density flux, and the thermal transfer coefficient. Samples with the number of layers n = 3 had a lower heat transfer coefficient and a lower heat flux density value than samples with n = 2 and samples with n = 1.
Analyzing the results shown in Figure 15, Figure 16, Figure 17, Figure 18, Figure 19 and Figure 20, it can also be concluded that for the fabricated cellular composites with an inner core structure based on the 3D-printed Kelvin structure, the energy efficiency improved when the number of layers was increased at the same thickness of the composites (e.g., at the studied thicknesses of 20 mm and 100 mm), as evidenced by the decreasing of the heat transfer coefficients (U). In addition, the tendency of the thermal properties of the composites to change depending on the type of material from which the insulation was made was shown. The values of the heat transfer coefficients (U) for different materials as a function of the thickness of the composites were as follows. For 20 mm thick composites, they were in the range of U = 1.04–1.65 W/(m2·K), with the lowest value for a composite sample made of white soybean oil-based resin (U = 1.04 W/(m2·K)) and the highest value for a composite made of transparent resin (U = 1.53 W/(m2·K)). For the 40 mm thick sample, the values of the heat transfer coefficient were in the range of U = 0.70–0.82 W/(m2·K), with the lowest value obtained for the sample with oil-based resin (U = 0.70 W/(m2·K)) and the highest value for those made of transparent resin (U = 0.82 W/(m2·K)). This was also the case for for composite samples with a thickness of 60 mm (U = 0.46–0.58 W/(m2·K)), 80 mm (U = 0.270–0.33 W/(m2·K)), and 100 mm (U = 0.14 to 0.21 W/(m2·K)) with the same combination, i.e., the best insulation was obtained for the white resin composite and the worst for the transparent resin samples. The good insulating properties of the soybean oil-based resin composites are mainly explained by the value of the emissivity coefficient (e) for the white resin. White-colored samples have a relatively low emissivity coefficient. In addition, they effectively reflect light, resulting in lower energy absorption and heat emission. However, although the best U-value in each test was obtained for the soybean oil-based resin samples, all materials were near to the requirements of ISO 9869-1:2014 [54], where the U-value for the building envelope should not exceed U = 0.2 W/(m2·K).
Comparing the obtained thermal parameters with typical building materials [17,53,55], it can be concluded that the proposed 3D-printed composites have similar or even better (lower) heat transfer coefficients, among others, than materials used as typical thermal insulation in buildings (polystyrene, mineral wool). It is also worth mentioning the use of 3D-printed materials for thermal insulation in the production of window frames. In the case of windows, their thermal insulation depends on both the glazing set and the window frame. Typical window frames are tens of millimeters thick and range from 50 to about 100 mm [56]. For such geometries, the heat transfer coefficient (Uf) of typical PVC window frames ranges from Uf = 0.8 to 1.4 W/(m2·K) [56]. If the analyzed 3D-printed composites were used to fill window frames or fabricate entire window frames using 3D printing technology, the estimated Uf would be in the range of U = 0.14 to 0.21 W/(m2·K) (for a 100 mm thick frame) to U = 0.46 to 0.58 W/(m2·K) (for a 60 mm thick frame).
The results indicate a great potential for the use of thermally tested cellular composites as window frame fillers. However, the design and selection of window frames must meet a number of requirements other than a low heat transfer coefficient (U) to minimize energy loss. One of the most important features, specifications, and barriers associated with window frames is mechanical resistance. Window frames must be able to withstand a variety of loads, including wind pressure, especially in taller buildings and high wind climates; accidental impacts, such as during cleaning; and temperature changes. Window frames must be able to withstand the expansion and contraction of materials under the influence of temperature, which can cause deformation. Barriers can include the difficulty of achieving appropriate standards while maintaining an attractive appearance and price. Durability and weather resistance are also important parameters, according to the authors. Therefore, the next step will be to determine the mechanical properties of such structures and to investigate the thermal stability of the composites using DSC/TG testing.
Currently, the 3D printing of large industrial equipment faces some difficulties, mainly related to technological limitations such as printing speeds and production costs. However, with the rapid development of the industry, it is expected that printing speeds will increase and production costs will decrease in the near future. This will open up opportunities for the use of 3D printing in new industries and for more complex projects, such as the construction of large industrial equipment, infrastructure, or advanced engineering structures.

4. Conclusions

Based on the research, it was shown that the use of 3D printing has a high potential for improving the thermal properties of insulating materials. The obtained values of heat transfer coefficients indicate the possibility of producing energy-efficient biodegradable thermal insulations and their wider use, not only in construction but also in other industries and packaging.
Based on the conducted research and analysis, the following conclusions were drawn.
1. The lowest thermal transmittance (U) was obtained for prototype insulating partitions with a core structure based on the Kelvin foam model produced by 3D DLP printing technology from a soybean oil-based resin with a pore diameter of 6 mm and porosity of 0.95 for a composite thickness of 100 mm–0.147 W/(m2·K).
2. Increasing the number of layers (for the same material thickness) significantly increased the thermal insulation of the printed structure. For a 20 mm thick sample, a reduction in U-value of approximately 20% was observed for three-layer composites, resulting in a value of U = 1.06 W/m2·K. For a composite thickness of 100 mm, increasing the number of layers from one to five reduced the U-value by 30%, giving a U-value of 0.147 W/m2·K for the five-layer variant.
3. The best choices for resin color were white and gray, which have the lowest heat transfer coefficients of U = 0.147–0.20 W/m2·K (for a sample thickness of 100 mm). On the other hand, the worst thermal properties were characterized by samples made of transparent and black resin, for which the U-value ranged from 2.11 to 2.21 W/m2·K for five-layer samples of 100 mm thickness.
The results obtained prompted the authors to plan further studies on the cellular composites analyzed in the paper, such as determining their mechanical properties (including their compressive strength and impact strength). In addition, it seems important to investigate the thermal stability of the composites by performing DSC/TG tests. The authors’ future research directions also include optimizing the thermal and mechanical properties of 3D-manufactured insulation materials using renewable or biodegradable raw materials. In order to lead the innovation of multifunctional and smart insulation materials, the improvement of printing processes seems to be the key in this field at the moment.

Author Contributions

Conceptualization, B.A., methodology, B.A.; software, B.A.; validation, B.A., writing—original draft preparation, B.A. and P.S.; writing—review and editing, B.A. and P.S.; visualization, B.A.; supervision, B.A. and P.S.; funding acquisition, B.A. and P.S. All authors have read and agreed to the published version of the manuscript.

Funding

This research received no external funding.

Data Availability Statement

Data are contained within the article.

Conflicts of Interest

The authors declare no conflicts of interest.

References

  1. Zhang, Y.; Hu, S.; Guo, F.; Mastrucci, A.; Zhang, S.; Yang, Z.; Yan, D. Assessing the Potential of Decarbonizing China’s Building Construction by 2060 and Synergy with Industry Sector. J. Clean. Prod. 2022, 359, 132086. [Google Scholar] [CrossRef]
  2. Rissman, J.; Bataille, C.; Masanet, E.; Aden, N.; Morrow, W.R.; Zhou, N.; Elliott, N.; Dell, R.; Heeren, N.; Huckestein, B.; et al. Technologies and Policies to Decarbonize Global Industry: Review and Assessment of Mitigation Drivers through 2070. Appl. Energy 2020, 266, 114848. [Google Scholar] [CrossRef]
  3. Harputlugil, T.; de Wilde, P. The Interaction between Humans and Buildings for Energy Efficiency: A Critical Review. Energy Res. Soc. Sci. 2021, 71, 101828. [Google Scholar] [CrossRef]
  4. Huang, H.; Zhou, Y.; Huang, R.; Wu, H.; Sun, Y.; Huang, G.; Xu, T. Optimum Insulation Thicknesses and Energy Conservation of Building Thermal Insulation Materials in Chinese Zone of Humid Subtropical Climate. Sustain. Cities Soc. 2020, 52, 101840. [Google Scholar] [CrossRef]
  5. Schulte, M.; Lewandowski, I.; Pude, R.; Wagner, M. Comparative Life Cycle Assessment of Bio-based Insulation Materials: Environmental and Economic Performances. GCB Bioenergy 2021, 13, 979–998. [Google Scholar] [CrossRef]
  6. Raja, P.; Murugan, V.; Ravichandran, S.; Behera, L.; Mensah, R.A.; Mani, S.; Kasi, A.; Balasubramanian, K.B.N.; Sas, G.; Vahabi, H.; et al. A Review of Sustainable Bio-Based Insulation Materials for Energy-Efficient Buildings. Macromol. Mater. Eng. 2023, 308, 2300086. [Google Scholar] [CrossRef]
  7. Rahla, K.M.; Mateus, R.; Bragança, L. Selection Criteria for Building Materials and Components in Line with the Circular Economy Principles in the Built Environment—A Review of Current Trends. Infrastructures 2021, 6, 49. [Google Scholar] [CrossRef]
  8. Góra, M.; Bańkosz, M.; Tyliszczak, B. Use of Innovative Methods to Produce Highly Insulating Walls Using 3D-Printing Technology. Materials 2024, 17, 3990. [Google Scholar] [CrossRef] [PubMed]
  9. Geyer, R.; Jambeck, J.R.; Law, K.L. Production, Use, and Fate of All Plastics Ever Made. Sci. Adv. 2017, 3, e1700782. [Google Scholar] [CrossRef] [PubMed]
  10. Lau, W.W.Y.; Shiran, Y.; Bailey, R.M.; Cook, E.; Stuchtey, M.R.; Koskella, J.; Velis, C.A.; Godfrey, L.; Boucher, J.; Murphy, M.B.; et al. Evaluating Scenarios toward Zero Plastic Pollution. Science (1979) 2020, 369, 1455–1461. [Google Scholar] [CrossRef]
  11. Kumar, D.; Alam, M.; Zou, P.X.W.; Sanjayan, J.G.; Memon, R.A. Comparative Analysis of Building Insulation Material Properties and Performance. Renew. Sustain. Energy Rev. 2020, 131, 110038. [Google Scholar] [CrossRef]
  12. Pérez, M.; Carou, D.; Rubio, E.M.; Teti, R. Current Advances in Additive Manufacturing. Procedia CIRP 2020, 88, 439–444. [Google Scholar] [CrossRef]
  13. Delgado Camacho, D.; Clayton, P.; O’Brien, W.J.; Seepersad, C.; Juenger, M.; Ferron, R.; Salamone, S. Applications of Additive Manufacturing in the Construction Industry—A Forward-Looking Review. Autom. Constr. 2018, 89, 110–119. [Google Scholar] [CrossRef]
  14. Shanmugam, V.; Das, O.; Neisiany, R.E.; Babu, K.; Singh, S.; Hedenqvist, M.S.; Berto, F.; Ramakrishna, S. Polymer Recycling in Additive Manufacturing: An Opportunity for the Circular Economy. Mater. Circ. Econ. 2020, 2, 11. [Google Scholar] [CrossRef]
  15. Ganobjak, M.; Carstensen, J.V. Topology-Optimized Insulating Facebrick with Aerogel Filling. J. Phys. Conf. Ser. 2019, 1343, 012195. [Google Scholar] [CrossRef]
  16. Sarakinioti, V.; Konstantinou, T.; Turrin, M.; Tenpierik, M.; Loonen, R.C.G.M. Development and Prototyping of an Integrated 3D-Printed Façade for Thermal Regulation in Complex Geometries. J. Facade Des. Eng. 2018, 6, 29–40. [Google Scholar]
  17. EN ISO 9869-1:2014; Thermal Insulation—Building Elements—In Situ Measurement of Thermal Resistance and Thermal Transmittance. Part 1: Heat Flow Meter Method. International Organization for Standardization: Geneva, Switzerland, 2014.
  18. de Rubeis, T.; Ciccozzi, A.; Paoletti, D.; Ambrosini, D. 3D Printing for Energy Optimization of Building Envelope—Experimental Results. Heliyon 2024, 10, e31107. [Google Scholar] [CrossRef]
  19. de Rubeis, T. 3D-Printed Blocks: Thermal Performance Analysis and Opportunities for Insulating Materials. Sustainability 2022, 14, 1077. [Google Scholar] [CrossRef]
  20. de Rubeis, T.; Ciccozzi, A.; Giusti, L.; Ambrosini, D. On the Use of 3D Printing to Enhance the Thermal Performance of Building Envelope—A Review. J. Build. Eng. 2024, 95, 110284. [Google Scholar] [CrossRef]
  21. de Rubeis, T.; Ciccozzi, A.; Giusti, L.; Ambrosini, D. The 3D Printing Potential for Heat Flow Optimization: Influence of Block Geometries on Heat Transfer Processes. Sustainability 2022, 14, 15830. [Google Scholar] [CrossRef]
  22. Cuevas, K.; Strzałkowski, J.; Kim, J.-S.; Ehm, C.; Glotz, T.; Chougan, M.; Ghaffar, S.H.; Stephan, D.; Sikora, P. Towards Development of Sustainable Lightweight 3D Printed Wall Building Envelopes—Experimental and Numerical Studies. Case Stud. Constr. Mater. 2023, 18, e01945. [Google Scholar] [CrossRef]
  23. Mihalache, A.; Hriţuc, A.; Boca, M.; Oroian, B.; Condrea, I.; Botezatu, C.; Slătineanu, L. Thermal Insulation Capacity of a 3D Printed Material. Macromol. Symp. 2021, 396, 2000286. [Google Scholar] [CrossRef]
  24. Dey, D.; Panda, B. An Experimental Study of Thermal Performance of 3D Printed Concrete Slabs. Mater. Lett. 2023, 330, 133273. [Google Scholar] [CrossRef]
  25. Pessoa, S.; Guimarães, A.S.; Lucas, S.S.; Simões, N. 3D Printing in the Construction Industry—A Systematic Review of the Thermal Performance in Buildings. Renew. Sustain. Energy Rev. 2021, 141, 110794. [Google Scholar] [CrossRef]
  26. Kaszynka, M.; Olczyk, N.; Techman, M.; Skibicki, S.; Zielinski, A.; Filipowicz, K.; Wroblewski, T.; Hoffmann, M. Thermal-Humidity Parameters of 3D Printed Wall. IOP Conf. Ser. Mater. Sci. Eng. 2019, 471, 082018. [Google Scholar] [CrossRef]
  27. de Rubeis, T.; Ciccozzi, A.; Pasqualoni, G.; Paoletti, D.; Ambrosini, D. Thermal Optimization of 3D-Printed Block—Hot Box and Heat Flow Meter Experimental Analysis. In Proceedings of the 2023 8th International Conference on Smart and Sustainable Technologies (SpliTech), Split, Croatia, 20–23 June 2023; IEEE: Piscataway, NJ, USA, 2023; pp. 1–5. [Google Scholar]
  28. Chung, S.-Y.; Stephan, D.; Elrahman, M.A.; Han, T.-S. Effects of Anisotropic Voids on Thermal Properties of Insulating Media Investigated Using 3D Printed Samples. Constr. Build. Mater. 2016, 111, 529–542. [Google Scholar] [CrossRef]
  29. Sarakinioti, M.V.; Turrin, M.; Konstantinou, T.; Tenpierik, M.; Knaack, U. Developing an Integrated 3D-Printed Façade with Complex Geometries for Active Temperature Control. Mater. Today Commun. 2018, 15, 275–279. [Google Scholar] [CrossRef]
  30. Nemova, D.; Kotov, E.; Andreeva, D.; Khorobrov, S.; Olshevskiy, V.; Vasileva, I.; Zaborova, D.; Musorina, T. Experimental Study on the Thermal Performance of 3D-Printed Enclosing Structures. Energies 2022, 15, 4230. [Google Scholar] [CrossRef]
  31. Marais, H.; Christen, H.; Cho, S.; De Villiers, W.; Van Zijl, G. Computational Assessment of Thermal Performance of 3D Printed Concrete Wall Structures with Cavities. J. Build. Eng. 2021, 41, 102431. [Google Scholar] [CrossRef]
  32. Suntharalingam, T.; Upasiri, I.; Gatheeshgar, P.; Poologanathan, K.; Nagaratnam, B.; Santos, P.; Rajanayagam, H. Energy Performance of 3D-Printed Concrete Walls: A Numerical Study. Buildings 2021, 11, 432. [Google Scholar] [CrossRef]
  33. El-Mahdy, D.; Gabr, H.S.; Abdelmohsen, S. SaltBlock as a 3D Printed Sustainable Construction Material in Hot Arid Climates. J. Build. Eng. 2021, 43, 103134. [Google Scholar] [CrossRef]
  34. He, Y.; Zhang, Y.; Zhang, C.; Zhou, H. Energy-Saving Potential of 3D Printed Concrete Building with Integrated Living Wall. Energy Build. 2020, 222, 110110. [Google Scholar] [CrossRef]
  35. Song, J.; Cao, M.; Cai, L.; Zhou, Y.; Chen, J.; Liu, S.; Zhou, B.; Lu, Y.; Zhang, J.; Long, W.; et al. 3D Printed Polymeric Formwork for Lattice Cementitious Composites. J. Build. Eng. 2021, 43, 103074. [Google Scholar] [CrossRef]
  36. Cuevas, K.; Chougan, M.; Martin, F.; Ghaffar, S.H.; Stephan, D.; Sikora, P. 3D Printable Lightweight Cementitious Composites with Incorporated Waste Glass Aggregates and Expanded Microspheres—Rheological, Thermal and Mechanical Properties. J. Build. Eng. 2021, 44, 102718. [Google Scholar] [CrossRef]
  37. Małek, M.; Kluczyński, J.; Łasica, W.; Jackowski, M.; Szachogłuchowicz, I.; Łuszczek, J.; Torzewski, J.; Grzelak, K. Performance Properties of Cement–Glass Composite Bricks (CGCB) with Additively Manufactured (AM) Polymeric Scaffolding. Materials 2023, 16, 1909. [Google Scholar] [CrossRef] [PubMed]
  38. Ebrahimi, M.; Mohseni, M.; Aslani, A.; Zahedi, R. Investigation of Thermal Performance and Life-Cycle Assessment of a 3D Printed Building. Energy Build. 2022, 272, 112341. [Google Scholar] [CrossRef]
  39. Kam, D.; Layani, M.; BarkaiMinerbi, S.; Orbaum, D.; Abrahami BenHarush, S.; Shoseyov, O.; Magdassi, S. Additive Manufacturing of 3D Structures Composed of Wood Materials. Adv. Mater. Technol. 2019, 4, 1900158. [Google Scholar] [CrossRef]
  40. Zeng, C.; Liu, L.; Bian, W.; Leng, J.; Liu, Y. Compression Behavior and Energy Absorption of 3D Printed Continuous Fiber Reinforced Composite Honeycomb Structures with Shape Memory Effects. Addit. Manuf. 2021, 38, 101842. [Google Scholar] [CrossRef]
  41. Maier, M.; Salazar, B.; Unluer, C.; Taylor, H.K.; Ostertag, C.P. Thermal and Mechanical Performance of a Novel 3D Printed Macro-Encapsulation Method for Phase Change Materials. J. Build. Eng. 2021, 43, 103124. [Google Scholar] [CrossRef]
  42. Rahemipoor, S.; Hasany, M.; Mehrali, M.; Almdal, K.; Ranjbar, N.; Mehrali, M. Phase Change Materials Incorporation into 3D Printed Geopolymer Cement: A Sustainable Approach to Enhance the Comfort and Energy Efficiency of Buildings. J. Clean. Prod. 2023, 417, 138005. [Google Scholar] [CrossRef]
  43. Anwajler, B. The Thermal Properties of a Prototype Insulation with a Gyroid Structure—Optimization of the Structure of a Cellular Composite Made Using SLS Printing Technology. Materials 2022, 15, 1352. [Google Scholar] [CrossRef] [PubMed]
  44. Anwajler, B.; Szkudlarek, M. Właściwości Cieplne Materiałów o Strukturze TPMS Wykonanych w Technologii Druku Addytywnego SLS. Rynek Energii 2023, 1, 11–20. [Google Scholar]
  45. Anwajler, B.; Piwowar, A. Bioniczny Kompozyt Komórkowy o Właściwościach Izolacyjnych Wykonany w Technologii Addytywnej SLS. Izolacje 2023, 28, 116–123. [Google Scholar]
  46. Anwajler, B.; Zielińska, S.; Witek-Krowiak, A. Innovative Cellular Insulation Barrier on the Basis of Voronoi Tessellation—Influence of Internal Structure Optimization on Thermal Performance. Materials 2024, 17, 1578. [Google Scholar] [CrossRef]
  47. Anwajler, B.; Szołomicki, J.; Noszczyk, P.; Baryś, M. The Potential of 3D Printing in Thermal Insulating Composite Materials—Experimental Determination of the Impact of the Geometry on Thermal Resistance. Materials 2024, 17, 1202. [Google Scholar] [CrossRef]
  48. Piwowar, A.; Anwajler, B.; Szulc, P. Właściwości Cieplne Materiałów Izolacyjnych Wykonanych w Technologii Druku 3D—Wpływ Optymalizacji Struktury Opartej Na Modelu Piany Kelvina. Rynek Energii 2024, 1, 60–68. [Google Scholar]
  49. Nie, Z.; Lin, Y.; Tong, Q. Modeling Structures of Open Cell Foams. Comput. Mater. Sci. 2017, 131, 160–169. [Google Scholar] [CrossRef]
  50. Islam, S.; Bhat, G.; Sikdar, P. Thermal and Acoustic Performance Evaluation of 3D-Printable PLA Materials. J. Build. Eng. 2023, 67, 105979. [Google Scholar] [CrossRef]
  51. Kumar, P.; Topin, F.; Vicente, J. Determination of Effective Thermal Conductivity from Geometrical Properties: Application to Open Cell Foams. Int. J. Therm. Sci. 2014, 81, 13–28. [Google Scholar] [CrossRef]
  52. Brennan-Craddock, J.P.J.; Bingham, G.A.; Hague, R.J.M.W.R.D.; Wildman, R.D. Impact Absorbent Rapid Manufactured Structures (IARMS). Int. Solid Free Fabr. Symp. 2008, 4–6, 266–277. [Google Scholar]
  53. Norma Europejska EN ISO 6946:2007 ma status Polskiej Normy PN-EN ISO 6946:2008; Komponenty Budowlane i Elementy Budynku Opór Cieplny i Współczynnik Przenikania Ciepła Metoda Obliczania. Polski Komitet Normalizacyjny: Warsaw, Poland, 2008.
  54. PN-EN ISO 9229:2020-12; Izolacja Cieplna--Materiały, Wyroby i Systemy--Terminologia. SBD, Sektor Budownictwa i Konstrukcji Budowlanych, KT 211, Wyrobów do Izolacji Cieplnej w Budownictwie. LOCJA: Warsaw, Poland, 2020.
  55. PN-EN ISO 10456: 2009; Materiały i Wyroby Budowlane—Tabele Wartości Projektowych, Określanie Deklarowanych i Projektowych Wartości Cieplnych. Polski Komitet Normalizacyjny: Warsaw, Poland, 2009.
  56. Jezierski, W. Wpływ Parametrów Fizykalnych Elementów Stolarki Okiennej Na Współczynnik Przenikania Ciepła Okien. Izolacje 2018, 3, 38–42. [Google Scholar]
Figure 1. Tetrahedron (a) and Kelvin structure (b). Based on [47,49].
Jcs 08 00389 g001
Figure 2. Kelvin’s tetrahedron cut with a sphere (a) and the resulting open-cell foam structure (b).
Jcs 08 00389 g002
Figure 3. A designed, single tetrahedron cut by a sphere of a 6 mm diameter (a) and a visualization of the spherical sections of the sphere cutting the Kelvin tetrahedron that is outside its surface (b).
Jcs 08 00389 g003
Figure 4. Layering of 20 mm thick samples: (a) one, (b) two, and (c) three layers.
Jcs 08 00389 g004
Figure 5. Layering of 100 mm thick samples: (a) one layer and (b) five layers.
Jcs 08 00389 g005
Figure 6. Example cores of printed open-cell composites: (a) black, (b) transparent, (c) gray, (d) SLS gray, and (e) white soybean oil-based.
Jcs 08 00389 g006
Figure 7. An example of a cellular composite sample with an internal core structure based on a tetrahedral Kelvin model produced by 3D printing; SLS gray, 20 mm thick samples: (a) one, (b) two, and (c) three layers and (d). Based on [45,47].
Jcs 08 00389 g007
Figure 8. Diagram of the test setup for thermal insulation evaluation [46,47].
Jcs 08 00389 g008
Figure 9. The variation of the heat flux (q) over time for samples made from PA12 (gray) using the SLS 3D printing technology.
Jcs 08 00389 g009
Figure 10. The variation of the heat flux (q) over time for samples made from soybean oil-based UV white resin using the DLP 3D printing technology.
Jcs 08 00389 g010
Figure 11. The variation of the heat flux (q) over time for samples made of gray UV resin using the DLP 3D printing technology.
Jcs 08 00389 g011
Figure 12. The variation of the heat flux (q) as a function of time for samples made of UV black resin using the DLP 3D printing technology.
Jcs 08 00389 g012
Figure 13. The variation of the heat flux (q) over time for samples made from a UV-transparent resin using the DLP 3D printing technology.
Jcs 08 00389 g013
Figure 14. Heat flux (q) versus time q for a five-layer, 100 mm thick structure made of different materials.
Jcs 08 00389 g014
Figure 15. The heat transfer coefficient (U) versus time for the PA12 (gray) samples made using the SLS 3D printing.
Jcs 08 00389 g015
Figure 16. The heat transfer coefficient (U) versus time for the soybean oil-based UV white resin samples using DLP 3D printing technology.
Jcs 08 00389 g016
Figure 17. The heat transfer coefficient (U) versus time for the gray UV resin samples using DLP 3D printing technology.
Jcs 08 00389 g017
Figure 18. The heat transfer coefficient (U) versus time for the UV black resin samples using DLP 3D printing technology.
Jcs 08 00389 g018
Figure 19. The heat transfer coefficient (U) versus time for the UV transparent resin samples using DLP 3D printing technology.
Jcs 08 00389 g019
Figure 20. The heat transfer coefficient (U) as a function of time for a five-layer, 100 mm thick structure made of different materials.
Jcs 08 00389 g020
Table 1. A summary of the analyzed works regarding 3D printing.
Research Object3DP
Process
Used
Optimization Strategy UsedThermal
Parameters Values
Reference
TopologyMaterial
3D-printed walls, concrete wallsCP brick wall—concretexR1 = 5.04 m2 K/W,
R2 = 5.74 m2 K/W,
R3 = 5.45 m2 K/W;
U1 = 0.2 W/m2 K,
U2 = 0.17 W/m2 K,
U3 = 0.18 W/m2 K
Kaszynka et al. [26]
3D-printed blocksFDM—PLAxU1 = 1.43 W/m2 K,
U2 = 1.25 W/m2 K,
U3 = 1.22 W/m2 K
de Rubeis et al. [21]
3D-printed blocksFDM—PLAxU1 = 1.22 W/m2 K,
U2 = 0.65 W/m2 K
U3 = 0.53 W/m2 K
U4 = 0.66 W/m2 K
de Rubeis et al. [18].
3D-printed blocksFDM—PLAxU1a = 1.22 W/m2 K
U1b = 1.13 W/m2 K,
U2 = 1.18 W/m2 K,
U3 = 1.08 W/m2 K
de Rubeis et al. [18]
3D-printed blocksFDM—PLAxU1 = 2.19 W/m2 K,
U2 = 1.24 W/m2 K,
U3 = 0.69 W/m2 K
de Rubeis et al. [19]
3D-printed blocksFDM—PLAxU1 = 1.22 W/m2 K,
U2 = 1.13 W/m2 K
de Rubeis et al. [27]
3D-printed insulationFDM—ABSx0.12 ≤ λ ≤ 0.18 W/(m·K)Chung et al. [28]
Adaptive facade panelFDM—PLA, PETGx0.09 < λ < 0.1 W/(m·K)Sarakinioti
et al. [29]
3D-printed tilesFDM -PLAx36 ≤ Tsi ≤ 55 °C,
32 ≤ Tse ≤ 50 °C
Mihalache
et al. [23]
3D-printed enclosuresConcrete CPxU = 1.18 W/m2 KNemova et al. [30]
3D-printed walls with cavitiesLWFC, HPC CPxλ1 = 0.37 W/(m·K),
λ2 = 1.1 W/(m·K)
Marais et al. [31]
3D-printed wallsConcrete CPx0.59 ≤ U1 ≤ 0.83 W/m2 K
0.2 ≤ U2 ≤ 0.58 W/m2 K
Cuevas et al. [22]
3D-printed concrete wallsEPLA CPx0.34 ≤ U ≤ 3.16 W/m2 KSutharalingam et al. [32]
3D-printed salt blocksSand, EVA RC/DIWxU = 0.94 W/m2 KEl-Mahdy
et al. [33]
3D-printed concrete wallsCPxQm = 3.94 W/m2 KHe et al. [34]
3D CS-LCCPolymer SLAx0.21 ≤ λ ≤ 0.33 W/(m·K)Song et al.
[35]
3D-printed concrete samplesLWC CPx0.35 ≤ λ ≤ 0.74 W/m2 K
0.35 ≤ C ≤ 0.94 MJ/m3K
Cuevas et al. [36]
3D-printed brick samplesPETG FFFx0.87 ≤ λ ≤ 0.99 W/(m·K);
0.61 ≤ α ≤ 0.69 μm2/s;
1.31 ≤ C ≤ 1.64 MJ/m3K
Malek et al. [37]
3D-printed RMC concreteConcrete with CSA, CPx9171.29 ≤ TSE ≤ 10,390.47 kWh;
5398.13 ≤ El ≤ 5419.5 kWh;
3036.42 ≤ DC≤ 4192.14 kWh;
609.58 ≤ DH ≤ 915.24 kWh
Ebrahimi et al. [38]
3D-printed objects DIW WoodDCW, binder Injectionxλ1 = 0.09 W/(m·K),
λ2 = 0.05 W/(m·K)
Kam et al. [39]
3D-printed CFRCHSSMP FFFx0.27 ≤ EA ≤1.10 kJ;
2.2 ≤ SEA ≤ 14.00 kJ/kg
Zeng et al. [40]
3D-printed polymer mesh embedded in cement-based matrixABSxC = 57.55 J/g°CMaier et al.
[41]
MEPCM integrated with GPP for 3D printingGPPx6.40 ≤ ΔH ≤ 24.74 J/g;
18.30 ≤ Tm ≤ 27.27 °C;
0.38 ≤ λ ≤ 0.84 W/mK
Rahemipoor
et al. [42]
Table 2. Descriptive statistics for the heat transmission coefficient (U) for single-, two-, and three-layer composite specimens, 20 mm thick (M—mean; Me—median; Min—minimum; Max—maximum; SD—standard deviation; Sk—skewness; and K—kurtosis).
MMeMinMaxSDSkK
U, (m2·K)/W1.471.551.041.870.250.331.09
Table 3. Descriptive statistics for the heat transmission coefficient (U) for single-layer composite specimens from 20 to 100 mm thick (M—mean; Me—median; Min—minimum; Max—maximum; SD—standard deviation; Sk—skewness; and K—kurtosis).
MMeMinMaxSDSkK
U, (m2·K)/W0.590.550.141.150.340.441.13
Table 4. Descriptive statistics for the heat transmission coefficient (U) for single- and five-layer composite specimens with a thickness of 100 mm (M—mean; Me—median; Min—minimum; Max—maximum; SD—standard deviation; Sk—skewness; and K—kurtosis).
MMeMinMaxSDSkK
U, (m2·K)/W0.190.200.140.240.020.560.62
Table 5. A quantitative assessment of the main effects and the effects of interactions; the identification of the impact of dominant and statistically significant input factors on the dependent variable U for single-, two- and three-layer composite specimens, 20 mm thick (SS—Sum of Squares, df—Degrees of Freedom, MS—Mean Square, F—F Ratio, p—Significance Level (p-values)).
The Symbol That Identifies
the Input Factors and Their Interactions
SSdfMS Fp
U, (m2·K)/W
absolute term91.1426191.1426 3463.0970
m0.9032230.30107 11.440.000
n0.9012420.45062 17.1220.000
m*n0.1449960.02416 0.9180.494
absolute term0.8685330.02632
m*n—the interaction between the applied of material type, composite layering of the structure and the values of the output data obtained in the experiment.
Table 6. Quantitative assessment of the main effects and the effects of interactions; the identification of the impact of dominant and statistically significant input factors on the dependent variable R and U for single-layer composite specimens from 20 to 100 mm thick (SS—Sum of Squares, df—Degrees of Freedom, MS—Mean Square, F-F Ratio, p—Significance Level (p-values)).
The Symbol That Identifies
the Input Factors and Their Interactions
SSdfMSFp
U, (m2·K)/W
absolute term20.6292120.6292556,028.90.000
m0.0345530.01152310.40.000
δ6.8806241.7201646,364.30.000
m*δ0.02633120.0021959.10.000
absolute term0.00148400.00004
m*δ—the interaction between the applied of material type, composite thickness of the structure and the values of the output data obtained in the experiment.
Table 7. Quantitative assessment of the main effects and the effects of interactions; the identification of the impact of dominant and statistically significant input factors on the dependent variable R and U for single-layer and five-layer composite specimens with a thickness of 100 mm (SS—Sum of Squares, df—Degrees of Freedom, MS—Mean Square, F-F Ratio, p—Significance Level (p-values)).
The Symbol That Identifies
the Input Factors and Their Interactions
SSdfMSFp
U, (m2·K)/W
absolute term1.12725211.12725241,534.620.000
m0.00339840.0008531.30.000
n0.01068410.010684393.670.000
m*n0.00287140.00071826.450.000
absolute term0.000543200.000027
m*n—the interaction between the applied of material type, composite layering of the structure and the values of the output data obtained in the experiment.
Disclaimer/Publisher’s Note: The statements, opinions and data contained in all publications are solely those of the individual author(s) and contributor(s) and not of MDPI and/or the editor(s). MDPI and/or the editor(s) disclaim responsibility for any injury to people or property resulting from any ideas, methods, instructions or products referred to in the content.

