
Recycled Low Density Polyethylene Reinforced with Deverra tortuosa Vegetable Fibers


Abstract
:
1. Introduction
2. Materials and Methods
2.1. Materials
2.2. Sample Preparation
2.3. Characterization
2.3.1. Morphology
2.3.2. Fourier Transform Infrared Spectroscopy (FTIR)
2.3.3. Differential Scanning Calorimetry (DSC)
2.3.4. Hardness
2.3.5. Tensile Properties
2.3.6. Flexion Properties
2.3.7. Impact Strength
3. Results and Discussion
3.1. Morphology
3.2. Fourier Transform Infrared Spectroscopy (FTIR)
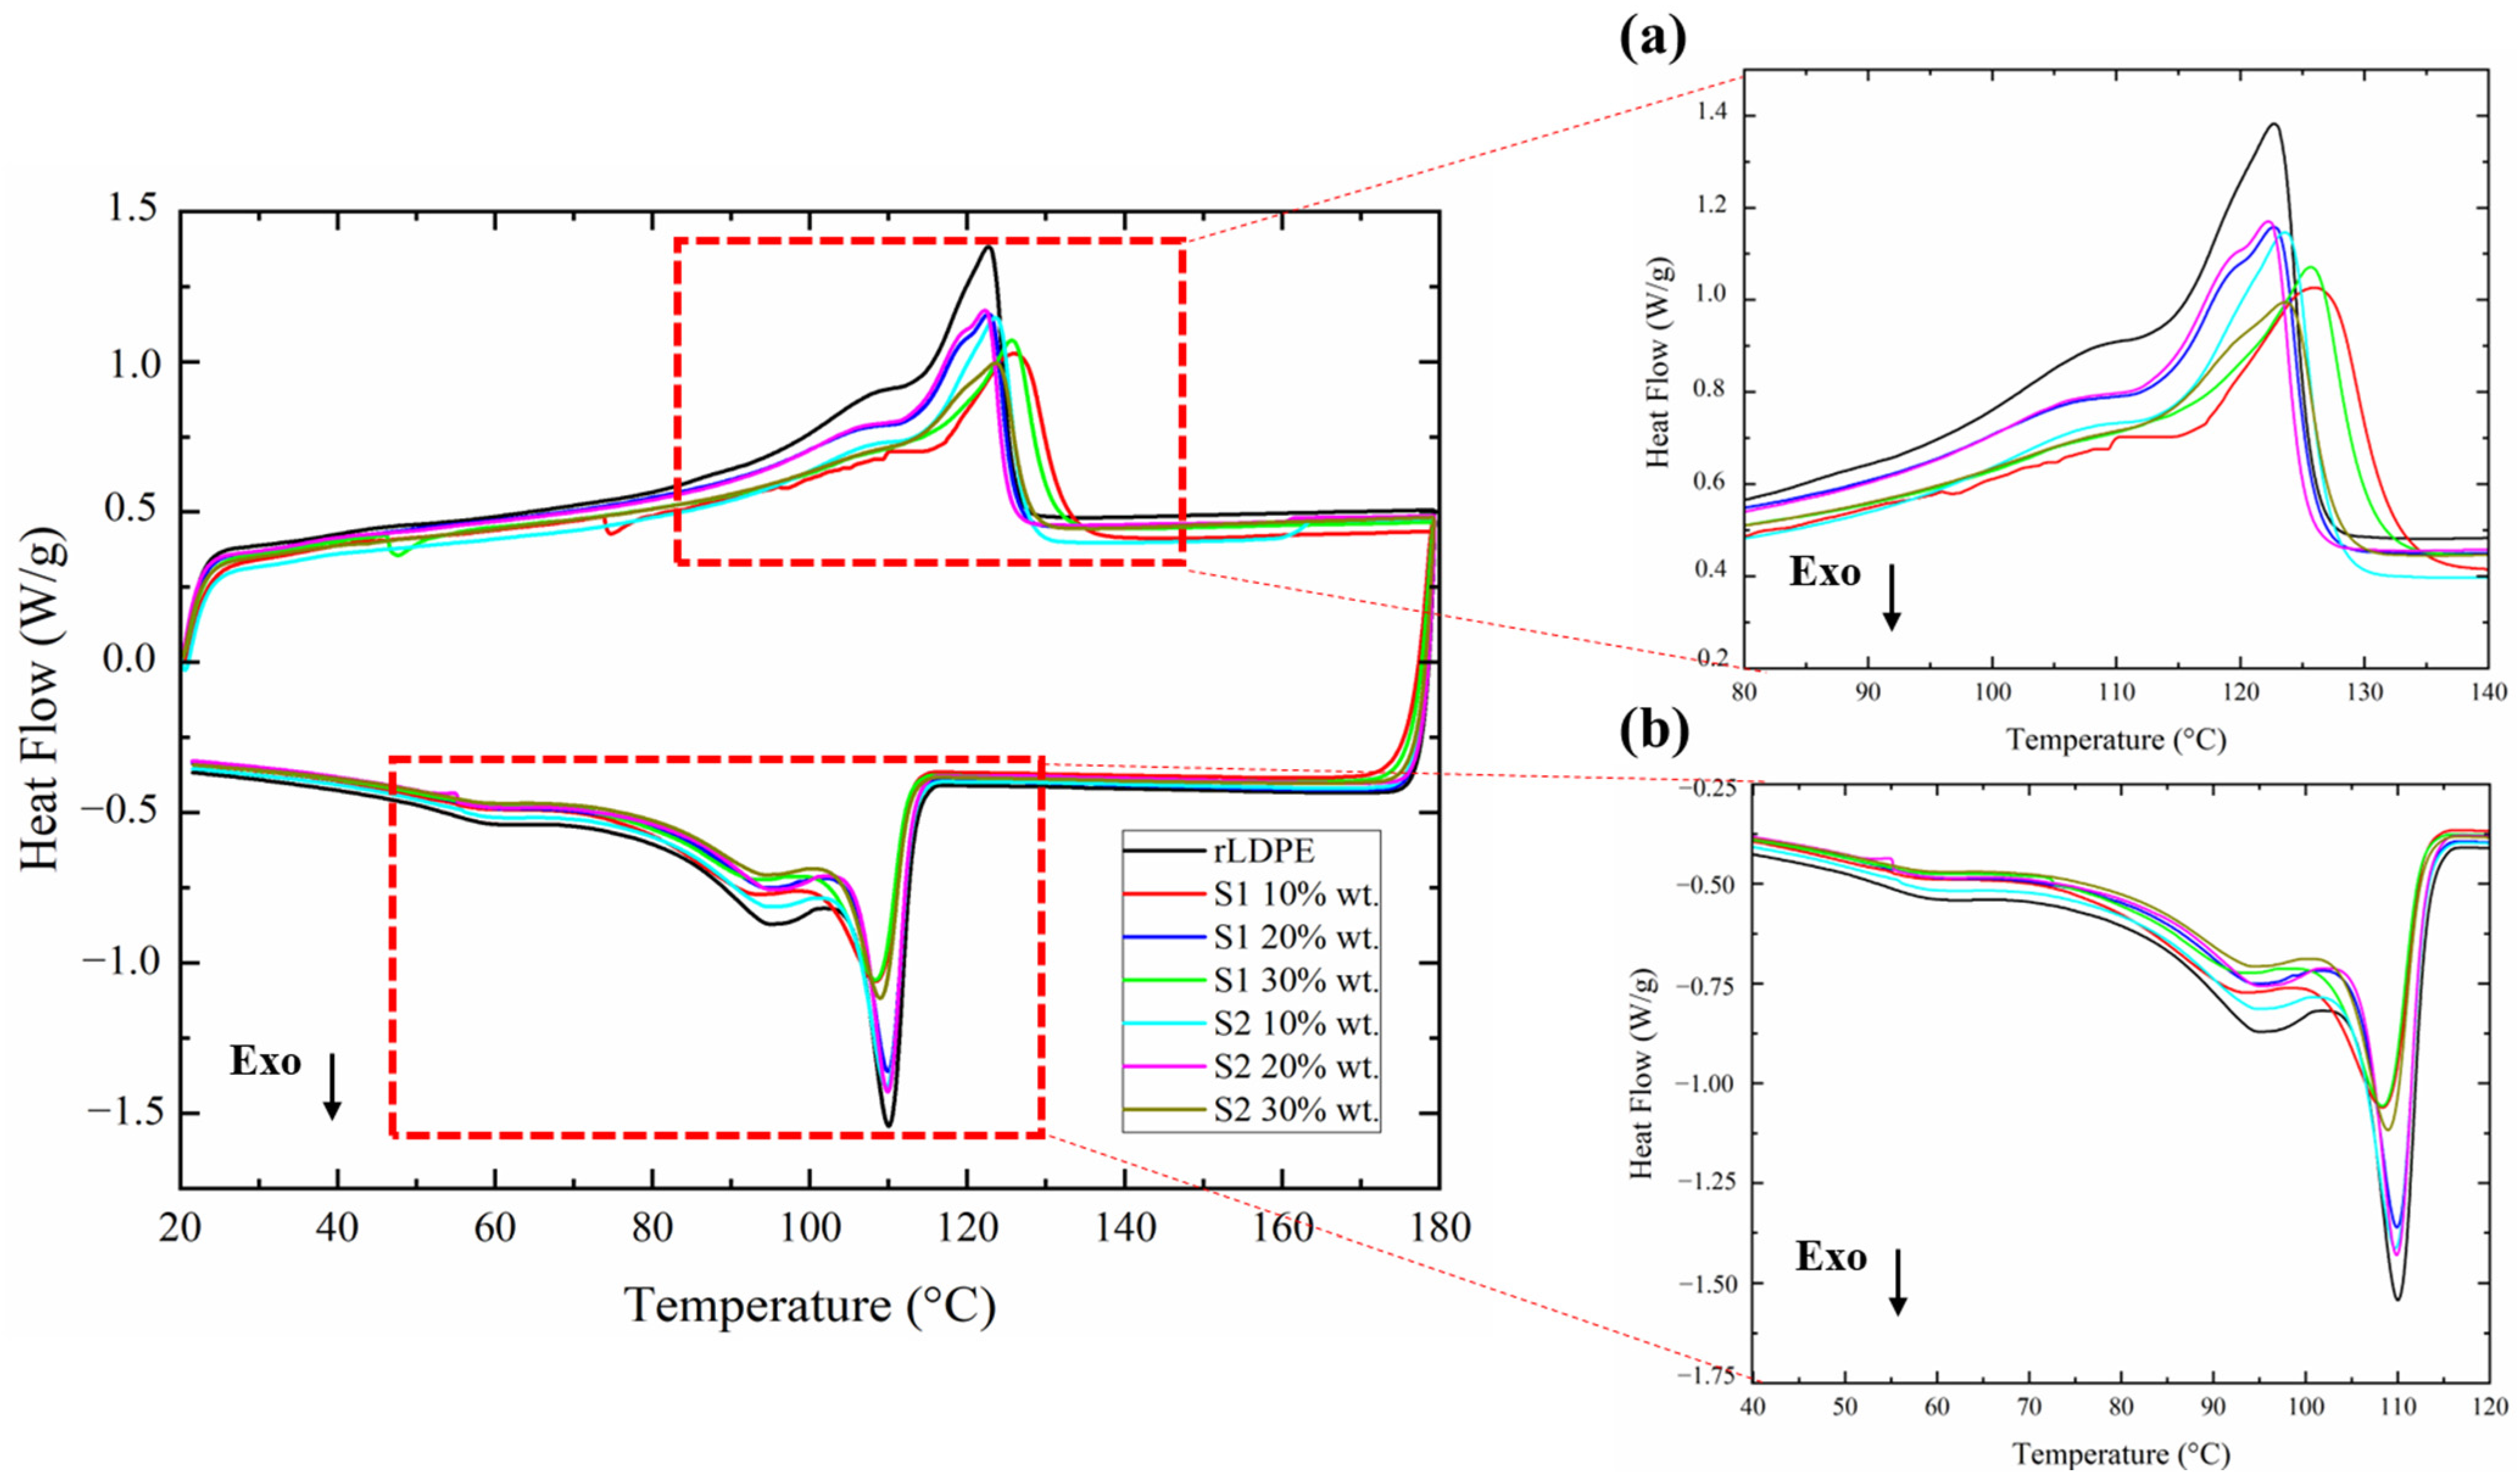
3.3. Differential Scanning Calorimetry (DSC)
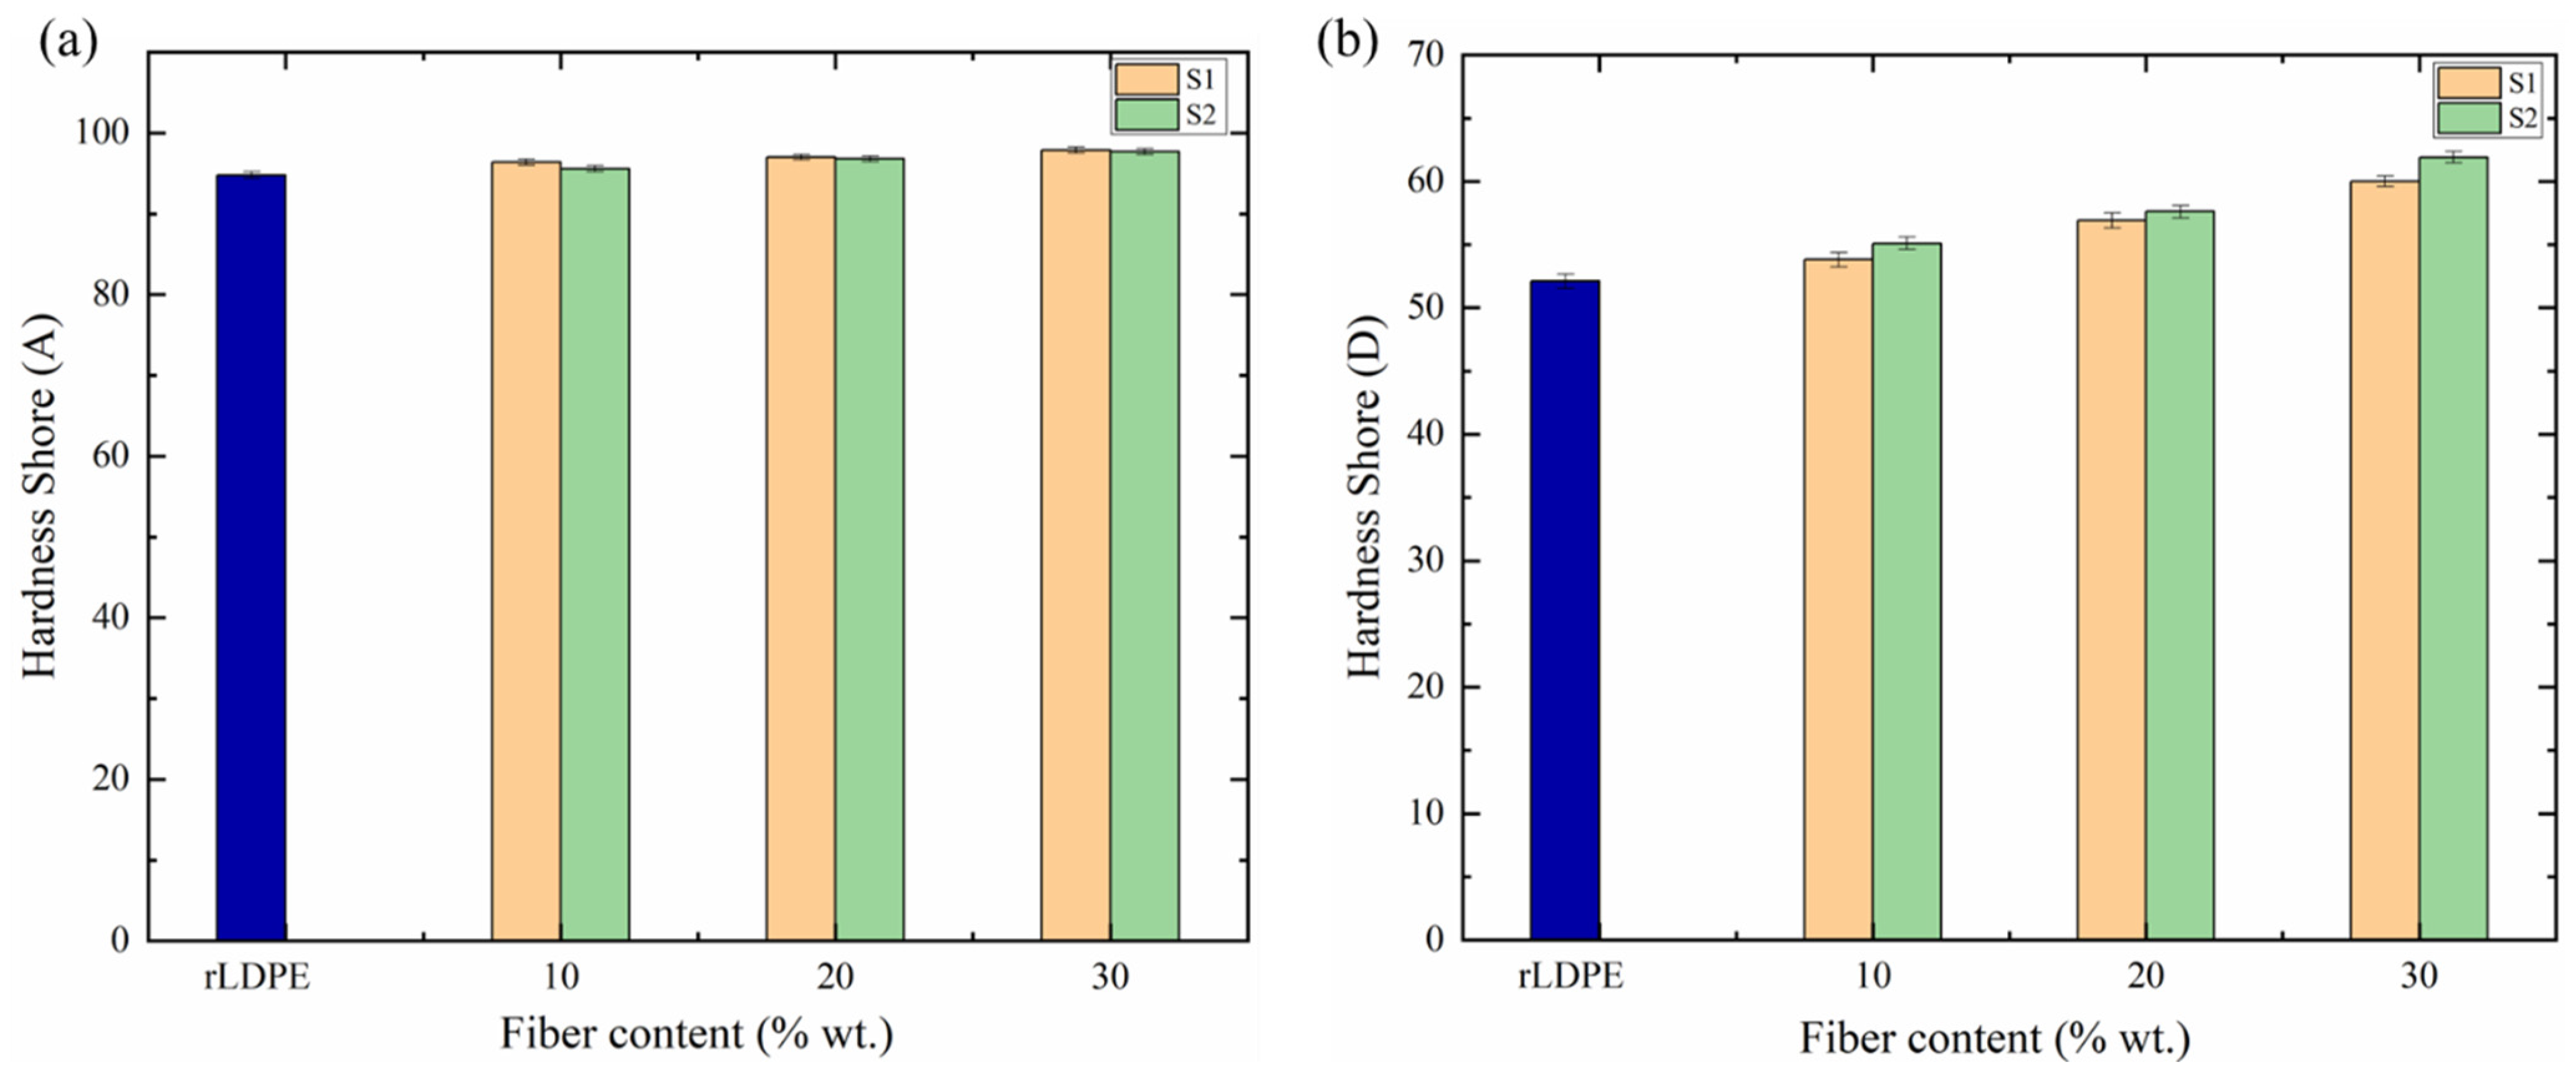
3.4. Hardness
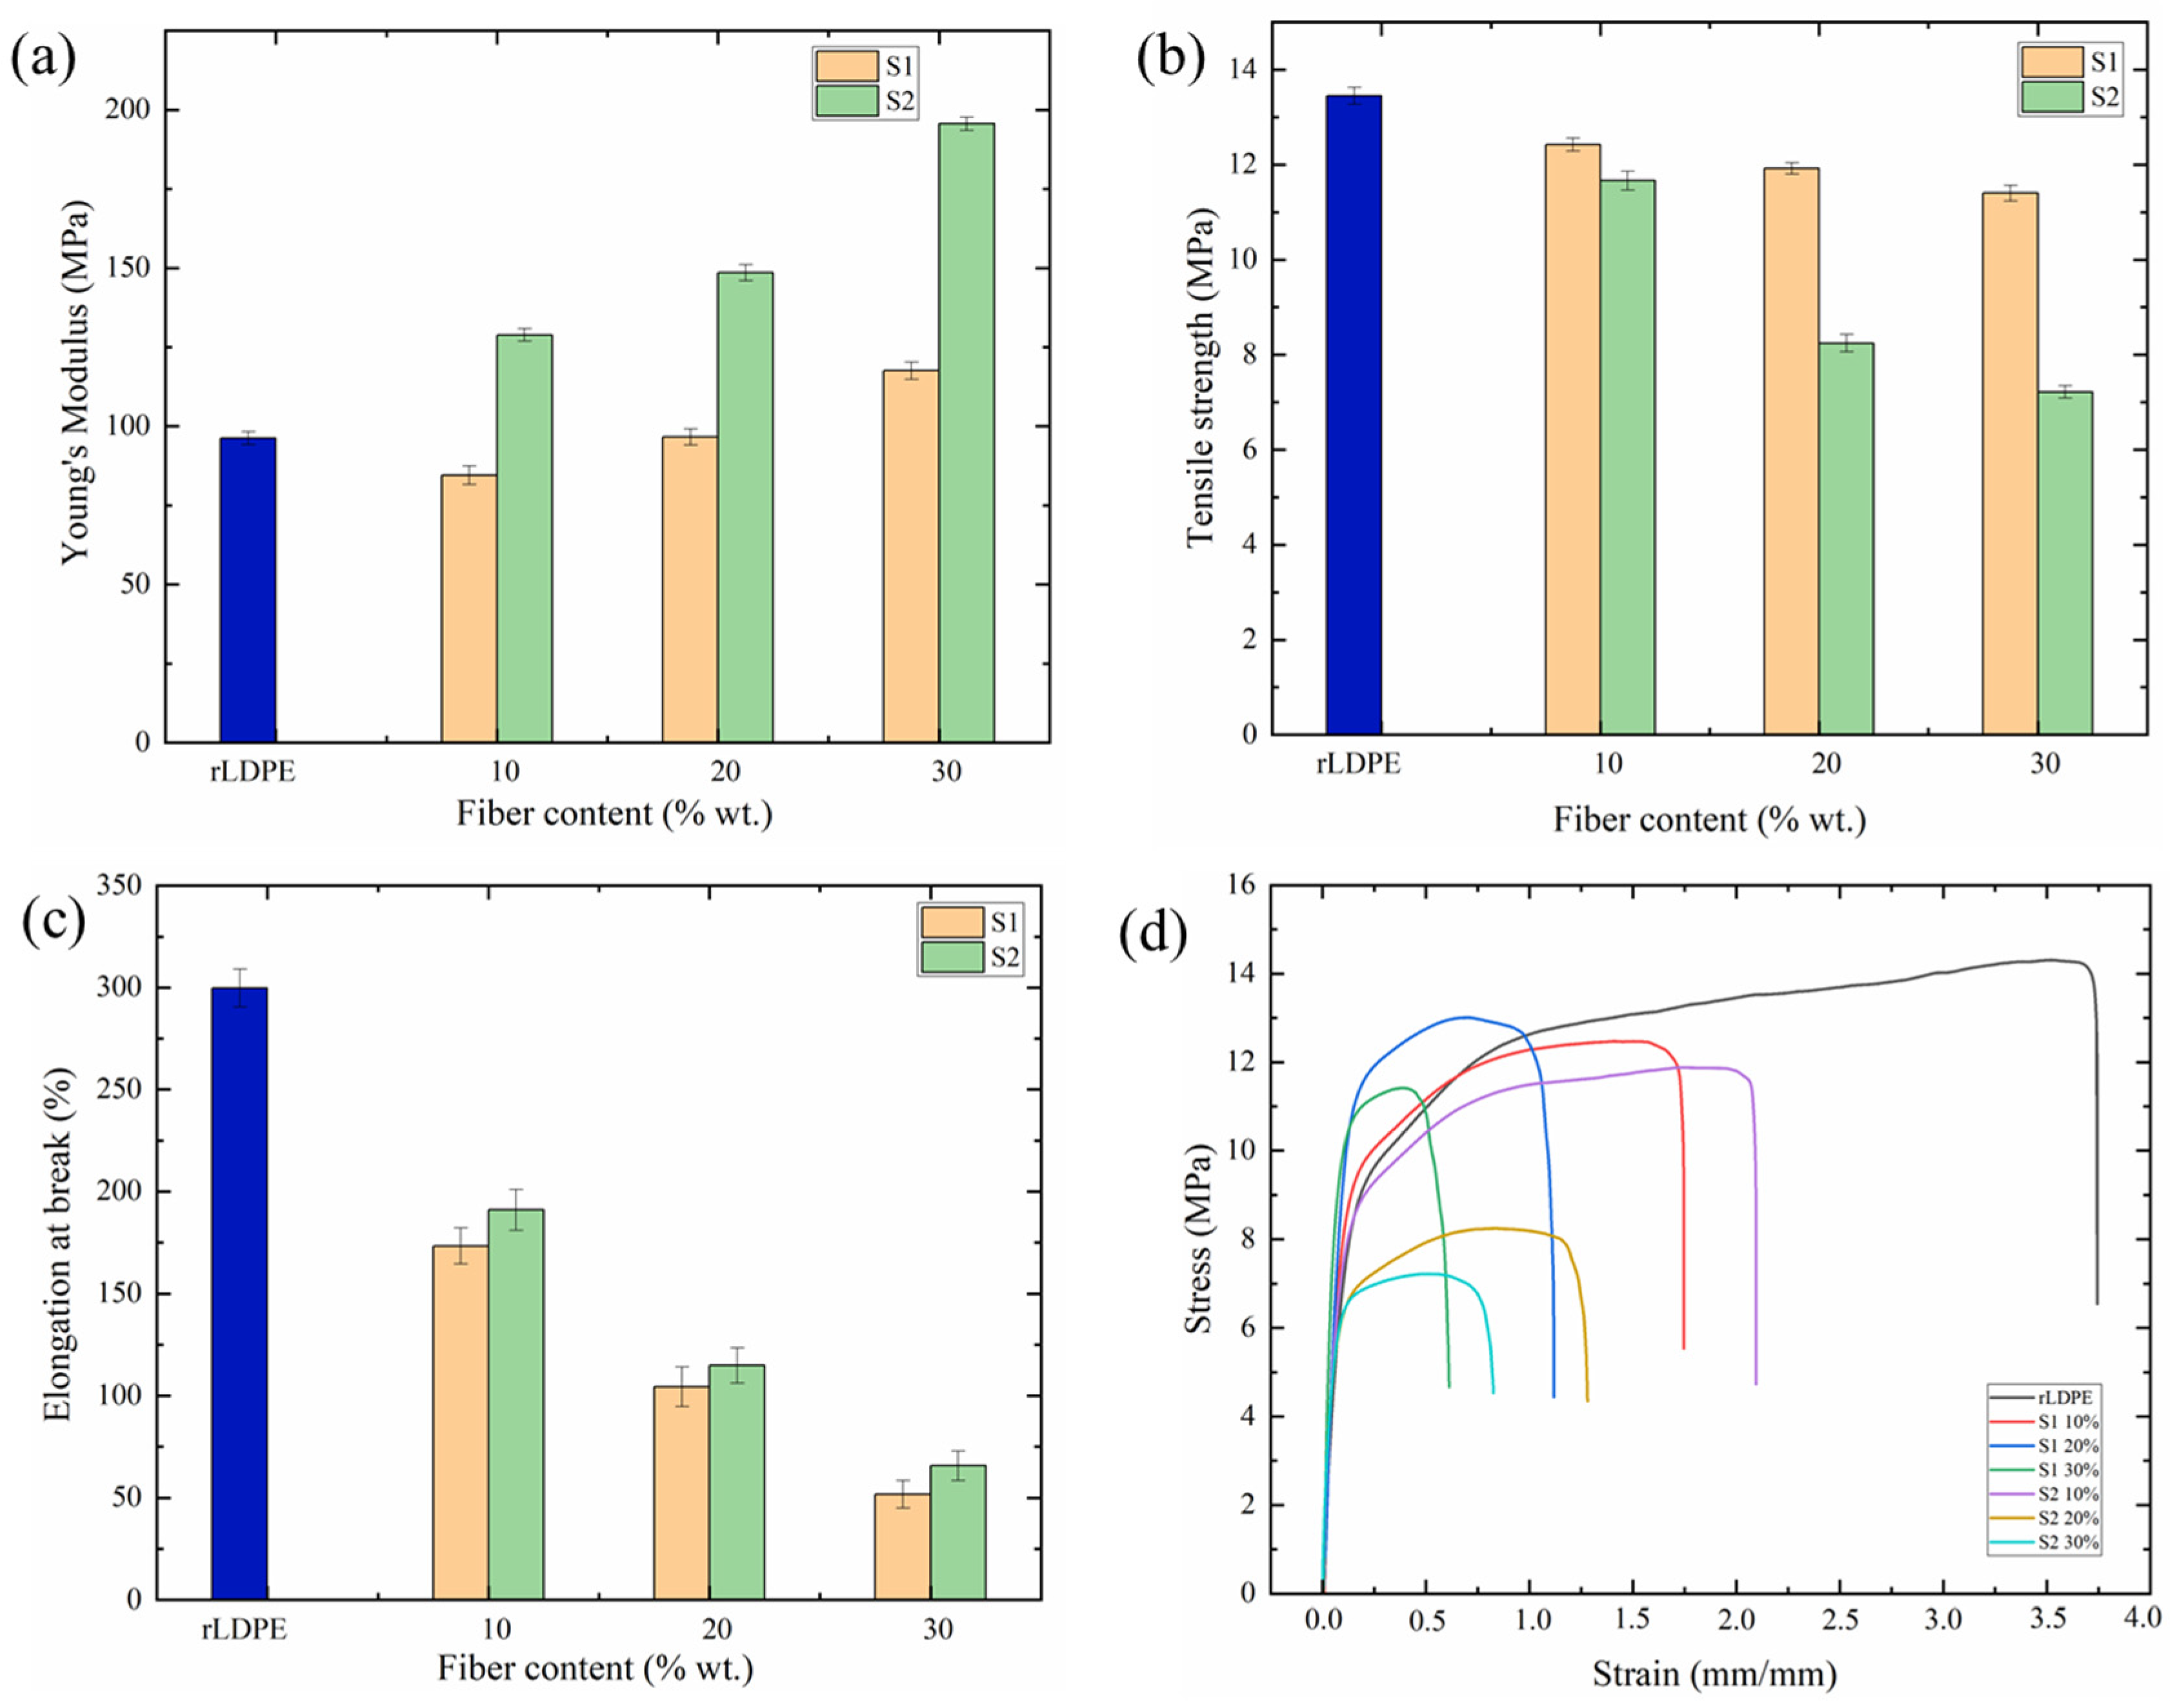
3.5. Tensile Properties
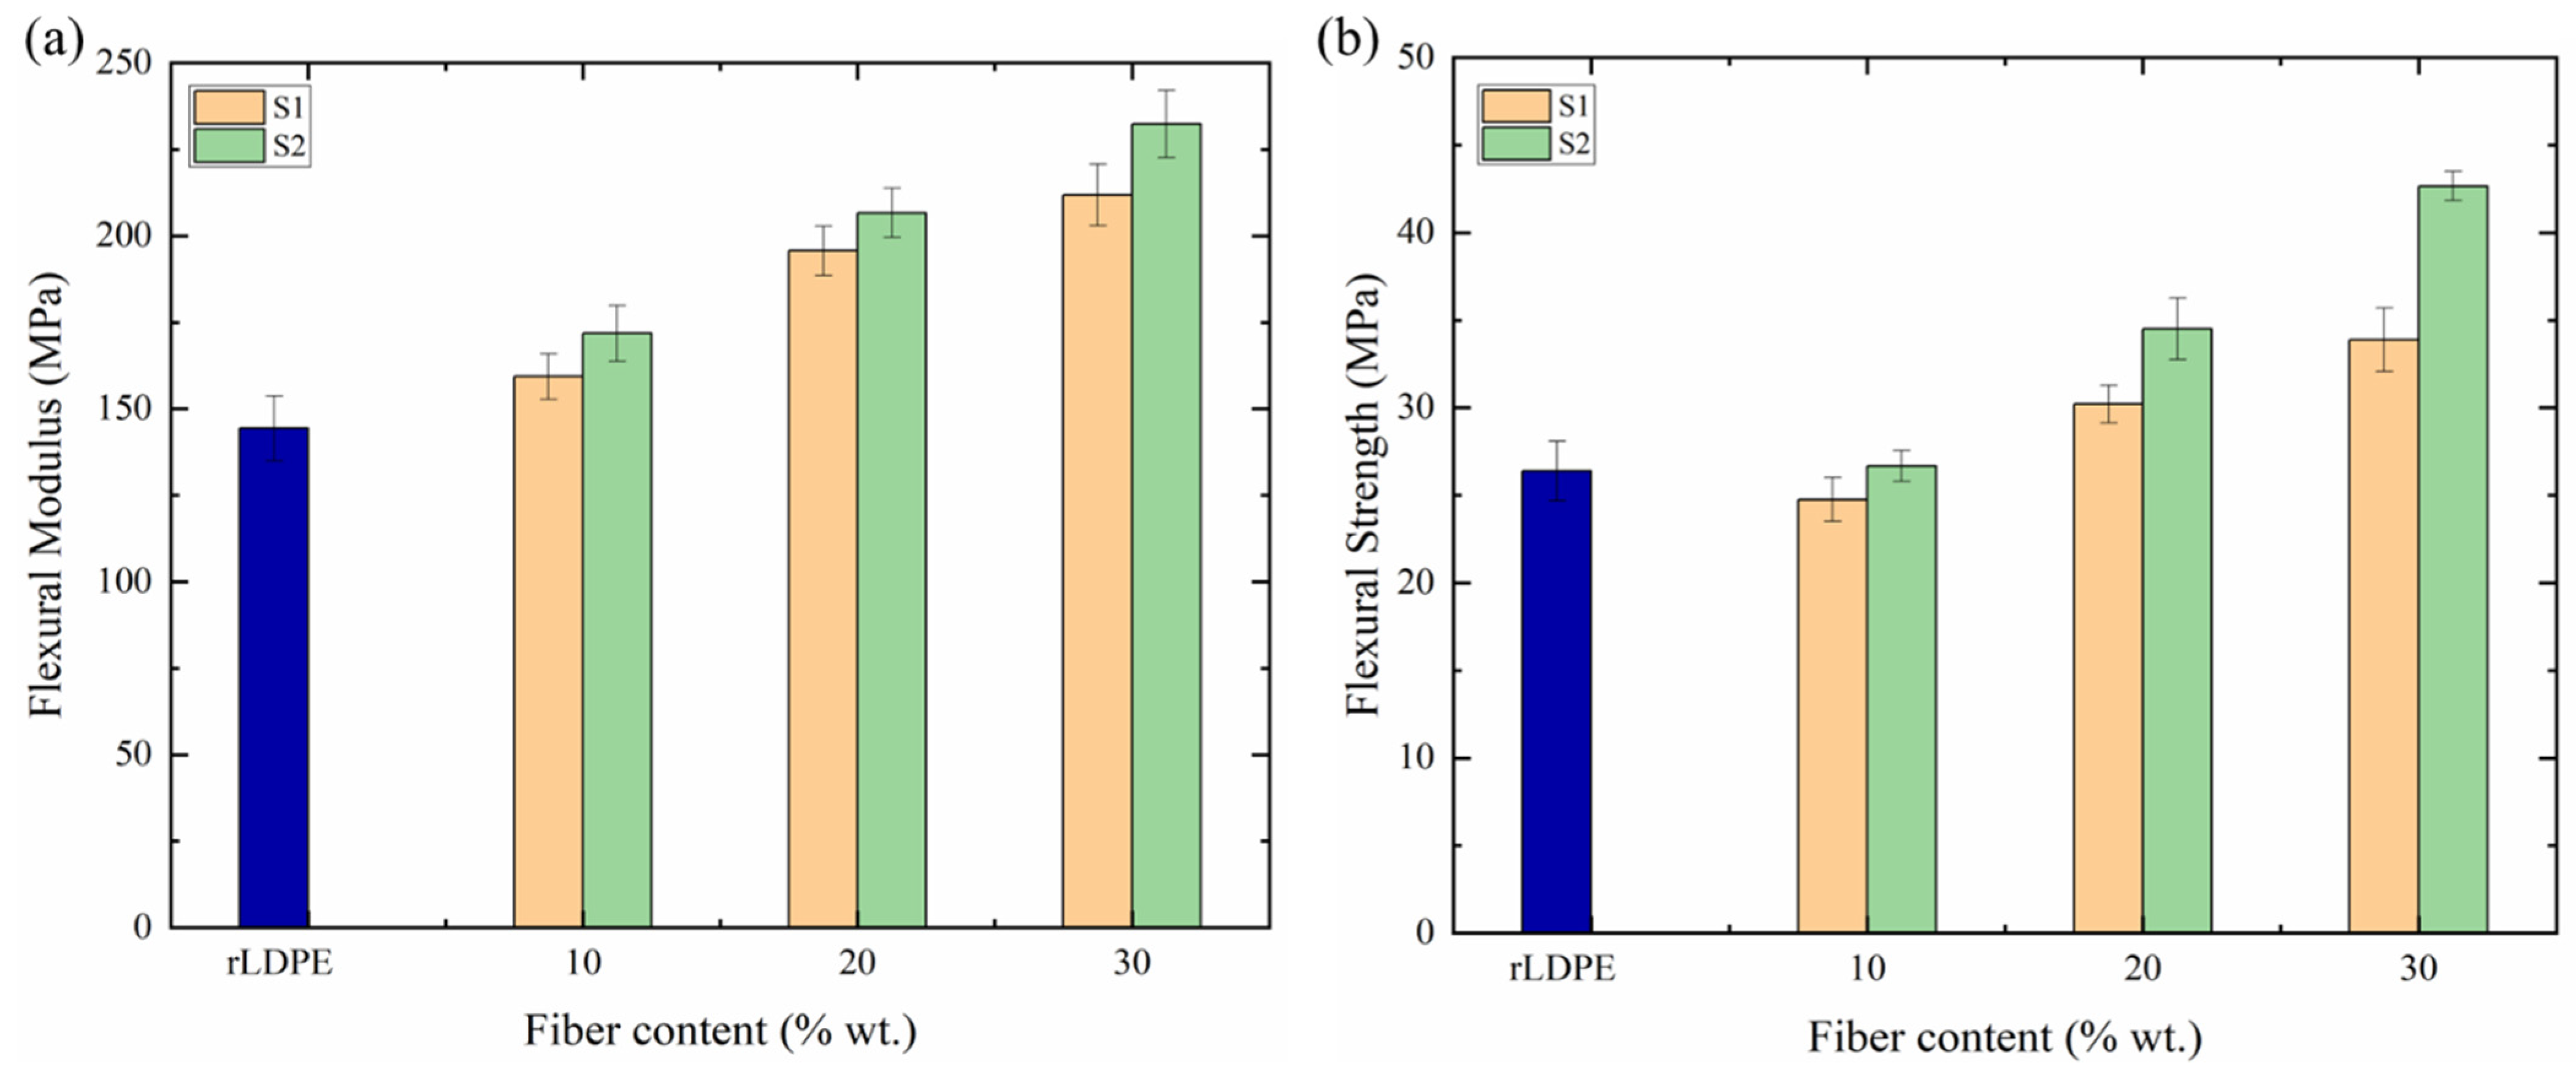
3.6. Flexural Properties
3.7. Impact Strength
4. Conclusions
Author Contributions
Funding
Data Availability Statement
Acknowledgments
Conflicts of Interest
References
- Pan, D.; Su, F.; Liu, C.; Guo, Z. Research progress for plastic waste management and manufacture of value-added products. Adv. Compos. Hybrid Mater. 2020, 3, 443–461. [Google Scholar] [CrossRef]
- Moharir, R.V.; Kumar, S. Challenges associated with plastic waste disposal and allied microbial routes for its effective degradation: A comprehensive review. J. Clean. Prod. 2019, 208, 65–76. [Google Scholar] [CrossRef]
- Pilapitiya, P.N.T.; Ratnayake, A.S. The world of plastic waste: A review. Clean. Mater. 2024, 11, 100220. [Google Scholar] [CrossRef]
- Selvin, M.; Shah, S.; Maria, H.J.; Thomas, S.; Tuladhar, R.; Jacob, M. Review on recycling of cross-linked polyethylene. Ind. Eng. Chem. Res. 2024, 63, 1200–1214. [Google Scholar] [CrossRef]
- Grand View Research. Recycled Plastics Industry Data Book—Recycled Polyethylene, Recycled Polyethylene Terephthalate (rPET), Recycled Polypropylene, Recycled Polyvinyl Chloride (PVC) and Recycled Polystyrene Market Size, Share, Trends Analysis, and Segment Forecasts, 2023–2030; Grand View Research: San Francisco, CA, USA, 2023; p. 350. [Google Scholar]
- Li, X.; Mahadas, N.A.; Zhang, M.; DePodesta, J.; Stefik, M.; Tang, C. Sustainable high-density polyethylene via chemical recycling: From modification to polymerization methods. Polymer 2024, 295, 126698. [Google Scholar] [CrossRef]
- Pick, L.; Hanna, P.R.; Gorman, L. Assessment of processibility and properties of raw post-consumer waste polyethylene in the rotational moulding process. J. Polym. Eng. 2022, 42, 374–383. [Google Scholar] [CrossRef]
- De Castro, R.D.; de Souza, T.M.P.A.; Bezerra, L.M.D.; Ferreira, G.L.S.; de Brito Costa, E.M.M.; Cavalcanti, A.L. Antifungal activity and mode of action of thymol and its synergism with nystatin against Candida species involved with infections in the oral cavity: An in vitro study. BMC Complement. Altern. Med. 2015, 15, 417. [Google Scholar] [CrossRef]
- El-Mokasabi, F.M. Floristic Composition and Traditional Uses of Plant Species at Wadi Alkuf, Al-Jabal Al-Akhder, Libya. J. Agric. Environ. Sci 2014, 14, 685–697. [Google Scholar]
- Bledzki, A.K.; Reihmane, S.A.; Gassan, J. Thermoplastics reinforced with wood fillers: A literature review. Polym. Plast. Technol. Eng. 1998, 37, 451–468. [Google Scholar] [CrossRef]
- Meyers, R.A. Molecular Biology and Biotechnology: A Comprehensive Desk Reference, 1st ed.; John Wiley & Sons. VCH: New York, NY, USA, 1995; 1034p. [Google Scholar]
- Jung, M.R.; Horgen, F.D.; Orski, S.V.; Rodriguez, V.; Beers, K.L.; Balazs, G.H.; Jones, T.T.; Work, T.M.; Brignac, K.C.; Royer, S.J.; et al. Validation of ATR FT-IR to identify polymers of plastic marine debris, including those ingested by marine organisms. Mar. Pollut. Bull. 2018, 127, 704–716. [Google Scholar] [CrossRef]
- Yu, B.; Cao, C.F.; Yuen, R.K. Progress in flame-retardant sustainable fiber/polymer composites. In Bio-Based Flame-Retardant Technology for Polymeric Materials; Elsevier: Amsterdam, The Netherlands, 2022; pp. 419–449. [Google Scholar] [CrossRef]
- Mohammed, M.; Oleiwi, J.K.; Mohammed, A.M.; Mohamad, A.J.A. A Review on the Advancement of Renewable Natural Fiber Hybrid Composites: Prospects, Challenges, and Industrial Applications. J. Renew. 2024, 12, 1237–1290. [Google Scholar] [CrossRef]
- Lu, N.; Swan, R.H., Jr.; Ferguson, I. Composition, structure, and mechanical properties of hemp fiber reinforced composite with recycled high-density polyethylene matrix. J. Compos. Mater. 2012, 46, 1915–1924. [Google Scholar] [CrossRef]
- Makhlouf, A.; Belaadi, A.; Amroune, S.; Bourchak, M.; Satha, H. Elaboration and characterization of flax fiber reinforced high density polyethylene biocomposite: Effect of the heating rate on thermo-mechanical properties. J. Nat. Fibers 2022, 19, 3928–3941. [Google Scholar] [CrossRef]
- Slima, D.F.; Alhobishi, H.A.; Turki, Z.A. Phytochemical screening on deverra tortuosa (Desf.) dc. collected from different habitats in Egypt. Egypt. J. Bot. 2021, 61, 849–866. [Google Scholar] [CrossRef]
- Sharaf, M.H. Evaluation of the antivirulence activity of ethyl acetate extract of Deverra tortuosa (Desf) against Candida albicans. Egypt. Pharm. J. 2020, 19, 188–196. [Google Scholar] [CrossRef]
- Fayed, E.M.; Abd-EIGawad, A.M.; Elshamy, A.I.; El-Halawany, E.S.F.; EI-Amier, Y.A. Essential oil of Deverra tortuosa Aerial Parts: Detailed Chemical Profile, Allelopathic, Antimicrobial, and Antioxidant Activities. Chem. Biodivers. 2021, 18, e2000914. [Google Scholar] [CrossRef]
- Almadiy, A.A.; Nenaah, G.E.; Albogami, B.Z. Bioactivity of Deverra tortuosa essential oil, its nanoemulsion, and phenylpropanoids against the cowpea weevil, a stored grain pest with eco-toxicological evaluations. Environ. Sci. Pollut. Res. 2022, 29, 65112–65127. [Google Scholar] [CrossRef]
- Khammassi, M.; Polito, F.; Kochti, O.; Kouki, H.; Souihi, M.; Khedhri, S.; Hamrouni, L.; Mabrouk, Y.; Amri, I.; De Feo, V. Investigation on Chemical Composition, Antioxidant, Antifungal and Herbicidal Activities of Volatile Constituents from Deverra tortuosa (Desf.). Plants 2023, 12, 2556. [Google Scholar] [CrossRef]
- Bidak, L.M.; Kamal, S.A.; Halmy, M.W.A.; Heneidy, S.Z. Goods and services provided by native plants in desert ecosystems: Examples from the northwestern coastal desert of Egypt. Glob. Ecol. Conserv. 2015, 3, 433–447. [Google Scholar] [CrossRef]
- Ribeiro, M.P.; de Mendonça Neuba, L.; da Silveira, P.H.P.M.; da Luz, F.S.; da Silva Figueiredo, A.B.H.; Monteiro, S.N.; Moreira, M.O. Mechanical, thermal and ballistic performance of epoxy composites reinforced with Cannabis sativa hemp fabric. J. Mater. 2021, 12, 221–233. [Google Scholar] [CrossRef]
- Benkhelladi, A.; Laouici, H.; Bouchoucha, A. Tensile and flexural properties of polymer composites reinforced by flax, jute and sisal fibres. Int. J. Adv. Manuf. Technol. 2020, 108, 895–916. [Google Scholar] [CrossRef]
- Neves, A.C.C.; Rohen, L.A.; Mantovani, D.P.; Carvalho, J.P.; Vieira, C.M.F.; Lopes, F.P.; Monteiro, S.N. Comparative mechanical properties between biocomposites of Epoxy and polyester matrices reinforced by hemp fiber. J. Mater. 2020, 9, 1296–1304. [Google Scholar] [CrossRef]
- Ndengue, M.J.; Ayissi, M.Z.; Noah, P.M.A.; Ebanda, F.B.; Ateba, A. Implementation and evaluation of certain properties of a polymer matrix composite material reinforced by fibrous residues of Saccharum officinarum in view of an applicability orientation. J. Miner. Mater. Charact. Eng. 2021, 9, 206. [Google Scholar] [CrossRef]
- Legrand, N.B.R.; Pierre, O.; Fabien, B.E.; Marcel, N.P.; Jean, A.A. Physico-chemical and thermal characterization of a lignocellulosic fiber, extracted from the bast of cola lepidota stem. J. Miner. Mater. Charact. Eng. 2020, 8, 377–392. [Google Scholar] [CrossRef]
- Abdmouleh, M.; Jedidi, I.; Khitouni, M.; Ben Salah, A.; Kabadou, A. LDPE phase composition in LDPE/Cu composites using thermal analysis and FTIR spectroscopy. J. Appl. Spectrosc. 2011, 78, 174–182. [Google Scholar] [CrossRef]
- Eun, J.C.T. Handbook of Engineering Practice of Materials and Corrosion; Springer Nature: Houston, TX, USA, 2020; pp. 1–116. [Google Scholar] [CrossRef]
- Hanana, F.E.; Rodrigue, D. Rotational molding of self-hybrid composites based on linear low-density polyethylene and maple fibers. Polym. Compos. 2018, 39, 4094–4103. [Google Scholar] [CrossRef]
- Kuram, E. Advances in development of green composites based on natural fibers: A review. Emergent Mater. 2022, 5, 811–831. [Google Scholar] [CrossRef]
- Bollino, F.; Giannella, V.; Armentani, E.; Sepe, R. Mechanical behavior of chemically-treated hemp fibers reinforced composites subjected to moisture absorption. J. Mater. 2023, 22, 762–775. [Google Scholar] [CrossRef]
- Taşdemır, M.; Biltekin, H.; Caneba, G.T. Preparation and characterization of LDPE and pp—Wood fiber composites. J. Appl. Polym. Sci. 2009, 112, 3095–3102. [Google Scholar] [CrossRef]
- Gulmine, J.V.; Janissek, P.R.; Heise, H.M.; Akcelrud, L. Polyethylene characterization by FTIR. Polym. Test. 2002, 21, 557–563. [Google Scholar] [CrossRef]
- Coates, J. Interpretation of Infrared Spectra, A Practical Approach. Encyclopedia of Analytical Chemistry; Meyers, R.A., Ed.; Coates Consulting: Newtown, CT, USA, 2000; Volume 12, pp. 10815–10837. [Google Scholar] [CrossRef]
- Kossack, W.; Papadopoulos, P.; Parkinson, M.; Prades, F.; Kremer, F. IR transition moment orientational analysis on semi-crystalline polyethylene films. Polymer 2011, 52, 6061–6065. [Google Scholar] [CrossRef]
- Khonakdar, H.A.; Morshedian, J.; Wagenknecht, U.; Jafari, S.H. An investigation of chemical crosslinking effect on properties of high-density polyethylene. Polymer 2003, 44, 4301–4309. [Google Scholar] [CrossRef]
- Xanthopoulou, E.; Chrysafi, I.; Polychronidis, P.; Zamboulis, A.; Bikiaris, D.N. Evaluation of eco-friendly hemp-fiber-reinforced recycled HDPE composites. J. Compos. 2023, 7, 138. [Google Scholar] [CrossRef]
- Dolçà, C.; Fages, E.; Gonga, E.; Garcia-Sanoguera, D.; Balart, R.; Quiles-Carrillo, L. The effect of varying the amount of short hemp fibers on mechanical and thermal properties of wood–plastic composites from biobased polyethylene processed by injection molding. Polymers 2021, 14, 138. [Google Scholar] [CrossRef]
- Shebani, A.; Klash, A.; Elhabishi, R.; Abdsalam, S.; Elbreki, H.; Elhrari, W. The Influence of LDPE Content on the Mechanical Properties of HDPE/LDPE Blends. J. Mater. Sci. 2018, 7, 791–797. [Google Scholar] [CrossRef]
- Li, D.; Zhou, L.; Wang, X.; He, L.; Yang, X. Effect of crystallinity of polyethylene with different densities on breakdown strength and conductance property. Materials 2019, 12, 1746. [Google Scholar] [CrossRef]
- Koffi, A.; Koffi, D.; Toubal, L. Mechanical properties and drop-weight impact performance of injection-molded HDPE/birch fiber composites. Polym. Test. 2021, 93, 106956. [Google Scholar] [CrossRef]
- Banakar, P.; Shivananda, H.K.; Niranjan, H.B. Influence of fiber orientation and thickness on tensile properties of laminated polymer composites. Int. J. Pure Appl. Sci. Technol. 2012, 9, 61. Available online: https://www.researchgate.net/publication/268205497 (accessed on 1 January 2024).
- Podder, A.K.; Mohamed, M.A.; Tseropoulos, G.; Nasiri, B.; Andreadis, S.T. Engineering Nanofiber Scaffolds with Biomimetic Cues for Differentiation of Skin-Derived Neural Crest-like Stem Cells to Schwann Cells. Int. J. Mol. Sci. 2022, 23, 10834. [Google Scholar] [CrossRef]
- Ren, B.; Noda, J.; Goda, K. Effects of fiber orientation angles and fluctuation on the stiffness and strength of sliver-based green composites. J. Mater. Sci. 2010, 59, 567–574. [Google Scholar] [CrossRef]
- Alkan, M.; Hopa, Ç.; Yilmaz, Z.; Güler, H. The effect of alkali concentration and solid/liquid rati2o on the hydrothermal synthesis of zeolite NaA from natural kaolinite. Micropor. Mesopor. Mat. 2005, 86, 176–184. [Google Scholar] [CrossRef]
- Garaeva, S.R.; Aydin, A.A.; Aydin, A.; Yalçin, B.; Fatullaeva, P.A.; Medzhidov, A.A. Composition, properties, and application of products formed in oxidation of polyethylene by nitric acid. Russ. J. Appl. Chem. 2010, 83, 97–101. [Google Scholar] [CrossRef]
- Platz, M. Gamle i Eget Hjem, Socialforskningsinstituttet, Levekår; Rapport: København, Denmark, 1989; Volume 89, p. 12. ISBN 87-7487-386-5/978-87-7487-386-0. [Google Scholar]
- da Silveira, P.H.P.M.; Santos, M.C.C.D.; Chaves, Y.S.; Ribeiro, M.P.; Marchi, B.Z.; Monteiro, S.N.; Bastos, D.C. Characterization of thermo-mechanical and chemical properties of polypropylene/hemp fiber biocomposites: Impact of maleic anhydride compatibilizer and fiber content. Polymers 2023, 15, 3271. [Google Scholar] [CrossRef] [PubMed]
- Oksman, K. Mechanical Properties of Natural Fibre Mat Reinforced Thermoplastic. Appl. Compos. Mater. 2000, 7, 403–414. [Google Scholar] [CrossRef]


| Fiber Origin | Compounds of D. tortuosa (%) | References |
|---|---|---|
| Degla valley protectorate, Elmaadi, Cairo, Egypt [29°56′16.5559″ N, 32°10′52.5384″ E] | 9-octadecenoic acid (Z)-, methyl ester (28.39) | [18] |
| Wadi El-Rashrash, Eastern Desert, Egypt (29°26′44.1″ N, 31°29′54.1″ E) | β-phellandrene (10.49) α-terpinene (6.21) m-cymene (4.65) p-cymenene (3.16) α-terpinolene (2.78) | [19] |
| Widyian region (Wadi Abalkour, (30°0.83′02″ N, 41°0.24′53″ E), 53 km east of Arar City, Saudi Arabia | dillapiole (41.6) elemicin (7.3) myristicin (5.1) sabinene (4.2) | [20] |
| Djerissa, Kef region, located in the northwest of Tunisia (35°50′40″ N, 8°37′40″ E) | α-pinene (28.8) sabinene (18.67) β-pinene (6.2) cis-ocimene (7.85) | [21] |
| Samples | Tm (°C) | Tc (°C) | ΔHm (J/g) | Xc (%) |
|---|---|---|---|---|
| rLDPE | 122.7 | 110.0 | 99.6 | 34.9 |
| S1 10% | 122.7 | 109.9 | 89.8 | 35.0 |
| S1 20% | 125.9 | 108.3 | 78.6 | 34.5 |
| S1 30% | 125.6 | 108.3 | 58.9 | 29.5 |
| S2 10% | 123.6 | 109.7 | 93.3 | 36.3 |
| S2 20% | 122.2 | 109.9 | 86.5 | 37.9 |
| S2 30% | 123.6 | 108.9 | 76.7 | 38.4 |
| Samples | Crystallization Temperature (°C) | ||
|---|---|---|---|
| Peak 1 | Peak 2 | Peak 3 | |
| rLDPE | 58.6 | 94.3 | 110.1 |
| S1 10% | 58.2 | 93.8 | 110.0 |
| S1 20% | 57.1 | 92.2 | 108.8 |
| S1 30% | 57.7 | 91.5 | 108.7 |
| S2 10% | 58.2 | 94.2 | 109.9 |
| S2 20% | 58.0 | 94.4 | 109.9 |
| S2 30% | 57.9 | 93.6 | 109.1 |
Disclaimer/Publisher’s Note: The statements, opinions and data contained in all publications are solely those of the individual author(s) and contributor(s) and not of MDPI and/or the editor(s). MDPI and/or the editor(s) disclaim responsibility for any injury to people or property resulting from any ideas, methods, instructions or products referred to in the content. |
© 2024 by the authors. Licensee MDPI, Basel, Switzerland. This article is an open access article distributed under the terms and conditions of the Creative Commons Attribution (CC BY) license (https://creativecommons.org/licenses/by/4.0/).
Share and Cite
Zorgui, T.; Ahmad, H.; Romdhane, M.; Rodrigue, D. Recycled Low Density Polyethylene Reinforced with Deverra tortuosa Vegetable Fibers. J. Compos. Sci. 2024, 8, 394. https://doi.org/10.3390/jcs8100394
Zorgui T, Ahmad H, Romdhane M, Rodrigue D. Recycled Low Density Polyethylene Reinforced with Deverra tortuosa Vegetable Fibers. Journal of Composites Science. 2024; 8(10):394. https://doi.org/10.3390/jcs8100394
Chicago/Turabian StyleZorgui, Tahani, Hibal Ahmad, Mehrez Romdhane, and Denis Rodrigue. 2024. "Recycled Low Density Polyethylene Reinforced with Deverra tortuosa Vegetable Fibers" Journal of Composites Science 8, no. 10: 394. https://doi.org/10.3390/jcs8100394