Article

Investigation of Tribological Behavior of PTFE Composites Reinforced with Bronze Particles by Taguchi Method

1
Global Arge, Osmanyilmaz Mah. 634 Sok. No: 31, Gebze, Kocaeli 41400, Turkey
2
Materials and Surface Engineering, Group, Chemnitz University of Technology, Erfenschlager Str. 73, 09125 Chemnitz, Germany
*
Author to whom correspondence should be addressed.
J. Compos. Sci. 2024, 8(10), 398; https://doi.org/10.3390/jcs8100398
Submission received: 22 August 2024 / Revised: 27 September 2024 / Accepted: 29 September 2024 / Published: 2 October 2024
(This article belongs to the Section Polymer Composites)

Abstract

:
Reinforced PTFE materials can be designed to show high mechanical stability against harder materials under sliding wear conditions. Especially bearing metal-reinforced PTFE is of high practical interest. In this class of materials, bronze-filled PTFE was reported to obtain high wear resistance, a low coefficient of friction (COF), and excellent self-lubrication properties in sliding conditions. In the statistical approach of this work, PTFE composites reinforced with 25 vol%, 40 vol%, and 60 vol% bronze particles were evaluated against pure PTFE regarding wear behavior under varied wear test parameters, i.e., material, normal load, and sliding speed. Wear tests were planned to use a standard orthogonal array based on the Taguchi design method. An analysis of variance test was utilized to quantify the effects of test parameters on the wear behavior of the bronze/PTFE composites and pure PTFE. According to the variance analysis, the material type has the largest influence on the COF and the specific wear rate (SWR) under test conditions of this work. Both COF and SWR were found to be influenced by the material type (29.83% and 96.16%), the normal load (33.34% and 0.95%), and sliding speed (9.14% and 1.28%). The lowest SWR and COF values were achieved at the optimum wear test conditions where the wear test parameters were 1 m/s sliding speed (A4B2C2) at PTFE + 60 vol.% bronze reinforced composite 50 N application load and 0.32 m/s sliding speed (A4B3C1) at PTFE + 60 vol.% bronze reinforced composite 100 N application load, respectively.

1. Introduction

PTFE is a hard and tough engineering thermoplastic that offers excellent antistick surface, low friction, high chemical resistance, high thermal/electrical properties, and environmentally friendly features [1,2,3]. Nevertheless, PTFE has poor physical and mechanical properties and a high production cost [4,5]. To improve its mechanical properties and wear resistance by ensuring dimensional stability, PTFE is often reinforced with carbon and glass fibers and some other fillers such as bronze, graphite, and molybdenum disulfide [2,3,4,5]. It has been reported that, when PTFE polymer alone or its various composites are reinforced with the bronze particles, higher mechanical strength, higher hardness, and higher dimensional stability can be obtained [1,2,3,4,5]. Although there are various studies in the literature dealing with the tribological behaviors of various filler materials with PTFE matrix, it is claimed that bronze-filled PTFEs in particular stand out with their superior wear resistance, lower COF, and excellent self-lubrication properties [4]. It has also been reported that the tribological behaviors of PTFE composites are also dependent on the working and environmental conditions such as relative humidity, temperature, normal load, sliding speed, sliding distance, vibration, and lubrication [5].
Number of studies carried out to explore the mechanical properties and the wear behavior of PTFE matrix materials by commonly employed Taguchi method as an experimental design and analysis tool [6,7,8,9,10,11,12,13]. Yadov et al. [6] studied the wear resistance of PTFE filled with glass fibers and bronze particles using the Taguchi technique. They concluded that sliding distance and normal load values had an important influence on the wear mechanism of the PTFE composite materials. The wear rate of the composite decreased by two folds with increasing volume fraction of bronze particles in the PTFE matrix.
Sadaphal et al. [7] used the Taguchi design method to study the effect of test conditions such as normal load, sliding distance, and velocity on the tribological characteristics of both PTFE and PTFE composites filled with black carbon particles. They concluded that the wear resistance of PTFE is significantly improved when reinforced with black carbon in various volume fractions. Moreover, the influence of the volume fraction of the reinforcing material on the wear behavior of PTFE composite increases in such a manner that the wear resistance increases as the volume fraction of the reinforcement increases.
Patare et al. [9] reported that increased wear performance and sliding wear resistance (SWR) were obtained when glass fiber (GF) was added into the PTFE polymer matrix. Various researchers tried to optimize the test parameters in tribological tests of PTFE composites and pure PTFE polymers by the Taguchi method [11,12,13,14]. Among them, Varpe et al. [11] analyzed the tribological performance of PTFE composites with different filler materials such as glass fiber (GF), graphite, and molybdenum disulfide (MoS2). They concluded that PTFE + 25 vol.% GF composite shows a higher coefficient of friction than both PTFE + 25 vol.% GF + 5 vol.% graphite and PTFE + 25 vol.% GF + 5 vol.% MoS2 composites. Furthermore, Bagale et al. [14] investigated tribological behavior analysis of pure PTFE polymer and PTFE composites reinforced with 25 vol.% bronze particles, 25 vol.% carbon black, and 25 vol.% glass fibers under wet conditions, and experimental work was analyzed using a Design of Experiment (DOE) commercial software. They reported that the wear resistance of the PTFE composite reinforced with carbon black is higher than that of the PTFE composite reinforced with glass fibers and bronze particles.
Despite that, due to its long-term toxicity, PTFE has been restricted in some areas, especially in medical applications and the health sector. However, owing to its superior tribological properties, it continues to be utilized in both scientific and industrial research [15,16,17,18].
In the presented work, the improving effect of a metal particle reinforcement on PTFE is systematically investigated. Focusing on bronze that in itself shows very good tribological properties in combination with high mechanical stability in bearing applications, the tribological properties of PTFE composite reinforced with 25, 40, and 60 vol.% bronze are investigated and compared against pure PTFE polymer. COF and SWR values are determined by applying four different sliding speeds (0.32, 1,1.5, and 2.0 m/s) and four different loads (10, 50, 100, and 200 N). To evaluate the statistical contribution and significance of each parameter setting, the Taguchi optimization method and ANOVA analysis were applied. In this way, their effects on COF and SWR were determined, and the optimum application parameters for bronze-reinforced PTFE were identified.

2. Taguchi Method

The Taguchi method, which has been widely used in experimental design for scientific, engineering, and industrial investigations, was developed by Taguchi Genichi [19]. Optimization of the parameters and the combination of test variables that influences the output properties might also be performed by using the Taguchi method. This approach is simple, strong, efficient, and practicable for most of the designed experimental systems. It consists of three phases: system design, parameter design, and tolerance design. The scope of designs is the application of engineering and/or scientific approval in fabrication for any product, determination of optimal test values to modify the system output and tolerance design, and examination of acceptance at optimal conditions suggested by the second phase [20].

3. Experimental Procedure

3.1. Materials

When bronze particles are added to PTFE, the resultant composite has several advantageous characteristics, including reduced wear, increased compressive strength, improved dimensional stability, and little creep. Therefore, test specimens were produced in this study by adding bronze to the PTFE matrix material in three different ratios to determine the optimum amount of bronze. The PTFE used as matrix material has the trade name G25 Reproflon and was obtained from MikroTechnik Plastics GmbH and Co.KG (Miltenberg, Germany). The physical and mechanical properties of PTFE are shown in Table 1.
The bronze particle powder preferred as the reinforcing phase was provided by Dr. Fritsch GmbH and Co. KG (Fellbach, Germany) under the trade name “Diabro-604045”. The physical properties of the bronze particles are given in Table 2.

3.2. Test Samples Preparation

For the test specimens, bronze particles were added in sizes of 5–60 µm. Grain-size analysis was performed in a Microtrac S 3500 device (Microtrac RetschTechnology, Haan, Germany). Werner Pfleiderer brand NRII-75 twin-screw extruder machine was used for PTFE polymer composites in granule form. The temperature range for the extruder machine heater was 220–255 °C. After the materials produced in the extruder were cooled in the cooling pool, they were cut into granules, and composite materials were produced. To ensure a homogeneous mixture, the granules produced were fed to the extruder from the feeding unit for the second time, and the mixing process was homogenized. Tribology specimens were produced in specially designed molds. Test specimens with a diameter of 6 mm and a length of 50 mm were produced in the molds by pressing in the injection machine. Injection heater temperatures were set between 220–250 °C. A Clemex image analyzer equipped with a Nikon Eclipse L150A optical microscope (Nikon Metrology Inc., Tokyo, Japan) was used to detect the distribution of bronze particles within the PTFE matrix.

3.3. Tribological Tests

Dry sliding friction tests are carried out using a pin-on-disk machine. The sample dimensions were chosen as 6 mm in diameter and 50 mm in length. AISI 440C stainless steel plate having 20 mm thickness, 175 mm diameter, and Ra = 0.27–0.32 µm surface roughness was used as a counter disk. Table 3 shows the chemical composition of AISI 440C stainless steel used in the experiment. Wear test conditions and material characteristics of the test specimens were shown in Table 4. In addition, the real image of the test specimens used in the wear tests is shown in Figure 1.
The tribology tests were conducted under ambient conditions (see Table 4) by varying normal load as 10 N, 50 N, 100 N, and 200 N and sliding speed as 0.32 m/s, 1.0 m/s, 1.5 m/s, and 2.0 m/s. Following each test, the PTFE polymer and PTFE composite samples were removed from the test setup, and the samples and the stainless-steel disk were cleaned ultrasonically with acetone in a bath and then dried. A MATLAB program was used to calculate the coefficient of friction of the test samples according to the ASTM G99-95 standard. The tribometer used in this study was specially designed and manufactured by the university. A schematic picture of the pin-on-disc device used in this study is given in Figure 2.
The COF values (µ) of the PTFE polymer and PTFE composites reinforced with bronze particles were calculated by using Equation (1):
F = μ x N
where F is friction force and N is the average normal load. In general, the SWR is expressed as the wear volume loss, normalized by the sliding distance and the normal load. V is the volume loss due to wear, which is calculated using Equation (2).
V = m / p
where p is the density of the sample and m is the mass loss of the samples. SWR was estimated by using the following relationship.
W S W R = V N x S  
where, S is the sliding distance. The wear mechanism of the specimens was studied using a Clemex image analyzer equipped with a Nikon Eclipse L150A optical microscope (Nikon Metrology Inc., Japan) and a Jeol JSM-5410 model SEM (JEOL Ltd., Tokyo, Japan).

3.4. Design of Experiments

To select a suitable Taguchi standard orthogonal array that can be adapted to any experimental test, it is necessary to know the test parameters and their levels [21,22]. In accordance with this issue, the total degrees of freedom (DOF) were calculated according to the determined test parameters and their levels. Total DOF of test parameters could be lower and/or equal to DOF of the standard orthogonal array [23]. Since the 3 factors used in this study and these factors have 4 levels, the most appropriate orthogonal array is designed as an L16 orthogonal array using MINITAB software and shown in Table 5. In addition, each test condition was performed 3 times, and the arithmetic average was taken. Since the Taguchi method does not allow interaction with the selected array, the interaction between wear test parameters is not included in this study. Table 6 shows the levels of wear test parameters and the test conditions for each level.
In this study, Taguchi L16 (45) standard orthogonal array was chosen, and the experimental parameters selected with a total of 16 experiments, including the combination of the levels of each test parameter, are summarized in Table 5. The effect of wear test parameters was analyzed by using MINITAB 19.1 package software.

4. Results and Discussions

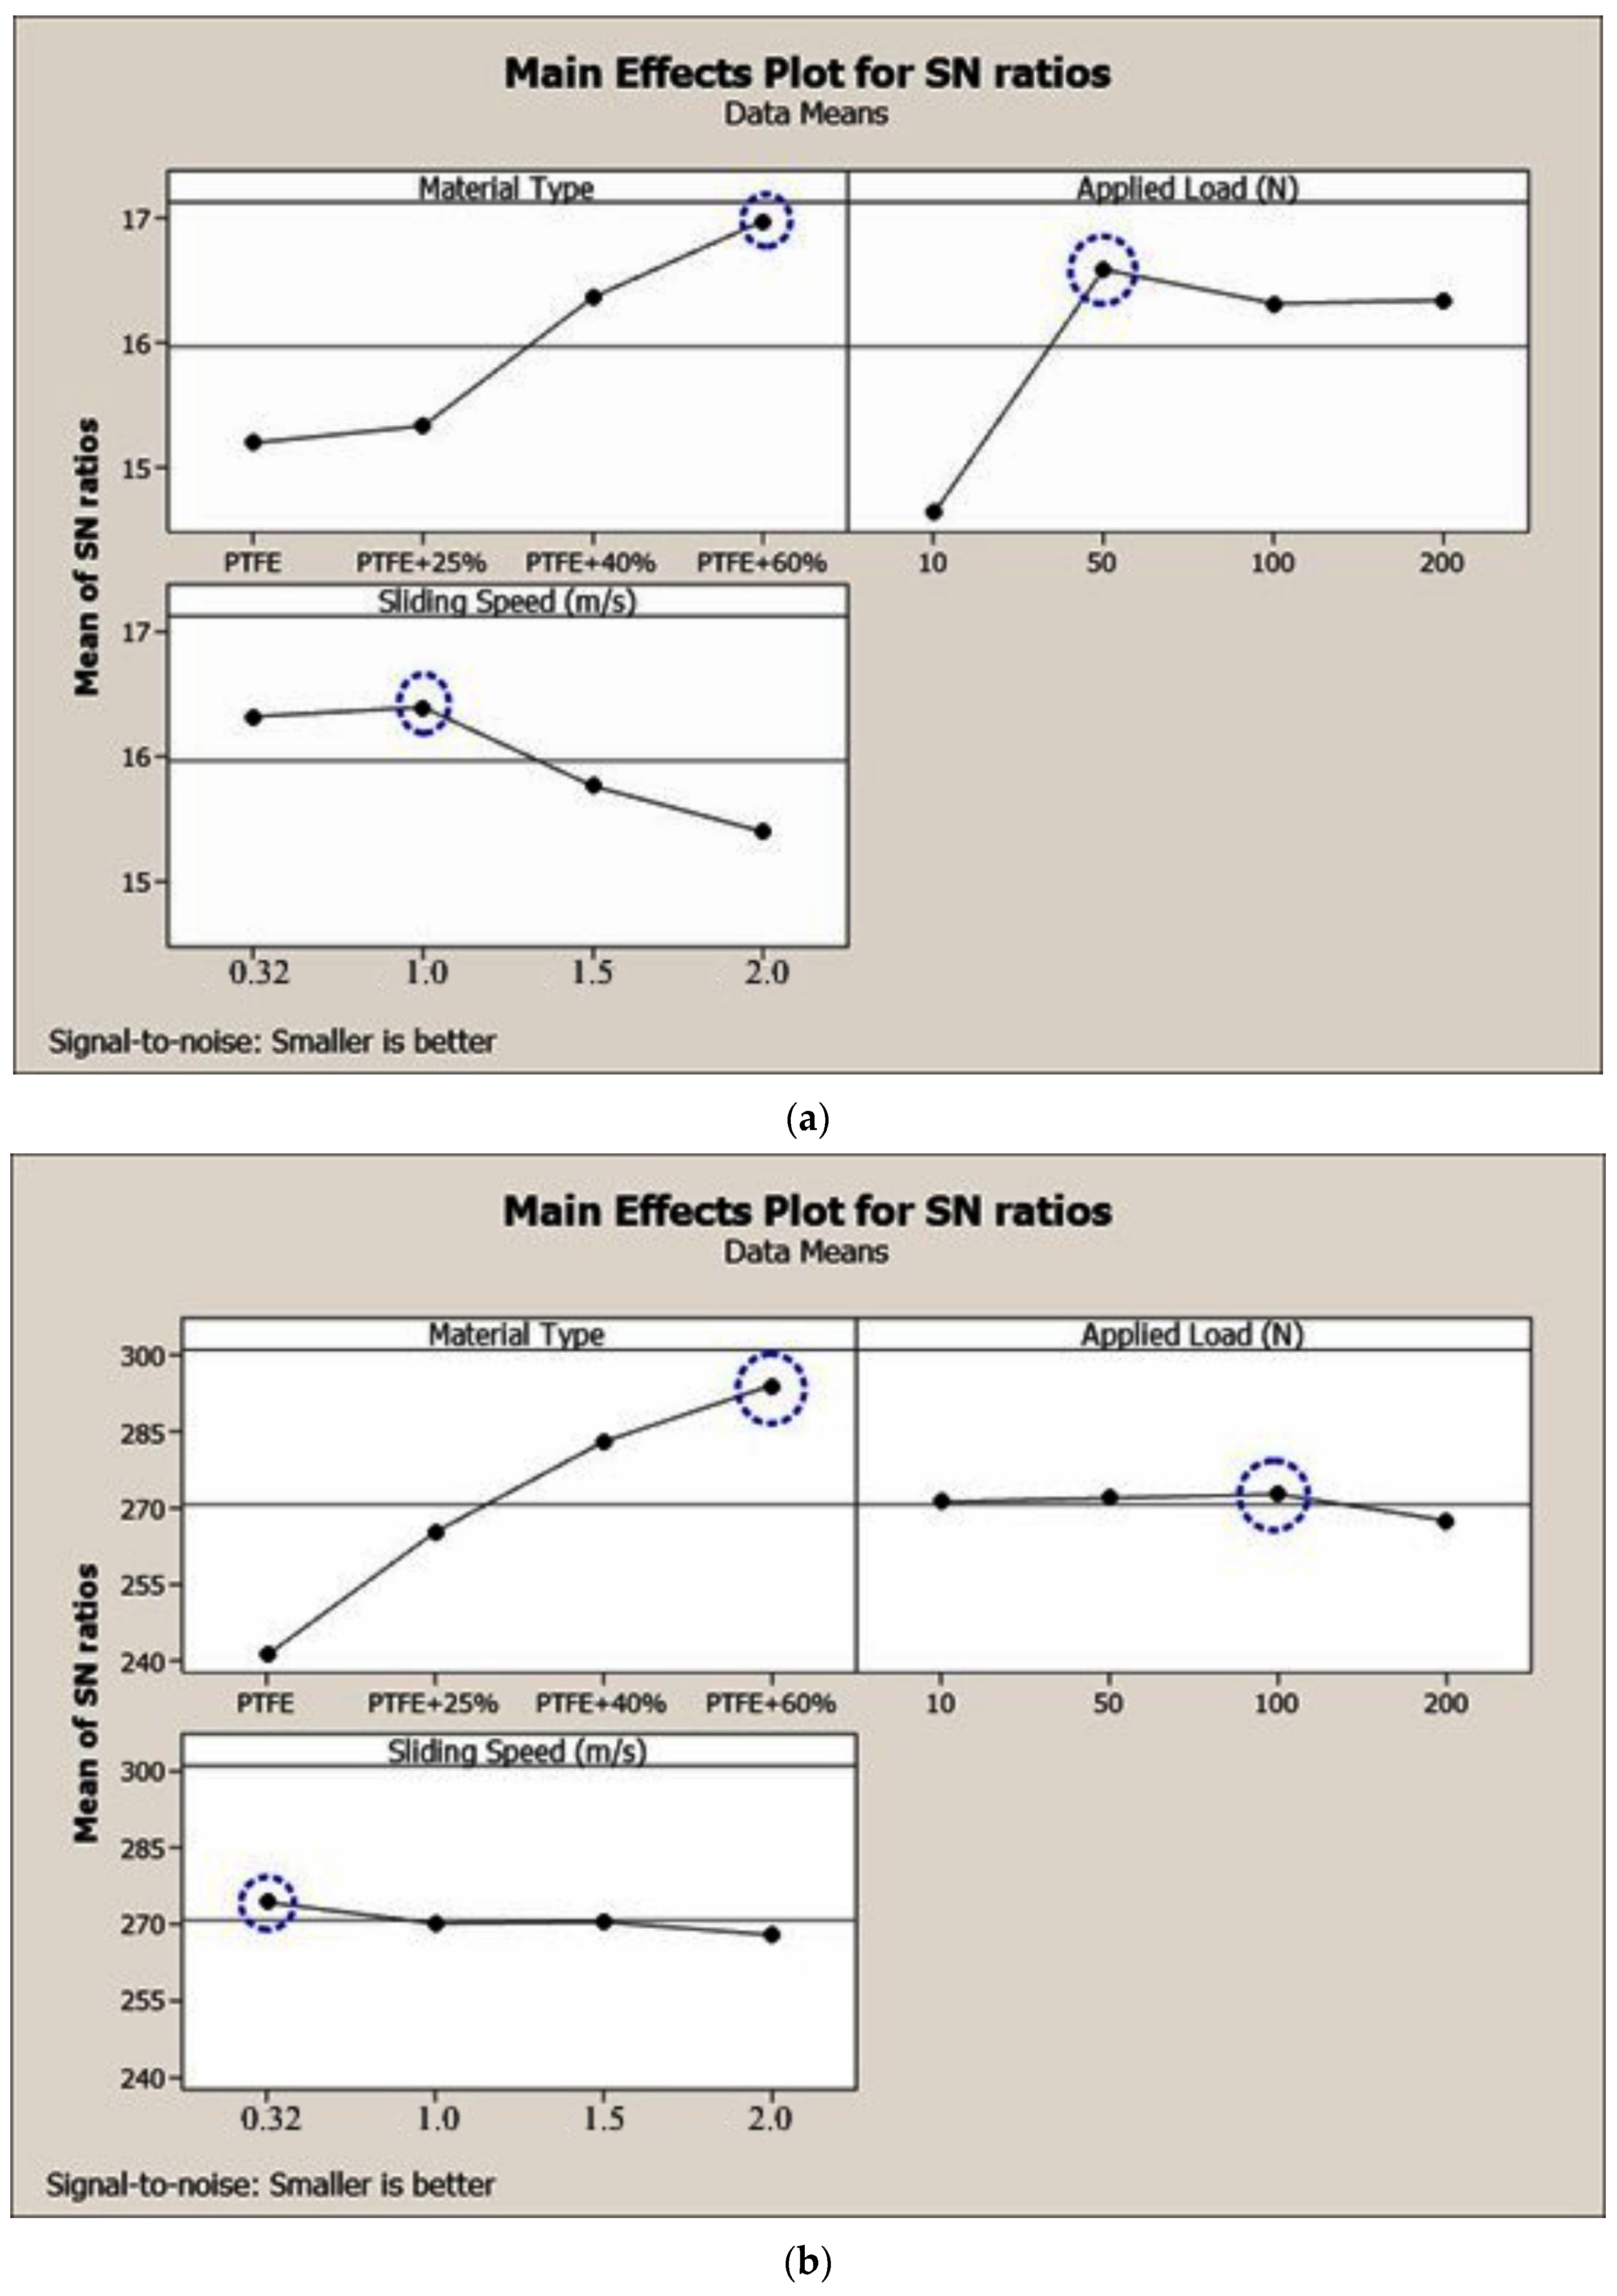
4.1. Analysis of Test Parameters

In the Taguchi method, signal (S) is called the desired value, noise (N) is called the undesired value, and the S/N ratio expresses the distribution around the desired value. There are several quality characteristics in the Taguchi method, such as “smaller is better”, “nominal is best”, and “larger is better”. The “smaller is better” quality characteristic is often preferred to reduce the COF and SWR of test samples. Therefore, in this study, the S/N ratio was calculated using Equation (4), which was expressed in the below part.
S N = 10 l o g 1 n i = 1 n y i 2
where ‘n’ is the number of tests and ‘yi’ is the value of the experimental result of the ith test. Table 7 shows the calculated S/N ratios in the 16th run by Equation (4).
The response table for mean S/N ratios of COF was shown in Table 8, where the calculated S/N ratios for each level of wear test parameters can also be seen. For each wear test parameter, the most dominant parameter is determined as the parameter with the highest delta value, according to the delta value in the response table, which is calculated by the difference of the maximum and minimum S/N ratios.
The response table for the mean S/N ratios of SWR was shown in Table 9. As can be seen from Table 8, the strongest influence on the COF was observed with the normal load (1) and with the material type (2), respectively. From Table 9, it is also observed that the strongest influential factors on the SWR are the material type (1) and the sliding speed (2), respectively.
The main effect plots of the test parameters were obtained using Minitab 19.0 commercial software and are shown in Figure 3a,b. In Figure 3a, the levels of optimum test parameters for minimum COF can be seen, with test parameters at optimum levels including material type (level 4), normal load (level 2) and sliding speed (level 2) test conditions. From Figure 3b, the optimum level of test parameters was achieved with material type (level 4), normal load (level 3), and sliding speed (level 1) test conditions.

4.2. Analysis of Variance (ANOVA) Test

The influence of wear test parameters on the COF and SWR of PTFE composite reinforced with bronze particles and PTFE polymer was analyzed by the ANOVA test in Table 10 and Table 11. Individual contribution percentages of each test parameter were obtained by ANOVA test results. The FTest value was calculated to be between 90% and 99.5% confidence intervals for each wear test parameter. In general, when FTest > 4, it is considered for any test parameter to have a strong influence on the quality characteristic. Conversely, it is suggested that a factor below 4 is insignificant and should be ignored. In this respect, when Table 10 is examined, the sliding speed parameter with a value of 0.66, which has cumulative influence on the COF, can be considered negligible. p-value refers to the significance level. According to Table 10, the normal load and sliding speed parameters were neglected.
The most important parameters for minimum COF up to Table 10 are normal load factor and material type factor with the values of 33.34% and 29.83%, respectively. Moreover, the most important parameter for minimum wear is the material type factor, with a value of 96.16% as shown in Table 11. These results are in good agreement with previous studies [24,25]. All in all, ANOVA test results in Table 10 and Table 11 indicate that the material type parameter was the most dominant parameter for COF and SWR.

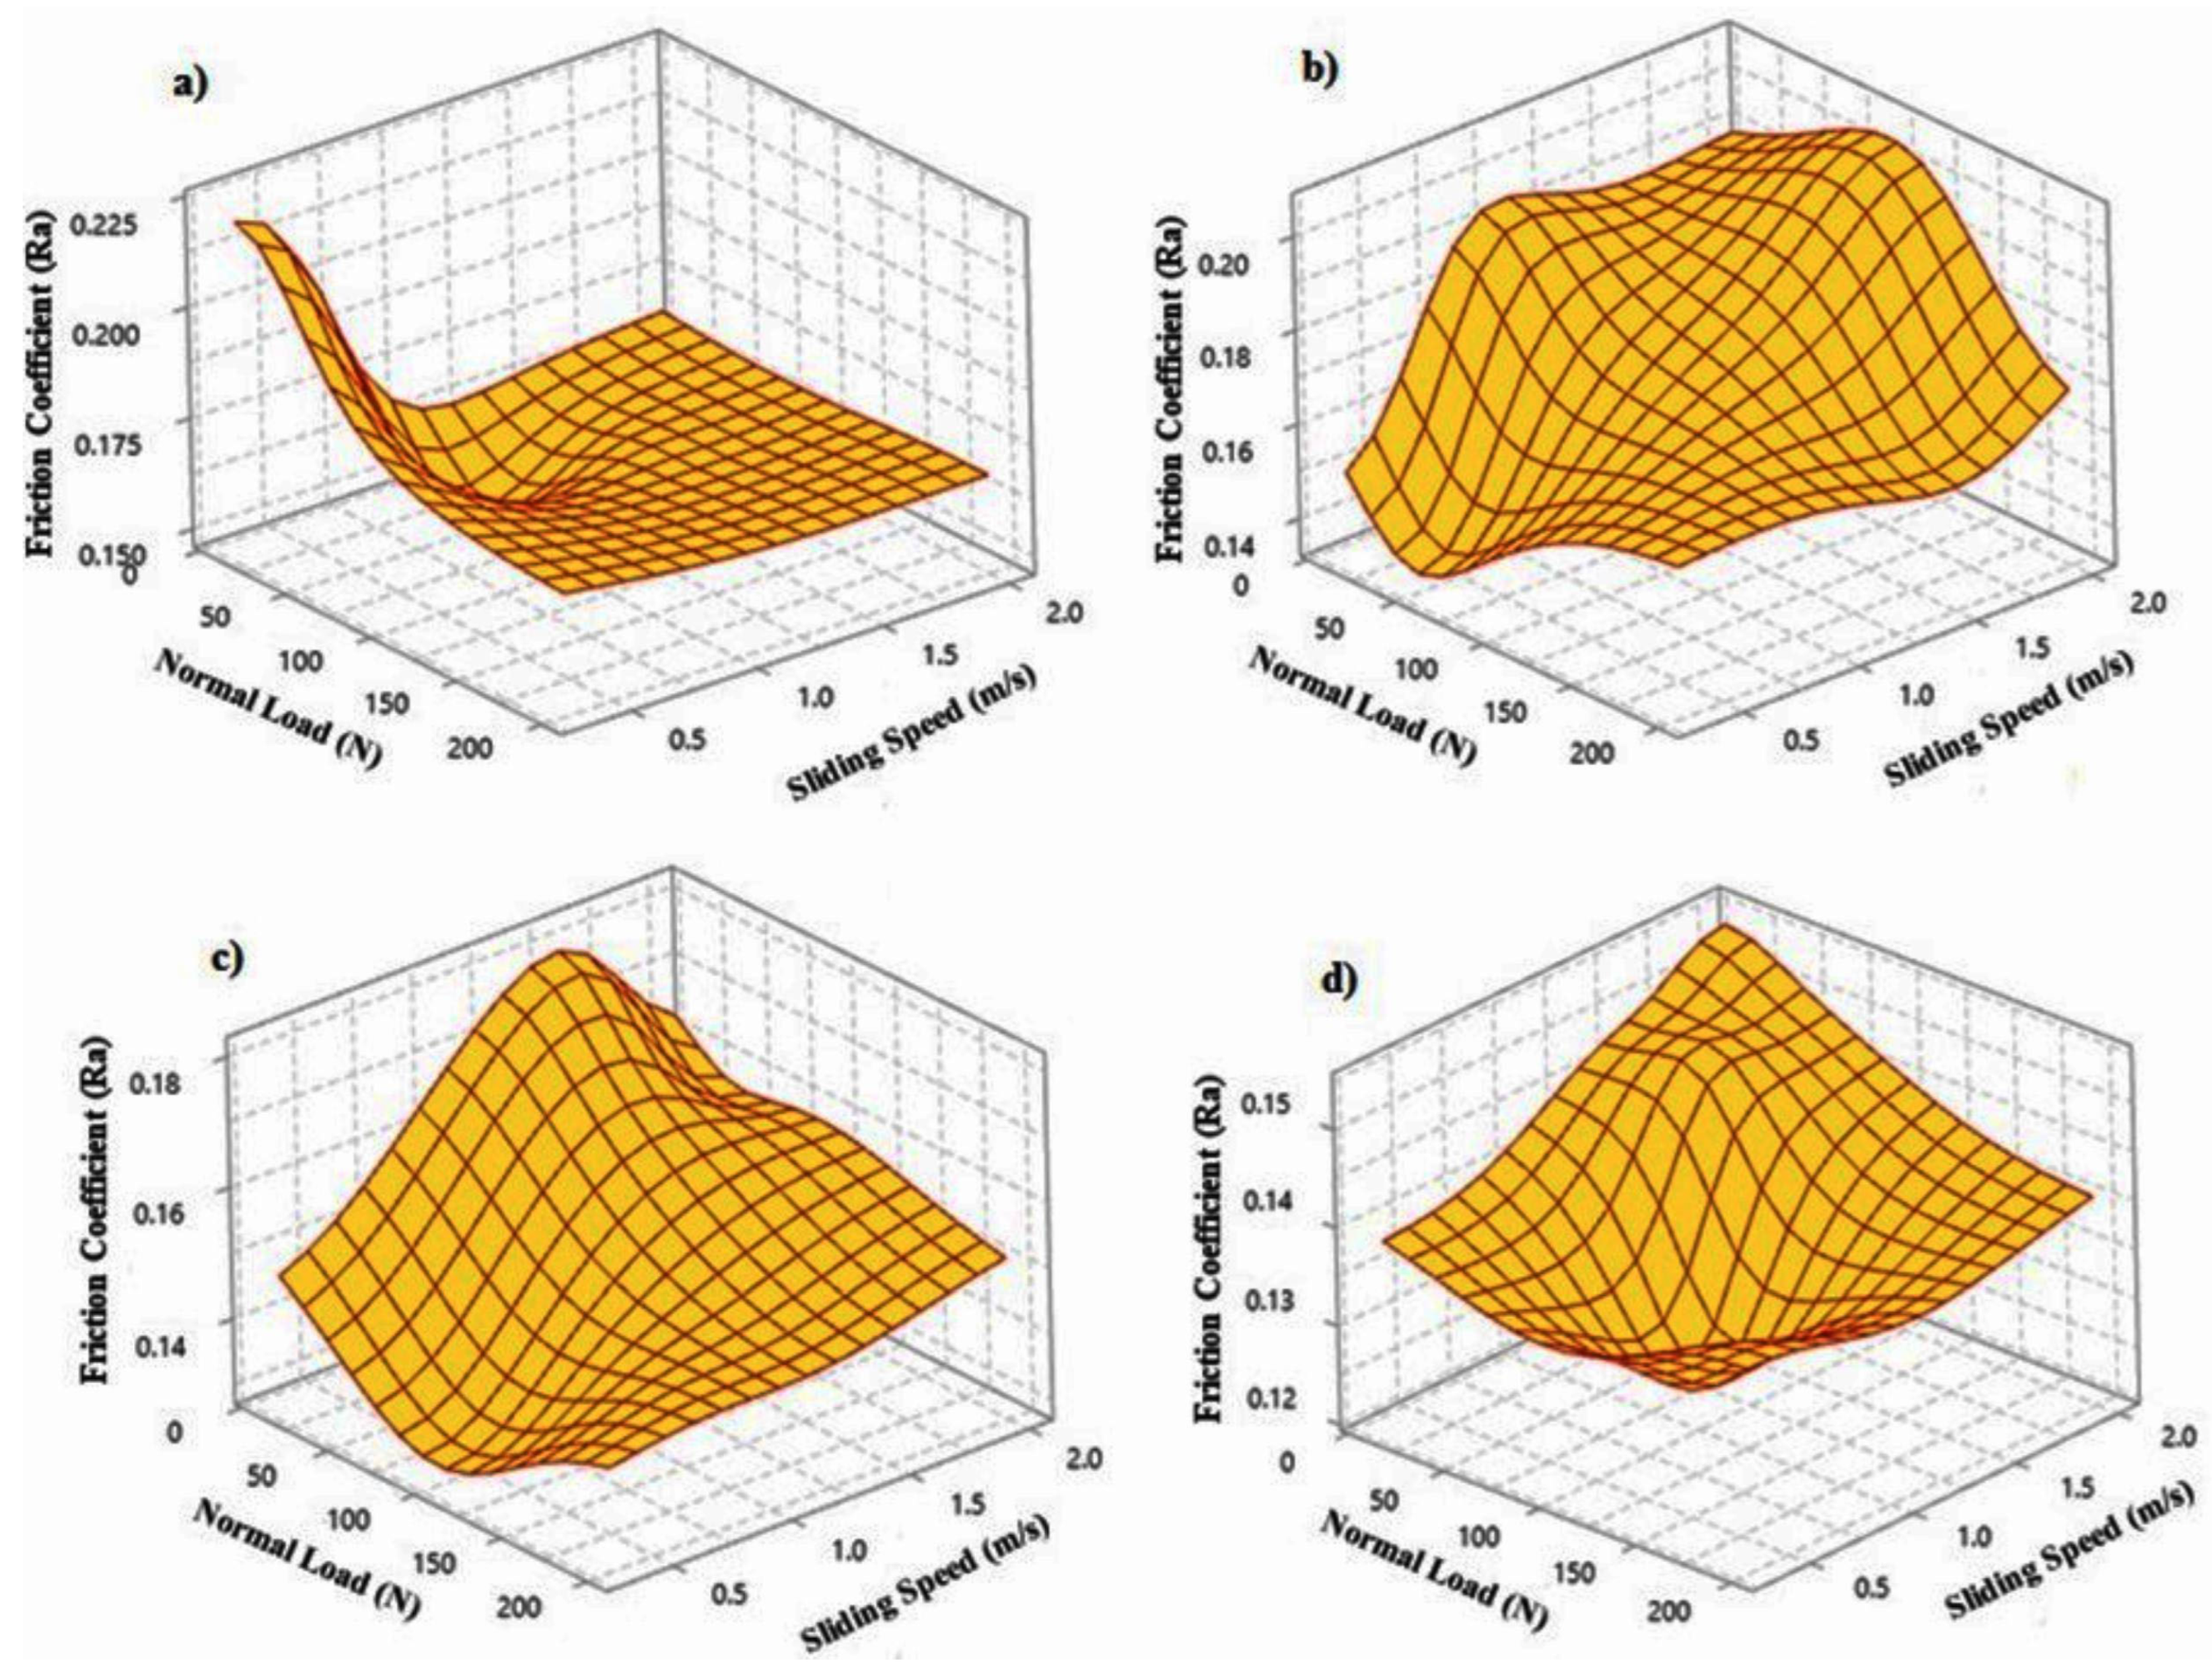
4.3. Friction and Wear Maps

The friction and the wear maps were plotted to investigate the tribological characteristics of PTFE polymer and PTFE composite reinforced with bronze particles against AISI 440C stainless steel discs at different wear test conditions. Figure 3 and Figure 4 show the variation of friction and SWR as a function of the normal load and the sliding speed. It was observed that the coefficient of friction decreases with increasing normal load under light wear test conditions for all test samples. On the other hand, with the increase in sliding speed, the COF increases, as shown in Figure 4. The reason for the increase in the coefficient of friction with increasing the sliding speed can be explained by the increase in the temperature on the polymer surface because of the contact of the polymer with the counter steel disk. The reason for the increase in the friction coefficient of the pure PTFE sample can be explained by the fact that with the increase in the polymer surface temperature, the cohesive attraction forces of the polymer molecular chains of PTFE decrease by moving away from each other and the polymer can adhere to the steel surface more easily. In addition, pure PTFE forms a non-continuous film layer on the surface of the steel disk material (Figure 4a). This causes an increase in the coefficient of friction. The composite material reinforced with 60% bronze particles in PTFE polymer forms a more uniform, thin, and continuous film layer on the surface of the steel disk material. This leads to a decrease in the coefficient of friction [26].
Since pure PTFE and PTFE composites are visco-elastic materials, the coefficient of friction decreases with increasing applied load value, but when the load increases to the limit load values of the polymer, the coefficient of friction and the amount of wear may increase due to the critical surface energy of the polymer. In addition, the temperature of the pin surface increases during the friction process, causing the surface to soften. This situation caused by the temperature increase may also cause an increase in the friction coefficient of the polymer [27].
Variations of SWR of pure PTFE polymer and PTFE composites reinforced with bronze particles under different wear test conditions were plotted in Figure 5. As seen on the wear map in Figure 5, the SWR decreases with increasing sliding speed values and increases with increasing normal load values. In addition, among tested samples, the best SWR value was achieved with the composite material reinforced with 60 vol.% bronze particles. It is assumed that the thinner film formation on the counter surface stainless steel disc does not help to prevent surface wear.

4.4. Regression Analysis

The regression analysis finds widespread application in different fields of science such as finance, engineering, economy, mathematics, and medicine. The essence of this statistical analysis is to find out the actual effects of parameters on a case under investigation. In this method, the parameters may be dependent or independent of each other, and the number of cases might be one or more [28,29].
Mathematical models with a combination of wear test parameters, i.e., the material type, the normal load, and the sliding speed, were developed by using regression analysis to estimate the COF and the SWR values. Through the developed mathematical model, the SWR and the COF values of each material type were calculated and shown in Table 12.
The correlation coefficient (R2) value should be between 0.8 and 1 in the multilinear regression method. In the current study, the mathematical models developed from COF and SWR values of pure PTFE polymer and PTFE composites reinforced with bronze particles. For all material types, R2 values were found to be greater than 0.82, and these models were assessed as consistent with experimental results.

4.5. Verification Test

The last step was the confirmation of quality characteristics under optimal test conditions (A4B2C2, A4B3C1), following the determination of those optimal conditions in connection with suitable wear test parameters. For the selected optimal test condition, S/N ratios of COF and SWR were calculated by the following equation:
η ^ p r e d i c t = r + i = 0 k ( r i r )
where r is the total S/N value, m i is the S/N value of the result for ith run in the kth (number of the) wear test [30].
The results from the validation test were shown in Table 13, where there was a slight difference between the predicted SWR results and the calculated SWR results obtained under the optimal wear testing conditions. This difference is also found in the confidence interval, which means it is acceptable. Thus, in accordance with response tables, the optimal wear testing conditions for the COF are:
  • Material type: 60 vol% PTFE composite reinforced with bronze particles.
  • Normal load: 50 N.
  • Sliding speed: 1 m/s.
The optimal wear testing conditions for the SWR are:
  • Material type: 60 vol% PTFE composite reinforced bronze particles.
  • Normal load: 100 N.
  • Sliding speed: 0.32 m/s.
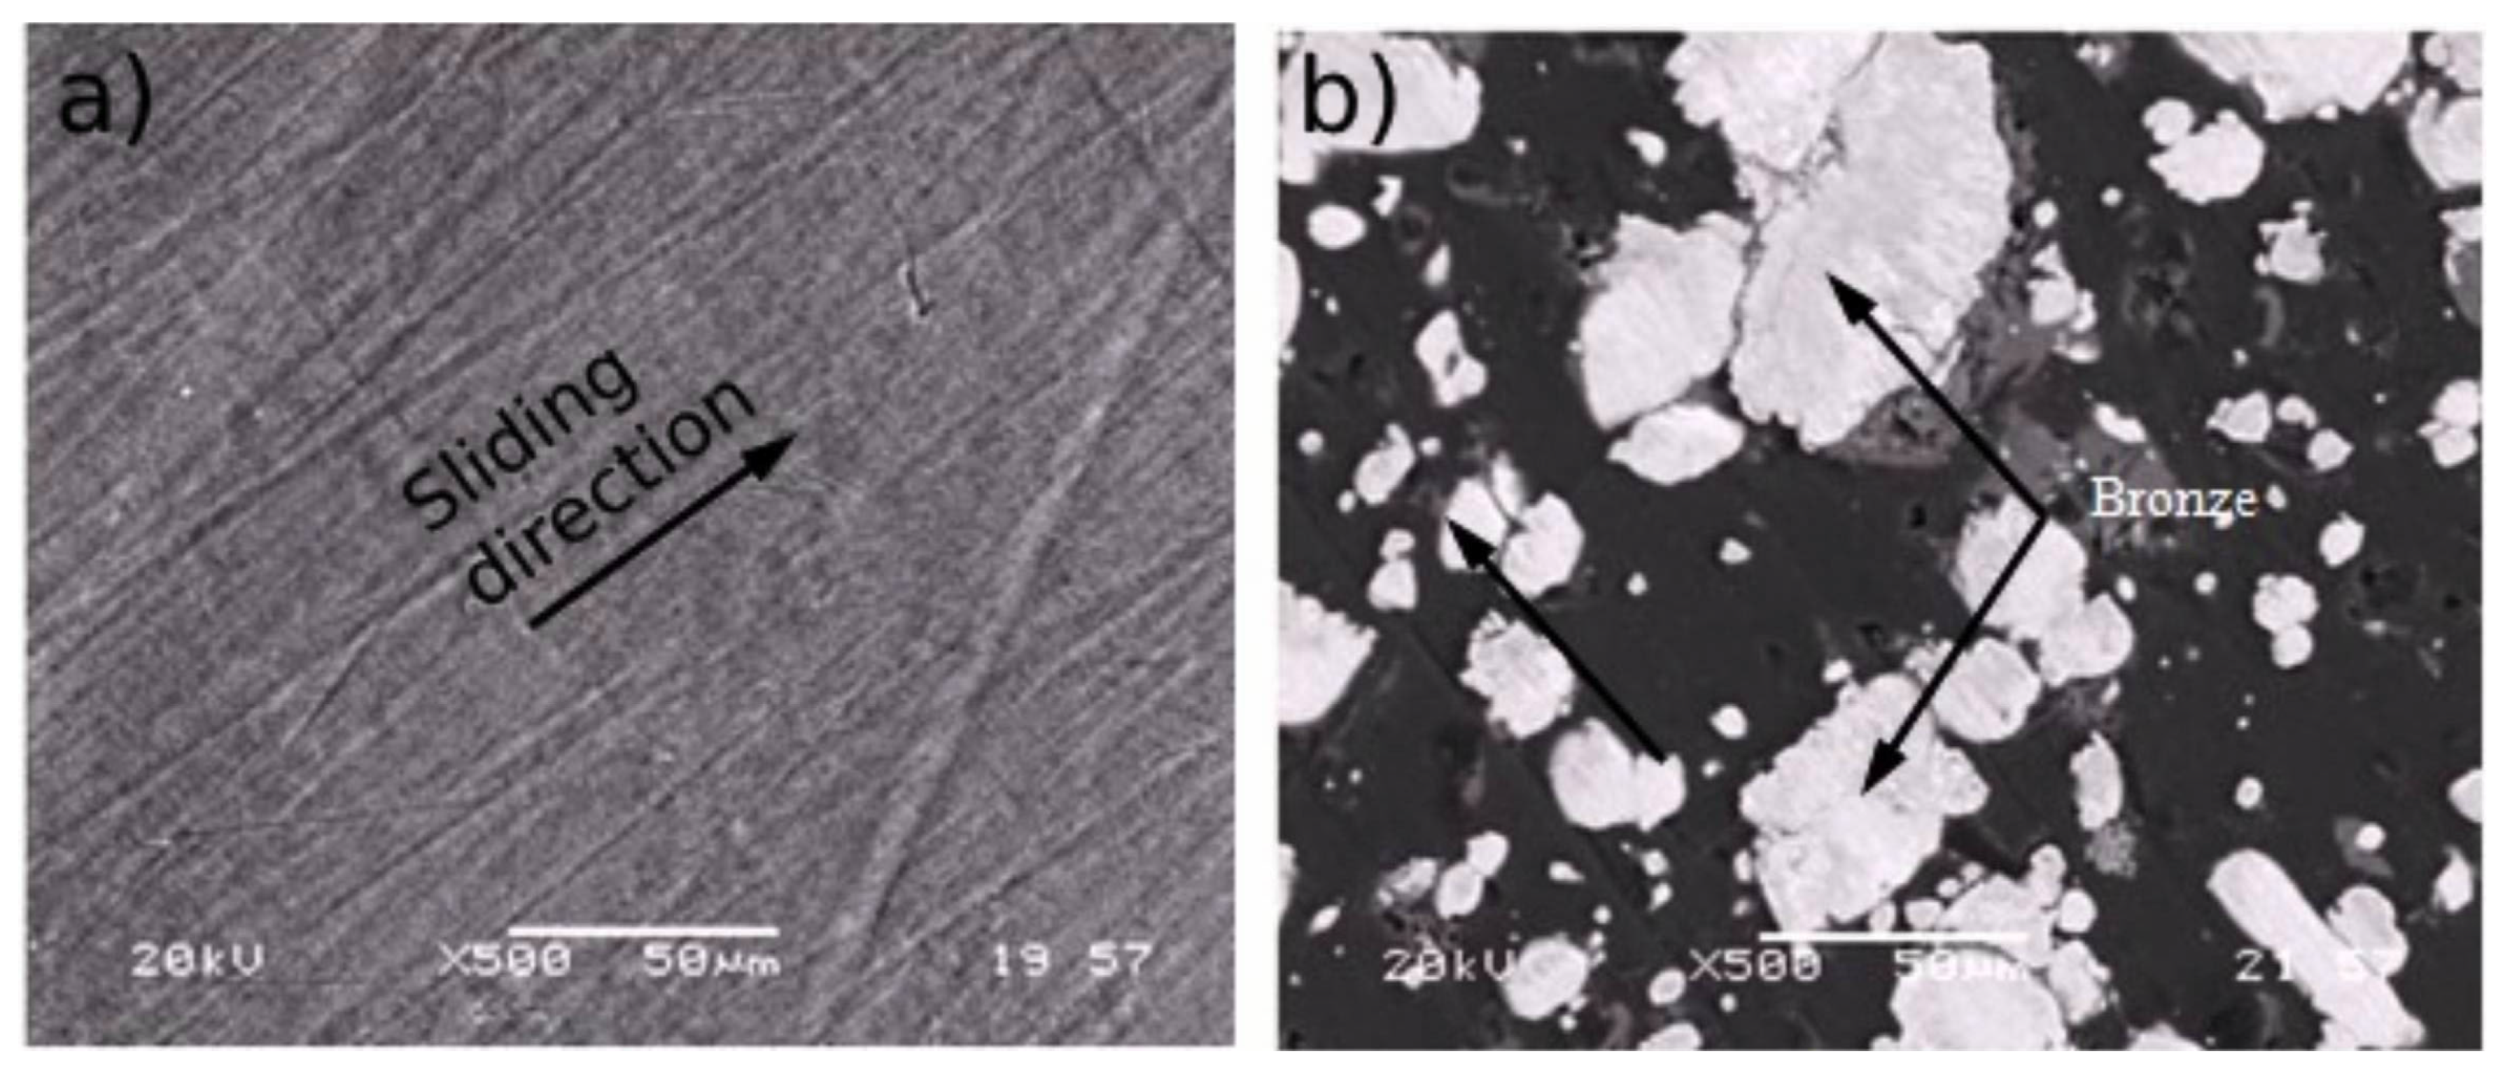
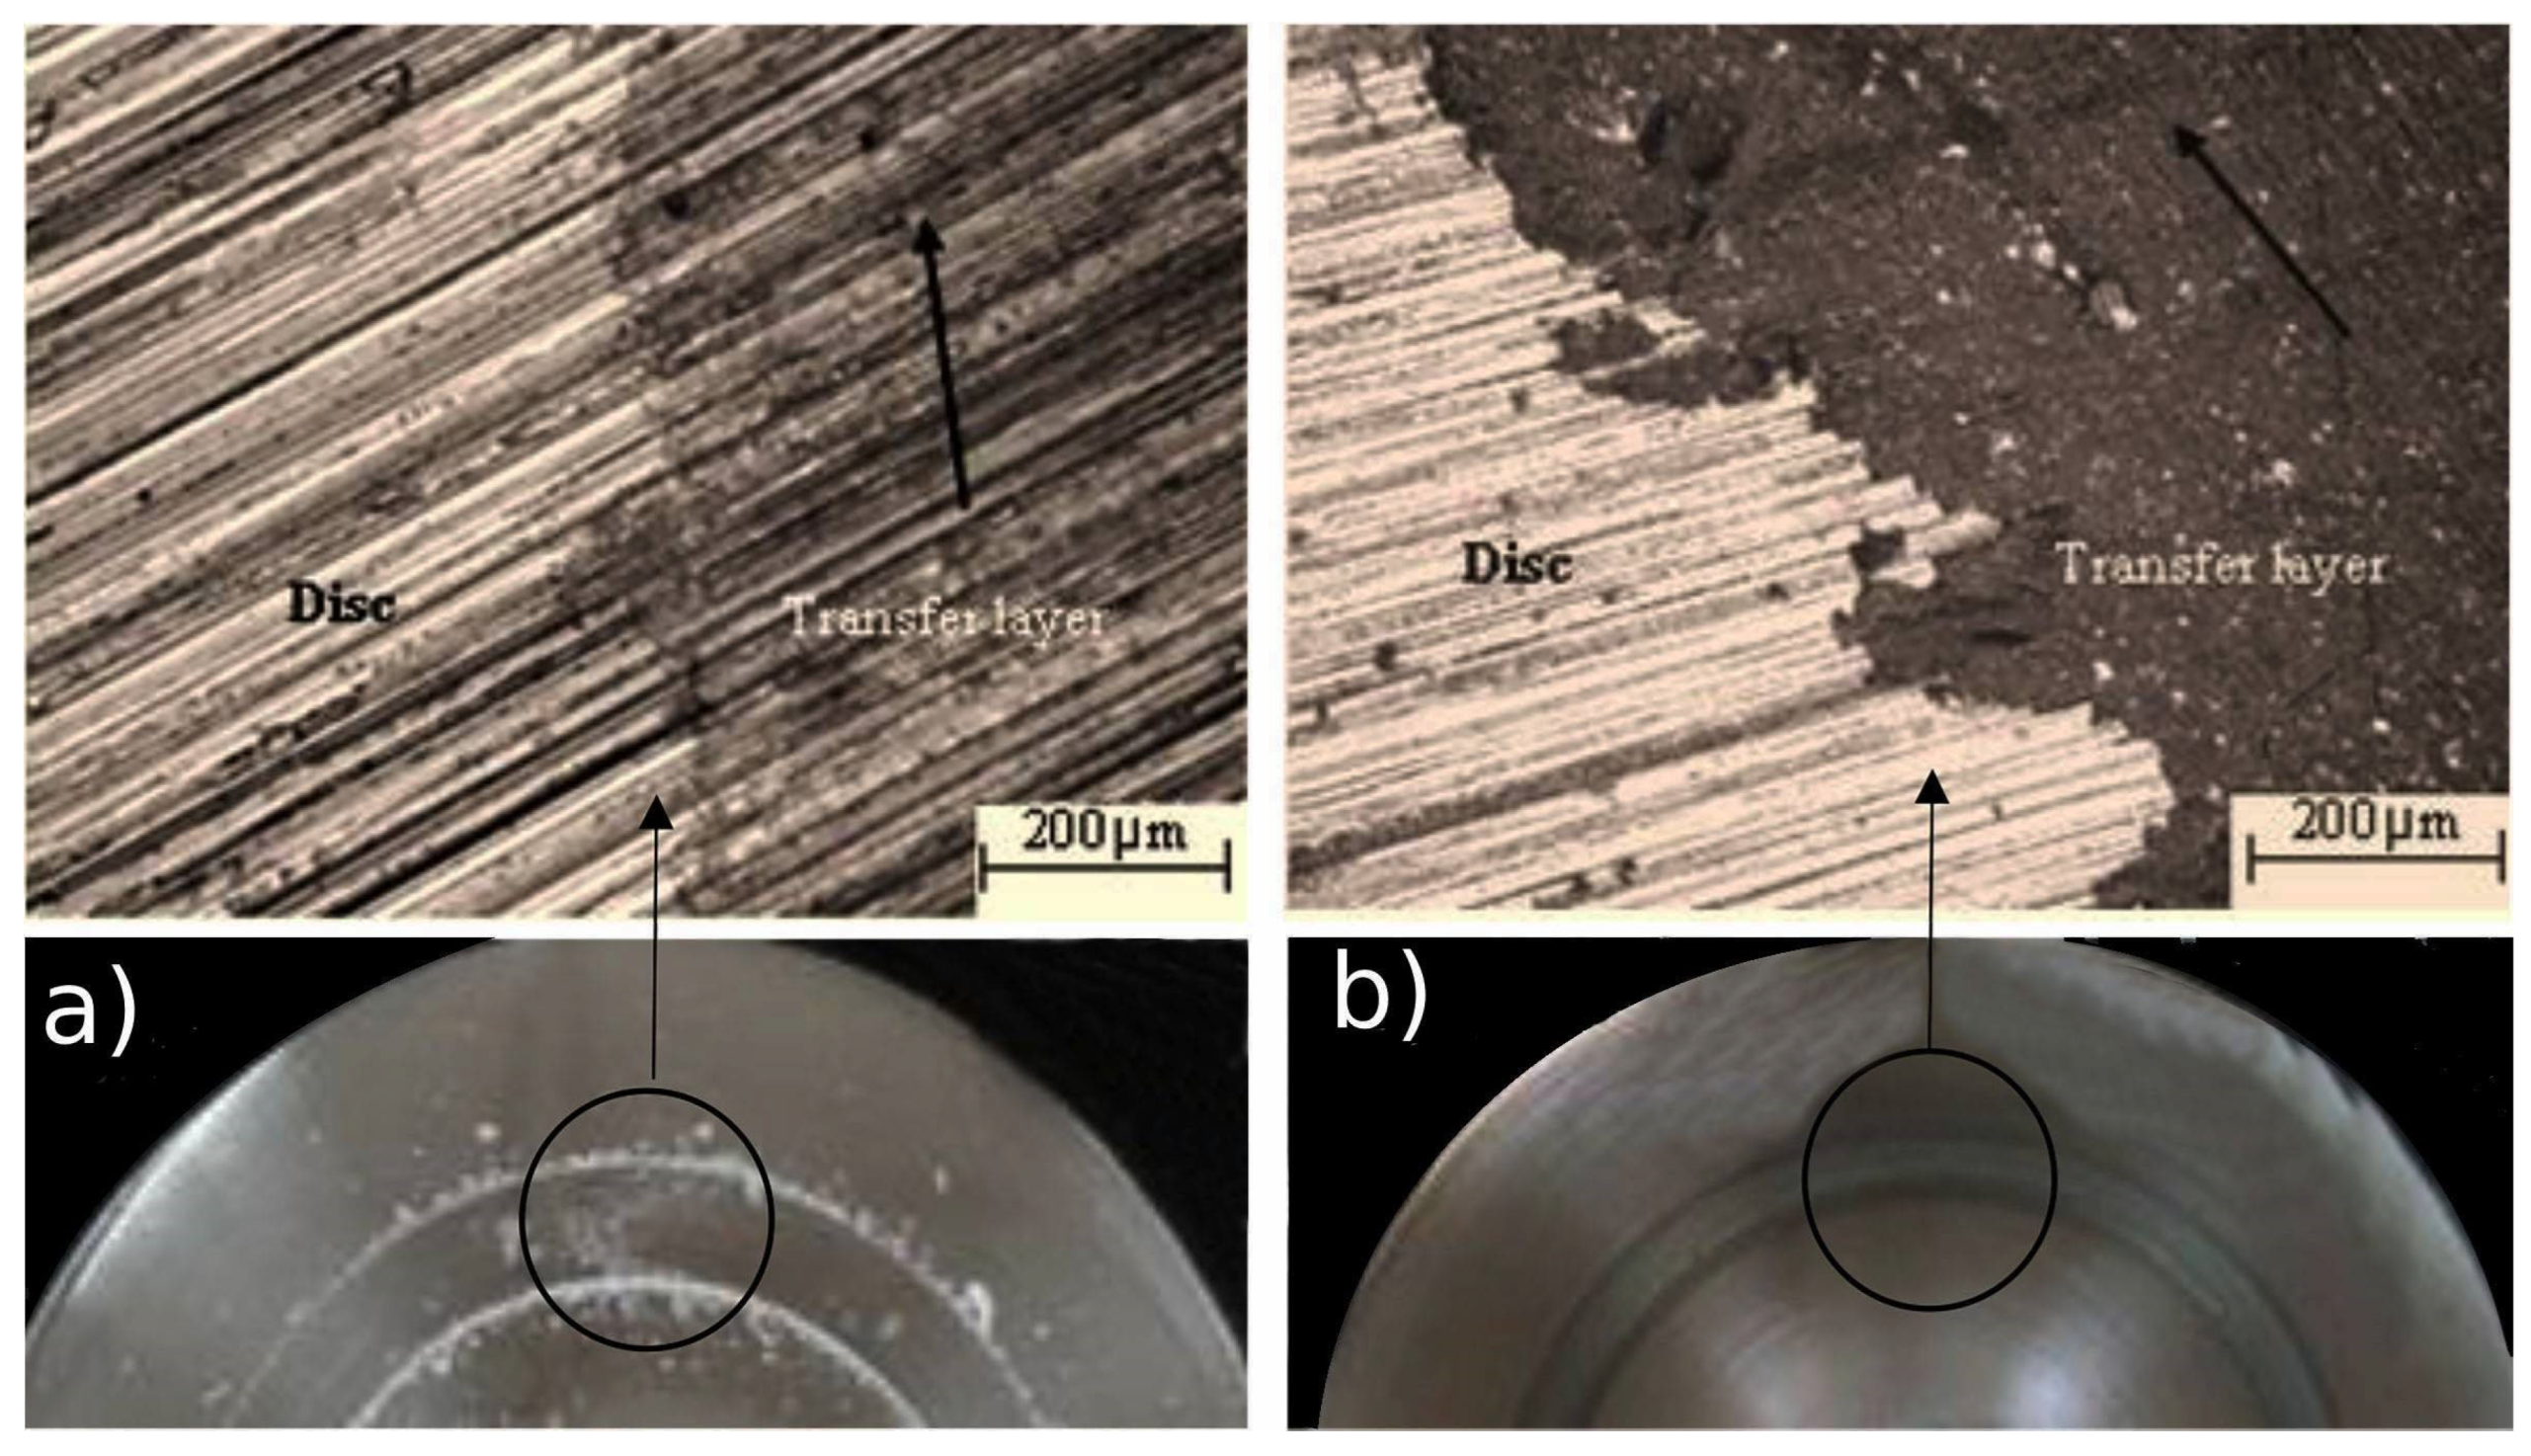
If the difference between m i , v e r m i , c a l is in either case within the confidence interval, the mathematical model is accurate. From Table 13, there is a good consistency between the calculated and experimental results.

4.6. Wear Mechanism

The SEM images of the pin-worn surfaces of the PTFE polymer and PTFE composites reinforced with bronze particles generated under the normal load of 100 N and the sliding speed of 1.0 m/s were shown in Figure 6. Apparent differences can be seen between the worn surfaces of the PTFE polymer and PTFE composite. In fact, the worn surface of both PTFE polymer and PTFE composite reinforced with bronze particles is quite smooth, but PTFE polymer has obvious abrasive grooves, see Figure 6a, while PTFE + 60 vol.% bronze composite is smoother, see Figure 6b. It is assumed that hard and sharp asperities on the hardened steel counter surface can form these grooves on the pin surfaces during the sliding. Similar behavior was observed in the study by Conte and Igartua [31].
Figure 7a,b show that optical micrographs of the transfer films accumulated on AISI 440C stainless steel disc surfaces during steady state wear.
After the measurements made on the disc surfaces shown in Figure 7a,b, the surface roughness values were determined as 0.28 mm and 0.24 mm. According to the measurement result of Figure 7a and the SEM image, it can be said that very little transfer film is accumulated on the disc surface. This transfer film formed on the AISI 440C stainless steel disc surface doesn’t assist enough in protecting the wear of PTFE polymer. This finding possibly means that the counter-surface with hard and sharp asperities may have an abrasive effect [32,33,34].
In addition, according to the measurement result of Figure 8, it was observed that the surface roughness value of the disc decreased. Accordingly, it can be said that more transfer film and/or thickness is formed because of sliding the PTFE composite compared to pure PTFE [35,36,37]. Furthermore, the formation of a thick transfer film helped the protection of PTFE composite reinforced with 60 vol% bronze particles from the hard counter-face asperities. Thus, the SWR of the bronze particle filled PTFE composite was found to be significantly low [38,39,40,41,42,43,44]. Hence, the presence of the transfer film and the improvement in surface roughness indicate that the mechanism of adhesive wear is present.
Evidence from surface observation of the abraded surface of the steel disc showed that transfer films were formed on the surface. The transfer films formed during the sliding of pure PTFE against the abrasive steel are relatively thinner than the transfer film formed by the bronze-filled PTFE composite. In addition, among the bronze-reinforced PTFE composites, 60% bronze + PTFE composite material is more advantageous than others in transfer film thickness. Secondly, it is believed that the thinner film formation on the surface against AISI 440C steel has fewer protective properties in preventing surface wear. Therefore, in this study, 60% bronze + PTFE composite material provides an advantage in terms of friction and wear behavior compared to other materials.

5. Conclusions

In this study, PTFE composite materials reinforced with three different bronze ratios were successfully produced by the injection molding method. The tribological behavior of these composite materials was investigated against pure PTFE according to four different normal load and sliding speed parameters. The Taguchi optimization method and ANOVA analysis were used to determine the optimum test parameters and the effects of these parameters on COF and SWR. By this systematical approach, the effects of the varied tribological test parameters on COF and SWR were determined, resulting not only in a deeper understanding of the tribological effect of the bronze particle reinforcement in PTFE material but also in the identification of the optimum fill grade and application condition. Conclusions drawn from these investigations are as follows:
  • The addition of the bronze particles to the PTFE polymer as a reinforcement phase improves the tribological properties of the material.
  • The material type is more pronounced on the desired wear resistance and COF rather than other parameters of the tribological system, such as normal load and sliding speed.
  • Among the bronze-reinforced PTFE composites used in the study, PTFE composites reinforced with 60 vol% bronze particles showed the lowest specific wear rate, followed by PTFE + 40 vol% bronze particles included composite, and then PTFE + 25 vol% bronze particles included composite.
  • The COF and SWR were found to be influenced by the material type (29.83% and 96.16%), the normal load (33.34% and 0.95%), and sliding speed (9.14% and 1.28%).
  • The optimum wear test conditions at that the minimum COF and the lowest SWR were achieved to be A4B2C2 and A4B3C1 levels of the wear test parameters, respectively.

Author Contributions

Conceptualization, F.F. and I.O.; methodology, F.F.; software, F.F.; validation, T.G., T.L. and F.F.; formal analysis, F.F.; investigation, I.O.; resources, F.F.; data curation, F.F.; writing—original draft preparation, F.F.; and I.O.; writing—review and editing, T.G.; and T.L.; visualization, F.F.; supervision, T.L.; project administration, T.L.; funding acquisition, F.F. All authors have read and agreed to the published version of the manuscript.

Funding

This research received no external funding.

Data Availability Statement

Data are contained within the article.

Conflicts of Interest

I hereby disclose my conflict of interest as outlined by the MDPI guidelines. I am currently employed by Global Arge Company while contributing to this manuscript. My contributions to this work and manuscript were made independently without any requirement, guidance or input by my employer. I received no financial compensation from any source for the contributions I made to this scientific work and manuscript.

References

  1. Khedkar, J.; Negulescu, I.; Meletis, E.I. Sliding wear behavior of PTFE composites. Wear 2002, 252, 361–369. [Google Scholar] [CrossRef]
  2. Bijwe, J.; Neje, S.; Indumathi, J.; Fahim, M. Friction and wear performence evaluation of carbon fibre reinforced PTFE composite. J. Reinf. Plast. Compos. 2002, 21, 1221–1240. [Google Scholar] [CrossRef]
  3. Stankovic, M.; Vencl, A.; Marinkoviz, A. Tribological Properties of Self-Lubricating Sliding Bearings Made of PTFE and POM-Based Composite Materials. In Proceedings of the 13’th International Conference on Tribology, Kragujevac, Sirbia, 15–17 May 2013; pp. 314–318. [Google Scholar]
  4. Tevruz, T. Tribological behaviours of bronze-filled polytetrafluoroethylene dry journal bearings. Wear 1999, 230, 61–69. [Google Scholar] [CrossRef]
  5. Tevruz, T. Tribological behaviours of carbon filled polytetrafluoroethylene (PTFE) dry journal bearings. Wear 1998, 221, 61–68. [Google Scholar] [CrossRef]
  6. Yadav, S.M.; Budan, D.A.; Basavarajappa, S.; Mudasar Pasha, B.A.; Kumar, S. Studies on Wear Resistance of PTFE Filled with Glass and Bronze Particles Based on Taguchi Technique. J. Eng. Sci. Technol. Rev. 2012, 5, 26–29. [Google Scholar] [CrossRef]
  7. Sadaphal, N.D.; Bhosale, K.C.; Kharde, S.B.; Varade, H.P. Performance Behaviour of Composite Polytetrafluroethylene (PTFE)-A Taguchi Approach. Int. J. Curr. Eng. Technol. 2014, 3, 235–238. [Google Scholar]
  8. Gujrathi, S.M.; Dhamande, S.; Patare, P.M. Wear studies on polytetrafluoroethylene (PTFE) composites: Taguchi approach. Int. J. Ind. Eng. Manag. Sci. 2013, 3, 47–51. [Google Scholar]
  9. Patare, P.M.; Lathkar, G.S. Effects of Filler Glass Fiber on the Tribological Properties of PTFE Composites. Int. J. Innov. Res. Sci. Eng. Tech. 2014, 3, 17624–17631. [Google Scholar]
  10. Varade, B.V.; Kharde, Y.R. Prediction of Specific Wear rate of Glass Filled PTFE Composites by Artificial Neural Networks and Taguchi Approach. Int. J. Eng. Res. App. 2012, 2, 679–683. [Google Scholar]
  11. Varpe, S.G.; Mate, D.M. Comparative analysis for tribological behaviour of PTFE composite with different filler material. Int. J. Sci. Adv. Res. Technol. 2015, 1, 194–198. [Google Scholar]
  12. Chaudhari, S.B.; Shekhawat, S.P. Wear Analysis of Polytetrafluoroethylene (PTFE) and Its Composites under Wet Conditions. Int. Mech. Civ. Eng. 2013, 8, 7–18. [Google Scholar]
  13. Sahin, Y. Analysis of abrasive wear behavior of PTFE composite using Taguchi’s technique. COG Eng. 2015, 2, 1–15. [Google Scholar]
  14. Bagale, D.; Shekhawat, S.; Chaudri, J. Wear Analysis of Polytetrafluoroethylene and it’s Composites under Dry Conditions using Design-Expert. Int. J. Sci. Res. Pub. 2013, 3, 1–4. [Google Scholar]
  15. Maculotti, G.; Goti, E.; Genta, G.; Mazza, L.; Galetto, M. Comprehensive Mechanical and Tribological Characterization of Metal-polymer PTFE + Pb/Bronze Coating by in-situ Electrical Contact Resistance Measurement Augmented Tribo-mechanical Tests. Tribol. Int. 2024, 193, 109397. [Google Scholar] [CrossRef]
  16. Christian, O.; Tobias, R.; Stephan, T. Unveiling an additively manufactured open hardware pin-on-disc tribometer considering its high reproducibility. Wear 2024, 552–553, 205437. [Google Scholar]
  17. Rüstem, B. Experimental and machine learning comparison for measurement the machinability of nickel based alloy in pursuit of sustainability. Meas 2024, 236, 115142. [Google Scholar]
  18. Tao, S.; Peiping, Y.; Shuo, W.; Miao, W.; Tonghai, W. Wear depth estimation from single 2-D image based on shape from Shading and convolutional neural network hybrid model for in-situ wear assessment. Wear 2024, 538–539, 205205. [Google Scholar]
  19. Taguchi, G. Introduction to Quality Engineering; McGraw-Hill: New York, NY, USA, 1990. [Google Scholar]
  20. Swami, M.C.; Dyadi, A. A Comparative Wear Studies of Three Polytetrafluroethylene (PTFE) Composites: A Taguchi Approach. Int. J. Adv. Res. Eng. Manag. 2015, 1, 1–8. [Google Scholar]
  21. Erzurumlu, T.; Ozcelik, B. Minimization of warpage and sink index in injection-molded thermoplastic parts using Taguchi optimization method. Mater. Des. 2006, 27, 853–861. [Google Scholar] [CrossRef]
  22. Taguchi, G.; Konishi, S. Taguchi Methods, Orthogonal Arrays and Linear Graphs, Tools for Quality Engineering; American Supplier Institute: Birmingham, AL, USA, 1987. [Google Scholar]
  23. Ross, P.J. Taguchi Techniques for Quality Engineering–Loss Function, Orthogonal Experiments, Parameter and Tolerance Design; McGraw-Hill: New York, NY, USA, 1988. [Google Scholar]
  24. Unal, H.; Ficici, F.; Mimaroglu, A.; Demirkol, A.; Kırdar, A. Prediction and optimization of tribological behavior of nylon composites using Taguchi analysis method. J. Braz. Soc. Mech. Sci. Eng. 2016, 38, 2097–2104. [Google Scholar] [CrossRef]
  25. Dinghan, X.; Weicai, L.L.; Zhong, X. On the Tribological Properties of PTFE Filled with Alumina Nanoparticles and Graphite. J. Reinf. Plast. Compos. 2007, 26, 331–339. [Google Scholar]
  26. Amenta, F.; Bolelli, G.; Pedrazzi, S.; Allesina, G.; Santeramo, F.; Bertarini, A.; Sassatelli, P.; Lusvarghi, L. Sliding wear behaviour of fibre-reinforced PTFE composites against coated and uncoated steel. Wear 2021, 486–487, 204097. [Google Scholar] [CrossRef]
  27. Raut, A.; Nunez, E.E.; Sellers, R.; Rahman, M.S.; Polycarpou, A.A. The effect of reinforcing fillers on the tribological performance of PTFE composites for a sustainable environment. Wear 2024, 556–557, 205524. [Google Scholar] [CrossRef]
  28. Şahin, Y. Dry Wear and Metallographic Study of PTFE Polymer Composites. Mech. Compos. Mater. 2018, 54, 403–414. [Google Scholar] [CrossRef]
  29. Ozcelik, B.; Sonat, I. Warpage and structural analysis of thin shell plastic in the plastic injection molding. Mater. Des. 2009, 30, 367–375. [Google Scholar] [CrossRef]
  30. Ross, P.J. Taguchi Techniques for Quality Engineering; Tata McGraw-Hill: New York, NY, USA, 1996. [Google Scholar]
  31. Conte, M.; Igartua, A. Study of PTFE composites tribological behavior. Wear 2012, 296, 568–574. [Google Scholar] [CrossRef]
  32. Bayer, R.G.; Sirico, J.L. The Influence of Surface Roughness on Wear. Wear 1975, 35, 251–260. [Google Scholar] [CrossRef]
  33. Ting, X.; Zhenghua, Z.; Zhenxing, X.; Jianwei, Y.; Minghua, J. Characteristics of the Transfer Film and Tribological Properties of Oxide/PTFE Composites. Adv. Mater. Res. 2013, 631–632, 172–175. [Google Scholar]
  34. Al-Samarai, R.A.; Haftirman Ahmad, K.R.; Al-Douri, Y. The Influence of Roughness on the Wear and Friction Coefficient under dry and lubricated sliding. Int. J. Sci. Eng. Res. 2012, 3, 1–6. [Google Scholar]
  35. Zhibin, L.; Bingzhao, G.; Xiangji, L.; Kaifeng, Y. Effect of abrasive grain size on surface particle deposition behaviour of PTFE/bronze composites during abrasive wear. Tribol. Int. 2019, 139, 12–21. [Google Scholar]
  36. Pontus, J.; Par, M.; Marcus, B.; Yijun, S. Effect of humidity and counterface material on the friction and wear of carbon fiber reinforced PTFE composites. Tribol. Int. 2021, 157, 106869. [Google Scholar]
  37. Aswani, K.B.; Ajay, K.K.; Paul, M.W.; Ronan, M.O.H. Mechanical and abrasive wear response of PTFE coated glass fabric composites. Wear 2020, 450–451, 203267. [Google Scholar]
  38. Güngör, K.; Ozsert, I.; Demirer, A.; Fiçici, F.; Demir, A. Experimental optimization of wear parameters of sintered bronze-based materials. Indian J. Eng. Mater. Sci. 2015, 22, 288–296. [Google Scholar]
  39. Federica, A.; Giovanni, B.; Francesco, D.; Filippo, O.; Simone, P.; Giulio, A.; Alessandro, B.; Pietro, P.; Luca, L. Tribological behaviour of PTFE composites: Interplay between reinforcement type and counterface material. Wear 2022, 510–511, 204498. [Google Scholar]
  40. Zhengjie, L.; Xiaowen, Q.; Changxin, L.; Bingli, F.; Xiao, Y. Particle size effect of PTFE on friction and wear properties of glass fiber reinforced epoxy resin composites. Wear 2023, 532–533, 205104. [Google Scholar]
  41. Amine, C.; Sameh, N.; Mohamed, K.; Maher, D. Tribological behaviors of PTFE-based composites filled with bronze microparticles. J. Thermoplast. Compos. Mater. 2021, 34, 1639–1653. [Google Scholar]
  42. Lixia, Y.; Yunlong, W.; Chongyang, N.; Chunxi, W.; Guixiang, W. Improvement of the Tribological Properties and Corrosion Resistance of Epoxy–PTFE Composite Coating by Nanoparticle Modification. Coat 2021, 11, 1–12. [Google Scholar]
  43. Federica, A.; Giovanni, B.; Stefano, D.; Alessandro, B.; Luca, L. Tribological Behavior of Reinforced PTFE Composites and Un-Reinforced Polyketone-Based Materials against Coated Steel. Lubricants 2022, 10, 1–26. [Google Scholar]
  44. Hailing, H.; Yanfei, L.; Yunjing, X.; Shengtao, Y.; Wenzhong, W.; Fuxin, L. Self-lubrication waterborne epoxy composite coating with amphiphilic Janus nanoparticles. Prog. Org. Coat. 2024, 189, 108303. [Google Scholar]
Figure 1. Actual images of the test samples.
Jcs 08 00398 g001
Figure 2. Pin-on disc wear test device.
Jcs 08 00398 g002
Figure 3. Main effect plots for (a) COF and (b) SWR.
Jcs 08 00398 g003
Figure 4. The friction map of (a) pure PTFE, (b) PTFE + 25% bronze particles, (c) PTFE + 40% bronze particles, and (d) PTFE + 60% bronze particles.
Jcs 08 00398 g004
Figure 5. The wear map of (a) pure PTFE, (b) PTFE + 25 vol% bronze particles, (c) PTFE + 40 vol% bronze particles, and (d) PTFE + 60 vol% bronze particles.
Jcs 08 00398 g005
Figure 6. Worn pin surfaces of (a) pure PTFE polymer material and (b) PTFE composite reinforced with 60 vol.% bronze particles.
Jcs 08 00398 g006
Figure 7. Transfer layers accumulated on the AISI 440C stainless steel disc after sliding with (a) pure PTFE polymer and (b) PTFE composite reinforced with 60 vol.% bronze particles.
Jcs 08 00398 g007
Figure 8. Optical (a) and SEM images (b) of the worn surfaces of a 60 vol% bronze-reinforced PTFE composite tested under wear conditions of 100 N and 1.0 m/s.
Jcs 08 00398 g008
Table 1. Physical and mechanical properties of PTFE.
PropertiesValues
Tensile strength (MPa)≥7
Elongation (%)≥50%
Density g/cm32.16–2.20
Usage temperature °C200–250
Table 2. Physical properties of bronze particles.
PropertiesValues
Density g/cm32.5–3.20
Hardness HRB112–114
Grain size (µm)<63
Hot pressing range (°C)460–580
Table 3. Chemical composition of AISI 440C stainless steel.
ElementCSiMnPSCrMoNi
Content0.981.20.80.0400.30170.700.80
Table 4. Test materials and wear test conditions used in the wear tests.
MaterialsColorsDensity
(g/cm−3)
Test Temperature
(°C)
Relative Humidity
(%)
PTFEwhite2.1421 ± 2
PTFE + 25 vol.% bronzebrown3.0319 ± 450 ± 8
PTFE + 40 vol.% bronzebrown3.4919 ± 4
PTFE + 60 vol.% bronzebrown3.9119 ± 4
Table 5. Taguchi L16 (45) standard orthogonal array.
L16 (45) Test12345
111111
212222
313333
414444
521234
622143
723412
824321
931342
1032431
1133124
1234213
1341423
1442314
1543241
1644132
Table 6. Test parameters and their levels.
Level
Test ParametersUnits1234
Material type-PTFEPTFE + 25 vol.% bronzePTFE + 40 vol.% bronzePTFE + 60 vol.% bronze
Normal Load(N)1050100200
Sliding Speed(m/s)0.321.01.52.0
Table 7. Experimental layout and results.
Material TypeNormal Load
(N)
Sliding Speed
(m/s)
SWR
(m2/N)
S/N Wear Rate
(dB)
COF
(µm)
S/N Friction Efficient
(dB)
PTFE100.327.42 × 10−13242.590.22013.15
PTFE501.007.20 × 10−13242.850.15016.48
PTFE1001.501.19 × 10−12238.490.16515.65
PTFE2002.001.03 × 10−12239.740.16815.49
PTFE + 25 vol.% bronze101.005.06 × 10−14265.920.19514.20
PTFE + 25 vol.% bronze500.323.24 × 10−14269.790.13617.33
PTFE + 25 vol.% bronze1002.005.69 × 10−14264.900.20513.76
PTFE + 25 vol.% bronze2001.501.01 × 10−13259.910.15816.03
PTFE + 40 vol.% bronze101.504.35 × 10−15287.230.18014.89
PTFE + 40 vol.% bronze502.001.20 × 10−14278.420.15716.08
PTFE + 40 vol.% bronze1000.322.99 × 10−15290.490.13017.72
PTFE + 40 vol.% bronze2001.001.70 × 10−14275.390.14516.77
PTFE + 60 vol.% bronze102.003.70 × 10−15288.640.15416.25
PTFE + 60 vol.% bronze501.501.53 × 10−15296.310.15016.48
PTFE + 60 vol.% bronze1001.001.50 × 10−15296.480.12418.13
PTFE + 60 vol.% bronze2000.321.87 × 10−15294.560.14017.08
Table 8. Response table for mean S/N ratios of COF.
LevelMaterial TypeNormal Load (N)Sliding Speed (m/s)
115.1914.6216.32
215.3316.5916.40
316.3716.3215.76
416.9816.3415.40
Delta1.791.971.00
Rank213
Table 9. Response table for mean S/N ratios of specific wear rate.
LevelMaterial TypeNormal Load (N)Sliding Speed (m/s)
1240.90271.10274.40
2265.10271.80270.20
3282.90272.60270.50
4294.00267.40267.90
Delta53.105.206.40
Rank132
Table 10. ANOVA table of COF for wear test samples.
SourceDegrees of Freedom
(DOF)
Sum of Squares (SDQ)Variance
(V)
FTestFTablePercentage of Contribution
(%)
Material type38.7972.9324.153.29 a29.83
Normal load (N)39.8343.2784.413.29 a33.34
Sliding speed (m/s)32.6960.8990.66 9.14
Error68.1681.361
Total1529.494
a 90% confidence level.
Table 11. ANOVA table of SWR for wear test samples.
SourceDegrees of Freedom
(DOF)
Sum of Squares
(SDQ)
Variance
(V)
FTestFTablePercentage of Contribution
(%)
Material type36435.952145.32119.7212.92 a96.16
Normal load (N)363.5621.191.18 0.95
Sliding speed (m/s)385.6928.561.59 1.28
Error6107.5117.92
Total156692.71
a 99.5% confidence level.
Table 12. Regression linear models for COF and SWR.
MaterialsResponseDeveloped Mathematical ModelsR2 (%)
Pure PTFECOF15.3388 + 0.00630148 × N − 0.591276 × V93.3
PTFE + 25 vol.% BronzeCOF15.4754 + 0.00630148 × N − 0.591276 × V93.3
PTFE + 40 vol.% BronzeCOF16.5129 + 0.00630148 × N − 0.591276 × V93.3
PTFE + 60 vol.% BronzeCOF17.1295 + 0.00630148 × N − 0.591276 × V93.3
Pure PTFEVSWR247.006 − 0208401 × N − 3.49497 × V97.8
PTFE + 25 vol.% BronzeVSWR271.216 − 0.0208401 × N − 3.49497 × V97.8
PTFE + 40 vol.% BronzeVSWR288.968.006 − 0.0208401 × N − 3.49497 × V97.8
PTFE + 60 vol.% BronzeVSWR300.083 − 0.0208401 × N − 3.49497 × V97.8
Table 13. Results of the verification test.
Optimal Wear Test Condition
PredictedObservedDifference
LevelsA4B2C2A4B2C2
S/N ratio for µ (dB)18.0317.720.31
LevelsA4B3C1A4B3C1
S/N ratio for SWR (dB)299.54298.021.52
Disclaimer/Publisher’s Note: The statements, opinions and data contained in all publications are solely those of the individual author(s) and contributor(s) and not of MDPI and/or the editor(s). MDPI and/or the editor(s) disclaim responsibility for any injury to people or property resulting from any ideas, methods, instructions or products referred to in the content.

