Article

Synthesis of a New Composite Material Derived from Cherry Stones and Sodium Alginate—Application to the Adsorption of Methylene Blue from Aqueous Solution: Process Parameter Optimization, Kinetic Study, Equilibrium Isotherms, and Reusability

by
Cristina-Gabriela Grigoraș
* and
Andrei-Ionuț Simion
*
Department of Food and Chemical Engineering, Faculty of Engineering, “Vasile Alecsandri” University of Bacău, Calea Mărășești 157, 600115 Bacau, Romania
*
Authors to whom correspondence should be addressed.
J. Compos. Sci. 2024, 8(10), 402; https://doi.org/10.3390/jcs8100402
Submission received: 6 September 2024 / Revised: 25 September 2024 / Accepted: 30 September 2024 / Published: 3 October 2024
(This article belongs to the Special Issue Theoretical and Computational Investigation on Composite Materials)

Abstract

:
Purifying polluted water is becoming a crucial concern to meet quantity and quality demands as well as to ensure the resource’s sustainability. In this study, a new material was prepared from cherry stone powder and sodium alginate, and its capacity to remove methylene blue (MB) from water was determined. The characterization of the resulting product, performed via scanning electron microscopy (SEM) and Fourier-transform infrared spectroscopy (FTIR), revealed that the raw material considered for the synthesis was successfully embedded in the polymeric matrix. The impact of three of the main working parameters (pH 3–9, adsorbent dose 50–150 g/L, contact time 60–180 min) on the retention of MB was evaluated through response surface methodology with a Box–Behnken design. In the optimal settings, a removal efficiency of 80.46% and a maximum sorption capacity of 0.3552 mg/g were recorded. MB retention followed the pseudo-second-order kinetic and was suitably described by Freundlich, Khan, Redlich–Peterson, and Sips isotherm models. The experimental results show that the synthesized composite can be used for at least three successive cycles of MB adsorption. From these findings, it can be concluded that the use of the cherry-stone-based adsorbent is environmentally friendly, and efficacious in the removal of contaminants from the water environment.

1. Introduction

Even though an overwhelming proportion of the Earth’s surface is covered by water, only a reduced part is appropriate for human and other living organisms’ consumption [1]. Simultaneously, rising industrial and technological developments, and extended urbanization in tandem with population increases contribute to its contamination. Ergo, to come across water quality and quantity requests, and guarantee the resource’s sustainability, cleaning water is nowadays a critical apprehension.
An aggregation of various conventional physical, biological, and chemical methods is usually applied to treat the aqueous effluents. The primary step consists of utilizing physical techniques such as screening, sedimentation, skimming, aeration, and filtration. These methods do not need chemical reagents and are employed to introduce oxygen, remove heavy or insoluble solid particles, and remove fine impurities [2]. In the second stage, microorganisms’ strains, acting in anaerobic or aerobic conditions, degrade pollutants through biosorption and metabolic pathways while reducing the values of parameters such as total organic carbon, chemical and biochemical oxygen demand, or total suspended solids [3,4]. Tertiary wastewater treatment includes advanced oxidation processes, ozonation, electrochemical destruction, and photocatalysis, and demands different chemical substances and particular conditions to lower the amount of wastewater organic material [5,6,7]. Intrinsic drawbacks of these methods, originating from the high costs, the significant requirements of time and energy, the limitations in eliminating many of the persistent pollutants, and the risk of producing different unwanted secondary by-products, make their use insufficient or incomplete.
Notwithstanding, improvements in the field are constantly looked for and innovative techniques are currently employed. Because of its straightforward design, ease of use, and reasonable cost and due to the fact that, unlike other procedures, it does not generate unwanted substances, adsorption is an advantageous method for the removal of emerging contaminants from water [8]. The process is based on the ability of a material to adsorb the undesired molecules (known as adsorbates) through various mass transfer mechanisms. The most frequently used adsorbent is activated carbon since it is suited to retain multiple types of pollutants like dyes, drug residues, pesticides, and personal care products [9,10,11,12,13]. Nonetheless, its application is restricted by its substantial cost and challenging regeneration. Subsequently, an economically viable implementation of the adsorption approach could be realized if the activated carbon is substituted by low-cost adsorbents. In occurrence, Sandhya et al. [14] used sugarcane juice to prepare biochar. They report propitious results in investigating its capacity to adsorb methylene blue (MB) from an aqueous solution. Xu et al. [15] demonstrated that the biochar synthesized from algal biomasses is an efficacious adsorbent of tetracycline from aqueous matrices. Under optimized conditions, the obtained composite retained more than 80% of the pollutant after five cycles of use. In the study published by Sayed and his coworkers [16], a hybrid treatment including adsorption on a mixture of bentonite and dolomite was conducted. The simultaneous removal of acetaminophen, citalopram, sulfamethoxazole, diclofenac, and estrone from water was achieved and the effluent was non-toxic. An investigation carried out by Chu et al. [17] reveals that magnesium oxide nanoparticles supporting biochar resulting from tea wastes can retain more than 80% of o-chlorophenol (the main chemical for pesticide production) from industrial wastewater. A composite of polycaprolactone-chitosan nanofibers prepared by Saleh et al. [18] was able to effectively retain MB. Rivera-Arenas and her collaborators [19] manufactured a composite hydrogel comprising organobentonite and alginate. Their evaluation of acid yellow 23 adsorption in a fixed-bed column shows that the adsorbent has a good potential of being used in continuous systems designed for dye removal from water.
Against this background, the present paper focused on the capitalization of cherry stones (CS), an industrial by-product, as a precursor for the preparation of an inexpensive composite material possessing adsorbing properties. According to statistics provided by the Food and Agriculture Organization of the United Nations [20], in 2022, the world production of cherries was more than 2.7 million tones, with 14.6% of them being represented by the seeds [21], whose valorization remains negligible [22]. The applicability of this by-product in dye retention from water was the subject of different investigations. Nowicki et al. [23] resorted to the physical activation through conventional and microwave heating to produce carbonaceous adsorbents from CS. The adequacy of the adsorbents was evaluated for three representative organic compounds (a surfactant, a protein, and a synthetic dye) and the results were satisfactory. Rodriguez Arana and Reyes [24] assert that the granular activated carbon obtained from CS by chemical activation with phosphoric acid can remove MB and phenol from aqueous matrices. Pietrzak et al. [25] revealed also that the activated carbon prepared from CS by chemical activation and thermal treatment possessed a sorption capacity comparable with that of the commercial products. Koohestani et al. [26] showed that the granular activated carbon produced from CS via a microwave-assisted technique and carbonization is effective in eliminating colorants. As can be noted, the use of CS for the production of adsorbents is represented mostly by their transformation into activated carbon. The process implies multiple steps, including activation (physical or chemical) and carbonization at elevated temperatures; it is time- and energy-consuming and, therefore, it often entails high costs.
The novelty of the current research emerges from the fact that it proposes a product prepared through a method consisting only of embedding the CS in the form of powder into a natural polymeric matrix, the subsequent material being directly usable.
The newly synthesized composite was first characterized through scanning electron microscopy (SEM) and Fourier-transform infrared spectroscopy (FTIR) and by establishing its point of zero charge (pHPZC).
In the second stage, the obtained composite was put in contact with aqueous media containing MB as the target model pollutant. This molecule is a synthetic dye used predominantly in textile coloring but also in the paper, food, and pharmaceutical industries. When released in water, MB can be responsible for human health concerns. The contact with this dye can cause skin discoloration, redness or dryness, and eye irritation. Severe exposure can lead to amplified heart rate, vomiting, shock, cyanosis, jaundice, or tissue necrosis [27]. MB can be accountable also for plant growth inhibitions and toxicity for aquatic ecosystems [28,29], with its removal from water being highly recommended.
In the third step, three of the main adsorption parameters (pH, adsorbent dose, contact time) were considered as input factors in a response surface methodology with a Box–Behnken design (RSM-BBD) optimization, while the MB final concentration was followed as a response function. Kinetic and equilibrium studies were conducted in optimal conditions, and the experimental data were fitted with various models.
At the end, the regeneration and the reusability of the composite were explored to evaluate its performance after multiple cycles of MB adsorption.

2. Materials and Methods

2.1. Chemicals

The analytical purity reagents were utilized as received. Sodium alginate (SA) (CAS 9005-38-3) and MB (CAS 61-73-4) were purchased from Merck (Bucharest, Romania). Sodium hydroxide (NaOH) (CAS 1310-73-2), hydrochloric acid (HCl) (CAS 7647-01-0), ethanol (C2H5OH) (CAS 64-17-5), sodium nitrate (NaNO3) (7631-99-4), and calcium chloride (CaCl2) (10043-52-4) were procured from Chemical Company (Iasi, Romania). All stock solutions and dilutions at the concentrations required in the experiments were prepared with distilled water.

2.2. Composite Preparation

CS recuperated from fruits harvested from the eastern Romanian region were carefully washed with distilled water in order to remove any remaining fruit residues and dried at room temperature for 24 h and in a laboratory oven (AirPerformance AP60, Froilabo, Paris, France) at 60 °C for 6 h. Then, they were milled (PerkinElmer, Stockholm, Sweden) and sieved (Filtra Vibracion IRIS FTS-0200 sieve shaker, Filtra Vibracion, Badalona, Spain). The fraction recovered from the sieve of 125 µm constituted the raw material that was used along with SA to prepare the composite.
To this purpose, 100 g of SA solution (2% in water) was kept for 2 h under stirring at 300 rpm on a Nahita magnetic plate (Auxilab, Beriáin, Spain). After complete homogenization, 1 g of CS powder was added and the stirring was continued for 1 h at 300 rpm. In the end, the mixture was introduced in a glass burette and dropped with a flow of 4 mL/min in 250 g of CaCl2 (5% in water).
The obtained composite (CSSA) was preserved at 4 °C. Before utilization, it was washed with distilled water to remove any unwanted calcium chloride. The preparation process is schematically represented in Figure 1.

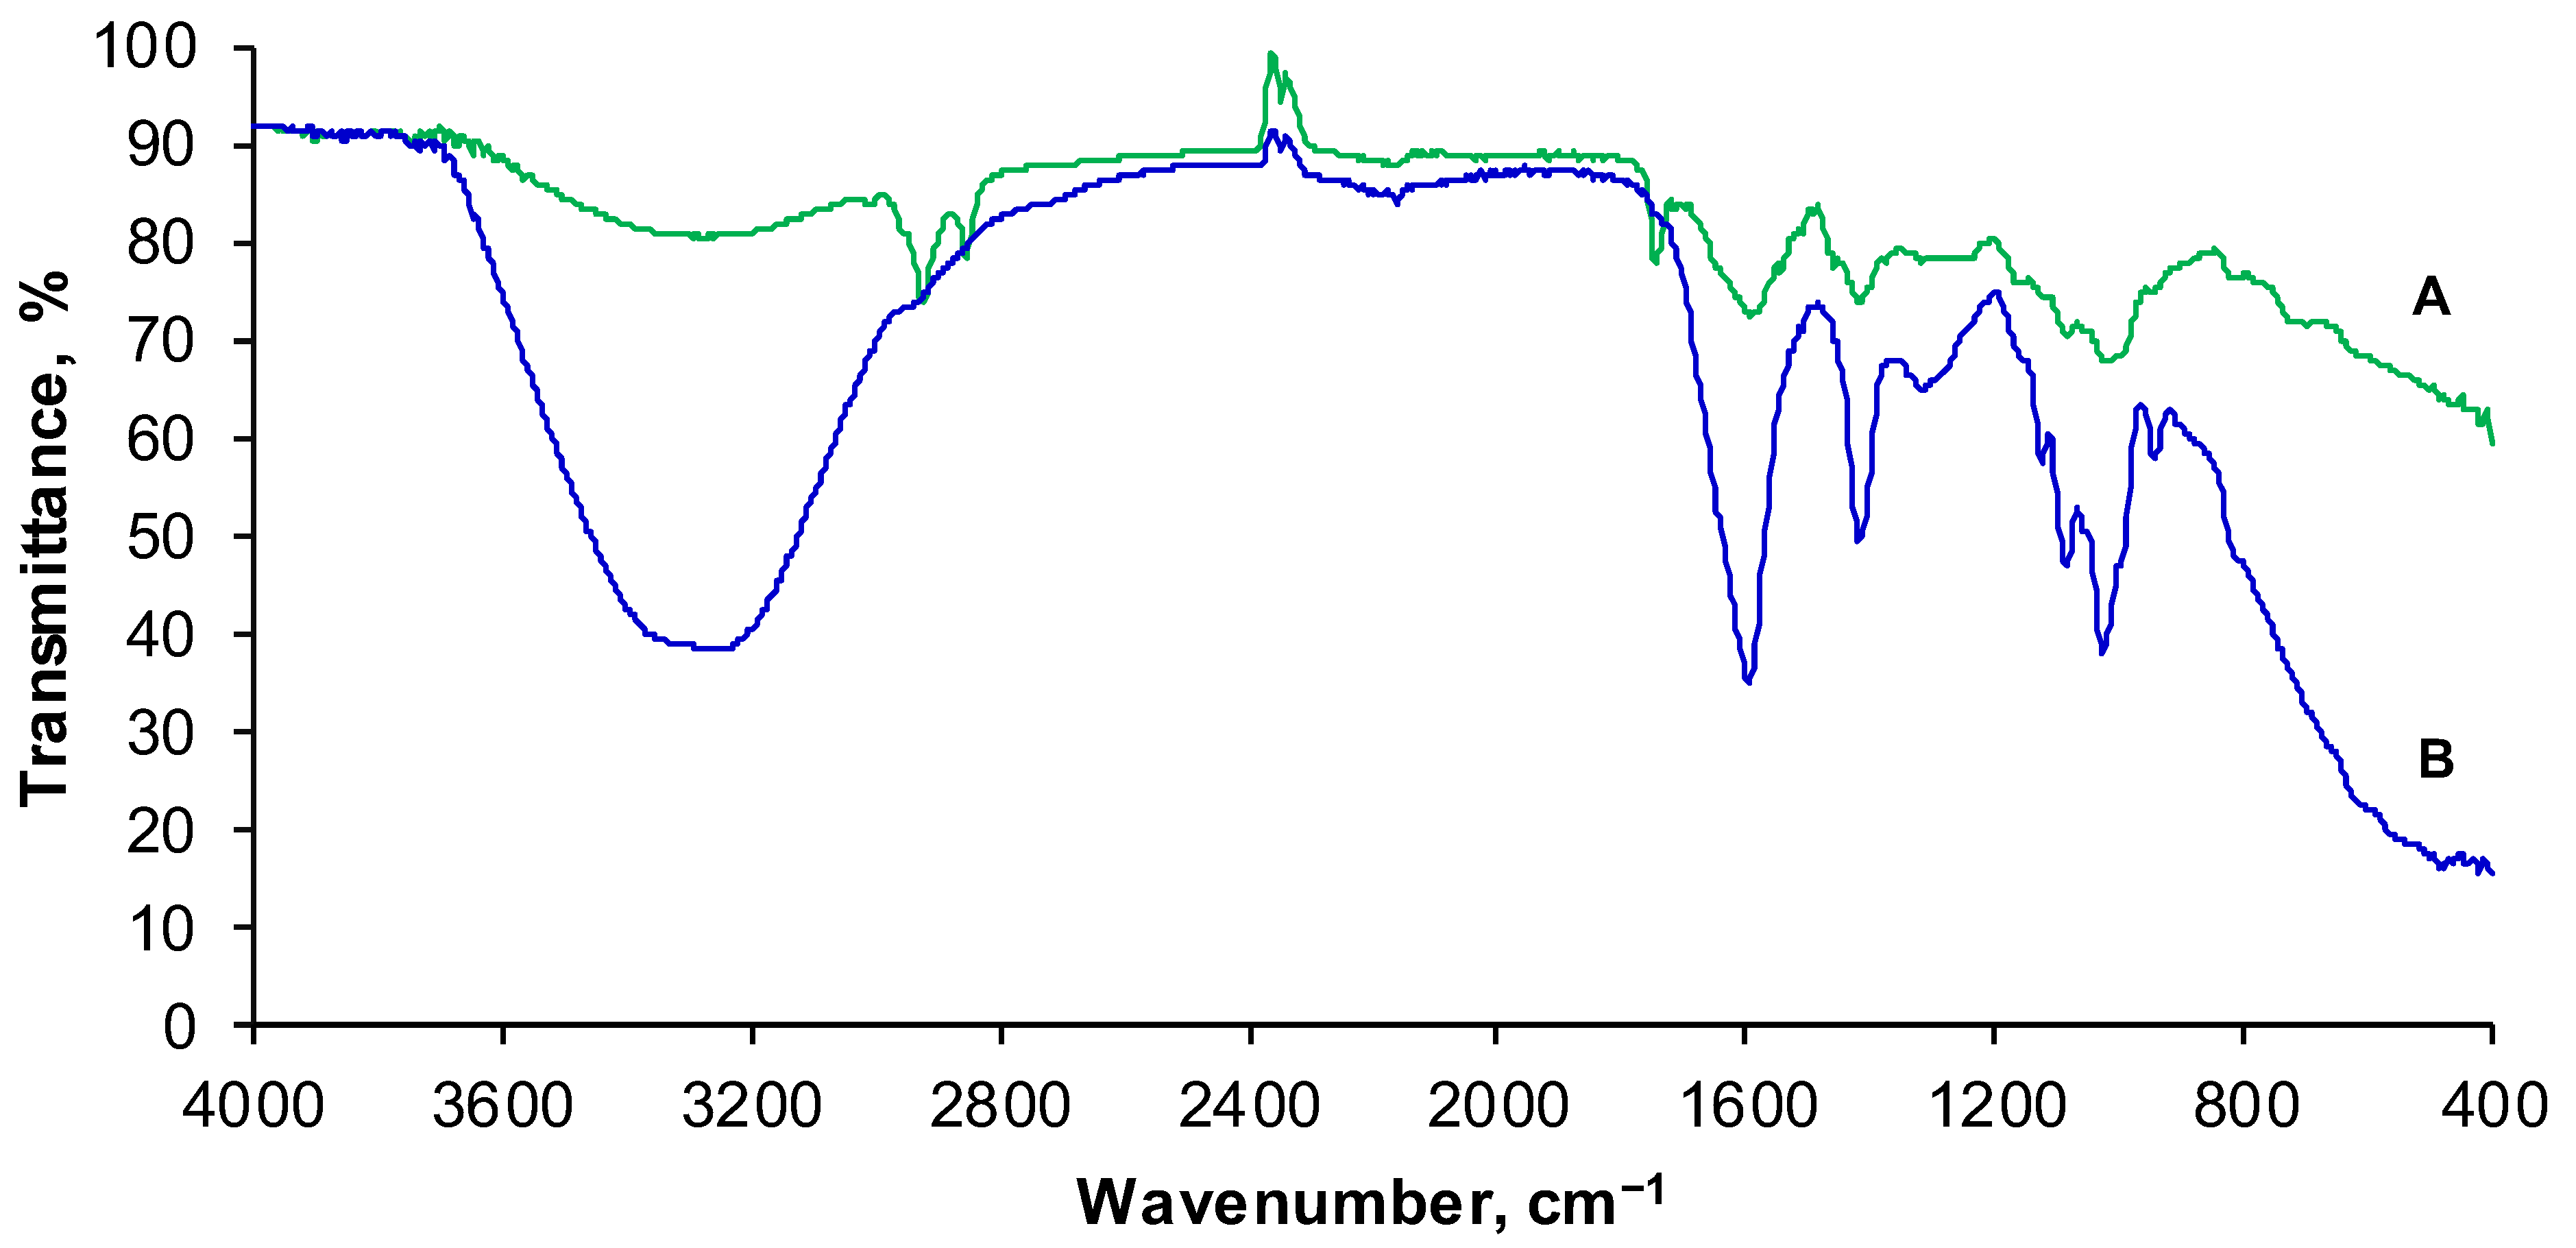
2.3. Composite Characterization

Prior to SEM analysis, CSSA was dried for 12 h at room temperature. Then, it was placed on double-adhesive carbon discs fixed on specific stubs of a TESCAN MIRA device (TESCAN Orsay Holding, Brno, Czech Republic) equipped with TESCAN Essence software version 1.0.8.0. The examination was piloted in normal secondary electron mode under a high vacuum. The detection was realized with a large field detector at an accelerating voltage of 20 keV, with a beam current of 300 pA, at a working distance of 35–50 mm. The magnification range was between 500 μm and 50 µm.
FTIR spectra were acquired on an IRSpirit FTIR spectrometer (Shimadzu, Bucharest, Romania) including an attenuated total reflectance single-reflection (QATR-S) auxiliary. The set interval was between 4000 cm−1 and 400 cm−1 (50 scans/min) with a resolution of 8 cm−1. Between acquisitions, the QATR-S accessory was cleaned with ethanol. The air background spectrum was recorded as a reference, and compared with the anterior one.
For CSSA pHPZC determination, NaNO3 aqueous solution was used as background electrolyte. Then, 25 mL of NaNO3 0.01 M with initial pH (pHi) adjusted between 2 and 12 with NaOH 0.1 M or HCl 0.1 M were introduced in a series of Erlenmeyer flasks. Following this, 0.5 g of CSSA was added. After 24 h at room temperature, the final pH (pHf) was measured. The evolution of differences between the initial and final pH values (ΔpH) against pHi was graphically represented. From the obtained plot, the pHPZC was determined at the intersection point between pHi and ΔpH. pH was measured with a pH tester HI 98103 (Hanna Instruments, Bucharest, Romania).

2.4. Analytical Method

A 1000 mg/L MB stock solution was prepared with distilled water. pH was corrected at the needed value with reduced volumes of NaOH 0.1 M or HCl 0.1 M.
Dilutions with concentrations between 1 and 5 mg/L served to obtain the calibration curve. The absorbance of these dilutions along with that of the MB solutions after adsorption and after desorption was recorded at 663 nm with a UV1280 Spectrophotometer (Shimadzu, Kyoto, Japan).

2.5. Optimization of Adsorption Parameters

The experiments were carried out with 10 mL of 30 mg/L MB solution with variable pH, different amounts of CSSA, and different contact times. These parameters were chosen based upon prior exploration trials. Their values (coded and uncoded) are disclosed in Table 1. The final MB concentration (mg/L) was followed as response function.
The removal efficiency (R, %) and the equilibrium sorption capacity (qe) were calculated with Equations (1) and (2):
R = C i C e C i · 100
q e = C i C e M · V
where Ci and Ce are the initial and equilibrium concentrations (mg/L); V is the MB volume (mL); M is the CSSA amount (g).
The acquired information was introduced in Design Expert 13 software (Stat-Ease, Minneapolis, MN, USA). A quadratic polynomial model, expressed by Equation (3), was generated:
Y K = β 0 + i = 1 n β i · X i + i = 1 n j = 1 n β i j · X i · X j + i = 1 n β i i · X i 2
where YK is the response function, Xi outlooks the independent variables, and β0, βi, βj, and βij are the intercept, linear, quadratic, and interaction coefficients.

2.6. Kinetic and Equilibrium Isotherms Assessment

Once the optimal adsorption conditions were established, 10 mL samples of MB with concentrations between 10 mg/L and 50 mg/L were mixed with CSSA in the optimal RSM-BBD conditions. The pollutant elimination was monitored between 5 and 480 min.
The nonlinear equations of kinetic and equilibrium isotherms models are presented in Table 2 and Table 3. Data were treated in Origin Pro 2019b software acquired from Macasoft Bt. (Gyor, Hungary).

2.7. Composite Regeneration and Reusability

To validate the potential regeneration of the prepared composite, three cycles of adsorption–desorption were performed. The adsorption was carried out with MB solution (samples volumes: 10 mL; initial concentration: 30 mg/L) in the conditions optimized by RSM-BBD. The desorption was conducted by putting in contact 1 g of CSSA loaded with the target molecule with 10 mL of three different eluents: water, hydrochloric acid 0.01 M, and ethanol. The process was conducted for 12 h, under stirring at 200 rpm on a Nahita magnetic plate (Auxilab, Beriáin, Spain).
The desorption efficiency (D, %) was expressed using Equation (17).
D = C d e s . C a d s . · 100
where Cdes. is the MB final concentration in the desorbent (mg/L); Cads. is the MB final concentration after adsorption (mg/L).

2.8. Statistical Analysis

All the experiments were conducted in triplicate. The outcomes collected through the experimental program were statistically evaluated by analysis of variance (ANOVA), standard error, sum of squares, residual sum of squares, coefficient of determination (R2), and adjusted determination coefficient (Adj. R2) with Design-Expert 13 software and Origin Pro 2019b software.

3. Results and Discussion

3.1. Composite Preparation and Characterization

This study aimed to use CS, a by-product from industrial cherry processing, as raw material for the preparation of a potential adsorbent for aqueous media pollutants. To elude the solubilization of CS constituents and to reduce the difficulty of recovering it from solution, CS has to be protected from direct contact with water. A wide variety of research has reported the utilization of different supports [30,31,32,33] as appropriate to cover a precursor of interest. Among them, one can cite SA for its hydrophilicity, biocompatibility, and innocuity [34]. Due to its gelling properties in the presence of metal cations, this polysaccharide, formed of (1,4)-linked α-L-guluronic and β-D-mannuronic acid, is regarded as being able to successfully conduct to a three-dimensional stable network. It is mentioned as an ingredient in the manufacture of various composites containing graphene oxide [35], biochar [36], montmorillonite [37], and zeolitic imidazolate framework-8 [38].
As consequence, a homogeneous mixture of CS powder and SA was dropped in a calcium chloride solution in order to prepare a suitable low-cost material. Spherical beads with a whitish hue were obtained and submitted to different analyses.
SEM examination (Figure 2) reveals that CSSA has a uniform and smooth external surface and displays a porous internal nature. These observations, corroborated with changes appearing after conducting the MB adsorption, suggest that CSSA is appropriate for retaining the considered target water pollutant.
Figure 3A displays the FTIR spectrum of CSSA before MB adsorption. Characteristic bands recorded at approximately 3400 cm−1, 1600 cm−1, 1400 cm−1, and at 1050 cm−1 can be attributed to hydroxyl group (–OH), to asymmetric and symmetric stretching vibrations of the carboxyl group, and to the elongation of C–O groups existing in SA, respectively [39,40]. Peaks observed at 1740 cm−1, 1650 cm−1, and 1500 cm−1 are specific for C=O, –C=O, and C=C stretching vibrations in aldehydes and aromatic compounds from CS. The signal encountered at 1240 cm−1 can be associated with C–O–C of alcohols, phenols, ethers, and esters. Peaks recorded at the wavenumbers 1100 cm−1 and 1040 cm−1 can be assigned to stretching vibrations of C–N and C–O of CS [26,41,42]. The typical peaks existing in SA and CS noticed in CSSA suggest that the composite includes the starting components.
In Figure 3B, the FTIR spectrum recorded after MB adsorption reveals at 1600 cm−1 the aromatic ring existing in the MB structure. The O–H stretching peak (3200–3400 cm−1) relates to the methyl group and C–H stretching peaks (2900 cm−1 and 2850 cm−1) congruent to the methylene group of MB are also visible [43]. As can be seen, the adsorption of the emerging compound from the aqueous solution to CSSA efficaciously took place, with the strong signature of MB being detectable. Stretching of 1640 cm−1 and 3400 cm−1 accredited to –C=N and to the hydroxyl group is consistent with this hypothesis [44].
Another investigation carried out for the characterization of CSSA consisted of the determination of the point of zero charge (pHPZC). The NaNO3 electrolyte used for the analysis can dissociate in aqueous solution. When the contact between CSSA and the electrolyte solution is ensured, complexes of the resulting ions and those of the CSSA surface are easily formed. The process is highly pH-dependent and three situations are possible: negative surface charge, positive surface charge, and parity of positive and negative charges (null surface charge) [45]. As pictured in Figure 4, it can be stated that the pHPZC of CSSA is 6. The pH augmentation from 2 to 4 led to an intensification of pHPZC. A slight decrease in pHPZC can be observed when the initial pH increases from 8 to 10. In the case of a pH range of 4 to 10, the pHPZC is almost constant. In this pH amplitude, CSSA could be considered as amphoteric, implying that the equilibrium pH is not influenced when the initial pH of the solution is adjusted by adding small volumes of acid or base.

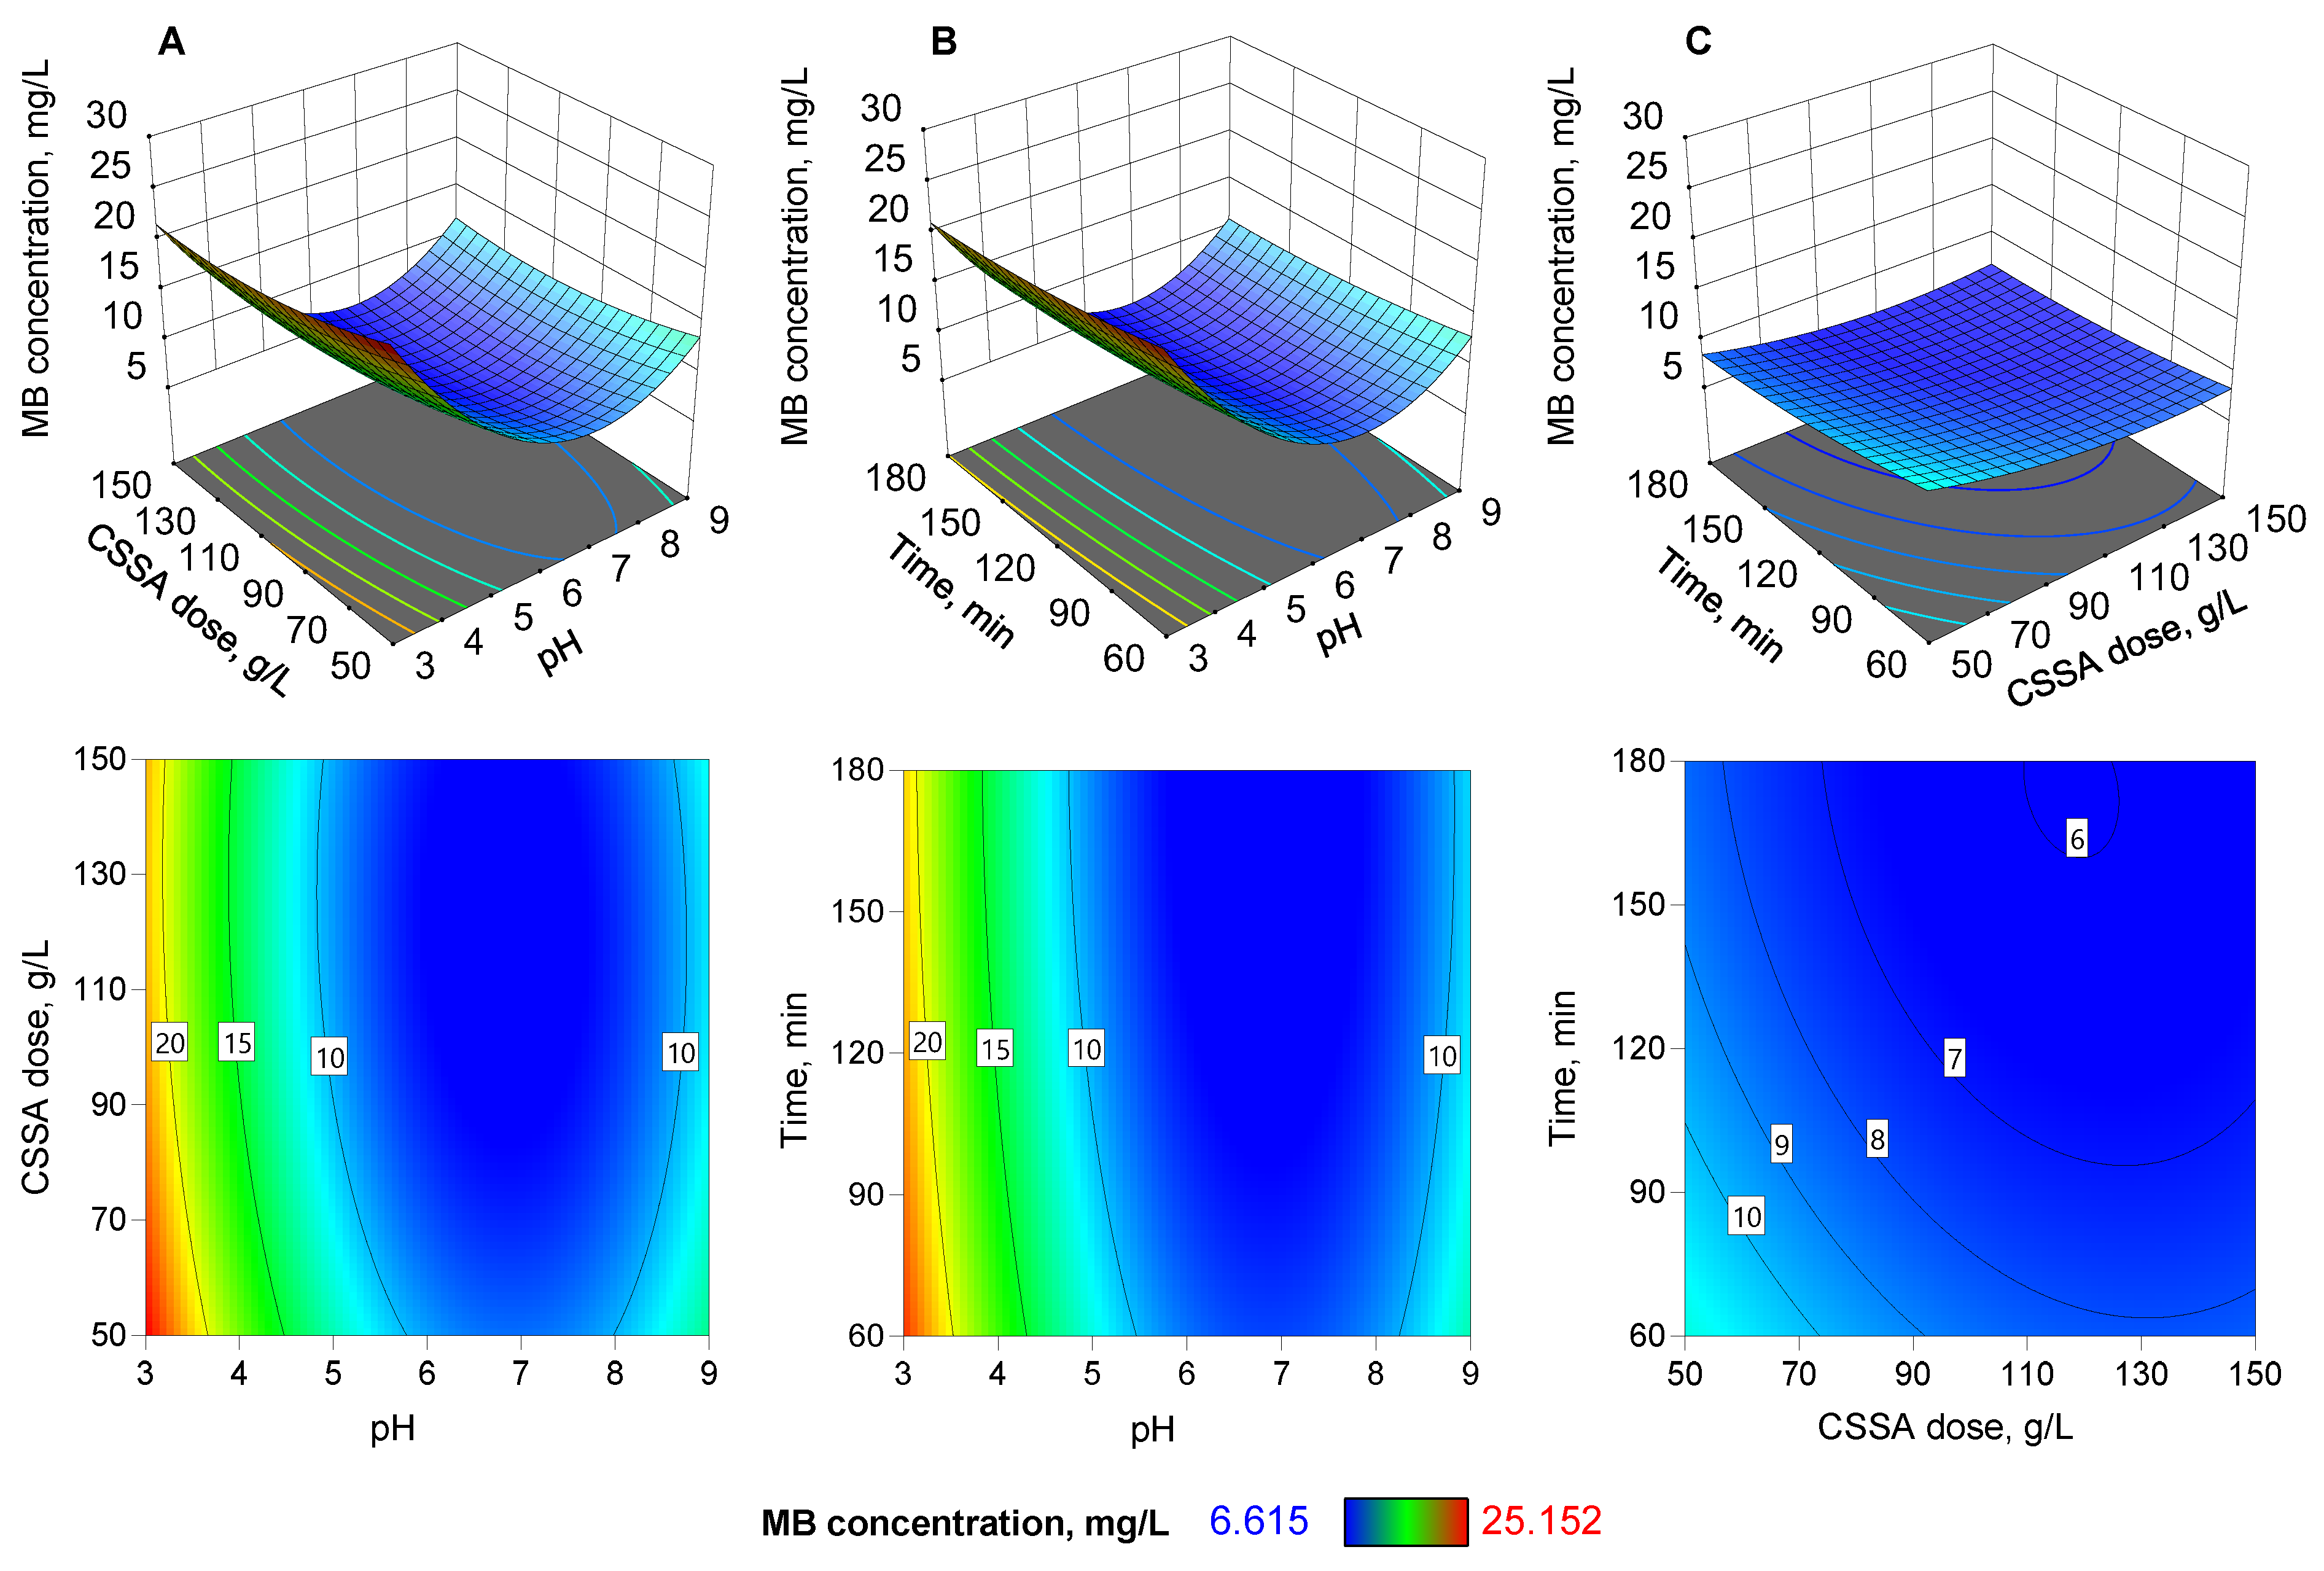
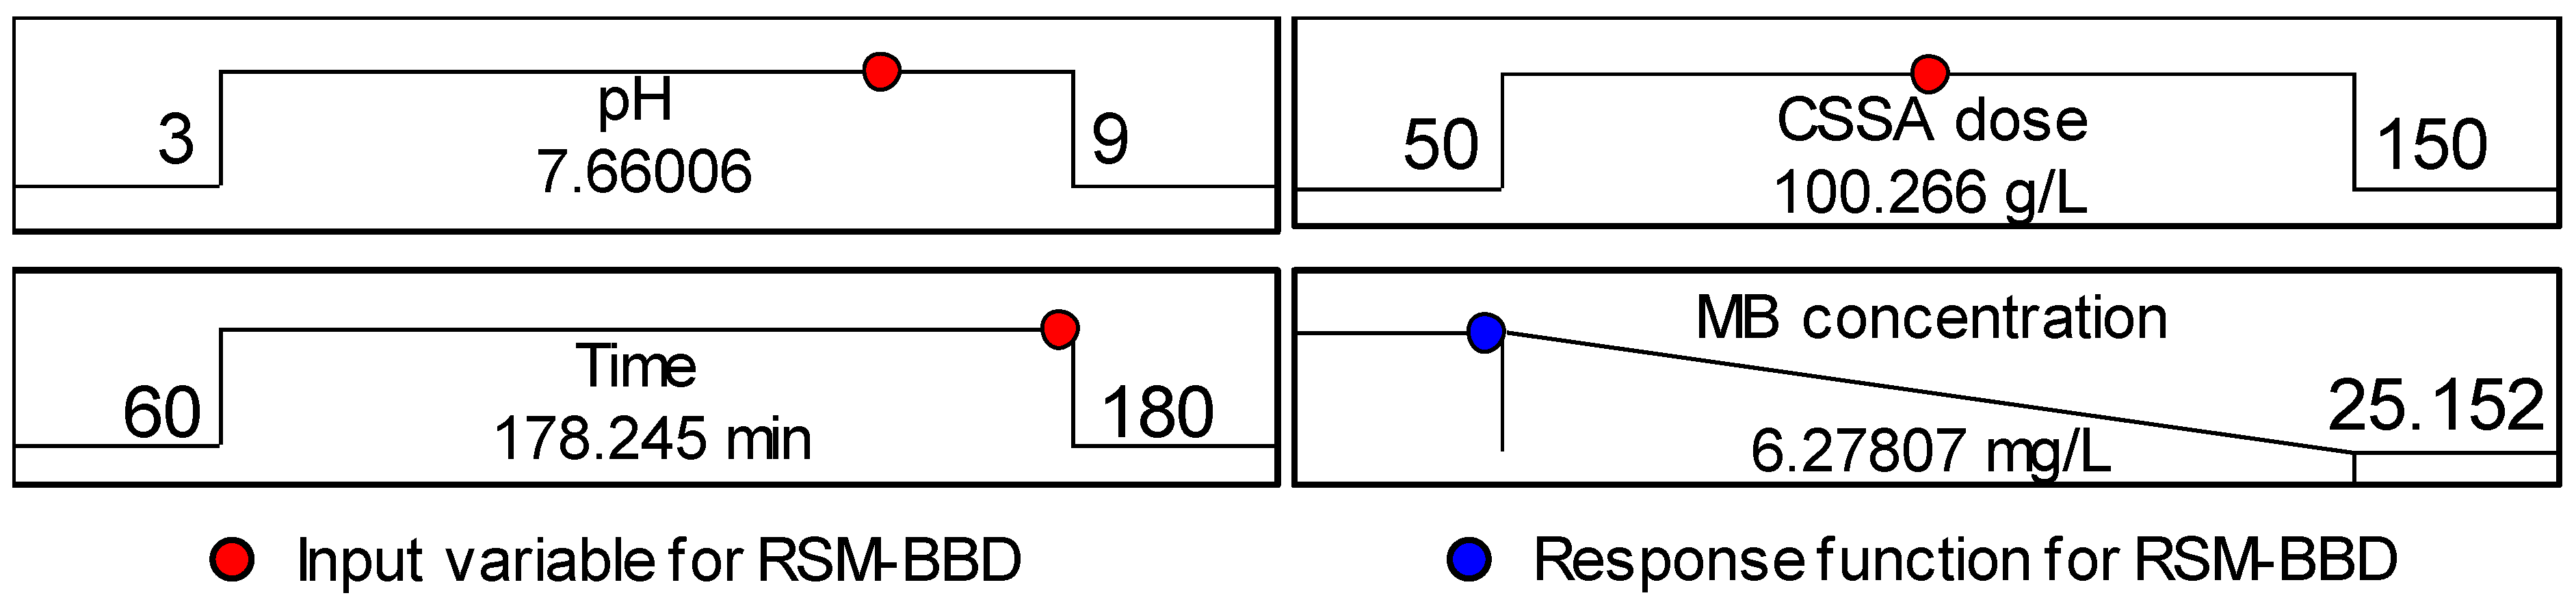
3.2. Adsorption Parameters Optimization by Box-Behnken Design

In favor of establishing the appropriate values for parameters affecting the MB adsorption, an optimization procedure is decidedly recommended. RSM is an unsurpassed technique for the analysis and mathematical modeling of adsorption processes. Based on experimental programs with different variables and after a reduced number of experiments, it estimates the effects and the interactions occurring between selected parameters. Then, it fits the experimental records to mathematical models that are confirmed through graphics and statistical analyses, finally helping to establish the optimal operating conditions required to reach the desired values of chosen response functions [46].
Among the multiple RSM available strategies, BBD—a spherical, three-level fractional factorial design able to avoid extreme investigational circumstances—was considered for the evaluation of removing MB from aqueous media by retention on CSSA. The three chosen factors (initial pH of MB solution, the CSSA dose, and the contact time between the MB solution and CSSA) are varied, as shown in Table 1.
The first factor examined for MB retention on CSSA was the initial pH of MB solution. Due to the fact that it influences the dye ionization and the surface charge of CSSA, this parameter is one of the key factors that must be managed in the adsorption process [47].
Of the three different pH values tested (3, 6, 9), the removal efficiency of the target pollutant from aqueous solution was reduced in acid media and increased in alkali environments. For an initial MB concentration of 30 mg/L and a CSSA dose of 100 g/L, after 180 min of contact the MB removal efficiency was 29.42% ± 0.02% at pH 3, 77.42% ± 0.03% at pH 6, and 64.14% ± 0.005% at pH 9. The experimental adsorption capacities were 0.088 mg/g ± 0.003 mg/g at pH 3, 0.232 mg/g ± 0.003 mg/g at pH 6, and 0.193 mg/g ± 0.002 mg/g at pH 9. This variance is explained by the fact that at pH higher than the MB acid dissociation constant (pKa = 5.8), the dye is ionized and has a positive charge while at pH inferior to pKa it is negatively charged. At the same time, as exposed in the pHPZC analysis, CSSA has a surface charge that is also pH dependent. Its functional groups are protonated at acid pH and, thus, electrostatic repulsion occurs for MB. Moreover, the positive ions from the solution compete with MB at the adsorption sites of the composite. As a consequence, the MB adsorption is diminished. When the pH is augmented to the alkali range, the functional groups of CSSA are deprotonated, being able to interact with positively charged MB, which leads to an enhanced adsorption.
Analogous results have been released by other researchers. Abu Musa et al. [48] collected the Vallisneria natans plant and used it to prepare an adsorbent for azo dyes from water. Their experiments included a four-variable three-planar Box–Behnken design. One of the variables was represented by the initial pH. This was varied from 5 to 9 and its optimal value was found at 7. Zein et al. [49] produced a biosorbent containing solid waste of lemongrass, tested its capacity to adsorb MB, and revealed that the maximum adsorption capacity was reached at pH 9. Shiferraw et al. [50] conducted a study on retaining MB on an adsorbent of phosphoric acid-modified montmorillonite and coffee waste carbon acid and highlighted that the adsorption was optimal at pH 7. Somsesta et al. [51] concluded that MB adsorption on an activated carbon–cellulose composite is not suitable at acidic pH and that it is favorable at pH 6.9.
Another prevalent factor with impact on the adsorption process was the amount of CSSA added to MB solutions. In the present case, three CSSA doses (50 mg/L, 100 mg/L, 150 mg/L) were tested. At the same MB initial concentration of 30 mg/L, at pH 6, after 180 min, the removal efficiency increased with the increase in the CSSA dose from 50 mg/L (where it was 71.92% ± 0.04%) to 100 mg/L, where the highest value of 77.42% ± 0.03% was recorded; the adsorption capacities were 0.214 ± 0.005 mg/g and 0.232 ± 0.003 mg/g, respectively. As mentioned by various other reports [52,53], this could be most likely due to the increase in the number of available adsorption sites for MB molecules. After this limit (considered here as optimal), due to a reduced concentration gradient between MB and CSSA, no considerable increase in MB retention on CSSA surface was detected [54]. A CSSA dose augmented to 150 g/L increased the removal efficiency at only 77.94% ± 0.05%, the adsorption capacity being 0.233 ± 0.005 mg/g.
Time is another parameter with an influence on the adsorption performance. At the beginning of the process, the adsorption sites of CSSA are available for MB, which is easily retained. As the contact time expands, the number of available sites progressively declines until an equilibrium between MB in the solution and that in CSSA is reached. The MB solution with an initial concentration of 30 mg/L and pH 6 was kept in contact with the CSSA (100 g/L) for 60 min, 120 min, or 180 min. The registered removal efficiencies were 60.74% ± 0.03% after 60 min and 77.42% ± 0.03% after 180 min. The adsorption capacities were 0.085 ± 0.003 mg/g in the first case and 0.232 ± 0.003 mg/g in the second situation. Dalmaz and Ozak [55] developed an activated carbon of waste cigarette butts and mixed it with MB solutions for periods ranging between 5 and 250 min. They concluded that the amount of the adsorbed MB increases as the contact time increases up to the equilibrium (registered at 240 min). Zhang et al. [56] used a multi-porous palygorskite to remove MB from water and revealed that the quantity of the MB adsorbed is important in the first minutes of the process (the equilibrium was reached after only 10 min).
The objective of the optimization process conducted in this study was to attain the lowest value for the final MB concentration. The collected data from the 16 runs carried out along with the values projected by RSM-BBD are given in Table 4.
The results were processed with Design-Expert software. A second-order polynomial model (Equation (18)) was generated to predict the final concentration of the target contaminant in the aqueous solution.
Y A B = 6.79 5.39 X 1 1.35 X 2 1.28 X 3 + 0.401 X 1 X 2 + 0.221 X 1 X 3 + 0.399 X 2 X 3 + 9.83 X 1 2 + 1.39 X 2 2 + 0.624 X 3 2
The inter-reliant repercussion of the terms depends on the coefficient signs. Positive signs denote interaction. The increase in the related factors leads to an increase in the response function. Negative signs indicate antagonism, signifying that the related parameters can conduct to the reduction of the response function values.
The importance of the coefficients and their interaction in the mathematical model was verified by analysis of variance (ANOVA) (Table 5) with the help of various tests (Fischer variation ratio, degree of freedom, coefficient of determination, adjusted coefficient of determination, probability value, and t-test). The large F-value reported for the model implies that it is noteworthy. There is only a 0.01% chance that an F-value this large could occur due to noise. p-values less than 0.0500 reveal that model terms are significant. In this case, all three factors (pH, adsorbent dose, and contact time) and their interactions are important model terms. The high determination coefficient (R2 = 0.999) indicates that the generated model is able to reasonably forecast the experimental results. Predicted R2 is in accordance with the adjusted R2. The adequate precision is superior to 4 and designates a suitable signal. Therefore, the regression model prominently represents the relation existing between the independent parameters and the response function.
Equation (5) can serve to calculate the final concentration of MB under conditions further than those surveyed in this study. The normal probability pictured in Figure 5A displays a normal scatter between the experimental results and the predicted ones, with points narrowly aligned along the line, which indicates that the model has an important level of significance.
Figure 5B exhibits the perturbation plot of all the decision variables. The response function is expressed by changing only one variable over its range while keeping the other two constant. The curvature in the pH decision variable implies that the MB final concentration is affected by the changes in this variable while the rather flat lines of the CSSA dose and of time reveal a more reduced impact of these variables on the response. This finding is in agreement with the ANOVA results where one can easily see that the corresponding F-value of pH factor is considerably higher than those of the other two parameters.
The quadratic regression equation served also to obtain 3D surface and 2D plots (Figure 6), which visually returned the significance level of the effect of the parameters on the MB final concentration. A higher slope of the response surface designated the superior impact of the single factors on the response value.
Through Design Expert v.13 software, the pH, the CSSA dose, and the contact time were set to fall within the ranges initially established while the minimization of the response function was desired. The software generated multiple possible solutions, with the best of them being pictured in Figure 7.
In order to confirm this hypothesis, four replications were realized with 10 mL of MB with pH 8, 100 g/L CSSA dose for 180 min. The recorded MB final concentration was 6.322 ± 0.46 mg/L, thus confirming the suitability of the model and endorsing it.

3.3. Kinetic and Equilibrium Isotherms Study

3.3.1. Kinetic Analysis

In the anteriorly presented optimized conditions, five sets of experiments were conducted for the evaluation of the adsorption performance of MB towards CSSA at initial concentrations of the MB solution varying between 10 mg/L and 50 mg/L (Figure 8). The adsorption advancement was surveyed between 5 min and 480 min.
Four different kinetic models, pseudo-1st-order, pseudo-2nd-order, intraparticle diffusion, and Bangham, were compared to the experimentally collected data. The pseudo-first-order kinetic model presumes that the adsorption rate is more dependent on the water contaminant concentration in the aqueous solution than on the surface concentration and explains the adherence of simple compounds to a solid surface. The pseudo-second-order model assumption is based on the fact that both the concentration of the target molecule in the liquid phase and the surface concentration of the adsorbate have an impact on the adsorption. It is considered appropriate for explaining the adsorption of complex compounds on a solid surface. The intraparticle diffusion model investigates the molecule’s diffusion in the pores existing in the adsorbent surface and is suitable for explaining the adsorption on porous solid surfaces while the Bangham model explores the slow diffusion in the adsorbent pores [57,58,59].
The values for the kinetic parameters, and of the applied statistical error function are listed in Table 6. Figure 9 plots the evolution of the adsorption capacity in time.
As observable from Table 6, for all the tested kinetic models, the sum of squares and the residual sum of squares are reduced. Only these data could indicate an apparent adequacy of the fitted equations. This affirmation is decidedly invalidated by the determination coefficients and the adjusted determination coefficients. The pseudo-first-order kinetic is not able to model all the experimental data (R2 ranges between 0.7640 for the adsorption of MB from a solution with a concentration of 10 mg/L and 0.8776 for the adsorption of MB from a solution with a concentration of 30 mg/L and increases to 0.9453 for the adsorption of MB from a solution with a concentration of 50 mg/L). The results are better fitted by the pseudo-second-order model (R2 between 0.9848 for the adsorption of MB from a solution with a concentration of 10 mg/L and 0.9708 for the adsorption of MB from a solution with a concentration of 50 mg/L). This assertion is sustained by the adsorbent capacities at equilibrium, which are comparable to those obtained through experiments [60]. Also, this situation is an indicator of the fact that, in some measure, the rate-limiting step could be the chemical adsorption between the adsorbent and the adsorbate [61].
For the study of kinetic adsorption through diffusion, one of the most frequently used models is represented by Equation (6). The analysis of the allures exhibited in Figure 9 and of the related error functions (Table 6) indicate that the intraparticle diffusion equation is not adequate to describe the MB kinetic adsorption. The increase in the constant C values with the concentration augmentation could be an indicator for the increase in the thickness of the boundary layer and, thus, for the increased chance of internal mass transfer. This hypothesis is not confirmed, since the determination coefficients decrease from 0.6323 for MB concentration of 10 mg/L to 0.4529 for MB concentration of 50 mg/L. Another possibility to verify the adequacy of the intraparticle diffusion model is based on Equations (7) and (8). Starting from the method proposed by Wang and Guo [57], various attempts of dividing the plot of adsorption capacity versus square root of time into multiple portions were realized. Equation (7) was applied in the first 15 min of the kinetic study while Equation (8) was used for the period 30–480 min. The experimental data are not satisfactorily described over the entire considered time range.
For the Bangham model, the determination coefficients are also reduced for all the studied concentrations, which implies that the adsorption is not the rate-limiting step in the process [62].
Other studies report equally that the adsorption of MB on various adsorbents generally follows pseudo-second-order kinetics. Chen et al. [63] engineered a composite material composed of sodium alginate and SiO2 and arrived at the result that the MB adsorption obeys pseudo-second-order kinetics. Yetgin and Amlani [64] disclose that the pseudo-second-order kinetics govern the adsorption of MB on adsorbents made of agriculture low-cost wastes. At the same time, the kinetic investigation carried out by Farhat et al. [65] for MB retention on composite beads fabricated of used tea and alginate indicated that the pseudo-second-order and intraparticle diffusion are representative for the adsorption process.

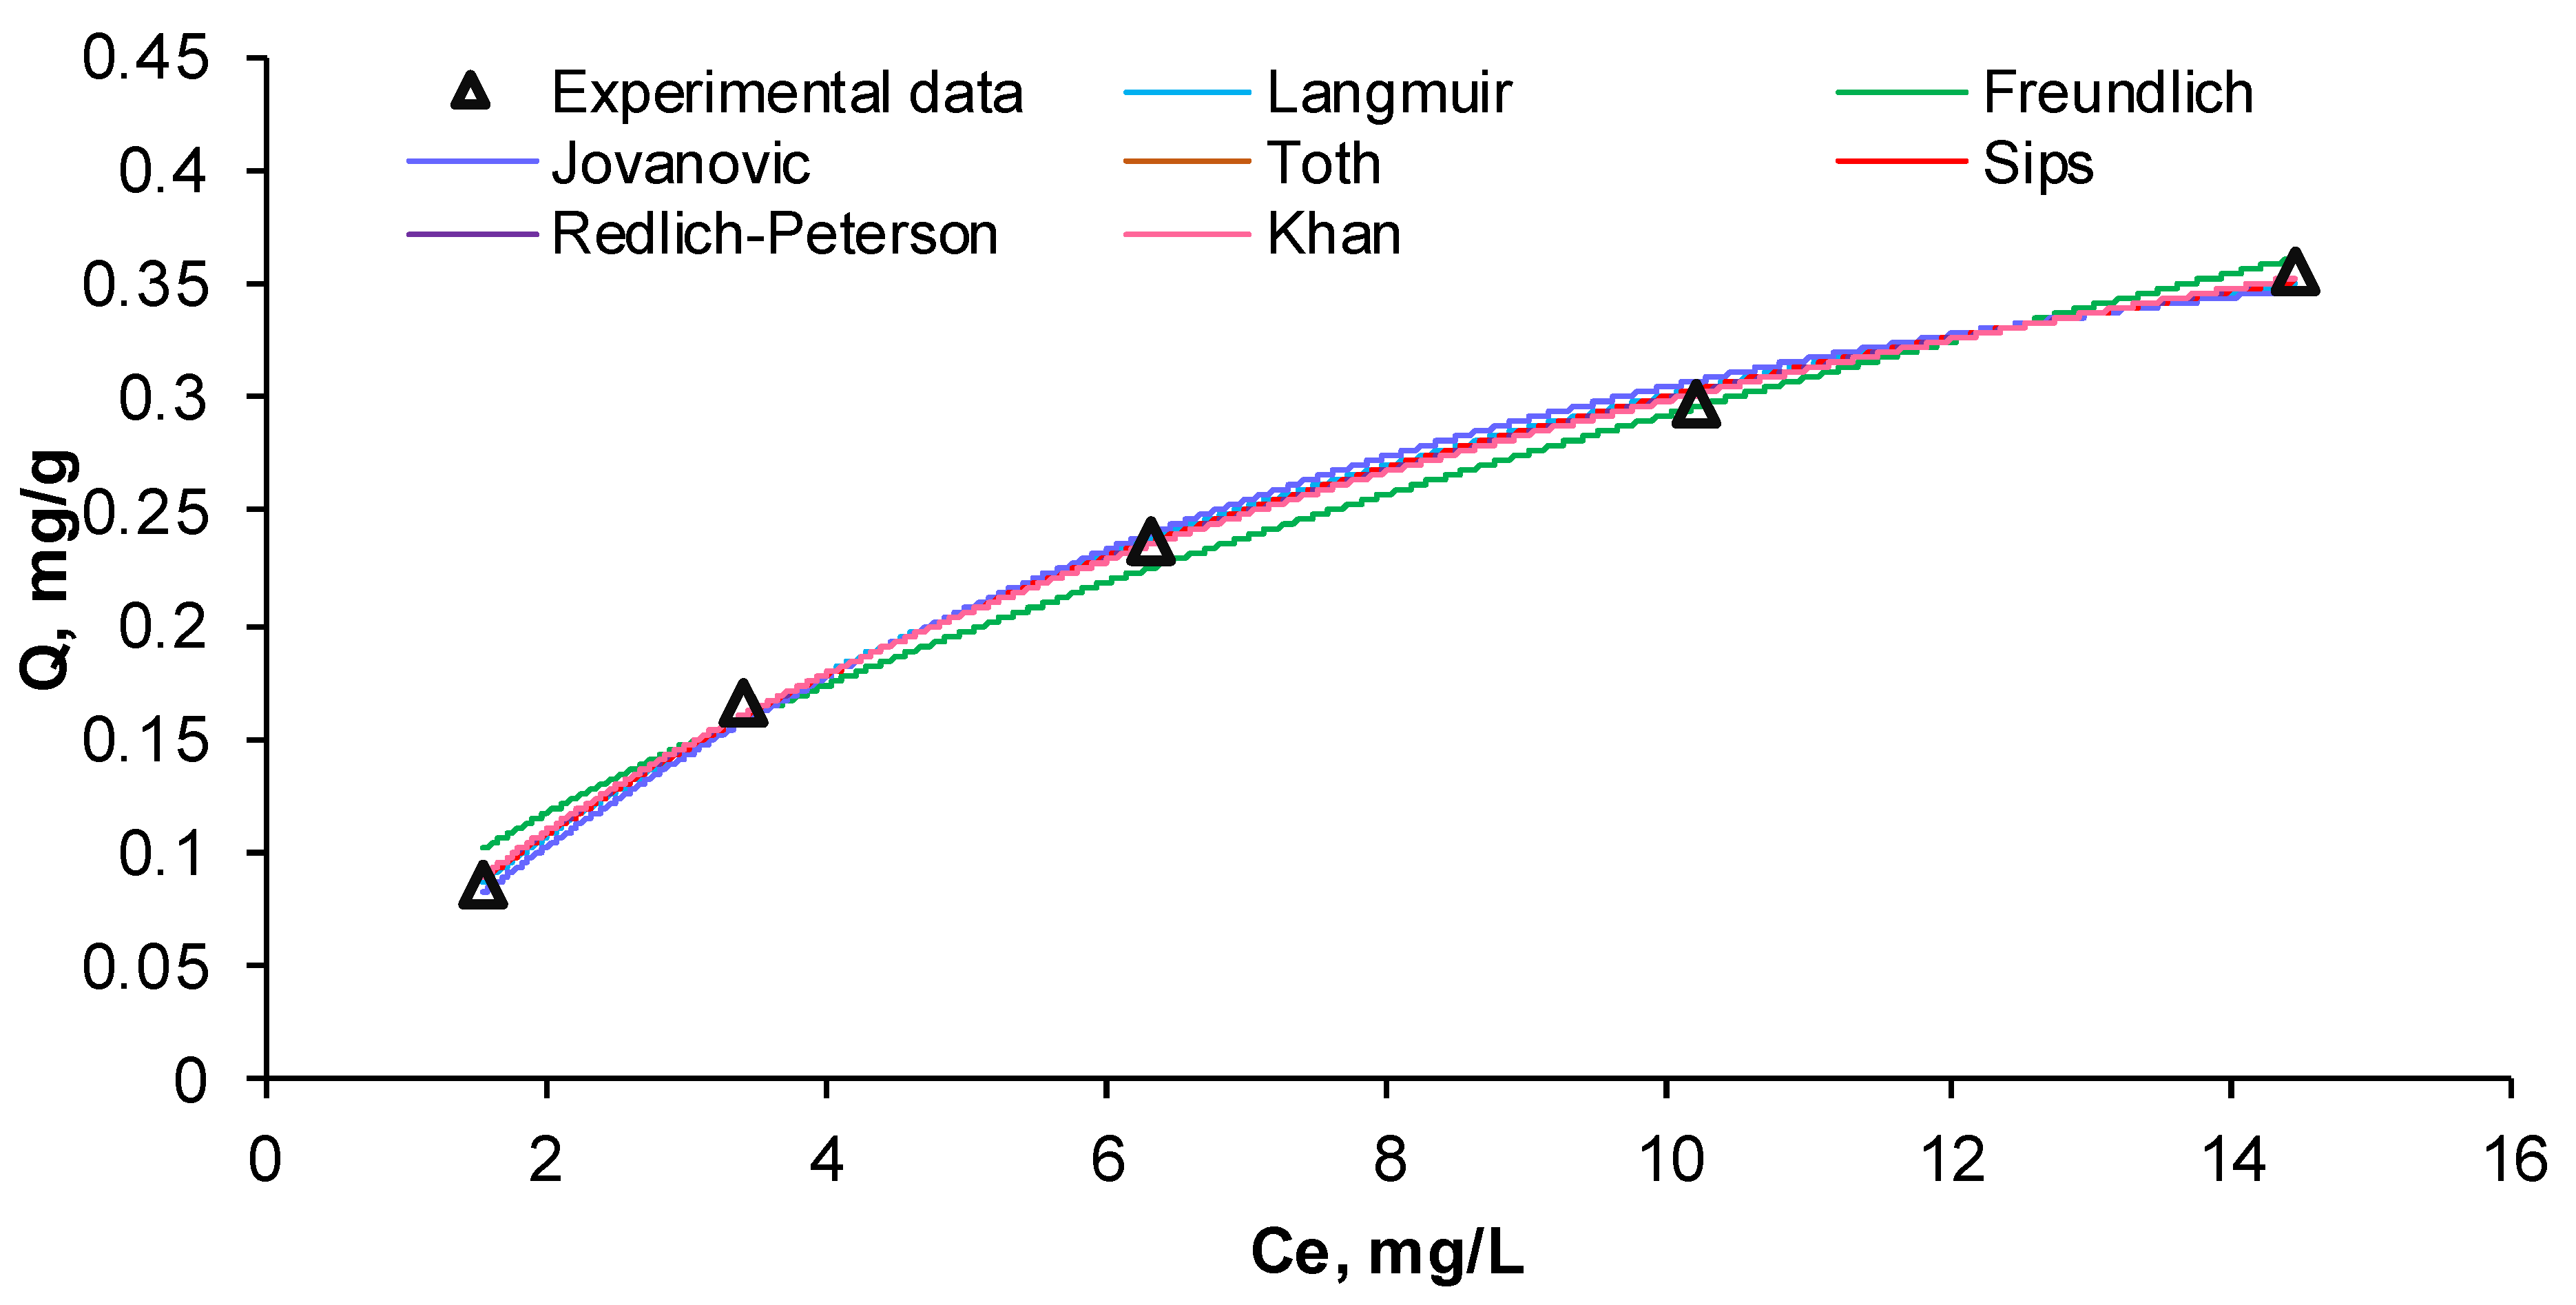
3.3.2. Equilibrium Isotherms Analysis

In terms of equilibrium isotherms, different models with two parameters (Langmuir, Freundlich, and Jovanovic) and three parameters (Toth, Sips, Redlich–Peterson, and Khan) were applied to the registered results. Table 7 and Figure 10 expose the values of the isotherm parameters along with those of the statistical error functions and the graphical representation of the adsorption capacity vs. the equilibrium concentration.
Based on the reported data, it is noticeable that, at first sight, all the tested isotherms seem to accurately describe the behavior of the adsorption process. For all the models, the standard errors, the sum of squares, and the residual sum of squares are well below zero, indicating an insignificant distance between the experimental values and those predicted by the isotherms. Equally, the determination coefficients were very close to the unit, the lowest value being recorded for Freundlich isotherm (R2 = 0.9892) and the highest for the Khan model (R2 = 0.9986). The reduced difference between R2 and adjusted R2 shows their agreement.
Upon closer analysis of the isotherm parameters values, it can be seen that there are some dissimilarities. The experimental adsorption capacity of MB on the CSSA (0.3552 ± 0.0005 mg/g) was compared with those calculated by the mathematical equations. As shown in Table 7, Langmuir discloses a considerably higher adsorption capacity. This could suggest that the adsorption is not a monolayer one. Although the Jovanovic model calculates an adsorption capacity (0.3929 mg/g) nearly the same as the experimental one, as with the Langmuir model, it is usually useful in describing the hyperbolic isotherm with a distinctive plateau. The absence of an obvious plateau, as in Figure 8, where rather a gradual increase in adsorption capacities can be seen, is challenging for this model due to its characteristic design for modeling adsorption reaching saturation [66].
On the other part, the parameter nF of the Freundlich model is superior to the unit (nF = 1.7504), pointing out favorable conditions for the MB removal from aqueous media by retention on CSSA and a multilayer adsorption [67,68]. The parameter nR of the Redlich–Peterson model, inferior to the unit, and the adsorption capacity calculated with the Khan isotherm (0.3459 mg/g), which is akin to the experimental one, likewise sustains the multilayer adsorption [69]. Besides that, the Sips model, which is a combination of the Langmuir and the Freundlich isotherms, has a heterogeneity constant of less than one (nS = 0.9344) also sustaining the idea that multilayer adsorption could occur between MB and CSSA [70].
Although the comparison of the exposed outcomes with earlier studies shows that the Langmuir isotherm was more often found to be appropriate for describing the MB adsorption [52,71,72], there are also cases in which the equilibrium adsorption data are better fitted by the Freundlich model [73,74], signifying that the process is a multilayer one.

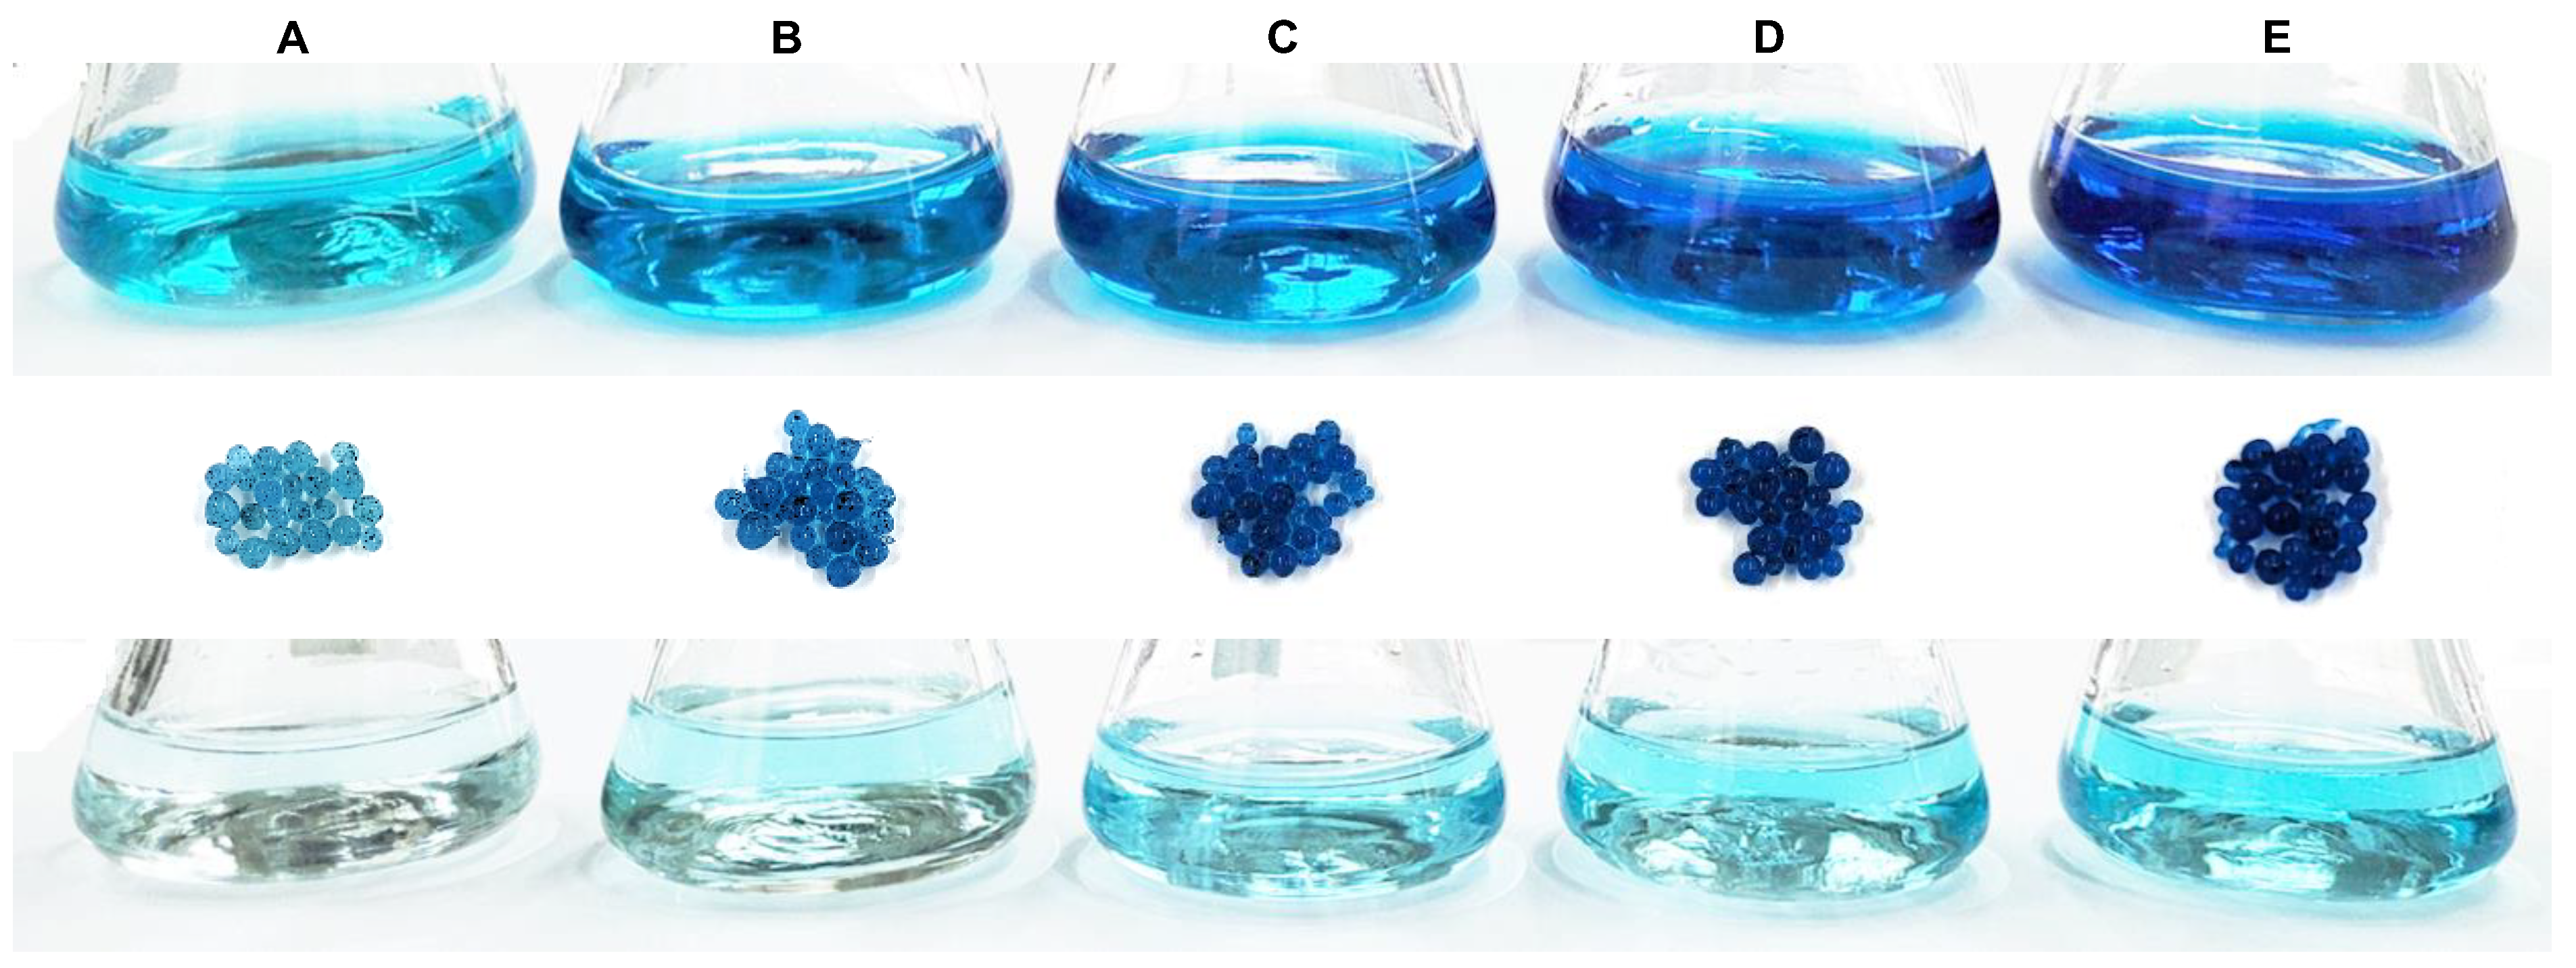
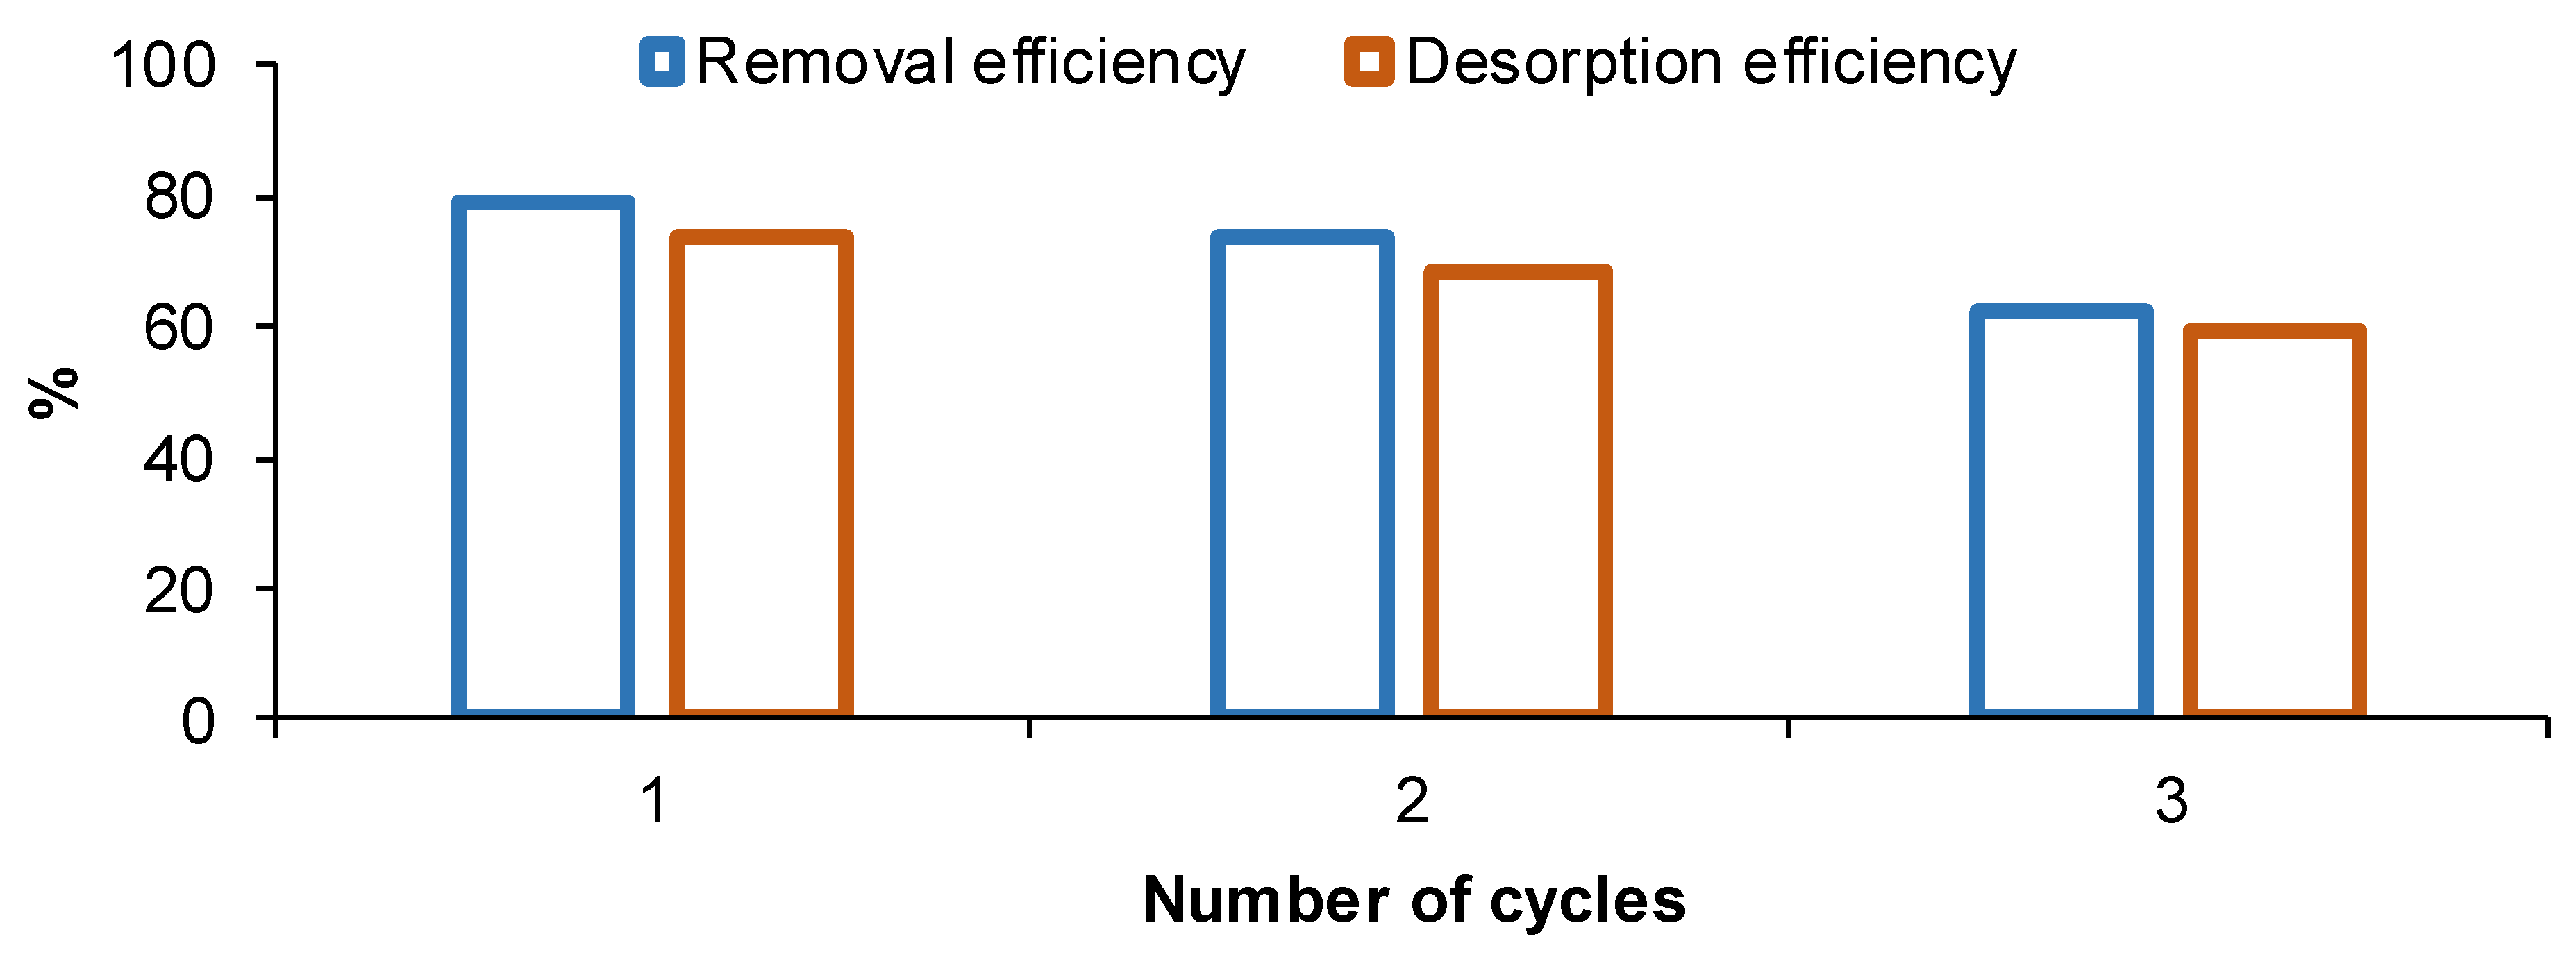
3.4. Adsorbent Regeneration and Reusability

Reusability refers to the possibility of regenerating CSSA after retaining the target pollutant molecule from the aqueous solution. Water, HCl 0.01 M, and ethanol were tested as desorption agents. While no desorption was recorded in water, and only a very reduced desorption was observed in ethanol (8.256% ± 0.0005%), in the hydrochloric acid solution 83.559% ± 0.001% of the adsorbed MB was recovered. This finding could be attributed to the hypothesis that the desorption efficiency is influenced by the solubility of MB in an eluent, by the polarity of the eluent, and by the amount of protons existing in the eluent, which can cause an electrostatic repulsion between the CSSA surface and the MB [68]. As revealed in Figure 11, the CSSA can be reasonably reused three times. The removal efficiency diminished from 78.91% ± 0.035% after the first cycle and to 62.59% ± 0.025% after the third cycle.
The MB adsorption decline could be explained by the fact that the active sites of the CSSA are gradually occupied, becoming unavailable for new MB molecules. Similar behavior is frequently noted by other researchers in which the regeneration and the reusability of the adsorbents were verified [49,75]. Even though, it must be pointed out that this conclusion is not always applicable and that there are also situations worth mentioning in which the adsorption process can be considered an irreversible one, as is the case of the study published by Watwe et al. [70], in which the authors declare that only 5% of the retained dyes were desorbed from the synthesized material.

4. Conclusions

In this paper, CS powder was used as a precursor for the preparation of a new adsorbent. To avoid drawbacks such as the risk of constituents’ water solubility or the difficulties of recovery from aqueous media, this industrial by-product was entrapped in a natural polymeric matrix of SA. The performances of the prepared material were surveyed in a batch system by adsorption of MB. An optimization step was carried out by RSM-BBD for some of the main factors with an impact on the adsorption process. pH, adsorbent dose, and time were varied within the ranges 3–9, 50–150 mg/L, and 60–180 min, respectively, and the final concentration of the model molecule was chosen as a response function. After 180 min of contact, an adsorbent dose of 100 g/L was able to remove more than 80% of the pollutant found in an aqueous solution whose pH was adjusted at 8. The recovered experimental data were fitted to kinetic and isotherm models. Pseudo-second-order was found to govern the adsorption process. In terms of equilibrium isotherm, Freundlich, Redlich–Peterson, Khan, and Sips equations adequately described the MB retention. Furthermore, based on the directed studies, it can be highlighted that the prepared adsorbent can be effectively regenerated and reused for three consecutive adsorption cycles.
The recovered results make it known that the elaborated product can be considered as a promising alternative in water treatment by adsorption being apposite for retaining persistent aqueous contaminants.
In perspective, future research will be developed at least in the interest of studying the ability of the synthesized adsorbent to remove other types of water contaminants, found in single and combined systems.

Author Contributions

Conceptualization, C.-G.G.; methodology, C.-G.G.; software, C.-G.G. and A.-I.S.; validation, C.-G.G. and A.-I.S.; formal analysis, C.-G.G.; investigation, C.-G.G.; resources, C.-G.G. and A.-I.S.; data curation, C.-G.G. and A.-I.S.; writing—original draft preparation, C.-G.G.; writing—review and editing, C.-G.G.; visualization, C.-G.G.; supervision, C.-G.G.; project administration, C.-G.G. and A.-I.S.; funding acquisition, C.-G.G. and A.-I.S. All authors have read and agreed to the published version of the manuscript.

Funding

This research received no external funding.

Data Availability Statement

Data are contained within the article.

Conflicts of Interest

The authors declare no conflicts of interest.

References

  1. Jain, K.; Patel, A.S.; Pardhi, V.P.; Flora, S.J.S. Nanotechnology in wastewater management: A new paradigm towards wastewater treatment. Molecules 2021, 26, 1797. [Google Scholar] [CrossRef]
  2. Salazar-Sogamoso, L.M.; Gómez-García, M.-Á.; Dobrosz-Gómez, I. Comparative life cycle assessment of sequential chemical and electrochemical processes for the treatment of industrial textile wastewater. J. Solid State Electrochem. 2024. [Google Scholar] [CrossRef]
  3. Zhang, T.; Payne, K.; Zhang, J.; Purswani, P.; Karpyn, Z.; Wang, M. Hybrid ion exchange and biological processes for water and wastewater treatment: A comprehensive review of process applications and mathematical modeling. Rev. Environ. Sci. Bio/Technol. 2024, 23, 163–188. [Google Scholar] [CrossRef]
  4. Gaioto, F.C.; Matheus, M.C.; de Souza-Chaves, B.M.; Campos, J.C.; Barra, T.A.; de Almeida Azevedo, D.; Bassin, J.P.; Dezotti, M. Treatment of a pesticide-containing wastewater by biological and physicochemical processes: Seeking the best conditions towards reuse. Braz. J. Chem. Eng. 2023. [Google Scholar] [CrossRef]
  5. Holkar, C.R.; Jadhav, A.J.; Pinjari, D.V.; Mahamuni, N.M.; Pandit, A.B. A critical review on textile wastewater treatments: Possible approaches. J. Environ. Manag. 2016, 182, 351–366. [Google Scholar] [CrossRef]
  6. Collivignarelli, M.C.; Abbà, A.; Carnevale Miino, M.; Damiani, S. Treatments for color removal from wastewater: State of the art. J. Environ. Manag. 2019, 236, 727–745. [Google Scholar] [CrossRef]
  7. Alhasan, H.S.; Omran, A.R.; Al Mahmud, A.; Mady, A.H.; Thalji, M.R. Toxic Congo red dye photodegradation employing green synthesis of zinc oxide nanoparticles using gum arabic. Water 2024, 16, 2202. [Google Scholar] [CrossRef]
  8. Melhi, S.; Alqadami, A.A.; Alosaimi, E.H.; Ibrahim, G.M.; El-Gammal, B.; Bedair, M.A.; Elnaggar, E.M. Effective removal of Malachite Green dye from water using low-cost porous organic polymers: Adsorption kinetics, isotherms, and reusability studies. Water 2024, 16, 1869. [Google Scholar] [CrossRef]
  9. González-Rodríguez, L.; Yáñez, O.; Mena- Ulecia, K.; Hidalgo-Rosa, Y.; García- Carmona, X.; Ulloa- Tesser, C. Exploring the adsorption of five emerging pollutants on activated carbon: A theoretical approach. J. Environ. Chem. Eng. 2024, 12, 112911. [Google Scholar] [CrossRef]
  10. Khnifira, M.; Boumya, W.; Atarki, J.; Sadiq, M.; Achak, M.; Bouich, A.; Barka, N.; Abdennouri, M. Experimental, DFT and MD simulation combined studies for the competitive adsorption of anionic and cationic dyes on activated carbon in an aqueous medium. J. Mol. Struct. 2024, 1310, 138247. [Google Scholar] [CrossRef]
  11. Domergue, L.; Cimetière, N.; Giraudet, S.; Cloirec, P.L. Adsorption onto granular activated carbons of a mixture of pesticides and their metabolites at trace concentrations in groundwater. J. Environ. Chem. Eng. 2022, 10, 108218. [Google Scholar] [CrossRef]
  12. Sanz-Santos, E.; Gutiérrez-Sánchez, P. Multicomponent and continuous adsorption of neonicotinoid pesticides identified in the EU Watch Lists onto mesoporous and biogenic activated carbon. Sep. Purif. Technol. 2024, 346, 127514. [Google Scholar] [CrossRef]
  13. Zhu, X.; He, M.; Sun, Y.; Xu, Z.; Wan, Z.; Hou, D.; Alessi, D.S.; Tsang, D.C.W. Insights into the adsorption of pharmaceuticals and personal care products (PPCPs) on biochar and activated carbon with the aid of machine learning. J. Hazard. Mater. 2022, 423, 127060. [Google Scholar] [CrossRef] [PubMed]
  14. Sandhya, V.; Pillai, R.; Balan, R.; Vijayaraghavan, R.; Rangaraj, L.; Revathi, V. Nanoarchitectonics of hydrothermal carbonized sugarcane juice-derived biochar for high supercapacitance and dye adsorption performance. Nano-Struct. Nano-Objects 2024, 39, 101249. [Google Scholar] [CrossRef]
  15. Xu, S.; Yang, J.; Marrakchi, F.; Wei, M.; Liu, Y.; Xiao, Y.; Li, C.; Wang, S. Macro- and micro-algae-based carbon composite for pharmaceutical wastewater treatment: Batch adsorption and mechanism study. Process Saf. Environ. Prot. 2023, 176, 641–652. [Google Scholar] [CrossRef]
  16. Sayed, K.; Wan Mohtar, W.H.M.; Hanafiah, Z.M.; Wan-Mohtar, W.A.A.Q.I.; Abd Manan, T.S.B.; Mohamad Sharif, S.A.B. Simultaneous enhanced removal of pharmaceuticals and hormone from wastewaters using series combinations of ultra-violet irradiation, bioremediation, and adsorption technologies. J. Water Process Eng. 2024, 57, 104589. [Google Scholar] [CrossRef]
  17. Chu, T.T.H.; Tran, T.M.N.; Pham, M.T.; Viet, N.M.; Thi, H.P. Magnesium oxide nanoparticles modified biochar derived from tea wastes for enhanced adsorption of o-chlorophenol from industrial wastewater. Chemosphere 2023, 337, 139342. [Google Scholar] [CrossRef]
  18. Saleh, H.M.; Albukhaty, S.; Sulaiman, G.M.; Abomughaid, M.M. Design, preparation, and characterization of polycaprolactone–chitosan nanofibers via electrospinning techniques for efficient methylene blue removal from aqueous solutions. J. Compos. Sci. 2024, 8, 68. [Google Scholar] [CrossRef]
  19. Rivera-Arenas, D.; Macías-Quiroga, I.F.; Dávila-Arias, M.T.; Vélez-Upegui, J.J.; Sanabria-González, N.R. Adsorption of acid yellow 23 dye on organobentonite/alginate hydrogel beads in a fixed-bed column. J. Compos. Sci. 2023, 7, 362. [Google Scholar] [CrossRef]
  20. Food and Agriculture Organization of the United Nations (FAOSTAT). Crops and Livestock Products: Cherries; United Nations: New York, NY, USA, 2022. [Google Scholar]
  21. Soares Mateus, A.R.; Pena, A.; Sendón, R.; Almeida, C.; Nieto, G.A.; Khwaldia, K.; Sanches Silva, A. By-products of dates, cherries, plums and artichokes: A source of valuable bioactive compounds. Trends Food Sci. Technol. 2023, 131, 220–243. [Google Scholar] [CrossRef]
  22. Abuşka, M.; Şevik, S.; Kayapunar, A. Comparative energy and exergy performance investigation of forced convection solar air collectors with cherry stone/powder. Renew. Energy 2019, 143, 34–46. [Google Scholar] [CrossRef]
  23. Nowicki, P.; Kaźmierczak, M.; Wiśniewska, M. Adsorption of organic pollutants on carbonaceous adsorbents prepared by direct activation of sweet cherry stones. ChemPhysChem 2024, 25, e202300859. [Google Scholar] [CrossRef] [PubMed]
  24. Rodríguez Arana, J.M.R.; Mazzoco, R.R. Adsorption studies of methylene blue and phenol onto black stone cherries prepared by chemical activation. J. Hazard. Mater. 2010, 180, 656–661. [Google Scholar] [CrossRef] [PubMed]
  25. Pietrzak, R.; Nowicki, P.; Kaźmierczak, J.; Kuszyńska, I.; Goscianska, J.; Przepiórski, J. Comparison of the effects of different chemical activation methods on properties of carbonaceous adsorbents obtained from cherry stones. Chem. Eng. Res. Des. 2014, 92, 1187–1191. [Google Scholar] [CrossRef]
  26. Koohestani, M.; Salem, A.; Salem, S. Decolorization of corn syrup in a dynamic system by activated carbon bed: Microwave-assisted impregnation of H3PO4 over cherry and date stones for efficient purification. Sustain. Chem. Pharm. 2023, 36, 101298. [Google Scholar] [CrossRef]
  27. Pawar, R.R.; Lalhmunsiama; Gupta, P.; Sawant, S.Y.; Shahmoradi, B.; Lee, S.-M. Porous synthetic hectorite clay-alginate composite beads for effective adsorption of methylene blue dye from aqueous solution. Int. J. Biol. Macromol. 2018, 114, 1315–1324. [Google Scholar] [CrossRef]
  28. Mallick, S.; Barik, D.; Pradhan, N. Commelina erecta, L. biomass-silver nanoparticle composite as a heterogeneous catalyst for methylene blue degradation. Appl. Catal. O Open 2024, 192, 206939. [Google Scholar] [CrossRef]
  29. Bushra, R.; Mohamad, S.; Alias, Y.; Jin, Y.; Ahmad, M. Current approaches and methodologies to explore the perceptive adsorption mechanism of dyes on low-cost agricultural waste: A review. Microp. Mesoporous Mater. 2021, 319, 111040. [Google Scholar] [CrossRef]
  30. Jiang, Q.; Han, Z.; Li, W.; Ji, T.; Yuan, Y.; Zhang, J.; Zhao, C.; Cheng, Z.; Wang, S. Adsorption properties of heavy metals and antibiotics by chitosan from larvae and adult Trypoxylus dichotomus. Carbohydr. Polym. 2022, 276, 118735. [Google Scholar] [CrossRef]
  31. Malik, D.S.; Jain, C.K.; Yadav, A.K. Removal of heavy metals from emerging cellulosic low-cost adsorbents: A review. Appl. Water Sci. 2017, 7, 2113–2136. [Google Scholar] [CrossRef]
  32. Guo, H.; Qin, Q.; Chang, J.-S.; Lee, D.-J. Modified alginate materials for wastewater treatment: Application prospects. Bioresour. Technol. 2023, 387, 129639. [Google Scholar] [CrossRef] [PubMed]
  33. Doyo, A.N.; Kumar, R.; Barakat, M.A. Recent advances in cellulose, chitosan, and alginate based biopolymeric composites for adsorption of heavy metals from wastewater. J. Taiwan Inst. Chem. Eng. 2023, 151, 105095. [Google Scholar] [CrossRef]
  34. Zheng, D.; Wang, K.; Bai, B. A critical review of sodium alginate-based composites in water treatment. Carbohydr. Polym. 2024, 331, 121850. [Google Scholar] [CrossRef] [PubMed]
  35. Li, H.; Zhu, X.; Zhao, J.; Ling, G.; Zhang, P. Emerging adsorbents: Applications of sodium alginate/graphene oxide composite materials in wastewater treatment. J. Water Process Eng. 2024, 59, 105100. [Google Scholar] [CrossRef]
  36. Tian, Y.; Sun, X.; Chen, N.; Cui, X.; Yu, H.; Feng, Y.; Xing, D.; He, W. Efficient removal of hexavalent chromium from wastewater using a novel sodium alginate-biochar composite adsorbent. J. Water Process Eng. 2024, 64, 105655. [Google Scholar] [CrossRef]
  37. Akin, K.; Ugraskan, V.; Isik, B.; Cakar, F. Adsorptive removal of crystal violet from wastewater using sodium alginate-gelatin-montmorillonite ternary composite microbeads. Int. J. Biol. Macromol. 2022, 223, 543–554. [Google Scholar] [CrossRef]
  38. Zhang, C.; Chen, W.; Owens, G.; Chen, Z. Recovery of rare earth elements from mine wastewater using alginate microspheres encapsulated with zeolitic imidazolate framework-8. J. Hazard. Mater. 2024, 471, 134435. [Google Scholar] [CrossRef]
  39. Liu, Z.; Zhao, J.; Wang, A.; Yuan, H.; Chi, Y. Adsorption behavior and mechanism of Cu(II) by sodium alginate/carboxymethylcellulose/magnesium hydroxide (SC-MH) hydrogel. Int. J. Biol. Macromol. 2024, 277, 134046. [Google Scholar] [CrossRef]
  40. Cai, Z.; Zhou, W.; Chen, W.; Huang, R.; Zhang, R.; Sheng, L.; Shi, M.; Hu, Y.; Huang, C.; Chen, Y. Preparation and properties of cationic starch-carrageenan-sodium alginate hydrogels with pH and temperature sensitivity. Food Chem. 2024, 459, 140272. [Google Scholar] [CrossRef]
  41. Venegas-Gómez, A.; Gómez-Corzo, M.; Macías-García, A.; Carrasco-Amador, J.P. Charcoal obtained from cherry stones in different carbonization atmospheres. J. Environ. Chem. Eng. 2020, 8, 103561. [Google Scholar] [CrossRef]
  42. Angin, D. Production and characterization of activated carbon from sour cherry stones by zinc chloride. Fuel 2014, 115, 804–811. [Google Scholar] [CrossRef]
  43. Pradhan, A.C.; Paul, A.; Rao, G.R. Sol-gel-cum-hydrothermal synthesis of mesoporous Co-Fe@Al2O3−MCM-41 for methylene blue remediation. J. Chem. Sci. 2017, 129, 381–395. [Google Scholar] [CrossRef]
  44. Raiyaan, G.I.D.; Khalith, S.B.M.; Sheriff, M.A.; Arunachalam, K.D. Bio-adsorption of methylene blue dye using chitosan-extracted from Fenneropenaeus indicus shrimp shell waste. J. Aquac. Mar. Biol. 2021, 10, 146–150. [Google Scholar]
  45. Nasiruddin Khan, M.; Sarwar, A. Determination of points of zero charge of natural and treated adsorbents. Surf. Rev. Lett. 2007, 14, 461–469. [Google Scholar] [CrossRef]
  46. Karimifard, S.; Alavi Moghaddam, M.R. Application of response surface methodology in physicochemical removal of dyes from wastewater: A critical review. Sci. Total Environ. 2018, 640-641, 772–797. [Google Scholar] [CrossRef] [PubMed]
  47. Zhao, S.; Jing, K.; Liu, H. Facile construction of pH-responsive graphene oxide-based aerogel and its efficient and selective adsorption performance toward methylene blue. Chem. Eng. Res. Des. 2024, 208, 1–14. [Google Scholar] [CrossRef]
  48. Abu Musa, M.; Chowdhury, S.; Biswas, S.; Nur Alam, S.M.; Parvin, S.; Abdus Sattar, M. Removal of aqueous methylene blue dye over Vallisneria Natans biosorbent using artificial neural network and statistical response surface methodology analysis. J. Mol. Liq. 2024, 393, 123624. [Google Scholar] [CrossRef]
  49. Zein, R.; Satrio Purnomo, J.; Ramadhani, P.; Safni; Alif, M.F.; Putri, C.N. Enhancing sorption capacity of methylene blue dye using solid waste of lemongrass biosorbent by modification method. Arab. J. Chem. 2023, 16, 104480. [Google Scholar] [CrossRef]
  50. Shiferraw, B.T.; Mengesha, D.N.; Kim, H. Enhanced adsorption capacity of phosphoric acid-modified montmorillonite clay and ground coffee waste-derived carbon-based functional composite beads for the effective removal of methylene blue. Colloids Surf. Physicochem. Eng. Asp. 2024, 695, 134243. [Google Scholar] [CrossRef]
  51. Somsesta, N.; Sricharoenchaikul, V.; Aht-Ong, D. Adsorption removal of methylene blue onto activated carbon/cellulose biocomposite films: Equilibrium and kinetic studies. Mater. Chem. Phys. 2020, 240, 122221. [Google Scholar] [CrossRef]
  52. Duru Kamacı, U.; Kamacı, M. Hydrogel beads based on sodium alginate and quince seed nanoparticles for the adsorption of methylene blue. Inorg. Chem. Commun. 2024, 160, 111919. [Google Scholar] [CrossRef]
  53. Allahkarami, E.; Allahkarami, E.; Heydari, M.; Azadmehr, A.; Maghsoudi, A. Assessment of chromite ore wastes for methylene blue adsorption: Isotherm, kinetic, thermodynamic studies, ANN, and statistical physics modeling. Chemosphere 2024, 358, 142098. [Google Scholar] [CrossRef] [PubMed]
  54. Chaima, H.; Eddine, B.C.; Faouzia, B.; Rana, H.; Aymene Salah, B.; Gil, A.; Imene, B.-A.; Ferhat, D.; Riadh, B.; Mokhtar, B. Adsorptive removal of cationic dye from aqueous solutions using activated carbon prepared from Crataegus monogyna/sodium alginate/polyaniline composite beads: Experimental study and molecular dynamic simulation. J. Mol. Liq. 2024, 408, 125372. [Google Scholar] [CrossRef]
  55. Dalmaz, A.; SİVrİKaya ÖZak, S. Methylene blue dye efficient removal using activated carbon developed from waste cigarette butts: Adsorption, thermodynamic and kinetics. Fuel 2024, 372, 132151. [Google Scholar] [CrossRef]
  56. Zhang, J.; Cai, D.; Zhang, G.; Cai, C.; Zhang, C.; Qiu, G.; Zheng, K.; Wu, Z. Adsorption of methylene blue from aqueous solution onto multiporous palygorskite modified by ion beam bombardment: Effect of contact time, temperature, pH and ionic strength. Appl. Clay Sci. 2013, 83–84, 137–143. [Google Scholar] [CrossRef]
  57. Wang, J.; Guo, X. Rethinking of the intraparticle diffusion adsorption kinetics model: Interpretation, solving methods and applications. Chemosphere 2022, 309, 136732. [Google Scholar] [CrossRef]
  58. Bensalah, J. Removal of the textile dyes by a resin adsorbent polymeric: Insight into optimization, kinetics and isotherms adsorption phenomenally. Inorg. Chem. Commun. 2024, 161, 111975. [Google Scholar] [CrossRef]
  59. Benjelloun, M.; Miyah, Y.; Akdemir Evrendilek, G.; Zerrouq, F.; Lairini, S. Recent advances in adsorption kinetic models: Their application to dye types. Arab. J. Chem. 2021, 14, 103031. [Google Scholar] [CrossRef]
  60. Waghmare, C.; Ghodmare, S.; Ansari, K.; Alfaisal, F.M.; Alam, S.; Khan, M.A.; Ezaier, Y. Adsorption of methylene blue dye onto phosphoric acid-treated pomegranate peel adsorbent: Kinetic and thermodynamic studies. Desalin. Water Treat. 2024, 318, 100406. [Google Scholar] [CrossRef]
  61. Loutfi, M.; Mariouch, R.; Mariouch, I.; Belfaquir, M.; ElYoubi, M.S. Adsorption of methylene blue dye from aqueous solutions onto natural clay: Equilibrium and kinetic studies. Mater. Today 2023, 72, 3638–3643. [Google Scholar] [CrossRef]
  62. Boughrara, L.; Zaoui, F.; Guezzoul, M.h.; Sebba, F.Z.; Bounaceur, B.; Kada, S.O. New alginic acid derivatives ester for methylene blue dye adsorption: Kinetic, isotherm, thermodynamic, and mechanism study. Int. J. Biol. Macromol. 2022, 205, 651–663. [Google Scholar] [CrossRef] [PubMed]
  63. Chen, S.; Wen, H.; Zheng, T.; Liu, X.; Wang, Z.; Tian, S.; Fan, H.; Chen, Y.; Zhao, H.; Wang, Y. Engineering sodium alginate-SiO2 composite beads for efficient removal of methylene blue from water. Int. J. Biol. Macromol. 2023, 239, 124279. [Google Scholar] [CrossRef] [PubMed]
  64. Yetgin, S.; Amlani, M. Agricultural low-cost waste adsorption of methylene blue and modelling linear isotherm method versus nonlinear prediction. Clean Technol. Environ. Pol. 2024. [Google Scholar] [CrossRef]
  65. Farhat, Z.; Kumar, A.; Das, C. Fabrication of used-tea embedded alginate beads for cationic dye remediation: Synergistic effect of surface adsorption and intraparticle diffusion. Surf. Interfaces 2024, 51, 104601. [Google Scholar] [CrossRef]
  66. Chu, K.H.; Hashim, M.A.; Debord, J.; Harel, M.; Salvestrini, S.; Bollinger, J.-C. The Jovanović adsorption isotherm in water contaminant research: Unmasking spurious versions and spotlighting the real thing. Chem. Eng. Sci. 2023, 281, 119127. [Google Scholar] [CrossRef]
  67. Mechati, F.; Djilani, C.; Bougdah, N.; Messikh, N.; Boussaha, E.; Moumen, A.; Bouchalta, C.; Medjram, M.S. Adsorption of methylene blue onto activated carbon prepared under N2/microwave radiation supported cobalt: Kinetics, isotherms, and thermodynamics studies. Desalin. Water Treat. 2023, 284, 288–300. [Google Scholar] [CrossRef]
  68. Bazan-Wozniak, A.; Nosal-Wiercińska, A.; Yilmaz, S.; Pietrzak, R. Chitin-based porous carbons from Hermetia illucens fly with large surface area for efficient adsorption of methylene blue; adsorption mechanism, kinetics and equilibrium studies. Measurement 2024, 226, 114129. [Google Scholar] [CrossRef]
  69. Hui, Y.; Liu, R.; Lan, J.; Sun, T.; Xu, A. Recyclable chitosan adsorbent: Facile functionalization strategy, excellent removal capacity of dyes and adsorption mechanism. Chemosphere 2024, 359, 142291. [Google Scholar] [CrossRef]
  70. Watwe, V.; Kulkarni, S.; Kulkarni, P. Development of dried uncharred leaves of Ficus benjamina as a novel adsorbent for cationic dyes: Kinetics, isotherm, and batch optimization. Ind. Crops Prod. 2023, 195, 116449. [Google Scholar] [CrossRef]
  71. Thakur, S.; Pandey, S.; Arotiba, O.A. Development of a sodium alginate-based organic/inorganic superabsorbent composite hydrogel for adsorption of methylene blue. Carbohydr. Polym. 2016, 153, 34–46. [Google Scholar] [CrossRef]
  72. Brazil, T.R.; Sousa, É.M.L.; dos Anjos, E.G.R.; Moura, N.K.; Rocha, L.S.; Calisto, V.; Gonçalves, M.; Rezende, M.C. Producing efficient adsorbents from kraft lignin for the temoval of contaminants from water—A full factorial design. Water 2024, 16, 1838. [Google Scholar] [CrossRef]
  73. Holilah; Asranudin; El Messaoudi, N.; Ulfa, M.; Hamzah, A.; Hamid, Z.A.A.; Ramadhani, D.V.; Suryanegara, L.; Mahardika, M.; Melenia, A.T.; et al. Fabrication a sustainable adsorbent nanocellulose-mesoporous hectorite bead for methylene blue adsorption. Case Stud. Chem. Environ. Eng. 2024, 10, 100850. [Google Scholar] [CrossRef]
  74. Aksu Demirezen, D.; Demirezen Yılmaz, D.; Yıldız, Y.Ş. Magnetic chitosan/calcium alginate double-network hydrogel beads: Preparation, adsorption of anionic and cationic surfactants, and reuse in the removal of methylene blue. Int. J. Biol. Macromol. 2023, 239, 124311. [Google Scholar] [CrossRef] [PubMed]
  75. Pishdadi-Aghdarreh, F.; Norouzbeigi, R.; Velayi, E. Simultaneous adsorption of methylene blue cationic dye and paraquat herbicide on activated lightweight expanded clay aggregate (LECA) as a sustainable and recyclable adsorbent. Appl. Clay Sci. 2024, 256, 107432. [Google Scholar] [CrossRef]
Figure 1. Preparation of CSSA.
Jcs 08 00402 g001
Figure 2. SEM micrographs of CSSA before (A) and after (B) MB adsorption.
Jcs 08 00402 g002
Figure 3. FTIR spectra for CSSA before (A), and after (B) MB adsorption.
Jcs 08 00402 g003
Figure 4. pHPZC of the CSSA.
Jcs 08 00402 g004
Figure 5. RSM-BBD plots for predicted vs. actual values of MB final concentration (A), and for perturbation of all decision variables (B).
Jcs 08 00402 g005
Figure 6. The 3D response surfaces and 2D contour plots of interaction occurring between CSSA dose and pH (A), time and pH (B), and time and CSSA dose (C).
Jcs 08 00402 g006
Figure 7. Optimized working conditions and corresponding value of the response function.
Jcs 08 00402 g007
Figure 8. Kinetic of MB adsorption on the prepared composite at different dye concentrations ((A) 10 mg/L, (B) 20 mg/L, (C) 30 mg/L, (D) 40 mg/L, (E) 50 mg/L).
Jcs 08 00402 g008
Figure 9. Kinetic models for the adsorption on CSSA at different MB concentrations ((A) 10 mg/L, (B) 20 mg/L, (C) 30 mg/L, (D) 40 mg/L, (E) 50 mg/L).
Jcs 08 00402 g009
Figure 10. Equilibrium isotherms for MB adsorption on CSSA.
Jcs 08 00402 g010
Figure 11. Adsorption–desorption cycles for MB–CSSA system.
Jcs 08 00402 g011
Table 1. Factors and levels of variation in RSM-BBD.
FactorsVariation Levels
CodedUncodedLow (−1)High (+1)
X1pH39
X2CSSA dose, g/L50150
X3Time, min60180
Table 2. Nonlinear equations for the tested kinetic models.
Kinetic ModelEquation
Pseudo-first-order Q t = Q e · ( 1 e k 1 · t ) (4)
Pseudo-second-order Q t = k 2 · Q e 2 · t ( 1 + k 2 · Q e · t ) (5)
Intraparticle diffusion Q t = k i · t 1 2 + C i (6)
Q t = k i 1 · t 1 2 , 0 ≤ tt1(7)
Q t = k i 2 ( t t 1 1 2 + Q t = t 1 ) , t1tt2(8)
Bangham Q t = k B · t ϑ (9)
Qt—concentration on the solid phase at time t, mg/g; Qe—adsorbent capacity at equilibrium, mg/g; k1—pseudo-first-order constant rate, min−1; t—contact time, min; k2—pseudo-second-order constant rate, g/(mg·min); ki, ki1, ki2—diffusion constant rates, mg/(g/min−1/2); Ci—intraparticle diffusion constant intercept, mg/g; kB—Bangham constant, mL/(g/L); ϑ—Bangham constant, dimensionless.
Table 3. Nonlinear equations for tested equilibrium isotherms.
Equilibrium IsothermNon-Linear Equation
Langmuir Q e = Q L · K L · C e 1 + K L · C e (10)
Freundlich Q e = K F · C e 1 / n F (11)
Jovanovic Q e = Q J · ( 1 e ( K J · C e ) ) (12)
Toth Q e = Q T o · C e ( 1 K T o + C e n T o ) 1 / n T o (13)
Sips Q d , t = Q S · ( K S · C e ) n S 1 + K S · C e n S (14)
Redlich–Peterson Q e = K R · C e 1 + a R · C e n R (15)
Khan Q e = Q K · K K · C e ( 1 + K K · C e ) n K (16)
Qe—adsorbate concentration on solid phase at equilibrium, mg/g; Ce—adsorbate concentration on fluid phase at equilibrium, mg/L; QL—maximum Langmuir uptake, mg/g; KL—Langmuir constant, L/mg; KF—Freundlich constant, (mg/g)(L/mg)1/nF; nF—Freundlich constant, dimensionless; QJ—Jovanovic maximum uptake, mg/g; KJ—Jovanovic constant, L/g; QTo—Toth maximum uptake, mg/g; KTo—Toth constant, L/mg; nTo—Toth constant, dimensionless; QS—Sips maximum uptake, mg/g; KS—Sips constant, L/mg; nS—Sips constant, dimensionless; KR—Redlich–Peterson constant, L/g; αR—Redlich–Peterson constant, 1/mg; nR—Redlich–Peterson exponent, dimensionless; QK—Khan maximum uptake, mg/g; KK—Khan constant, L/mg; nK—Khan exponent, dimensionless.
Table 4. Experimental runs and response function for RSM-BBD.
Run
Order
X1X2X3MB Blue Final Concentration, mg/L
Experimental
Value
Predicted
Value
161001206.7786.79
2910018010.75910.80
3315012021.55421.65
4310018021.17421.13
591006012.87512.92
661001206.7886.79
76501808.4218.47
861001206.7956.79
961501806.6156.57
106506011.78411.83
116150608.3818.33
1231006024.17524.13
1335012025.15225.15
1495012013.66613.57
15915012011.67211.68
Table 5. ANOVA results for MB removal by adsorption on the prepared material.
SourceSum of SquaresdfMean SquareF-Valuep-Value
Model619.93968.8810,265.12<0.0001
X1232.021232.0234,576.67<0.0001
X214.58114.582173.20<0.0001
X313.12113.121955.60<0.0001
X1X20.643210.643295.850.0002
X1X30.195810.195829.180.0029
X2X30.637610.637695.020.0002
X12357.131357.1353,221.34<0.0001
X227.1317.131061.99<0.0001
X321.4411.44214.25<0.0001
Residual0.033650.0067
Lack of Fit0.033430.0111152.540.0065
Pure Error0.000120.0001
Cor Total619.9714
Table 6. Kinetic parameters and statistical error function values of the nonlinear models applied for MB adsorption on CSSA.
KineticParametersValuesSum of SquaresResidual Sum
of Squares
R2Adj. R2
MB initial concentration: 10 mg/L
Experimental dataQe, mg/g0.0844
Pseudo-first-orderQe, mg/g0.0828 0.13230.0000140.76400.7509
k1, min−10.2433
Pseudo-second-orderQe, mg/g0.0844 0.13240.0000090.98480.9839
k2, g/(mg·min)6.3750
Intraparticle diffusion (Equation (6))ki, mg/(g/min−1/2)0.0007 0.00030.0002260.63230.6119
Ci, mg/g0.0720
Intraparticle diffusion (Equations (7) and (8))ki1, mg/(g/min−1/2)0.01810.00250.0007160.86840.8529
ki2, mg/(g/min−1/2)0.0002
BanghamkB, mL/(g/L)0.06440.13230.0000990.83870.8297
ϑ, dimensionless0.0479
MB initial concentration: 20 mg/L
Experimental dataQe, mg/g0.1656
Pseudo-first-orderQe, mg/g0.1628 0.51720.0002800.78490.7730
k1, min−10.3074
Pseudo-second-orderQe, mg/g0.1652 0.51740.0000330.97420.9728
k2, g/(mg·min)4.8066
Intraparticle diffusion (Equation (6))ki, mg/(g/min−1/2)0.0010 0.00080.0004830.62950.6090
Ci, mg/g0.1473
Intraparticle diffusion (Equations (7) and (8))ki1, mg/(g/min−1/2)0.03240.00120.0006580.70480.6702
ki2, mg/(g/min−1/2)0.0007
BanghamkB, mL/(g/L)0.13580.51720.0002270.82560.8159
ϑ, dimensionless0.0348
MB initial concentration: 30 mg/L
Experimental dataQe, mg/g0.2367
Pseudo-first-orderQe, mg/g0.2328 1.05040.0004430.87760.8708
k1, min−10.2693
Pseudo-second-orderQe, mg/g0.23651.05080.0000740.97930.9781
k2, g/(mg·min)2.7981
Intraparticle diffusion (Equation (6))ki, mg/(g/min−1/2)0.00160.00200.0016000.55870.5342
Ci, mg/g0.2080
Intraparticle diffusion (Equations (7) and (8))ki1, mg/(g/min−1/2)0.05330.01820.0058040.84290.8245
ki2, mg/(g/min−1/2)0.0012
BanghamkB, mL/(g/L)0.18961.05000.0008830.75640.7428
ϑ, dimensionless0.0390
MB initial concentration: 40 mg/L
Experimental dataQe, mg/g0.2977
Pseudo-first-orderQe, mg/g0.29341.65890.0006090.91640.9117
k1, min−10.2412
Pseudo-second-orderQe, mg/g0.29851.65940.0001100.98480.9839
k2, g/(mg·min)1.9127
Intraparticle diffusion (Equation (6))ki, mg/(g/min−1/2)0.00210.00350.0037300.48790.4595
Ci, mg/g0.2598
Intraparticle diffusion (Equations (7) and (8))ki1, mg/(g/min−1/2)0.06030.03490.0124440.80840.7860
ki2, mg/(g/min−1/2)0.0002
BanghamkB, mL/(g/L)0.23451.65760.0022000.69790.6811
ϑ, dimensionless0.0422
MB initial concentration: 50 mg/L
Experimental dataQe, mg/g0.3552
Pseudo-first-orderQe, mg/g0.35132.38050.0005560.94530.9422
k1, min−10.2443
Pseudo-second-orderQe, mg/g0.35722.38080.0002960.97080.9692
k2, g/(mg·min)1.6499
Intraparticle diffusion (Equation (6))ki, mg/(g/min−1/2)0.0024 0.00460.0055500.45290.4239
Ci, mg/g0.3128
Intraparticle diffusion (Equations (7) and (8))ki1, mg/(g/min−1/2)0.08010.03820.0099360.87220.8572
ki2, mg/(g/min−1/2)0.0006
BanghamkB, mL/(g/L)0.28342.37760.00340.66040.6415
ϑ, dimensionless0.0404
Table 7. Equilibrium isotherm parameters and statistical error functions values of the nonlinear isotherm models for MB adsorption on CSSA.
Equilibrium
Isotherm
ParametersValuesStandard
Error
Sum of SquaresResidual Sum of SquaresR2Adj. R2
Experimental dataQe, mg/g0.35520.0005
LangmuirQL, mg/g0.55670.02230.30530.0000890.99800.9973
KL, L/mg0.11770.0096
FreundlichKF, (mg/g)(L/mg)1/nF0.07850.00760.30490.0004880.98920.9857
nF, dimensionless1.75040.1305
JovanovicQJ, mg/g0.39290.01750.30520.0002350.99480.9931
KJ, L/g0.14950.0143
TothQTo, mg/g0.43100.18260.30530.0000700.99840.9969
KTo, L/mg0.14970.0640
nTo, dimensionless0.88670.1582
SipsQS, mg/g0.57660.06680.30530.0000840.99810.9962
KS, L/mg0.09910.0505
nS, dimensionless0.93440.1777
Redlich–PetersonKR, L/g0.07270.01310.30530.0000700.99840.9969
αR, 1/mg0.18530.1261
nR, dimensionless0.88700.1588
KhanQK, mg/g0.34590.19220.30530.0000630.99860.9972
KK, L/mg0.20240.1359
nK, dimensionless0.77360.2077
Disclaimer/Publisher’s Note: The statements, opinions and data contained in all publications are solely those of the individual author(s) and contributor(s) and not of MDPI and/or the editor(s). MDPI and/or the editor(s) disclaim responsibility for any injury to people or property resulting from any ideas, methods, instructions or products referred to in the content.

