Article

Three-Dimensional Printing Limitations of Polymers Reinforced with Continuous Stainless Steel Fibres and Curvature Stiffness

by
Alison J. Clarke
1,*,
Andrew N. Dickson
2,
Vladimir Milosavljević
3 and
Denis P. Dowling
1
1
I-Form Centre, School of Mechanical & Materials Engineering, University College Dublin, Belfield, D04 C1P1 Dublin, Ireland
2
Infraprint, Nova University College Dublin, Belfield Innovation Park, D04 V2P1 Dublin, Ireland
3
School of Physics, Clinical and Optometric Sciences, Technological University Dublin, City Campus, Central Quad, Grangegorman Lower, D07 ADY7 Dublin, Ireland
*
Author to whom correspondence should be addressed.
J. Compos. Sci. 2024, 8(10), 410; https://doi.org/10.3390/jcs8100410
Submission received: 12 August 2024 / Revised: 25 September 2024 / Accepted: 30 September 2024 / Published: 6 October 2024
(This article belongs to the Special Issue Polymer Composites and Fibers, 3rd Edition)

Abstract

:
This study investigates the printability limitations of 3D-printed continuous 316L stainless steel fibre-reinforced polymer composites obtained using the Materials Extrusion (MEX) technique. The objective was to better understand the geometric printing limitations of composites fabricated using continuous steel fibres, based on a combination of bending stiffness testing and piezoresistive property studies. The 0.5 mm composite filaments used in this study were obtained by co-extruding polylactic acid (PLA), with a 316 L stainless steel fibre (SSF) bundle. The composite printability limitations were evaluated by the printing of a series of ’teardrop’ shaped geometries with angles in the range from 5° to 90° and radii between 2 and 20 mm. The morphology and dimensional measurements of the resulting PLA-SSF prints were evaluated using μ CT scanning, optical microscopy, and calliper measurements. Sample sets were compared and statistically examined to evaluate the repeatability, turning ability, and geometrical print limitations, along with dimensional fluctuations between designed and as-printed structures. Comparisons of the curvature bending stiffness were made with the PLA-only polymer and with 3D-printed nylon-reinforced short and long carbon fibre composites. It was demonstrated that the stainless steel composites exhibited an increase in bending stiffness at smaller radii. The change in piezoresistance response of the PLA-SSF with load applied during the curvature bending stiffness testing demonstrated that the 3D-printed composites may have the potential for use as structural health monitoring sensors.

1. Introduction

Stainless steel fibres have been combined with polymer textiles for use in applications ranging from heated automotive seats to personal protective clothing for extremely low-temperature environments [1,2]. Another potential use of steel fibre-reinforced composites is in signal and information transfer, which takes account of their piezoresistivity response to an applied loading, for load sensing, smart impact textiles, and structural health monitoring [3,4]. Three-dimensional printed composite functionality can be adapted depending on their end-use application, i.e., electrical, structural, or impact applications [5]. This study evaluates the geometric printability limitations of 3D-printed continuous stainless steel fibre-reinforced polymer composites, focusing on cornering capabilities and the relationship between the polymer and SSF deposition through smaller angles and radii. An evaluation of individual semi-circle sections were carried out by developing a curvature bending stiffness test. The latter was evaluated in conjunction with the loading resistance response.

1.1. Printing of Continuous Fibre-Reinforced Composites

The most frequently used 3D printing technique for polymers and composites is material extrusion (MEX) [6,7]. Polymer printing involves feeding a thermoplastic polymer filament through a heated extruder nozzle (usually in the range of 150–260 °C) and depositing the material in layers onto the building platform [5]. For many engineering applications, it is necessary to reinforce the 3D-printed polymer with fibres to enhance their mechanical strength [8,9]. The fibre reinforcing of composites can be through the use of either continuous or short fibres [10,11]. Due to the fibre orientation, continuous fibre composites offer higher strength and stiffness than those of discontinuous fibre composites [8]. Amongst the continuous reinforcing fibres reported for use in 3D-printed polymer composites are glass, aramid, flax, jute, Nitinol, carbon, and basalt [9,12,13,14,15]. The thermoplastic polymer matrices most associated include polylactic acid (PLA), Polyamide (PA or nylon), Acrylonitrile butadiene styrene (ABS), polyurethane (PU), polyetheretherketone (PEEK), and Polycarbonate (PC) [4,9,16,17,18].

1.2. Geometric Print Designs

The wider adoption of robotics and multi-axis 3D printers for the fabrication of continuous fibre-reinforced components has led to the generation of more complex tooling paths and internal structures [8,19,20,21,22]. These more complex structural designs encompass a wide range of angles and curves, where more knowledge about how the continuous fibre affects the geometric print constraints (including cornering) is needed [23,24,25,26,27]. The industry demand for lightweight, mechanically strong structures drives research into 3D-printed continuous reinforced composite cores for sandwich structures. These core sandwich structures include truss (free-printing), unit cell combinations, and variations of repeating patterns, which use an array of angles and curves, typically joining top and bottom plates [28]. Knowledge of the material’s stiffness and critical force at different radii inform the structural design [6,20,29].
Geometrical limitations when printing with continuous fibres should be considered during the design phase; however, few studies report the deviation between designed dimensions and as-printed results. Precise fibre deposition in corners is difficult when 3D printing with continuous fibres at small radii circles or arcs. A further consideration is the materials relationship between the matrix and continuous fibre. Acute turning results in fibre migration (stringing), i.e., the movement of fibres out of the design path, which frequently occurs when printing smaller angles or radii, changing the resultant as-printed dimensions. Cornering was evaluated at radii from 2 to 20 mm for 3D printing ABS-continuous carbon fibre (cCF) by Matsuzaki et al. [30]. It was concluded that the cCF bundle size and radius of the turn affects the material deposition at small radii of <4 mm. It was also observed that a larger bundle size restricts deposition.
Three-dimensional printing smaller turns with continuous fibres also affects the exterior perimeter dimensional accuracy. The fabrication of sandwich core structures such as honeycomb, rhombus, rectangles, and circles cores, which combine unit cells consisting of angles or radii, results in the continuous printing paths making multiple turns [31]. Some core designs intend for the material of one cell to join another cell or plate [32,33,34]. Depending on the fibre reinforcement, the minimum turn angle or radius has limitations due to fibre fracture or dimensional restrictions between the design and printed structures [25].
An adopted approach to remove small radii cornering effects is fibre cutting and the use of a dual-head material printing system, such as that developed by Markforged [35]. In MEX, adjusting the print speed during 3D printing helps reduce fibre migration and also improves part strength and surface quality [36,37,38,39]. Yamamoto et al. [25] proposed an algorithm for generating a single-stoke tooling path of continuous carbon fibre MEX 3D printing, without the need for filament cutting between layers. The resultant geometry deviations, however, were found to leave structural gaps in positions where the material should join together, leading to unpredictable mechanical properties and structures.
Individual mechanical testing of continuous fibre components is primarily focused on aligned fibres, employing compression, tensile, or flexural techniques [14]. Several authors reported on the mechanical properties of 3D-printed fibre-reinforced sandwich structures exhibiting different grids or unit cell dimensions [10,28]. Most have tested structures incorporating an array of cells with angles or radii in the core structures printed in the horizontal or vertical plane [20,23,39]. Longer cell lengths, with larger radii turning paths, are associated with increased tensile or compressive properties.
A large radii curve bend test was developed by Zhang et al. [40] for 3D-printed leaf springs of PLA reinforced with continuous flax fibre, fabricated using a five-axis 3D printer. The part had the following dimensions: a 60 mm inner radius, a 15 mm width, a 2 mm height, and an 80 mm test span. The incorporation of the flax fibre was found to increase the stiffness by 115% compared with unreinforced PLA. While these studies evaluated the mechanical properties of 3D-printed sandwich composites, few have reported investigating the mechanical properties of individual arcs or cylinder sections at smaller radii.

1.3. Electrical Resistance

The incorporation of continuous conductive fibres into a composite has introduced the potential for their use as embedded sensors for structural health monitoring (SHM) [41,42]. Amongst the conductive filaments that can be used with these composites are copper, nickel–chromium, and carbon fibre [26,27,43].
Mechanical performance testing combined with piezoresistive responses can evaluate the correlation between resistance and load, strain, or tension. An example of a 3D-printed PLA-cCF SHM sensor was integrated into a composite finger studied by Yao et al. [24]. The authors reported that, during cyclical flexural testing, there was an increase in the fractional resistance as the strain fluctuations increased. A study on the tensile and piezoresistive properties of MEX 3D-printed copper wire-reinforced PLA and polyurethane (PU) for in-situ SHM sensing by Saleh et al. [4] concluded that correlations of the electrical resistance and mechanical strain of the embedded wire has no significant impact on the matrix material.
Partial fibre failure increased resistance peaks during cyclical dynamic and static testing of 3D-printed cCF cantilever beams due to fibre failure [27]. The fibre alignment of 3D-printed composites is directionally unrestricted, allowing the integration of individual or multi-layer sensors with the structure in various orientations. Galos et al. [44] investigated the electrical conductivity of cCF-nylon fabricated by MEX 3D printing, which oriented the filaments and laminate structures in various directions. A factor influencing a reduction in conductive performance was damage to the cCF at the exit of the print nozzle, which resulted in a 40% loss in longitudinal resistance.
The study reported in this paper evaluated the printability limitations of 3D-printed continuous 316 L stainless steel fibre-reinforced polymer composites based on a comparison between the design geometry and the properties of the printed parts. By identifying geometric 3D printing characteristics between the design and as-printed PLA-SSF parts, issues such as fibre migration and gaps can be addressed to define the appropriate dimensions.Many structures are mechanically tested in their complete form, but few studies evaluate individual struts or curvatures of continuous fibre-reinforced composites. This work also proposes a methodology to evaluate the mechanical properties of curvatures by loading sectioned cylinders to failure during curvature bending stiffness testing (CBS). Given the uses of conductive stainless steel fibres, piezoresistivity was investigated during CBS.

2. Theory and Calculation

The continuous fibres used in this study consisted of a 316 L stainless steel bundle, containing 90 fibres. These fibres were obtained from NV Bekaert SA (Zwevegem, Belgium), who fabricated them by ‘bundle wire drawing’ [45,46]. Each fibre had a diameter of 14 μm, a torsion per cm of 1, a linear density of 110 decitex (TEX), an overall bundle diameter of approx. 0.15 mm, and a breaking load of 20 N. Pellets of PLA were sourced from Nature Works, commercially called IngeoTM Biopolymer D4043D [47]. Other polymers and composites investigated for CBS testing included Markforged Onyx (Nylon—short carbon fibre) and Onyx reinforced with continuous carbon fibre (Onyx-cCF), obtained from Markforged [35]. These were printed using the conditions described in Section 2.2.
A 3devo laboratory-scale filament maker was used to fabricate both PLA and PLA-SSF filaments [48]. This was facilitated through the use of a custom-designed extrusion nozzle that incorporates the SSFs into the polymer at extrusion, as described previously [16]. The processing parameters for the PLA-SSF filaments, with a diameter of 0.5 mm (±0.6), are outlined in Table 1.

2.1. PLA-SSF Filament Fabrication and 3D Printing

‘Teardrop’ shapes were printed to evaluate the PLA-SSF materials deposition while cornering during MEX 3D printing. These typologies combine an angle, straight sections, and semi-circles, as shown in Figure 1. The angles investigated were 5°, 10°, 15°, 30°, 50°, 70°, and 90°, which were joined to straight sections that connected to semi-circles with inner radii of 2, 3, 4, 5, 10, 15, and 20 mm.
A mechanical test to determine the curvature bending stiffness (CBS) of the PLA-SSF composite used the same dimensions as the radii of the semi-circles teardrop sections. Oval cylinders were printed for sectioning with inner radii from 3 to 20 mm. The resistance response of the PLA-SSF composite was measured during CBS testing as the load deformed short sectioned cylinders.
In addition to the stainless steel composites, other materials were printed for comparison in the CBS study. These were neat PLA and nylon–short carbon fibre (Markforged, Onex), with the same geometric dimensions as the PLA-SSF semi-circles and Nylon with short and continuous carbon fibre (Markforged, Onex-cCF), with radii of 5, 10, 15, and 20 mm.

2.2. Three-Dimensional Printing Teardrop and Curvature Stiffness Samples

The polymer-SSF filaments were used to 3D print both teardrop and oval cylinder geometries designed using a computer-aided design (CAD) file (Solidworks 2021 software, version SP03, Dassault Systèmes SOLIDWORKS Corporation, Waltham, MA, USA) and then exported as a stereolithography (STL) file. The PLA and PLA-SSF material 3D printing g-code was generated using PrusaSlicer, an open-source slicing software. Anycubic i3 Mega polymer extrusion 3D printers facilitated the deposition of the PLA and, with modifications, the continuous PLA-SSF filament. These modifications included a printing nozzle designed to remove excess polymer during printing, an increased nozzle area on the lower face surface to increase the dwell time, and a soft wheel filament feeder [16].
The following 3D printing parameters were maintained at constant values during printing: the print head temperature of 220 °C, the print bed temperature of 65 °C, a layer height (h) of 0.22 mm, and a hatch spacing (w) of 0.4 mm. The printing speed was adjusted to address the requirements of varying angles and radii, as detailed in Table 2. Note the reduction in printing speed as the radii and angles decreased. A slower speed increases the nozzle’s dwell time at a given location, allowing partial polymer solidification, thus reducing stringing. Polymer solidification helps retain the continuous SSF bundle in the structure, as the print head traverses the X-Y plane. The curvature test samples were oval cylinder designs to facilitate a continuous fibre toolpath and the same print speeds for the respective teardrop radii were adopted. All teardrop printing toolpaths were in an anticlockwise direction, starting at the corner of the angle.
PLA filaments with a diameter of 1.75 mm were also fabricated using the 3devo system; these were then used in an Anycubic printer to print parts. As outlined earlier, this investigation included comparison studies with Onyx and Onyx-cCF, printed using the Markforged Mark Two 3D printer [35]. The Onyx-cCF print study was limited to radii above 5 mm and a wall width above 2.8 mm, due to the printing limitations imposed by the Markforged slicing software version 3.170.0, Eiger version 3.19.46 (Markforged, Billerica, MA, USA). Hence, all Onyx and Onyx-cCF oval cylinders were designed with a wall width of 3 mm, replicating the PLA-SSF as-printed cylinders’ average wall width of 3.2 mm ( ± 0.3 ). The Onyx-cCF pattern is concentric, with a 0.125 mm layer height, a hatch packing of 0.25 mm, and a printing head temperature of 285 °C. Both the PLA and Onyx were printed in a concentric pattern. Based on the author’s previous study using the sample printing parameters, the typical volume fraction ( V f ) was 30% V f and a porosity of 2% for the PLA-SSF composites was used [16].

2.3. Characterisation and Geometry Analysis

The as-printed PLA-SSF teardrop composite dimensions, printed structure, and morphology were recorded and compared with the design dimensions. The seven PLA-SSF teardrop geometries printed contain a minimum of three structures. The as-printed teardrop samples were examined using a GE Nanotom X-ray micro-computed tomography ( μ CT) scanner (GE Sensing & Inspection Technologies GmbH, Wunstorf, Germany), with an 8 μm resolution. The μ CT scans of the teardrops were evaluated using the VG Studios software, version 3.5, (Volume Graphics GmbH, Heidelberg, Germany) The specimens’ dimensions were also recorded using digital vernier callipers (Digi Plus Line), an Olympus DSX1000 microscope (LECO Corporation, Tokyo, Japan), and a Dinolite AM7915MZT USB 2.0 microscope, combined with a lighting box.
Geometry differences between the as-printed teardrop parts and the CAD design dimensions were investigated. Figure 2 illustrates an example of the measurement locations around the teardrop geometry, with an angle of 70° and an inner radius of 15 mm. A particular focus was the structure in the semi-circle and the angle areas. All designs had a wall height of 4 mm and wall width of 1.2 mm (Figure 2a). Table 3 and Figure 2c detail the design dimensions and locations of each teardrop. In the angle area, the relationship between the polymer and SSF deposited was explored, relating to the length of the expected material at the corner of the angle (C_length), the overall internal length (L_inner), and outer radii (R_outer). All measurements were recorded at the base (B) and top (T) surfaces relative to the print bed. The statistical analysis of the measured dimensional data was executed using the SPSS software version 28 [49].

2.4. Testing Methods: Curvature Bending Testing

When a force is applied to a structure, the curved bending stiffness (CBS), or k (N/mm), is the ability of the material to resist elastic deformation. A test methodology was devised to determine the curvature bend stiffness (CBS) and the electrical resistance response of the stainless steel composites as force was applied. The CBS testing approach involved the further development of the methodology described by Zhang et al. [40], whereby the testing apparatus was redesigned to facilitate testing semi-circular composites with inner radii from 3 to 20 mm, as opposed to the 60 mm radius used by Zhang et al. The span for the CBS testing was equal to the inner radii due to the small radii, rather than shorter than the sample length.
A minimum of 5 semi-circular specimens were tested for each radius evaluated in all materials (PLA, PLA-SSF, Onyx, and Onyx-cCF). The semi-circular test samples were cut, using a fine-hacksaw blade, from the 3D-printed cylinders. The cut surface was ground down, using a water-cooled grinding wheel with silicon carbide grinding paper from 120 grit down to 1200 to achieve optimal contact with the test bed.
A testing jig was designed and fabricated to hold the semi-circle samples vertically as a force was applied, as shown schematically in Figure 3b. This jig consisted of two aluminium blocks with milled channels; three-dimensional printed PETG insulating sleeves were inserted in the channels separating two copper blocks to support the sample on each side of the curve. Two testing jigs were designed: one for larger radii (>5 mm) and the other for smaller radii samples (<5 mm). The large jig had two supporting walls and the smaller jig’s the inner walls were removed to prevent sample surface interference.
The CBS jig was then mounted onto a Zwick Rolle testing machine with a 15 mm radius PLA-SSF sample, as shown in the photograph of the test equipment in Figure 3c. Each sample was loaded into the appropriate design jigs and a compressive load was applied at testing at a speed of 1 mm/s. The end testing protocol was determined when the force decreased by 30% or when the maximum set travel was reached (the cross-sectional height of the sample). The curved bending stiffness k (N/mm) was calculated using Equation (1) [40]. CBS testing was carried out on the stainless steel composites, including neat PLA, Onex, and Onyx with continuous carbon fibre composites.
k = F δ ,
where F denotes the force load applied to the sample (N) and δ is the deformation (mm) due to the force.

2.5. Resistance Response

Using the same CBS testing jig, the resistance response of the PLA-SSF was examined. The test schematic is illustrated in Figure 3b. A Keysight E4980AL Precision Inductance, Capacitance, and Resistance (KS-LCR) meter was used in conjunction with the Keysite BenchVue Software, version 2.5.0.18, (Keysite, Tipperary, Ireland) to record changes in resistance ( Ω ) response during CBS testing for sample sets with radii of 4, 10, and 15 mm. The KS-LCR meter default measurement was a frequency of 1 kHz. The KS-LCR meter was calibrated using resistors of known values from 0.1 to 62 Ω , with a tolerance between 1 and 5%. The measurements were compared with readings of the same resistors and a verification measurement was obtained using a Wayne Kerr Automatic LCR meter 4225. The calibration curve is available in the Supplementary Materials.
To gain an insight into the piezoresistive response of the PLA-SSF filament, a single 100 mm long PLA-SSF filament was attached to a plastic glove, as shown in Figure 3a. While wearing the glove, the KS-LCR meter was attached to either end of the SSF, and the resistance change was monitored between placing the glove finger flat and bent. A resistance of approximately 6.65 Ω and 7.25 Ω was recorded moving between straight or bent configurations, respectively.The results in Figure 3a demonstrate the reduction in resistance while the fibres were straight and its increase on bending the fibres.
The resistance response determination was based on a modified version of ASTM D4496-21 [50]. This involved connecting the steel fibre in the PLA-SSF semi-circle composite and KS-LCR meter. The semi-circle’s cross-sectional contact faces with the testing jig were ground with abrasive silica paper to 2000 grit, and then polished with a 3 μm diamond suspension, exposing the SSFs.
To accommodate the movement of the samples during testing, the KS-LCR gold crocodile clips were connected to a pair of copper strips and then seated into each copper supporting block (Figure 3c). An electrically conductive silver paste was added to each side of the semi-circle between the polished face and the copper strips. No significant difference in the fibre resistance values was obtained for this copper strips/silver paste connection arrangement when a comparison experiment was conducted using a 30 mm fibre bundle length, with crocodile clips, which were directly in contact with the steel. Given that the SSFs were coated using a polymer, they could be treated as insulated wires. The resulting structure could thus be considered as a compilation of individual fibres in a parallel circuit, for which the total resistance ( R t ) could be calculated using Equation (2).
1 R t = 1 R 1 + 1 R 2 + + 1 R n
where R t is the total resistance of the circuit, and R 1 to R n are the individual resistances of each SSF. The SSF bundles were electrically conductive with a reported resistance per meter of 65 Ω /m, with each curvature containing 72 fibre bundles.
The resistance and time were recorded by the KS-LCR meter and exported as Excel-readable CSV files. Using Matlab 2020b, the results were analysed and plotted alongside the force against time from the CBS testing. Resistance against time and force against time were compared and interpolated.

3. Results

The objective of this study was to evaluate the performance and geometry limitations of 3D-printed continuous fibre-reinforced polymer-SSF components. Figure 4a shows the 3D-printed teardrop shapes, with angles ranging from 5° to 90° and radii from 2 to 20 mm, as detailed in Section 2.2. A comparison is made between the design geometry and the dimensions of the printed parts. We also evaluated the curvature bending stiffness of the semi-circles from the sectioned oval cylinder samples and the resistance resonance as force was applied, (Figure 4b).

3.1. Three-Dimensional Print Teardrop Geometry Repeatability

The accuracy of the printed ‘Teardrop’ geometry was assessed based on the print wall height, width, radius, angles, and polymer-SSF materials relationship, at nine measurement positions for each print.

3.1.1. Wall Width

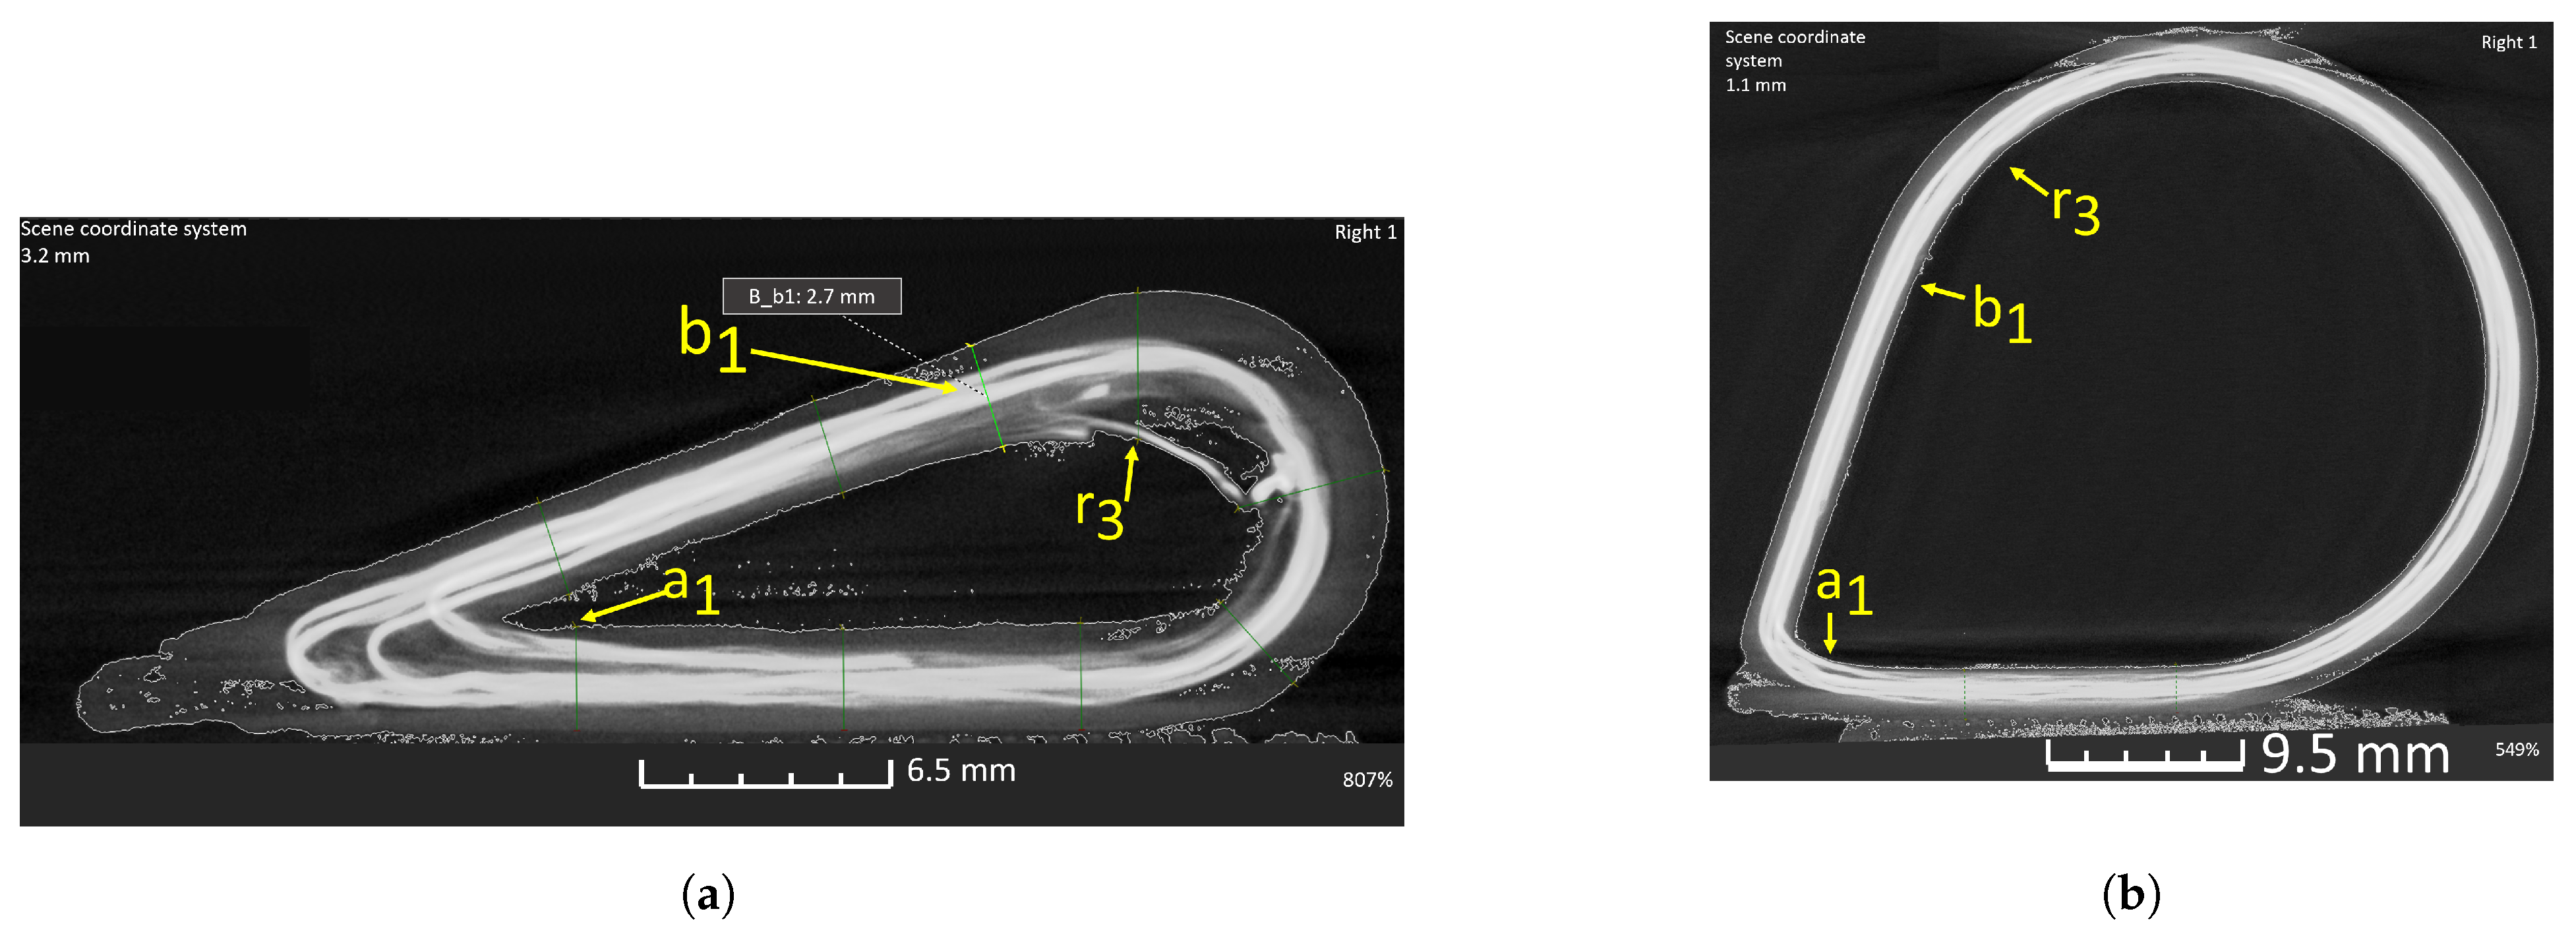
The average as-printed wall width in the straight section was 2.6 mm ( ± 0.9 ), from b1 to b3 as described in Section 2.3, which was larger than the 1.2 mm designed wall width. The dimension difference results from the polymer-SSF filament volume were greater than the deposition volume. While some polymer was removed during printing through the print nozzle pressure vent, at the lower layer heights, excess polymer was also deposited on the outer surface of the part, thus increasing the wall thickness [16]. The remaining polymer created a section of unreinforced PLA around the outer edges of the teardrops. The CT scan images shown in Figure 5 were obtained for the composites printed with angles of 20° (a radius of 4 mm) and 70° (a radius of 15 mm). Both structures exhibited regions with unreinforced polymer (grey colour) around the inner and outer edges of the print, as just described, and the steel fibre-reinforced region (white colour).
The wall width was found to increase as the teardrop angle decreased. This was illustrated by comparing the a1 position thickness measurements for the teardrop of 20° (a radius of 4 mm) compared with the teardrop of 70° (a radius of 15 mm), as shown in Figure 5b. A similar observation was found at the top of the semi-circle (positions r3 and b1). The width dimensions were found to increase at the end of a turn due to fibre migration during more acute cornering.

3.1.2. Angle and Apex

A comparison was made between the design angle from the CAD drawing with the as-printed measured angle for each teardrop geometry. All angles acquired from the straight section of the as-printed teardrops (between a 1 a 3 and b 1 b 3 in Figure 2) statistically satisfied the design requirement. However, at the angle’s corner or apex, the deposited polymer or SSF failed to meet the designed apex points (Figure 6). The polymer migrated away from the external design position due to a strong bond between the matrix and fibres. This bond meant that as the fibre migrated, the polymer matrix also migrated, leaving an area with no deposited material, which diminished the external design dimension. This distortion was present at all angles, with an increased level of variation obtained for more acute toolpath cornering, particularly below 5°. Measurements were obtained between the outer apex to the PLA, the outer apex to the SSF outside, and the inner apex to the inner material, as described in Section 2.3.
Figure 6a,b help to compare the level of deviation observed for teardrop prints with angles of 20° and 70°, respectively. During cornering, the continuous SSF exhibited a curved shape, as opposed to the angular design angle specified. This curvature likely resulted from fibre migration due to the print head moving out of a linear toolpath. During turning, its rate of travel was faster than the rate of polymer solidification, which did not hold the SSF in its deposited position. The amount of fibre migration was reduced by decreasing the print speed for more acute toolpath cornering, as indicated in Section 2.2.
The difference between the design position of the outer and inner apex and the deposited polymer or SSF for all geometries is depicted in Figure 6c. The variation observed during cornering is a characteristic of 3D printing continuous fibre composites, as highlighted previously by Cheng et al. [51].

3.1.3. Semi-Circle Cornering

The accuracy of the semi-circle section of the teardrop composites is reviewed in this section. At radii of 5 mm and lower, it was observed that the fibre migration at the end of the turn increased; see measurement position r 3 and b 1 as described in Section 2.3. This change in the wall width at smaller radii is demonstrated in Figure 7a for a 4 mm radius and Figure 7b for a 15 mm radius. As the design radii reduced from 5 to 2 mm, the fibre migration initiated closer to the start of the cornering toolpath. The semi-circular section average wall width for all radii is plotted in Figure 7c. The increased wall width and data spread significantly increased for radii below 5 mm.
An examination of teardrop composites for all geometries with an inner radius above 4 mm demonstrated that the SSF was located at the position as defined using the CAD design. However, in all cases, a perimeter of unreinforced PLA was located on the outer surface of the composite as illustrated in Figure 7, and as previously described in Section 2.3. The average as-printed dimensions for the 20 mm radius resulted in an inner and outer radius of 14.2 mm (−0.8 mm) and 17.0 mm (+0.8 mm). The steel fibres were located in the positions specified during the printing set-up, with the outer fibre perimeters equivalent to the 16.2 mm design radii. In comparison, for the teardrop with a designed inner radius of 4 mm and outer radii of 5.2 mm, shown in Figure 7a, the deposited SSF outer radius was smaller at 4.9 mm (−0.3 mm). For the resulting as-printed average inner and outer radius of 2.8 mm (−1.3 mm), an outer as-printed radius of 6.0 mm (+0.8 mm) was achieved. All SSF inner radii deposition dimensions were below the design dimensions, as outlined in Table 4.

3.1.4. Height

A statistical analysis was carried out using the Wilcoxon signed-rank test [49]. It demonstrated that in the case of the wall heights, the measured dimensions of all as-printed geometries yielded no significant difference from the design height of 4 mm. A comparison between the callipers and the CT scan techniques used to measure these heights yielded a probability (p-value) of less than 0.05, indicating that the measurements using these two approaches were statistically similar.

3.1.5. Deposition Effects

Figure 8 helps to illustrate the differences between the design and as-printed structures in the angle and semi-circular sections. Each dimension was measured at the bottom (B) and top (T) of the print to evaluate any significant variations in the geometry during layer deposition of the material. The Wilcoxon test indicated no significant difference between the dimensions of the bottom and top layers.
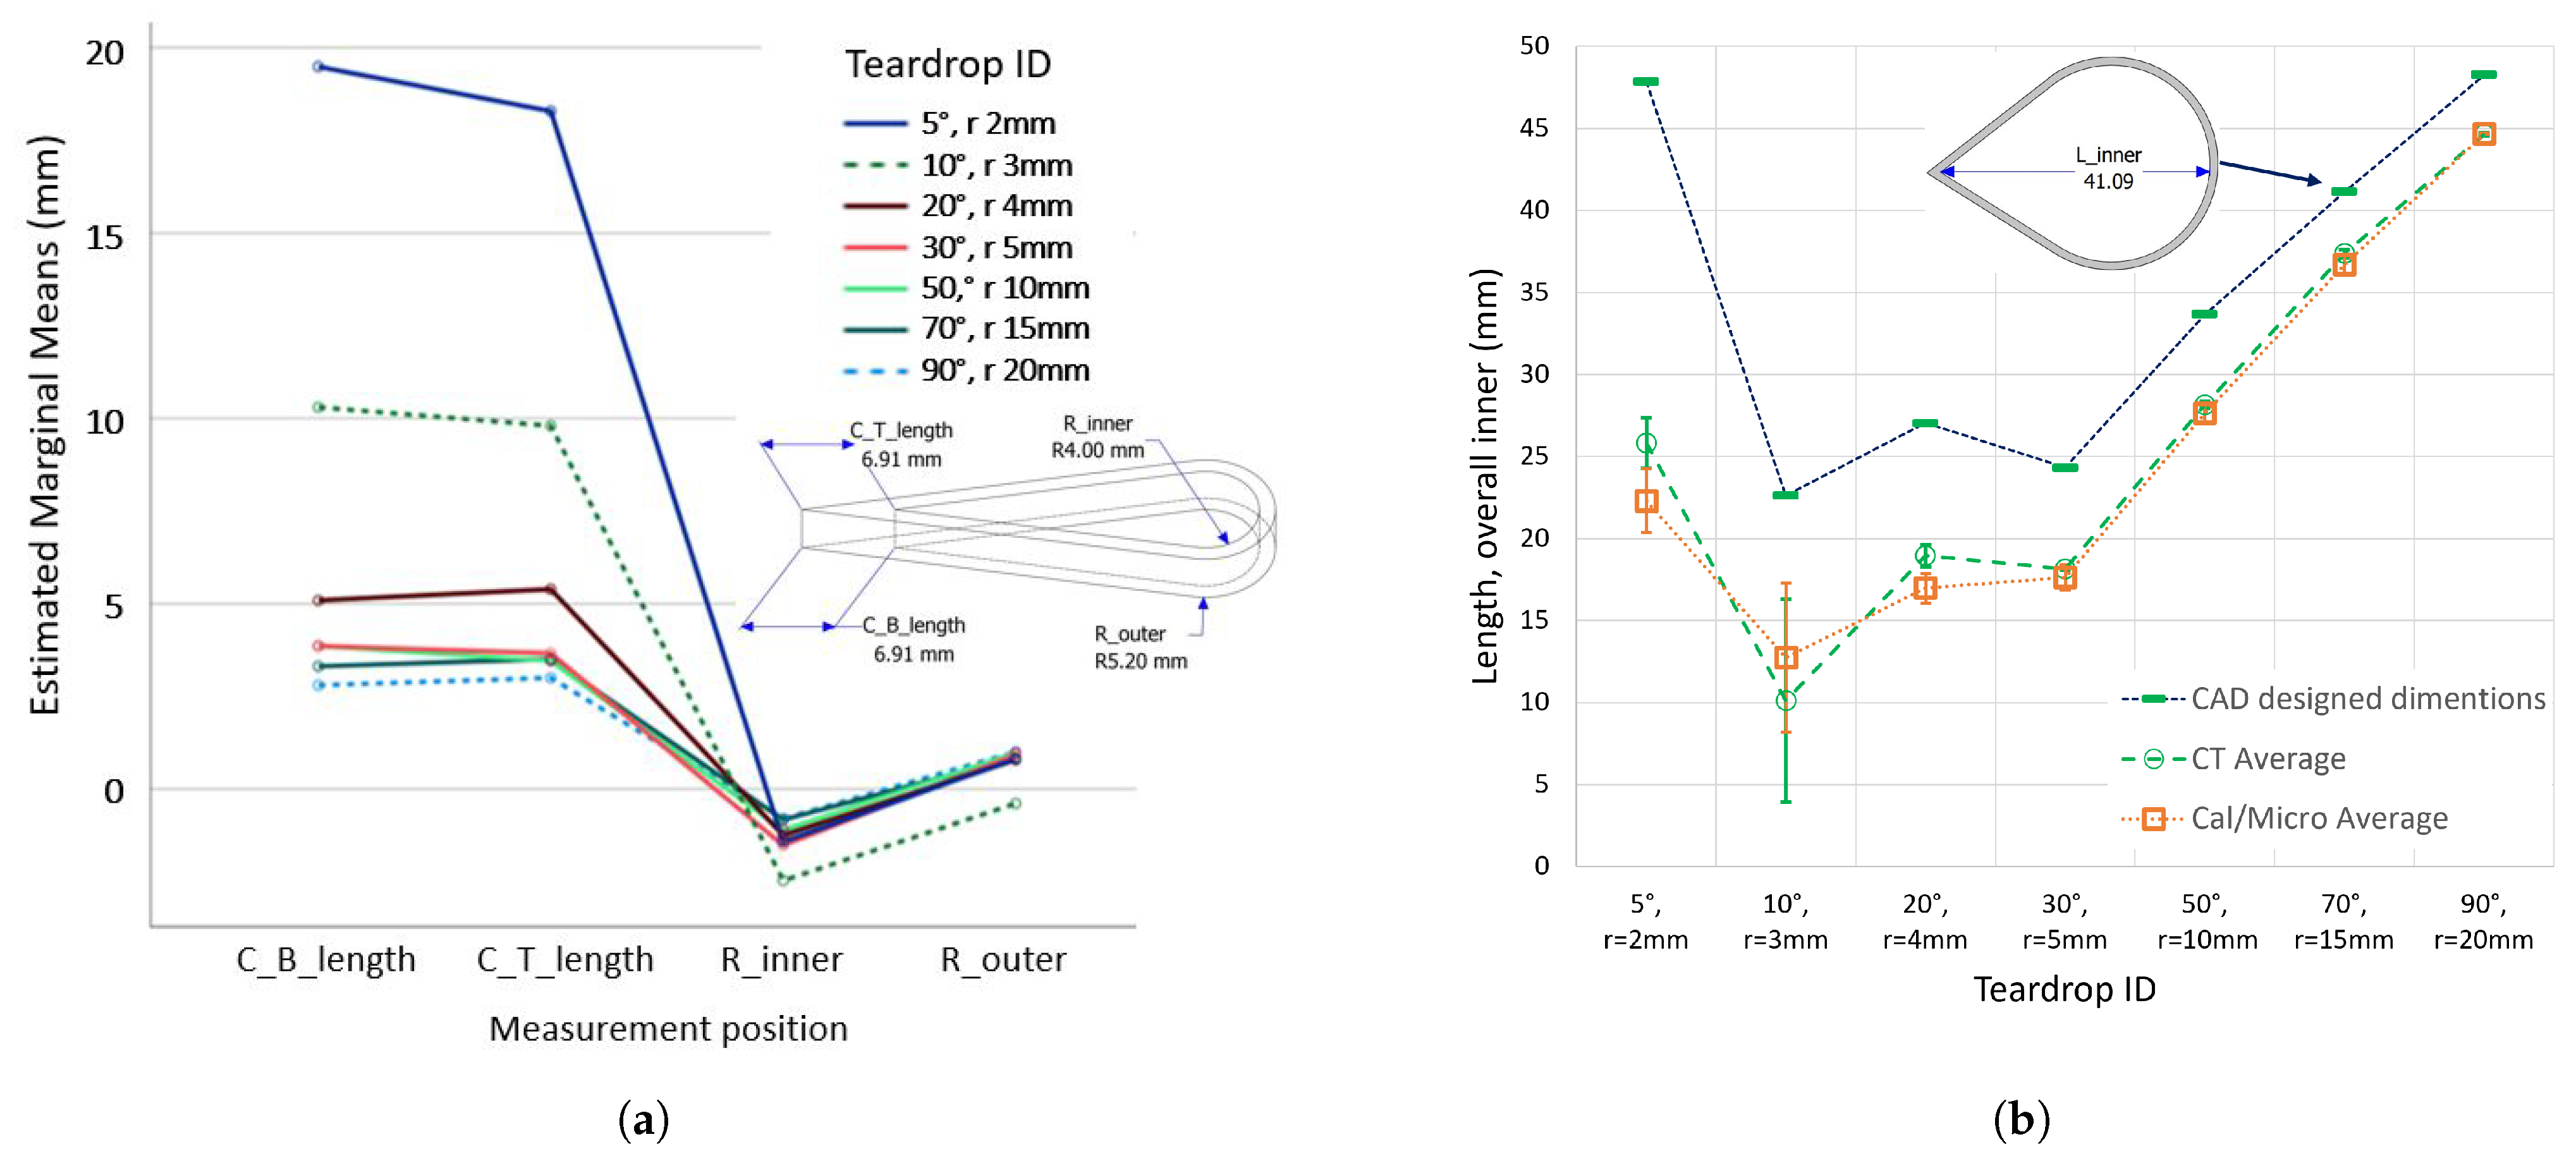
While the measurements on the top and bottom were broadly similar, the variations in the length of material deposited at the angle’s corner or apex varied. The composite length was measured between the outer and inner corner apex again for the base and top, denoted by C_B_length and C_T_length, respectively, as outlined in Figure 2. A plot of estimated marginal means vs. measurement positions in Figure 8a for the seven teardrop shapes. In this figure, the zero on the Y axis indicates no difference between the measured values and the CAD target measurement. For both C_B_length and C_T_length, differences existed between the measured values and CAD design measurements. There was no significant difference between the printed base and top measurements as they had the same overshot. As expected from the results detailed earlier, the variation increased at more acute angles or tighter cornering. However, the difference was very small for the geometry “90°, r = 20 mm” and significant for the geometry “5°, r = 2 mm”.
The inner and outer radius of the semi-circle (R_inner and R_outer) were found to exhibit no significant differences between the experimentally measured and the CAD set points. Figure 8b plots the design dimensions for each teardrop geometry and the resulting as-printed dimensions. As the angles and radii decreased, the geometry differences between the printed structure and the CAD design specifications increased.
Table 4 provides details on the average weight of the printed teardrops with varying angles/radii. All the test samples were printed with 18 filament layers, four concentric paths, and 72 SSF bundles. Despite variances in angle and radius, fabricated teardrop samples with angles and radii greater than 30° and 5 mm yielded as-printed parts with dimensions close to the design geometry. The accuracy of the prints decreased, however, as the acuteness of the turn increased. A potential route to address the unreinforced polymer observed in cornering regions would be to alter either the tooling path or the part design to minimise the offset distance issue observed in this study.

3.2. Curved Bending Test and Resistance Response

To gain an insight into the as-printed structures, the print radii test samples investigated in the geometry study were mechanically tested, while the conducive SSF resistance response was recorded during loading.

3.2.1. Curved Bending Test

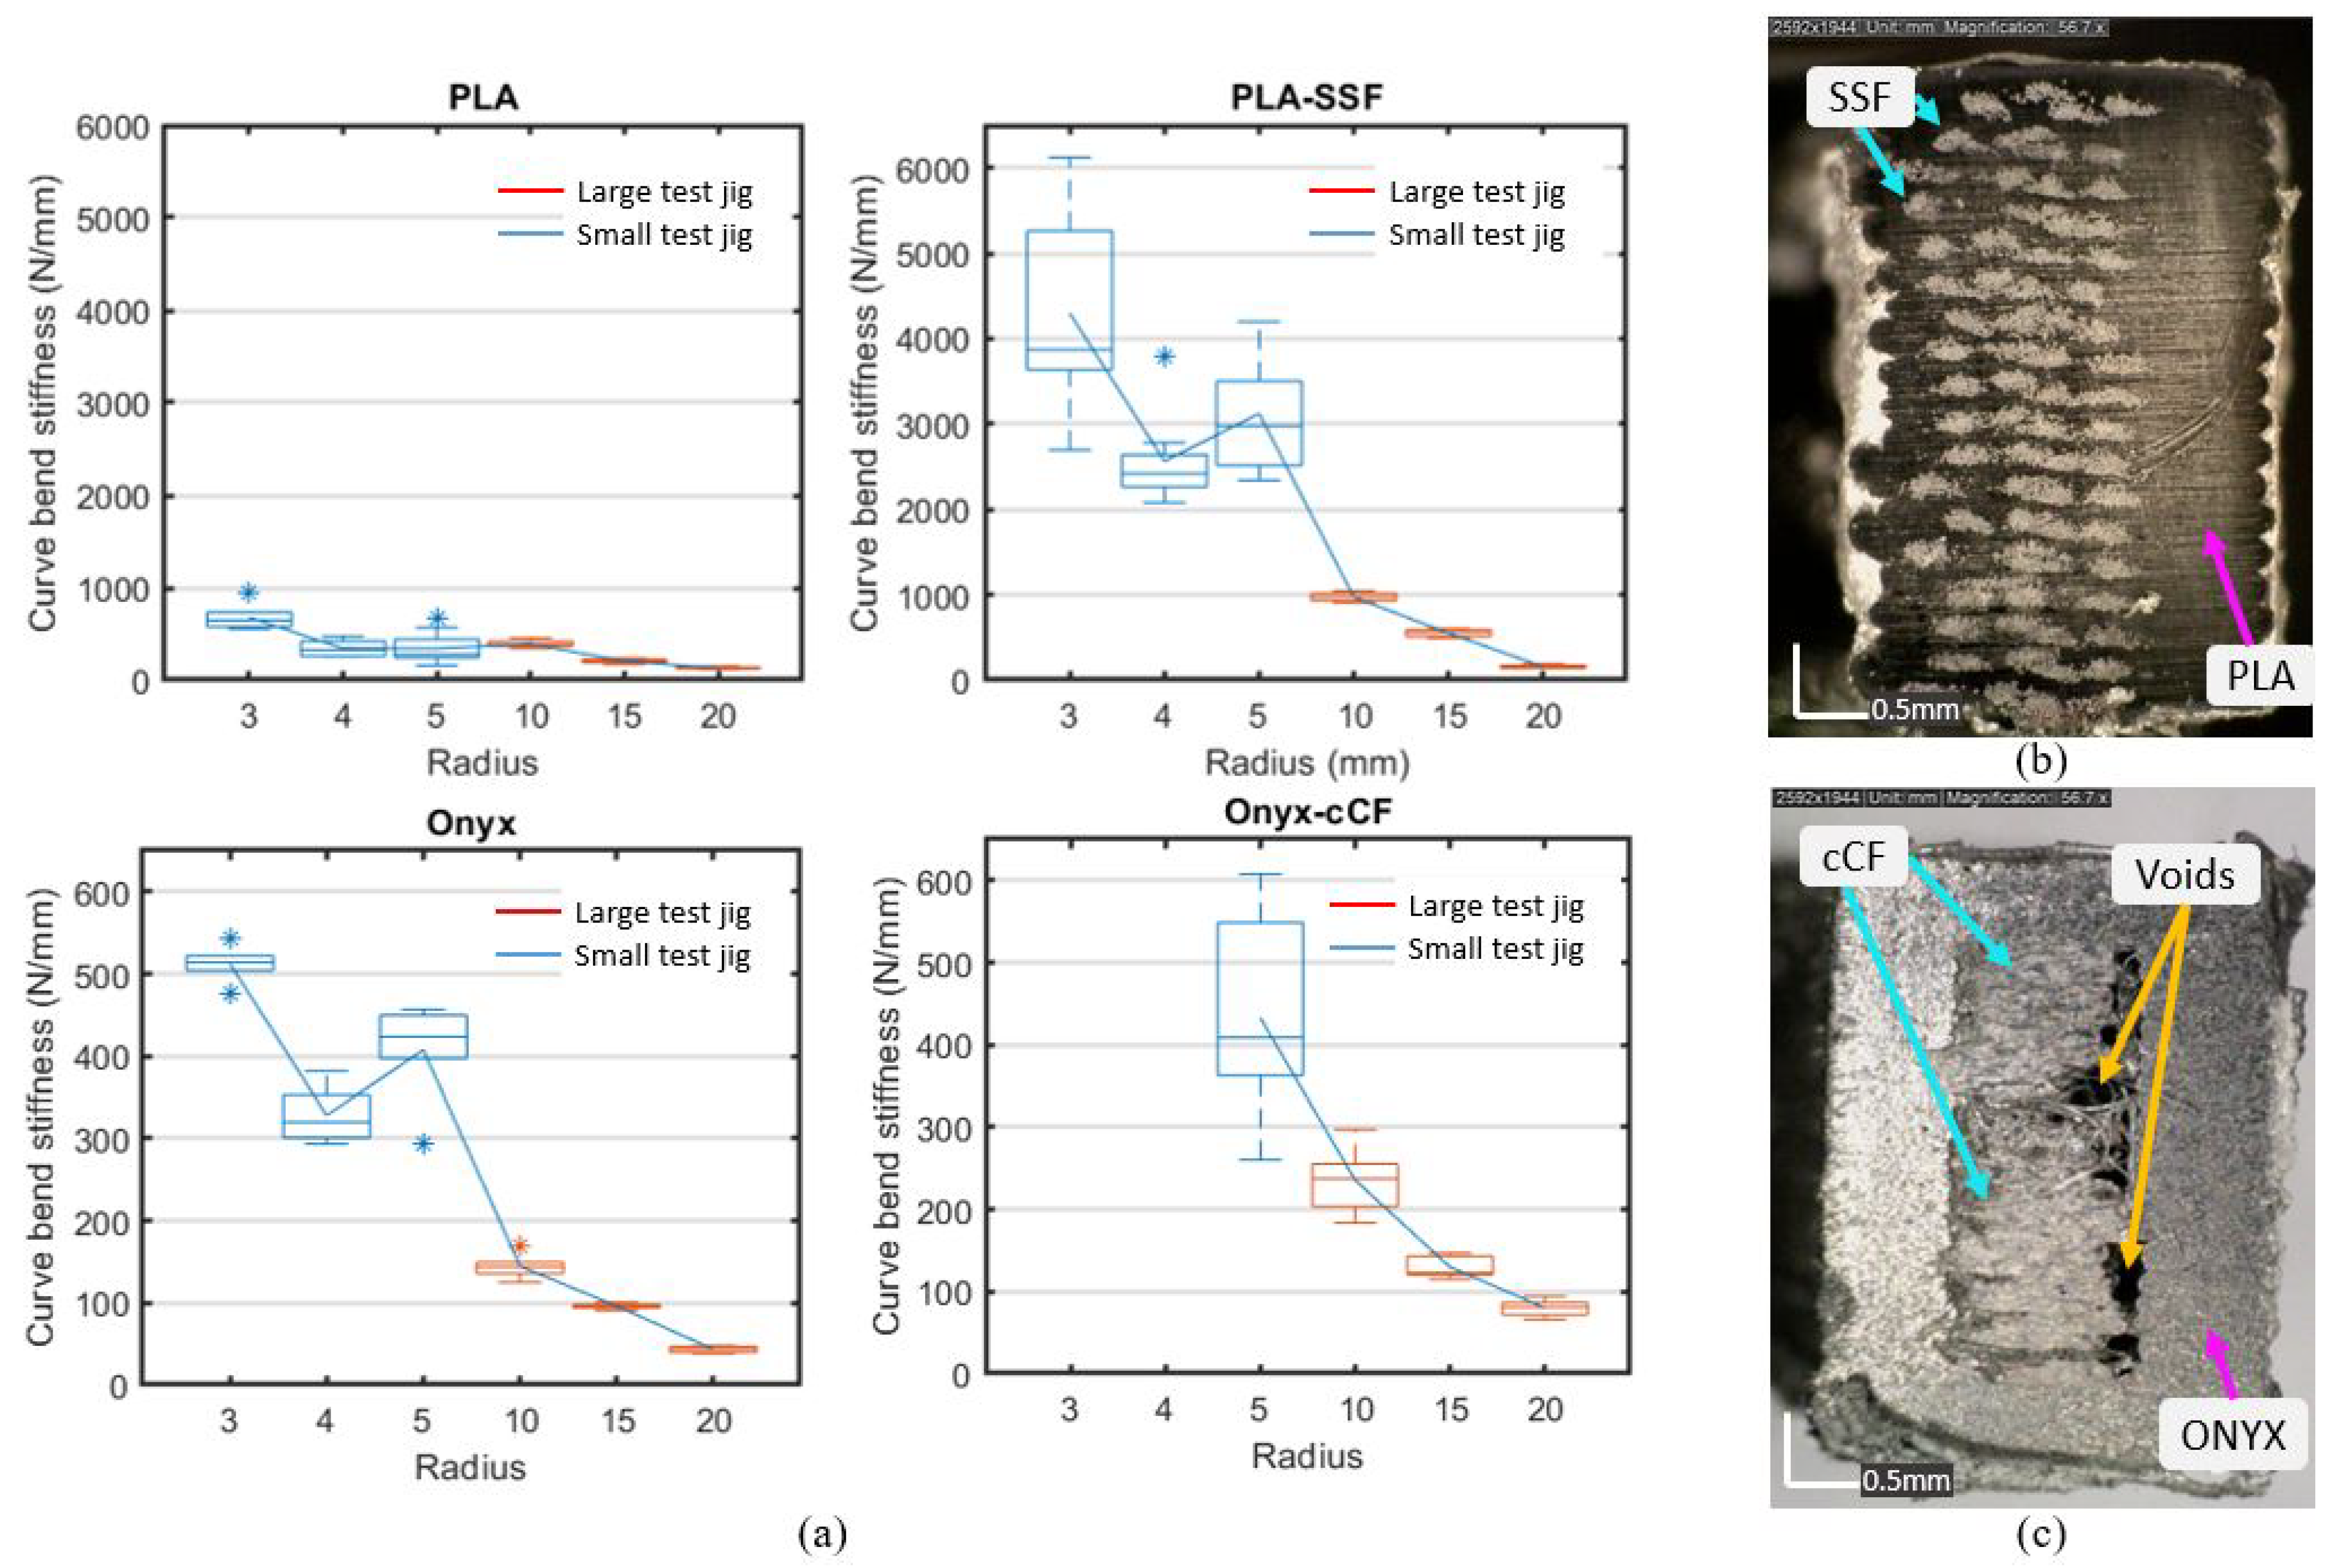
The curve bend stiffness evaluation was carried out for PLA-SSF, PLA only, and with Nylon composites with short carbon fibres (Onyx), and short and continuous carbon fibres (Onyx-cCF), as detailed in Figure 9. As the radii of the test parts decreased, there was a broadly linear trend in the CBS for the range between 10 and 20 mm for the inner radii (for the larger test rig, as detailed in Section 2.4) and for 3 to 5 mm (the small test rig).
There are a number of potential explanations for the large CBS values obtained for the PLA-SSF as detailed in Figure 9 with lower CBS values for Onyx-cCF. A combination of both the material and composite structure issues along with printing techniques likely influenced the composite stiffness results. An examination of the as-printed cross-section microscope images of the PLA-SSF shown in Figure 9b with the Onyx-cCF shown in Figure 9c, it is clear that the continuous SSF reinforcing fibres were present at the top and bottom layers of the PLA-SSF. While the cCFs were present only in the middle of the Onyx-cCF composite. During the fabrication of the PLA-SSF composite, each line of deposited material simultaneously contained the matrix polymer and contentious fibre reinforcement. In contrast, the Onyx-cCF structure materials were deposited independently and only one line of CF was added per layer in the middle of the cross section. Another observation in Figure 9c of the Onyx and CCF was a void region on each side of the CCFs with no bonding between them. This void allowed the Onyx and CCFs to shear independently of each other and could contribute to the lack of fracture in the structure.
The first failure mode for all PLA and PLA-SSF samples was a tensile fracture, observed for most of the test samples at the loading contact point. For samples with radii below 4 mm, there was a second crushing action observed, creating an elevated maximum force over the displacement. All PLA samples failed by tensile fracture, while none of the Onyx samples fractured, but their shape was permanently deformed. A similar result was found from short beam testing by Caminero et al. [52].

3.2.2. Resistance Responses

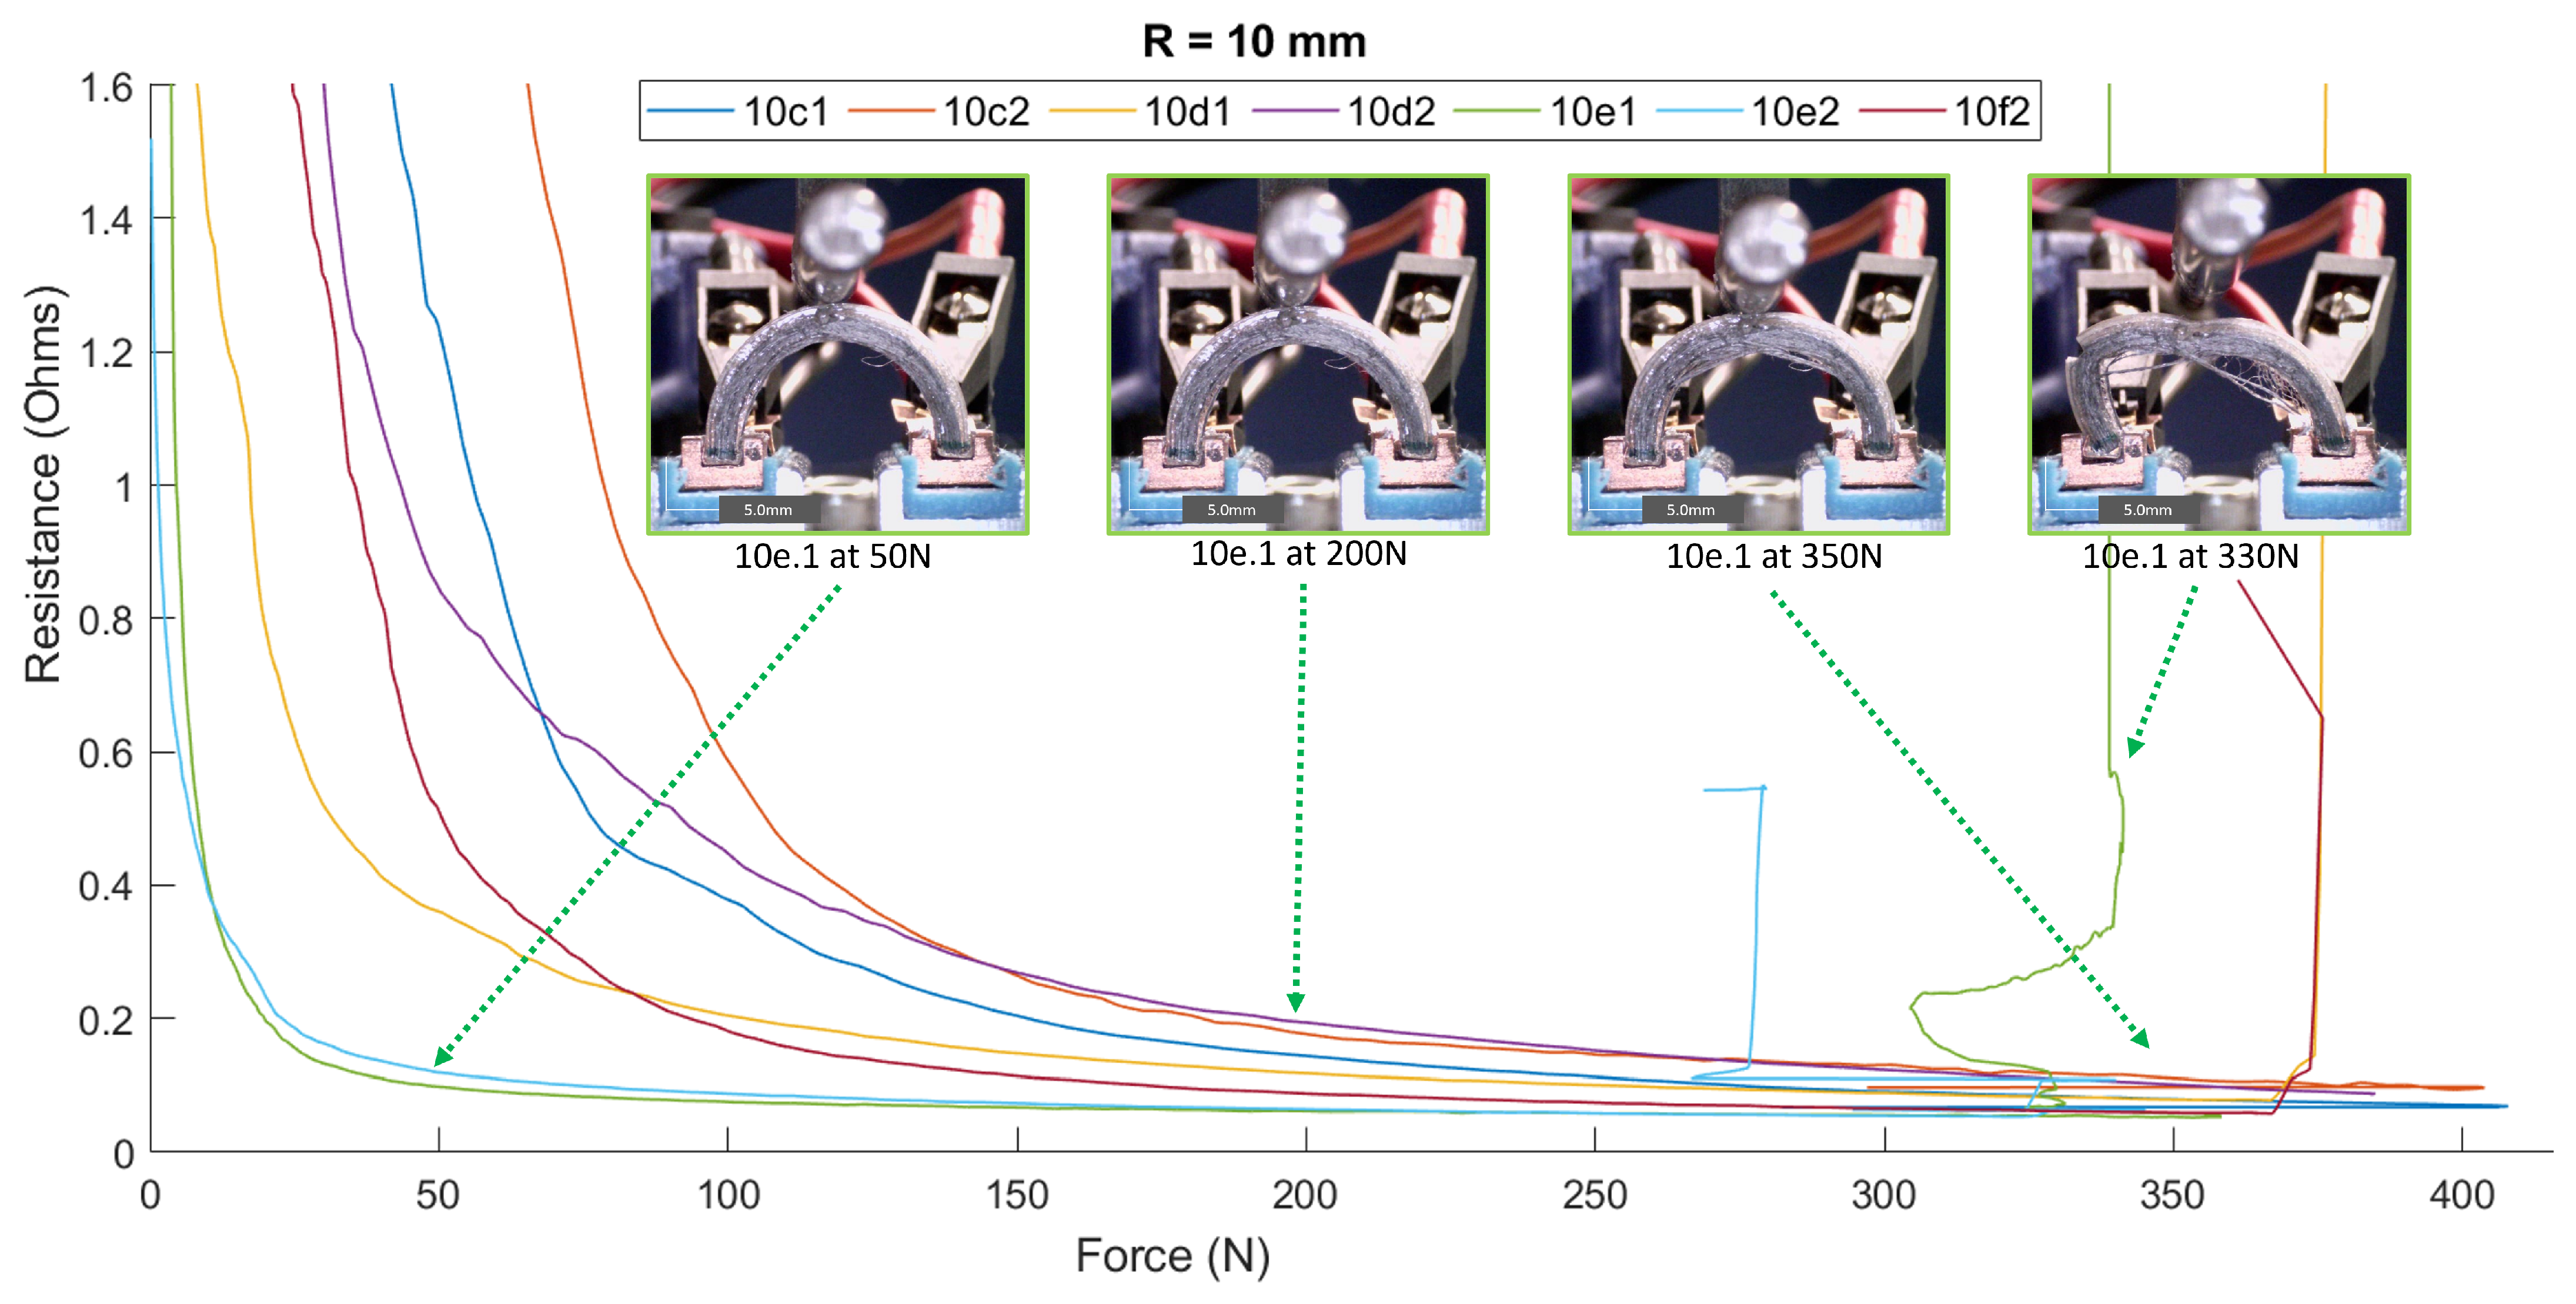
During the curve bend testing, the conducive SSF resistance response was also recorded during loading. The plot of resistance against the applied force for the 10 mm radius sample set in Figure 10 demonstrates the decrease in resistance as loading was increased. Also, Figure 10 contains four photographs showing the effect of loading on the CBS sample 10e.1, at forces of 50, 200, 350 (first fracture), and 325 N (catastrophic failure). It was found that both the 5 and 15 mm sample sets followed a similar pattern, with a decrease in resistance as loading increased, as described by other authors [53]. For test samples where significant breakage of the conductive steel fibres occurred, there was an associated increase in the resistance (tending to infinity). Where complete failure occurred, the resistance R t was zero; thus, in this situation, the resistance approaches infinity.
The MEX 3D printing process adopted caused minimum damage to individual stainless steel fibres in the bundle. A comparison of the resistance measurements between raw SSF, the PLA-SSF filament, and a single 3D-printed deposited line of the composite resulted in a similar resistance of 8.9 Ω for a 120 mm length of SSF. The results show there was a low level of resistance fluctuation during testing until, approaching failure. The piezoresistivity of the SSF indicated the relative absence of fibre damage in longitudinal resistance associated with damage to the cCFs, as detailed in Section 1.3.
The resistance measurement at a set loading can vary. Several reasons may account for this, including sample stiffness, preparation methods, internal fibre connections, and movement of the connecting pads during testing. In the future, a potential application of the 3D-printed polymer SSFs is in the fabrication of embedded strain gauges due to the piezoresistance response of the composite to loading. Initially, each sensor would need to be individually calibrated as the material properties can be unique to the components, such as changes in the deposition of the fibres, the density, and fibre alignment during the manufacturing process. Polymer-SSF filaments can be 3D printed for after-market sensitisation onto the surface of pre-existing structures utilising robotic technologies, thus informing designers and engineers for part planning drawings and print parameters.

4. Conclusions

This study evaluates the geometry limitations in the 3D printing of continuous polymer-SSF parts and curvature bending stiffness. Teardrop-shaped components incorporated an angle, straight sections, and a semi-circle dimensional evaluation. To evaluate the dimensional repeatability, a statistical analysis was carried out using a μ CT scan and callipers data obtained from the 3D-printed composite samples with print angles between 5° to 90°, and radii ranging from 2 to 20 mm. It was concluded that there was no significant difference between the radii (5 mm) and the geometric dimensions estimated based on marginal means analysis, indicating a decrease in the dimensional accuracy at the apex and curved sections. At smaller angles (≤5°) and radii (≤4 mm), the acute toolpath cornering towards the end of the turn gave rise to a higher level of distortion. The fibre migration led to some stringing in a number of the print geometries with lower radii semi-circles. This was likely associated with the slow solidification of the polymer as the print head changed direction. As a result, the SSFs moved out of the targeted print track position. Controlling the speed at which the printer head travels around corners was found to be efficient in successfully reducing the level of stringing for the smaller radii print structures. A curvature bending stiffness test methodology was developed to establish a relationship between the curve size (<20 mm) and stiffness. It was demonstrated that there was an increase in the curvature bend stiffness as the radii decreased for all materials tested. Comparison materials included PLA, Onyx (Nylon with short carbon fibres), and Onyx-cCF (Nylon with short and continuous carbon fibre prints). There was almost a linear increase in the curvature bending stiffness as the print radii were reduced in the 3 to 20 mm range investigated. The PLA-SSF composite exhibited the most significant stiffness increase at radii below 5 mm. This study helps to demonstrate the geometric 3D printing limits during cornering SSF-reinforced polymers and how the resultant print gaps obtained due to print geometry limitations can potentially be accounted for by modifying the design dimensions. The piezoresistance response of PLA-SSFs with the applied load during curve bend stiffness testing demonstrated their potential for use as sensors and in structural health monitoring.

Supplementary Materials

The following supporting information can be downloaded at: https://www.mdpi.com/article/10.3390/jcs8100410/s1, Figure S1: Printed teardrop sample no. 5 r2a; Figure S2: Printed teardrop sample no. 5 r2c; Figure S3: Teardrop sample no. 5 r2c Inner apex dimension; Figure S4: sample no. 5 r2a Outer apex dimension; Figure S5: Teardrop sample no. 5 r2a Radius; Figure S6: Teardrop sample no. 5 r2c outer apex; Figure S7: Teardrop sample no. 5 r2c Radius dimensions; Figure S8: Printed teardrop sample no. 5 r2d; Figure S9: Teardrop sample design of 5° angle and 2 mm radius; Figure S10: Printed teardrop sample no. 10 r3a; Figure S11: Teardrop sample no. 10 r3a outer apex dimensions; Figure S12: Teardrop sample no. 10 r3a outer overall inner dimension; Figure S13: Printed teardrop sample no. 10 r3b; Figure S14: Teardrop sample no. 10 r3b outer apex dimensions; Figure S15: Teardrop sample no. 10 r3b Radius dimensions; Figure S16: Printed teardrop sample no. 10 r3c; Figure S17: Teardrop sample design of 10° angle and 3 mm radius; Figure S18: Printed teardrop sample no. 20 r4a; Figure S19: Printed teardrop sample no. 20 r4b; Figure S20: Teardrop sample no. 20 r4b Radius dimensions; Figure S21: Teardrop sample no. 20 r4b dimensions; Figure S22: Teardrop sample no. 20 r4b semi-circle sections wall dimensions; Figure S23: Teardrop sample no. 20 r4b wall dimensions; Figure S24: Teardrop sample no. 20 r4b radius dimensions; Figure S25: Printed teardrop sample no. 20 r4c; Figure S26: Teardrop sample no. 20 r4c apex dimensions; Figure S27: Teardrop sample no. 20 r4c radius dimensions; Figure S28: Teardrop sample design of 20° angle and 4 mm radius; Figure S29: Printed teardrop sample no. 30 r5b; Figure S30: Teardrop sample no. 30 r5b base angle corner dimensions; Figure S31: Teardrop sample no. 30 r5b top surface angle corner dimensions; Figure S32: Teardrop sample no. 30 r5b radius dimensions; Figure S33: Printed teardrop sample no. 30 r5e; Figure S34: Teardrop sample no. 30 r5e base angle corner dimensions; Figure S35: Teardrop sample no. 30 r5e radius dimensions; Figure S36: Printed teardrop sample no. 30 r5f; Figure S37: Teardrop sample no. 30 r5f apex dimensions; Figure S38: 30 r5f apex dimensions; Figure S39: Teardrop sample design of 30° angle and 5 mm radius; Figure S40: Printed teardrop sample no. 50 r10c; Figure S41: 50 r10c apex dimensions; Figure S42: 50 r10c apex dimension 2; Figure S43: 50 r10c Radius; Figure S44: Printed teardrop sample no. 50 r10f; Figure S45: 50 r10f Radius Figure S46: Printed teardrop sample no. 50 r10g; Figure S47:Teardrop sample design of 50° angle and 10 mm radius; Figure S48: Printed teardrop sample no. 70 r15b; Figure S49: 70 r15b angle dimension; Figure S50: 70 r15b apex dimensions; Figure S51: 70r15 b dimensions between PLA to SSF of the wall; Figure S52: 70r15 b dimensions between PLA to SSF of the wall 2; Figure S53: Printed teardrop sample no. 70 r15e; Figure S54: Printed teardrop sample no. 70 r15f; Figure S55: 70 r15f apex dimensions; Figure S56: 70r15f Radius; Figure S57: Teardrop sample design of 70° angle and 15 mm radius; Figure S58: Printed teardrop sample no. 90 r20c; Figure S59: 90 r20c apex dimensions; Figure S60: 90 r20c apex dimension 2; Figure S61: 90r20c Radius dimensions; Figure S62: Printed teardrop sample no. 90 r20dd; Figure S63: 90 r20d apex dimension 2; Figure S64: Printed teardrop sample no. 90 r20ee; Figure S65: Teardrop sample design of 90° angle and 20 mm radius; Figure S66: PLA-SSF ovals for sectioning to CBS test; Figure S67: PLA-SSF sectioned oval for CBS; Figure S68: PLA-SSF CBS 10 mm cross-section; Figure S69: Aligning the Semi-circular PLA-SSF sample with copper connectors in the supporting cartridges Figure S70: CBS testing jig dry set up; Figure S71: CBS testing jig in testing machine connected to LCR meter—PLA-SSF R15 mm; Figure S72: Keysights LCR meter, Resistance Calibration curve; Figure S75: CBS sample 5a.1 at 42 s; Figure S73: CBS sample 5a.1 at1.38s; Figure S74: CBS sample 5a.1 at 2.27 s; Figure S76: CBS sample 5c.1 at 0.36 s; Figure S77: CBS sample 5b.2 at 1.02 s; Figure S78: CBS sample 5b.2 at 2.19 s; Figure S79: CBS sample 5b.2 at 3.24 s; Figure S80: CBS sample 5c.2 at 0.21 s; Figure S81: CBS sample 5c.2 at 0.39 s; Figure S82: CBS sample 5c.2 at 0.54 s; Figure S83: CBS sample 5c.1 at 1.13 s; Figure S84: CBS sample 5c.1 at 2.19 s; Figure S85: CBS sample 10c2 at 1 s; Figure S86: CBS sample 10c2 at 30 s; Figure S87: CBS sample 10c2 at 50 s; Figure S88: CBS sample 10c2 at 80 s; Figure S89: CBS sample 10e.2 at 0.40 s; Figure S90: CBS sample 10e.2 at 1.08 s; Figure S91: CBS sample 10e.2 at 1.28 s; Figure S92: CBS sample 10f.2 at 0.25 s; Figure S93: CBS sample 10f.2 at 1.19 s; Figure S94: CBS sample 10b.2 at 0.39 s; Figure S95: CBS sample 10b.2 at 1.16 s; Figure S96: CBS sample 10b.2 at 1.44 s; Figure S97: CBS sample 10c.2 at 0.21 s; Figure S98: CBS sample 10c.2 at 1.31 s; Figure S99: CBS sample 10c.2 at 2.16 s; Figure S100: CBS sample 10g.2 at 0.56 s; Figure S101: CBS sample 10g.2 at 1.40 s; Figure S102: CBS sample 10g.2 at 2.16 s.

Author Contributions

Conceptualisation, A.J.C. and A.N.D.; methodology, A.J.C. and A.N.D.; software, A.J.C. and V.M.; validation, A.J.C., A.N.D., V.M. and D.P.D.; formal analysis, A.J.C., A.N.D., V.M. and D.P.D.; investigation, A.J.C.; resources, D.P.D.; data curation, A.J.C.; writing—original draft preparation, A.J.C.; writing—review and editing, D.P.D.; visualisation, A.J.C.; supervision, D.P.D.; project administration, A.J.C.; funding acquisition, D.P.D. All authors have read and agreed to the published version of the manuscript.

Funding

This publication has emanated from research supported in part by a grant from Science Foundation Ireland and I-Form Advanced Manufacturing Centre under Grant number 21/RC/10295_P2.

Data Availability Statement

Conflicts of Interest

The authors declare no conflicts of interest.

Abbreviations

The following abbreviations are used in this manuscript:
3DThree-dimensional
°CDegrees Centigrade
a 1 Measurement position
a 2 Measurement position
a 3 Measurement position
b 1 Measurement position
b 2 Measurement position
b 3 Measurement position
δ Deformation due to the force
>Greater than
hLayer Height
kCurvature bending stiffness
<Less than
Less than or equal to
μ CTMicro-computed tomography
μmMicrometer
mmMillimetre
mm/sMillimetres Per second
N/mmNewtons per millimetre
Ω Ohms
F t u Tensile strength
P m or P m a x Maximum load or failure
r 1 Measurement position
r 2 Measurement position
r 3 Measurement position
rpmRevolutions per minute
T 1 1st Extrusion barrel heater temperature
T 2 2nd Extrusion barrel heater temperature
T 3 3rd Extrusion barrel heater temperature
T 4 4th Extrusion barrel heater temperature
wHatch spacing
ABSAcrylonitrile butadiene styrene
BStructures base
CADComputer-aided design
cCFContinuous carbon fibre
CBSCurvature bending stiffness
C_lenghtCorner material length
FForce
KS-LCRKeysights Inductance, Capacitance, and Resistance meter
LCRInductance, Capacitance, and Resistance meter
L_innerOverall internal length
MEXMaterial extrusion
NNewton
Onyx-cCFNylon containing short carbon fibres and continuous carbon fibre
PAPolyamide or nylon
PCPolycarbonate
PEEKPolyetheretherketone
PLAPolylactic acid
PLA-cCFPolylactic acid containing continuous carbon fibre
PLA-SSFPolylactic acid containing continuous stainless steel fibre bundle composite
PUPolyurethane
RRadius
R_innerInner radius
R_outerOuter radius
SEMScanning electron 255 microscope
SSF316 L stainless steel fibre bundle
SHMStructural health monitoring
STLStereolithography file
TStructure top
TEXDecitex
V f Volume fraction

References

  1. Tack, L. Heatable Textiles Flexible and Durable Solutions for Heatable Textiles; Technical Report; NV Bekaert SA: Wetteren, Belgium, 2017. [Google Scholar]
  2. Tack, L. Bekinox® VN and Bekiflex®for Heatable Textiles; Technical Report; NV Bekaert SA: Wetteren, Belgium, 2019. [Google Scholar]
  3. Tack, L. Conductive Textiles Durable Textile Solutions for Transferring Power and Signals; Technical Report; NV Bekaert SA: Wetteren, Belgium, 2017. [Google Scholar]
  4. Saleh, M.A.; Kempers, R.; Melenka, G.W. A comparative study on the electromechanical properties of 3D-Printed rigid and flexible continuous wire polymer composites for structural health monitoring. Sensors Actuators A Phys. 2021, 328, 112764. [Google Scholar] [CrossRef]
  5. Park, S.; Shou, W.; Makatura, L.; Matusik, W.; Fu, K.K. 3D printing of polymer composites: Materials, processes, and applications. Matter 2022, 5, 43–76. [Google Scholar] [CrossRef]
  6. Zhuo, P.; Li, S.; Ashcroft, I.A.; Jones, A.I. Material extrusion additive manufacturing of continuous fibre reinforced polymer matrix composites: A review and outlook. Compos. Part B Eng. 2021, 224, 109143. [Google Scholar] [CrossRef]
  7. Brenken, B.; Barocio, E.; Favaloro, A.; Kunc, V.; Pipes, R.B. Fused filament fabrication of fiber-reinforced polymers: A review. Addit. Manuf. 2018, 21, 1–16. [Google Scholar] [CrossRef]
  8. Dickson, A.N.; Abourayana, H.M.; Dowling, D.P. 3D printing of fibre-reinforced thermoplastic composites using fused filament fabrication-A review. Polymers 2020, 12, 2188. [Google Scholar] [CrossRef] [PubMed]
  9. Beckman, I.P.; Lozano, C.; Freeman, E.; Riveros, G. Fiber selection for reinforced additive manufacturing. Polymers 2021, 13, 2231. [Google Scholar] [CrossRef]
  10. Tian, X.; Todoroki, A.; Liu, T.; Wu, L.; Hou, Z.; Ueda, M.; Hirano, Y.; Matsuzaki, R.; Mizukami, K.; Iizuka, K.; et al. 3D Printing of Continuous Fiber Reinforced Polymer Composites: Development, Application, and Prospective. Chin. J. Mech. Eng. Addit. Manuf. Front. 2022, 1, 100016. [Google Scholar] [CrossRef]
  11. Pandelidi, C.; Bateman, S.; Piegert, S.; Hoehner, R.; Kelbassa, I.; Brandt, M. The technology of continuous fibre-reinforced polymers: A review on extrusion additive manufacturing methods. Int. J. Adv. Manuf. Technol. 2021, 113, 3057–3077. [Google Scholar] [CrossRef]
  12. Krishnan, P. Evaluation and Methods of Interfacial Properties in Fiber-Reinforced Composites; Elsevier Ltd.: Amsterdam, The Netherlands, 2018; pp. 343–385. [Google Scholar] [CrossRef]
  13. Sanivada, U.K.; Mármol, G.; Brito, F.; Fangueiro, R. PLA Composites Reinforced with Flax and Jute. Polymers 2020, 12, 2373. [Google Scholar] [CrossRef] [PubMed]
  14. Vedrtnam, A.; Ghabezi, P.; Gunwant, D.; Jiang, Y.; Sam-Daliri, O.; Harrison, N.; Goggins, J.; Finnegan, W. Mechanical performance of 3D-printed continuous fibre Onyx composites for drone applications: An experimental and numerical analysis. Compos. Part C Open Access 2023, 12, 100418. [Google Scholar] [CrossRef]
  15. Sealy, C. Thermoplastic waste recycled into useful composite. Mater. Today 2023, 69, 4–6. [Google Scholar] [CrossRef]
  16. Clarke, A.J.; Dickson, A.; Dowling, D.P. Fabrication and Performance of Continuous 316 Stainless Steel Fibre-Reinforced 3D-Printed PLA Composites. Polymers 2024, 16, 63. [Google Scholar] [CrossRef] [PubMed]
  17. Matsuzaki, R.; Ueda, M.; Namiki, M.; Jeong, T.K.; Asahara, H.; Horiguchi, K.; Nakamura, T.; Todoroki, A.; Hirano, Y. Three-dimensional printing of continuous-fiber composites by in-nozzle impregnation. Sci. Rep. 2016, 6, 23058. [Google Scholar] [CrossRef] [PubMed]
  18. Wang, X.; Jiang, M.; Zhou, Z.; Gou, J.; Hui, D. 3D printing of polymer matrix composites: A review and prospective. Compos. Part Eng. 2017, 110, 442–458. [Google Scholar] [CrossRef]
  19. Ibrahim, Y. 3D Printing of Continuous Wire Polymer Composite for Mechanical and Thermal Applications. Ph.D. Thesis, York University, Toronto, ON, Canada, 2019. [Google Scholar]
  20. Hou, Z.; Tian, X.; Zhang, J.; Li, D. 3D printed continuous fibre reinforced composite corrugated structure. Compos. Struct. 2018, 184, 1005–1010. [Google Scholar] [CrossRef]
  21. Hamidi, A.; Tadesse, Y. Single step 3D printing of bioinspired structures via metal reinforced thermoplastic and highly stretchable elastomer. Compos. Struct. 2019, 210, 250–261. [Google Scholar] [CrossRef]
  22. Shang, J.; Tian, X.; Luo, M.; Zhu, W.; Li, D.; Qin, Y.; Shan, Z. Controllable inter-line bonding performance and fracture patterns of continuous fiber reinforced composites by sinusoidal-path 3D printing. Compos. Sci. Technol. 2020, 192, 108096. [Google Scholar] [CrossRef]
  23. Dong, K.; Liu, L.; Huang, X.; Xiao, X. 3D printing of continuous fiber reinforced diamond cellular structural composites and tensile properties. Compos. Struct. 2020, 250, 112610. [Google Scholar] [CrossRef]
  24. Yao, X.; Luan, C.; Zhang, D.; Lan, L.; Fu, J. Evaluation of carbon fiber-embedded 3D printed structures for strengthening and structural-health monitoring. Mater. Des. 2017, 114, 424–432. [Google Scholar] [CrossRef]
  25. Yamamoto, K.; Luces, J.V.S.; Shirasu, K.; Hoshikawa, Y.; Okabe, T.; Hirata, Y. A novel single-stroke path planning algorithm for 3D printers using continuous carbon fiber reinforced thermoplastics. Addit. Manuf. 2022, 55, 102816. [Google Scholar] [CrossRef]
  26. Saari, M.; Cox, B.; Richer, E.; Krueger, P.S.; Cohen, A.L. Fiber encapsulation additive manufacturing: An enabling technology for 3D printing of electromechanical devices and robotic components. 3D Print. Addit. Manuf. 2015, 2, 32–39. [Google Scholar] [CrossRef]
  27. Bakas, L.; Rimašauskas, M. Investigation of Electrical Properties of 3D Printed Carbon Fiber Reinforced Composite Structures. Ph.D. Thesis, Kaunas University of Technology, Kaunas, Lithuania, 2023. [Google Scholar]
  28. Liu, G.; Xiong, Y.; Zhou, L. Additive manufacturing of continuous fiber reinforced polymer composites: Design opportunities and novel applications. Compos. Commun. 2021, 27, 100907. [Google Scholar] [CrossRef]
  29. Callens, M.G.; Gorbatikh, L.; Verpoest, I. Ductile steel fibre composites with brittle and ductile matrices. Compos. Part Appl. Sci. Manuf. 2014, 61, 235–244. [Google Scholar] [CrossRef]
  30. Matsuzaki, R.; Nakamura, T.; Sugiyama, K.; Ueda, M.; Todoroki, A.; Hirano, Y.; Yamagata, Y. Effects of Set Curvature and Fiber Bundle Size on the Printed Radius of Curvature by a Continuous Carbon Fiber Composite 3D Printer. Addit. Manuf. 2018, 24, 93–102. [Google Scholar] [CrossRef]
  31. Sugiyama, K.; Matsuzaki, R.; Ueda, M.; Todoroki, A.; Hirano, Y. 3D printing of composite sandwich structures using continuous carbon fiber and fiber tension. Compos. Part A Appl. Sci. Manuf. 2018, 113, 114–121. [Google Scholar] [CrossRef]
  32. Bettini, P.; Alitta, G.; Sala, G.; Di Landro, L. Fused Deposition Technique for Continuous Fiber Reinforced Thermoplastic. J. Mater. Eng. Perform. 2017, 26, 843–848. [Google Scholar] [CrossRef]
  33. Lu, C.; Qi, M.; Islam, S.; Chen, P.; Gao, S.; Xu, Y.; Yang, X. Mechanical performance of 3D-printing plastic honeycomb sandwich structure. Int. J. Precis. Eng. Manuf. Green Technol. 2018, 5, 47–54. [Google Scholar] [CrossRef]
  34. Eichenhofer, M.; Wong, J.C.; Ermanni, P. Continuous lattice fabrication of ultra-lightweight composite structures. Addit. Manuf. 2017, 18, 48–57. [Google Scholar] [CrossRef]
  35. Markforged. Material Datasheet Composites; Technical Report; Markforged: Billerica, MA, USA, 2022. [Google Scholar]
  36. Yao, Y.; Li, M.; Lackner, M.; Herfried, L. A continuous fiber-reinforced additive manufacturing processing based on PET fiber and PLA. Materials 2020, 13, 3044. [Google Scholar] [CrossRef]
  37. Heidari-Rarani, M.; Rafiee-Afarani, M.; Zahedi, A.M. Mechanical characterization of FDM 3D printing of continuous carbon fiber reinforced PLA composites. Compos. Part B Eng. 2019, 175, 107147. [Google Scholar] [CrossRef]
  38. Tian, X.; Liu, T.; Yang, C.; Wang, Q.; Li, D. Interface and performance of 3D printed continuous carbon fiber reinforced PLA composites. Compos. Part A Appl. Sci. Manuf. 2016, 88, 198–205. [Google Scholar] [CrossRef]
  39. Liu, S.; Li, Y.; Li, N. A novel free-hanging 3D printing method for continuous carbon fiber reinforced thermoplastic lattice truss core structures. Mater. Des. 2018, 137, 235–244. [Google Scholar] [CrossRef]
  40. Zhang, H.; Liu, D.; Huang, T.; Hu, Q.; Lammer, H. Three-dimensional printing of continuous flax fiber-reinforced thermoplastic composites by five-axis machine. Materials 2020, 13, 1678. [Google Scholar] [CrossRef] [PubMed]
  41. Carani, L.B.; Humphrey, J.; Rahman, M.M.; Okoli, O.I. Advances in Embedded Sensor Technologies for Impact Monitoring in Composite Structures. J. Compos. Sci. 2024, 8, 201. [Google Scholar] [CrossRef]
  42. Wang, Z.; Luan, C.; Liao, G.; Yao, X.; Fu, J. Mechanical and self-monitoring behaviors of 3D printing smart continuous carbon fiber-thermoplastic lattice truss sandwich structure. Compos. Part Eng. 2019, 176, 107215. [Google Scholar] [CrossRef]
  43. Ibrahim, Y.; Melenka, G.W.; Kempers, R. Fabrication and tensile testing of 3D printed continuous wire polymer composites. Rapid Prototyp. J. 2018, 24, 1131–1141. [Google Scholar] [CrossRef]
  44. Galos, J.; Hu, Y.; Ravindran, A.R.; Ladani, R.B.; Mouritz, A.P. Electrical properties of 3D printed continuous carbon fibre composites made using the FDM process. Compos. Part Appl. Sci. Manuf. 2021, 151, 106661. [Google Scholar] [CrossRef]
  45. Küster, K.; Barburski, M.; Lomov, S.V.; Vanclooster, K. Metal Fibers-Steel. In Inorganic and Composite Fibers: Production, Properties, and Applications; Elsevier Ltd.: Amsterdam, The Netherlands, 2018; pp. 219–241. [Google Scholar] [CrossRef]
  46. Verlinden, B.; Driver, J.; Samajdar, I.; Doherty, R. Thermo-mechanical processing of metallic materials. In Pergamon Materials Series; Pergamon: Oxford, UK, 2007; Volume 11, pp. 7–30. [Google Scholar] [CrossRef]
  47. NatureWorks. Ingeo™ Biopolymer 3D850 Technical Data Sheet 3D Printing Monofilament—General Purpose Grade; Technical Report 4; NatureWorks LLC: Minneapolis, MI, USA, 2018. [Google Scholar]
  48. 3devo. Composer 350 Product Specifications. Technical Report, 3devo, Utrecht, The Netherlands, 2020. Available online: https://cdn2.hubspot.net/hubfs/4595257/Product%20Spec%20Sheets/Composer-350-Specs.pdf (accessed on 26 September 2022).
  49. Sen, P.K.; Conover, W.J. Practical Nonparametric Statistics, 3rd ed.; Wiley: Hoboken, NJ, USA, 1972; Volume 67, p. 350. [Google Scholar] [CrossRef]
  50. ASTM D4496-21; Standard Test Method for D-C Resistance or Conductance of Moderately Conductive Materials. ASTM International: West Conshohocken, PA, USA, 2011.
  51. Cheng, P.; Wang, K.; Le Duigou, A.; Liu, J.; Liu, Z.; Peng, Y.; Ahzi, S. A novel dual-nozzle 3D printing method for continuous fiber reinforced composite cellular structures. Compos. Commun. 2023, 37, 101448. [Google Scholar] [CrossRef]
  52. Caminero, M.A.; Chacón, J.M.; García-Moreno, I.; Reverte, J.M. Interlaminar bonding performance of 3D printed continuous fibre reinforced thermoplastic composites using fused deposition modelling. Polym. Test. 2018, 68, 415–423. [Google Scholar] [CrossRef]
  53. Cook, J.W.; Skove, M.J.; Stillwell, E.P. Electrical resistance of an elastically bent thin metal wire in a magnetic field. Phys. Rev. B 1979, 20, 5100–5103. [Google Scholar] [CrossRef]
Figure 1. Teardrop geometry designs investigated.
Jcs 08 00410 g001
Figure 2. Teardrop plan and elevation CAD designs, including geometry dimensions with an angle of 70° and a 15 mm radius.
Jcs 08 00410 g002
Figure 3. (a) The piezoresistive response of a PLA-SSF filament attached to a plastic moving between straight or bent configuration; (b) schematic of the curvature bend test testing jig; and (c) photograph the curvature bend test equipment during composite sample testing.
Jcs 08 00410 g003
Figure 4. Three-dimensional printed PLA-SSF composites: (a) teardrop geometries investigated along with the (b) curvature bend test semi-circle samples.
Jcs 08 00410 g004
Figure 5. Planer CT scans of the middle sections of PLA-SSF teardrop geometries: (a) 20° angle with a radius of 4 mm and (b) 70° with a radius of 15 mm. Note the differences in the scale bars for the two scan images.
Jcs 08 00410 g005
Figure 6. Close up view of the apex angle section illustrating cornering material deposition: (a) 20° and a radius of 4 mm; (b) 70° and a radius of 15 mm; and (c) differences between the design dimensions and as-printed geometries obtained at the teardrop apex for prints with angles from 5° to 90°.
Jcs 08 00410 g006
Figure 7. Radius dimensions of teardrop geometries: (a) teardrop with a 20° angle and radius of 4 mm; (b) teardrop with a 70° angle and radius of 15 mm; and (c) average wall width around semi-circular sections.
Jcs 08 00410 g007
Figure 8. Overview of the difference between the design and as-printed dimensional results: (a) dimensional evaluation between the difference between the estimated marginal mean dimensions vs. the design dimensions; and (b) average resulting internal lengths.
Jcs 08 00410 g008
Figure 9. Curvature bending stiffness (CBS) (a) results for the printed materials shown. Note that the CBS testing was carried out using two test rigs (depending on the composite geometry), as described in Section 2.4; (b) PLA-SSF CBS samples cross section; and (c) Onyx-cCF CBS samples cross section.
Jcs 08 00410 g009
Figure 10. Curvature bending stiffness testing force against resistance for semi-circle sample set with a radius of 10 mm (seven specimens).
Jcs 08 00410 g010
Table 1. 3devo filament maker processing parameters, T 1 to T 4 related to extrusion barrel heater temperatures.
FilamentFilament Diameter (mm)Cooling Fans (°C)Extrude Speed (rpm) T 1 (°C) T 2 (°C) T 3 (°C) T 4 (°C)
PLA-SSF0.5 (±0.8)33.02.2179186193191
Table 2. Printing parameters of the PLA-SSF.
Angle
Radii (R), (mm)
90°
20.0
70°
15.0
50°
10.0
30°
5.0
20°
4.0
10°
3.0

2.0
Speed, (mm/s)8842111
Table 3. CAD dimensions and key to sections of geometry measured.
Measurement
Code
Description of
Position on Geometry
90°
R 20 mm
70°
R 15 mm
50°
R 10 mm
30°
R 5 mm
20°
R 4 mm
10°
R 3 mm

R 2 mm
R_innerInner radius20.0015.0010.005.004.003.002.00
R_outerOuter radius21.2016.2011.206.205.204.203.20
C_lenghtCorner material length1.702.092.844.646.9113.6027.51
L_innerOverall internal length48.2844.4433.6624.3227.0422.6247.85
Table 4. As-printed teardrop weight and average measured dimensions, where S.D. denotes the standard deviation, − is less, and + is more than the target dimensions.
MeasurementAngle90°70°50°30°20°10°
CodeRadii (R), (mm)20.015.010.05.04.03.02.0
R_inner P L A Design difference−0.8−0.8−1.1−1.5−1.3−2.5−1.4
R_inner S S F Design difference−0.1−0.3−0.2−1.3−1.2−2.5−1.2
R_outer S S F Design difference+0.10.0+0.1−0.1−0.3−1.9−0.3
R_outer P L A Design difference+1.0+0.8+1.0+0.9+0.8−0.4+0.8
C_LengthDesign difference+1.0+0.8+1.0+0.9+0.8−0.4+0.8
Disclaimer/Publisher’s Note: The statements, opinions and data contained in all publications are solely those of the individual author(s) and contributor(s) and not of MDPI and/or the editor(s). MDPI and/or the editor(s) disclaim responsibility for any injury to people or property resulting from any ideas, methods, instructions or products referred to in the content.