Article

Simulation and Discussion on Strength Mechanism of Trimodal Grain-Structured CNT/Al Composites Using Strain Gradient Theory

1
School of Mechanical, Electrical and Information Engineering, Shandong University at Weihai, Weihai 264209, China
2
State Key Laboratory of Rolling and Automation, Northeastern University, Shenyang 110819, China
3
Beijing Institute of Astronautical Systems Engineering, Beijing 100076, China
4
UR/LASMIS, University of Technology of Troyes, 12, rue Marie Curie, CS42060, 10004 Troyes Cedex, France
5
State Key Laboratory of Metal Matrix Composites, School of Materials Science and Engineering, Shanghai Jiao Tong University, Shanghai 200240, China
*
Authors to whom correspondence should be addressed.
These authors contributed equally to this work.
J. Compos. Sci. 2024, 8(12), 490; https://doi.org/10.3390/jcs8120490
Submission received: 19 October 2024 / Revised: 17 November 2024 / Accepted: 20 November 2024 / Published: 22 November 2024

Abstract

:
The trimodal grain-structured (TGS) carbon nanotube-reinforced aluminum matrix composites (CNT/Al) exhibit better strength–ductility synergy compared to bimodal grain-structured (BGS) composites. The addition of fine grain (FG) to the TGS composites effectively facilitates strain hardening and reduces strain/stress concentrations. In order to address the strain incompatibility in TGS composites, a significant accumulation of geometrically necessary dislocations (GNDs) occurs at the hetero-zone boundaries. This accumulation serves as the key factor in generating additional strengthening and work hardening. By utilizing a multi-mechanism strain gradient model, a quantitative analysis of the contributions made by Hall–Petch, Taylor, and back stress strengthening was conducted. Furthermore, effects of each domain volume fraction on the GND density at the boundaries between heterogeneous domains were carefully and extensively investigated and compared. It is found that the strengthening effect of back stress significantly surpasses that of the Hall–Petch and Taylor strengthening accounting. Compared to BGS composites, the TGS composites are more effective in facilitating strain hardening and reducing strain/stress concentrations, which may lead to a better balance between strength and ductility.

Graphical Abstract

1. Introduction

Over the past few decades, heterogeneous-structured (HS) composites have emerged as attractive materials due to their high strength, stiffness, and lightweight, finding unique applications in aerospace and defense industries. Efforts to achieve a synergistic increase in both strength and ductility have focused on adjusting the composition and structure of these materials [1,2,3]. Currently, efforts to enhance the mechanical properties of HS composites predominantly focus on manipulating grain structures and reinforcing the matrix. Refining grains to the ultrafine grain (UFG) level is effective; however, this process can lead to dislocation annihilation at grain boundaries, thereby reducing both the dislocation storage and adjustment capacities, ultimately diminishing the ductility of the composites. The family of heterogeneous materials, characterized by diverse grain size distributions, includes bimodal, trimodal, gradient, harmonic, and lamella structures, each comprising soft and hard zones. Deformation incompatibility between the fine/ultrafine grain (FG/UFG) and coarse grain (CG) zones, accommodated by geometrically necessary dislocations (GNDs), results in hetero-deformation-induced (HDI) strengthening, the principal mechanism behind the unprecedented mechanical properties. Bimodal grain-structured (BGS) composites, a category of HS materials, have garnered significant attention due to their simple microstructure and ease of control. The interfacial regions between CG and UFG zones, notable for their significant strength disparity, are the primary sources of stress localization and microcrack nucleation at the CG–UFG interfaces [4]. Researchers have mitigated the disparities in mechanical properties between CG and UFG zones by incorporating FG [5].
Studies on BGS composites indicate that optimal tensile and yield strengths can be achieved by adjusting the concentration of the CG domain, although increases in tensile elongation are limited to 1–2% [1,6]. To improve tensile ductility, the focus of microstructure design in HS composites has shifted towards modifying the hard domains [6]. Consequently, researchers introduced inter-domain grains into BGS to develop a trimodal grain-structured (TGS) composite, which exhibits enhanced strength and ductility compared to the BGS composites. The elongation and tensile strength of the CNT/Al-Cu-Mg composites are 6.7% and 723 MPa, respectively. Compared to the CNT/Al BGS composites, the CNT/Al-Cu-Mg TGS composites show a 34% increase in ductility alongside an increase in strength [5,7]. Fu et al. [7] employed the powder assembly/elemental alloying technique to fabricate carbon nanotube-reinforced aluminum matrix composites (CNT/Al-Cu-Mg) with a trimodal grain structure. They reported that these TGS composites offer an exceptional combination of strength and ductility compared to bimodal and unimodal composites. Su et al. [8] compared the toughness of an interstitial carbon-doped high-entropy alloy (HEA) with bimodal and trimodal microstructures. They reported a significant enhancement in ductility—from 14% to 60%—in the trimodal HEA, attributed to the multi-stage work hardening behavior. It has been reported that heterogeneous microstructures, including multimodal and gradient materials, exhibit extraordinary strain hardening—a property absent in homogeneous materials—that delays necking [9]. Comparative analyses of multiple studies reveal that the strength–ductility combination is profoundly influenced by the transition mode of grain sizes: complex grain size structures, such as trimodal microstructures or gradient grain sizes ranging from nano to micron scales, yield better results than instant transitions between bimodal structures [10]. Given the distinct roles of different domains in the deformation process, it is essential to examine the influence and contributions of various strengthening mechanisms on the strain hardening of TGS composites.
The physics-based constitutive model enables the simultaneous investigation of multiple strengthening mechanisms [11]. Given the large number of grains in TGS composites, the finite element method (FEM) based on crystal plasticity is time-consuming [12]. The overall mechanical response of TGS composites can be estimated using the rule of mixtures (ROM) [13,14,15]. However, the ROM overlooks interactions between heterogeneous domains, leading to underestimated strength values compared to actual strengths [2,16]. The strain gradient constitutive model effectively simulates the mechanical response of metal matrix composites (MMCs) [17]. Zhu et al. [18] developed a theoretical model to characterize the mechanical properties of nanostructured metals with BGS grain size distribution, successfully predicting their tensile properties including yield strength, strain hardening, and uniform elongation. Wu et al. [19] quantified the contributions of various strengthening mechanisms in BGS composites, including dislocation strengthening, grain boundary strengthening, and load-bearing enhancement. Since the mechanical model for BGS composites does not account for back stress, it fails to accurately predict their real mechanical responses [20]. Moreover, Wang et al. [21] studied how the hetero-zone boundary regions control the mechanical properties of heterostructures.
To date, only a few studies have focused on evaluating the elastic–plastic behavior of TGS composites. The analytical model and FEM are the main methods to reveal the mechanical responses of these composites. For example, finite element modeling based on the dislocation mechanism has been used to study the stress–strain distribution of composites [7]. Back stress has been proved to be an important factor in the study of HS composites, and the presence of back stress can improve yield strength, strain hardening, and ductility [16]. Zhang et al. [22] artificially studied the effect of grain size and found that due to the interaction between dislocation and grain boundaries, a large amount of GNDs accumulated near the grain boundaries. At the micron scale, the smaller the grain size, the greater the GND density and the greater the back stress [22].
Researchers can calculate back stress as a function of dislocation density [23]. Li et al. [24] proposed a constitutive model of BGS copper alloys; they considered the sample-level back stress, but ignored the grain-level back stress. Zhang et al. [25] found that the back stress strengthening effect was more sensitive to the size of FG than to the size of CG. However, the back stress in TGS composites has not been studied deeply. Similarly, it can be noted that after the addition of FG, the distribution of the dislocations in the TGS composites is significantly different from that in the BGS composites. Some studies also showed that the dislocation density at the boundaries of the HS composites is often higher than that in other regions, but the rule was not summarized. The influence of morphology and microstructure evolution of the TGS composites on the overall mechanical response has not been studied.
Subsequently, a TGS composites model based on multiple mechanisms was established. The effects of Hall–Petch and Taylor strengthening, statistical storage dislocations (SSDs), grain size, sample level GNDs and GNDs at hetero-zone boundaries, and back stress were considered in the composition equation. In heterogeneous materials, the incongruity of plastic strain results in back stress in the soft domain and forward stress in the hard domain. HDI stress occurs in the coupling and interaction between the back stress and the forward stress [26]. Because it is not clear how to calculate the HDI stress quantitatively, it is hard to incorporate it into the constitutive model. Among them, the GND density of three kinds of hetero-zone boundaries of TGS composites were summarized, aiming to explore the potential advantages of adding FG. The effects of different strengthening mechanisms on plastic behavior were considered, and the effects of morphology and microstructure evolution on mechanical response were studied. The contents of this paper are arranged as follows. In Section 2, the experiments and characterization of TGS composites are introduced. In Section 3, the constitutive equation of the TGS composites is established. In Section 4, the geometric models and parameter identification of TGS composites are introduced by means of uniaxial tensile tests. In Section 5, the effects of morphology and microstructure evolution of TGS composites were discussed. Finally, a conclusion is drawn in Section 6.

2. Materials, Experimental Procedures, and Observations

The TGS composites are prepared by powder assembly and alloying (as we have publish before in paper [7]). The raw materials are pure aluminum powder and different sizes of CNT/Al and CNT/2024Al [5,7,27]. The manufacturing process of TGS composite material is shown in Figure 1. The trimodal grain structure of powder assemblies can be obtained by assembling different building blocks. By confining Cu, Mg elemental powders, and Al powders within CNTs during alloying, these building blocks evolve into trimodal grains (Table 1). It should be noted that the grain structure can be easily controlled by changing the assembled building blocks during the powder assembly and alloying process. Unimodal and bimodal grain structure composites can be obtained by assembling the corresponding building blocks. Initially, a mixture of 66.25 wt.% pure Al powder, 25 wt.% 2024Al powder, 1.875 wt.% Mg powder, 5 wt.% Cu flakes, and 1.875 wt.% CNTs were mixed in a 3D mixer for 5 h, with 1 wt.% stearic acid as the process control agent. Then, shift-speed ball milling (SSBM) was used to uniformly disperse CNTs, which involved a low-speed ball milling (LSBM) process and a high-speed ball milling (HSBM) process. The powder mixtures were ball milled at 135 rpm for 12 h and 270 rpm for 1 h in a planetary ball mill with a ball-to-powder ratio of 20:1. After milling, the pure Al and 2024Al flakes of varying thicknesses were assembled and alloyed to form cold-welded particles with evenly distributed CNTs. These cold-welded particles were then combined with an additional 20 wt.% of coarse-grained pure Al powder using planetary ball milling at 135 rpm for 1 h, resulting in composite powder assemblies designed for the trimodal grain structure. The device used is a universal testing machine (Instron Model 3344) equipped with a static axial clip-on extensometer (Instron Model 2630-101). It conducted uniaxial tensile experiments on the composite materials at room temperature under a constant loading rate of 5 × 10⁻⁴ s−1. We utilized sheet tensile specimens with a gauge length of 10 mm, width of 2 mm, and thickness of 1 mm. For the tensile specimens, we first used wire cutting to extract dog-bone-shaped samples from an extruded rod, where the tensile axis was parallel to the direction of extrusion. Subsequently, the surfaces and edges of the specimens were polished using sandpapers of various grit sizes (320, 600, 1200, 2400, and 4000) to remove contaminants such as oils, achieving a smooth finish on the sheet specimens. To ensure the reliability and stability of the data, each sample underwent uniaxial tensile testing at least three times.
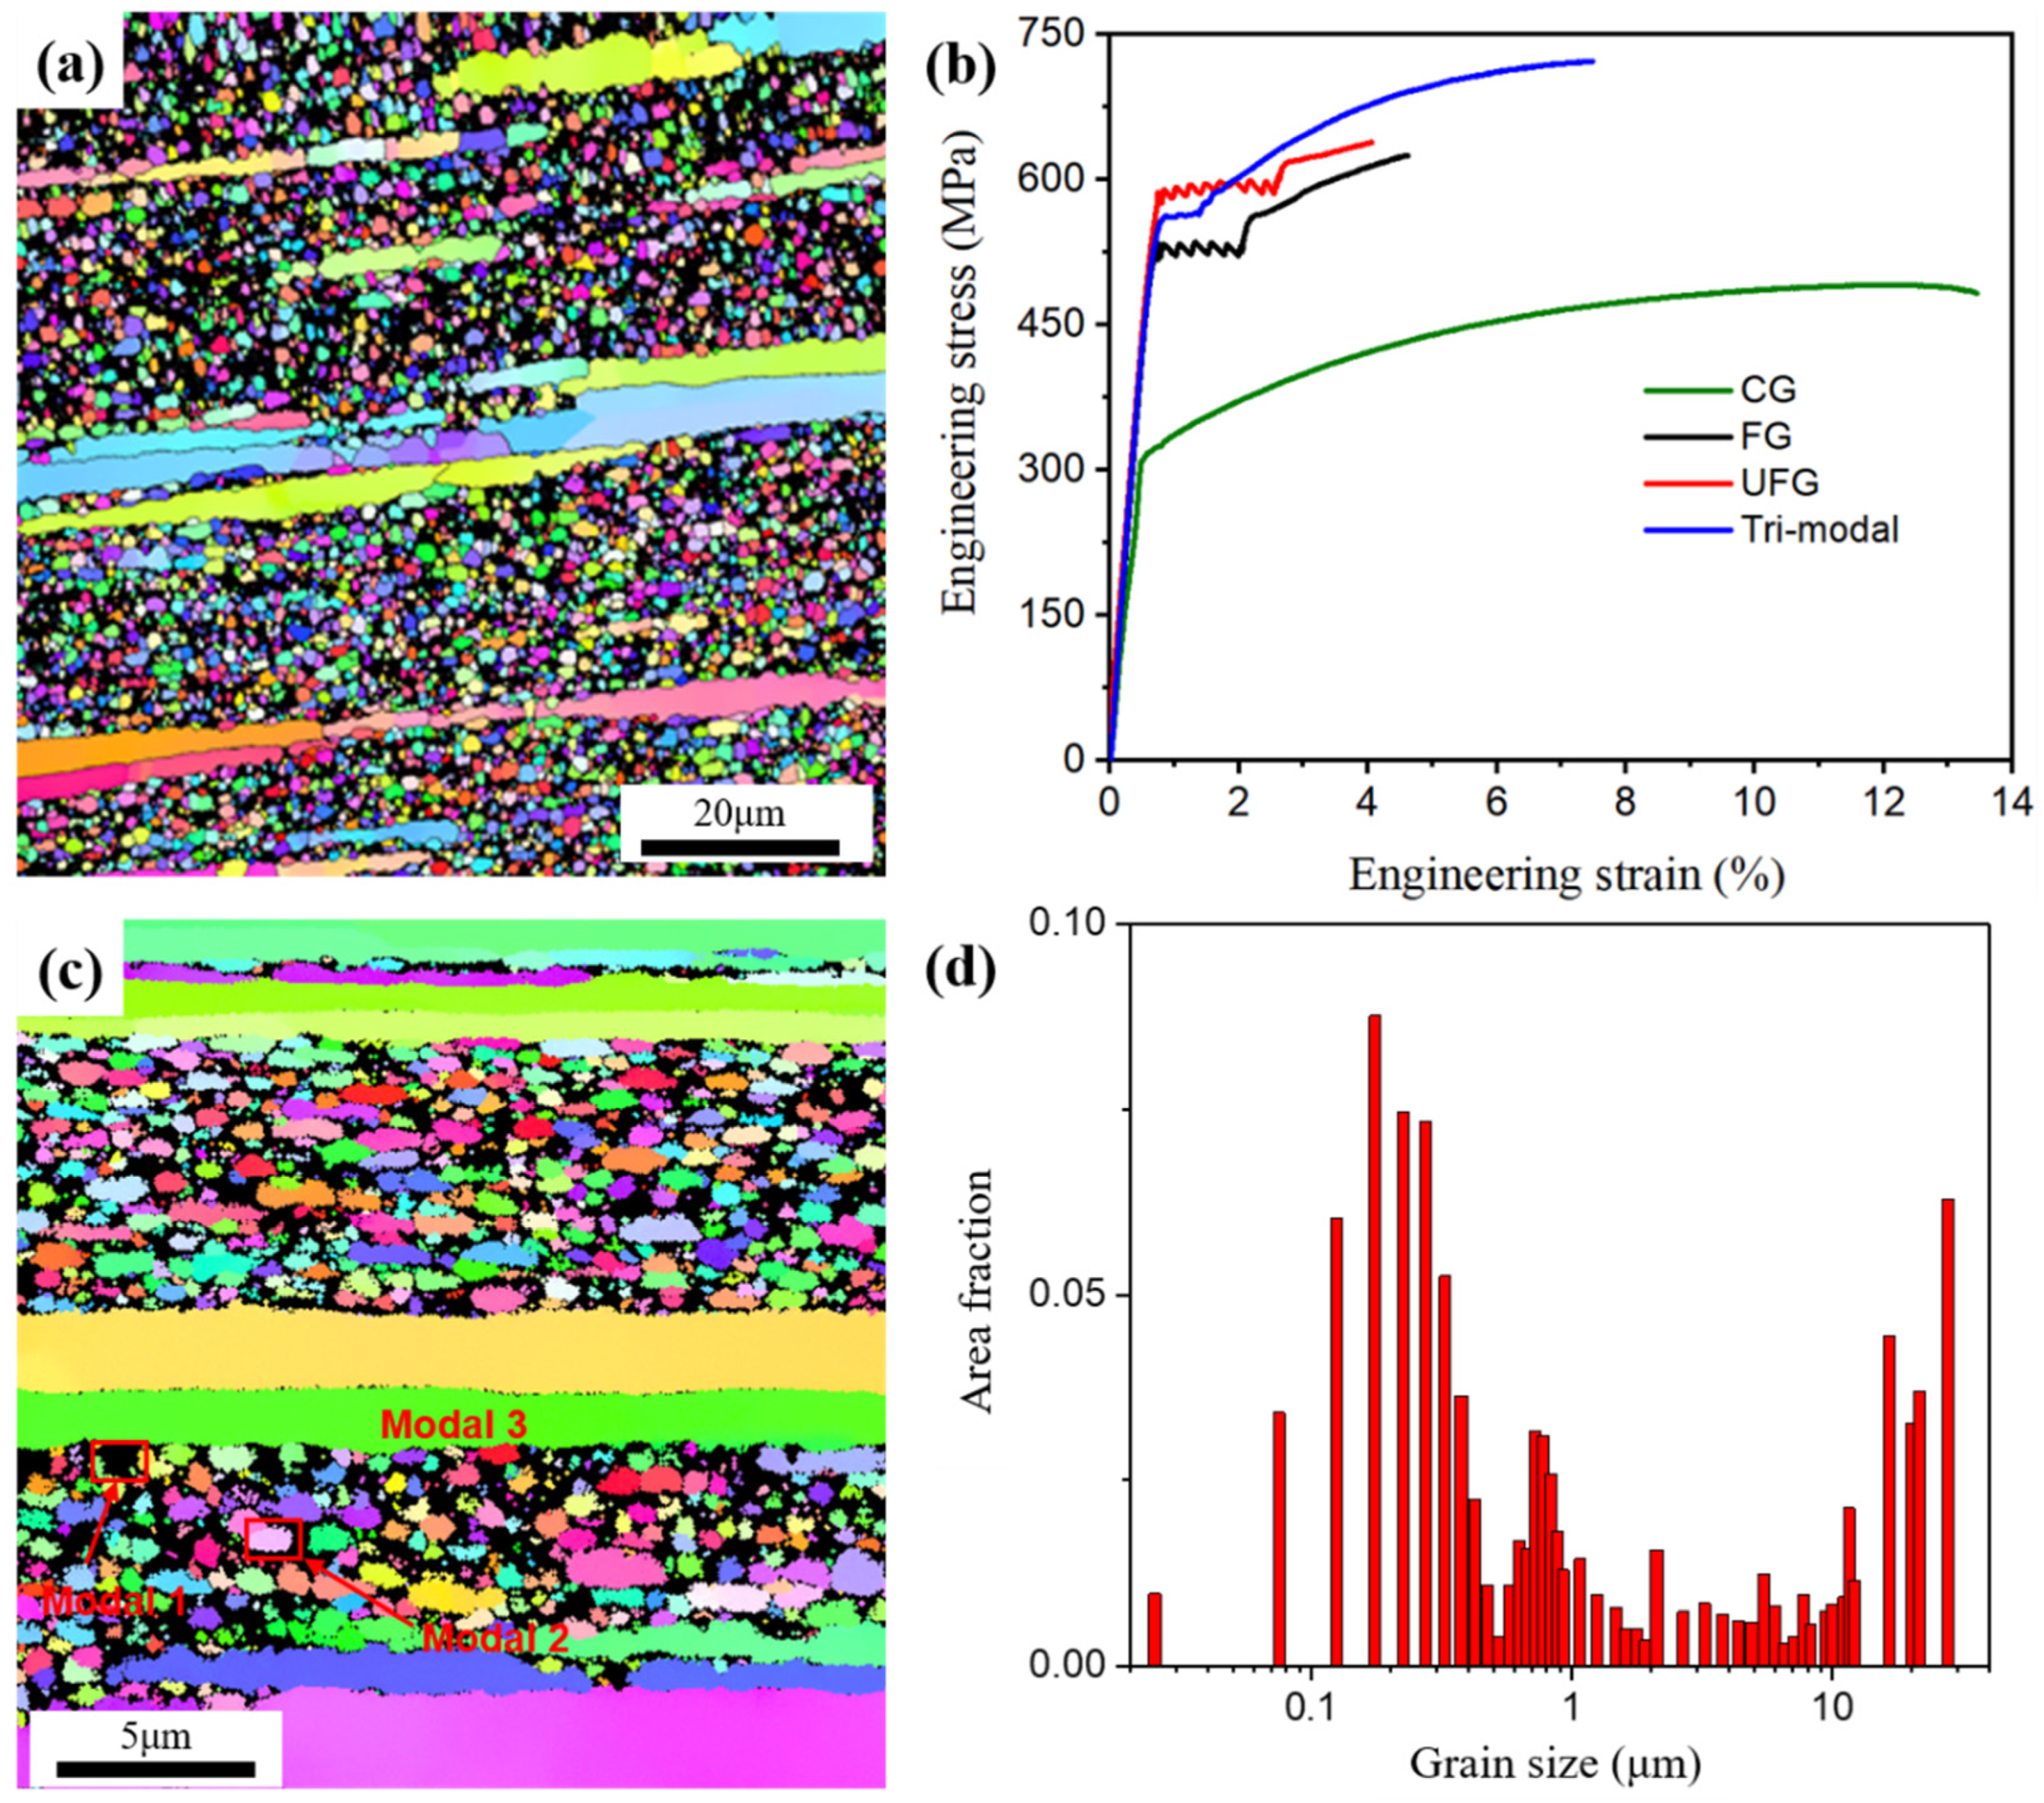
The microstructure of the composite with FG and CG (bright contrast) uniformly distributed within UFG (dark contrast) is depicted in Figure 2a. Figure 2b shows the stress–strain curve of the composite under uniaxial tensile test. CNT/Al, CNT/2024Al, and pure Al are relative to the UFG, FG, and CG domains, respectively. From the single-domain materials, UFG has the highest ultimate tensile strength and the lowest elongation, and CG has the lowest ultimate tensile strength and the highest elongation. The TGS has the highest tensile strength and the elongation is higher than FG and UFG, indicating that the TGS material has an additional strengthening mechanism to improve the strain hardening ability of the material. At the same time, because CG is a softer and more ductile domain, it effectively provides additional space for strain hardening and avoids strain localization in CG domain [28]. Figure 2c describes the microstructure of TGS composites: CG (modal 3) are embedded into the FG (modal 2) and UFG (modal 1) matrix, indicating that the TGS structure can be seen as a composite structure composed of the three domains of UFG, FG, and CG. The grain size distribution of the composites is shown in Figure 2d. The average grain size of UFG is 203 nm. The FG grain size in the middle ranges from 500 nm to 2 μm, with an average of 768 nm. The CG average grain size is 15.23 μm. These three grain types are randomly distributed. The average width and length of the CG bands formed by CG were 8.9 μm and 329.5 μm, respectively.

3. A Constitutive Model for TGS Composites Considering the Microstructure Deformation Mechanism

To investigate the influence of the morphology and microstructure of TGS composites on their mechanical response, this multi-mechanism material model incorporates Hall–Petch strengthening, Taylor strengthening, and back stress strengthening.

3.1. Elastoplasticity

Similar to the traditional continuum mechanics approach, the rate of deformation tensor comprises a plastic component ε ˙ i j p and an elastic component ε ˙ i j e . The total strain rate, ε ˙ i j , is defined as follows:
ε ˙ i j = ε ˙ i j e + ε ˙ i j p
The relationship between the stress rate and elastic strain rate adheres to Hooke’s law [29]:
ε ˙ i j e = 1 2 μ S i j + σ ˙ k k 9 K δ i j
here, K and μ represent the bulk modulus and the shear modulus, respectively. The deviatoric stress rate S i j is defined as follows:
S i j = σ ˙ i j σ ˙ k k δ i j 3
where σ ˙ k k and δ i j denote the hydrostatic stress rate and Kronecker’s tensor, respectively. The J2-flow theory is selected to describe the hardening flow dynamics [30]:
ε ˙ i j p = 3 ε ˙ p 2 σ e S i j
within this equation, ε ˙ p = 2 ε ˙ i j p ε ˙ i j p / 3 and σ e = 3 S i j S i j / 2 represent the equivalent plastic strain rate and the von Mises equivalent stress, respectively. According to the power law, the relationship between these parameters can be expressed as [31]:
ε ˙ p = ε ˙ 0 σ e σ f m
where ε ˙ 0 , σ f , and m denote the reference strain rate, the flow stress, and the rate sensitivity, respectively.

3.2. Flow Stress

For the TGS composites, multi-mechanism strengthening processes are incorporated into the flow stress, wherein dislocation density serves as the internal variable controlling strain hardening. This is defined as [23,32,33]:
σ f = σ y + M α μ b ρ + σ B a c k
the parameters σ y and M α μ b ρ represent the initial yield stress and Taylor strengthening due to the dislocation phenomena, respectively. M , α , b , ρ , and σ B a c k   denote the Taylor factor, a material-dependent constant, the magnitude of the Burgers vector, dislocation density, and back stress, respectively [34]. Isotropic hardening is typically associated with SSDs. All metallic materials produce GNDs, with those generated within the ultrafine UFG, FG, and CG domains of TGS composites significantly enhancing strength. Consequently, the total dislocation density can be categorized into three distinct parts, taking into account both SSDs and GNDs at the sample and grain levels [35]:
ρ = ρ S S D s + ρ G N D s s a m + ρ G N D s g r a
where   ρ S S D s , ρ G N D s s a m , and ρ G N D s g r a denote the density of the SSDs, and the densities of GNDs at the sample and grain levels, respectively. Additionally, the back stress is defined as follows:
σ B a c k = σ B a c k s a m + σ B a c k g r a + σ B a c k G B
In this equation, σ B a c k s a m , σ B a c k g r a , and σ B a c k G B denote the back stresses at the sample levels, grain levels, and induced by uniformly distributed CNTs in the grain boundaries, respectively. And σ B a c k G B provides the back stresses at the grain boundaries denoted by CNTs dispersed across the grain boundaries. The flow stress will be modified as:
σ f = σ y + M α μ b ρ S S D s + ρ G N D s s a m + ρ G N D s g r a + σ B a c k s a m + σ B a c k g r a + σ B a c k G B

3.2.1. Evolution of Yield Stress

Grain size influences both the yield and strain hardening behavior of materials [36]. The Hall–Petch formula describes the relationship between yield stress and grain size as follows:
σ y = σ 0 + k H P d
where σ 0 , k H P , and d represent the lattice friction stress, the Hall–Petch slope, and the grain size, respectively. k H P d is the strength contribution of grain boundaries. The grain sizes for the UFG, FG, and CG materials are reported as 200 nm, 1 μm, and 15.23 μm, respectively.

3.2.2. Evolution of SSDs

The calculation of SSD density may be based on the hypothesis proposed by Zhao et al. [11,37]. The parameter k m f p g denotes a geometric factor related to the grain shape, whereas k m f p d i s acts as a proportionality factor. In the context of SSD evolution via the dislocation dipole mechanism, the dislocation annihilation rate at grain boundaries (GBs) is defined by ( d r e f / d ) 2 ρ S S D s . Below d r e f , which denotes the reference grain size, dislocation annihilation is intensified. Consequently, the formula governing SSD density evolution is:
ρ S S D s ε P = M k m f p g b d + k m f p d i s b ρ S S D s + ρ G N D s k a n n 0 ε ˙ P ε ˙ r e f 1 n ρ S S D s d r e f d 2 ρ S S D s
where ε ˙ r e f is the reference strain rate and n is related to temperature. For TGS composites with grain sizes greater than 100 nm, the formula still applies.

3.2.3. Evolutions of GNDs and Back Stresses

The GNDs at the grain level in a homogeneous polycrystalline structure can be calculated using the pile-up dislocation mechanism, which accounts for slip discontinuities between different grains. In contrast, the GNDs at the sample level are typically assumed to be uniformly distributed throughout the polycrystalline cluster. The GNDs at the sample level can be calculated based on the hypothesis proposed by Nye and Ashby [35]:
ρ G N D s s a m = r ¯ η P b
where r ¯ denotes the Nye factor. The effective plastic strain gradient η P refers to the hypothesis of Gao et al. [38] as:
η P = η i j k p η i j k p / 4 ,   η i j k p = ε i k , j p + ε j k , i p ε i j , k p
In above expressions, i and j denote the x and y coordinate directions, respectively. The plastic strain tensor is defined in Equation (4). The sample-level back stress σ B a c k s a m can be derived based on the hypothesis proposed by Yefimov et al. [39] and Zhao et al. [11]:
σ B a c k s a m = μ b R 2 D 2 π ( 1 ν ) ρ G N D s s a m X 2 + ρ G N D s s a m Y 2
with the parameters R, D, and v denoting the cut-off radius of domain of GNDs, the nondimensional coefficient, and Poisson’s ratio [16,40]. Here, X and Y correspond to the 1 and 2 directions of the material point strain, respectively. The density of the GNDs at the grain level, which accumulates at the grain boundaries (GBs), can be calculated according to the hypothesis proposed by Zhao et al. [11]:
ρ G N D s g r a = N d 2
where d denotes the grain size and N denotes the total number of dislocations accumulated at the grain boundary. The evolution of N with plastic strain is defined following the methodologies of Sinclair et al. [40] and Zhao et al. [11]:
N ε P = N Δ 1 N N
In this equation, N and N Δ represent the dislocation saturation value and the initial evolution rate, respectively. The saturation value of N can be represented as [11,41]:
N = λ d + N e x t r a
where λ represents the proportional coefficient and N e x t r a is correction parameter for the pile-up of dislocations. Together, these factors determine the saturation number of piled-up dislocations. A smaller grain size will lead to smaller N Δ [33,42]. This relationship follows a linear equation expressed as:
N Δ = k N d + N A
where k N and N A are the constants for the piled-up dislocations, representing the initial rate of their evolution. Normally, back stress is generated within the grains, inhibiting the subsequent movement of dislocations toward GBs. However, observing the distribution of dislocations within grains is challenging. The back stress at the grain level can be calculated according to the method described by Hirth et al. [43]:
σ B a c k g r a = M μ b N π ( 1 ν ) d
The influence of various deformation mechanisms on the mechanical response of TGS composites under tensile load indicates that strain hardening is predominantly governed by back stress induced by GNDs. Figure 3a shows the grain-level back stress resulting from inter-grain slip discontinuities. Figure 3b depicts the sample-level back stress generated by stacked dislocations at the interface between two domains, arising from their differing shear moduli.
The kinematic component of strain hardening can be described using Brown and Clarke’s model, which characterizes the average stress in the secondary phases as [44]:
σ B a c k G B = 4 γ C N T s D C N T s V C N T s ε P κ
where γ C N T s = 10 8 ν C N T s 16 ( 1 ν C N T s ) and D C N T = 0.94 μ C N T s μ A l . ν C N T s is the Poisson’s ratio of CNTs. μ C N T s is the transverse shear modulus of CNTs. κ is the adaptive parameter of homogenization constitutive model. V C N T s is the volume fraction of CNTs. To estimate the kinematic contribution of the reinforcements, it is necessary to determine the unrelaxed strain in the intergranular reinforcements:
ε P = N b λ M
We have designed the transformation of information between scales along two distinct pathways. Figure 4 demonstrates the process and details of effective information transfer between the micro and nano scales. The path is a bottom-up approach: it involves transferring the material properties, calculated through homogenization of heterogeneous materials at the nano scale, to the micro scale. During the computational process of microstructures under load, updates to stiffness matrices, viscous stresses, strain gradients, SSDs, GNDs, as well as other material parameters at the integration points of micro finite elements, are derived from computational data of the nanostructures. The presence of strain gradients leads to the formation of hetero-interface affected-zones (the area outside the dotted box) due to GNDs.

4. Microstructure Simulation

4.1. Microstructure-Based Modeling

Figure 5c shows the kernel average misorientation (KAM) diagram of the TGS composite, offering a visual representation of the dislocation distribution within the composite under tensile strain. The diagram clearly reveals that the accumulation of dislocations is primarily concentrated within the boundary region of the CG domain. Referring to Figure 5d, the paths represented in this figure pass through three different heterogeneous domain boundaries: UFG-CG (Path 1#), CG-FG (Path 2#), and FG-UFG (Path 3#). For each kind of path, six different locations were randomly selected, and the average GND density was calculated to analyze the results obtained.
In computational homogenization, a reasonable overall numerical response can be achieved through the use of a periodic 2D microstructure, which is considered based on 2D plane strain states [45]. To maintain the periodicity of the Voronoi diagram, seeds are replicated in both the X and Y directions, as depicted in Figure 5a. A microstructure comprising 1089 grains was constructed; the volume fractions of UFG ( ρ U F G ), FG ( ρ F G ), and CG ( ρ C G ) ranging from 0.10 to 0.80, 0.10 to 0.60, and 0.10 to 0.50, respectively, were illustrated in Figure 5d. The constraint equations for the periodic boundary conditions of each representative volume element (RVE) are specified in Figure 5b,d.
u 1 A = u 1 D = u 1 L e f t u 1 B = u 1 C = u 1 R i g h t u 1 R i g h t + u 1 L e f t = 0
  u 2 A = u 2 B = u 2 T o p u 2 D = u 2 C = u 2 B o t t o m u 2 T o p + u 2 B o t t o m = 0
During the deformation process, u 1 A , u 1 B , u 1 C , and u 1 D represent the displacements in the X direction at points A, B, C, and D of the RVE, respectively. u 1 L e f t , u 1 R i g h t , u 2 T o p , and u 2 B o t t o m denote the displacements in the X direction at the Left and Right, and in the Y direction at the Top and Bottom, respectively.
Figure 5. (a) The 2D periodic structure; (b) periodic boundary conditions; (c) KAM diagram of TGS; and (d) UFG-CG, CG-FG, and FG-UFG boundary path setting and RVE unidirectional stretching periodic boundary conditions in the TGS composite RVE [46].
Jcs 08 00490 g005

4.2. Material Properties

In the multi-mechanical material model, most parameters, including the Taylor coefficient ( M ), Burgers vector magnitude ( b ), and Hall–Petch constant ( k H P ), possess physical significance. Some parameters’ values are empirically determined, while others are derived from the mechanical response under loading conditions using an inverse methodology, which considers grain size effects ranging from 200 nm to 15.23 µm (as detailed in Table 2).
This study requires the determination of ten parameters using an inverse methodology. The stress–strain curves of the composites with grain sizes of 0.2, 0.77, and 15 µm were analyzed. The SSD evolution is expressed by k m f p g , k m f p d i s , k a n n 0 , and d r e f , as outlined in Equation (11). k N and N A represent the initial evolution rates of stacked dislocations. In Equation (18), back stress evolution is represented by N and N D . For the CNT/Al with the specific grain sizes (e.g., d = 200 nm), these two parameters could be exclusively determined with the help of the back stress evolution curves. For a grain size of 200 nm, it is assumed that only two dislocations are piled up (i.e., d = 200 nm and N = 6). In Equations (17) and (18), N   is adjusted to align with its back stress evolution curve. Conversely, when the grain size is small, N Δ can be determined by N A . As the grain size increases, N Δ is predominantly influenced by the parameter k N and d . Additionally, the stress–strain curve of CNT/Al with a grain size of 200 nm aids in determining N A and k N . Subsequently, N e x t r a and λ can also be determined.
The material parameters determined are listed in Table 2, and the numerical results closely match the experimental data for the initial elastic and subsequent plastic sections, as shown in Figure 6a. As grain size decreased from 15.23 µm to 200 nm, yield strength increased from approximately 291 MPa to 481 MPa, confirming Hall–Petch strengthening. For UFG, FG, and CG, the predicted back stress evolution depicted in Figure 6b correlates well with the experimental results and is clearly related to grain size. With decreasing grain size, back stress reaches saturation earlier during plastic deformation, consistent with the experimental results [45,46]. The back stress increases inversely with grain size, aligning with both the experimental results and the predictions of the discrete dislocation dynamics model [47]. In summary, the parameters derived from the inversion process accurately depict the mechanical characteristics of TGS.
Table 2. The mechanical parameters of the UFG, FG, and CG.
ParametersSymbolsUFGFGCGRef.
Modulus of elasticity (MPa)E89,00086,00064,600
Poisson’s ratioν0.30.30.3
Reference strain rate (S−1) ε ˙ 0 111[23]
Rate sensitively exponentm202020[20]
Hall–Petch constant (MPa· μ m1/2) k H P 454545[11]
Taylor factorM3.063.063.06[11,12]
Taylor constant α0.260.30.34
Magnitude of Burgers vector (nm) b 0.250.250.25
Nye factor r ˉ 1.91.91.9[29]
Dynamic recovery constant 1 k a n n 0 1.51.51.5[11]
Dynamic recovery constant 2 n 21.2521.2521.25[23]
Geometric factor k m f p g 0.060.060.06[11]
Proportionality factor k m f p d i s 0.0080.0080.008[11]
Pile-up dislocations constant 1 ( μ m−1) k N 464646
Pile-up dislocations constant 2 N A 300300300
Pile-up factor related to grain size ( μ m−1) λ 5.95.95.9
Correction parameter of pile-up dislocations N e x t r a 4.824.824.82
Cut-off radius of the GND domain ( μ m)R333[11]
Initial dislocation density (m−2) ρ 0 4 × 10113 × 10112 × 1011[11]
Grain size ( μ m)d0.20.7715.23
Reference grain size ( μ m) d r e f 0.5130
Parameter of materialSymbolMagnitude Ref.
Poisson’s ratio of CNTs ν C N T s 0.28 [48,49]
Poisson’s ratio of Al μ A l 0.33 [50]
Volume fraction of CNTs (wt.%) V C N T s 1.875
Transverse shear modulus of CNTs μ C N T s 60 [49]
Shear modulus of Al μ A l 25.4 [44]

5. Results and Discussion

5.1. Mechanical Response

The constitutive model introduced in Section 3 and the geometric RVE outlined in Section 4.1 were utilized to simulate the mechanical behavior of TGS composites under uniaxial loading conditions. The constitutive parameters of TGS were established based on the mechanical parameters detailed in Section 4.2. Figure 7 displays the numerical and experimental stress–strain curves for the TGS composite under tensile loading. The results confirm that the model of TGS composites achieves satisfactory accuracy.
By analyzing the stress and strain distribution at the macroscopic strain level of 8%, this study investigated the influence of volume fractions in each domain on microplastic behavior. The observations indicated that with a constant CG volume fraction, maximum strength occurred at an FG volume fraction of 20%. Furthermore, peak strength was achieved with a CG volume fraction of 0.1 and an FG volume fraction of 0.2. To further examine the effects of the UFG, FG, and CG volume fractions on mechanical responses, the plastic stress and strain responses of the RVEs were calculated and analyzed.
Figure 8 illustrates the Mises stress results, showing the stress distribution across varying domain volume fractions. The calculated results reveal that the presence of the FG domain leads to a smoother and more uniform stress increment. Additionally, the soft and intermediate domains support the hard domain in sustaining more stress, thus delaying the onset of plastic deformation and instability. The strain distribution results, also depicted in Figure 8, demonstrate that an increase in the FG volume fraction leads to a more uniform and enhanced strain distribution. This suggests that the FG domain alleviates the strain incompatibility issues arising from specific parts of the strain gradient.
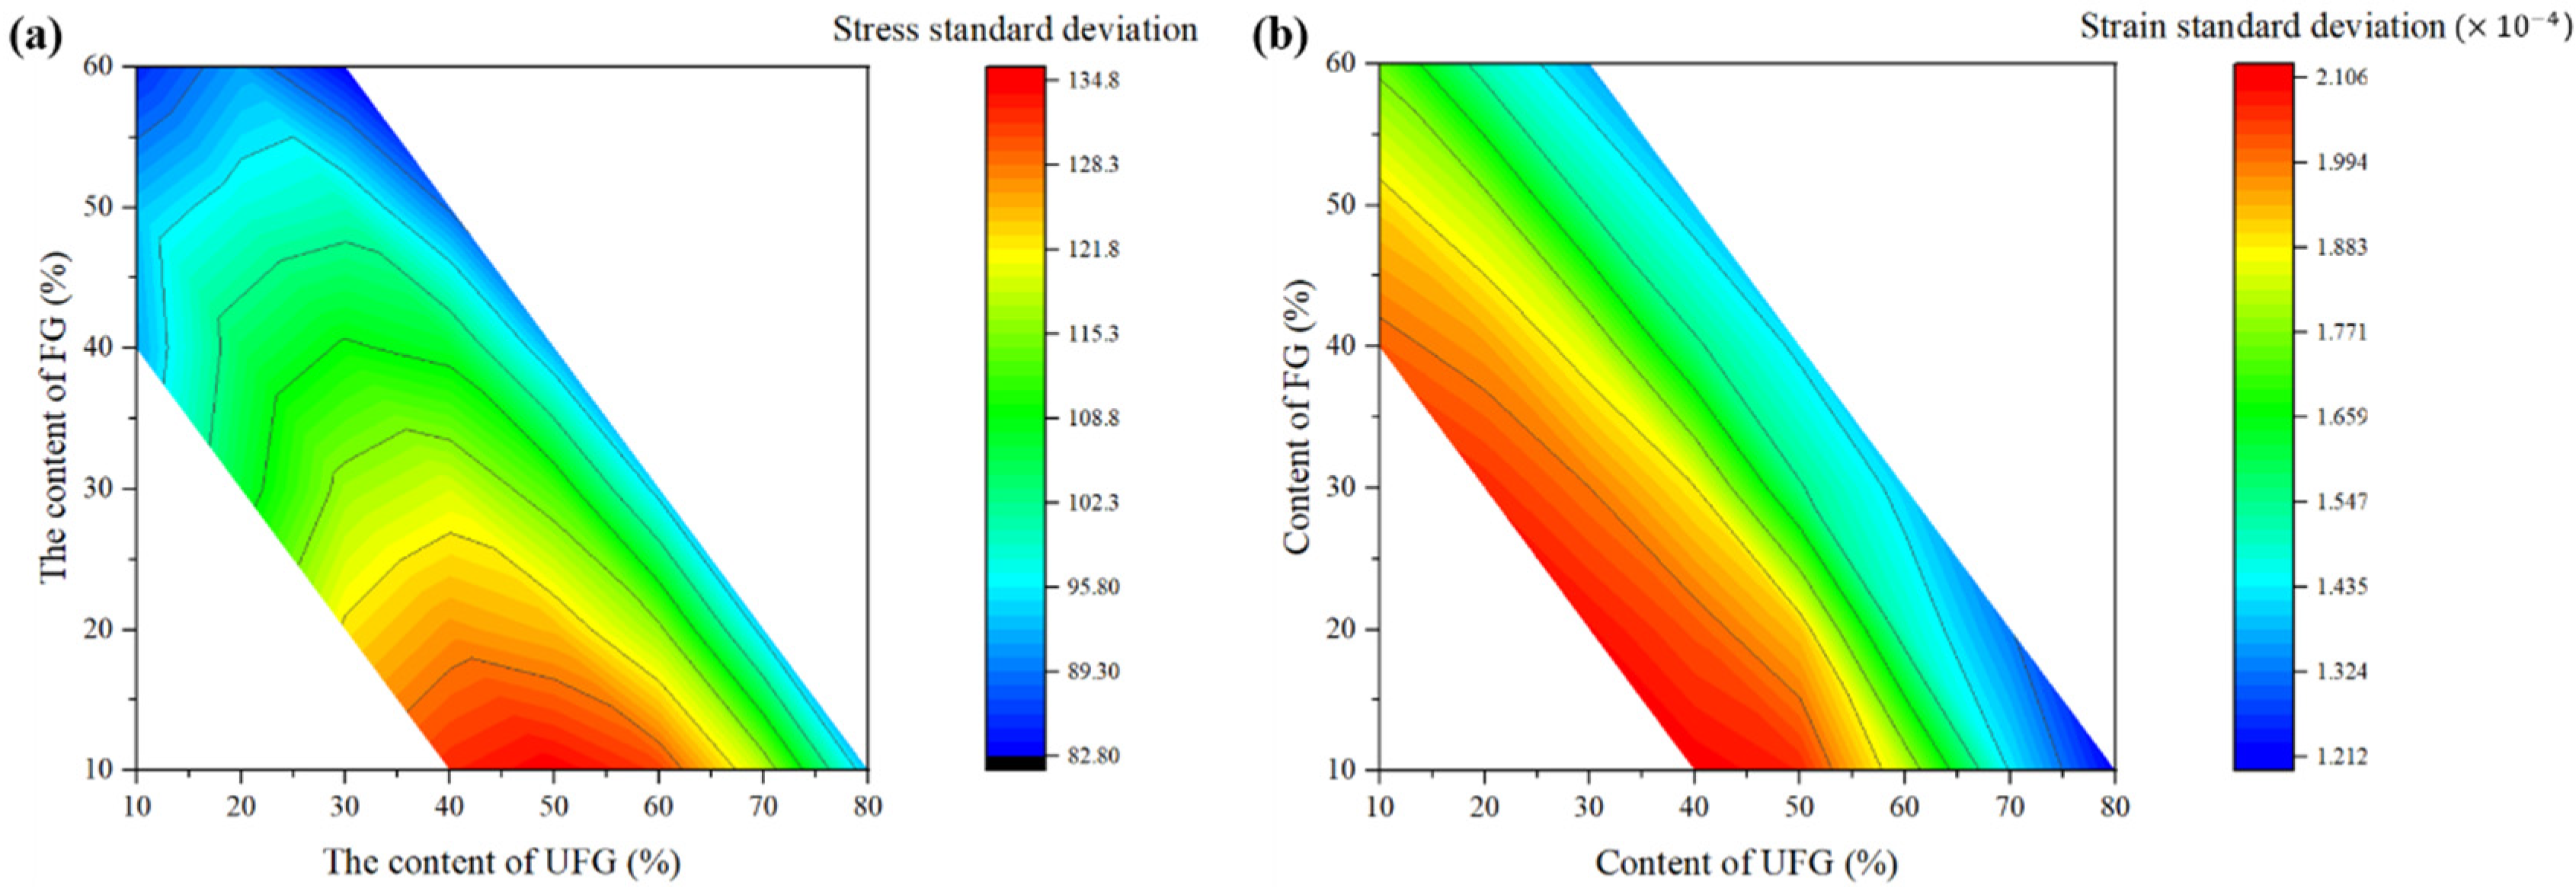
As demonstrated in Figure 9a, an increase in the standard deviation of stress correlates with a more uneven stress distribution within the microstructure. The following conclusions can be inferred: (i) With a constant UFG volume fraction, the lower the volume fraction of the FG, the more pronounced the stress concentration becomes. (ii) With a fixed FG volume fraction, the higher the volume fraction of the UFG, the more uniform the local stress distribution in the microstructure. (iii) Conversely, with a constant CG volume fraction, the larger the UFG volume fraction, the greater the stress at the boundary of the heterogeneous domain.
The standard deviation of strain, as depicted in Figure 9b, highlights the following issues: (i) With a constant UFG volume fraction, the strain exceeds the average as the FG volume fraction increases. Closer FG and CG volume fractions result in a smoother strain transition. (ii) Conversely, with a constant FG volume fraction, an increase in UFG volume fraction causes the strain to exceed the average. (iii) Additionally, when the CG volume fraction is fixed, increasing the UFG volume fraction results in the strain exceeding the average.
Similar volume fractions of FG and CG can mitigate the strain gradient at the heterogeneous interface, thereby reducing the risk of damage due to stress concentration. However, an increased volume fraction of UFG is likely to cause excessive local strain, leading to a greater strain gradient at the interface.

5.2. Discussion of the Strengthening Mechanism

The exceptional mechanical performance of TGS composites is attributed to their unique microstructure design and deformation mechanisms. To understand the underlying mechanisms of work hardening in TGS composites, this study conducted a detailed examination of how morphological and microstructural evolutions influence their mechanical responses, with extensive discussions of the findings.

5.2.1. Effect of Domain Volume Fractions on SSDs

Figure 9a displays the distribution of SSDs, indicating that ρ S S D gradually increases from FG and CG to UFG, with peaks observed at the interfaces between FG and UFG, and CG and UFG. The analysis is based on the statistical dislocation density distribution depicted in Figure 10a and the standard deviation of the solid-state distribution presented in Figure 10b. When the UFG volume fraction is maintained constant, an increase in the CG volume fraction leads to a rise in ρ S S D near CG and an enhancement in its average value. With the FG volume fraction held constant, an increase in the CG volume fraction similarly results in an elevated average value of ρ S S D . When the CG volume fraction is set at 0.5, an increment in the FG volume fraction results in an increased ρ S S D near CG.

5.2.2. Effect of Domain Volume Fraction on GNDs

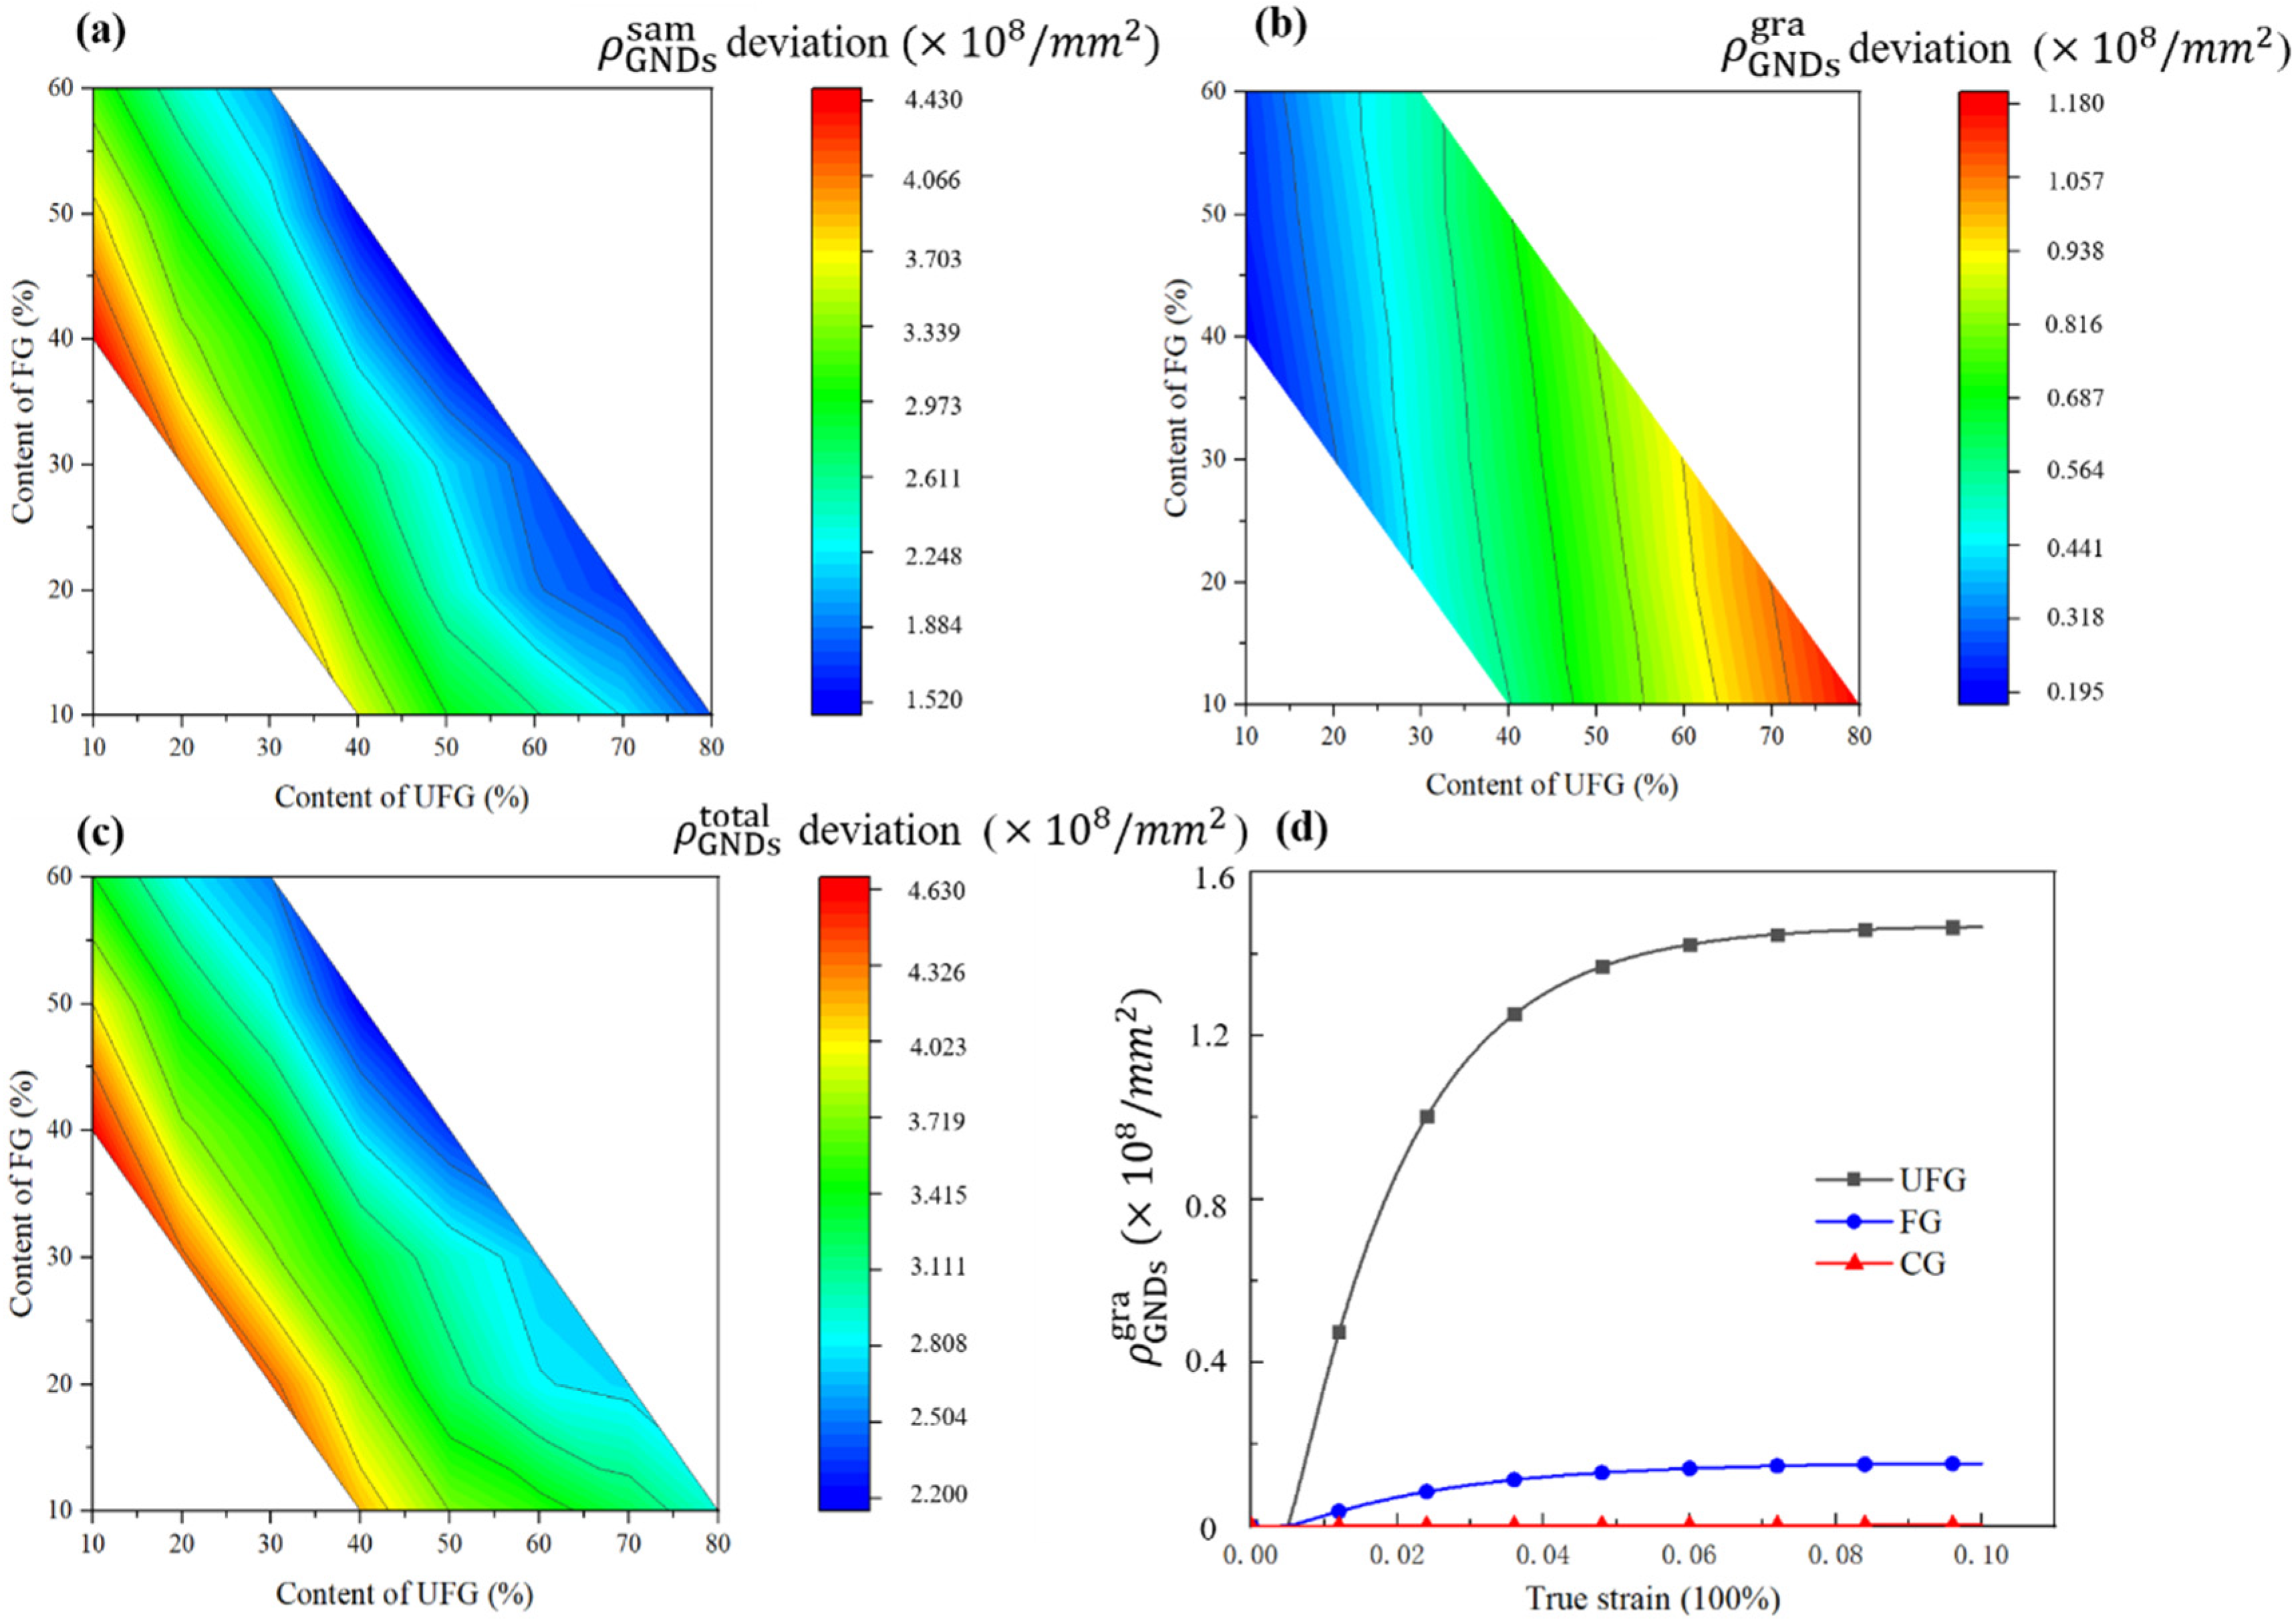
Figure 11 depicts the density distribution of GNDs in selected cloud images, indicating that an increase in CG volume fraction improves both the overall ρ G N D s s a m and the distribution of the dislocation gradient. Figure 11 does not clearly reveal the effects of an increased FG volume fraction; these effects will be elaborated in the subsequent section. Following the addition of FG, distribution uniformity improves from CG to FG and UFG, with notable peaks at the interfaces between FG and UFG, and between CG and UFG, and there are obvious interface influence zones. This suggests that the softer domains, constrained by the harder surrounding domains, undergo plastic deformation. The accumulation of GNDs near domain boundaries impedes dislocation movement, and the Taylor strengthening and back stress strengthening effects are formed in the soft domain, significantly hardening these softer regions.
Figure 12 illustrates the relationship between the average density of GNDs and the volume fractions of each domain. (i) With a constant UFG volume fraction, ρ G N D s s a m   increases as the CG volume fraction increases, with high-density areas primarily concentrated near the CG boundaries, aligning with the structures observed in Figure 5a. (ii) With the FG volume fraction held constant, ρ G N D s s a m continues to rise as the UFG volume fraction decreases. Figure 12b shows that ρ G N D s g r a reaches its maximum when the volume fraction of UFG is at its highest and that of FG is at its lowest. This indicates that the increase in ρ G N D s g r a is related to the large difference in grain size. Figure 12c demonstrates that when the FG volume fraction is 0.4, the UFG volume fraction is 0.1, and the CG volume fraction is 0.5, ρ G N D s t o t a l reaches its peak.

5.2.3. GNDs Evolution at Microstructure Boundary

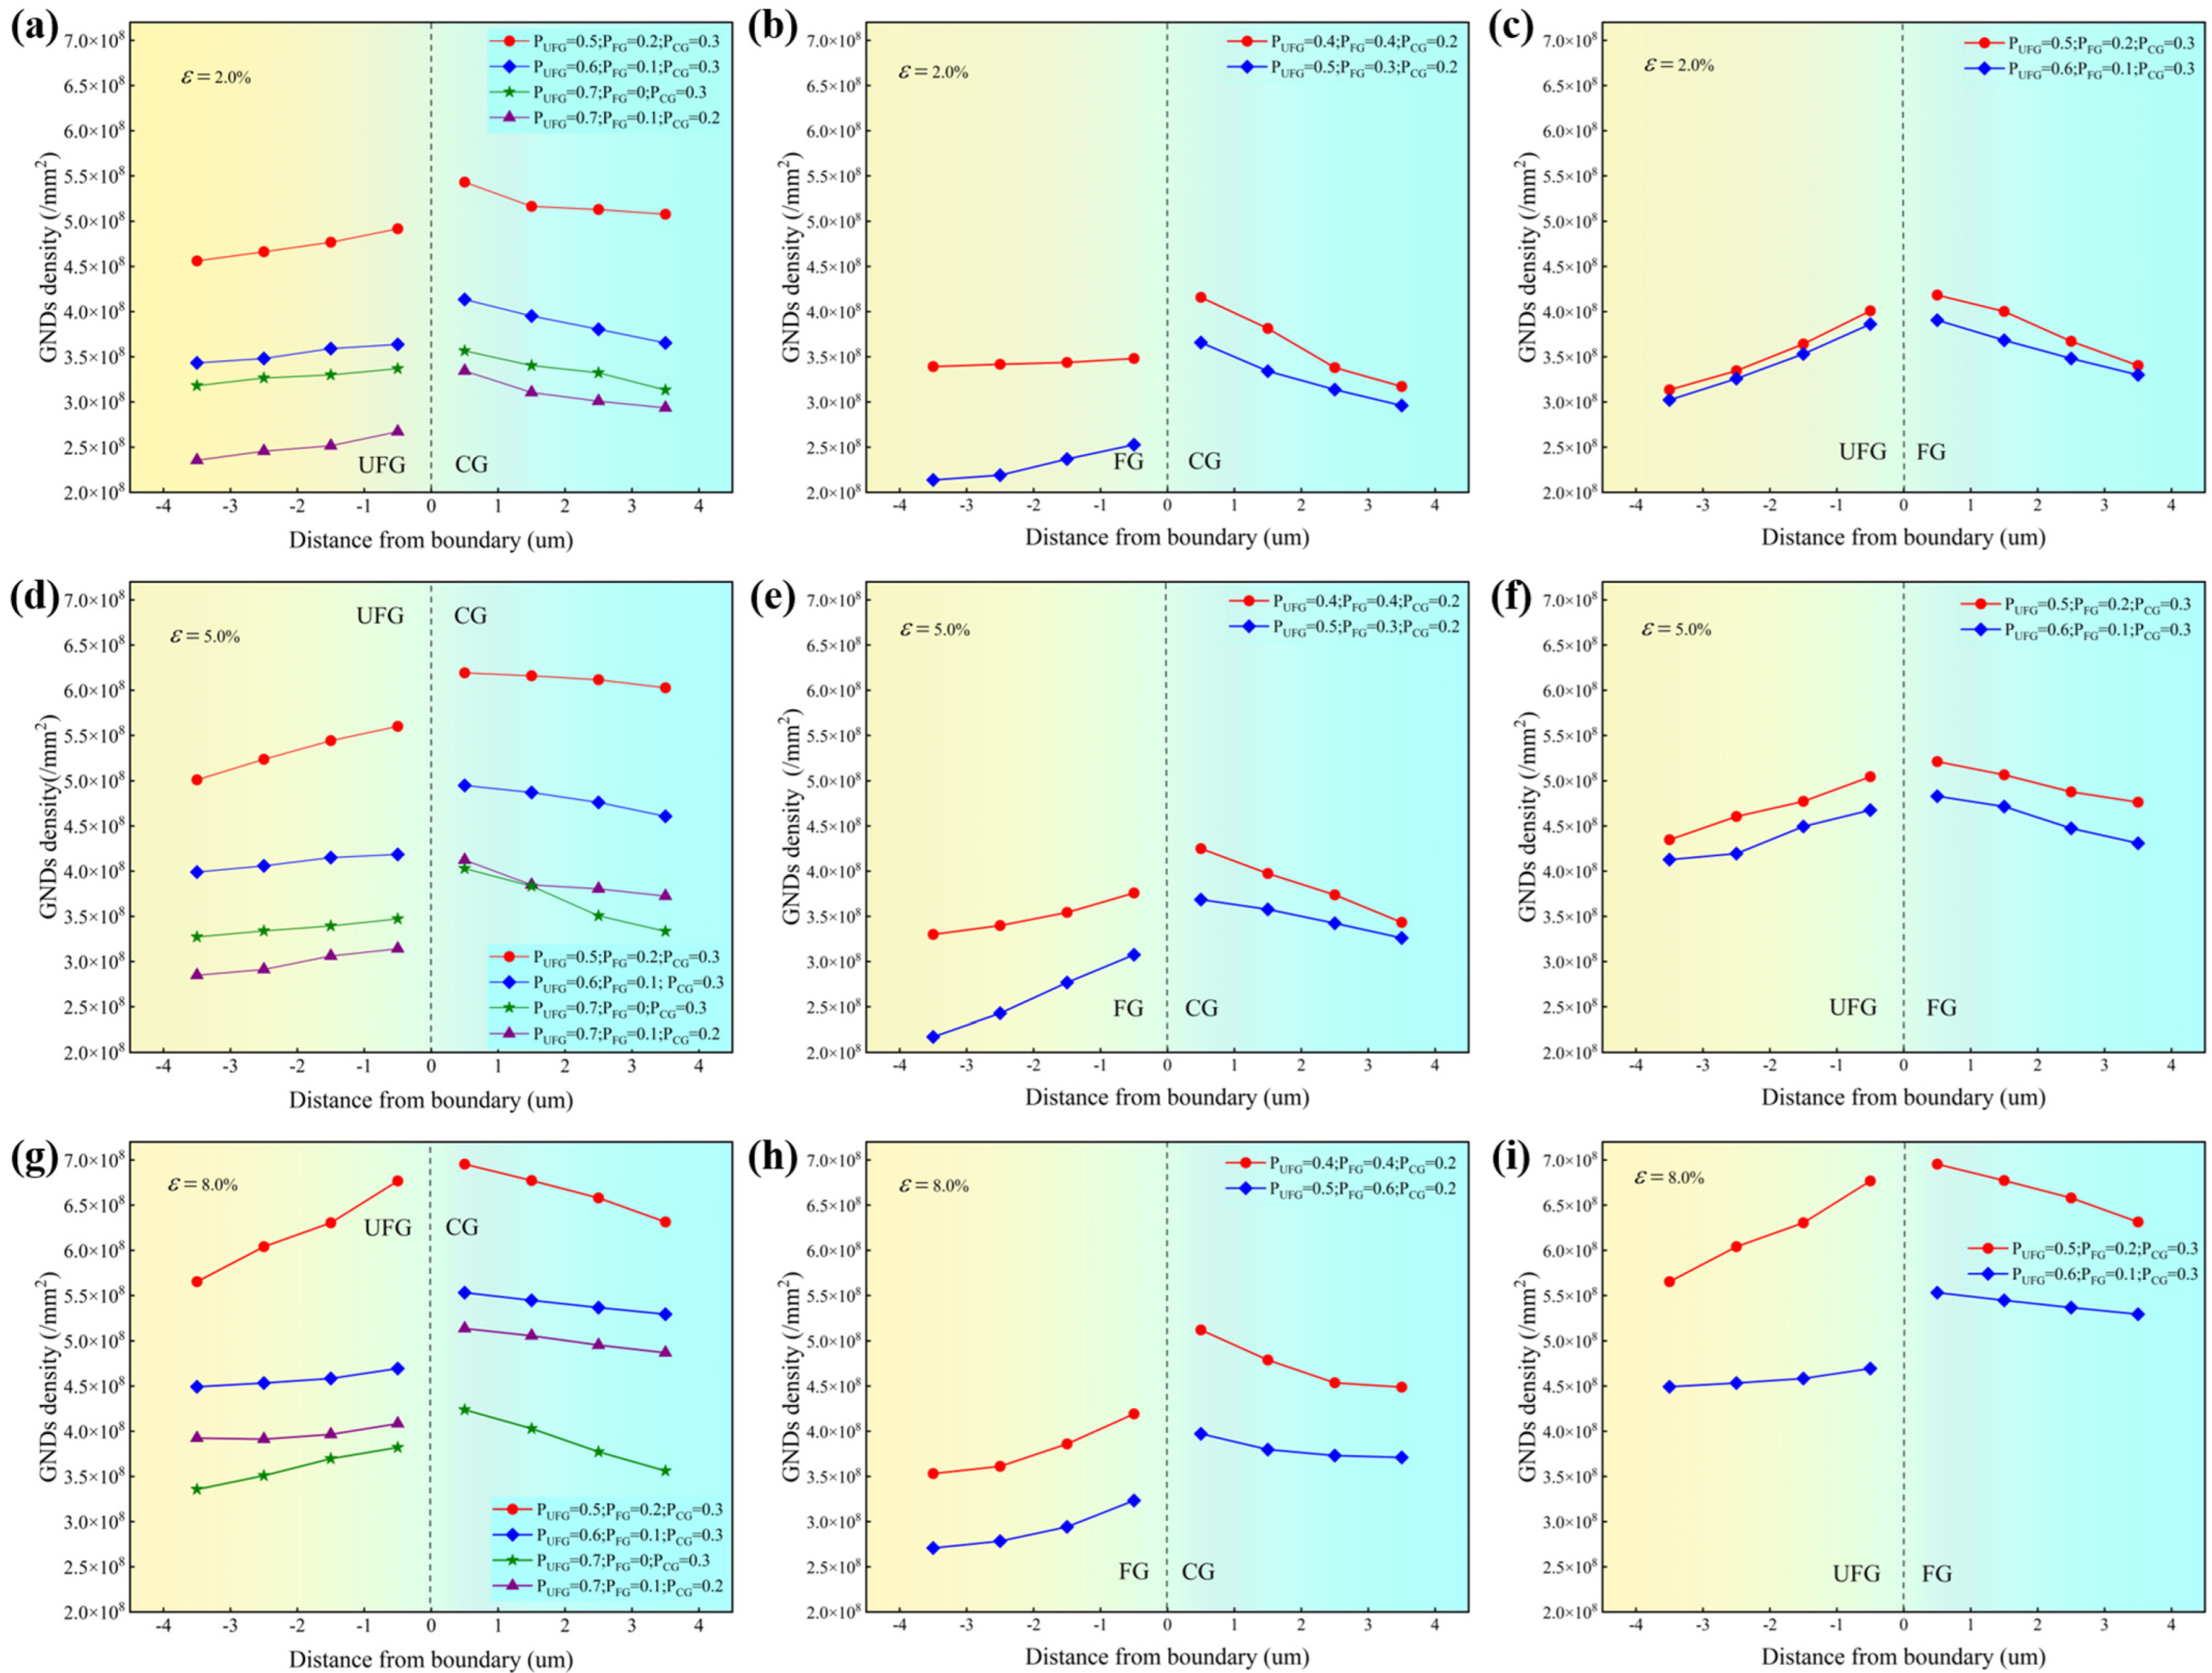
To further investigate the mechanism of dislocation density evolution, GND densities along six different paths adjacent to the same phase boundary were compared, and their average values were computed to explore the relationship between GND density and the volume fractions of FG and CG, as shown in Figure 13.
In the TGS composites model, maintaining constant strain and CG volume fraction, an increase in FG volume fraction results in a heightened peak of GNDs within the boundary zones of CG-FG and FG-UFG. The boundary density diagram of UFG-CG suggests that an increase in FG volume fraction elevates the proportion of individual FG boundaries within UFG. This, coupled with the boundary influence, results in greater GND accumulation at the UFG-CG boundaries. Similarly, a rise in FG volume fraction leads to an enhanced density of GNDs at the UFG-FG and FG-CG boundary domains. Notably, under similar CG volume fractions, increasing strain results in a higher rate of boundary dislocation density accumulation within UFG-CG containing FG compared to UFG-CG without FG. This suggests that FG stabilizes the dislocation structure and enhances dislocation storage capacity during strain hardening.
As strain increased, we observed varying degrees of GND accumulation at different boundary positions, as shown in Figure 14. GND densities at the CG-FG, CG-UFG, and FG-UFG boundaries were quantified under plastic strains of 2% (low), 5% (medium), and 8% (high). Notably, the increase in GND densities at the CG-UFG boundaries in the TGS composites was significantly greater compared to those in the BGS composites without FG. This observation substantiates the beneficial impact of FG addition on the accumulation of boundary dislocations in CG-UFG.
Examination of GND density maps across various boundary regions clearly demonstrated GND accumulation along the boundaries, irrespective of whether they were CG-FG, CG-UFG, or FG-UFG boundaries. This phenomenon is attributable to mechanical incompatibility between the relatively hard and soft domains under increasing strain. To maintain material continuity, a greater volume of GNDs is generated within the soft domain, which deforms in concert with the adjacent hard domain. However, these GNDs cannot traverse the boundaries and instead accumulate at these locations. This mechanism also indicates that TGS, as a three-domain multimodal composite, features an increased number of boundaries to accommodate more GNDs. Consequently, the overall strain capacity, as depicted in Figure 8, is enhanced, leading to improved strain hardening behavior.

5.2.4. Effect of Domain Volume Fraction on Back Stress

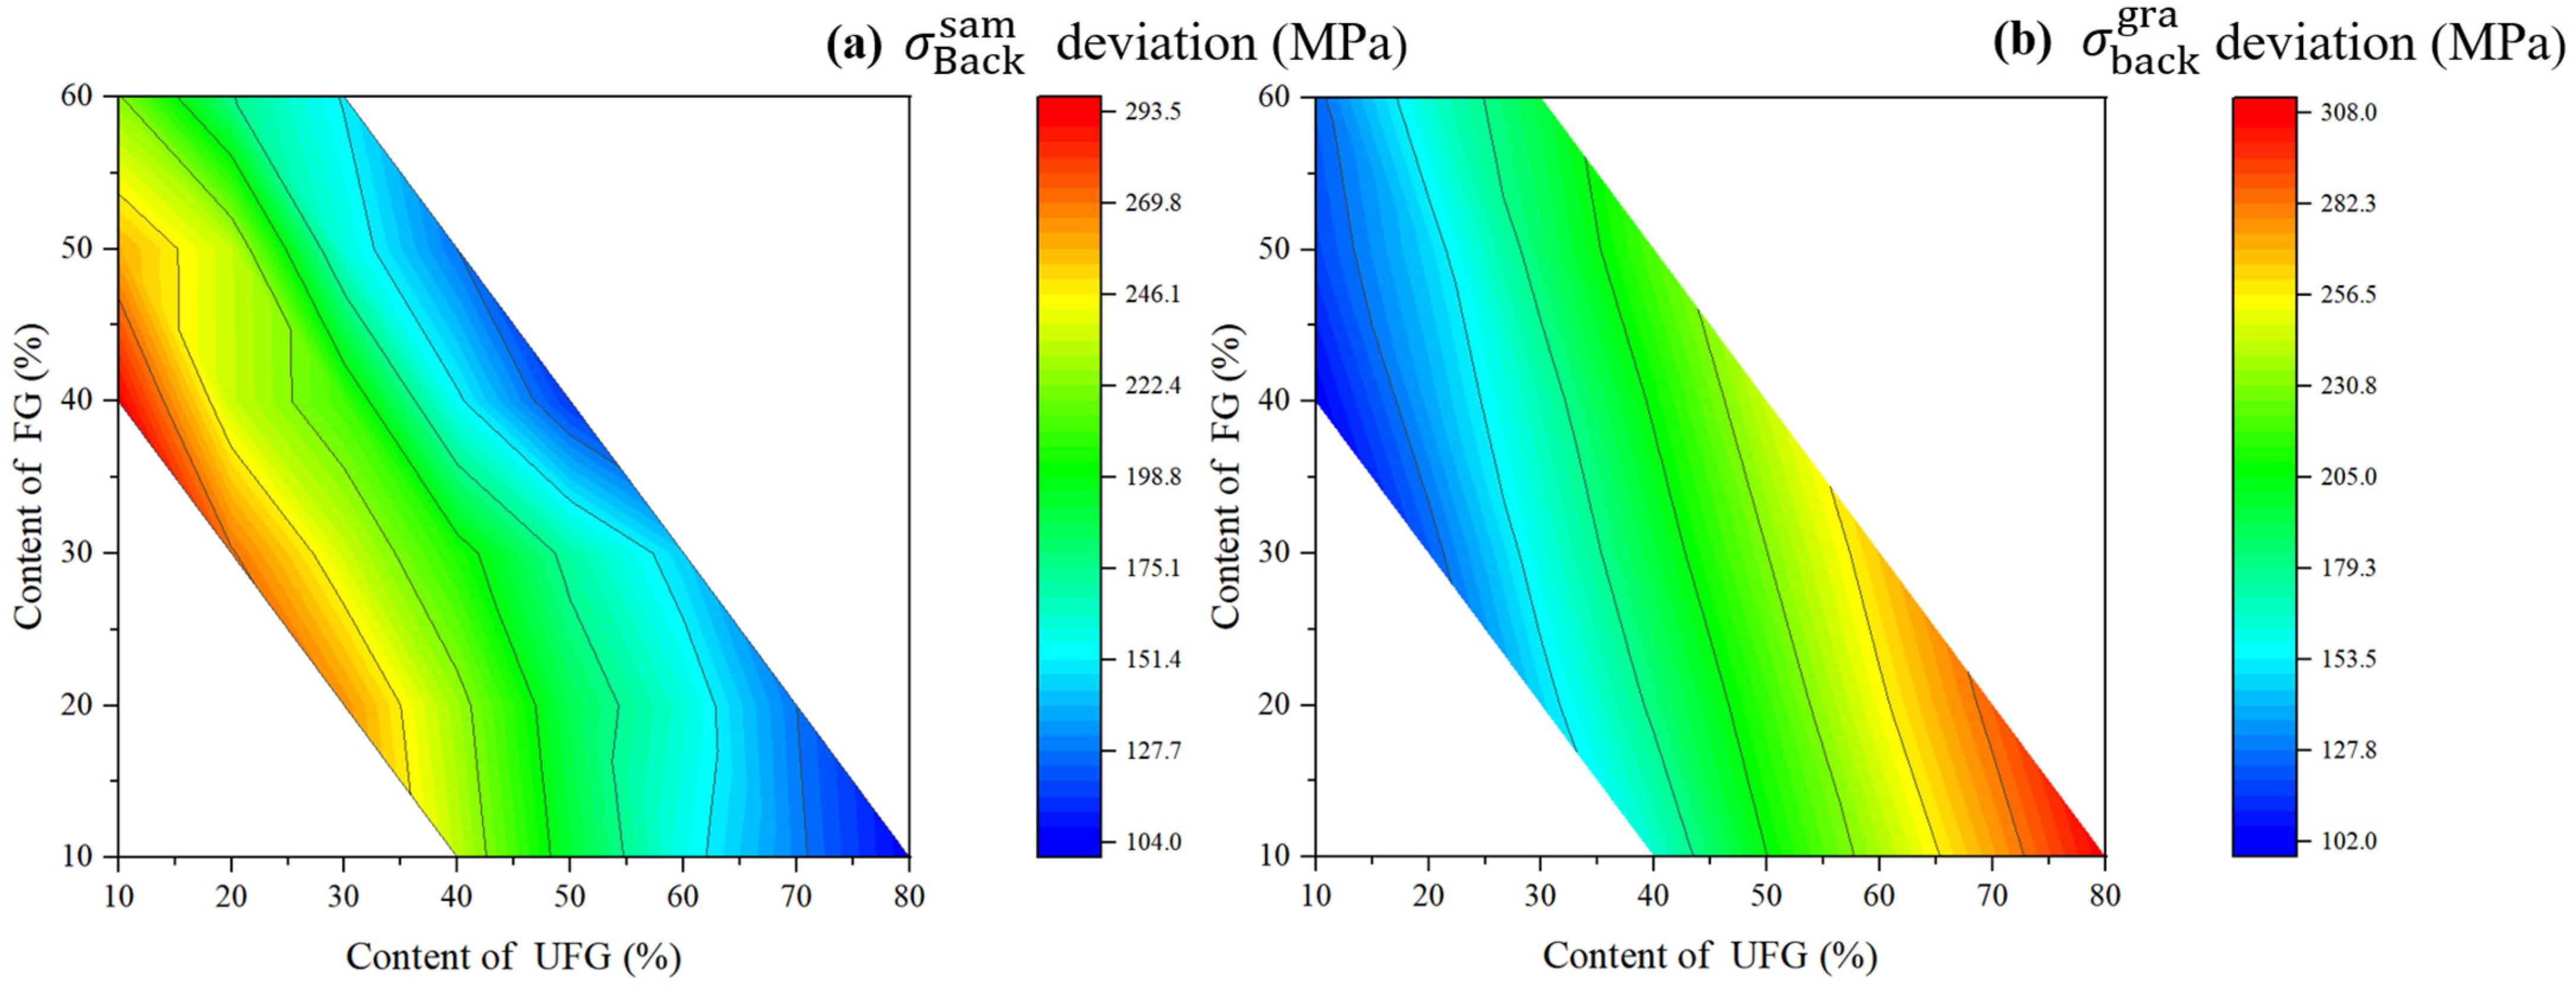
Smaller grain sizes are associated with greater back stress in the initial deformation stage. Figure 6b reveals that the back stress of UFG is approximately 330 MPa higher than that of CG and about 220 MPa higher than FG, indicating that UFG contributes to additional strain hardening through increased back stress. Therefore, grain size has an effect on strain hardening behavior and initial yield stress. Figure 15 demonstrates how σ B a c k s a m and σ B a c k g r a vary with the volume fraction of each domain. In Figure 15, the maximum σ B a c k s a m value approaches 400 MPa, with UFG and FG exhibiting 146 MPa and 38 MPa, respectively. A comparison between Figure 15 and Figure 10 shows a similarity in the distribution patterns of σ B a c k g r a and ρ G N D s g r a , consistent with the structural description provided. This phenomenon is governed by the number of stacked dislocations, as detailed in Equations (19) and (15). The above analysis concludes that UFG influences the strain hardening rate sensitivity of the TGS composites, CG affects the overall ductility, and an optimal FG volume fraction effectively coordinates the mechanical properties of TGS.
The mean back stress, as illustrated in Figure 16, was calculated. When the FG volume fractions were held constant, the average value of σ B a c k s a m increased with an increase in CG volume fractions, whereas the average value of σ B a c k g r a decreased. When the CG volume fractions were held constant, the mean back stress initially increases and then decreases as the FG volume fractions increase.

5.3. Strengthening Mechanism of TGS Composites

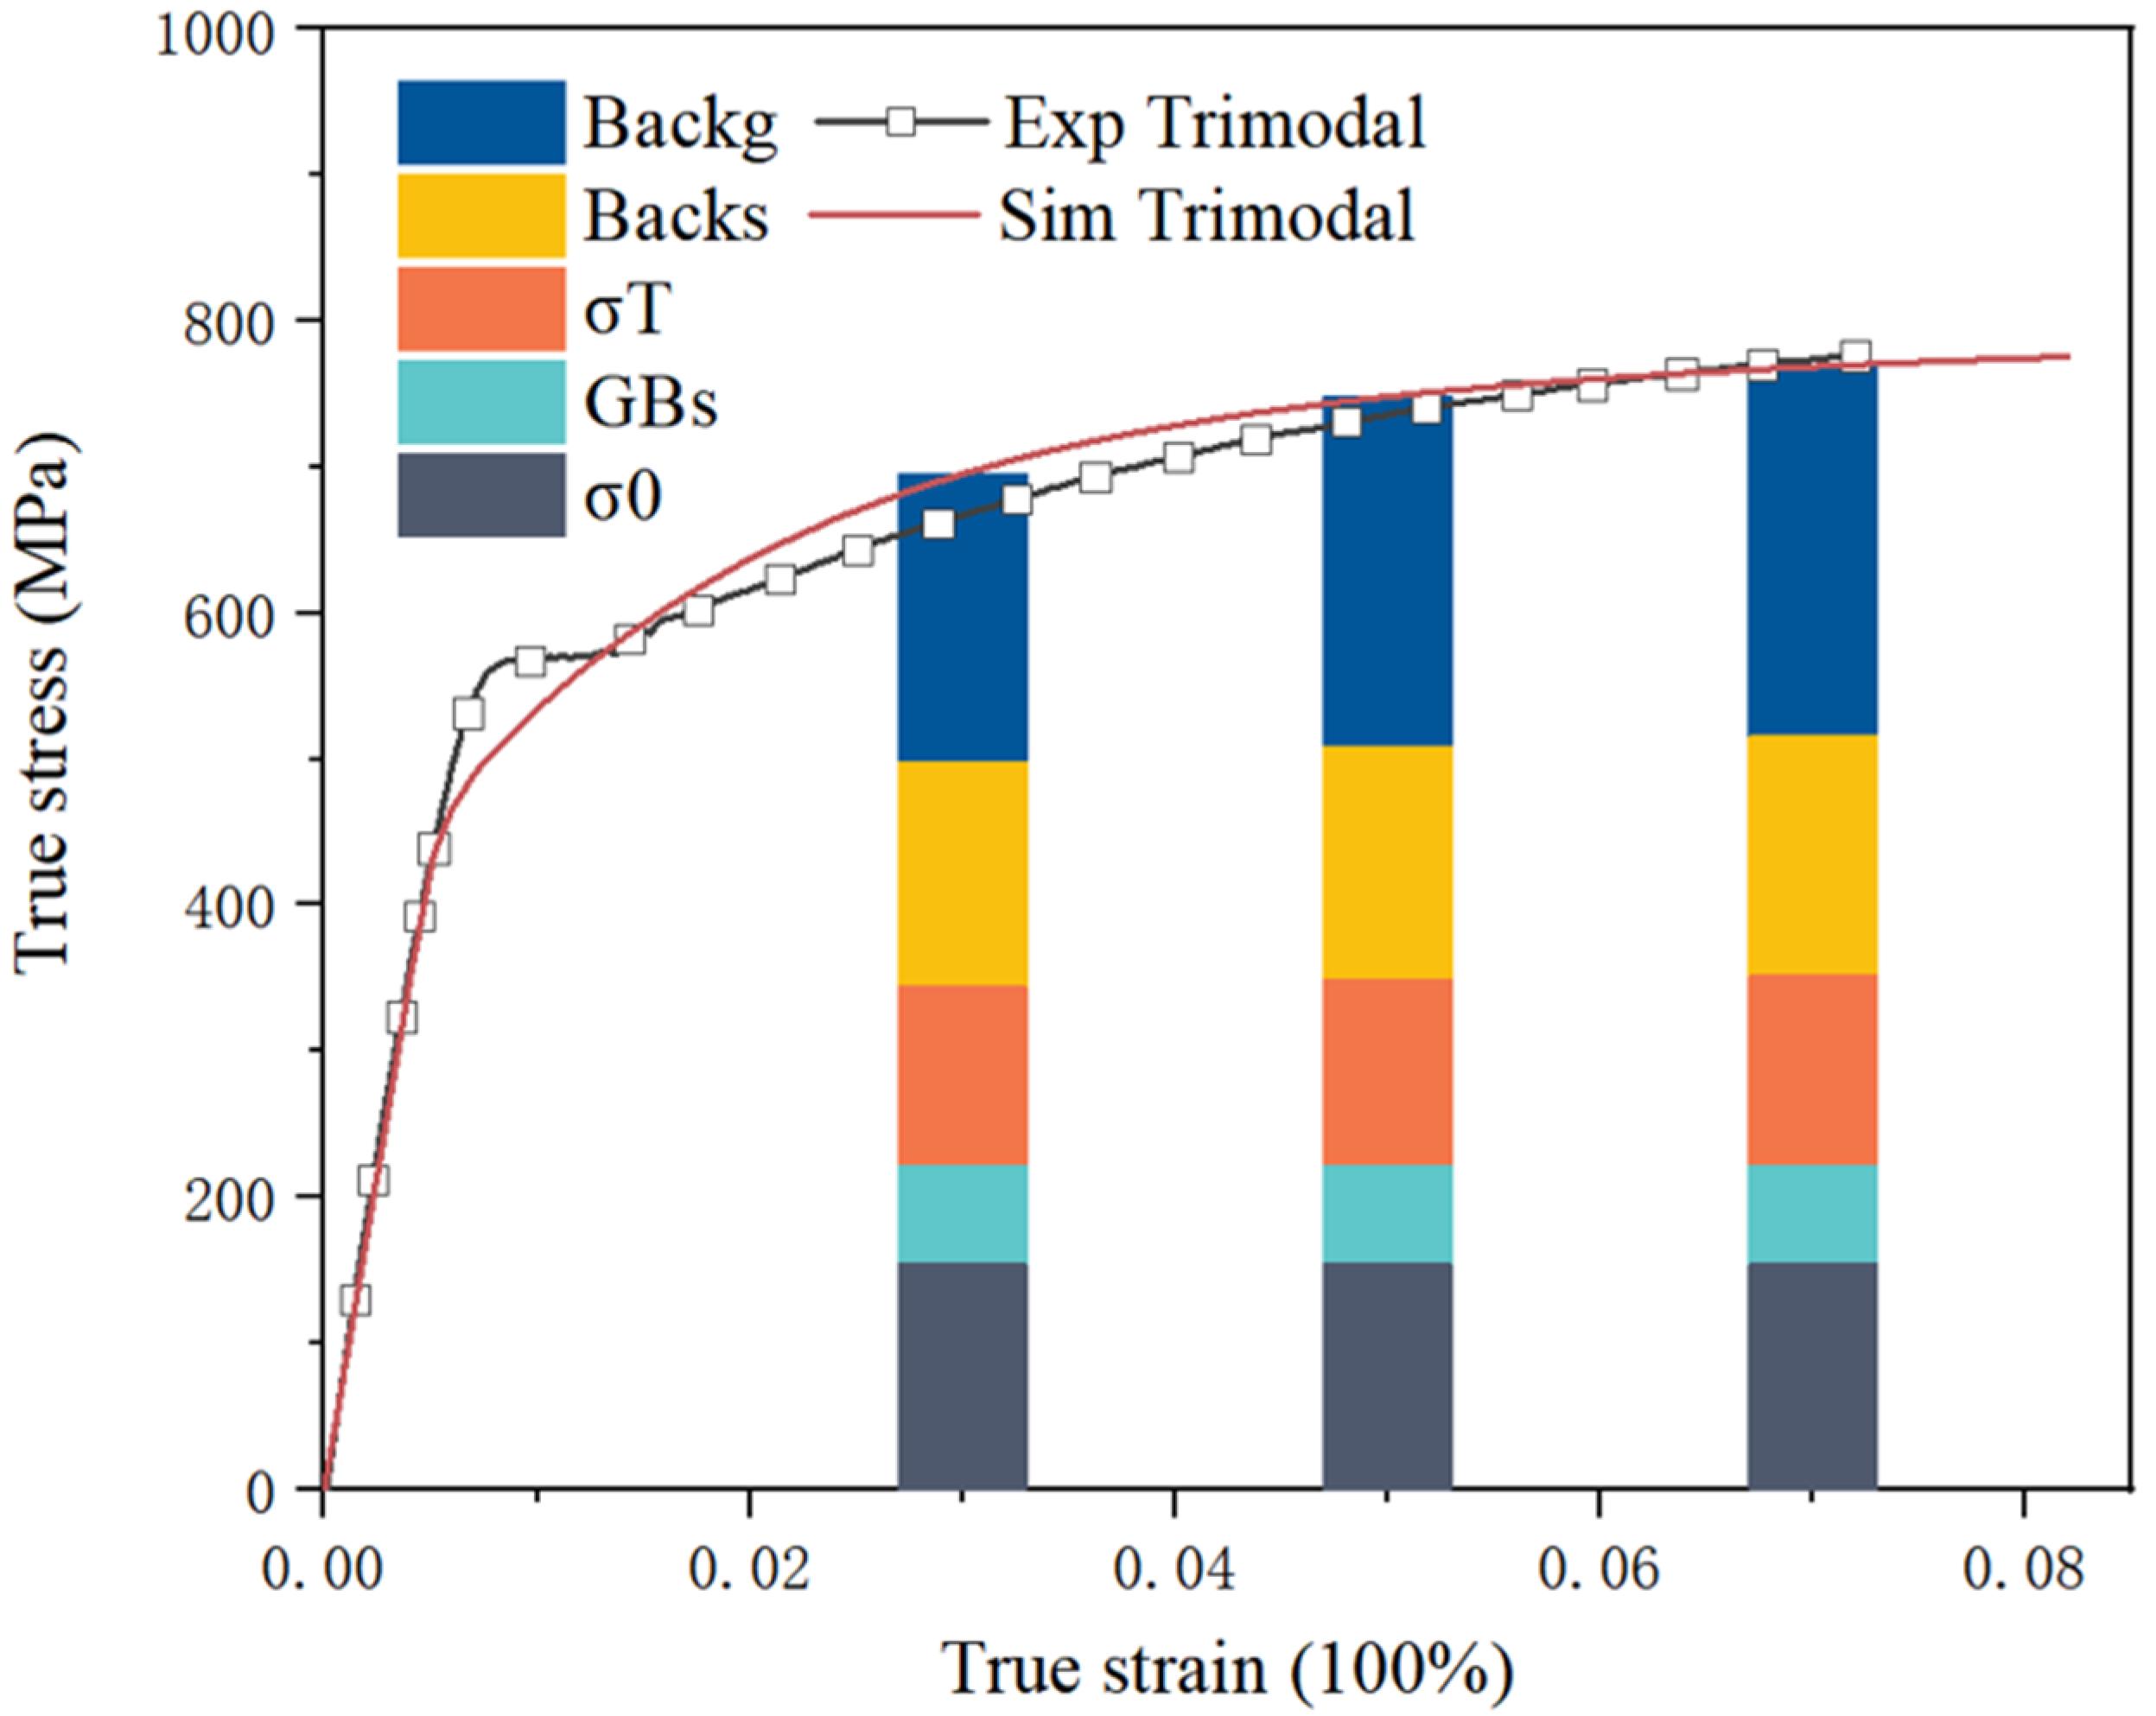
The variation of the flow stress of σ T , σ B a c k s a m , and σ B a c k g r a with strain is shown in Figure 17. And Figure 17 illustrates how the flow stresses of σ T , σ B a c k s a m , and σ B a c k g r a vary with strain. At a true strain of 8%, the flow stress from σ T , reaches 129.4 MPa, with ρ G N D s g r a , ρ G N D s s a m , and ρ S S D s contributing 24.2%, 50.2%, and 25.6% to the total dislocation density, respectively. The results indicate that at a real strain of 8%, the flow stress attributed to σ B a c k s a m is 160.4 MPa. At a true strain of 3%, σ B a c k g r a increases to 217.2 MPa. At a true strain of 8%, σ B a c k g r a rises to 253.6 MPa. Back stress significantly influences the flow stress of TGS composites. Assuming a constant grain size during deformation, the contribution of grain boundaries (GBs) to stress remains at approximately 67.7 MPa. It is noteworthy that in unidirectional tensile tests, the hardening effect of back stress in TGS composites exceeds the softening effect of forward stress, indicating that the HDI stress should exhibit an increasing trend with back stress.

6. Conclusions

This study investigated and discussed the strengthening mechanisms in TGS composites, including Hall–Petch, Taylor, and back stress strengthening, utilizing the developed multi-mechanism strain gradient theory. Additionally, the mechanical responses of TGS composites were predicted by considering their microstructural morphologies. The main conclusions of this study are summarized as follows:
(1)
The impact of changes in the three-domain volume fraction on stress–strain distribution was studied. The CG volume fraction was found to have the most significant effect among the three domains. When the CG volume fraction is held constant, the stress–strain distribution becomes more uniform with an increase in FG volume fraction. The incorporation of hard domains (FG and UFG) into soft domains (CG) facilitates significant strain distribution. However, it is noteworthy that the continuous distribution of the soft domain (CG) allows the material to yield under lower stresses.
(2)
The variation of boundary GNDs during plastic deformation is analyzed in detail. Our findings indicate that, within a certain range, an increase in FG volume fraction results in a higher accumulation rate of boundary GNDs compared to an increase in CG volume fraction. Furthermore, as the tensile strain increases, the accumulation rate of boundary dislocations attributed to both FG and CG also increases gradually. In order to counteract the strain gradient produced by continuous plastic deformation, back stress–strain hardening develops, enhancing the plasticity of TGS.
(3)
This study explains the evolution of back stress with variations in domain volume fraction. The accumulation of GNDs at boundaries contributes to the development of back stress. When the volume fraction of the CG domain remains constant, the FG domain exhibits the most significant impact on back stress. As the FG volume fraction increases, the average back stress initially rises and subsequently falls. Concurrently, back stress serves as an additional stress to overcome, leading to enhanced strain hardening and improved ductility. Furthermore, the FG domain augments the stress-bearing capacity of the UFG domain, thereby contributing to the heightened plasticity and strength of TGS materials.
(4)
This study quantified the contributions of Taylor strengthening and back stress to the overall stress–strain response of TGS composites. The analysis shows that back stress, induced by the accumulation of GNDs, significantly contributes to the strain hardening of TGS composites, accounting for 76.3% of the overall effect. This significant contribution is attributed to the enhanced work-hardening capacity of back stress, facilitated by the high interfacial density within the composite.

Author Contributions

Conceptualization, S.W. and Q.Z.; methodology, S.W. and Q.Z.; software, S.W., Q.Z. and X.L.; validation, S.W. and Q.Z.; formal analysis, S.W.; investigation, S.W.; resources, Z.Y.; data curation, S.W.; writing—original draft preparation, S.W. and Q.Z.; writing—review and editing, Z.Y., Z.L., W.L. and F.S.; visualization, H.B. and W.L.; supervision, W.L.; project administration, Z.Y.; funding acquisition, Z.Y. All authors have read and agreed to the published version of the manuscript.

Funding

This work was supported by the National Key Research and Development Program of China (2022YFB3707401), National Natural Science Foundation of China (Nos. 52175337 and 52192591), and the Key Research and Development Program of Shandong province (2021SFGC001).

Data Availability Statement

Data are available on request due to privacy/ethical restrictions. The data that support the findings of this study are available on request from the corresponding author.

Conflicts of Interest

The authors declare no conflict of interest.

References

  1. Yang, M.; Yan, D.; Yuan, F.; Jiang, P.; Ma, E.; Wu, X. Dynamically reinforced heterogeneous grain structure prolongs ductility in a medium-entropy alloy with gigapascal yield strength. Proc. Natl. Acad. Sci. USA 2018, 115, 7224–7229. [Google Scholar] [CrossRef] [PubMed]
  2. Wu, X.; Yang, M.; Yuan, F.; Wu, G.; Wei, Y.; Huang, X.; Zhu, Y. Heterogeneous lamella structure unites ultrafine-grain strength with coarse-grain ductility. Proc. Natl. Acad. Sci. USA 2015, 112, 14501–14505. [Google Scholar] [CrossRef] [PubMed]
  3. Jiang, L.; Ma, K.; Yang, H.; Li, M.; Lavernia, E.J.; Schoenung, J.M. The Microstructural Design of Trimodal Aluminum Composites. Jom 2014, 66, 898–908. [Google Scholar] [CrossRef]
  4. Zhu, Y.; Wu, X. Heterostructured materials. Prog. Mater. Sci. 2023, 131, 101019. [Google Scholar]
  5. Fu, X.; Tan, Z.; Ma, Z.; Li, Z.; Fan, G.; Xiong, D.-B.; Li, Z. Powder assembly & alloying to CNT/Al-Cu-Mg composites with trimodal grain structure and strength-ductility synergy. Compos. Part B-Eng. 2021, 225, 109271. [Google Scholar]
  6. Liu, Z.Y.; Ma, K.; Fan, G.H.; Zhao, K.; Zhang, J.F.; Xiao, B.L.; Ma, Z. Enhancement of the strength-ductility relationship for carbon nanotube/Al-Cu-Mg nanocomposites by material parameter optimisation. Carbon 2020, 157, 602–613. [Google Scholar] [CrossRef]
  7. Fu, X.; Tan, Z.; Min, X.; Li, Z.; Yue, Z.; Fan, G.; Xiong, D.-B.; Li, Z. Trimodal grain structure enables high-strength CNT/Al-Cu-Mg composites higher ductility by powder assembly & alloying. Mater. Res. Lett. 2021, 9, 50–57. [Google Scholar]
  8. Su, J.; Raabe, D.; Li, Z. Hierarchical microstructure design to tune the mechanical behavior of an interstitial TRIP-TWIP high-entropy alloy. Acta Mater. 2019, 163, 40–54. [Google Scholar] [CrossRef]
  9. Shao, C.W.; Zhang, P.; Zhu, Y.K.; Zhang, Z.J.; Tian, Y.Z.; Zhang, Z.F. Simultaneous improvement of strength and plasticity: Additional work-hardening from gradient microstructure. Acta Mater. 2018, 145, 413–428. [Google Scholar] [CrossRef]
  10. Lyu, H.; Hamid, M.; Ruimi, A.; Zbib, H.M. Stress/strain gradient plasticity model for size effects in heterogeneous nano-microstructures. International Journal of Plasticity 2017, 97, 46–63. [Google Scholar] [CrossRef]
  11. Zhao, J.; Lu, X.; Yuan, F.; Kan, Q.; Qu, S.; Kang, G.; Zhang, X. Multiple mechanism based constitutive modeling of gradient nanograined material. Int. J. Plast. 2020, 125, 314–330. [Google Scholar] [CrossRef]
  12. Hamid, M.; Lyu, H.; Zbib, H. A dislocation-based stress-strain gradient plasticity model for strength and ductility in materials with gradient microstructures. Philos. Mag. 2018, 98, 2896–2916. [Google Scholar] [CrossRef]
  13. Bi, S.; Liu, Z.Y.; Xiao, B.L.; Xue, P.; Wang, D.; Wang, Q.Z.; Ni, D.R.; Ma, Z.Y. Different fatigue behavior between tension-tension and tension-compression of carbon nanotubes reinforced 7055 Al composite with bimodal structure. Carbon 2021, 184, 364–374. [Google Scholar] [CrossRef]
  14. Ma, K.; Li, X.N.; Liu, K.; Chen, X.G.; Liu, Z.Y.; Xiao, B.L.; Ma, Z. Improving the high-cycle fatigue strength of heterogeneous carbon nanotube/Al-Cu-Mg composites through grain size design in ductile-zones. Compos. Part B-Eng. 2021, 222, 109094. [Google Scholar] [CrossRef]
  15. Yang, H.; Topping, T.D.; Wehage, K.; Jiang, L.; Lavernia, E.J.; Schoenung, J.M. Tensile behavior and strengthening mechanisms in a submicron B4C-reinforced Al trimodal composite. Mater. Sci. Eng. A-Struct. Mater. Prop. Microstruct. Process. 2014, 616, 35–43. [Google Scholar] [CrossRef]
  16. Wu, X.; Zhu, Y. Heterogeneous materials: A new class of materials with unprecedented mechanical properties. Mater. Res. Lett. 2017, 5, 527–532. [Google Scholar] [CrossRef]
  17. Azizi, R.; Niordson, C.F.; Legarth, B.N. On the homogenization of metal matrix composites using strain gradient plasticity. Acta Mech. Sin. 2014, 30, 175–190. [Google Scholar] [CrossRef]
  18. Zhu, L.; Shi, S.; Lu, K.; Lu, J. A statistical model for predicting the mechanical properties of nanostructured metals with bimodal grain size distribution. Acta Mater. 2012, 60, 5762–5772. [Google Scholar] [CrossRef]
  19. Wu, C.; Shi, R.; Luo, G.; Zhang, J.; Shen, Q.; Gan, Z.; Liu, J.; Zhang, L. Influence of particulate B4C with high weight fraction on microstructure and mechanical behavior of an Al-based metal matrix composite. J. Alloys Compd. 2019, 789, 825–833. [Google Scholar] [CrossRef]
  20. Zhu, Y.; Ameyama, K.; Anderson, P.M.; Beyerlein, I.J.; Gao, H.; Kim, H.S.; Lavernia, E.; Mathaudhu, S.; Mughrabi, H.; Ritchie, R.O.; et al. Heterostructured materials: Superior properties from hetero-zone interaction. Mater. Res. Lett. 2021, 9, 1–31. [Google Scholar] [CrossRef]
  21. Wang, Y.; Zhu, Y.; Yu, Z.; Zhao, J.; Wei, Y. Hetero-zone boundary affected region: A primary microstructural factor controlling extra work hardening in heterostructure. Acta Mater. 2022, 241, 118395. [Google Scholar] [CrossRef]
  22. Zhang, X.; Zhao, J.; Kang, G.; Zaiser, M. Geometrically necessary dislocations and related kinematic hardening in gradient grained materials: A nonlocal crystal plasticity study. Int. J. Plast. 2023, 163, 103553. [Google Scholar] [CrossRef]
  23. Li, J.; Weng, G.J.; Chen, S.; Wu, X. On strain hardening mechanism in gradient nanostructures. Int. J. Plast. 2017, 88, 89–107. [Google Scholar] [CrossRef]
  24. Li, J.; Lu, W.; Chen, S.; Liu, C. Revealing extra strengthening and strain hardening in heterogeneous two-phase nanostructures. Int. J. Plast. 2020, 126, 102626. [Google Scholar] [CrossRef]
  25. Zhang, Y.; Chen, H.; Jia, Y.-F.; Li, D.-F.; Yuan, G.-J.; Zhang, X.-C.; Tu, S.-T. A modified kinematic hardening model considering hetero-deformation induced hardening for bimodal structure based on crystal plasticity. Int. J. Mech. Sci. 2021, 191, 106068. [Google Scholar] [CrossRef]
  26. Zhu, Y.; Wu, X. Perspective on hetero-deformation induced (HDI) hardening and back stress. Mater. Res. Lett. 2019, 7, 393–398. [Google Scholar] [CrossRef]
  27. Fu, X.; Yu, Z.; Tan, Z.; Fan, G.; Li, P.; Wang, M.; Xiong, D.-B.; Li, Z. Enhanced strain hardening by bimodal grain structure in carbon nanotube reinforced Al-Mg composites. Mater. Sci. Eng. A-Struct. Mater. Prop. Microstruct. Process. 2021, 803, 140726. [Google Scholar] [CrossRef]
  28. Sadeghi, B.; Cavaliere, P.; Pruncu, C.I. Architecture dependent strengthening mechanisms in graphene/Al heterogeneous lamellar composites. Mater. Charact. 2022, 188, 111913. [Google Scholar] [CrossRef]
  29. Huang, Y.; Qu, S.; Hwang, K.C.; Li, M.; Gao, H. A conventional theory of mechanism-based strain gradient plasticity. Int. J. Plast. 2004, 20, 753–782. [Google Scholar] [CrossRef]
  30. Hill, R. The Mathematical Theory of Plasticity; Oxford Academic: Oxford, UK, 1950. [Google Scholar]
  31. Kok, S.; Beaudoin, A.J.; Tortorelli, D.A. On the development of stage IV hardening using a model based on the mechanical threshold. Acta Mater. 2002, 50, 1653–1667. [Google Scholar] [CrossRef]
  32. Li, J.; Soh, A.K. Modeling of the plastic deformation of nanostructured materials with grain size gradient. Int. J. Plast. 2012, 39, 88–102. [Google Scholar] [CrossRef]
  33. Zhu, L.; Lu, J. Modelling the plastic deformation of nanostructured metals with bimodal grain size distribution. Int. J. Plast. 2012, 30–31, 166–184. [Google Scholar] [CrossRef]
  34. Fang, T.H.; Li, W.L.; Tao, N.R.; Lu, K. Revealing Extraordinary Intrinsic Tensile Plasticity in Gradient Nano-Grained Copper. Science 2011, 331, 1587–1590. [Google Scholar] [CrossRef] [PubMed]
  35. Sawangrat, C.; Kato, S.; Orlov, D.; Ameyama, K. Harmonic-structured copper: Performance and proof of fabrication concept based on severe plastic deformation of powders. J. Mater. Sci. 2014, 49, 6579–6585. [Google Scholar] [CrossRef]
  36. Meyers, M.A.; Mishra, A.; Benson, D.J. Mechanical properties of nanocrystalline materials. Prog. Mater. Sci. 2006, 51, 427–556. [Google Scholar] [CrossRef]
  37. Zhao, X.; Yue, Z.; Wang, G.; Li, Z.; Soyarslan, C. Role of GNDs in bending strength gain of multilayer deposition generated heterostructured bulk aluminum. Mater. Des. 2022, 219, 110769. [Google Scholar] [CrossRef]
  38. Salama, E.I.; Abbas, A.; Esawi, A.M.K. Preparation and properties of dual-matrix carbon nanotube-reinforced aluminum composites. Compos. Part A-Appl. Sci. Manuf. 2017, 99, 84–93. [Google Scholar] [CrossRef]
  39. Yefimov, S.; van der Giessen, E. Size effects in single crystal thin films: Nonlocal crystal plasticity simulations. Eur. J. Mech. A-Solids 2005, 24, 183–193. [Google Scholar] [CrossRef]
  40. Groma, I.; Csikor, F.F.; Zaiser, M. Spatial correlations and higher-order gradient terms in a continuum description of dislocation dynamics. Acta Mater. 2003, 51, 1271–1281. [Google Scholar] [CrossRef]
  41. Park, H.K.; Ameyama, K.; Yoo, J.; Hwang, H.; Kim, H.S. Additional hardening in harmonic structured materials by strain partitioning and back stress. Mater. Res. Lett. 2018, 6, 261–267. [Google Scholar] [CrossRef]
  42. Langdon, T.G. Twenty-five years of ultrafine-grained materials: Achieving exceptional properties through grain refinement. Acta Mater. 2013, 61, 7035–7059. [Google Scholar] [CrossRef]
  43. Hirth, J.P.; Lothe, J.; Mura, T. Theory of dislocations. J. Appl. Mech. 1983, 50, 476–477. [Google Scholar] [CrossRef]
  44. Xu, R.; Tan, Z.; Fan, G.; Ji, G.; Li, Z.; Guo, Q.; Li, Z.; Zhang, D. Microstructure-based modeling on structure-mechanical property relationships in carbon nanotube/aluminum composites. Int. J. Plast. 2019, 120, 278–295. [Google Scholar] [CrossRef]
  45. Mahato, J.K.; De, P.S.; Sarkar, A.; Kundu, A.; Chakraborti, P.C. Effect of deformation mode and grain size on Bauschinger behavior of annealed copper. Int. J. Fatigue 2016, 83, 42–52. [Google Scholar] [CrossRef]
  46. Wang, H.; You, Z.; Lu, L. Kinematic and isotropic strain hardening in copper with highly aligned nanoscale twins. Mater. Res. Lett. 2018, 6, 333–338. [Google Scholar] [CrossRef]
  47. Lu, S.; Zhang, B.; Li, X.; Zhao, J.; Zaiser, M.; Fan, H.; Zhang, X. Grain boundary effect on nanoindentation: A multiscale discrete dislocation dynamics model. J. Mech. Phys. Solids 2019, 126, 117–135. [Google Scholar] [CrossRef]
  48. Lu, J.P. Elastic properties of carbon nanotubes and nanoropes. Phys. Rev. Lett. 1997, 79, 1297–1300. [Google Scholar] [CrossRef]
  49. Xu, Y.R.; Zangvil, A.; Kerber, A. SiC nanoparticle-reinforced Al2O3 matrix composites: Role of intra- and intergranular particles. J. Eur. Ceram. Soc. 1997, 17, 921–928. [Google Scholar] [CrossRef]
  50. Gaillac, R.; Pullumbi, P.; Coudert, F.-X. ELATE: An open-source online application for analysis and visualization of elastic tensors. J. Phys.-Condens. Matter 2016, 28, 275201. [Google Scholar] [CrossRef]
Figure 1. Schematic diagram of manufacturing process of TGS composites.
Jcs 08 00490 g001
Figure 2. Multi-scale characterization of the TGS composites: (a) low power and (c) high resolution EBSD maps; (b) single tensile curve of composites with different grain structures; and (d) grain size distribution of the TGS composites [7].
Jcs 08 00490 g002
Figure 3. Illustration of the origin of (a) σ B a c k g r a and (b) σ B a c k s a m .
Jcs 08 00490 g003
Figure 4. Information transition relationship of multi-scale FEA method.
Jcs 08 00490 g004
Figure 6. Comparison of numerical and experimental (a) true stress–strain and (b) back stress plastic strain curves. The experimental results come from our previous study [7].
Jcs 08 00490 g006
Figure 7. (a) P C G = 0.1, (b) P C G = 0.2, (c) P C G = 0.3, (d) P C G = 0.4, and (e) P C G = 0.50; the comparison of simulated and experimental stress–strain curves of different volume fractions of P U F G and P F G .
Jcs 08 00490 g007
Figure 8. (a) Stress distribution and (b) strain distribution (ε = 8%).
Jcs 08 00490 g008
Figure 9. (a) Stress standard deviation with each volume fraction (ε = 8%). (b) Strain standard deviation with each volume fraction (ε = 8%).
Jcs 08 00490 g009
Figure 10. (a) Standard deviation of statistical storage dislocations with different volume fractions (ε = 8%) and (b) statistical storage dislocations with each volume fraction (ε = 8%).
Jcs 08 00490 g010
Figure 11. (a) Distribution of density of GNDs of sample level in different volume fractions (ε = 8%). (b) Distribution of density of GNDs of grain level in different volume fractions (ε = 8%). (c) Distribution of total GND density in different volume fractions (ε = 8%).
Jcs 08 00490 g011
Figure 12. (a) Distribution of standard deviations of density of GNDs of sample level with strain variation (ε = 8%). (b) Distribution of standard deviations of density of GNDs of grain level with strain variation (ε = 8%). (c) Distribution of standard deviations of density of total GNDs with strain variation (ε = 8%). (d) Density of GNDs of grain level in UFG, FG, and CG with strain variation (ε = 8%).
Jcs 08 00490 g012
Figure 13. (ac) GND density maps of various boundary regions in different volume fractions (ε = 2%); (df) GND density maps of various boundary regions in different volume fractions (ε = 5%); and (gi) GND density maps of various boundary regions in different volume fractions (ε = 8%).
Jcs 08 00490 g013
Figure 14. Comparison of the density of UFG and CG boundary dislocations with the same volume fraction in different strains.
Jcs 08 00490 g014
Figure 15. (a) The rainbow of back stress of the sample level (ε = 8%). (b) The rainbow of back stress of the grain level (ε = 8%).
Jcs 08 00490 g015
Figure 16. (a) The deviation of back stress of the sample level (ε = 8%). (b) The deviation of back stress of the grain level (ε = 8%).
Jcs 08 00490 g016
Figure 17. Comparison of the numerical and experimental true stress–strain curves. ( σ T   is the extra stress from the Taylor hardening; σ H P is the extra stress from the GB hardening effect).
Jcs 08 00490 g017
Table 1. Chemical composition of TGS composite.
ElementCuMgCOAl
wt.%3.381.66.730.7Margin
Disclaimer/Publisher’s Note: The statements, opinions and data contained in all publications are solely those of the individual author(s) and contributor(s) and not of MDPI and/or the editor(s). MDPI and/or the editor(s) disclaim responsibility for any injury to people or property resulting from any ideas, methods, instructions or products referred to in the content.