Abstract
Wood–plastic composites (WPC) are partially biobased composite materials that exhibit appealing properties, but also some drawbacks. One is the inherent propensity to take up water, which influences different composite properties. In this work, we investigated the general water uptake behavior of injection-molded WPC and applied a simple model to evaluate different formulations. We found that the major influence is the wood content, but also, wood particle size showed a distinct influence on the water uptake speed, while the saturation concentration correlated with the equilibrium moisture content of the wood. The mechanical properties, such as elastic modulus and tensile strength, were reduced with increasing water uptake, and the reduction correlated with wood content and the moisture content of the wood, while the particle size did not show an influence in the investigated region.
1. Introduction
Using reinforcements to improve the properties of plastic materials is a common and widely used approach. In light of consuming fewer resources and improving the sustainability of such polymer matrix composite materials, natural reinforcements from plants are considered, as these show some advantages in that regard in comparison to inorganic reinforcements like glass fibers or talc [1]. Such approaches have been discussed in the literature and have been found in some selected applications for quite some time. Looking at potential reinforcements, natural fibers of different kinds, like hemp, flax, or sisal, come to mind. These are thin and long fibers that would be proper for reinforcement but exhibit some drawbacks in regard to processing in extruders and year-round availability, as these are usually harvested only once or twice a year. A more readily available source is wood particles, also referred to as sawdust or wood chips, as these are by-products from timber production or are produced from trees that cannot be utilized as construction lumber. Besides being available independently of a harvesting cycle, wood also has the advantage that seasonal changes that influence the growth are averaged out over the years. Therefore, wood–plastic composites (WPC) have been around for some decades, often in extruded applications like deck boards or as a lightweight filler for injection molded parts.
One property that is heavily influenced by adding wood to a polymer matrix like polypropylene, polyethylene, or polyvinylchloride is that the wood will take up water, and this influences the properties of the wood–plastic composites. On the one hand, there is swelling with the water uptake, and, in addition, wood components are washed out of the composite (especially after weathering). On the other hand, there are some changes in the composite properties to be expected. Due to that, several researchers have investigated the water uptake behavior of wood–plastic composites. Espert et al. investigated the water uptake behavior of polypropylene-based cellulose fiber reinforces composites and used Fick’s law to model the water uptake behavior and also showed that in these fiber composites, the mechanical properties are reduced due to the water uptake [2]. The method of using diffusion to fit water uptake was also applied by other researchers for polyolefin-based WPC [3]. Other works looked into the water uptake and its correlation with the biological decay of extruded boards [4]. Another publication investigated the short-term water uptake and the influence of temperature on that. They found that temperature had a huge influence on the water uptake on the compression-molded panels they investigated [5]. A study on the comparison of extruded WPC, based on PP and PLA, showed that both absorb water, but the composites based on PLA considerably more. Heat treatment of the wood fibers can reduce water uptake [6], which was also found in another study [7].
In our group, water uptake of wood–plastic composites has also been studied, especially using a chemical modification of the wood surface to reduce absorption [8]. Water uptake can influence the mechanical properties. In one publication, the authors investigated the creep behavior of wood–plastic composites with up to 80 wt% of wood and found that with increasing water uptake, the creep deflection also increases, thus reducing the load-bearing capacity [9]. In terms of modeling the water uptake, a numerical approach (based on Fickian Diffusion for short and long times) was applied to WPC with rather low wood content (between 20 and 40 wt%). The model also considered the wood type. They found that the main influence was, besides the amount of wood in the WPC, the chemical composition, which could be captured with their respective model [10]. Another work investigated the influence of wood particle size and different specimen geometry on the water uptake behavior. Here, the bigger wood particles in the WPC show a higher water uptake than the smaller ones, and also, the bigger specimens exhibit a higher water uptake [11]. More recent research has investigated the effects of recycled matrix materials on different properties besides the water uptake behavior of extruded WPC. They found that the polyolefin recyclates with higher shares of polypropylene tend to take up more water [12]. Several publications have dealt with the reduction of water uptake by different additives like coupling agents or methacrylates [13], anhydrides [8], the presence of coupling agents [14], alkalization of the wood, and silanization [15,16]. Therefore, water uptake is a relevant property of wood–plastic composites in regard to short-term properties and durability. In addition, some modeling has been conducted to describe this behavior. Another approach to reduce water uptake is hybridization. WPC produced with a hand layup technique showed reduced water uptake, as the wood was less accessible [17]. This was also confirmed in another review, where besides chemical pre-treatment, hybridization was also an option to reduce the water uptake of WPC [18]. In a more recent publication, the different water uptake mechanisms were discussed, e.g., the water uptake into the cells, but also the formation of microcracks in the polymer matrix, which themselves lead to higher water uptake. Again, the addition of a coupling agent reduced the water uptake, as previously shown [19]. For WPC, using recycled polymers as the matrix has often been considered an even more sustainable composite, which is also documented in the literature. The authors found that for up to 30 wt% of wood particles, the water uptake is rather low, and therefore, the dimensional stability, measured as thickness swelling, is improved, i.e., the samples also swell less. The water absorption of the WPC with the recyclate was found to be somewhat higher than for the virgin material, but in this case, the reason was the presence of inorganic filler, which provided additional water pathways and led to higher water uptake [20]. The reduction of the mechanical properties due to the water uptake is not only found in WPC but also in related composites built from agricultural fibers. Also, the addition of a compatibilizer was found to be a water uptake-reducing influence [21].
Nevertheless, what is missing, in our opinion, is a more general understanding of how the water uptake in WPC functions and a simple model, which can easily be used to predict water uptake in regard to wood content and particle size. Therefore, the aim of this research was to investigate the general water uptake behavior of injection molded wood–plastic composites and to apply a simple model with only physically meaningful constants to describe that. Also, the influence of the water uptake on the mechanical properties is investigated.
2. Materials and Methods
In this study, two polypropylene homopolymers were used. Both were injection molding grades with melt flow rates of 8 and 50 g/10 min (grades HD120MO and HJ320MO, both Borealis, Vienna, Austria). Both MFR values are given for 230 °C and 2.16 kg piston weight. Throughout this work, the two grades will be referred to as PP-8 and PP-50, respectively. These two grades were chosen as matrix materials, as PP-based WPC are most common in Europe, and both are well suited for compounding and injection molding. As the reinforcement, a wide range of softwood particles with different sieve sizes were used. The different grades named CW630PU, C100, C120, S150TR, C320, BK40/90, and Type 9 were supplied by J. Rettenmaier & Söhne GmbH + Co KG, Rosenberg, Germany, and grade CB200 by LaSoLe Est. Srl., Percoto, Italy. To improve the wetting of the wood particles with the PP and adhesion between the components, a maleic anhydride grafted PP (grade Exxelor PO1020, Exxon Mobile Chemical Company, Houston, TX, USA) was used as a compatibilizer.
With these materials, compounds with different amounts of wood particles (20–70 wt%) and a constant share of compatibilizer, i.e., a concentration of 1/10 of the wood particle share, were used to produce compounds with both PP grades. The different formulations are indicated throughout the paper in the respective results. The compounds were produced by means of a co-rotating, intermeshing 24 mm twin screw extruder (TSE24MC, ThermoPrism, Karlsruhe, Germany), with a processing length of 40 L/D, a throughput of 10 kg/h at a screw speed of 300 rpm and a maximum barrel temperature of 230 °C. The wood particles are dosed into the already molten PP after 8 L/D by means of a side-feeder. The extruded strands were cooled via a water bath, and afterward, cut into 4 mm long granules by a strand cutter and then dried in hot air drying hoppers (Luxor 120, Motan, Konstanz, Germany) at 80 °C for at least 6 h. Injection molding to yield a universal test specimen (specimen geometry according to ISO-527) was carried out on a conventional injection molding machine (Victory 80, Engel, Schwertberg, Austria) with a maximum barrel temperature of 230 °C and a mold temperature of 40 °C. Samples for further testing were stored in a dry atmosphere (desiccant) until the water uptake experiments started.
Water uptake of the samples was determined on a prismatic specimen (80 × 10 × 4 mm3) punched from the parallel part of the universal test sample, with three replicates per material. (Three replicates were seen as being sufficient, as the samples are produced via compounding and injection molding and are, therefore, quite homogenous.) Also, for one set of experiments, shorter prismatic specimens (40, 20, and 10 mm in length) were used. As the 100 wt% reference, defect and knot-free pieces of spruce wood were used, which were milled to the same dimension (80 × 10 × 4 mm3). The samples were labeled, weighed, and stored under deionized water at 23 °C for different time periods while being taken from the water bath, dried superficially, and weighed. For storage in air with defined moisture content, the same specimens were stored and weighed, but in a climate cabinet (23 °C, 50% r.h., KBF 720, Binder, Tuttlingen, Germany) or in a desiccator at 23 °C, over a solution of 20 wt% of lithium chloride (reagent grade) in deionized water to create an atmosphere with 15% r.h. and over a solution of 20 wt% of sodium chloride (reagent grade) in deionized water to yield 75% r.h.
Tensile properties were recorded in accordance with ISO-527 with a crosshead speed of 1 mm/min until the determination of the elastic modulus and afterward with 5 mm/min until the break of the samples on a 20 kN universal test machine (Z020, Zwick-Roell, Ulm, Germany). For each sample series, 5 replicates were tested. Unnotched Charpy impact properties were recorded on a prismatic specimen (80 × 10 × 4 mm3) punched out from the parallel part of the universal test specimen in accordance with ISO-179 on a pendulum impact tester (5113.300, Zwick-Roell, Ulm, Germany).
The particle size and particle size distribution of the wood flour fillers were determined by a Malvern 2000 (Malvern Panalytical Ltd., Malvern, UK) laser diffraction particle size analyzer. Three parallel measurements were carried out, and the result given is their average. Particle characteristics were also determined with the help of SEM micrographs. The SEM micrographs were taken by a Jeol JSM 6380 LA (Jeol GmbH, Freising, Germany) apparatus.
3. Results & Discussions
3.1. Basic Water Uptake Behavior of Wood–Plastic Composites
In this section, we first look into the mechanisms of water uptake in wood–plastic composites, especially as we tested this on prismatic specimens (80 × 10 × 4 mm3) cut from injection molded universal test specimens. As these specimens exhibit cut ends, but a molded skin surface, the generalization would be that the water uptake is mainly happening via the ends of the sample. A specimen was stored underwater to investigate this, and after storage, slices with defined thickness were cut from the ends with a rotational microtome, so every slice corresponds to a certain position from the end of the specimen. These slices were then investigated for their moisture content. The limit in depth was approx. 2000 µm, as the samples could not be repositioned without losing the position (repositioning is not as exact, so the first slice after would be undefined in thickness), and when sticking out further of the jaws of the microtome, the samples flex too much while cutting, then resulting in slices with wedge shape and a non-uniform thickness.
In Figure 1, one can see that the water content is higher at the end and decreases with the position going further into the specimen. This fits the general assumption, as in a wood–plastic composite (WPC) consisting of wood particles and polypropylene, only the wood should take up water, and therefore the skin surface, being a closed molten surface due to the conditions in injection molding, where the hot melt is cooled down rapidly at the cool metal surface of the injection mold. Also, as each of these points represents a single slice and, therefore, only a single measurement, some scattering between the data points can also be seen. This is due to the preparation of the slices—although the blade in the microtome is very sharp, some compression forces are still exerted onto the sample, leading to some water being squeezed out and also slight variations in cutting. Nevertheless, the water uptake from the ends can be seen quite clearly by that decrease in water content over the specimen length.
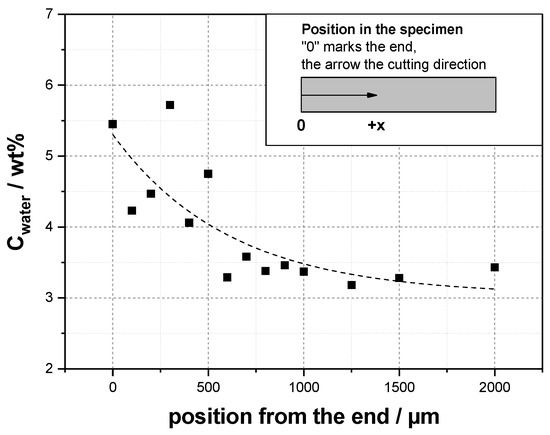
Figure 1.
Water content (Cwater) in relation to the position from the end for a wood–plastic composite with 60 wt% of softwood particles (CB200) in polypropylene (PP-8) after 10 d of underwater storage at room temperature. Slices cut from the end were 100 µm in thickness.
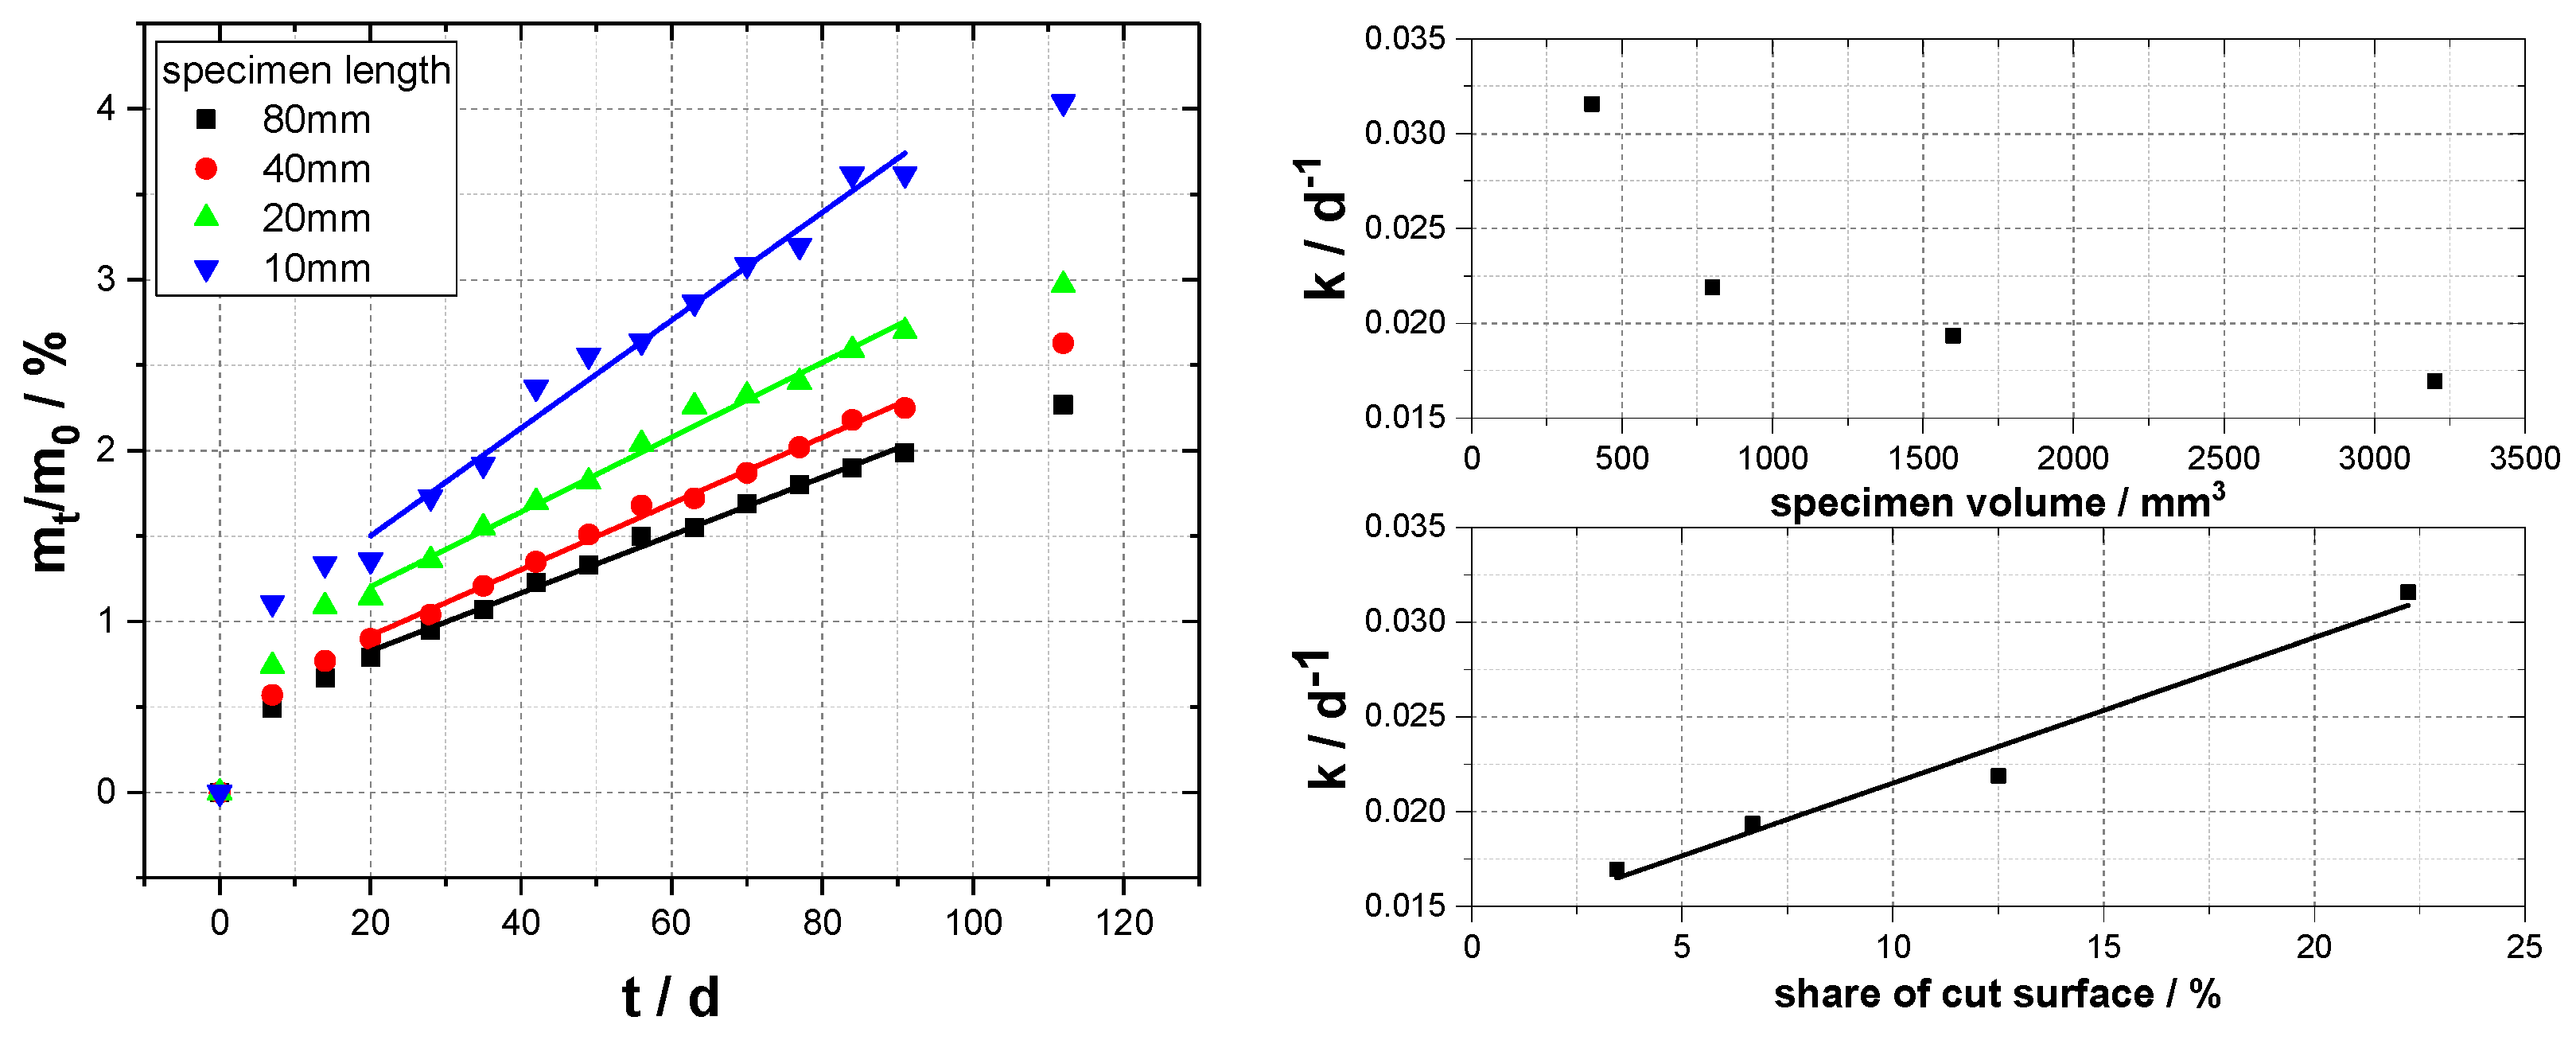
Another question remains after this first experiment. The initial assumption here is that the skin surface does not take up any water, but as we know that moisture still can diffuse through polypropylene and the outer skin layer of pure polymer is rather thin, we have to investigate the potential water uptake over the skin layer. As preparing a precise specimen with only molded surfaces is rather difficult, we took another approach. Here, we stored specimens of different lengths of the same formulation, therefore changing the relation between the cut surfaces (the ends) and the molded surfaces (the skin layer). If no water uptake occurred through the skin, the water uptake should have remained constant, regardless of specimen length; but if not, the water uptake would change. The weight gain is related to the initial weight, and the slope of the increase was then calculated to evaluate the water uptake of these specimens (Figure 2 and Table 1). This slope, equaling the weight gain over time, was then compared to the specimen volume and the share of the cut surface. In the case that the skin did not allow for any water to be absorbed into the specimen, the correlation between the water uptake (represented as the slope of the water uptake curves) and the specimen volume would be linear, as the increase in length equals a linear increase in volume and therefore weight. As can be seen in Figure 2, this is not the case, thus meaning that water is also taken up via the skin layer. To estimate the amount of water taken up via the skin layer, we can use the linear fit given in Figure 2 for the slope in correlation to the share of the cut surface. At an extrapolated 0% cut surface, the value for the slope k is approx. 0.014, while at 100%, we obtain an approximate value of 0.091. This means that the water uptake via the cut ends happens about 6.5 times faster than over the skin layer. We expect this to be dependent on the type of polymer, but this has to be investigated further for materials other than those we used in this study.
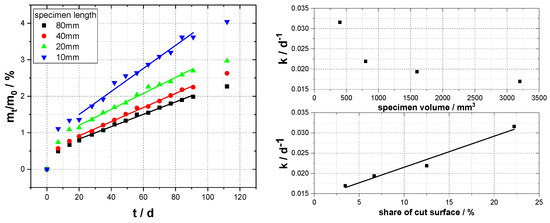
Figure 2.
Water uptake specimens containing 30 wt% of softwood particles (CB200) in PP-8 with different lengths ((left), straight lines represent linear fits) and a cross-section of 4 × 10 mm2 and slope of the linear fits vs. specimen volume (right top) and share of specimen cut surface ((right bottom), line represents linear fit y = kx + d with k = 7.68 × 10⁻⁴ and d = 0.014, R2 = 0.986).

Table 1.
Results from fitting the water uptake data in Figure 2 with linear fits of the general form y = kx + d, with k being the slope, d the y-axis intercept, and R2 the coefficient of determination.
3.2. Influence of Wood Content on Water Uptake in Wood–Plastic Composite
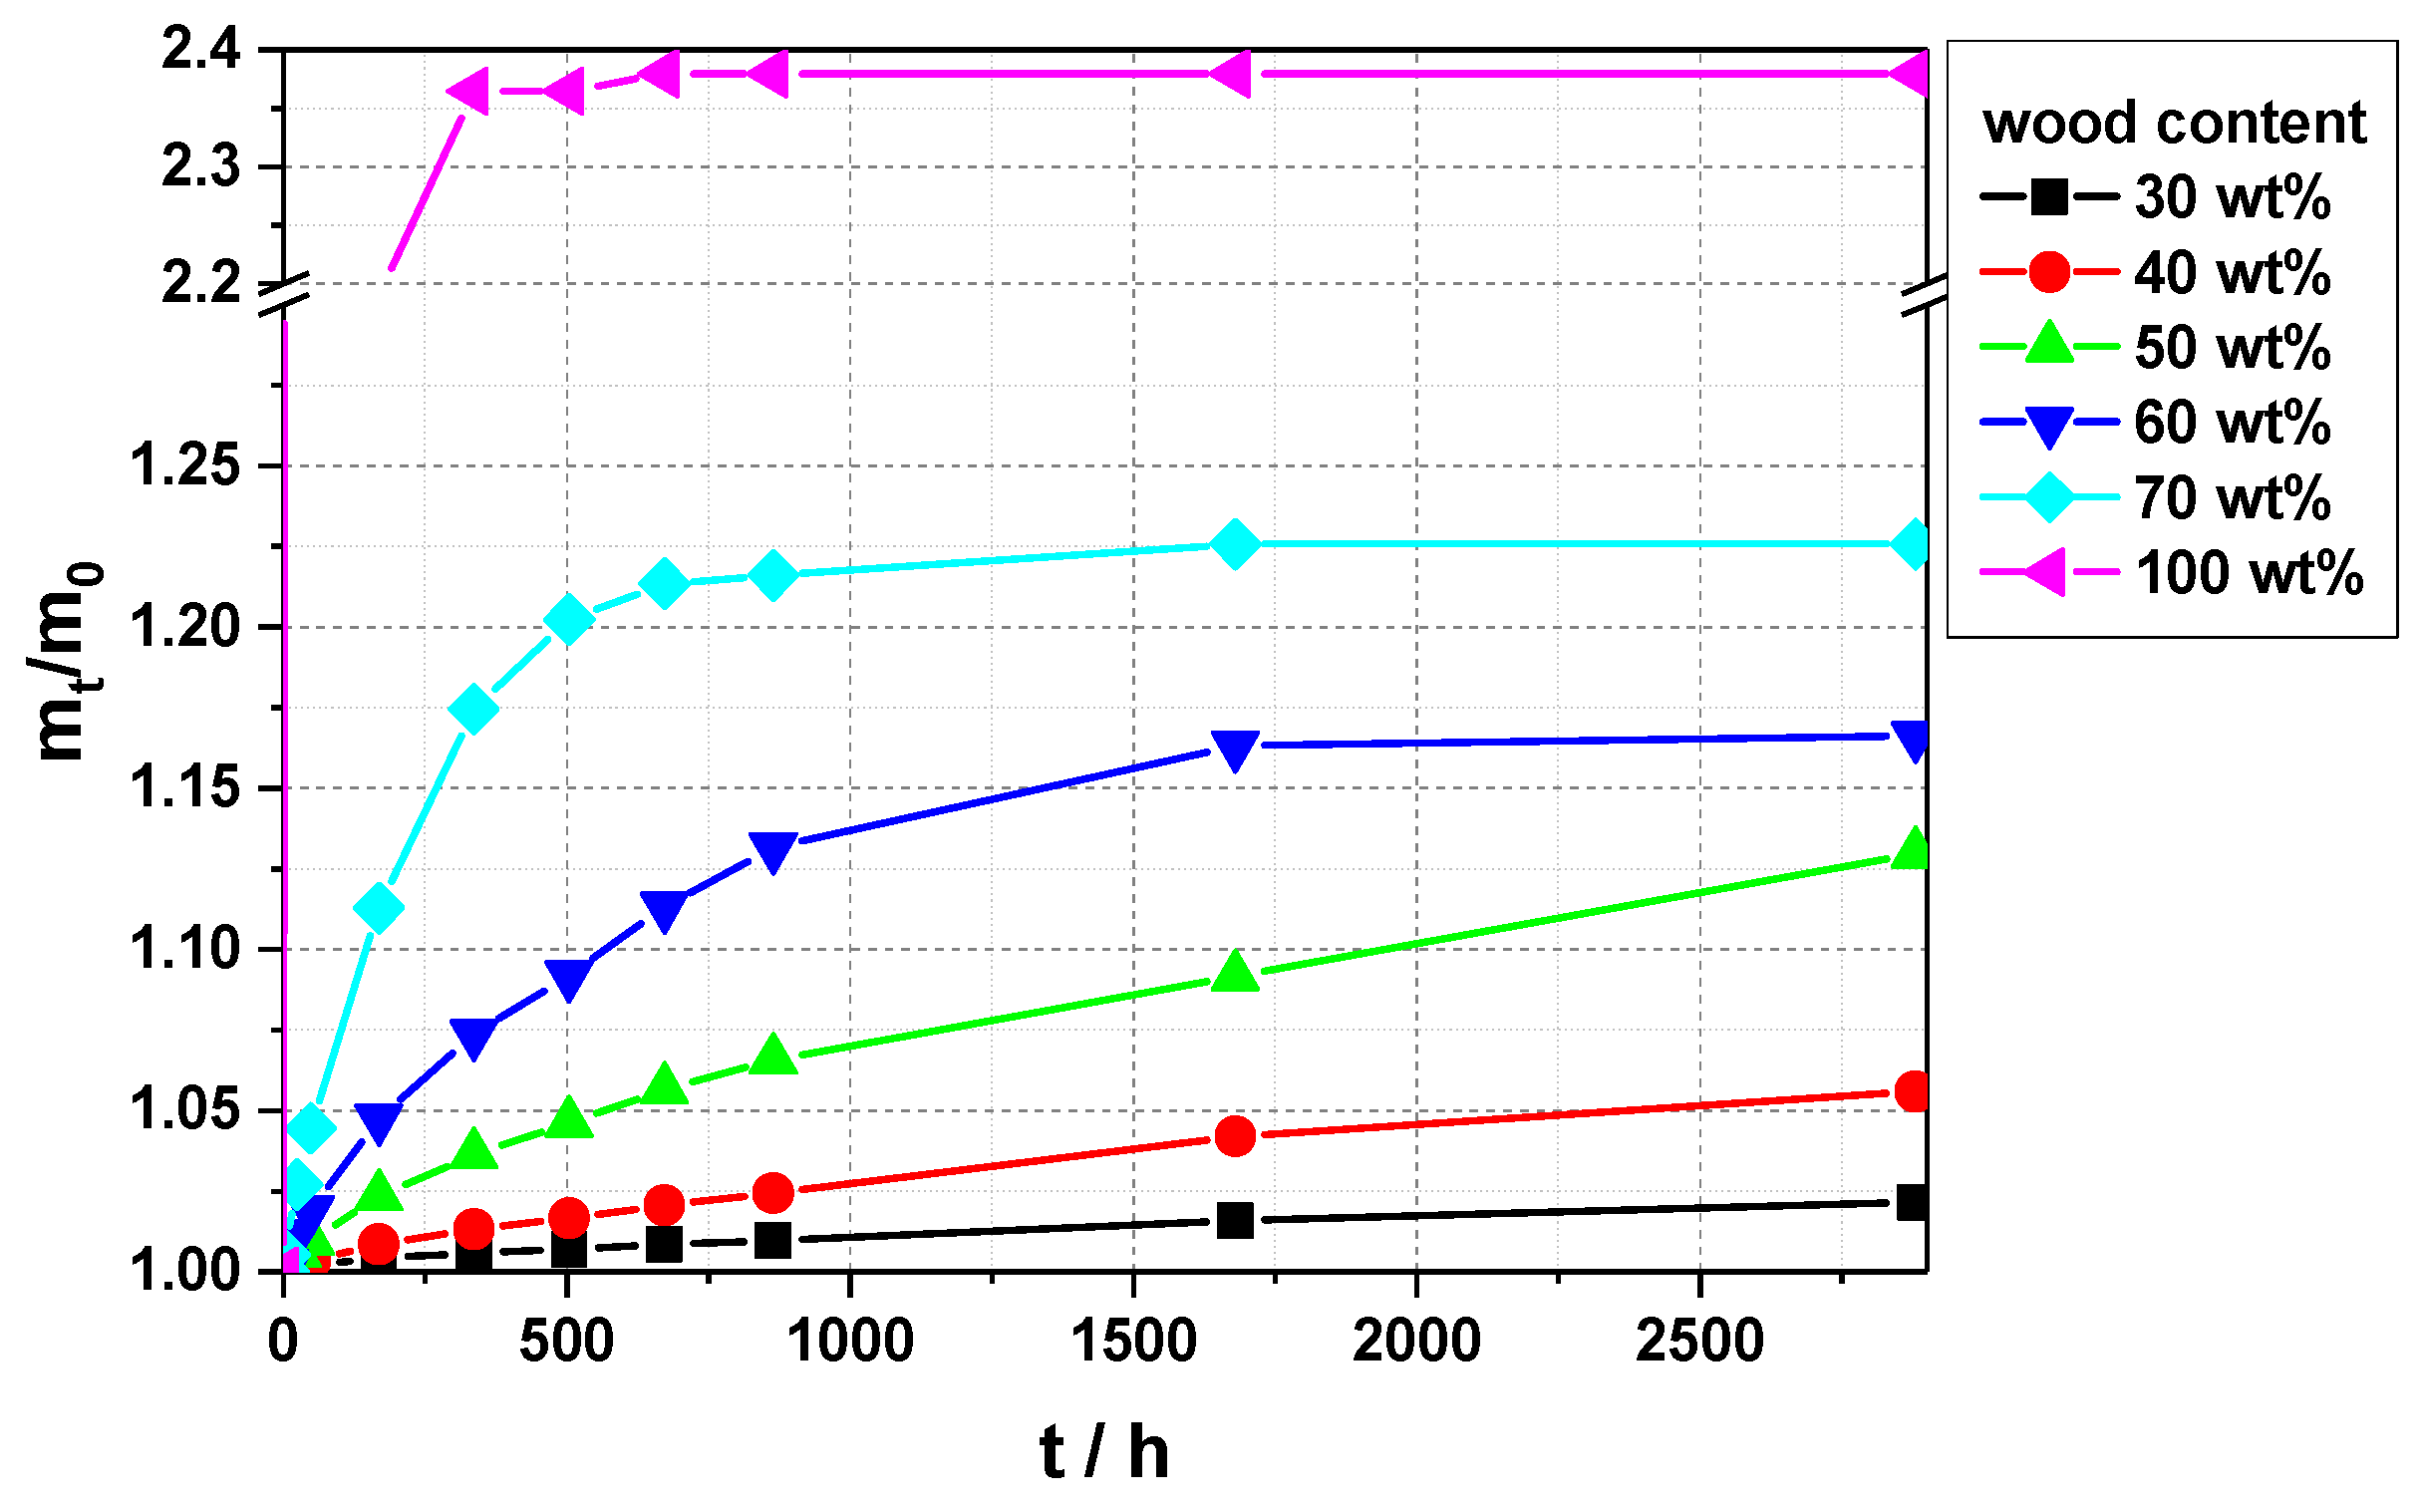
After having investigated some basic behavior, the next question concerning water uptake was how the wood content in the composite influenced the water uptake behavior. It is to be expected that with higher wood shares more water can also be taken up, and faster, as the water pathways through the composite are becoming more pronounced. This can be seen from the data shown in Figure 3. With increasing wood content, the water uptake speed and the amount of water taken up increase. Solid wood shows a much higher water uptake rate and concentration than composites, as the water transport in solid wood is not disturbed by any layers of the polymer as it is in composites.
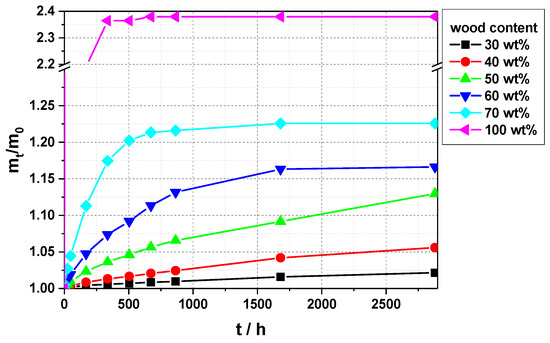
Figure 3.
Water uptake over time for wood–plastic composites containing different shares (30–70 wt%) of softwood particles (CB200) in PP-8 and solid softwood (spruce, designated with 100 wt%).
As the evaluation of such curves in a graphical way is of limited use, a simple model (Equation (1)) for fitting the curves is applied.
where m0 is the sample mass at t = 0, mt is the sample mass at time t and constants C1 is the curvature, C2 is the moisture content taken up until equilibrium, and C3 is the initial moisture content.
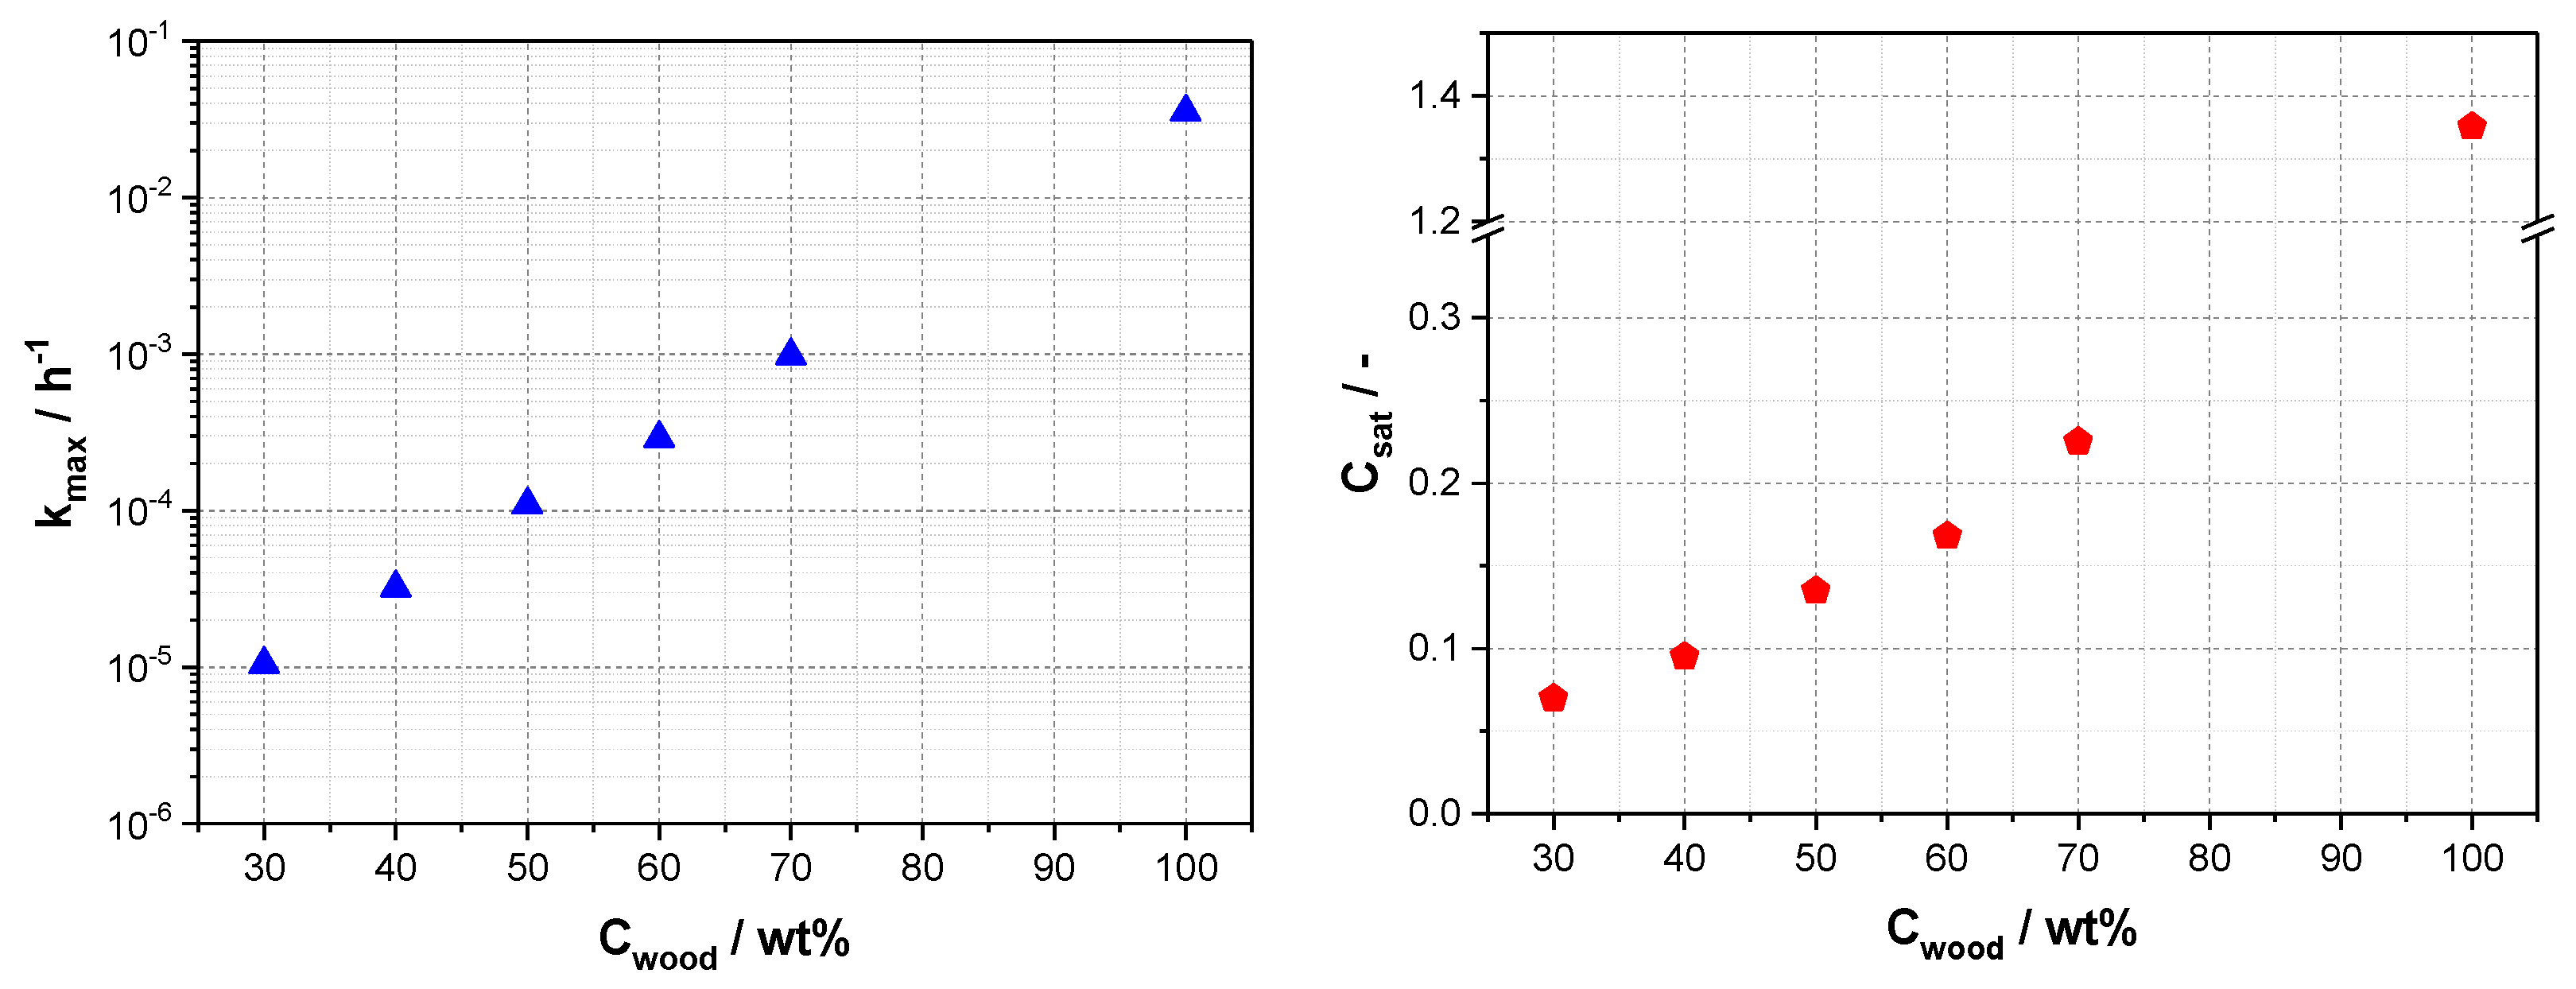
To utilize the constants yielded from fitting the curves with this equation, two main data points can be extracted. The first is the maximum water uptake, i.e., the equilibrium or saturation concentration Csat, which is the sum of C2 and C3. The second parameter is the maximum slope, which can be calculated from the first derivative of Equation (1) at time t = 0, as at this time, the gradient between the sample moisture and the underwater storage is at its maximum, thus giving us the maximum water uptake speed. This maximum water uptake speed kmax is calculated as the product of C1 and C2. With these two parameters, Csat and kmax, the water uptake of the different specimens shown in Figure 3 can now be compared. This comparison is shown in Figure 4, where kmax is plotted over the wood content. What can be seen there is that kmax increases rapidly with the share of wood. This is a linear behavior as we plotted with a logarithmic y-axis. This shows that the more wood is added, the more water can be taken up, because it is transported through the composite at a much higher rate, as the rates are increased by orders of magnitude when going from 30 to 50 wt%, for example. So, for reducing water uptake, the reduction of wood content gives high leverage. The other parameter shown in Figure 4 is the saturation concentration, i.e., the maximum water uptake for the different composites. Here, we also see an increase with increasing wood content. Also, calculating the moisture content related to only the wood share (as only the wood takes up water, given as Cwater/Cwood in Table 2) shows the values of the composite between 32.1 and 23.0%, while for the solid wood, we yield 135.4%. For the composites, these values are similar to the fiber saturation point (FSP), especially for these concentrations where in the data, the water uptake approached or reached Csat, which is between 30 and 34% from the literature [22,23]. The definition of the FSP is where the wood has taken up as much water as possible into its structure without any superficial water. As the wood particles in the composites have most of their surfaces covered, water can only be taken up into the structure, and so this correlates well. Another point to consider is that the wood particles exhibit lumen, but these can collapse due to the melt processing, thus having less water uptake potential, which might be the influence why, at lower wood concentrations, the Cwater/Cwood’ is lower than the FSP. The solid wood takes up much more water—about 135%, which is possible as there is also superficial water absorbed, which cannot be wiped off completely in these tests. The FSP gives a good maximum estimation of the maximum water uptake, which is helpful when designing such composites.
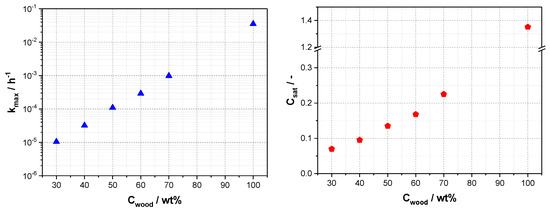
Figure 4.
Maximum water uptake rate kmax (left) and saturation concentration Csat (right) of different wood–plastic composites with varying content and solid softwood as 100 wt% reference.
Table 2.
Results from fitting the water uptake data in Figure 3 with Equation (1), with kmax being the maximum slope, Csat the saturation concentration of water in the respective sample, R2 being the coefficient of determination of the fit, Cwater/Cwood being the moisture content in the wood at saturation and t0.99 the calculated time when 0.99 of Csat are reached (calculation with Equation (1)).
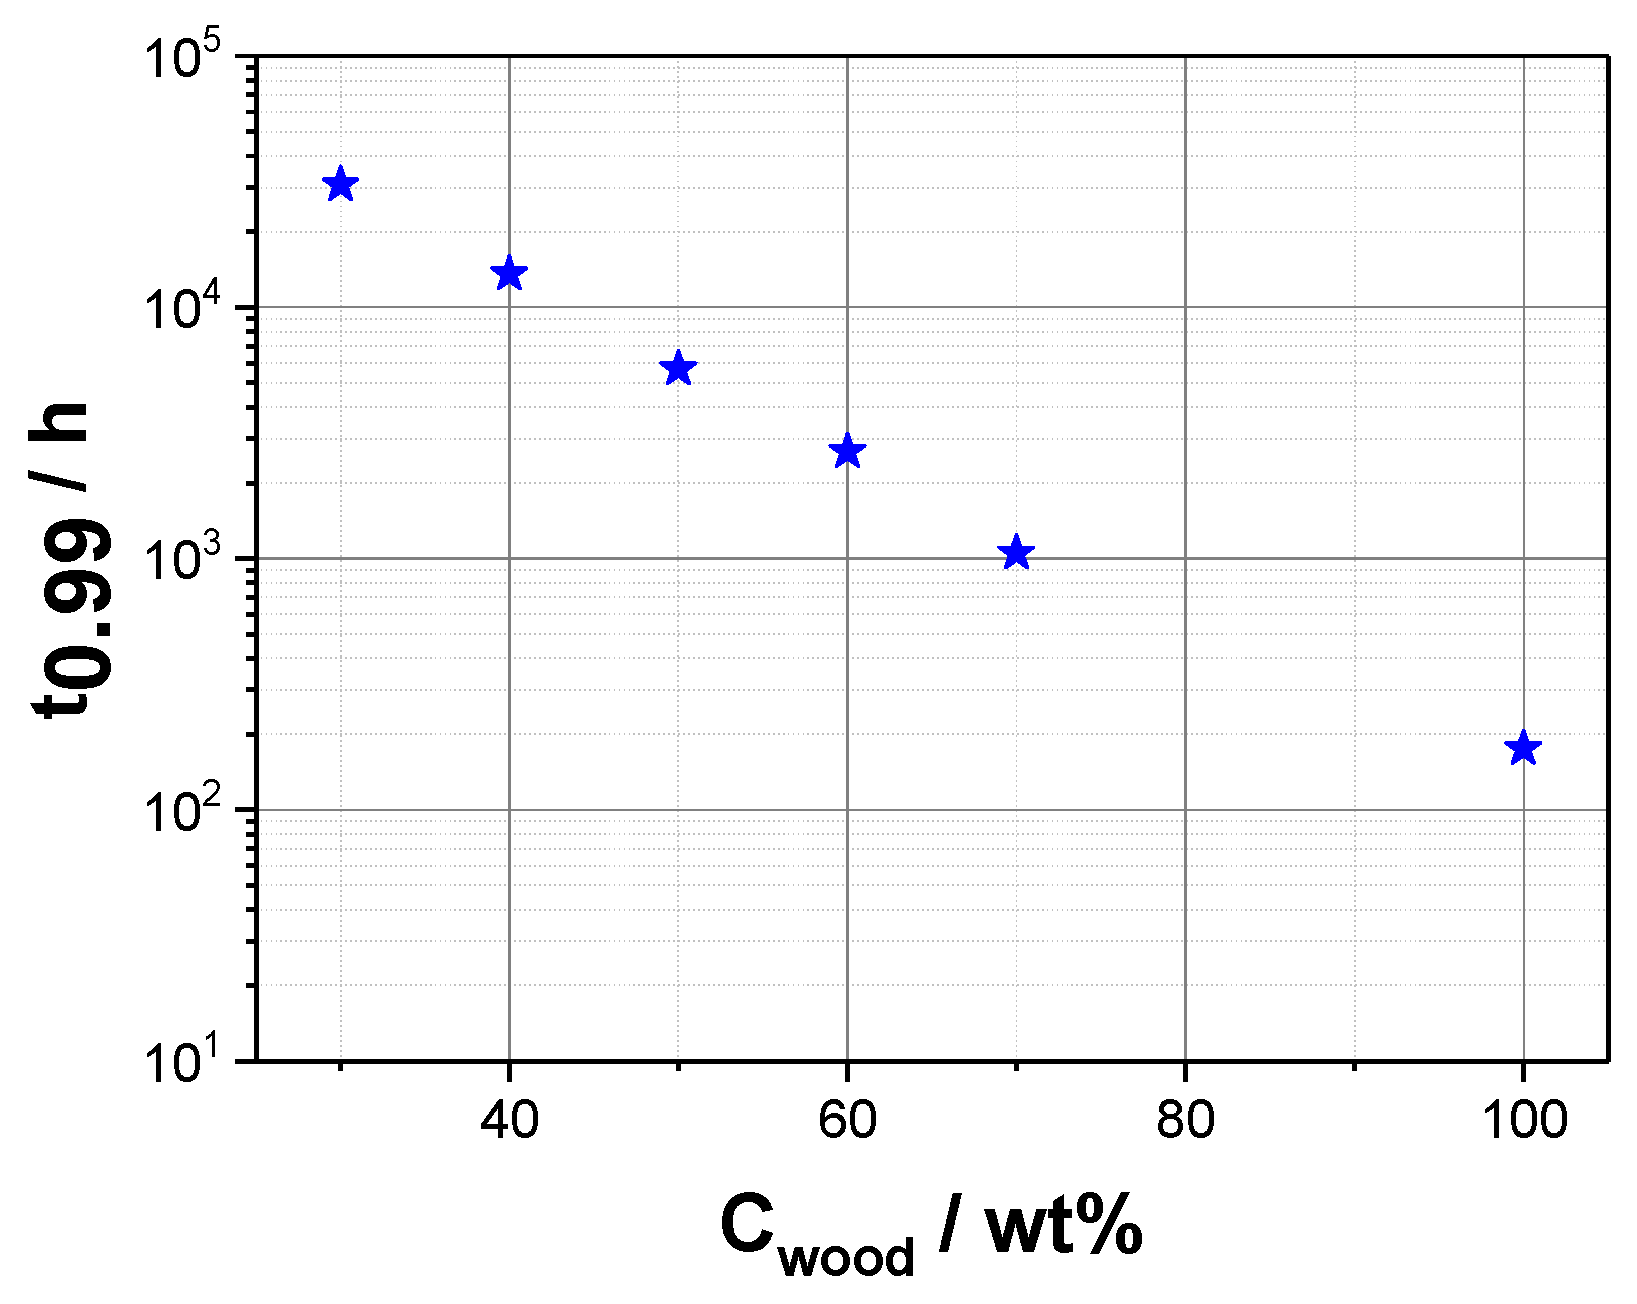
The last value extracted from that set of data is t0.99, which is the calculated time when 0.99 of Csat is reached. This shows how long a sample needs to be stored underwater to become completely saturated, which is 175 h (or 7.3 days) for the solid wood samples (of the given geometry) and about 1279 days (or approx. 3.5 years) for the 30 wt% of wood sample to reach saturation, which overall is a logarithmic correlation (Figure 5). This is an easy measure to estimate the influence of water and the general water uptake potential of such composites in different applications and can later be used to estimate the overall effects of water uptake.
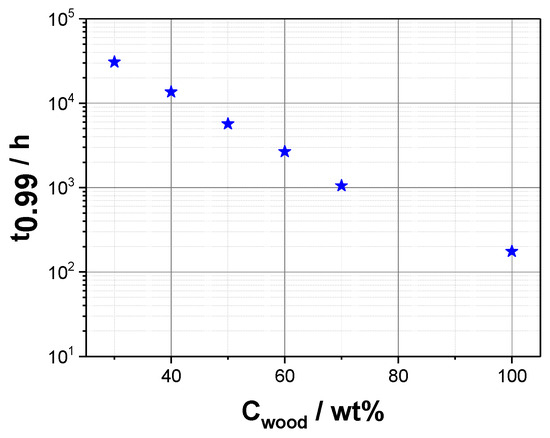
Figure 5.
Calculated time until 99% of saturation is reached in underwater storage for samples with different wood content.
3.3. Influence of Surrounding Moisture on the Water Uptake of Wood–Plastic Composites
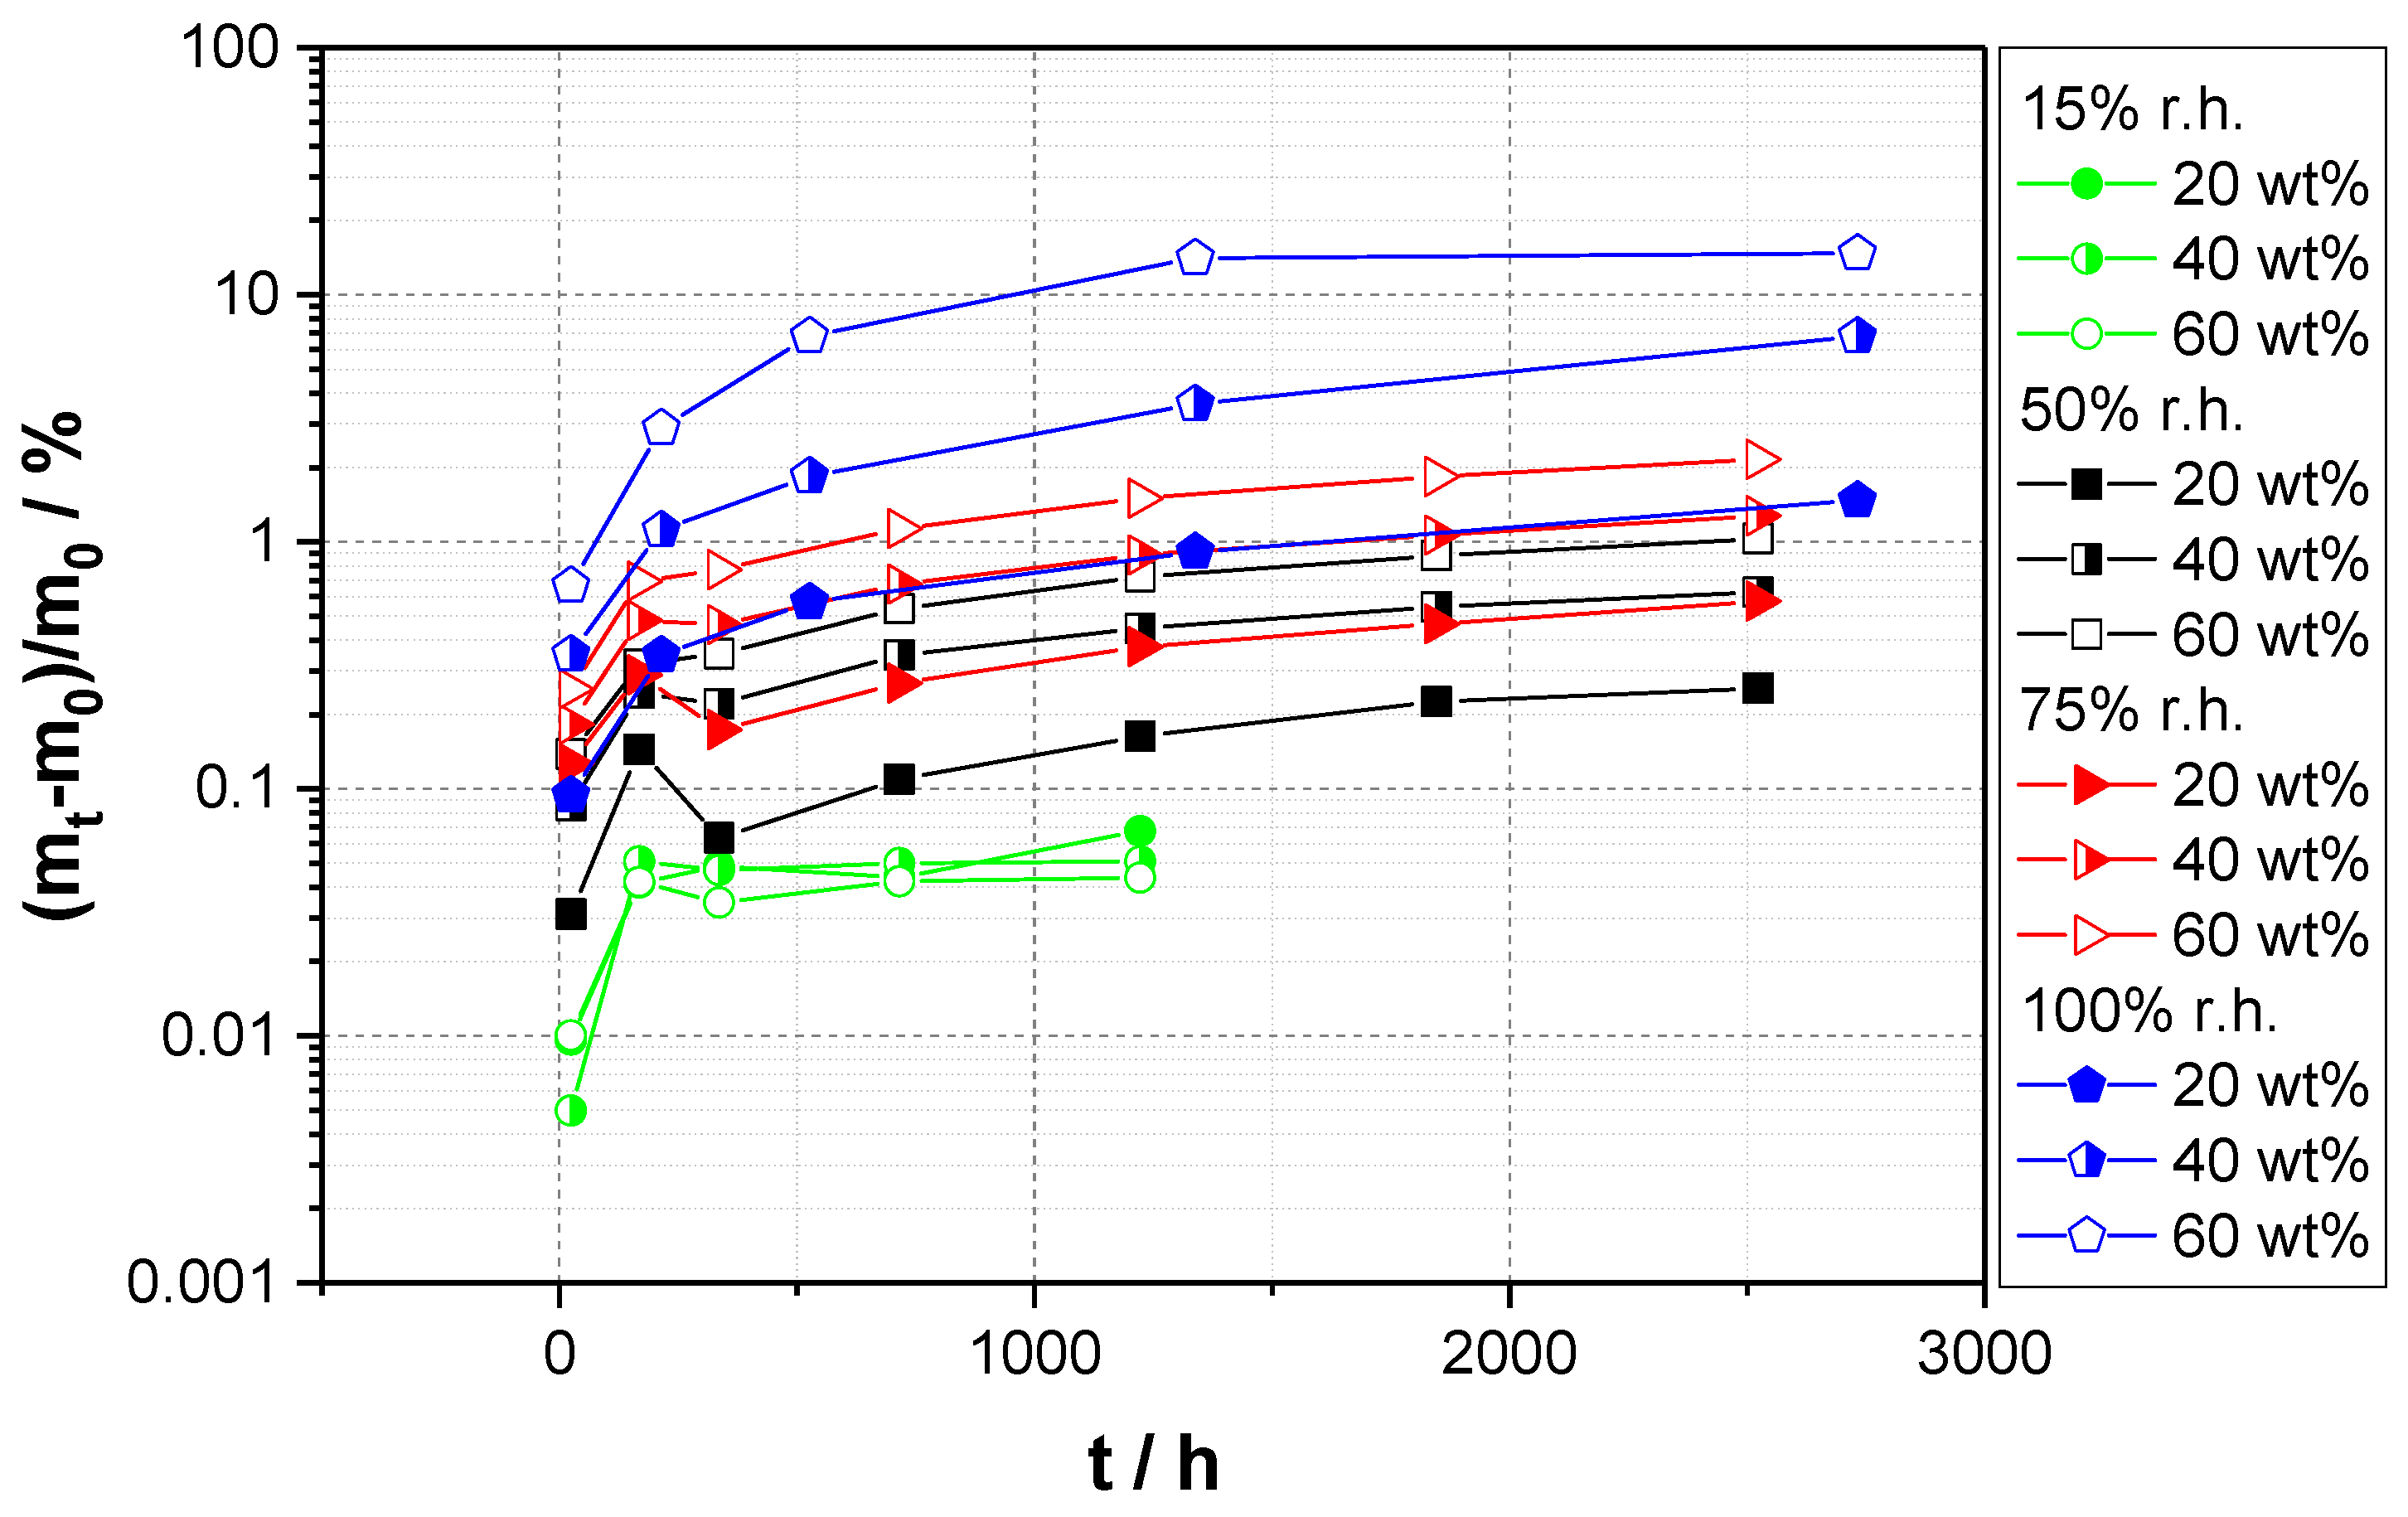
The next question arising from the results thus far is how the moisture content influences the water uptake behavior. Both underwater storage and high or low humidity can influence the wood–plastic composite in real life. Therefore, the same set of samples (20, 40, and 60 wt% of wood) were stored at different relative humidities (r.h.). As can be seen in Figure 6, the general water uptake behavior is the same, regardless of the humidity. The only exception here is the storage of the wood–plastic composites at 15% r.h., where the water uptake is negligible due to the low humidity. For the other storage conditions, the same trend is seen, i.e., with higher wood content and higher r.h., the water uptake is also higher. With the confirmed same behavior regardless of the moisture content of the atmosphere, one can use the same model to describe the water uptake behavior of wood–plastic composites for all storage conditions.
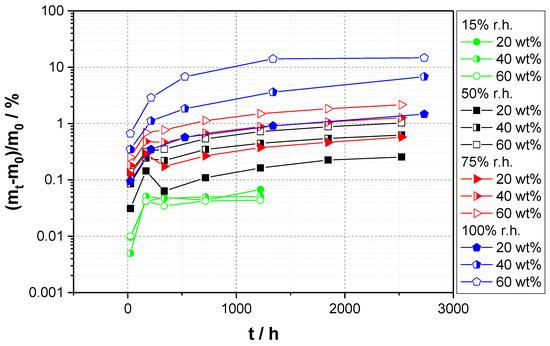
Figure 6.
Water uptake curves (given as relative weight increase (mt − m0)/m0 over time) vs. relative humidity (r.h.) for wood–plastic composites containing different amounts of softwood particles (CW630PU) in PP-50. 100% r.h. refers to underwater storage.
3.4. Influence of Wood Particle Size on the Water Uptake Behavior of Wood–Plastic Composites
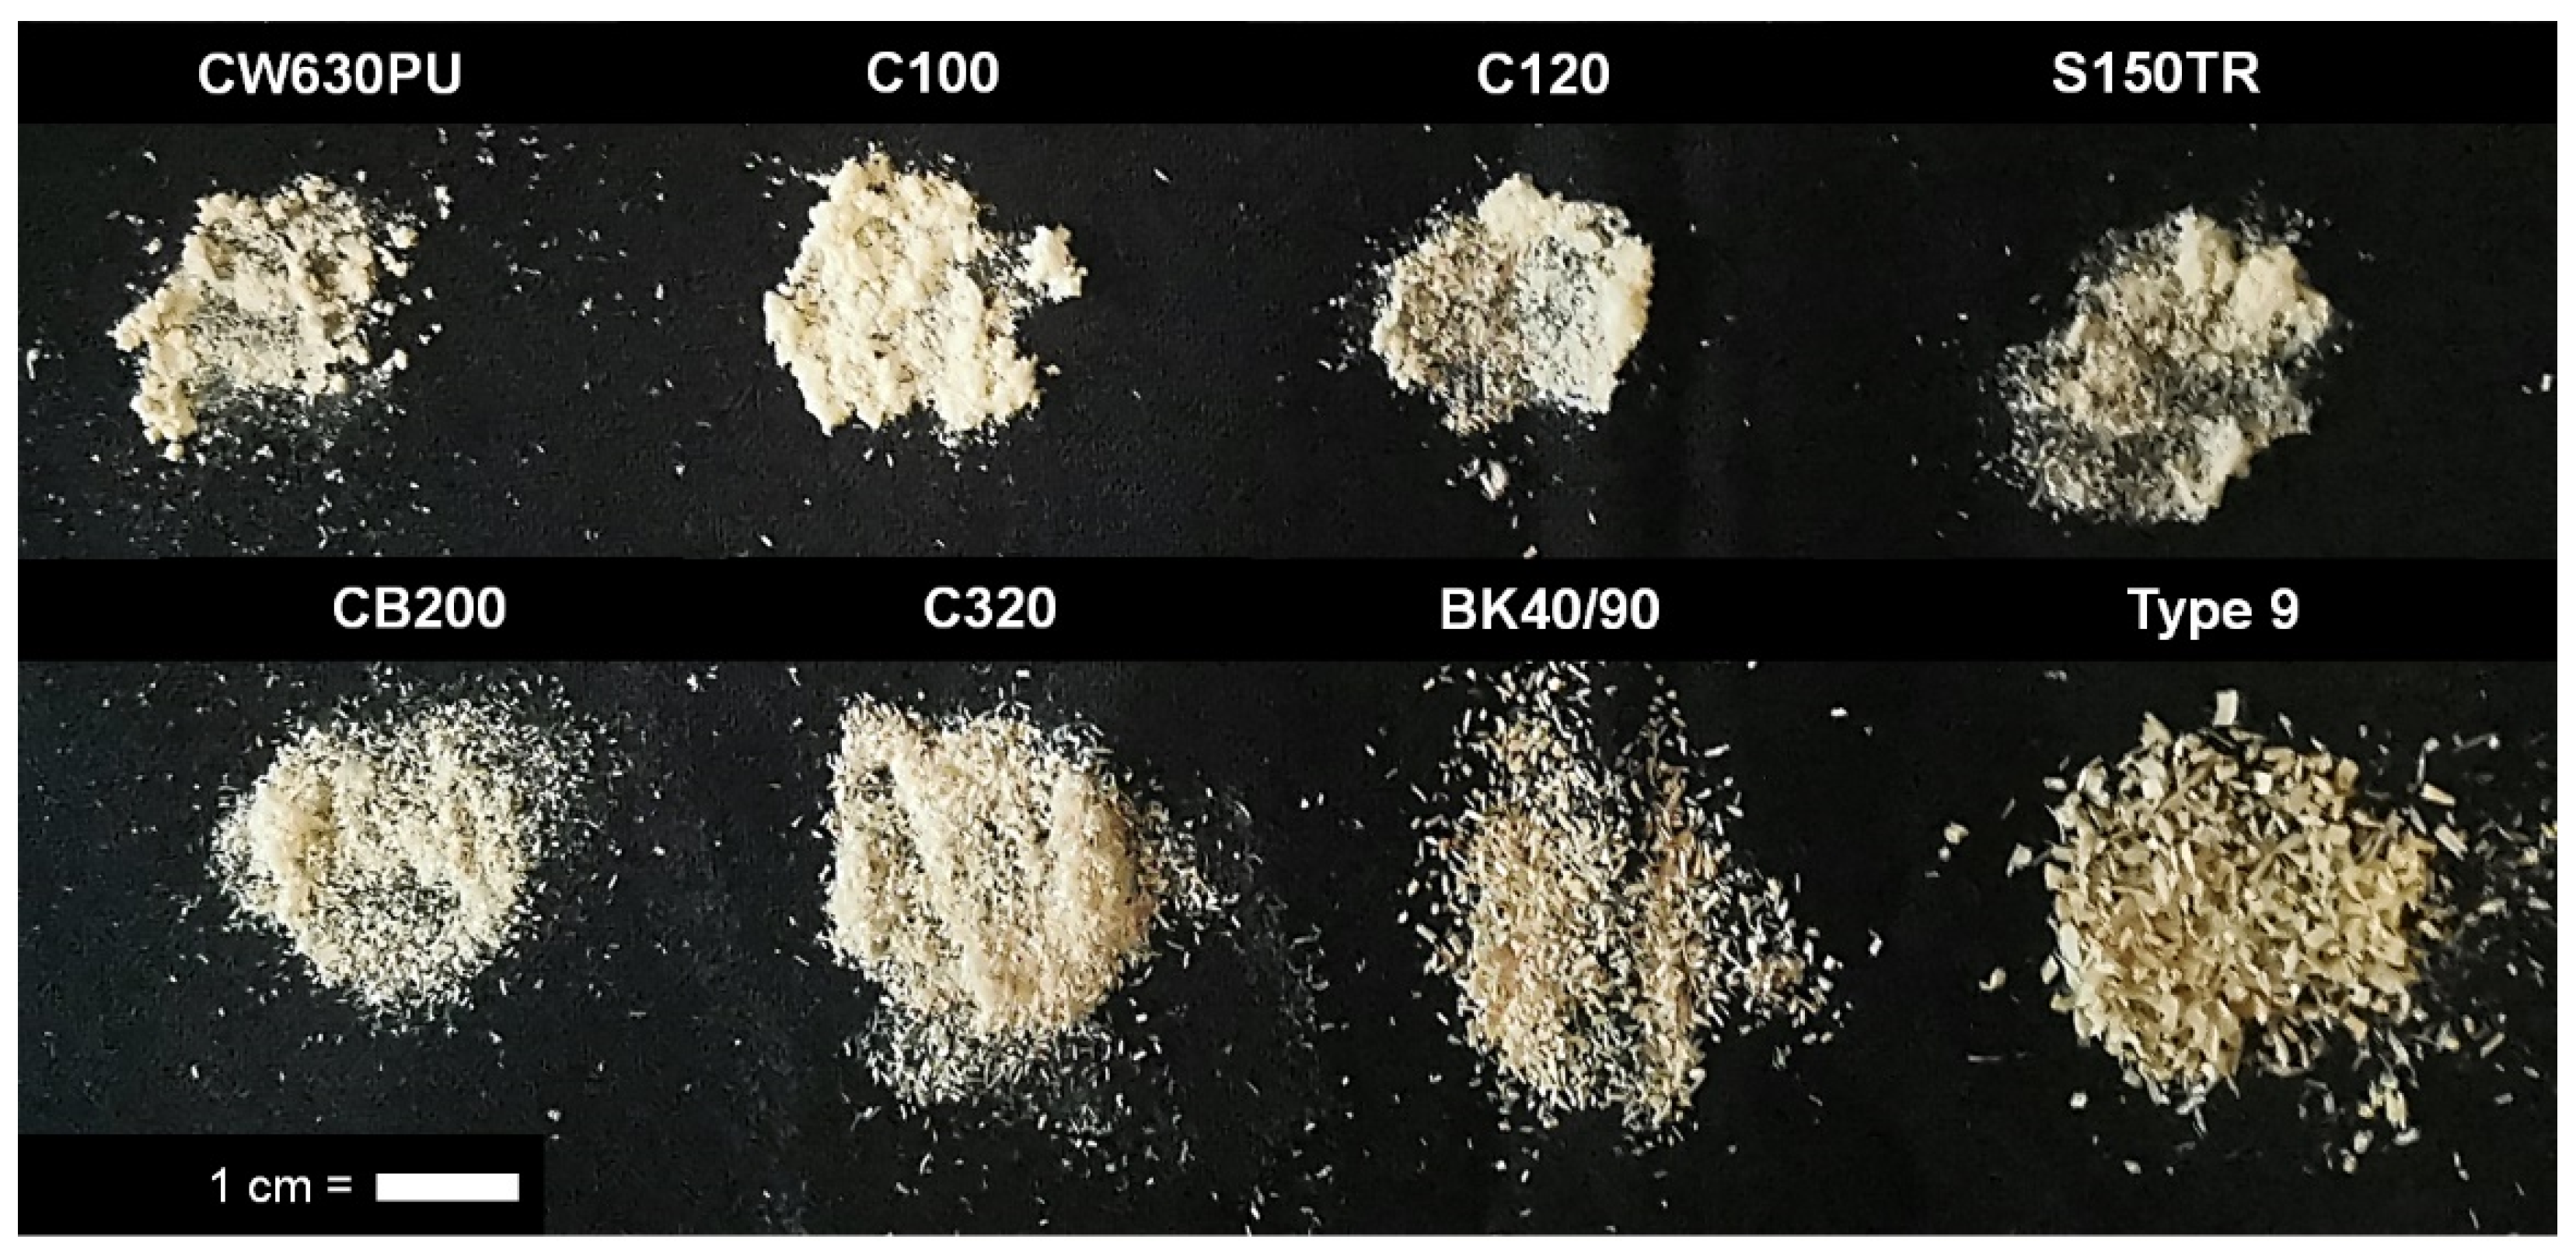
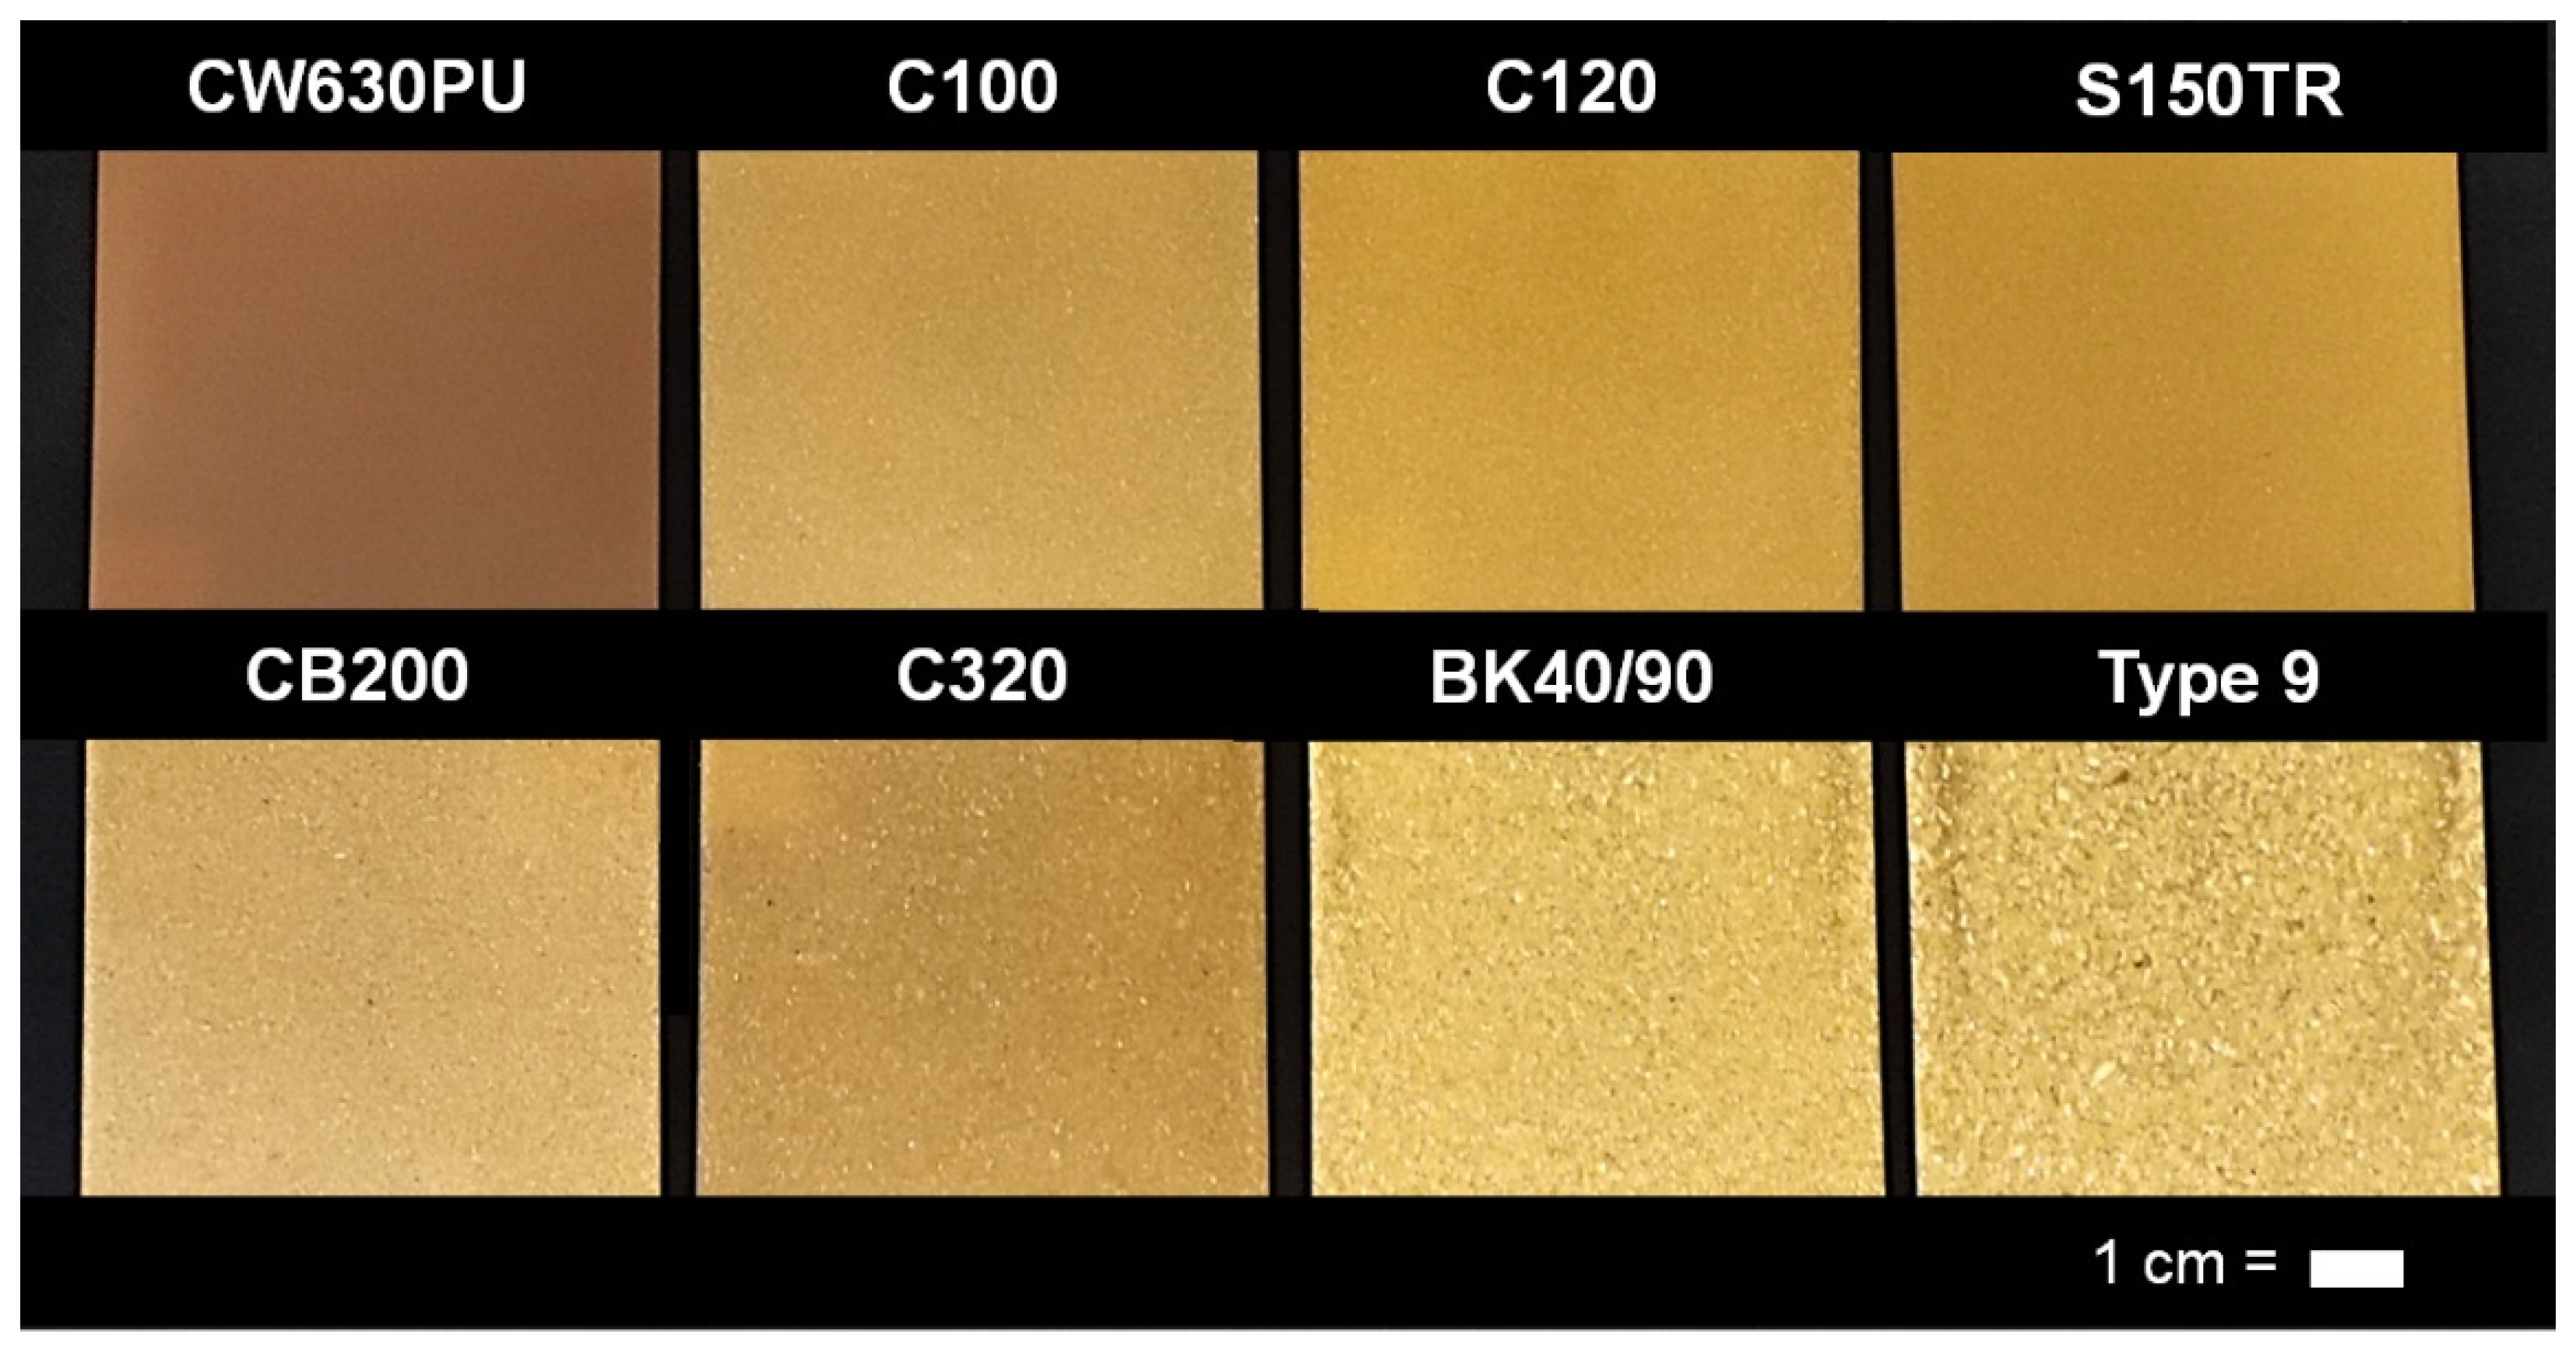
As a visual representation of the different particle sizes used, photographs from the wood particles, as well as the WPC, are shown here. In Figure 7, one can see the range of sizes, from very fine “dust” up to coarser particles. With the finer particles, what can be seen by the naked eye are often not the single wood particles (e.g., which are about 36 µm in diameter on average for CW630PU) but agglomerates from these. When the wood particles are coarser (starting from CB200), that effect cannot be seen anymore. These wood particle sizes translate into different appearances in the WPC, as shown in Figure 8. We chose the WPC containing 20 wt% of wood, as with the lower wood content, single particles are more visible. What we can see is that the appearance of the WPC changes from being a more uniform color with the fiber wood particles to a coarser, more particulate appearance. Also, the finest two grades give a darker, more brown shade, while with increasing particle size, the overall color becomes more yellowish. For the finer grades, with the higher specific surface, more of the wood components can give rise to color, which is most likely to be from lignin being brought to the wood particle surface in the process. Also, with finer wood particles, in melt processing, shear will increase, which can also add to the color.
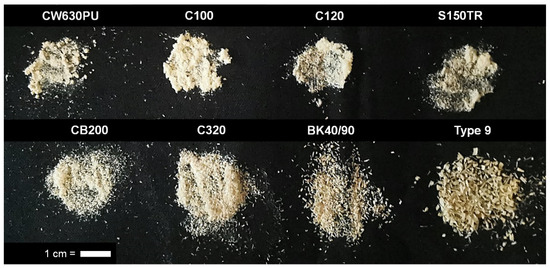
Figure 7.
Photograph of the different wood particles used in this study (scale bar represents 1 cm).

Figure 8.
Photograph of the different wood–plastic composites (each containing 20 wt% of wood) used in this study (scale bar represents 1 cm).
The differences that can be seen between the water uptake curves emerge from the different particle sizes of the used softwood particles. To compare these, from the particle size measurements, the volume moment mean D[4,3] was calculated, which is the sum of the particle diameter to the 4th power divided by the sum of the particle diameter to the 3rd power. This gives a single mean value to better compare particle distributions for composite properties, as the smaller particles add in number, but their share contributes less to the volume fraction and thus shows less influence on composite properties. The different values for the wood particles used are given in Table 3. Using the D[4,3] to compare the different maximum water uptake rates kmax, one can see that the behavior differs depending on the wood content of the composites (Figure 9). Meanwhile, for WPC with 20 wt% of wood, kmax increases with increasing wood particle size. For higher wood concentrations, we see the opposite behavior. In our opinion, this emerges from the fact that in small wood contents, the finer particles span less space in the composite; therefore water transport is more limited than for bigger particles. At higher wood shares, the finer particles exhibit higher interface areas (as the specific surface increases with decreasing particle size), thus inverting the effect, as here, the water transport network through the composite is improved. In the literature, a different behavior was reported, i.e., that the larger wood particles took up more water than the finer ones [11]. Comparing these results with ours, one can see that the wood particles used in that study are significantly bigger, more in the mm size scale, than we used here, which explains the difference. Our WPC with the overall finer particles is more homogeneous than the WPC with mm-sized wood. We have chosen the finer particles for our study because the particles need to be fine enough to pass through this region of the cavities for injection molding.
Table 3.
Results from particle size distribution measurements of the different wood particles used in this study, where d is the diameter on the cumulative size distribution with indices 10, 50, and 90, indicating that 10, 50, or 90% of the wood particles are smaller than that particular diameter and D[4,3] being the volume moment mean.
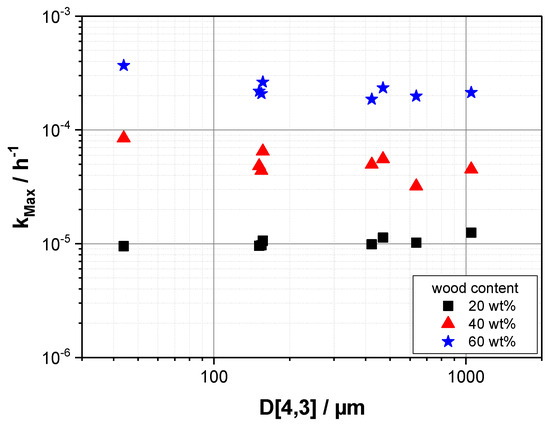
Figure 9.
Maximum water uptake rate kmax in relation to average wood particle D[4,3] size for wood–plastic composites with different wood content in PP-50.
As the maximum water uptake is not dependent on the wood particle size but on the share of the wood particles (as shown before), this is not shown here. Another observation can be made from Figure 9 that particles with similar D[4,3] show similar kmax, but not exactly the same. The reason for this is that using D[4,3] is a simplification, as we approximate the wood particles basically as spherical, which does not take the particle shape into account, but for the sake of visually well-understandable comparisons, we chose this simplification. An example of that deviation is shown in Figure 10, where three wood grades are compared visually (by means of SEM micrographs), which exhibit very similar D[4,3] values. While two of the grades (C100 and C120) exhibit a mixture of smaller and larger particles, in the micrographs of the third grade (S150TR), these bigger, longer particles are less visible. These smaller differences give rise to the also small but visible differences in kmax.
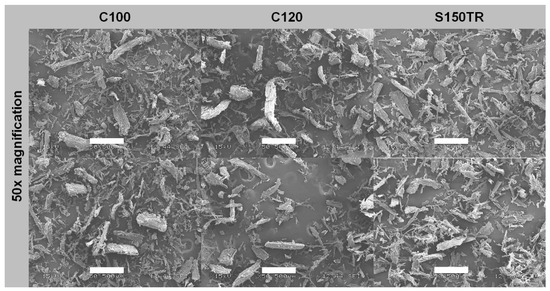
Figure 10.
SEM micrographs of selected wood particles (C100, C120, S150TR). The scale bar represents 500 µm.
3.5. Influence of Water Uptake on the Mechanical Properties of Wood–Plastic Composites
The last remaining question for this research is how the water uptake influences the mechanical properties of the different wood–plastic composites. As solid wood itself takes up water, it becomes less rigid, so any softening effects could influence the properties of profiles and parts, and loads could be deforming the wet composites, which should not deform dry ones. This would be quite relevant in different outdoor applications, but also in such where the relative humidity changes often. In the figures shown below (Figure 11, Figure 12 and Figure 13), the water uptake of the samples is related to the wood share for easier comparison of different formulations. The mechanical properties are related to the same property at the starting time t0 for better comparability. What the reader has to keep in mind is that the absolute values of the properties are different. In the case of the elastic modulus, the values are much higher for the composites containing a higher share of wood particles, and in succession, a decrease of 10% is a bigger effect for the samples with higher wood content, but still resulting in higher absolute values for the sample with higher wood content than for the ones with lower wood content. So, the figures provide good comparability, but the values cannot be compared directly.
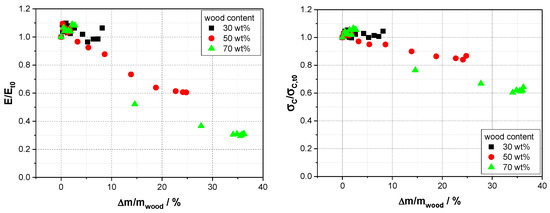
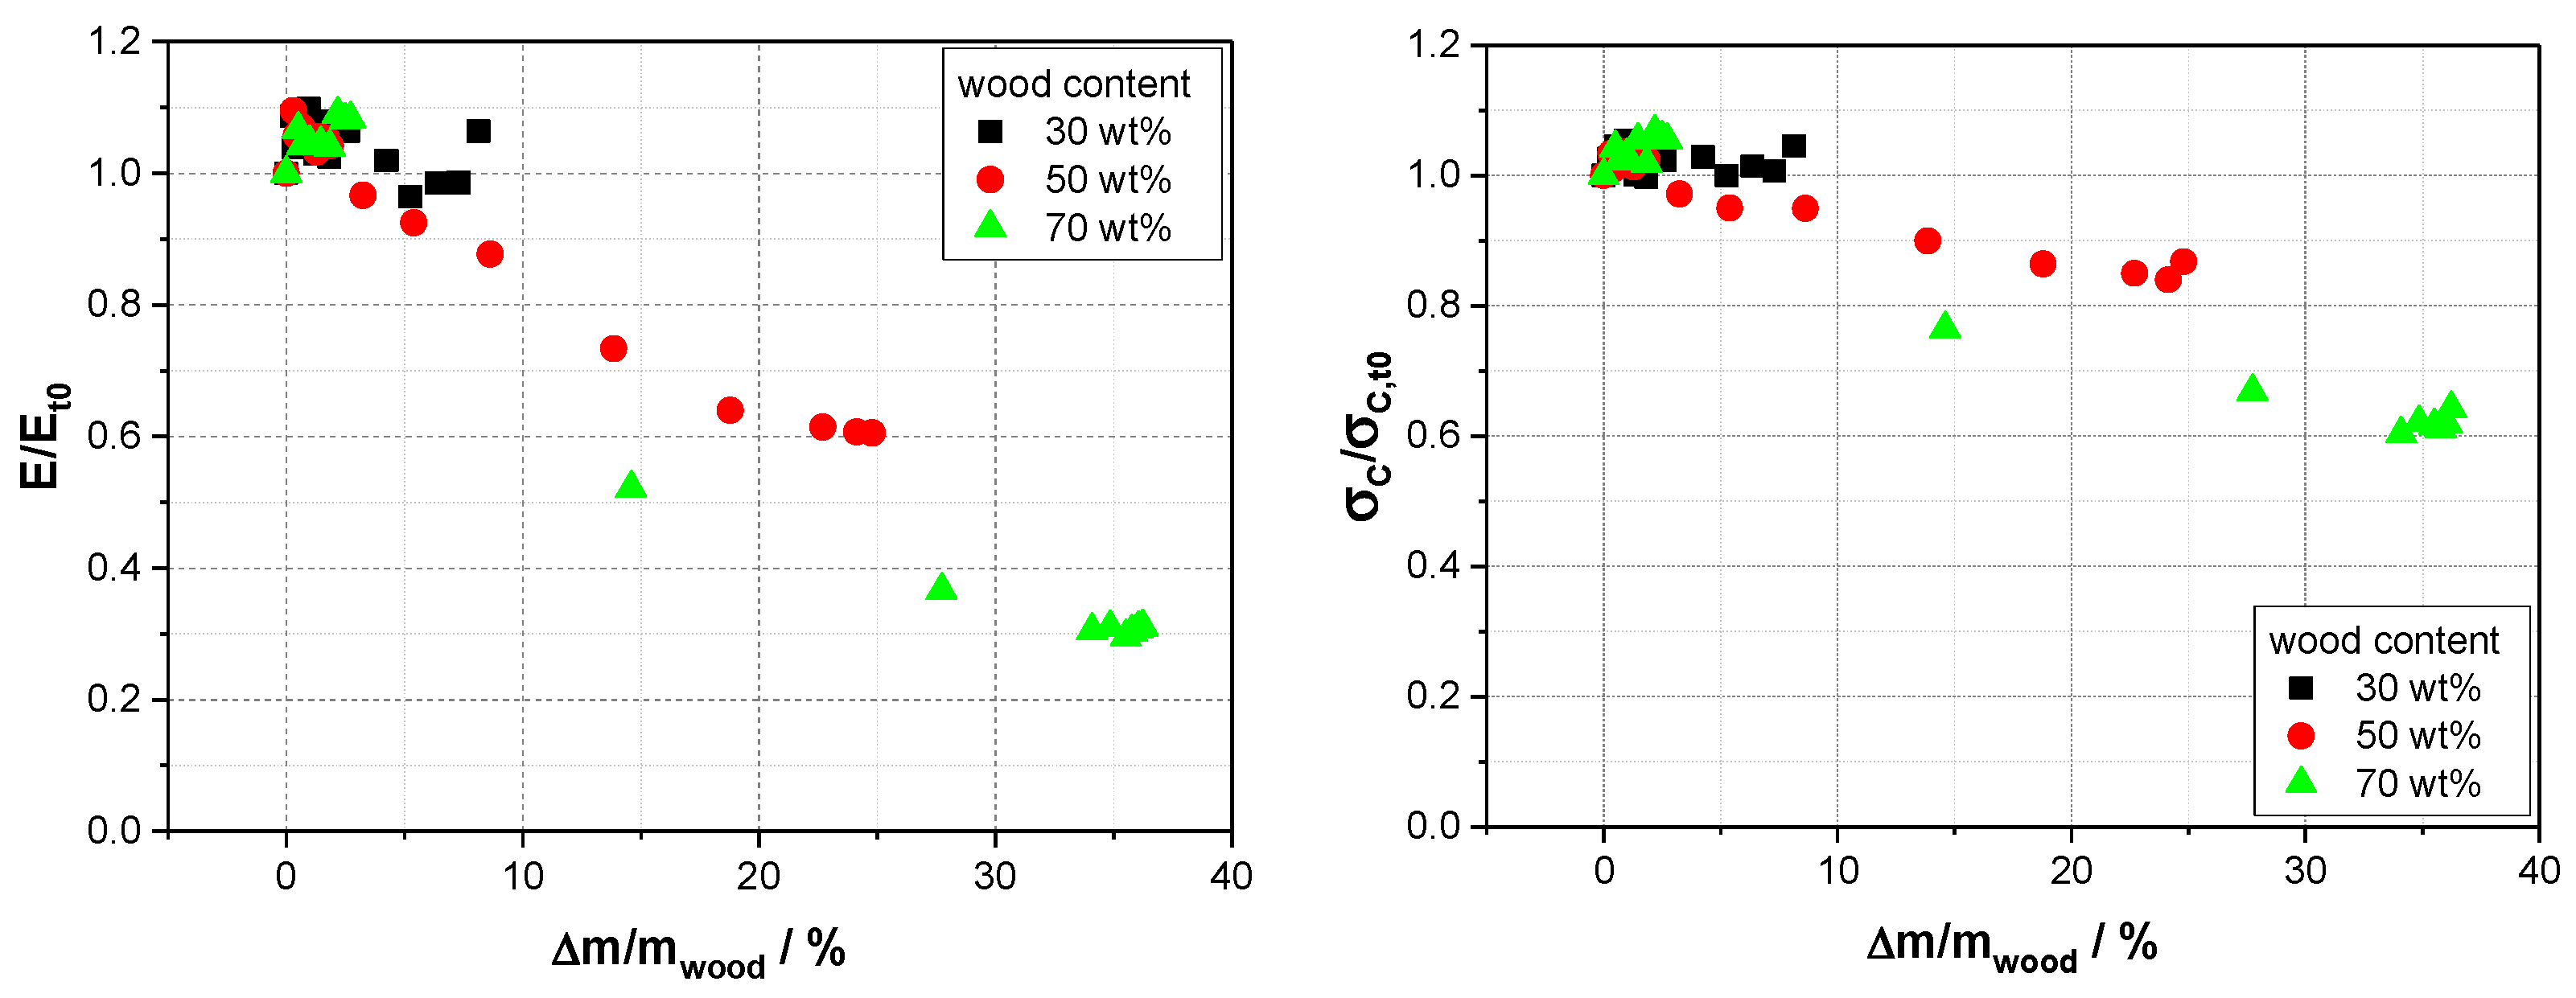
Figure 11.
Relative elastic modulus (E/Et0, (left)) and relative tensile strength (σc/σc,t0, (right)) vs. wood moisture content for wood–plastic composites with different amounts of softwood particles (CW630PU) in PP-8.

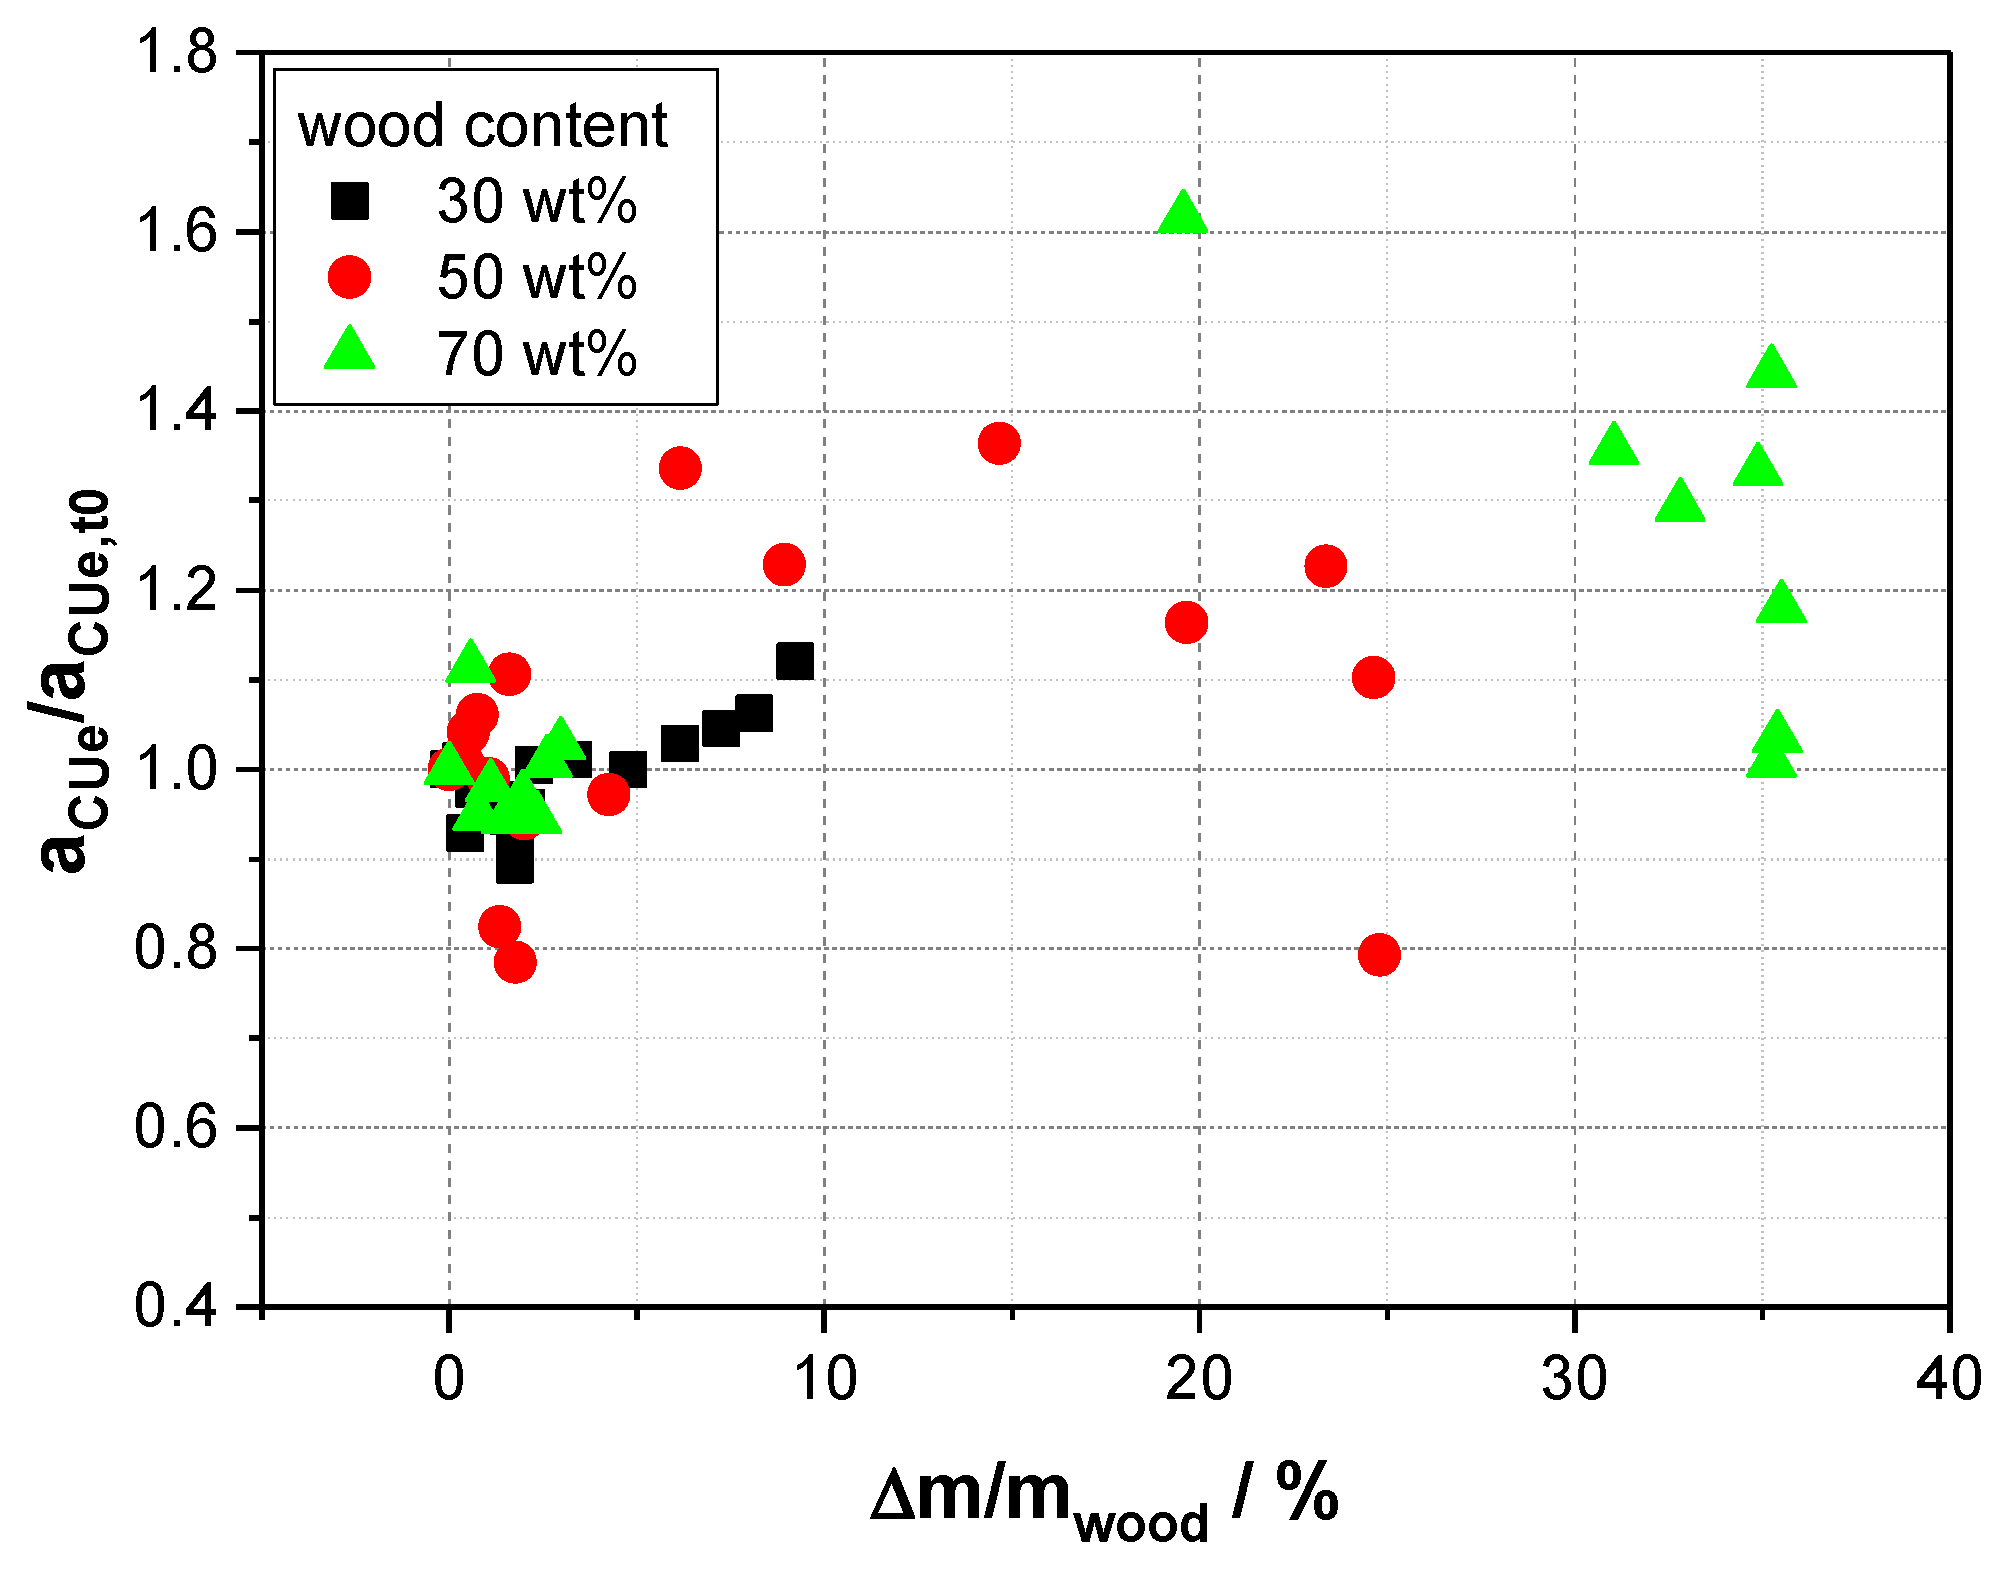
Figure 12.
Relative unnotched impact strength (acUe/acUe,t0) vs. wood moisture content for wood–plastic composites with different amounts of softwood particles (CW630PU) in PP-8.
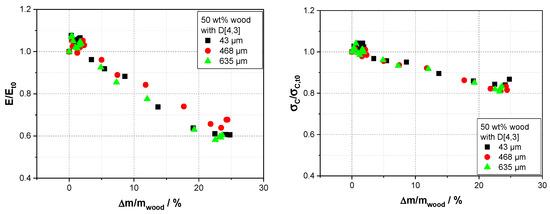
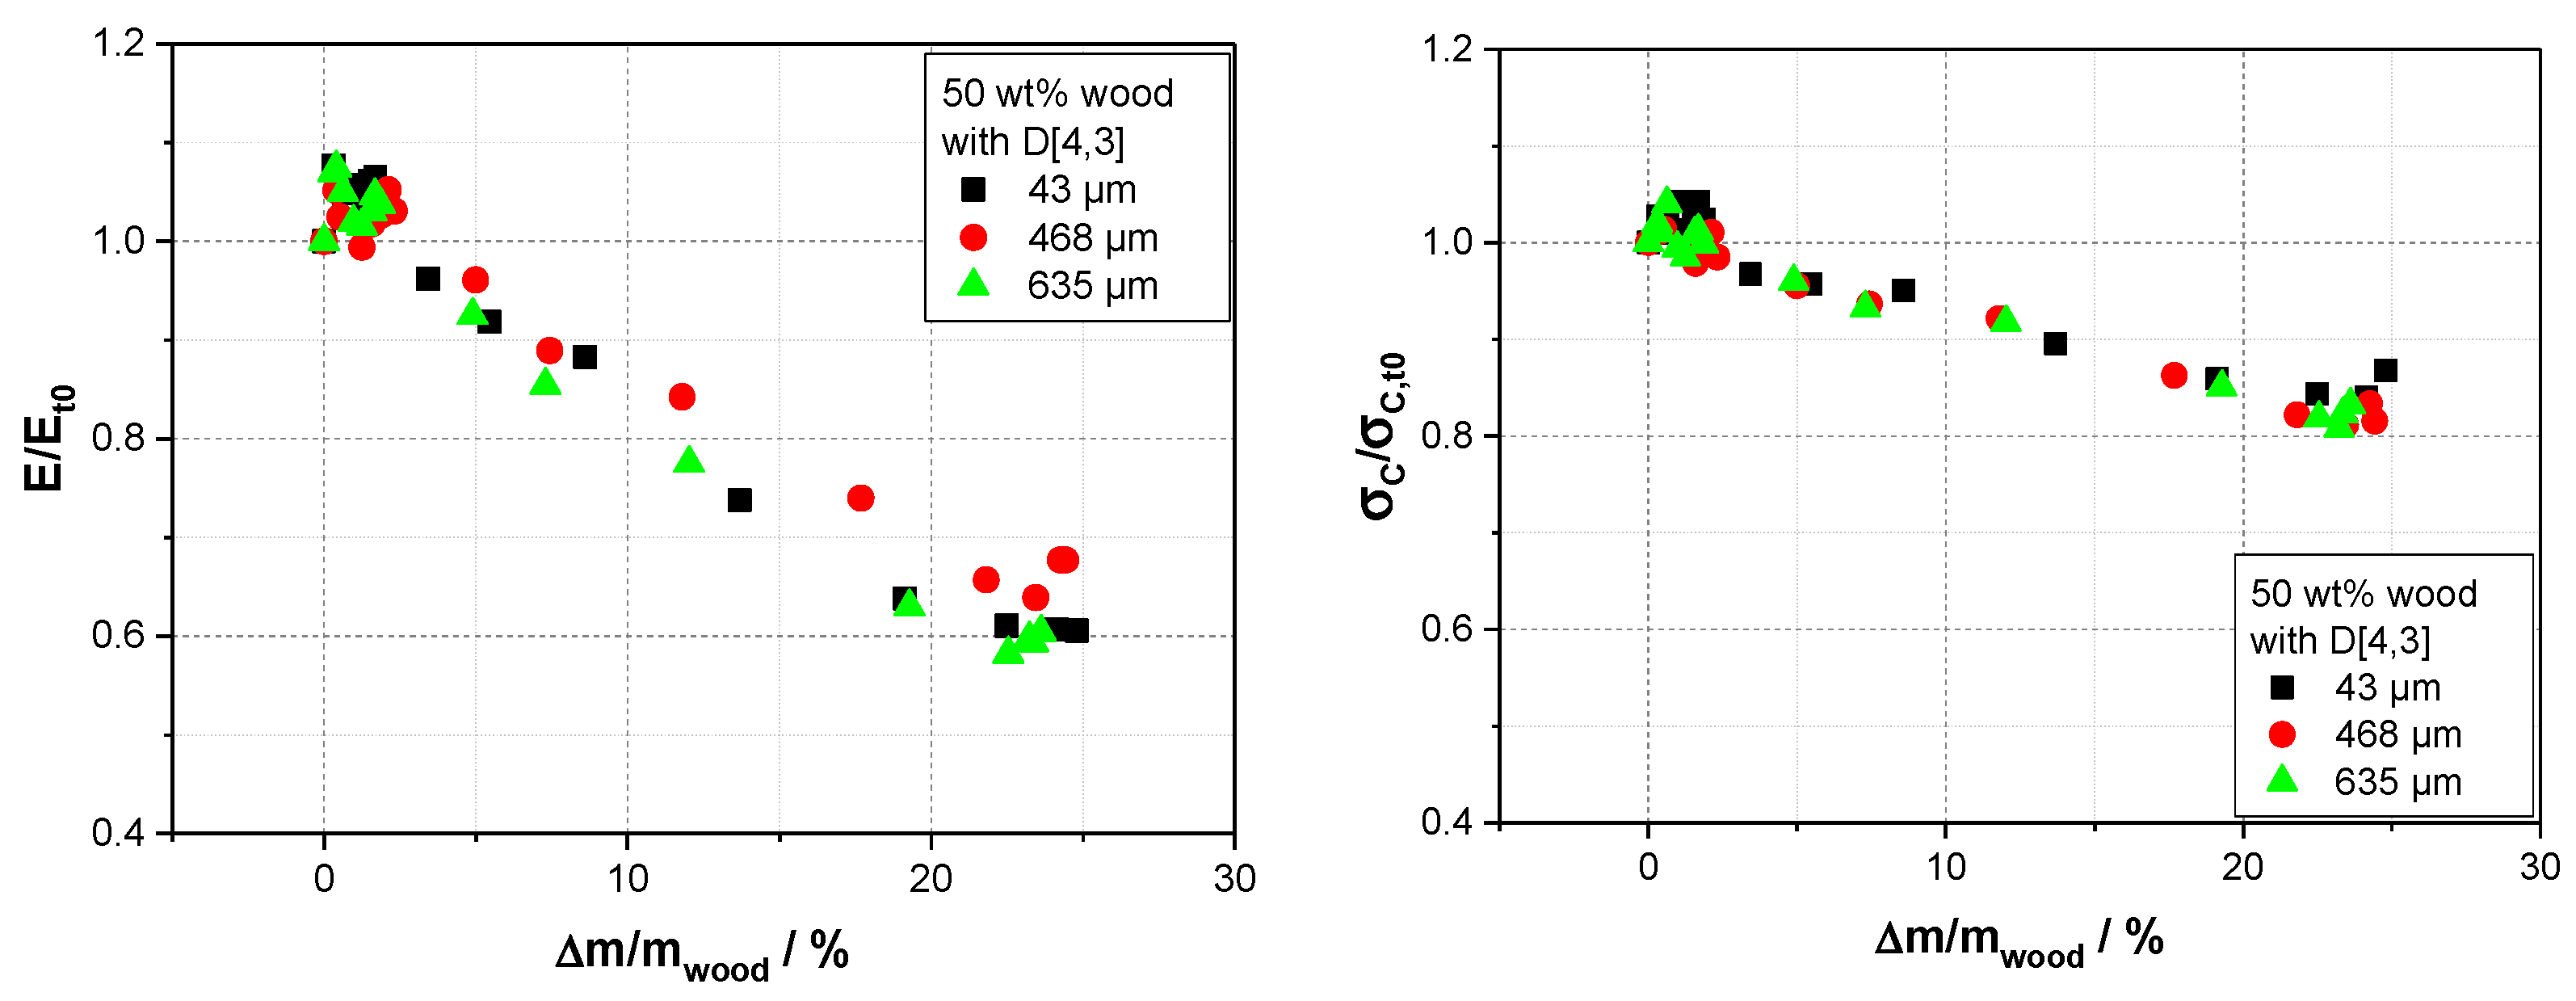
Figure 13.
Relative elastic modulus (E/Et0, (left)) and relative tensile strength (σc/σc,t0, (right)) vs. wood moisture content for wood–plastic composites with 50 wt% of different softwood particles (CW630PU, C320, BK40/90) in PP-8.
With increasing moisture content in the wood, the elastic modulus is decreasing (Figure 11). Besides some scattering, the trend for the reduction directly correlates with the water taken up, i.e., the higher the water content, the higher the reduction is. For the low wood content (30 wt%), the values stay approx. the same, while for higher wood content, a distinct decrease can be seen. This decrease is more severe for higher wood content, as these composites take up more water (as the specimens were all stored under water for comparable times up to 4000 h, the composites with 50 and 70 wt% of wood were already at their saturation). As these reductions fall within one line as a first approximation, one can deduce that the property reduction is due to the softening of the wood. Also, as elastic modulus is measured at low strains, the interfacial adhesion plays a minor role, so any water uptake or hydrolyzing effects there would most likely not be visible. In the case of the tensile strength, we see a similar picture but with a distinct difference (Figure 11). Here, the tensile strength is reduced with increased water uptake, but the slopes of the property reduction clearly correlate with the wood content. This is an indication that also the interface is also negatively influenced. Therefore the property degradation is more severe at the composites with higher wood contents at comparable wood moisture levels—if the interface would not be influenced, then the slopes should be the same. In the case of the impact strength (Figure 12), no clear trend can be observed, as the scattering within these data points is rather high for the composites with 50 and 70 wt% wood. For the composites with 30 wt% wood, some increase can be seen in the impact strength due to the softening of the wood.
While the wood content shows a distinct influence on the changes in composite properties, the wood particle size does not. As shown in in Figure 13, the elastic modulus is reduced with increasing amount of moisture in the wood particles, but all the data points form a line (besides some scattering). This means that particle size does not influence property reduction, only the water uptake speed, as shown above (Figure 7). The same is true for the tensile strength, with the only difference being that the slope of the reduction with the moisture content is less steep than the one for the elastic modulus.
4. Conclusions
In this work, we investigated the water uptake behavior of different injection molded wood–plastic composites. We found that the water uptake of the injection molded specimens is mainly happening via the cut surfaces at the end of the specimen, while the skin surface, formed as the melt is cooled down on the metal in the mold, exhibits a layer of plastic skin which greatly reduces water uptake. For modeling, we applied a simple saturation model, which can be used to fit the water uptake as the weight gain over time. The saturation concentration of moisture in the wood correlates with the equilibrium moisture content of the wood itself, and the model enables us to calculate maximum water uptake rates to compare different formulations. Also, we saw that at lower surrounding moisture, the general water uptake behavior is the same for underwater storage but with less saturation moisture. Wood particle size shows a distinct influence (besides the wood content), especially at higher wood concentrations on the specific surface, and therefore, the water pathways increase throughout the WPC. Therefore smaller wood particles show a higher water uptake speed at comparable loadings.
The mechanical properties of WPC, especially elastic modulus and tensile strength, are reduced with increasing water uptake—while the wood content shows some differences, i.e., with increasing wood content, the reduction of properties is higher, the wood particle size shows no influence, i.e., the reduction of the properties correlates with the moisture content of the WPC. Overall, we have shown that moisture uptake is heavily dependent on the formulation parameters, so with the data and model provided, one can estimate the behavior of specific WPCs, which could be helpful for application development.
Author Contributions
Conceptualization, C.B. and K.R.; methodology, C.B. and K.R.; validation, C.B.; formal analysis, C.B.; investigation, C.B. and K.R.; resources, C.B.; writing—original draft preparation, C.B.; writing—review and editing, C.B. and K.R.; visualization, C.B.; supervision C.B.; funding acquisition, C.B. All authors have read and agreed to the published version of the manuscript.
Funding
This research was partially funded by the Upper Austrian government through the project “Marzypan”.
Data Availability Statement
Data are available on request from the authors.
Acknowledgments
C.B. acknowledges his team of technicians for carrying out part of the lab work.
Conflicts of Interest
Author C.B. is employed by Transfercenter für Kunststofftechnik GmbH, author K.R. is employed by Furukawa Electric Institute of Technology Ltd., all authors declare no conflict of interest. The funders had no role in the design of the study; in the collection, analyses, or interpretation of data; in the writing of the manuscript; or in the decision to publish the results.
References
- Wambua, P.; Ivens, J.; Verpoest, I. Natural fibres: Can they replace glass in fibre reinforced plastics? Compos. Sci. Technol. 2003, 63, 1259–1264. [Google Scholar] [CrossRef]
- Espert, A.; Vilaplana, F.; Karlsson, S. Comparison of water absorption in natural cellulosic fibres from wood and one-year crops in polypropylene composites and its influence on their mechanical properties. Compos. Part A Appl. Sci. Manuf. 2004, 35, 1267–1276. [Google Scholar] [CrossRef]
- Najafi, S.K.; Kiaefar, A.; Hamidina, E.; Tajvidi, M. Water absorption behavior of composites from sawdust and recycled plastics. J. Reinf. Plast. Compos. 2007, 26, 341–348. [Google Scholar] [CrossRef]
- Wang, W.; Morrell, J.J. Water sorption characteristics of two wood-plastic composites. For. Prod. J. 2004, 54, 209–212. [Google Scholar]
- Kazemi, N.S.; Mehdi, T.; Elham, H. Effect of temperature, plastic type and virginity on the water uptake of sawdust/plastic composites. Eur. J. Wood Wood Prod. 2007, 65, 377–382. [Google Scholar] [CrossRef]
- Butylina, S.; Martikka, O.; Kärki, T. Comparison of water absorption and mechanical properties of wood–plastic composites made from polypropylene and polylactic acid. Wood Mater. Sci. Eng. 2010, 5, 220–228. [Google Scholar] [CrossRef]
- Hosseinihashemi, S.K.; Arwinfar, F.; Najafi, A.; Nemli, G.; Ayrilmis, N. Long-term water absorption behavior of thermoplastic composites produced with thermally treated wood. Measurement 2016, 86, 202–208. [Google Scholar] [CrossRef]
- Burgstaller, C.; Stadlbauer, W. Influence of chemical modification on the water uptake properties of wood plastic composites. J. Biobased Mater. Bioenergy 2012, 6, 380–387. [Google Scholar] [CrossRef]
- Najafi, S.K.; Sharifnia, H.; Tajvidi, M. Effects of water absorption on creep behavior of wood—Plastic composites. J. Compos. Mater. 2008, 42, 993–1002. [Google Scholar] [CrossRef]
- Mrad, H.; Alix, S.; Migneault, S.; Koubaa, A.; Perré, P. Numerical and experimental assessment of water absorption of wood-polymer composites. Measurement 2018, 115, 197–203. [Google Scholar] [CrossRef]
- Gozdecki, C.; Wilczyn, A. Effects of wood particle size and test specimen size on mechanical and water resistance properties of injected wood–high density polyethylene composite. Wood Fiber Sci. 2015, 47, 365–374. [Google Scholar]
- Turku, I.; Keskisaari, A.; Kärki, T.; Puurtinen, A.; Marttila, P. Characterization of wood plastic composites manufactured from recycled plastic blends. Compos. Struct. 2017, 161, 469–476. [Google Scholar] [CrossRef]
- Cui, Y.H.; Wang, X.X.; Xu, Q.; Xia, Z.Z. Research on moisture absorption behavior of recycled polypropylene matrix wood plastic composites. J. Thermoplast. Compos. Mater. 2011, 24, 65–82. [Google Scholar] [CrossRef]
- Kaboorani, A. Characterizing water sorption and diffusion properties of wood/plastic composites as a function of formulation design. Constr. Build. Mater. 2017, 136, 164–172. [Google Scholar] [CrossRef]
- Chang, W.P.; Kim, K.J.; Gupta, R.K. Moisture absorption behavior of wood/plastic composites made with ultrasound-assisted alkali-treated wood particulates. Compos. Interfaces 2009, 16, 937–951. [Google Scholar] [CrossRef]
- Gwon, J.G.; Lee, S.Y.; Chun, S.J.; Doh, G.H.; Kim, J.H. Effects of chemical treatments of hybrid fillers on the physical and thermal properties of wood plastic composites. Compos. Part A Appl. Sci. Manuf. 2010, 41, 1491–1497. [Google Scholar] [CrossRef]
- Saxena, M.; Gupta, M.K. Mechanical, thermal, and water absorption properties of hybrid wood composites. Proc. Inst. Mech. Eng. Part L J. Mater. Des. Appl. 2019, 233, 1914–1922. [Google Scholar] [CrossRef]
- Bahrami, M.; Abenojar, J.; Martínez, M.Á. Recent progress in hybrid biocomposites: Mechanical properties, water absorption, and flame retardancy. Materials 2020, 13, 5145. [Google Scholar] [CrossRef]
- Khan, M.Z.; Srivastava, S.K.; Gupta, M.K. A state-of-the-art review on particulate wood polymer composites: Processing, properties and applications. Polym. Test. 2020, 89, 106721. [Google Scholar] [CrossRef]
- Basalp, D.; Tihminlioglu, F.; Sofuoglu, S.C.; Inal, F.; Sofuoglu, A. Utilization of municipal plastic and wood waste in industrial manufacturing of wood plastic composites. Waste Biomass Valorization 2020, 11, 5419–5430. [Google Scholar] [CrossRef]
- Arman, N.S.N.; Chen, R.S.; Ahmad, S. Review of state-of-the-art studies on the water absorption capacity of agricultural fiber-reinforced polymer composites for sustainable construction. Constr. Build. Mater. 2021, 302, 124174. [Google Scholar] [CrossRef]
- Shi, S.Q.; Gardner, D.J.; Wang, J.Z. Estimating maximum water absorption of wood fiber/polymer fluff composites. Wood Fiber Sci. 2000, 32, 269–277. [Google Scholar]
- Lohmann, U. Holzhandbuch, 6th ed.; DRW-Verlag: Karlsruhe, Germany, 2005. [Google Scholar]


Disclaimer/Publisher’s Note: The statements, opinions and data contained in all publications are solely those of the individual author(s) and contributor(s) and not of MDPI and/or the editor(s). MDPI and/or the editor(s) disclaim responsibility for any injury to people or property resulting from any ideas, methods, instructions or products referred to in the content. |
© 2024 by the authors. Licensee MDPI, Basel, Switzerland. This article is an open access article distributed under the terms and conditions of the Creative Commons Attribution (CC BY) license (https://creativecommons.org/licenses/by/4.0/).