Article

Acoustic Emission during Non-Uniform Progression of Processes in Composite Failure According to the Von Mises Criterion

by
Sergii Filonenko
1,†,
Anzhelika Stakhova
2,*,†,
Adrián Bekö
2,† and
Alzbeta Grmanova
2,†
1
Department of Computerized Electrical Systems and Technologies, Aerospace Faculty, National Aviation University, Liubomyra Huzara Ave. 1, 03058 Kyiv, Ukraine
2
Department of Structural Mechanics, Faculty of Civil Engineering, Slovak University of Technology in Bratislava, Radlinského 11, SK-810 05 Bratislava, Slovakia
*
Author to whom correspondence should be addressed.
These authors contributed equally to this work.
J. Compos. Sci. 2024, 8(7), 235; https://doi.org/10.3390/jcs8070235
Submission received: 15 April 2024 / Revised: 13 June 2024 / Accepted: 21 June 2024 / Published: 24 June 2024
(This article belongs to the Section Composites Modelling and Characterization)

Abstract

:
In the study, based on the model of acoustic emission during the destruction of a composite material by shear force according to the Von Mises criterion, the effect of non-uniformity of the destruction process on the generated acoustic emission signal is simulated. The study under the accepted modeling conditions allows us to determine the patterns of changes in the amplitude envelope of acoustic emission signals at various stages of developing processes. In theoretical and experimental studies of acoustic emission signals when searching for patterns in their parameter changes and developing methods for monitoring or diagnosing the state of composite materials, the problem lies in the interpretation of recorded information. This issue arises from the complexity and diversity of processes occurring in the material structure at micro and macro levels, and the high sensitivity of the acoustic emission method to these processes, wherein structural changes lead to observable alterations in the characteristics of acoustic emissions. Solving this problem requires both theoretical and experimental studies to understand the influence of various factors on the characteristics of the generated acoustic emission. The results of the presented study can be used to assess the condition of composite materials and structures, such as bridges, e.g., in terms of defectiveness, property dispersion, damage during operation, and other characteristics.

1. Introduction

Composite materials (CM) are widely utilized in various industries such as aviation, civil construction, and bridge construction [1,2,3]. Particularly in bridge construction [4,5] they demonstrate effectiveness due to outstanding characteristics, including high strength and durability. These materials not only contribute to reducing the weight of structures but also enhance their resilience to various environmental factors, which is critical for ensuring the reliability of infrastructure. The extensive use of CM is attributed to their physical-mechanical characteristics. They exhibit high stiffness and mechanical strength, have good damping properties, and possess high impact toughness. Additionally, their low coefficient of thermal expansion, wear resistance, high flexibility, corrosion resistance, and ability to maintain properties at high temperatures are crucial features [6,7,8]. These properties have made composite materials a key element in creating robust, lightweight, and durable structures across various applications.
However, CM are prone to brittle failure. The initiation of defects at micro and sub-micro levels and the accumulation of such damage may lead to severe destruction, loss of the material load-bearing capacity, and catastrophic product failures. Also, these processes can occur with high speed. Therefore, it is necessary to monitor the condition of the elements and assess the risks posed by the developing damage processes.
Traditional methods of product condition monitoring, such as visual inspection, color testing, ultrasonic testing, X-ray radiography and tomography, infrared thermography, and others, are aimed at detecting and localizing damages [9,10,11,12] with the possibility of performing a quantitative assessment. At the same time, to increase the reliability of methods for assessing the defects in CM and to follow the developing of underlying processes, as well as predicting the behavior and residual life a broad array of theoretical [13,14,15] and experimental [16,17,18] research is being carried out on the destruction processes of CM. The research focuses on finding criteria for assessing the condition and predicting the state of CM prior to failure. Various methods of obtaining information about the processes developing in the material structure under loading are employed. One such method is the acoustic emission (AE) method [19,20,21,22], which has a high sensitivity to the processes of deformation and destruction of materials at the sub-micro, micro, and macro levels. Theoretical studies, however, do not delve into the processes of AE signal formation. When the destruction of CM elements occurs, numerical modeling using the finite element method is employed to simulate stress changes (stress waves) that cause surface displacements resulting in AE waves [23,24,25].
In the investigation of destruction processes of composites various models are employed which include the phase field damage model [26], smeared damage model [27], and discrete damage model [28]. However, the fiber bundle model (FBM), widely used to represent CM, has gained popularity and finds an application also in the study of CM destruction under actions of tension and shear force [29,30,31,32].
The analysis of the CM destruction process using the FBM is founded on several principles. A discrete set of fibers (cells) exhibits linear elastic behavior with a constant Young’s modulus and fails in a brittle manner. The destruction of cells occurs sequentially and immediately upon reaching their limit strength. The local load at which cells are destroyed is assumed to be a random variable described by a specific probability density distribution function. When a cell is destroyed, the redistribution of the applied load to the remaining cells is determined. Typically, two scenarios are analyzed: equal load sharing (ELS), where the load is equally distributed among other cells in the material upon cell destruction, and local load sharing (LLS), where the load is redistributed only to the nearest, i.e., neighboring cells.
This research aims to identify patterns of destruction and to determine the time of complete CM destruction. It involves studying changes in the number of destroyed and remaining elements, alterations in stresses during CM element destruction, variations in the distribution of destruction avalanches, changes in the time of complete composite destruction under the influence of various factors, and other relevant parameters.
To analyse the destruction process of a composite material expressions were derived in [29] to calculate the number of remaining elements and accumulated AE energy. This study demonstrates that the patterns of their changes follow power laws until the moment nearing the complete destruction of the CM. In article [33] the destruction of a two-component system is explored, examining the distribution of the number of destroyed elements and determining the transition from brittle to ductile destruction of the material. In [34] the energy balance of the destruction process under the condition of uniform load distribution while using different distributions of destruction threshold levels is investigated. It is determined that as the critical point of destruction is approached the elastic energy is always greater than the total damage energy. This allows for the prediction of material destruction considering the relationship between the peak of elastic energy and the moment of destruction. The dynamics of avalanche fracture for a high-dimensional FBM are studied in [35], revealing that the average profile time of avalanche destruction development depends on the system dimension, varying from a highly asymmetric shape to a symmetric parabola. In study [36] the authors assumed a CM with a random distribution of elements and varying levels of interaction between matrix and fibers. These resulted in distribution densities of intact fibers over time, which depend on the applied force and the system size. Patterns in the change of elastic energy for different applied load levels during the destruction of CM elements were observed, as well as patterns in the time interval between two maxima of elastic energy variations. In analyzing the CM destruction process article [37] explores patterns in the change of failure time measured from threshold levels of initial destruction and various noise levels that were introduced into the destruction model. The study includes an analysis of the waiting time distribution for various fiber density distributions and the distribution of destruction avalanche sizes.
Study [32] explores patterns in changes of equivalent stresses (according to the logical “OR” and Von Mises criteria) and follows the number of remaining elements during the development of the material destruction process under shear force. In [38] the expressions for the number of remaining elements and the rate of AE energy release are presented. However, these expressions are applicable only when approaching complete material destruction. At the moment of destruction the studied functions are discontinuous. This limitation prevented obtaining an expression for the AE signal, i.e., a signal whose parameter changes can be used to develop methods for monitoring and predicting CM destruction. Articles [39,40,41] report investigations of the CM destruction process by shear force and the AE signal formation under the influence of various factors influencing the FBM. The authors applied the “OR” rule and the Von Mises criterion to describe CM destruction. Expressions for the number of remaining elements over time during CM destruction and, consequently, the generated AE signal were obtained. It was demonstrated that the continuity of the CM destruction process is accompanied by the formation of a continuous AE signal. The influence of various factors like loading speed or CM properties on the amplitude of the generated AE signals have been analyzed [39,40] and their influence on energy parameters likewise [41]. Patterns in the change of AE signal parameters under the influence of the studied factors were also obtained.
These studies revealed that, for a constant speed of the destruction process, the generated AE signal is a pulse signal with an accelerated increase in leading-edge amplitude and relaxation decrease in trailing-edge amplitude. This is due to the continuity of the destruction process at a constant speed. However, experimental AE signals [42,43] exhibit a complex envelope shape with surges and drops in amplitude, which may be attributed to the non-uniformity of the CM destruction process. To reliably interpret AE information and to ensure the robustness of methods for monitoring and diagnosing the CM condition, it is crucial to analyze how the non-uniformity of the CM destruction process influences the acoustic emission based on the Von Mises criterion.
In this work, we obtained analytical descriptions of AE signals formed during CM destruction by shear force, using the Von Mises criterion to define the failure of the CM in the form of bundles of fibers. The influence of various factors like rate of composite deformation, physical and mechanical characteristics of the composite, dispersion of composite properties, and the area of composite destruction on the parameters of generated AE signals have been investigated. Patterns in changes of the AE parameters were identified, forming the basis for the development of diagnostic tools and methods for monitoring the condition of a CM.
Simultaneously, the conducted experimental studies demonstrate that AE signals have a complex shape, evidently due to the non-uniformity of the destruction process. Conducting experimental studies on dynamic shifts through the processing of recorded signals additionally substantiates our understanding of composite material failure and contributes a scientific basis to the analysis of AE signals. From the perspective of the reliability of interpreting AE information and the robustness of methods for monitoring and diagnosing the condition of CM, it is crucial to analyze the influence of the non-uniformity of the CM destruction process during damage formation on the acoustic emission according to the Von Mises criterion.

2. Analysis

2.1. Simulation Conditions

This current development builds on previous investigations of the influence of loading speed on AE during the destruction of a composite by the authors [40], in which the governing formulas were derived. The investigation of the non-uniformity of the CM destruction according to the Von Mises criterion during changes in the developing process speed will be conducted in three stages. In the first stage of modeling, we will calculate and construct a pattern of equivalent stress changes over time t according to the Von Mises criterion. The adopted modeling parameter is the strain rate and the change of stress over time is described by the following expression,
σ m ( t ) = α t · 0.5 2 2 α t + α t 3 2 log 1 + α t 1 α t α t 3 2 2 1 α t α t + log 1 + 1 α t 1 1 α t ,
where σ m ( t ) is the equivalent stress change on CM elements over time with a linear input of strain ϵ = α t , where α is the strain rate. For the assumed time instant t 0 , at which the destruction of CM begins, we calculate the corresponding stress σ ( t 0 ) . We carry out the calculation according to the expression
σ ( t 0 ) = α t 0 · 0.5 2 2 α t 0 + α t 0 3 2 log 1 + α t 0 1 α t 0 α t 0 3 2 2 1 α t 0 α t 0 + log 1 + 1 α t 0 1 1 α t 0 .
In the second stage of modeling, we calculate the change in the number of remaining CM elements and the amplitude of AE signals over time as the process of CM destruction progresses according to the expressions
N ( t ) = N 0 · e v 0 t 0 t e r [ σ m ( t ) ] σ ( t 0 ) d t ,
U ( t ) = U 0 v 0 [ σ m ( t ) σ ( t 0 ) ] · e r [ σ m ( t ) σ ( t 0 ) ] · e v 0 t 0 t e r [ σ m ( t ) σ ( t 0 ) ] d t ,
where σ m ( t ) and σ ( t 0 ) are respectively the equivalent stress change in the CM elements over time and the threshold stress at t 0 (the initial time of CM destruction process); U 0 is the maximum possible displacement during the rapid CM destruction consisting of N 0 elements; v 0 and r are constants depending on the physical and mechanical characteristics of the CM.
From a kinetic point of view the fracture process consists of two stages, crack initiation and its propagation through the material. However, due to material dispersion properties, crack development can occur with inhibition or acceleration, i.e., with rate change of the destruction, specifically of stress. In the third stage, we simulate the change of strain rate α by increasing or decreasing it locally at certain points in time. Taking into account the linearity of the change of the AE signal amplitude with respect to α according to [40], we will calculate and plot the dependence of AE signal amplitudes over time as a proportional percentage increase or decrease in signal amplitude at the instants of local changes of α .
The simulation will be carried out in relative units with the following parameter values: loading speed α ˜ = 30 ; physical and mechanical characteristics: v ˜ 0 = 100,000, r ˜ = 10,000; initial time of CM destruction t ˜ 0 = 0.001 . The time interval Δ t k between AE signal amplitudes is chosen to be Δ t ˜ k = 1 · 10 7 .

2.2. Simulation Results

The calculation results, according to (1), for a linear strain input and the adopted parameters are shown in Figure 1. They are presented in terms of change in equivalent stress according to the Von Mises criterion given in relative units. From Figure 1, it can be observed that for a linear deformation input the change of stress over time exhibits a non-linear character.
Using expression (2) we calculate the stress at the initial time of CM destruction t ˜ 0 = 0.001 , that is at the beginning of the destruction process, which gives us the corresponding value of the initial destruction stress σ ˜ 0 = 0.023884393144868957 in relative units. For readability, this value can be approximated as σ ˜ 0 ( 0.001 ) = 0.023884 . The stress value is dimensionless as it has been normalized for the modeling purposes.
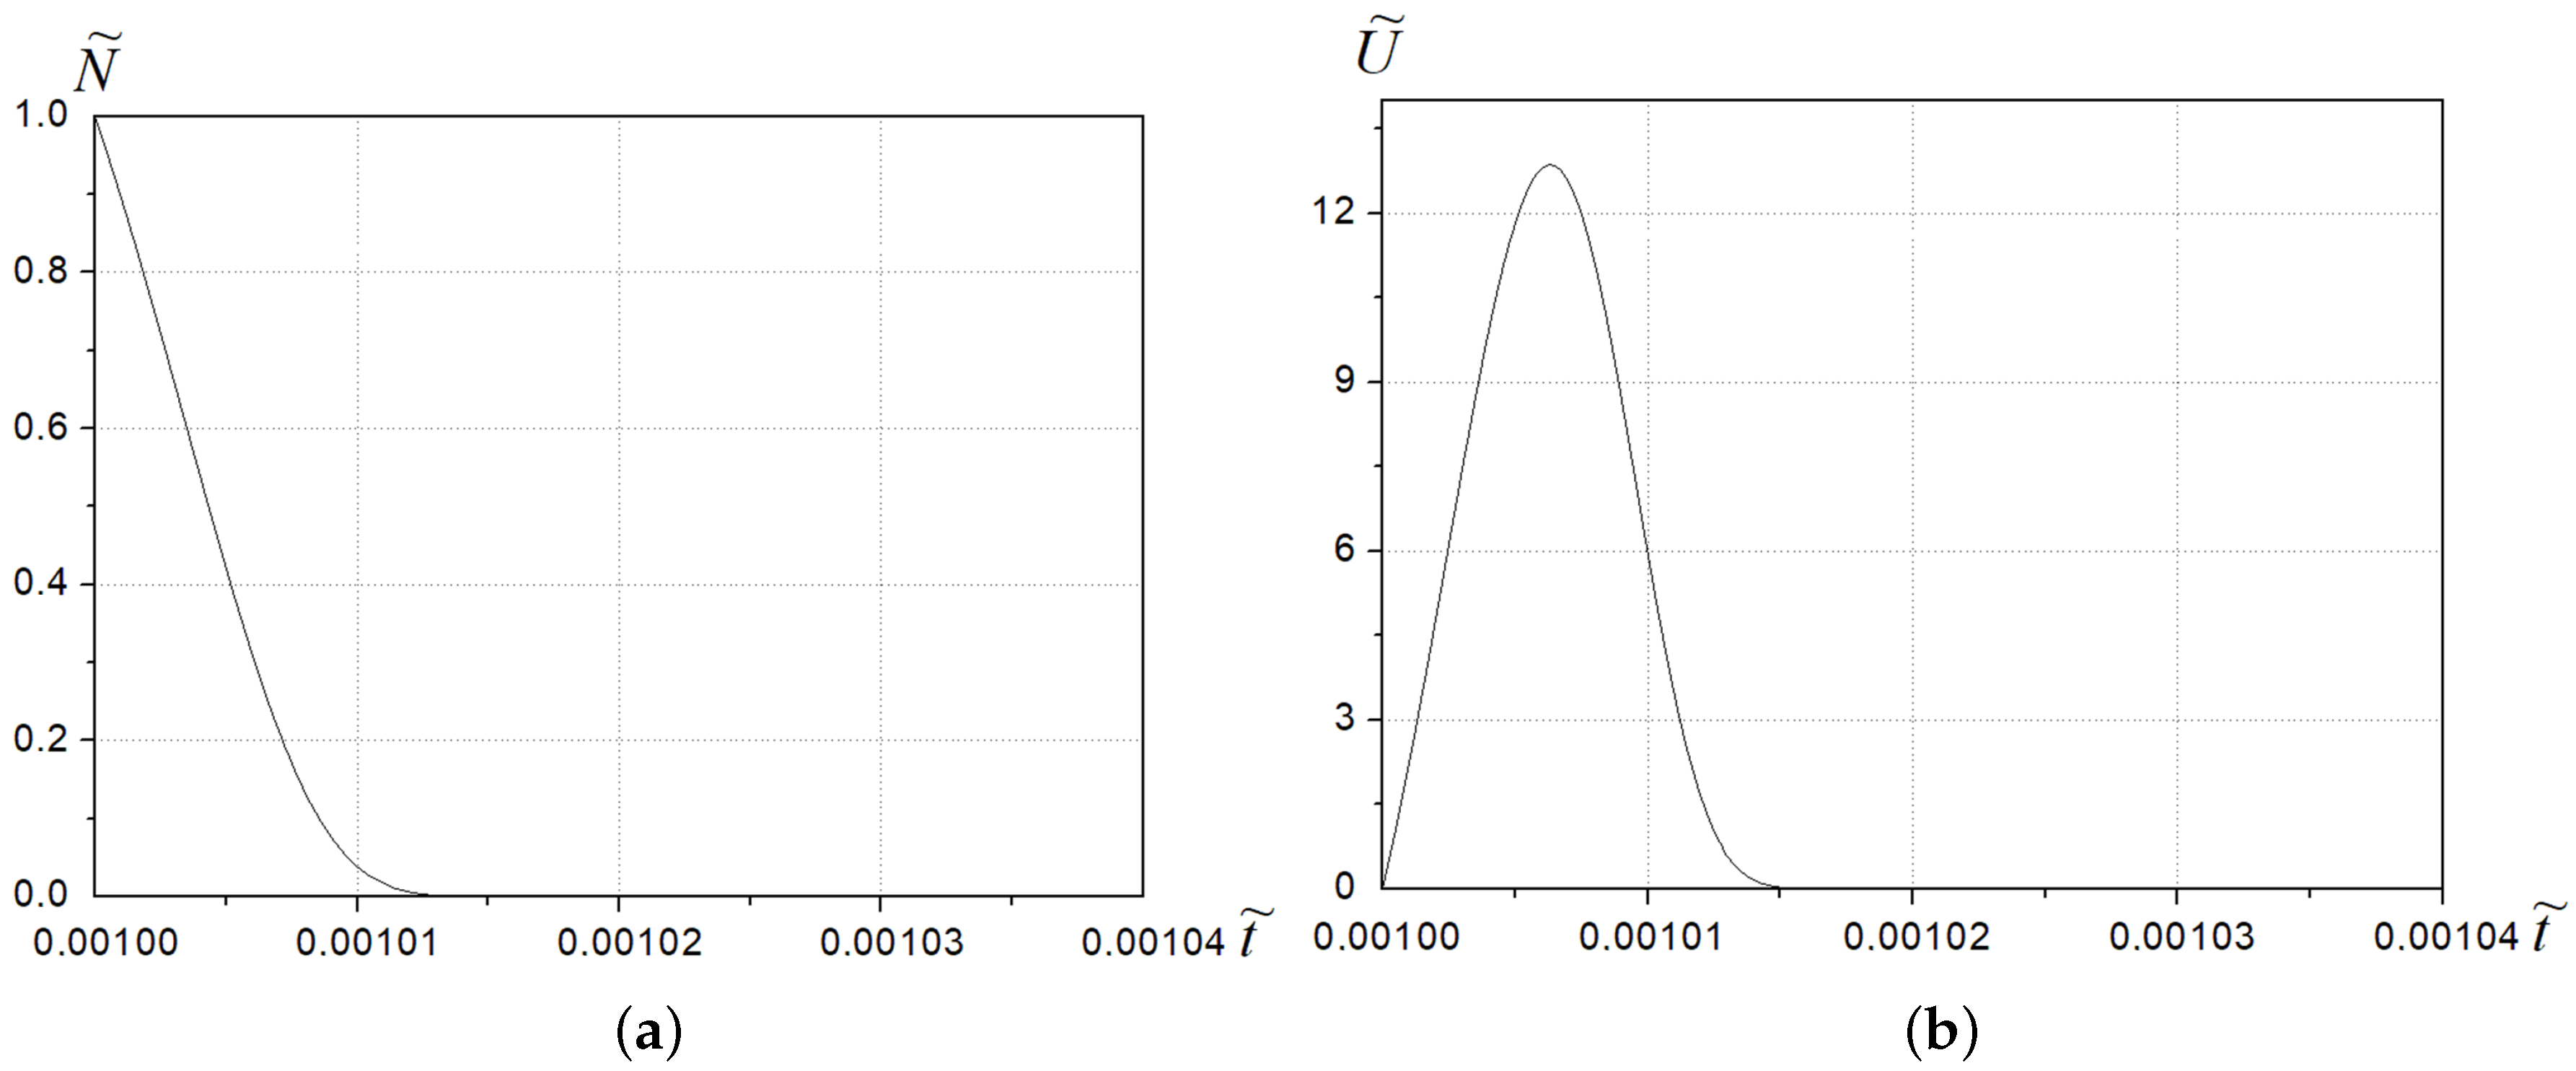
For the given value of threshold stress level σ ˜ 0 , the number of remaining CM elements and the AE signal amplitude over time were calculated using expressions (3) and (4). The results of calculations in relative units are given in Figure 2. Dependencies in Figure 2 are presented as N ˜ ( t ) = N ( t ) / N 0 and U ˜ ( t ) = U ( t ) / U 0 .
The obtained results indicate that, under the adopted modeling conditions, with the continuity of the CM destruction process (Figure 2a) a continuous AE signal is formed (Figure 2b). The AE signal exhibits an accelerated increase in the leading edge amplitude and an exponential decrease in the trailing edge amplitude.
Next, we model the non-uniformity of the destruction process of the composite with a local increase or decrease of speed α . The variation of the speed is introduced at the final stages of the destruction development at specific instances t ˜ i where i = 1 , 2 n , so that α ˜ τ = α ˜ + Δ α ˜ i , where Δ α ˜ i is local change of speed. In this case, we will assume that the change of stress occurs continuously. For this calculation, we will limit ourselves to the simplest case, a proportional percentage increase or decrease of signal amplitude at the moments of a local speed variation α ˜ τ , which is than returned to the original speed of the process development. The changes in speed are assumed to occur during the final stages of destruction development. We calculate the percentage increase of AE signal amplitude according to the equations obtained in [40].
Figure 3 shows the results of the AE signal amplitude for four different variations of the rate of the development process. Specifically, speed is increased by Δ α ˜ 1 = 2 , Δ α ˜ 1 = 3 , or decreased by Δ α ˜ 1 = 2 , Δ α ˜ 1 = 3 at a point in time t ˜ 1 = 1.0095 · 10 3 .
Figure 3 shows that, under the adopted modeling conditions, a local increase (advance) or decrease (inhibition) in the rate of development of the destruction process in the final stage leads to surges or drops in AE signal amplitude at the trailing edge.
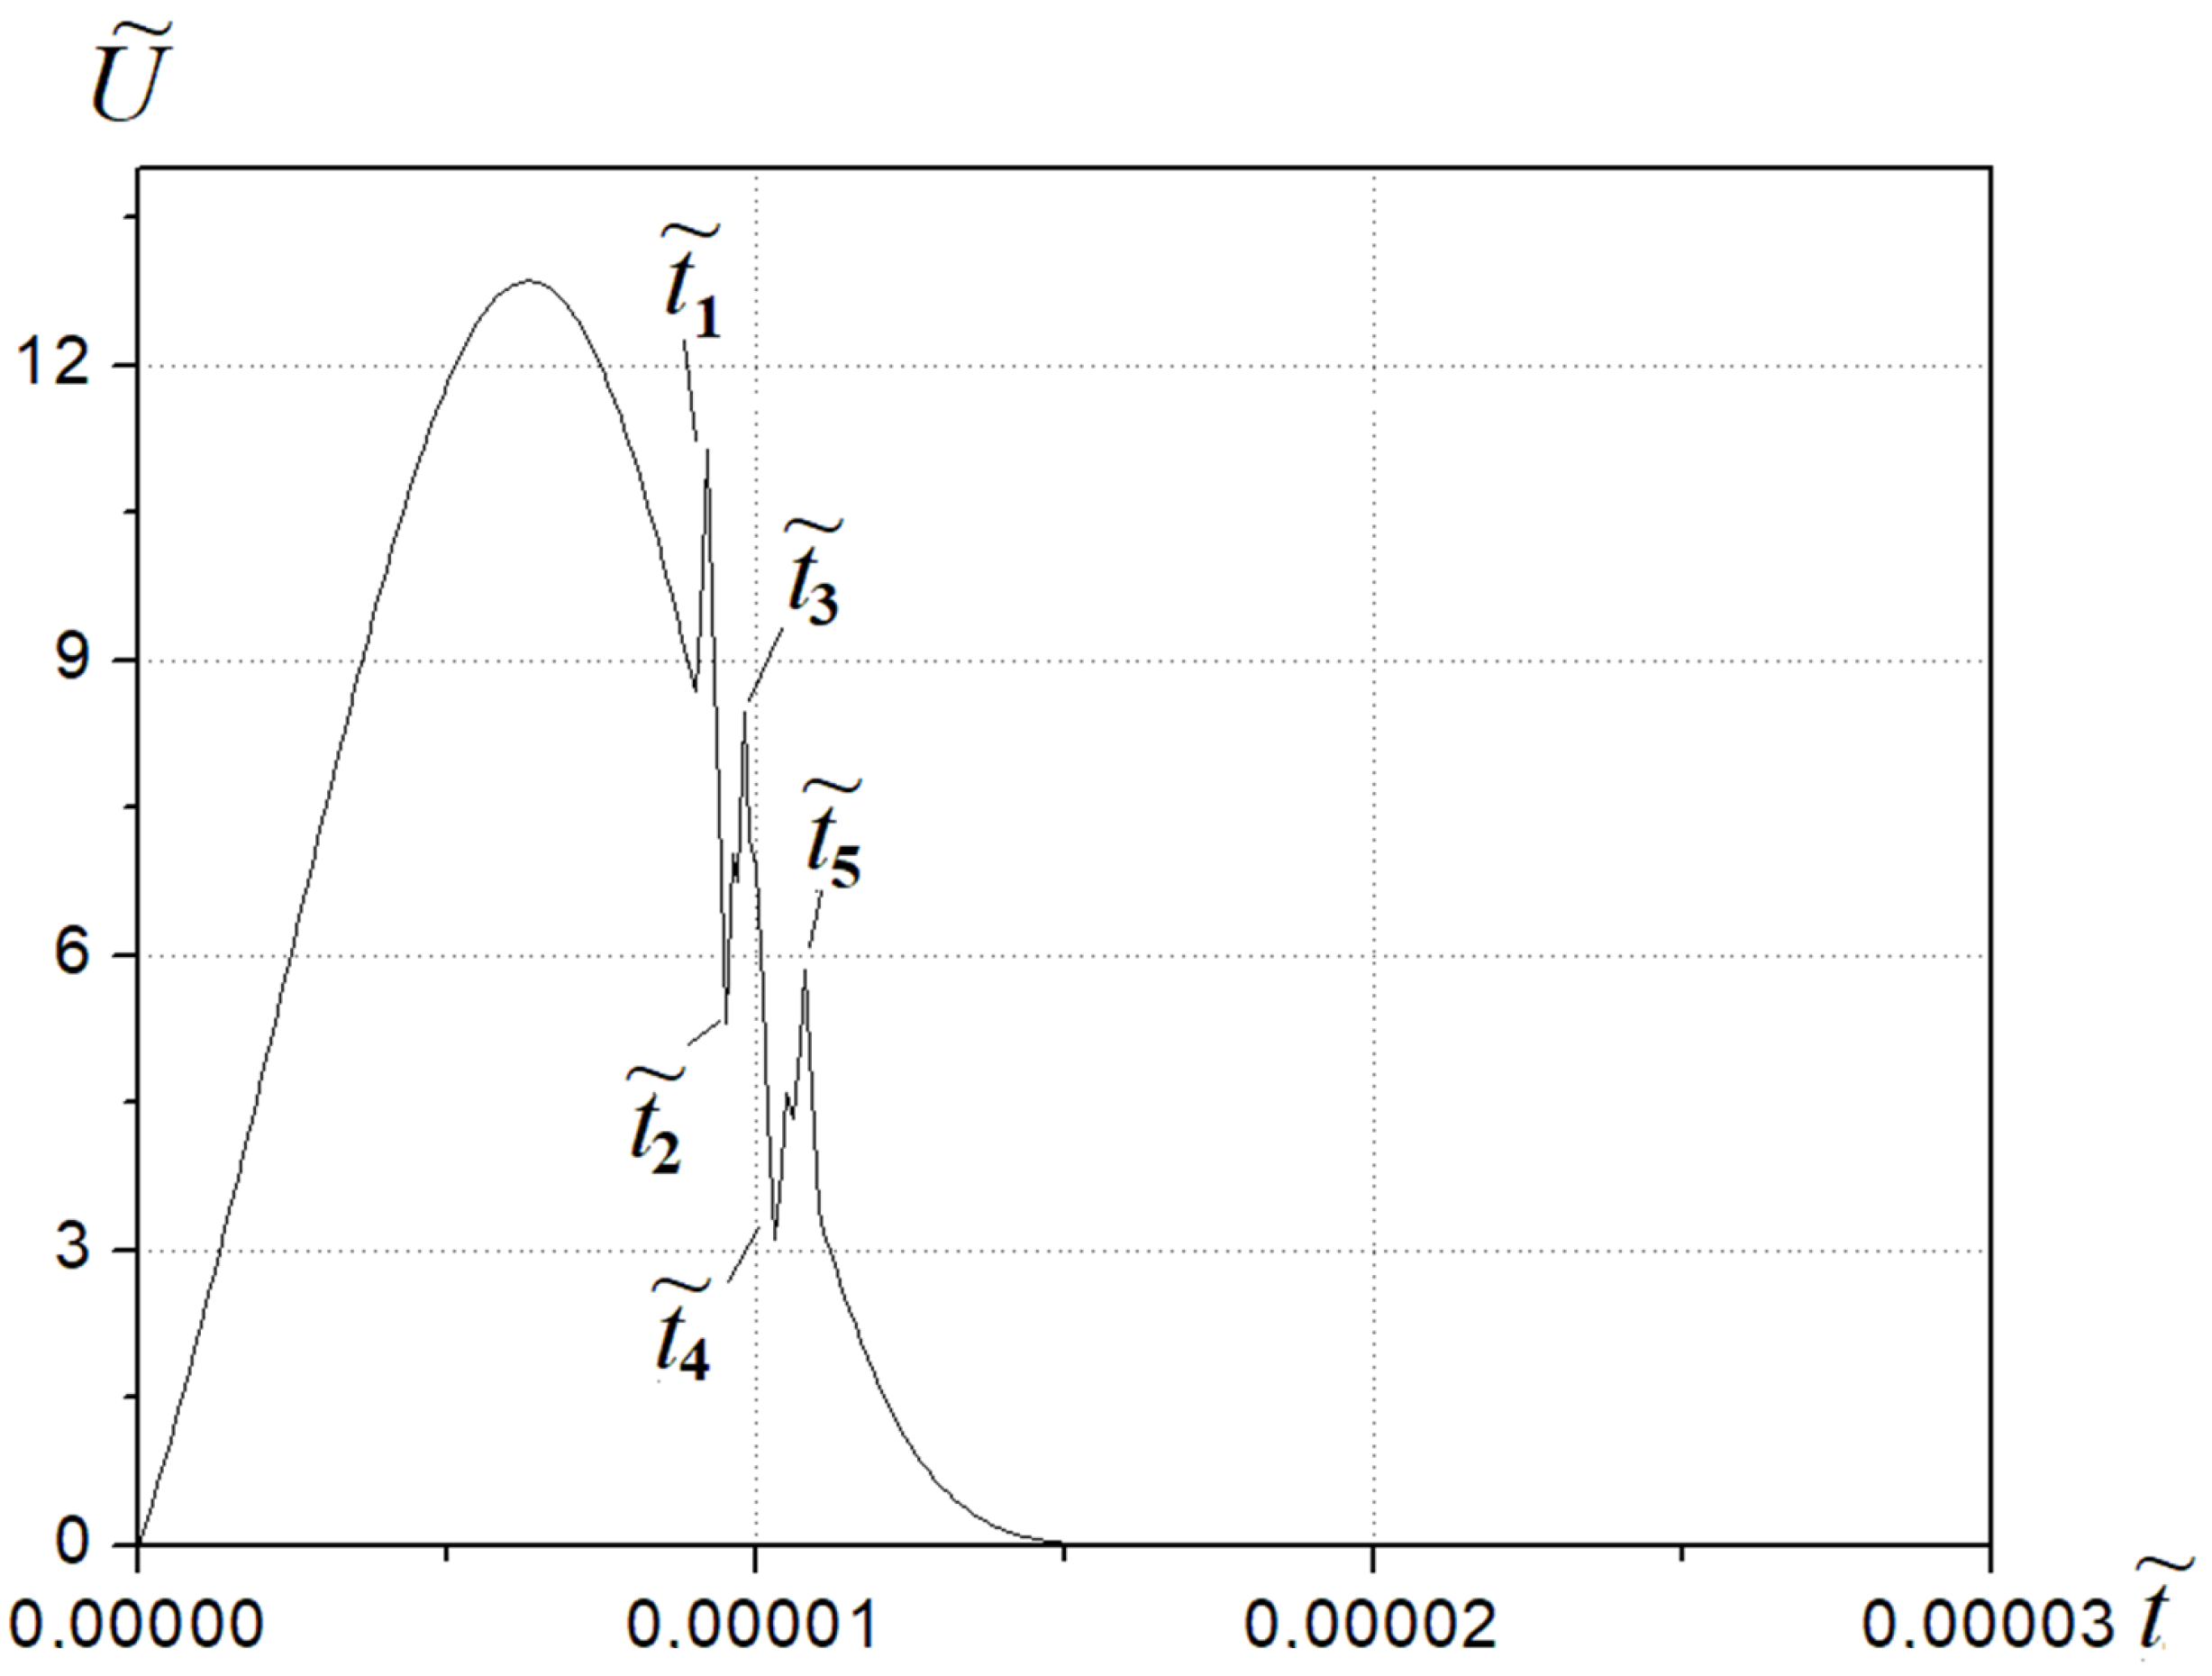
The results of AE signal modeling with a sequential increase and decrease of the local development rate of the destruction process at successive time moments are shown in Figure 4. The local speed change, for the corresponding times of the process development, is t ˜ 1 = 1.0092 · 10 3 , Δ α ˜ 1 = 3 ; t ˜ 2 = 1.009 · 10 3 , Δ α ˜ 2 = 2 ; t ˜ 3 = 1.0098 · 10 3 , Δ α ˜ 3 = 2 ; t ˜ 4 = 1.0103 · 10 3 , Δ α ˜ 4 = 2 ; t ˜ 5 = 1.0108 · 10 3 , Δ α ˜ 5 = 2 .
The obtained results show that the non-uniformity of the destruction process of the composite material at the final stage leads to a jagged trailing edge of the signal. Modeling the non-uniformity of destruction at the initial and final stages of the process with different scenarios and times of local speed variations shows similar results.

3. Discussion of Research Results

Experimental studies of AE signals during CM destruction [42,43] reveal the complexity of the AE signal shape, characterized by spikes and drops in amplitude at both the initial and final stages of the progression of the processes. For a reliable interpretation of the AE information and the development of methods for monitoring and diagnosing the condition of CM, it is crucial to analyze the influence of the non-uniform destruction process on the acoustic emission during this process, particularly according to the Von Mises criterion.
The results of our study, similar to those in [40], demonstrate that at a constant deformation rate, the CM destruction process according to the Von Mises criterion is continuous, showing a continuous decrease in the number of remaining elements over time (Figure 2a). Concurrently, a continuous AE signal pulse is formed (Figure 2b), characterized by an accelerated increase in leading-edge amplitude and an exponential decrease in trailing-edge amplitude. For this case the signal exhibits a smooth shape.
From a kinetic standpoint the dispersion of material properties implies that crack development may occur unevenly, exhibiting deceleration over time for more durable elements or acceleration over time for less durable elements. Simulation results with a local variation in the process speed at specific time instances reveal the following.
  • A short-term increase in local process speed in the final stage leads to a surge (jump) in the generated AE signal amplitude at the trailing edge (Figure 3a). Moreover, a greater increase in local process speed results in a proportionally larger surge in generated AE signal amplitude (Figure 3b).
  • Conversely, a short-term decrease in local process speed in the final stage leads to a drop in generated AE signal amplitude at the trailing edge (Figure 3c). Again, the magnitude of the speed decrease and the related AE signal amplitude drop are in proportion. (Figure 3d).
The results of modeling of the AE signal for a sequential increase and decrease in the local destruction rate at successive moments in the final stage of the process show that the trailing edge of the signal exhibits a jagged shape with spikes and drops in signal amplitude at the moments of local speed change (Figure 4).
Figure 5a illustrates the experimental AE signal recorded during the testing of a VK6 hard alloy sample subjected to a transverse force. The VK6 alloy is a sintered carbide alloy which belongs to the group of dispersion-strengthened composite materials. The sample had a cylindrical shape (Figure 5b) with a thickness of 4 mm and a diameter of 8 mm. An incision was made on the sample at a distance of 2 mm from the edge, with a width of 0.1 mm and a depth of 1.5 mm. The tests were conducted using a universal machine FP-10, with the sample secured in a special device within the grips of the testing machine. An AE system was employed to record signals, utilizing special software. The AE signal was captured by a sensor, amplified, converted into a digital code, and recorded on a personal computer. Subsequently, the signal underwent processing and graphic display (Figure 5b). The AE system featured the following parameters: AE sensor with a bandwidth of 100 kHz–2 MHz and uneven amplitude-frequency response ±3 dB, a signal amplifier with a bandwidth of 100 kHz–2 MHz, uneven amplitude-frequency response ±3 dB, sensitivity of 5 µV, and a dynamic range of 60 dB. A 14-bit analog-to-digital converter was used with a sensitivity of 1.22 mV per low-order unit and a sampling interval of 5 µs.
The conducted studies show a high degree of correlation between the calculated results of the modeled AE signal when changing the speed of the developing process and the experimental AE signal (Figure 4 and Figure 5a). It is clearly visible that the graph of the experimental AE signal (Figure 5a) shows spikes and drops in amplitude on the trailing edge of the AE signal. Similar changes in the signal, indicating a change in the speed of the destruction process, are reproduced in the modeled results (Figure 4). Consequently, the spikes and drops in amplitude in the experimental data may indicate the moments when the destruction process accelerates or decelerates, which corresponds to the dynamics shown on the modeled graph. This allows us to assert that the model effectively reflects the behavior of the real destruction process captured by experimental methods.
Analyzing the increases or decreases in emission amplitude at various stages of the developing process can be used to assess the state of the material including defectiveness, dispersion of properties, and other characteristics. Such an analysis will enhance the reliability of methods for controlling, monitoring, and diagnosing the condition of materials and products manufactured from composite materials.

4. Conclusions

The modeling AE signals during the destruction of a composite by shear force based on the Von Mises criterion and considering a non-uniformity in the developing process has been discussed. It was determined that at a constant rate of destruction development an AE signal is formed, which resembles a pulse. The signal exhibits an accelerated increase in leading-edge amplitude and an exponential decrease in trailing-edge amplitude. In this case, the AE signal has a smooth shape. However, when there is non-uniformity in the development of the destruction, which may be attributed to the degree of dispersion of CM properties, the shape of the AE signal becomes distorted. Modeling of the non-uniformity in the developing destruction, assuming that the generated AE signal amplitude is proportional to the rate of stress change according to the pattern defined in [40], showed that acceleration of the developing process in the final stage leads to surges in the generated AE signal amplitude at the trailing edge. In this case, the greater the acceleration, the greater surge in the AE signal amplitude. Correspondingly, inhibition of the developing process at the final stage leads to a drop in the generated AE signal amplitude at the trailing edge. In this case, the lower the speed of the developing process, the greater the drop in the AE signal amplitude. The simulation results also demonstrated that successive acceleration or inhibition of the developing process in the final stage results in the appearance of a jagged trailing edge in the generated AE signal. It was also shown that the simulation results correspond well with the experimental AE signals recorded during the destruction of samples made of VK6 hard alloy by shear force.
The analysis of amplitude increments or decreases at various stages of the developing process can be utilized to assess the state of the material, including factors such as defectiveness, properties dispersion, damage during operation, and other characteristics. Conducting such analyses is of interest as it has the potential to enhance the reliability of inspection, monitoring, and diagnostic methods for assessing the condition of materials and products made of composite materials.

Author Contributions

Conceptualization, S.F. and A.S.; methodology, S.F. and A.S.; validation, A.S. and A.B.; formal analysis, S.F.; investigation, S.F.; resources, S.F.; data curation, S.F. and A.S.; writing—original draft preparation, S.F. and A.S.; writing—review and editing, A.S. and A.B.; visualization, S.F. and A.S.; supervision, S.F.; project administration, A.S. and A.G.; funding acquisition, A.S. and A.B. All authors have read and agreed to the published version of the manuscript.

Funding

Funded by the EU Next Generation EU through the Recovery and Resilience Plan for Slovakia under the project No. 09I03-03-V01-00104. Co-funded by the VEGA Grant Agency of the Slovak Republic, grant No. 1/0230/22.

Institutional Review Board Statement

Not applicable.

Data Availability Statement

Data The original contributions presented in the study are included in the article, further inquiries can be directed to the corresponding author/s.

Conflicts of Interest

The authors declare no conflicts of interest.

References

  1. Toor, Z.S. Space Applications of Composite Materials. J. Space Technol. 2018, 8, 65–70. [Google Scholar]
  2. Gunale, R.B.; Joshi, S. Applications of composite material in various fields. J. Emerg. Technol. Innov. Res. 2019, 6, 528–540. [Google Scholar]
  3. Alam, M.I.; Maraz, K.M.; Khan, R.A. A review on the application of high-performance fiber-reinforced polymer composite materials. GSC Adv. Res. Rev. 2022, 10, 20–36. [Google Scholar] [CrossRef]
  4. Cheng, L.; Karbhari, V.M. New bridge systems using FRP composites and concrete: A state-of-the-art review. Prog. Struct. Eng. Mater. 2006, 8, 143–154. [Google Scholar] [CrossRef]
  5. Blaga, L.A. Innovating Materials in Bridge Construction; Contribution to Construction with Composite Fiber-Reinforced Materials; EdituraPolitehnica: Timişoara, Romania, 2012. [Google Scholar]
  6. Jones, F.R. Mechanical Properties of Composite Materials. In Composites Science, Technology, and Engineering; Cambridge University Press: Cambridge, UK, 2022; pp. 160–209. [Google Scholar]
  7. Karnoub, A.; Huang, H.; Antypas, I. Mechanical properties of composite material laminates reinforced by woven and non-woven glass fibers. In Proceedings of the XIII International Scientific and Practical Conference “State and Prospects for the Development of Agribusiness—INTERAGROMASH 2020”, E3S Web of Conferences, Rostovon-Don, Russia, 29 June 2020. Abstract Number 12005. [Google Scholar]
  8. Bafekrpour, E. Advanced Composite Materials: Properties and Applications; De Gruyter Open Poland: Warsaw, Poland, 2017. [Google Scholar]
  9. Singh, T.; Sehgal, S. Structural health monitoring of composite materials. Arch. Comput. Methods Eng. 2022, 29, 1997–2017. [Google Scholar] [CrossRef]
  10. Metaxa, S.; Kalkanis, K.; Psomopoulos, C.S.; Kaminaris, S.D.; Ioannidis, G. A review of structural health monitoring methods for composite materials. Procedia Struct. Integr. 2019, 22, 369–375. [Google Scholar] [CrossRef]
  11. Chaki, S.; Krawczak, P. Non-Destructive Health Monitoring of Structural PolymerComposites: Trends and Perspectives in the Digital Era. Materials 2022, 15, 7838. [Google Scholar] [CrossRef] [PubMed]
  12. Kong, K.; Dyer, K.; Payne, C.; Hamerton, I.; Weaver, P.M. Progress and Trends in Damage Detection Methods, Maintenance, and Data-driven Monitoring of Wind Turbine Blades—A Review. Renew. Energy Focus 2023, 44, 390–412. [Google Scholar] [CrossRef]
  13. Liu, P. Damage Modeling of Composite Structures: Strength, Fracture, and Finite Element Analysis; Elsevier: Amsterdam, The Netherlands, 2021. [Google Scholar]
  14. Kurumatani, M.; Kato, T.; Sasaki, H. Damage model for simulating cohesive fracture behavior of multi-phase composite materials. Adv. Model. Simul. Eng. Sci. 2023, 10, 2. [Google Scholar] [CrossRef]
  15. Millen, S.L.; Lee, J. Microscale Modelling of Lightning Damage in Fibre-Reinforced Composites. J. Compos. Mater. 2023, 57, 1769–1789. [Google Scholar] [CrossRef]
  16. Korzec, I.; Samborski, S.; Łusiak, T. A Study on Mechanical Strength and Failure of Fabric Reinforced Polymer Composites. Adv. Sci. Technol. Res. 2022, 16, 120–130. [Google Scholar] [CrossRef]
  17. Bolcu, D.; Stănescu, M.M.; Miriţoiu, C.M. Some Mechanical Properties of Composite Materials with Chopped Wheat Straw Reinforcer and Hybrid Matrix. Polymers 2022, 14, 3175. [Google Scholar] [CrossRef] [PubMed]
  18. Ba, Y.; Sun, S. Tensile and Fatigue Properties of Fiber-Reinforced Metal Matrix Composites Cf/5056Al. Compos. Adv. Mater. 2021, 30, 2633366X20929712. [Google Scholar] [CrossRef]
  19. Gholizadeh, S. Damage Analysis and Prediction in Glass Fiber Reinforced Polyester Composite Using Acoustic Emission and Machine Learning. J. Robot. Autom. Res. 2022, 3, 131–141. [Google Scholar]
  20. Almeida, R.S.M.; Magalhães, M.D.; Karim, M.N.; Tushtev, K.; Rezwan, K. Identifying Damage Mechanisms of Composites by Acoustic Emission and Supervised Machine Learning. Mater. Des. 2023, 227, 111745. [Google Scholar] [CrossRef]
  21. Panasiuk, K.; Dudzik, K. Determining the Stages of Deformation and Destruction of Composite Materials in a Static Tensile Test by Acoustic Emission. Materials 2022, 15, 313. [Google Scholar] [CrossRef]
  22. James, R.; Joseph, R.P.; Giurgiutiu, V. Impact Damage Ascertainment in Composite Plates Using In-Situ Acoustic Emission Signal Signature Identification. J. Compos. Sci. 2021, 5, 79. [Google Scholar] [CrossRef]
  23. Gao, Y.; Xiao, D. Simulation and Feature Analysis of Modal Acoustic Emission Wave in Planar C/SiC Composite. Int. J. Vibroeng. 2018, 20, 748–761. [Google Scholar] [CrossRef]
  24. Gemmeren, V.; Graf, T.; Dual, J. Modeling the Acoustic Emissions Generated during Dynamic Fracture Under Bending. Int. J. Solids Struct. 2020, 203, 84–91. [Google Scholar] [CrossRef]
  25. Hamam, Z.; Godin, N.; Fusco, C.; Doitrand, A.; Monnier, T. Acoustic Emission Signal Due to Fiber Break and Fiber Matrix Debonding in Model Composite: A Computational Study. Appl. Sci. 2021, 11, 8406. [Google Scholar] [CrossRef]
  26. Dzepina, B.; Balinta, D.; Dini, D. A Phase Field Model of Pressure-Assisted Sintering. J. Eur. Ceram. Soc. 2019, 39, 173–182. [Google Scholar] [CrossRef]
  27. Heinrich, C.; Waas, A.M. Investigation of Progressive Damage and Fracture in Laminated Composites Using the Smeared Crack Approach. In Proceedings of the 53rd AIAA/ASME/ASCE/AHS/ASC Structures, Structural Dynamics and Materials Conference, Honolulu, HI, USA, 23–26 April 2012; p. 1537. [Google Scholar]
  28. Jin, W.; Arson, C. Micromechanics Based Discrete Damage Model with Multiple Non-Smooth Yield Surfaces: Theoretical Formulation, Numerical Implementation and Engineering Applications. Int. J. Damage Mech. 2018, 27, 611–639. [Google Scholar] [CrossRef]
  29. Turcotte, D.L.; Newman, W.I.; Shcherbakov, R. Micro and Macroscopic Models of Rock Fracture. Geophys. J. Int. 2003, 152, 718–728. [Google Scholar] [CrossRef]
  30. Swolfs, Y.; McMeeking, R.M.; Rajan, V.P.; Zok, F.W.; Verpoest, I.; Gorbatikh, L. Global Load-Sharing Model for Unidirectional Hybrid Fibre-Reinforced Composites. J. Mech. Phys. Solids 2015, 84, 380–394. [Google Scholar] [CrossRef]
  31. Kun, F.; Hidalgo, R.C.; Raischel, F.; Herrmann, H.J. Extension of Fibre Bundle Models for Creep Rupture and Interface Failure. Int. J. Fract. 2006, 140, 255–265. [Google Scholar] [CrossRef]
  32. Raischel, F.; Kun, F.; Herrmann, H.J. A Simple Beam Model for the Shear Failure of Interfaces. Phys. Rev. E 2005, 72, 046126. [Google Scholar] [CrossRef] [PubMed]
  33. Kovács, K.; Hidalgo, R.C.; Pagonabarraga, I.; Kun, F. Brittle-to-Ductile Transition in a Fiber Bundle with Strong Heterogeneity. Phys. Rev. E 2013, 87, 042816. [Google Scholar] [CrossRef] [PubMed]
  34. Pradhan, S.; Kjellstadli, J.T.; Hansen, A. Variation of Elastic Energy Shows Reliable Signal of Upcoming Catastrophic Failure. Front. Phys. 2019, 7, 106. [Google Scholar] [CrossRef]
  35. Danku, Z.; Ódor, G.; Kun, F. Avalanche Dynamics in Higher-Dimensional Fiber Bundle Models. Phys. Rev. E 2018, 98, 042126. [Google Scholar] [CrossRef]
  36. Tanasehte, M.; Hader, A.; Sbiaai, H.; Achik, I.; Boughaleb, Y. The Effect of Fibers-Matrix Interaction on the Composite Materials Elongation. In Proceedings of the IOP Conference Series: Materials Science and Engineering, International Conference on Advances in Energy Technologies, Environment, El Jadida, Morocco, 13–14 December 2018; p. 012032. [Google Scholar]
  37. Chakrabarti, B.K.; Biswas, S.; Pradhan, S. Cooperative Dynamics in the Fiber Bundle Model. Front. Phys. 2021, 8, 613392. [Google Scholar] [CrossRef]
  38. Shcherbakov, R. On Modeling of Geophysical Problems. Ph.D. Thesis, Cornell University, Ithaca, NY, USA, 2002. [Google Scholar]
  39. Filonenko, S.; Kalita, V.; Kosmach, A. Destruction of Composite Material by Shear Load and Formation of Acoustic Radiation. Aviation 2012, 16, 5–13. [Google Scholar] [CrossRef]
  40. Filonenko, S.; Stadychenko, V. Influence of Loading Speed on Acoustic Emission During Destruction of a Composite by Von Mises Criterion. Am. J. Mech. Mater. Eng. 2020, 4, 54–59. [Google Scholar] [CrossRef]
  41. Filonenko, S.; Stakhova, A. Amplitude-Energy Parameters of Acoustic Radiation with Composite Properties Changing and Mises Destruction. J. Autom. Mob. Robot. Intell. Syst. 2022, 16, 19–24. [Google Scholar]
  42. Guo, F.; Li, W.; Jiang, P.; Chen, F.; Liu, Y. Deep Learning Approach for Damage Classification Based on Acoustic Emission Data in Composite Materials. Materials 2022, 15, 4270. [Google Scholar] [CrossRef]
  43. Roundi, W.; Mahi, A.E.; Rebiere, J.L.; Gharad, A.E. Monitoring Damage Evolution with Acoustic Emission in Two Types of Glass Epoxy Laminates. Polym. Polym. Compos. 2022, 30, 09673911221109906. [Google Scholar] [CrossRef]
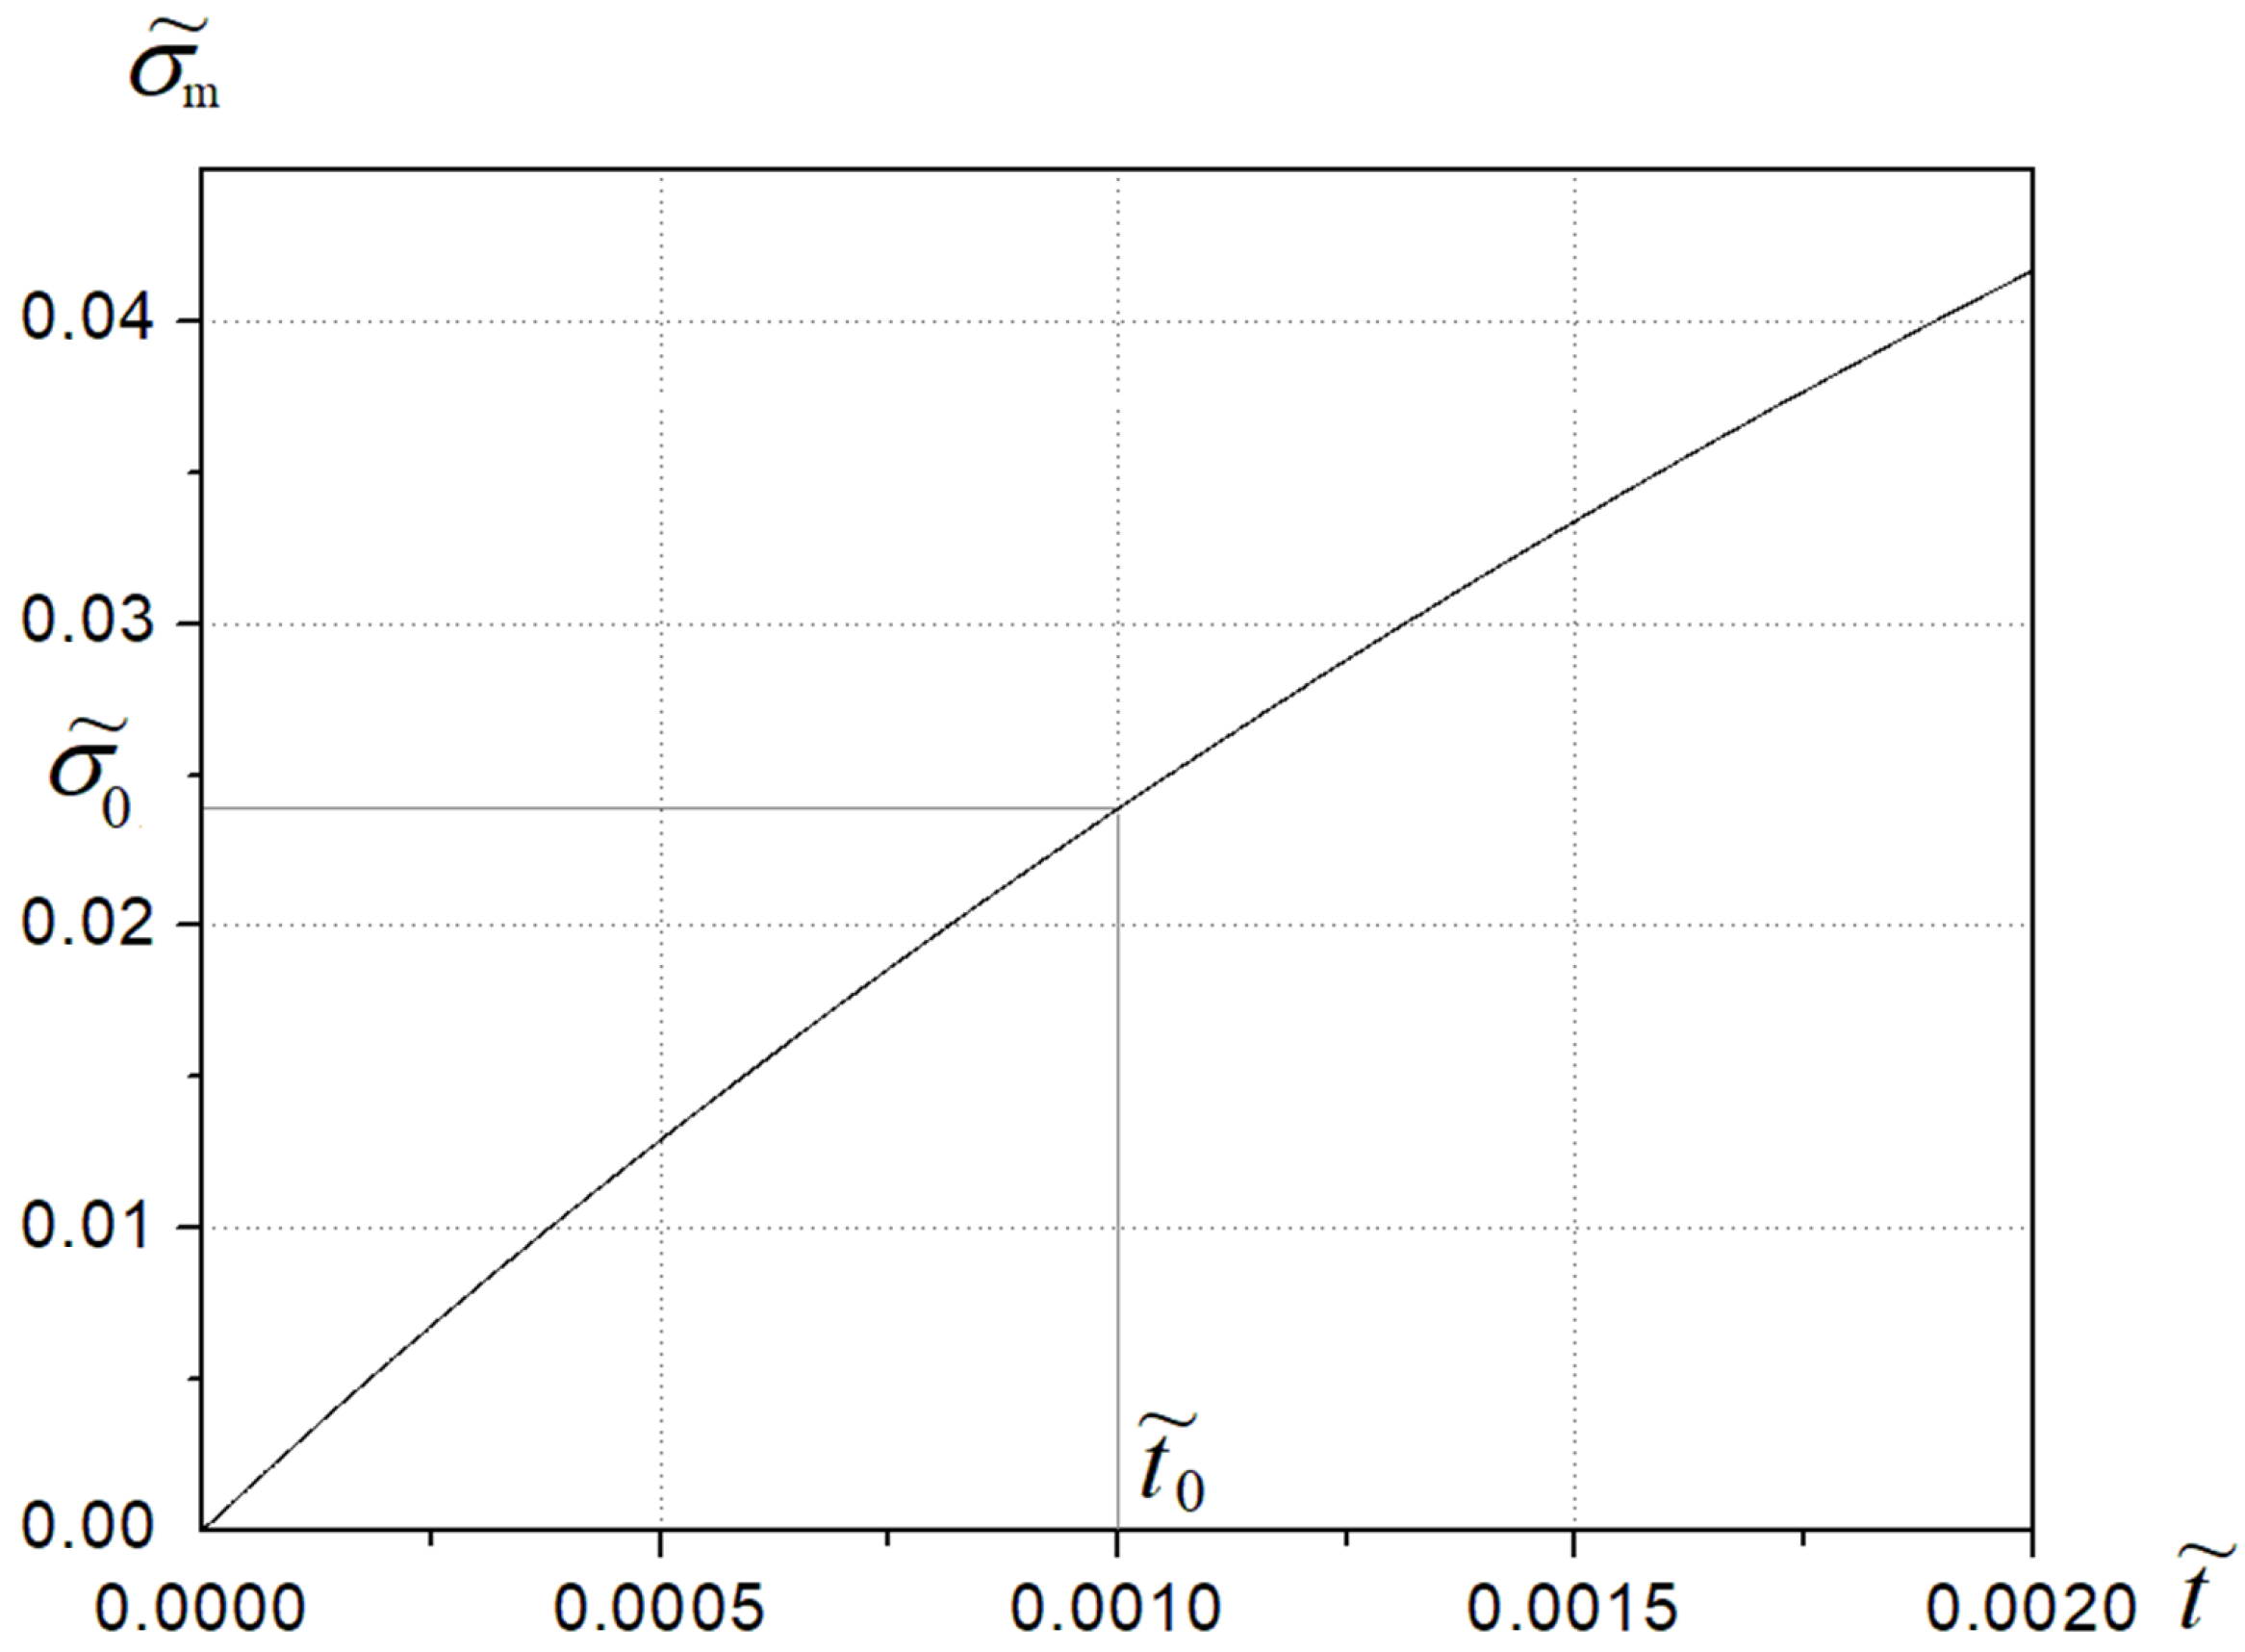
Figure 1. Equivalent stresses σ ˜ m over time t ˜ for deformation rate α ˜ = 30 , Equation (1). Stresses during CM destruction calculated according to the Von Mises criterion.
Jcs 08 00235 g001
Figure 2. Number of remaining elements over time (a) and AE signal amplitude (b) during the destruction of a CM by transverse force, for deformation rate α ˜ = 30 and an initial time of destruction t ˜ 0 = 0.001.
Jcs 08 00235 g002
Figure 3. AE signals over time with increasing and decreasing rates of destruction of CM elements in the final stage of the development process. Speed changes at t ˜ 1 = 1.0095 · 10 3 by (a) Δ α ˜ 1 = 2 , (b) Δ α ˜ 1 = 3 , (c) Δ α ˜ 1 = 2 , (d) Δ α ˜ 1 = 3 .
Jcs 08 00235 g003
Figure 4. AE signal over time with a sequential increase and decrease in the rate of destruction of CM elements in the final stage of development process. Local speed changes, at times t ˜ 1 = 1.0092 · 10 3 , Δ α ˜ 1 = 3 ; t ˜ 2 = 1.009 · 10 3 , Δ α ˜ 2 = 2 ; t ˜ 3 = 1.0098 · 10 3 , Δ α ˜ 3 = 2 ; t ˜ 4 = 1.0103 · 10 3 , Δ α ˜ 4 = 2 ; t ˜ 5 = 1.0108 · 10 3 , Δ α ˜ 5 = 2 .
Jcs 08 00235 g004
Figure 5. AE signal (a) recorded during destruction of sample VK6 hard alloy by shear force with a deformation rate of 5 mm/min. Installation diagram (b) for experimental studies of AE: 1—AE sensor; 2—signal amplifier; 3—A-D converter; 4—personal computer; 5—software; 6—support for installing the test sample; 7—sample; P is the transverse force applied to the sample.
Jcs 08 00235 g005
Disclaimer/Publisher’s Note: The statements, opinions and data contained in all publications are solely those of the individual author(s) and contributor(s) and not of MDPI and/or the editor(s). MDPI and/or the editor(s) disclaim responsibility for any injury to people or property resulting from any ideas, methods, instructions or products referred to in the content.