Abstract
Fiber-reinforced laminates with flexibility (FRLs) are becoming increasingly crucial across diverse sectors due to their adaptability and outstanding mechanical attributes. Their ability to deliver high performance relative to their weight makes them indispensable in lighter-than-air (LTA) applications, such as aerostats, inflatable antennas, surge bladders, gas storage balloons, life rafts, and other related uses. This research delved into employing woven fabrics as the reinforcement material and explored how their specific parameters, like fiber type, fabric count (warp thread density × weft thread density), fabric areal density, and fabric cover influence the bonding and mechanical properties of laminates. A thorough analysis encompassing standard T-peel (ASTM standard D1876) and a newly proposed yarn pullout in laminate test were conducted on laminates fabricated with various woven reinforcements, each with its unique specifications. The T-peel test was utilized to gauge the adhesive strength between FRL components, offering crucial insights into interfacial bonding within the laminates. Nevertheless, challenges exist with the T-peel test, including instances where the adherents lack the strength to withstand rupture, resulting in unsuccessful peel propagation and numerous outliers that necessitate costly additional trials. Thus, our research group introduced a novel yarn pullout in laminate test to accurately assess adhesion in FRLs. This study uncovered correlations between both adhesion tests (T-peel and yarn pullout in laminate), indicating that the innovative yarn pullout in laminate test could effectively substitute for characterizing adhesion in FRLs. Furthermore, the findings unveiled a complex relationship between woven fabric specifications and laminate properties. We noted that variations in fiber type, yarn linear density, and adhesive type significantly impacted adhesion strength. For instance, Kevlar exhibited markedly superior adhesion compared to Ultra-High Molecular Weight Polyethylene (UHMWPE) when paired with Thermoplastic Polyurethane (TPU) adhesive, whereas UHMWPE demonstrated better adhesion with Ethylene Vinyl Acetate (EVA). Moreover, the adhesion quality lessened as fabric count increased for the same adhesive quantity. These discoveries carry practical implications for material selection and design across industries, from automotive to aerospace, offering avenues to enhance FRL performance.
1. Introduction
An increase in human curiosity and exploration has continued to fuel the development of inflatable systems. Inflatable systems are adaptable systems that can go from a compact, launch configuration to a fully operating, enlarged state. They are folded and bundled to reduce the size for transportation to the launch site, then made rigid by the internal pressure of the expanded gas, resulting in huge, lightweight structures [1]. These inflatable structures are ideal for applications in multiple industries. More complex inflatables, like inflated radomes and hull structures for lighter-than-air (LTA) systems, are used in the aerospace and defense industries. Inflatable structures are desired for their excellent mechanical strength, light weight, durability, good barrier property, low area density, strong weather resistance, and resistance to chemicals and oils [2,3]. The use of inflatable systems in the aerospace industry started with the Echo I mission in 1960 [4]. Inflatable systems have progressed since then, but the technology was abandoned once more powerful launch vehicles became available. In the recent two decades, there has been a resurgence of interest in LTA inflatable structures, resulting in various research and projects for further development and testing initiatives [4,5]. An inflatable system core is generally made up of a thin layer of one or more materials that can be inflated with various gases such as air, hydrogen, helium, and nitrogen. Except for a few low-value inflatable articles (such as balloons, advertisements, and recreation objects), all inflatables are built by using these coated or laminated envelope material. These structures usually consist of a reinforcement or fabric layer that is continuously coated or laminated on either one or both sides of its surface with a polymeric material [2]. Although the layers work together to create a synergistic effect, each layer still serves its own purpose. The performance of fibers, polymers, coatings and finishes all contribute to the successful operation of the inflatable system [6].
To maximize the payload, a desirable inflatable system must have a high strength-to-weight ratio. As a result, high-performance fibers are becoming more widespread in inflatable systems. Because of their superior load-bearing, flexibility and lightweight properties, they play a significant part in the design. The structures that use high-performance fibers as the load-bearing layer are exclusively called Fabric Reinforced Lamintes (FRLs). FRLs find extensive use in diverse and demanding scenarios where durability, flexibility, and lightweight construction are paramount. Applications range from inflatable habitats for space exploration, hull material for stratospheric airships to flexible shelters for disaster relief efforts on Earth [7].
Despite the widespread adoption of FRLs in various industries, there exists a notable gap in the understanding of adhesion properties specific to these laminates. Adhesion plays a critical role in the structural integrity and performance of inflatable structures, influencing factors such as air retention, tear resistance, and overall durability [8]. However, comprehensive studies focusing on the adhesion properties of FRLs are limited, hindering advancements in material selection, manufacturing processes, and design optimization. Addressing this gap through targeted research efforts is essential to unlock the full potential of FRLs and ensure their reliability in critical applications.
Furthermore, the properties of woven fabrics introduce a multitude of intricacies that can significantly impact adhesion in FRLs [3]. Woven fabrics possess a complex structure characterized by interlaced yarns in both the warp and weft directions, resulting in varying tensile strengths and tear resistances along different axes. These variations pose challenges in achieving uniform adhesion between fabric layers and coating materials, as regions with different mechanical properties may exhibit differential responses to adhesion processes. Additionally, factors such as the fiber type, fabric count (warp thread density × weft thread density), fabric areal density, and fabric cover, etc. can further complicate the adhesion process in FRLs. Addressing these intricacies requires a comprehensive understanding of the interactions between woven fabric properties, coating materials, and adhesion mechanisms, enabling the development of tailored solutions to enhance adhesion performance and ensure the integrity of FRL structures in demanding applications.
Prior to the development and improvement of high-performance fibers, adhesion was the primary focus for improving the structural and functional qualities of FRLs. Research on the development and characterization of film-fabric laminates have since shifted focus to textile engineering (high-performance fibers and polymeric films) and characterizing the mechanical properties. Some of the focus has to be shifted back to the adhesion layer as the significance of adhesion condition on the performance of the laminate is becoming clearer. Lee et al. revealed that good interfacial adhesion conditions not only prevent delamination but also positively affect the thermal and physical properties and also the flexural strength of the laminate and vice versa [6]. Furthermore, weak interfacial adhesion between the fibers and the matrix leads to poor impact strength performance; therefore, the mechanism of adhesion, characterization, and improvement of said adhesion between high-performance fibers and polymeric films in laminated structures must be studied. In both the woven fabric and laminate contexts, the effects of factors including woven fabric specifications on tensile qualities have been investigated, but it is unknown how these fabric specifications impact adhesion [7,8]. In order to fill that gap, this paper explores how fabric specifications for various fiber types impact adhesion in FRLs while also establishing their effects on mechanical qualities. This research investigates the influence of specific parameters of woven fabrics on the adhesive properties of fiber-reinforced laminates (FRLs), proposing a novel yarn pullout in laminate test to accurately assess adhesion strength. The study also aims to reveal fiber type, yarn linear density, and adhesive type impacts on adhesion strength and offers critical insights for material selection and design in various industries.
2. Experimental Procedure
2.1. Materials
The chosen laminate design aligns with the classic structural and material design of laminate materials used in inflatable structures such as airships, aerostats, inflatable antennas, and other applications. It is also suitable for assessing the adhesion strength between the fiber layer and the film layer. The structure of the laminate is shown in Figure 1.
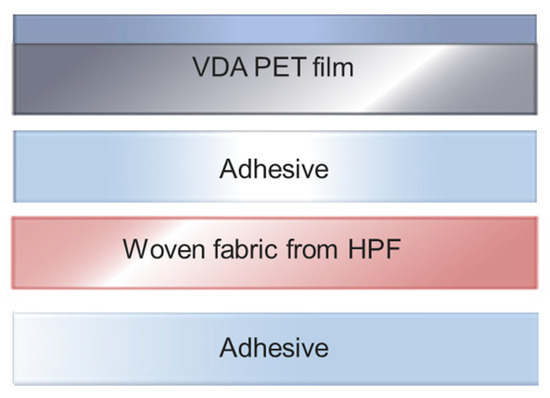
Figure 1.
Laminate structure.
The laminate is made up of a polyethylene terephthalate (PET) film with vacuum-deposited aluminum (VDA) called Mylar (CS Hyde, Lake Villa, IL, USA) and two adhesive layers sandwiching the load-bearing layer. The Mylar film is a popular choice for FRL production, particularly in industries such as aerospace, military, and industrial applications, where environmental protection is a critical consideration as the VDA coating enhances the material’s barrier properties, providing excellent protection against moisture, gases, and light transmission. Woven fabrics from Kevlar (CST, Tehachapi, CA, USA) (ACP Composites, Livermore, CA, USA) and Ultra-High Molecular Weight Polyethylene (UHMWPE) (Zhejiang Mengtex Special Materials Technology Co., Ltd., Tongxiang, Zhejiang, China) fibers were selected as the core strength-bearing/fiber-reinforcement element for this study. These two high-performance fibers (high strength-to-weight ratio) are among the most popular fibers used in the industry, but they are also two of the more difficult to work with due to their chemical inertness and high crystallinity. Four plain woven fabrics from Kevlar and two from UHMWPE fibers, each with distinct structures, were sourced and utilized for this study. The fabric construction parameters include the areal density, the yarn linear density, yarn crimp due to weave as well as the fabric count warp thread density × weft thread density). A summary of the specifications of each fabric are depicted in Table 1. Three different adhesives were used in order to confirm the trend across different adhesive types. The adhesive types sourced are as follows: ethylene-vinyl alcohol (EVOH) (EVAL™, Kuraray, Chiyoda-ku, Tokyo, Japan), ethylene-vinyl acetate (EVA) (KETAEBO, Suzhou, Jiangsu, China), and thermoplastic polyurethane (TPU) (KETAEBO, Suzhou, Jiangsu, China). The thickness of each adhesive was kept constant across all the samples, with 0.015 mm for EVOH and 0.025mm for TPU and EVA. These adhesives were chosen because they are the top readily used choices in the industry and they are also commercially accessible.

Table 1.
Summary of specifications of the plain woven fabrics.
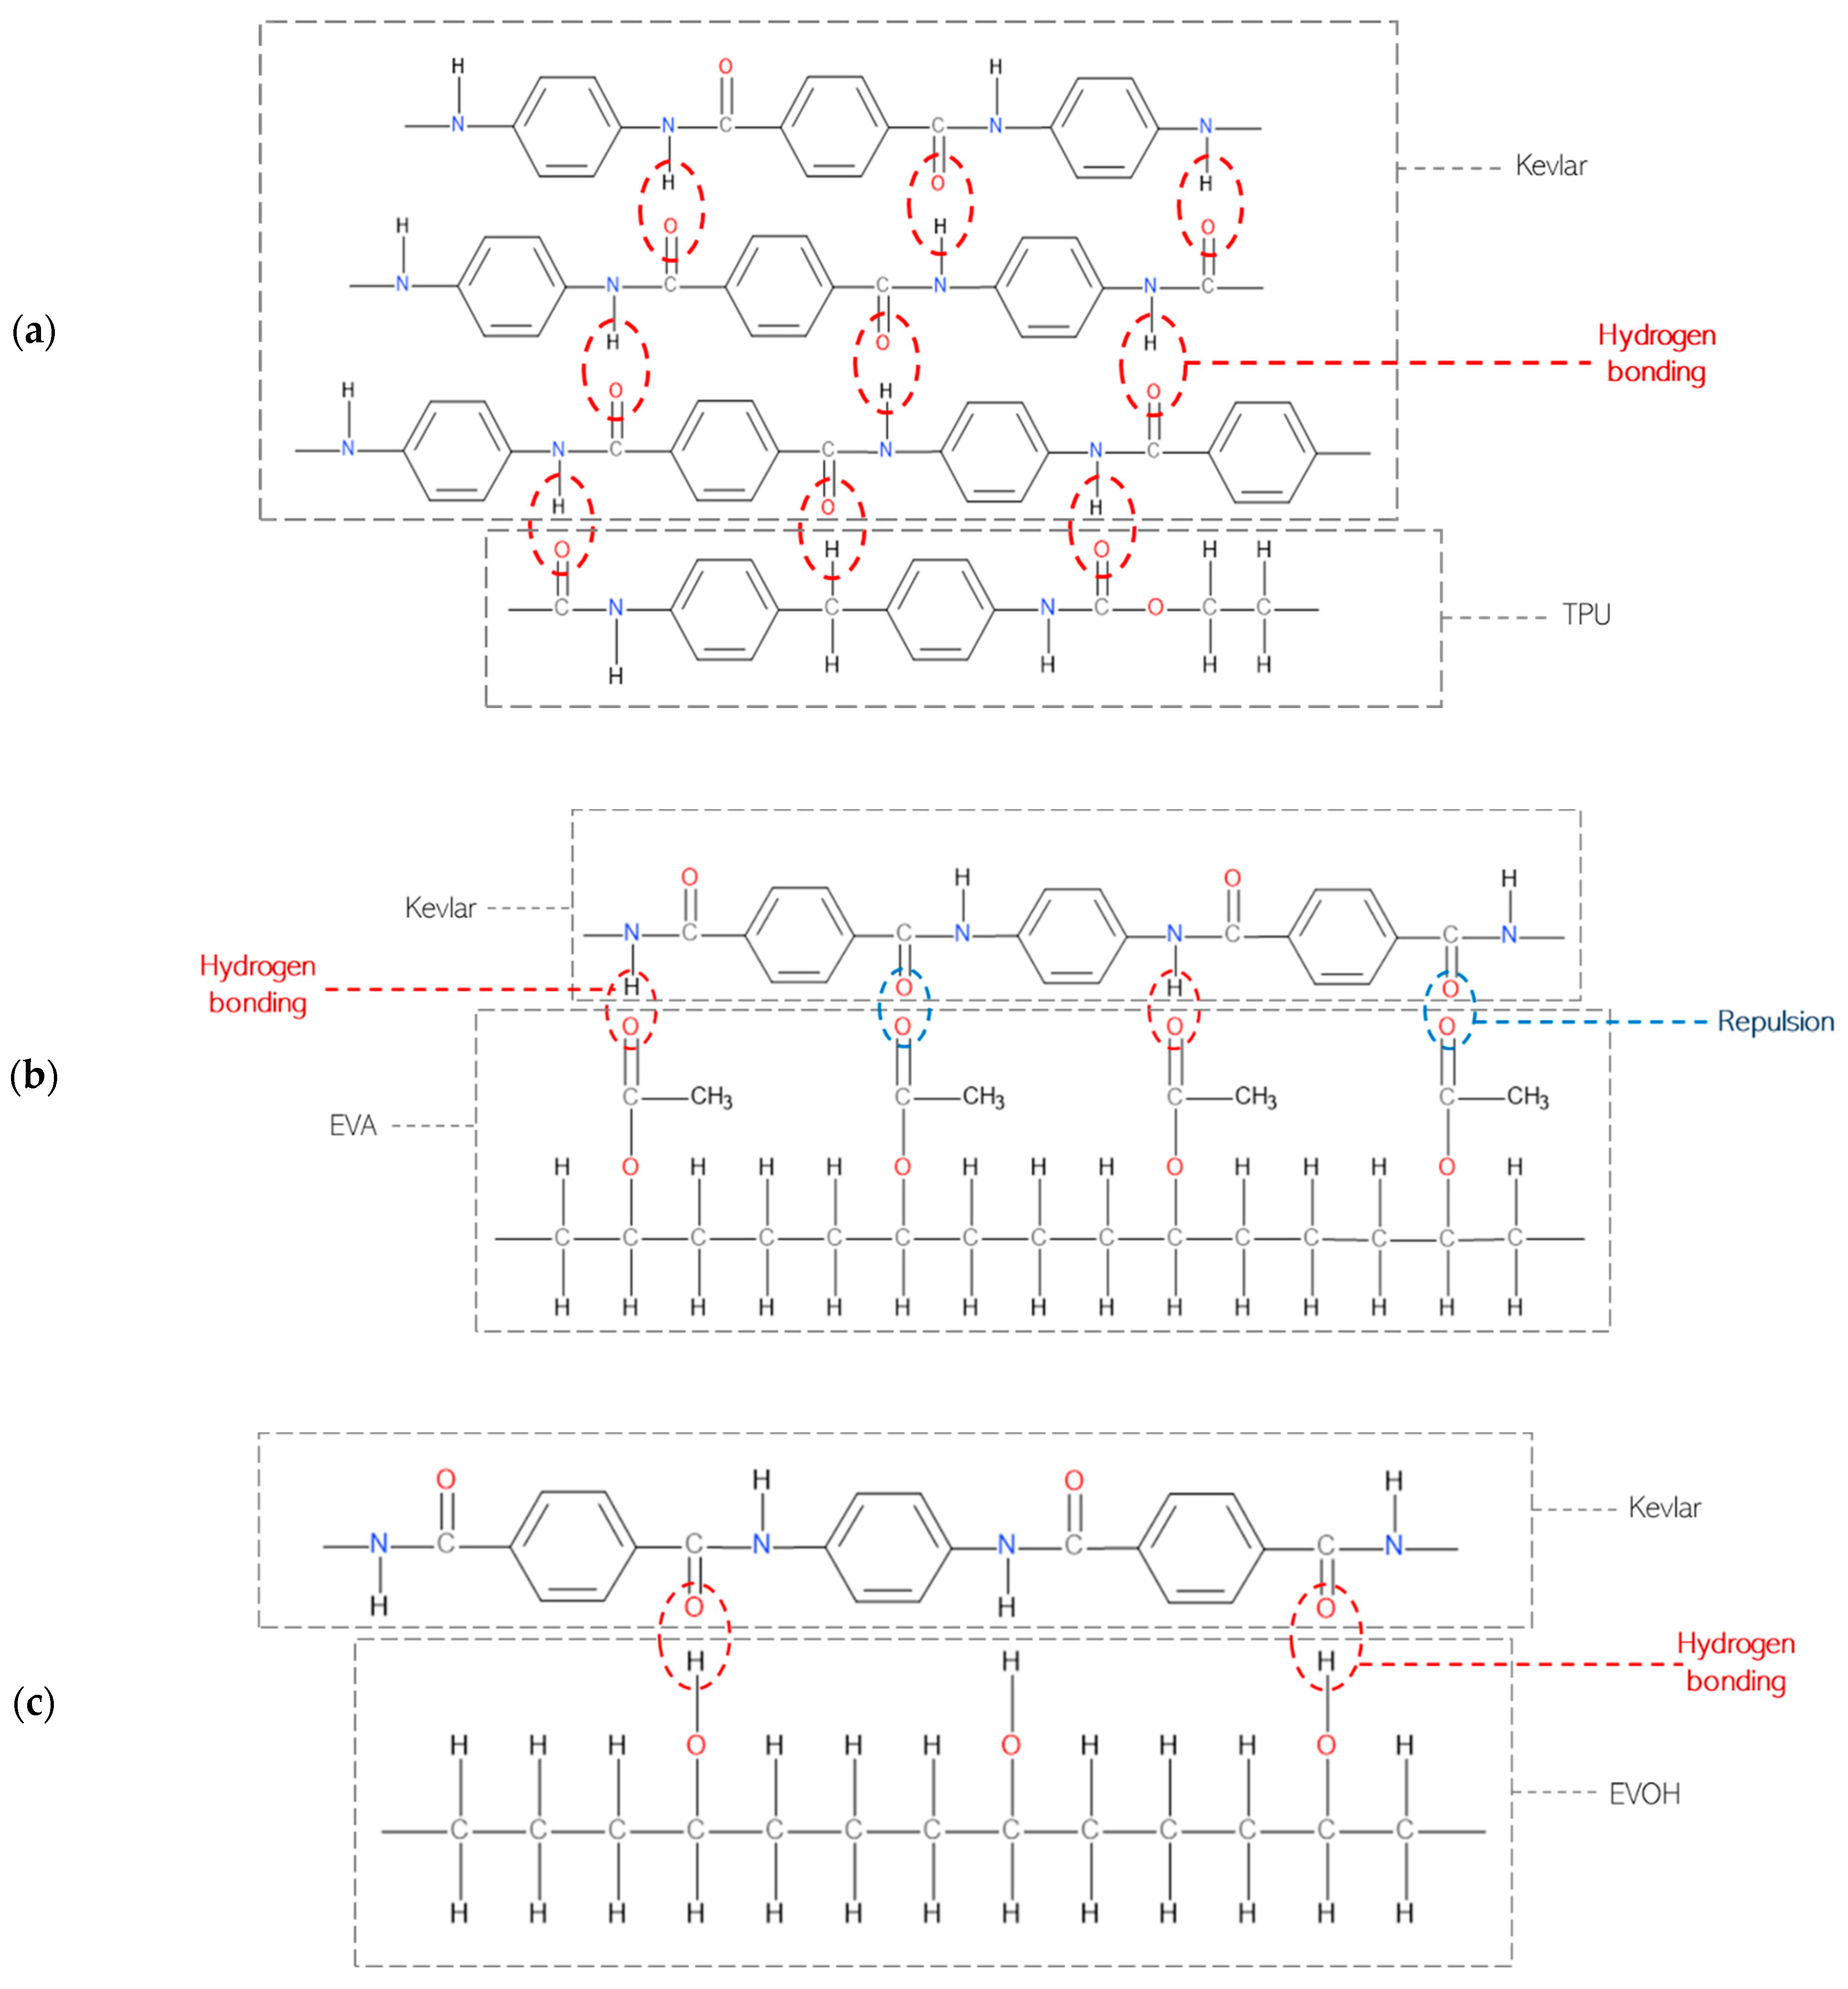
Kevlar has a structure primarily composed of long chains of polymeric aromatic amide groups. The amide groups (-CONH-) in Kevlar are known for their high polarity and strong hydrogen-bonding capacity. TPU contains urethane groups (-NHCOO-) that can form strong hydrogen bonds [9]. These hydrogen bonds can interact effectively with the amide groups in Kevlar, leading to better adhesion, which can be seen in Figure 2a. EVA has both ethylene (-CH2-CH2-) and acetate (-COOCH3) groups as seen in Figure 2b. While it contains polar acetate groups which can form some hydrogen bonds with Kevlar’s amide groups, the hydrogen bonds formed may be undermined by the repulson between the carbonyl groups, resulting in weaker adhesion [10].
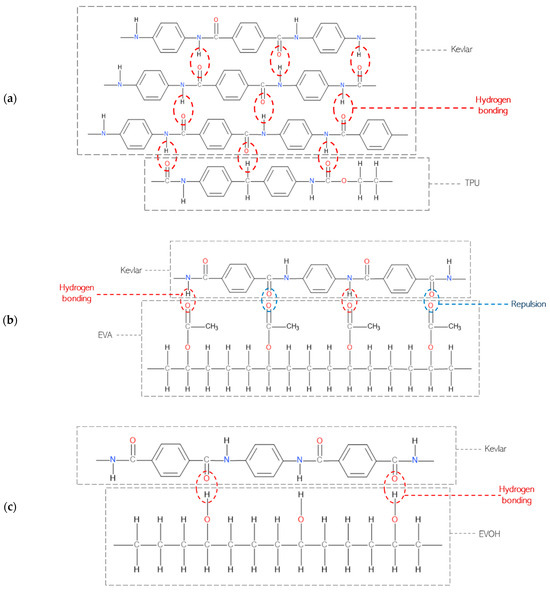
Figure 2.
Bonding high-performance fibers with adhesives: (a) Kevlar and TPU, (b) Kevlar and EVA, and (c) Kevlar and EVOH [9].
Furthermore, the presence of hydroxyl groups in EVOH originating from the vinyl alcohol units creates the possibility of hydrogen bonding with the amide groups present in Kevlar, potentially augmenting the adhesion between the two materials. The polar nature of EVOH, as seen in Figure 2c, attributed to the oxygen in the vinyl alcohol units, further promotes intermolecular interactions, enhancing the likelihood of bonding. Additionally, EVOH is known for its high crystallinity, and the regular and ordered structure of its crystalline regions provides favorable sites for enhanced adhesion. The increased mechanical rigidity associated with crystallinity facilitates improved interaction with other materials, and the larger surface area of crystalline regions also presents additional opportunities for bonding [11].
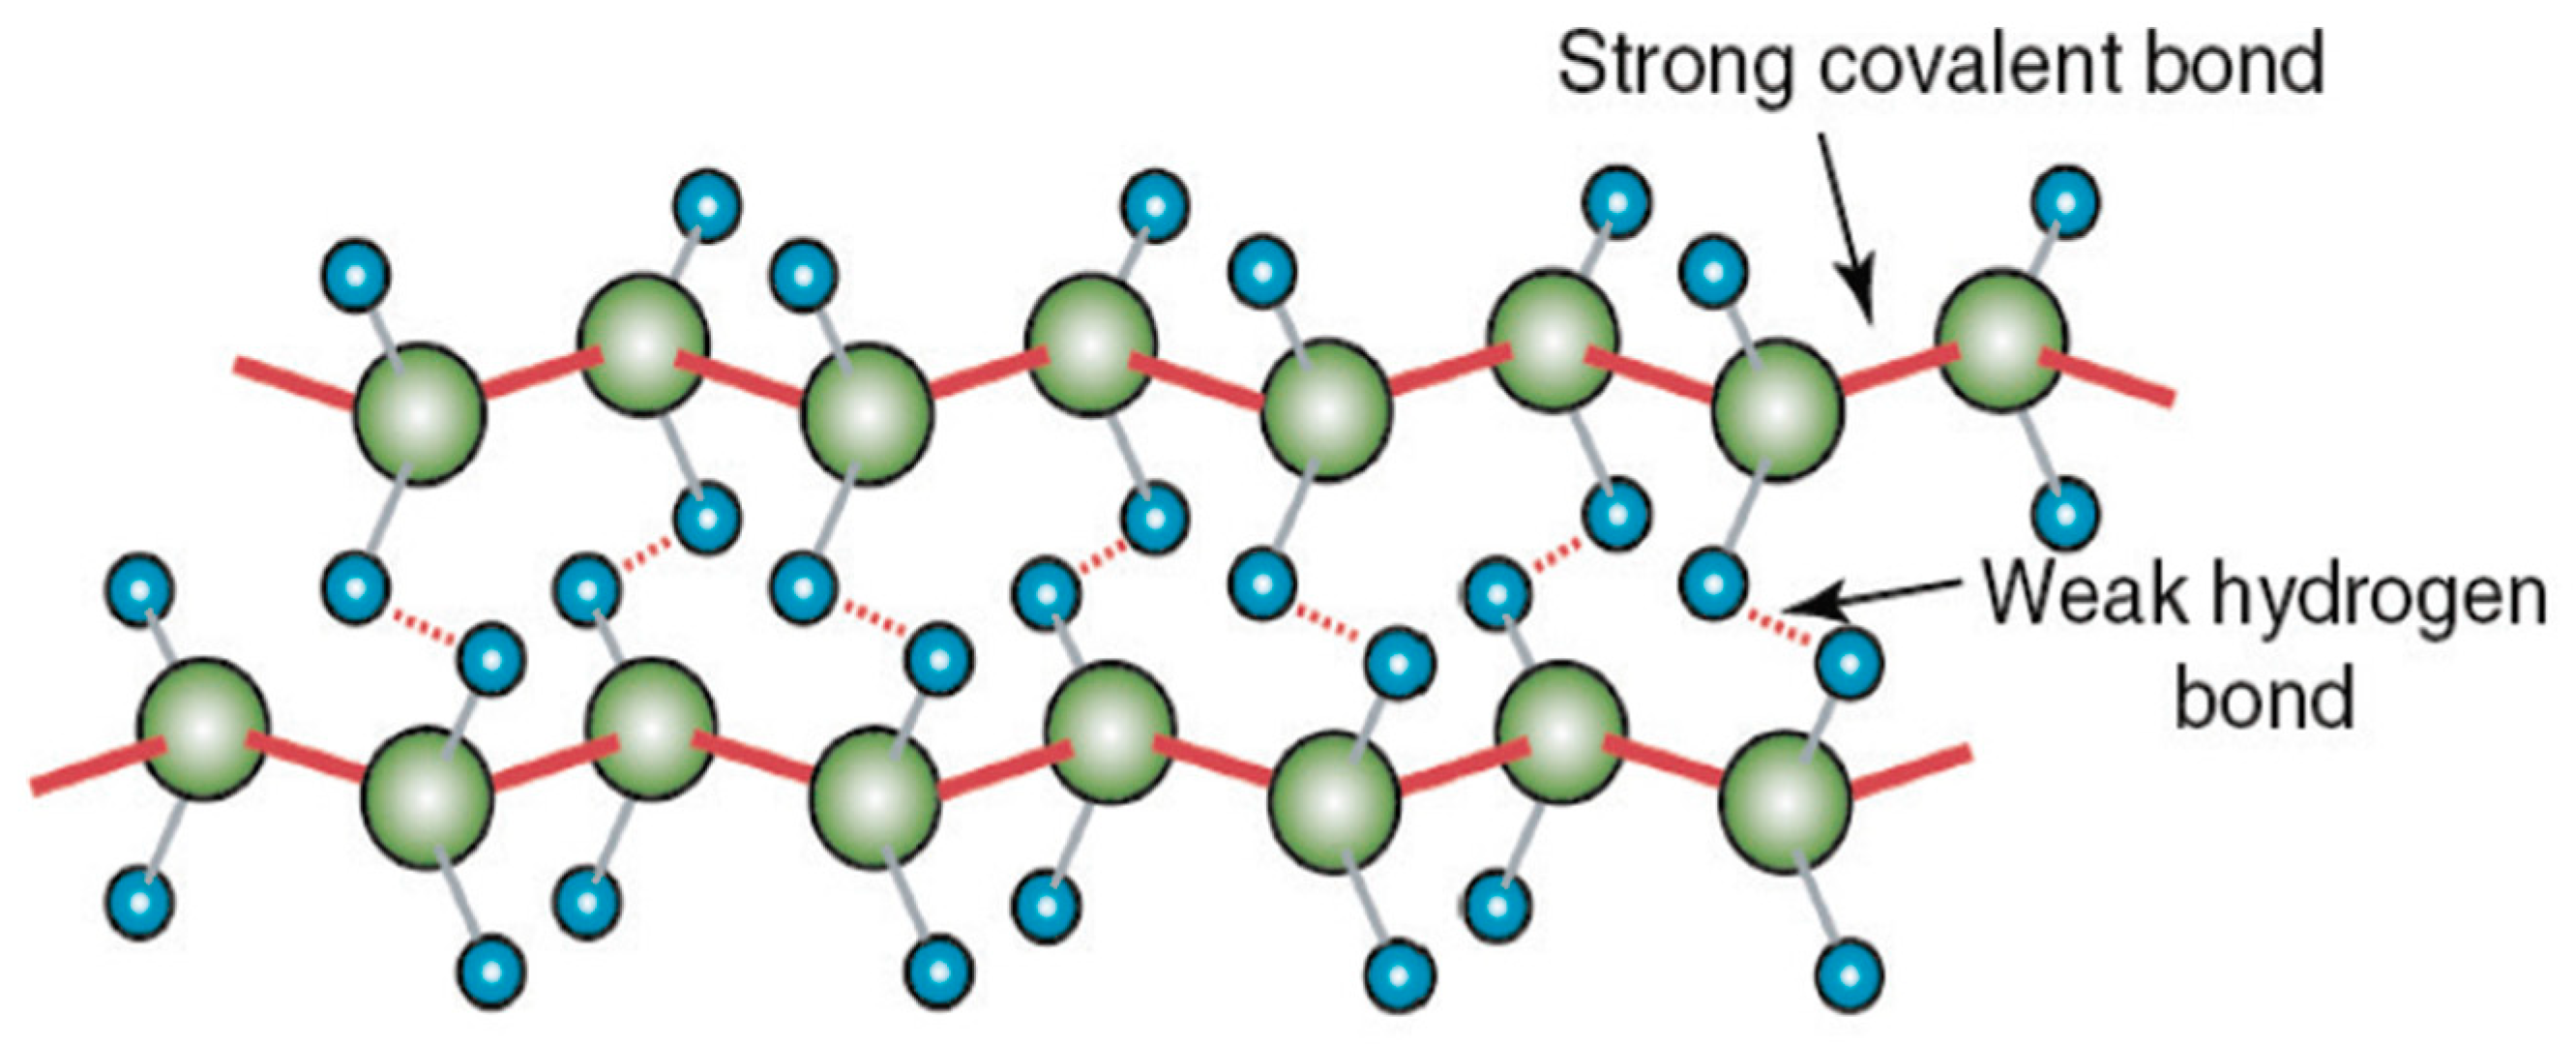
UHMWPE is renowned for its low friction, high wear resistance, and exceptional chemical resistance. This is attributed to its unique molecular structure characterized by high crystallinity and the absence of functional groups, which presents significant challenges for bonding with adhesives. The crystalline structure of UHMWPE is composed of long polyethylene chains (-CH2-CH2-), contributing to its nonpolar nature and making it difficult for many adhesives to form effective bonds [12]. The carbon-carbon covalent bonds in UHMWPE are very strong and rigid, however, in the transverse directions, the bonds between hydrogen atoms in the molecules are much weaker as they rely on van der Waals interactions as seen in Figure 3. The high molecular weight molecules align along the fiber axis which leads to significant strength due to the numerous albeit weak hydrogen bonds and high alignment [12,13].
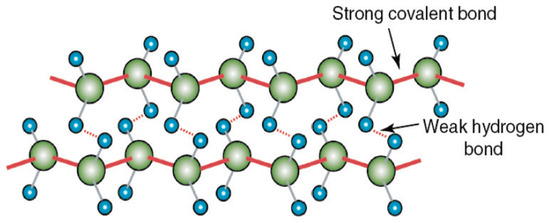
Figure 3.
UHMWPE atomic structure showing strong covalent C-C bonds and weak hydrogen bonds between the molecules [13].
EVA adhesive contains polar acetate groups (-COOCH3) which can potentially form weak hydrogen bonds with UHMWPE. Although UHMWPE’s surface is generally resistant to adhesion due to its lack of polar groups, the presence of surface irregularities might allow EVA to establish some degree of interaction. The compatibility between EVA and UHMWPE can also be enhanced due to the ethylene (-CH2-CH2-) units present in both materials, providing common segments for entanglement of extremely lengthy polymer chains [14]. TPU adhesive contains polar urethane groups (-NHCOO-) which can also form weak hydrogen bonds. However, the bonding between TPU and UHMWPE may not be as strong as that of EVA and UHMWPE. This is because EVA offers more sites for weak hydrogen bonding due to the presence of acetate groups. However, despite these interactions, the overall adhesion remains relatively weak due to the highly crystalline and nonpolar nature of UHMWPE, necessitating the need of specialized surface treatments or primers to enhance bonding with UHMWPE [15].
2.2. Fabric Structure Parameters
Understanding fabric structure parameters is essential for comprehending the mechanical, physical, and adhesive properties of textiles. Fabric structure is influenced by various factors, including yarn type, yarn linear density, fabric count, and weave pattern. Among the parameters used to characterize fabric structure are fabric cover factor and fabric tightness. Fabric cover and tightness play pivotal roles in determining the adhesive bonding characteristics of fabrics. The fabric cover factor, denoted by C, represents the proportion of the fabric area covered by actual yarn [16,17]. It is a crucial parameter in assessing the density and arrangement of yarns within the fabric structure. The calculation of fabric cover factor typically considers the yarn diameter and spacing, providing insights into the packing density of yarns and the overall tightness of the fabric weave.
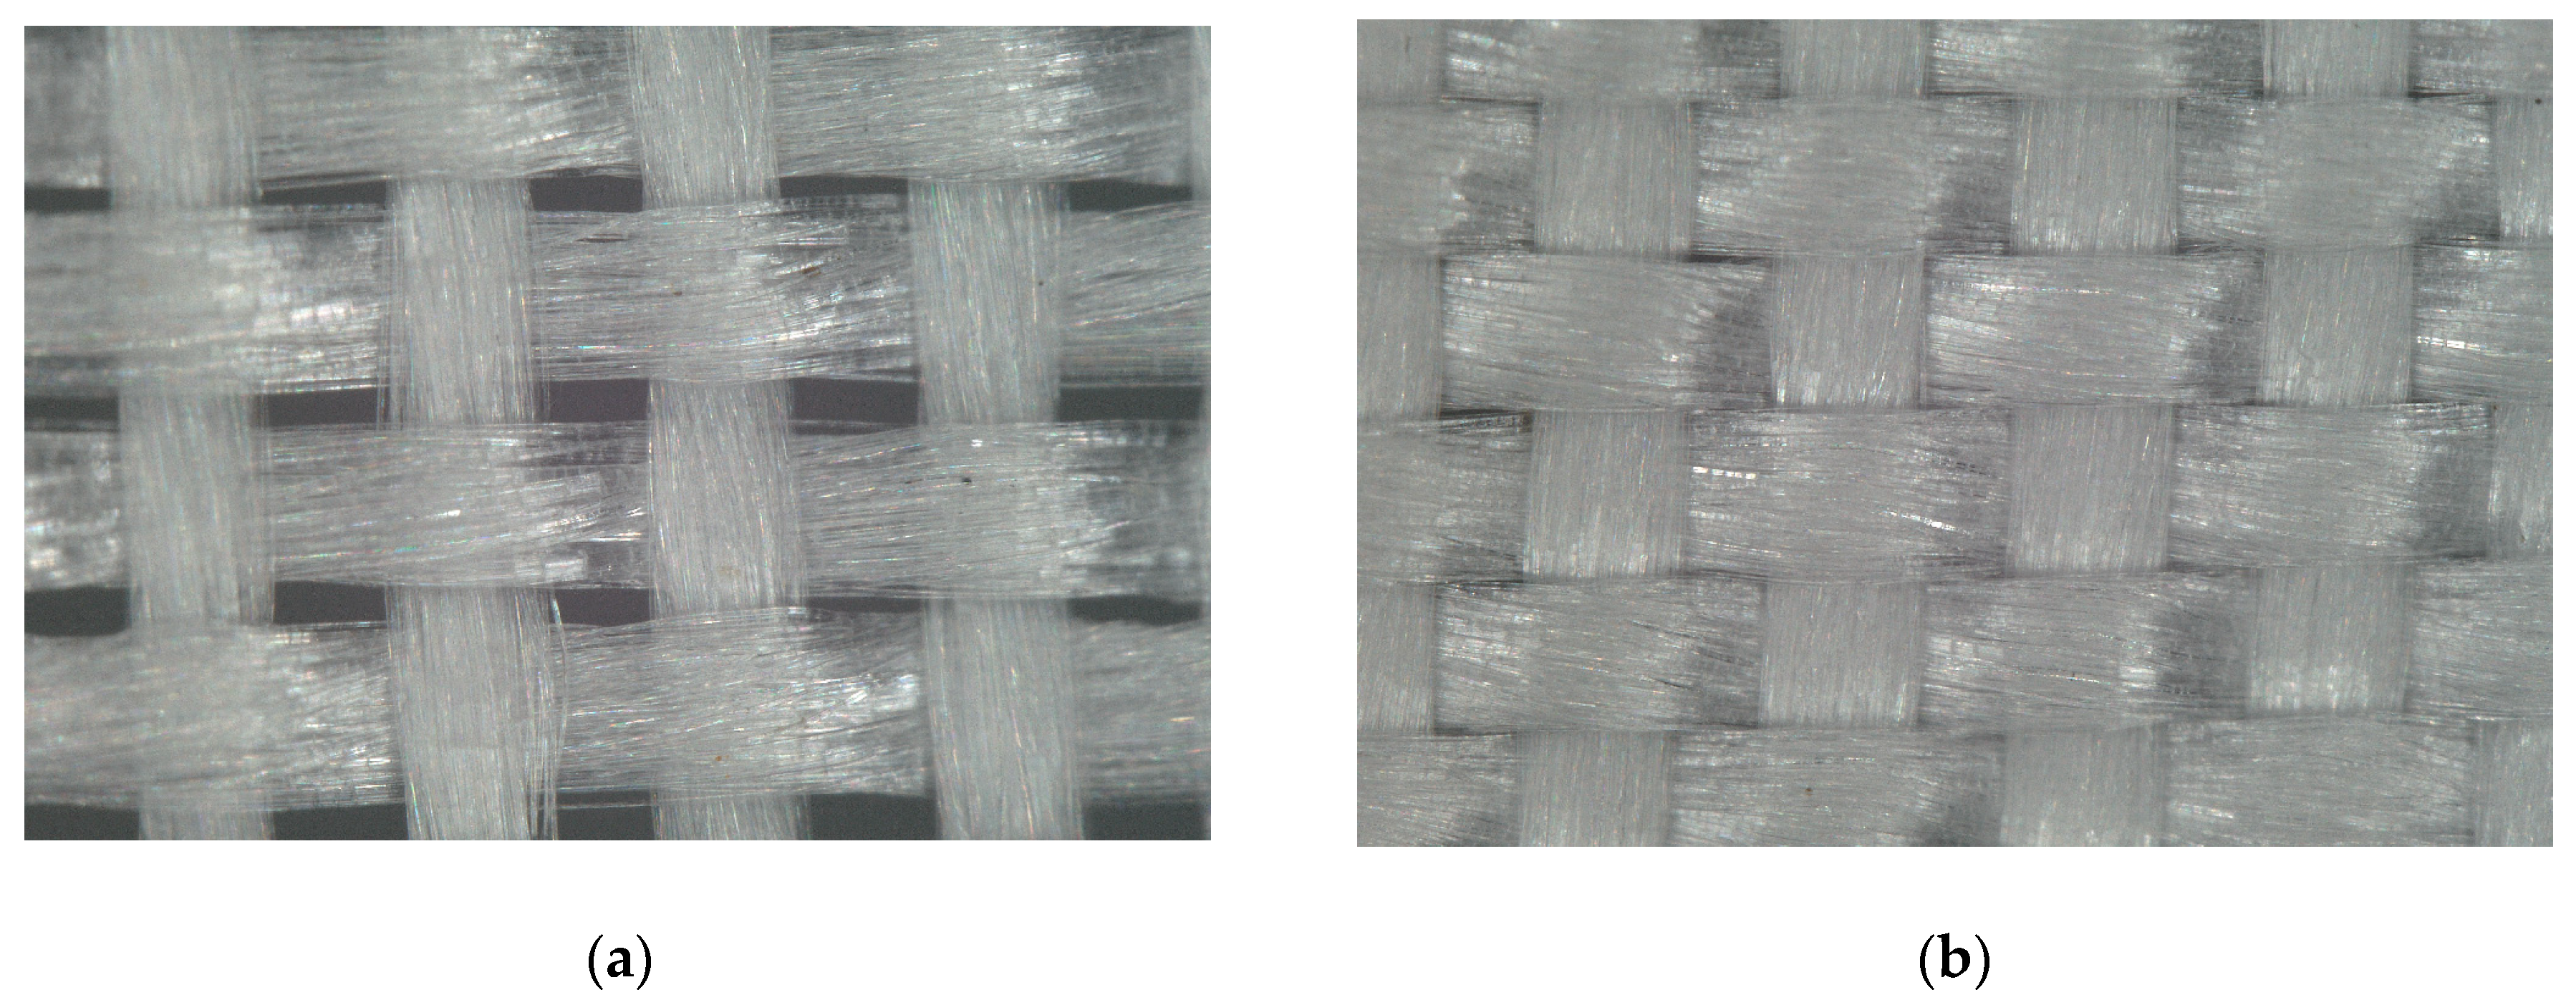
The fabric cover factor provides valuable insights into the density and arrangement of yarns within the fabric structure. A lower cover factor suggests a more open and loosely woven fabric (Figure 4a), whereas a higher cover factor indicates a denser fabric with closely packed yarns (Figure 4b). This distinction in fabric tightness can significantly influence the adhesive bonding characteristics of fabrics. Higher cover fabrics with closely packed yarns offer more contact points and surface area for adhesive bonding. This promotes strong interfacial adhesion and bonding. However, the reduced spacing between yarns minimizes adhesive penetration into the fabric structure, inhibiting proper wetting of the fibers. Conversely, in looser woven fabrics with lower fabric cover factors, greater spacing between yarns may limit contact points available; however, the increased porosity allows the adhesive to wet the fibers effectively, creating strong cohesion between adhesive layers above and below the fabric. This enhances overall adhesion strength, despite there being lesser fabric surface available for bonding. Moreover, the surface bonding is primarily hydrogen bonds, and they are inherently weaker than the cohesion between the adhesive layers. Therefore, fabric cover factor and tightness are crucial considerations in adhesive bonding, and the relationship between fabric structure and adhesion is nuanced. Adjusting fabric tightness and cover must be carefully considered alongside adhesive characteristics to achieve the desired adhesive performance.
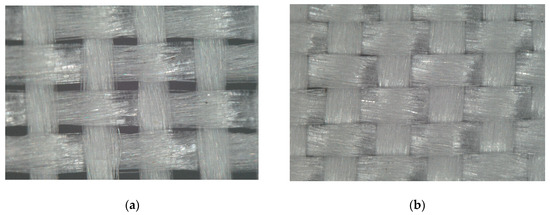
Figure 4.
Microscopic images (X80) of UHMWPE woven fabrics: (a) UP66 and (b) UP80 showing different tightness levels.
In practice, cover factors are calculated independently for the warp and weft directions (Warp cover, C1) and (Weft cover, C2), reflecting the coverage of yarns along each axis. The fractional warp cover factor (C1) is determined by the ratio of the yarn diameter (d) to the thread spacing (p) in the warp direction. The yarn diameter was determined by dividing the thickness of the fabric by 2, assuming that the thickness is the distance at the intersection of the warp and weft yarns. The yarn spacing was obtained by averaging 10 measurements under microscope. Finally, the fabric cover was calculated using Equation (1) below.
On the other hand, when determining the tightness of a fabric, consideration is given to the weave factor, which is determined by the design of the weave [18]. However, as all fabrics utilized in this investigation were of a plain weave (weave factor of 1), the assessment of tightness was omitted from subsequent analyses. Nevertheless, in future research endeavors examining various weave designs, the tightness of each fabric will be of paramount significance in elucidating the impact of diverse weave patterns on the adhesive properties of woven fabrics. The cover of the fabrics used in this investigation are summarized in Table 2 below.
Table 2.
Cover of fabrics
2.3. Laminates Formation
A Pratix OK-12L Seamless Teflon Belt Drum Laminator was used for the laminating procedure. All the laminates’ components were fed through a heated roller using a one-pass procedure. The feed speed was set at 0.32 m/min and the pressure at 413.685 kPa (60 psi). The temperature was set to a predetermined level depending on the fiber type and adhesive type in order to obtain the laminate samples without sacrificing their own properties. Higher temperatures lower viscosity, improving flow for application and enhancing adhesion strength, while lower temperatures increase viscosity, extending the open time. Proper temperature control is vital to ensure optimal bonding, substrate compatibility, equipment functionality, and safety during application and subsequent use [5]. The temperature for each adhesive was chosen based on the recommendation of each manufacturer. The polymeric film chosen was VDA-coated PET film. Before lamination, a very thin coating of VDA is deposited on the films to reinforce their ability to retain gas while adding the least amount of weight possible. While it is not necessary for this study, in real-life applications, the function of the VDA coatings placed on the exterior of the laminate is to effectively reflect heat and UV rays and protect the fiber and adhesive from deterioration.
There were 18 combinations of the 6 woven fabrics with the 3 adhesives; however, because the melting temperature for EVOH is too high for the UHMWPE fabrics, a total of 16 different laminates were made. Each laminate with their corresponding laminate IDs are summarized in Table 3. The properties of the fiber-reinforced laminate, including the interfacial adhesion, were assessed by T-peel test (20 replicates in each direction) and yarn pullout in laminate test in both weft and warp fabric directions (10 replicates in each direction).
Table 3.
Summary of specifications of the plain woven fabrics, adhesives and Laminate IDs.
2.4. Testing and Characterization
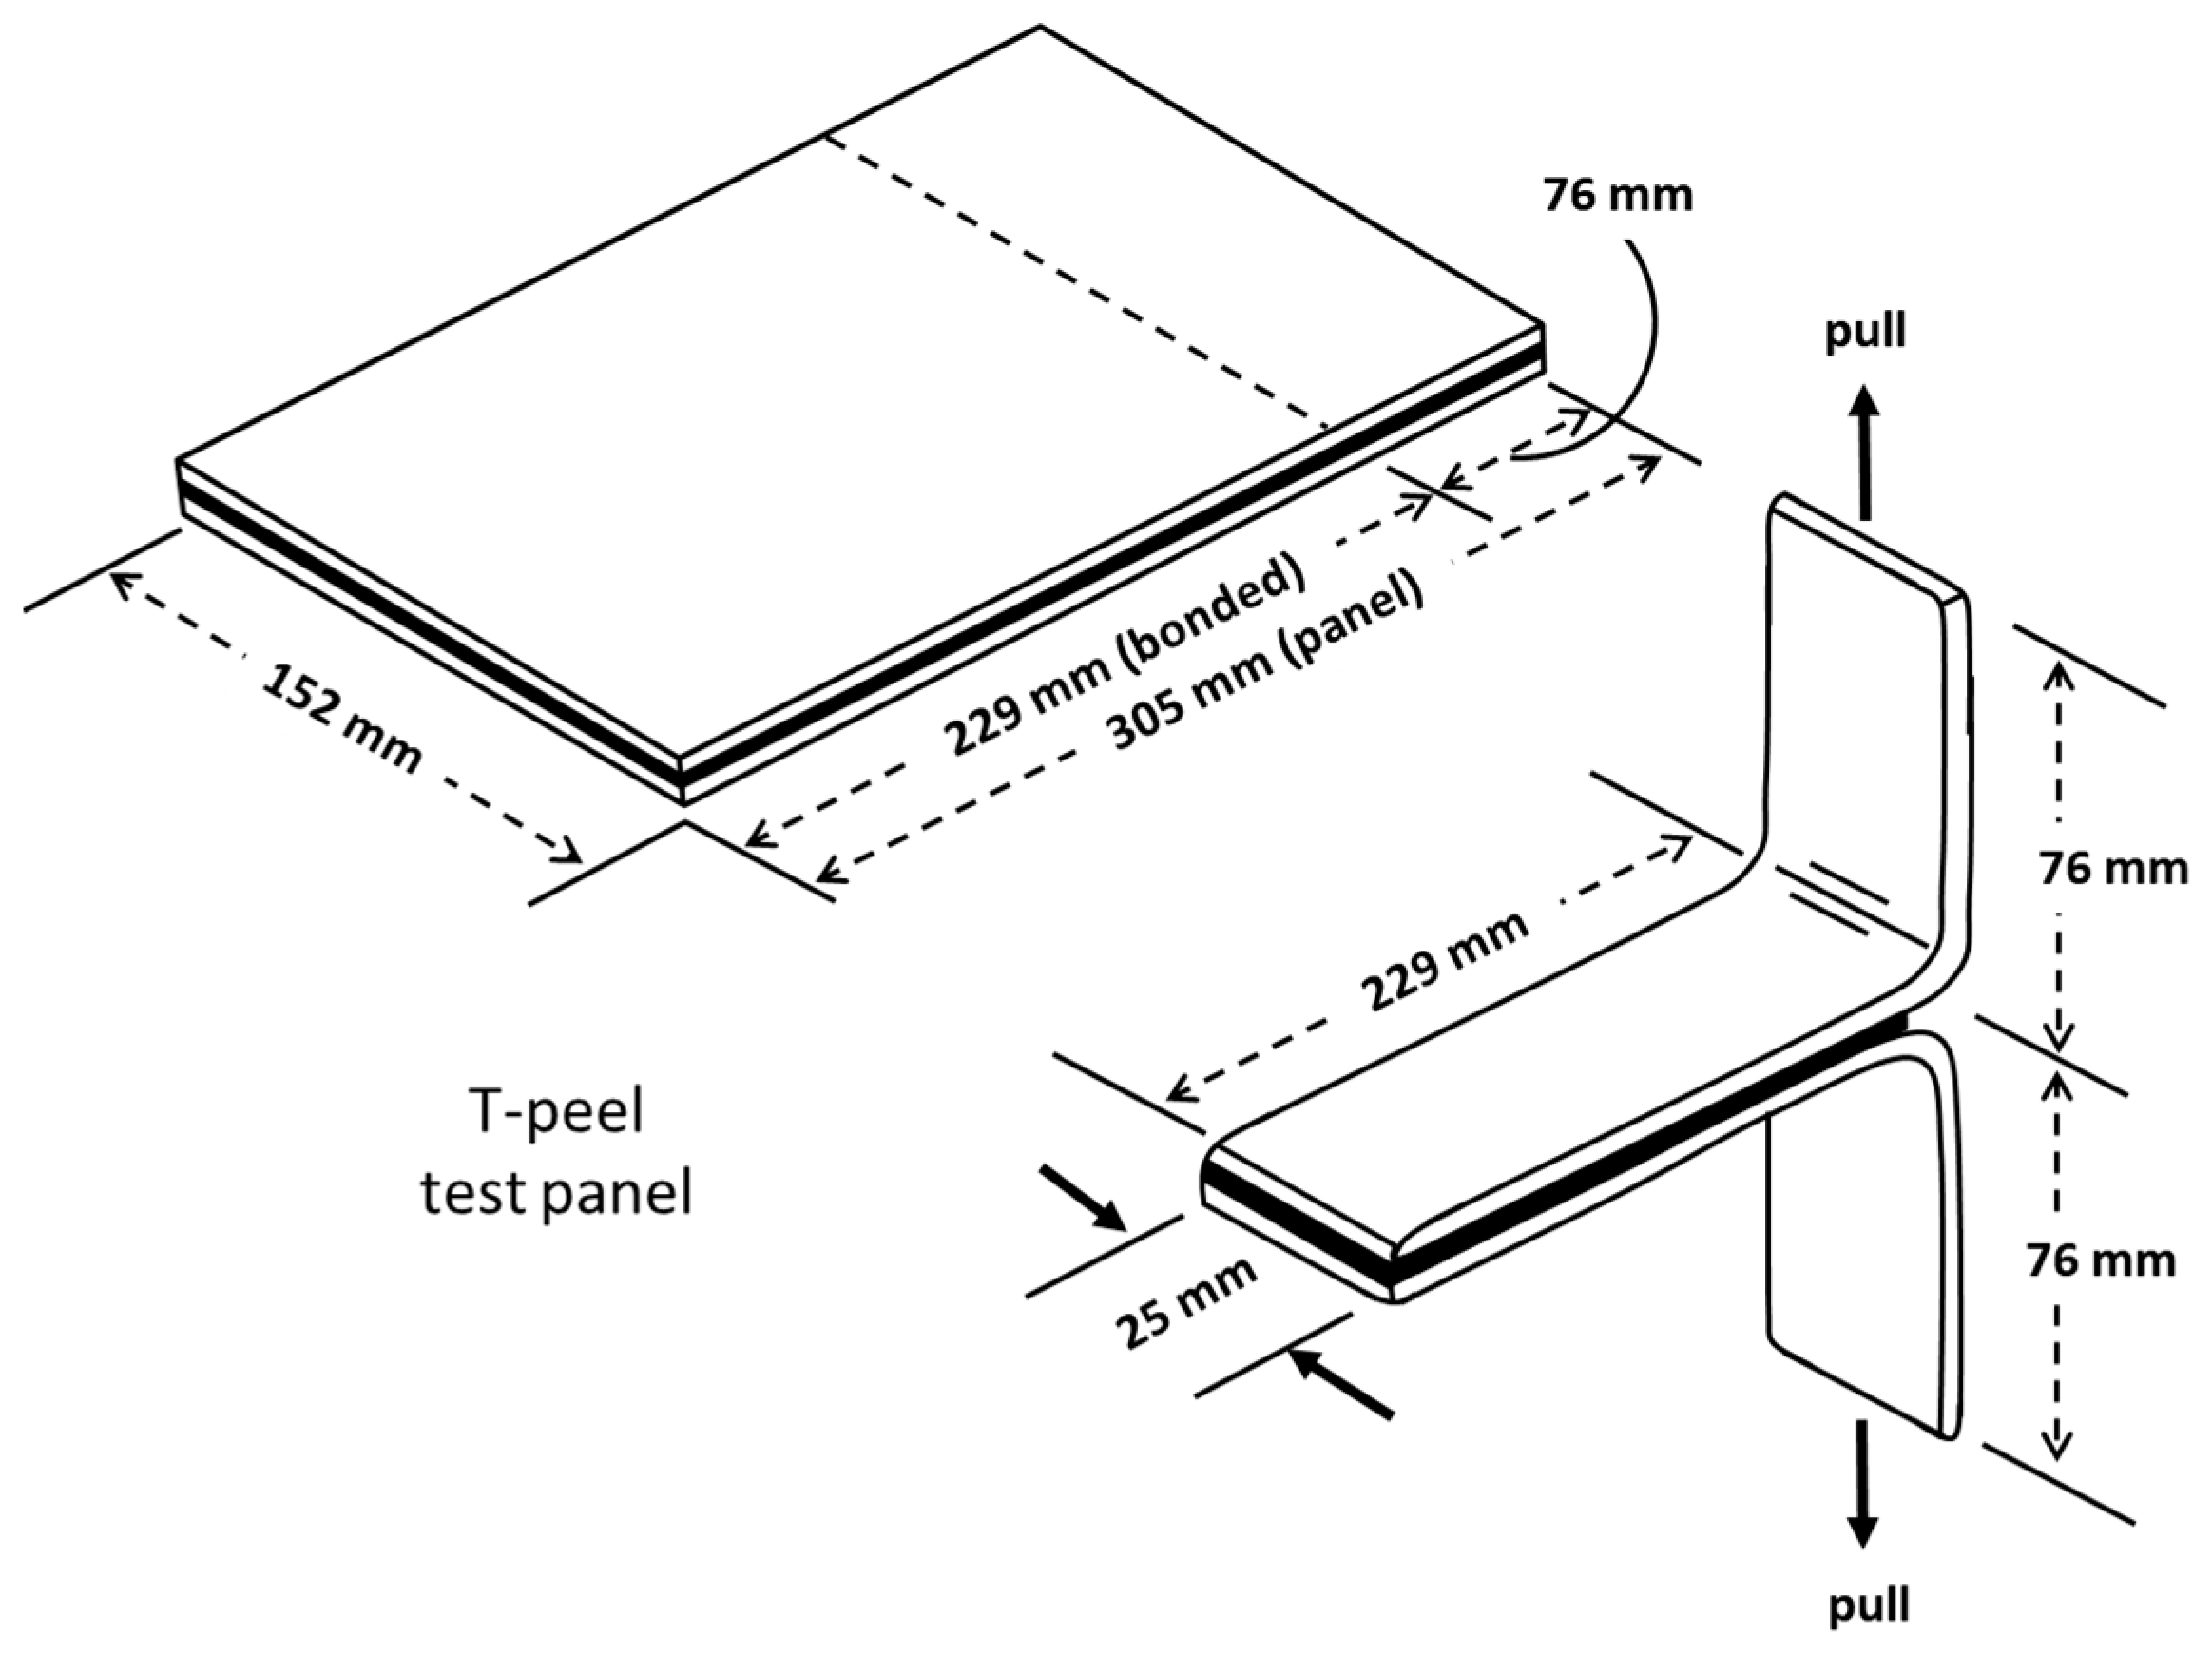
T-peel test: T-peel test and analysis were performed following the procedure outlined in ASTM standard D1876 [19]. By using a T-shape specimen, this technique is primarily designed to assess the relative peel resistance of adhesive bindings between flexible adherents. Figure 5 shows a schematic of the peel test samples. For the T-peel test, an Instron machine 34TM-5 with a 5 kN load cell was used.
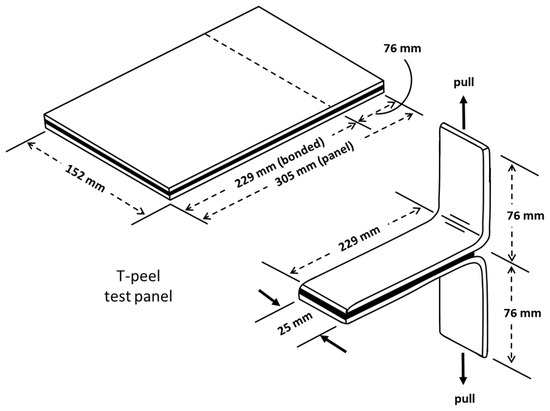
Figure 5.
Test panel and specimen for T-peel test [19].
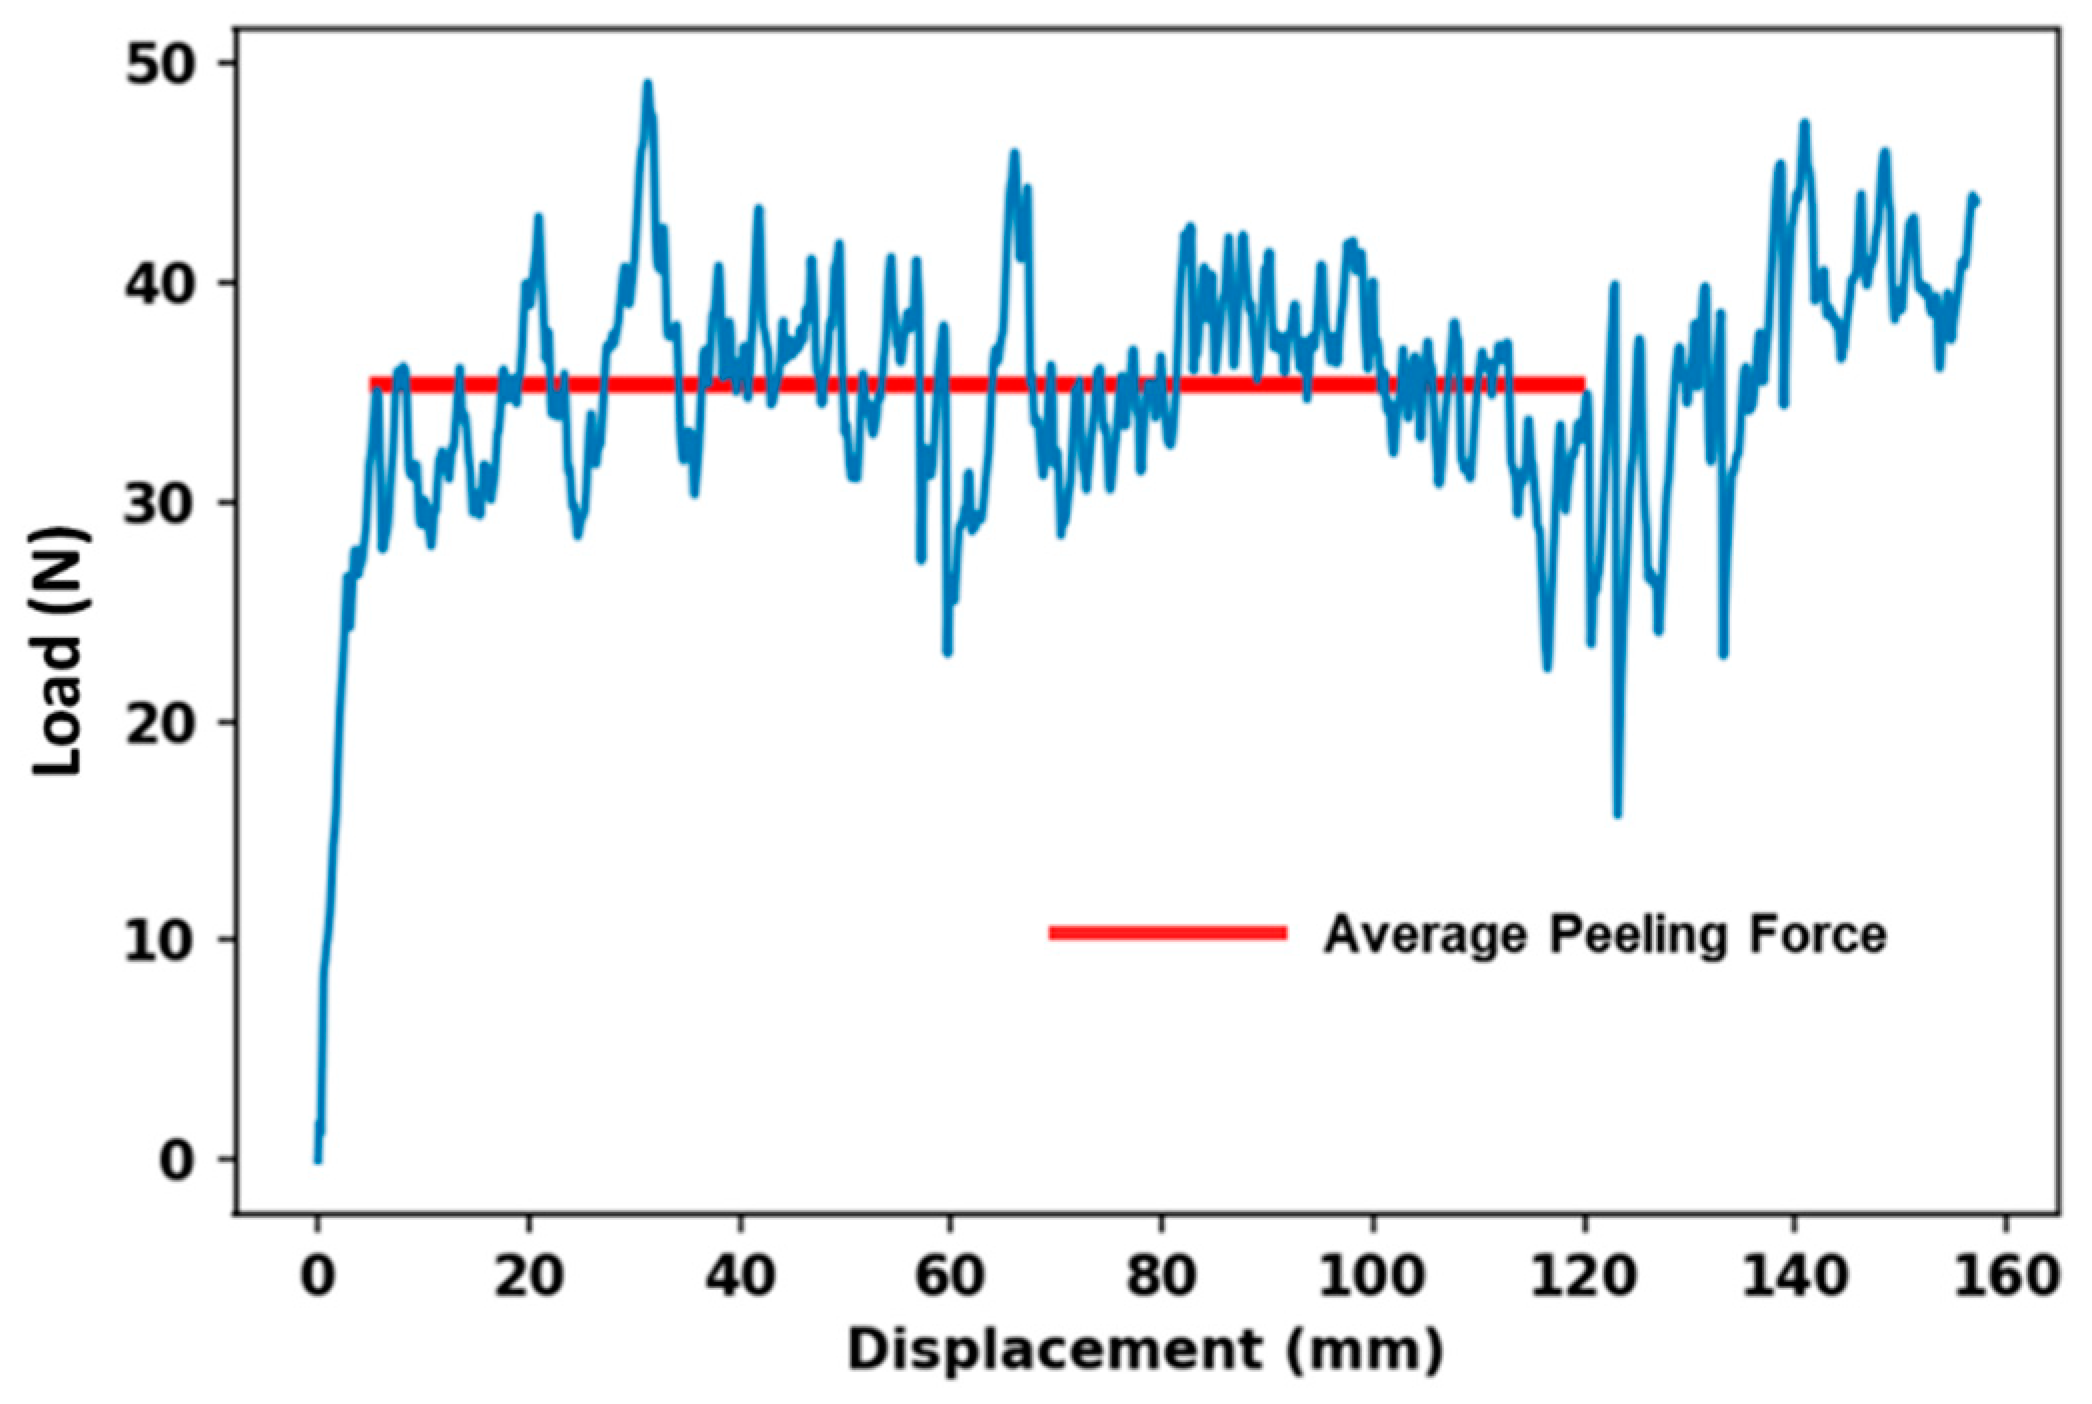
The T-peel test result profile of FRLs is very important to understand the delamination behavior. As the woven fabric-reinforced laminates are made with woven fabric, the behavior of delamination will depend heavily on the properties of the material used to make the reinforcement [20]. Every T-peel test profile is unique; some have an initial maximum peak load which is a measure of the force required to initial failure and to break the rim-seal contact at the start of peeling, but such behavior is not present in FRLs [21,22]. However, there are commonly large fluctuations on the graph which indicate inconsistencies in the peel strength. The peak-to-peak distance represents the interval of bond separation i.e., the maximum variation in force during the test, indicating the range of forces experienced during the peeling process. The peak-to-peak distance can also provide insights into the strength and durability of the bond between the materials being tested. A larger peak-to-peak distance may indicate greater variability or instability in the bond, whereas a smaller peak-to-peak distance may suggest a more consistent and reliable bond. Figure 6 shows the typical load-displacement curve of FRLs. According to the testing procedure, the specimen’s peel strength/resistance will be determined by averaging the load values over a bond line that is at least 12.7 cm (5 inches) long after the initial peak which is represented by the red line [19].
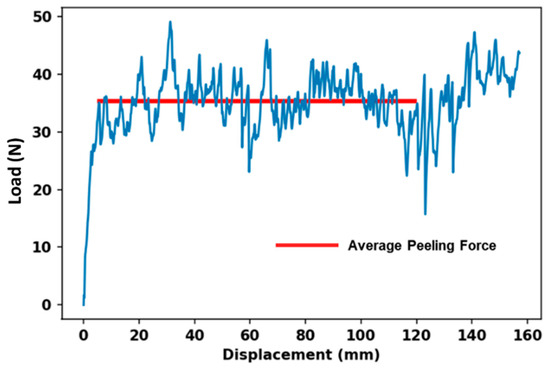
Figure 6.
Typical load-displacement curve for T-peel test for FRLs.
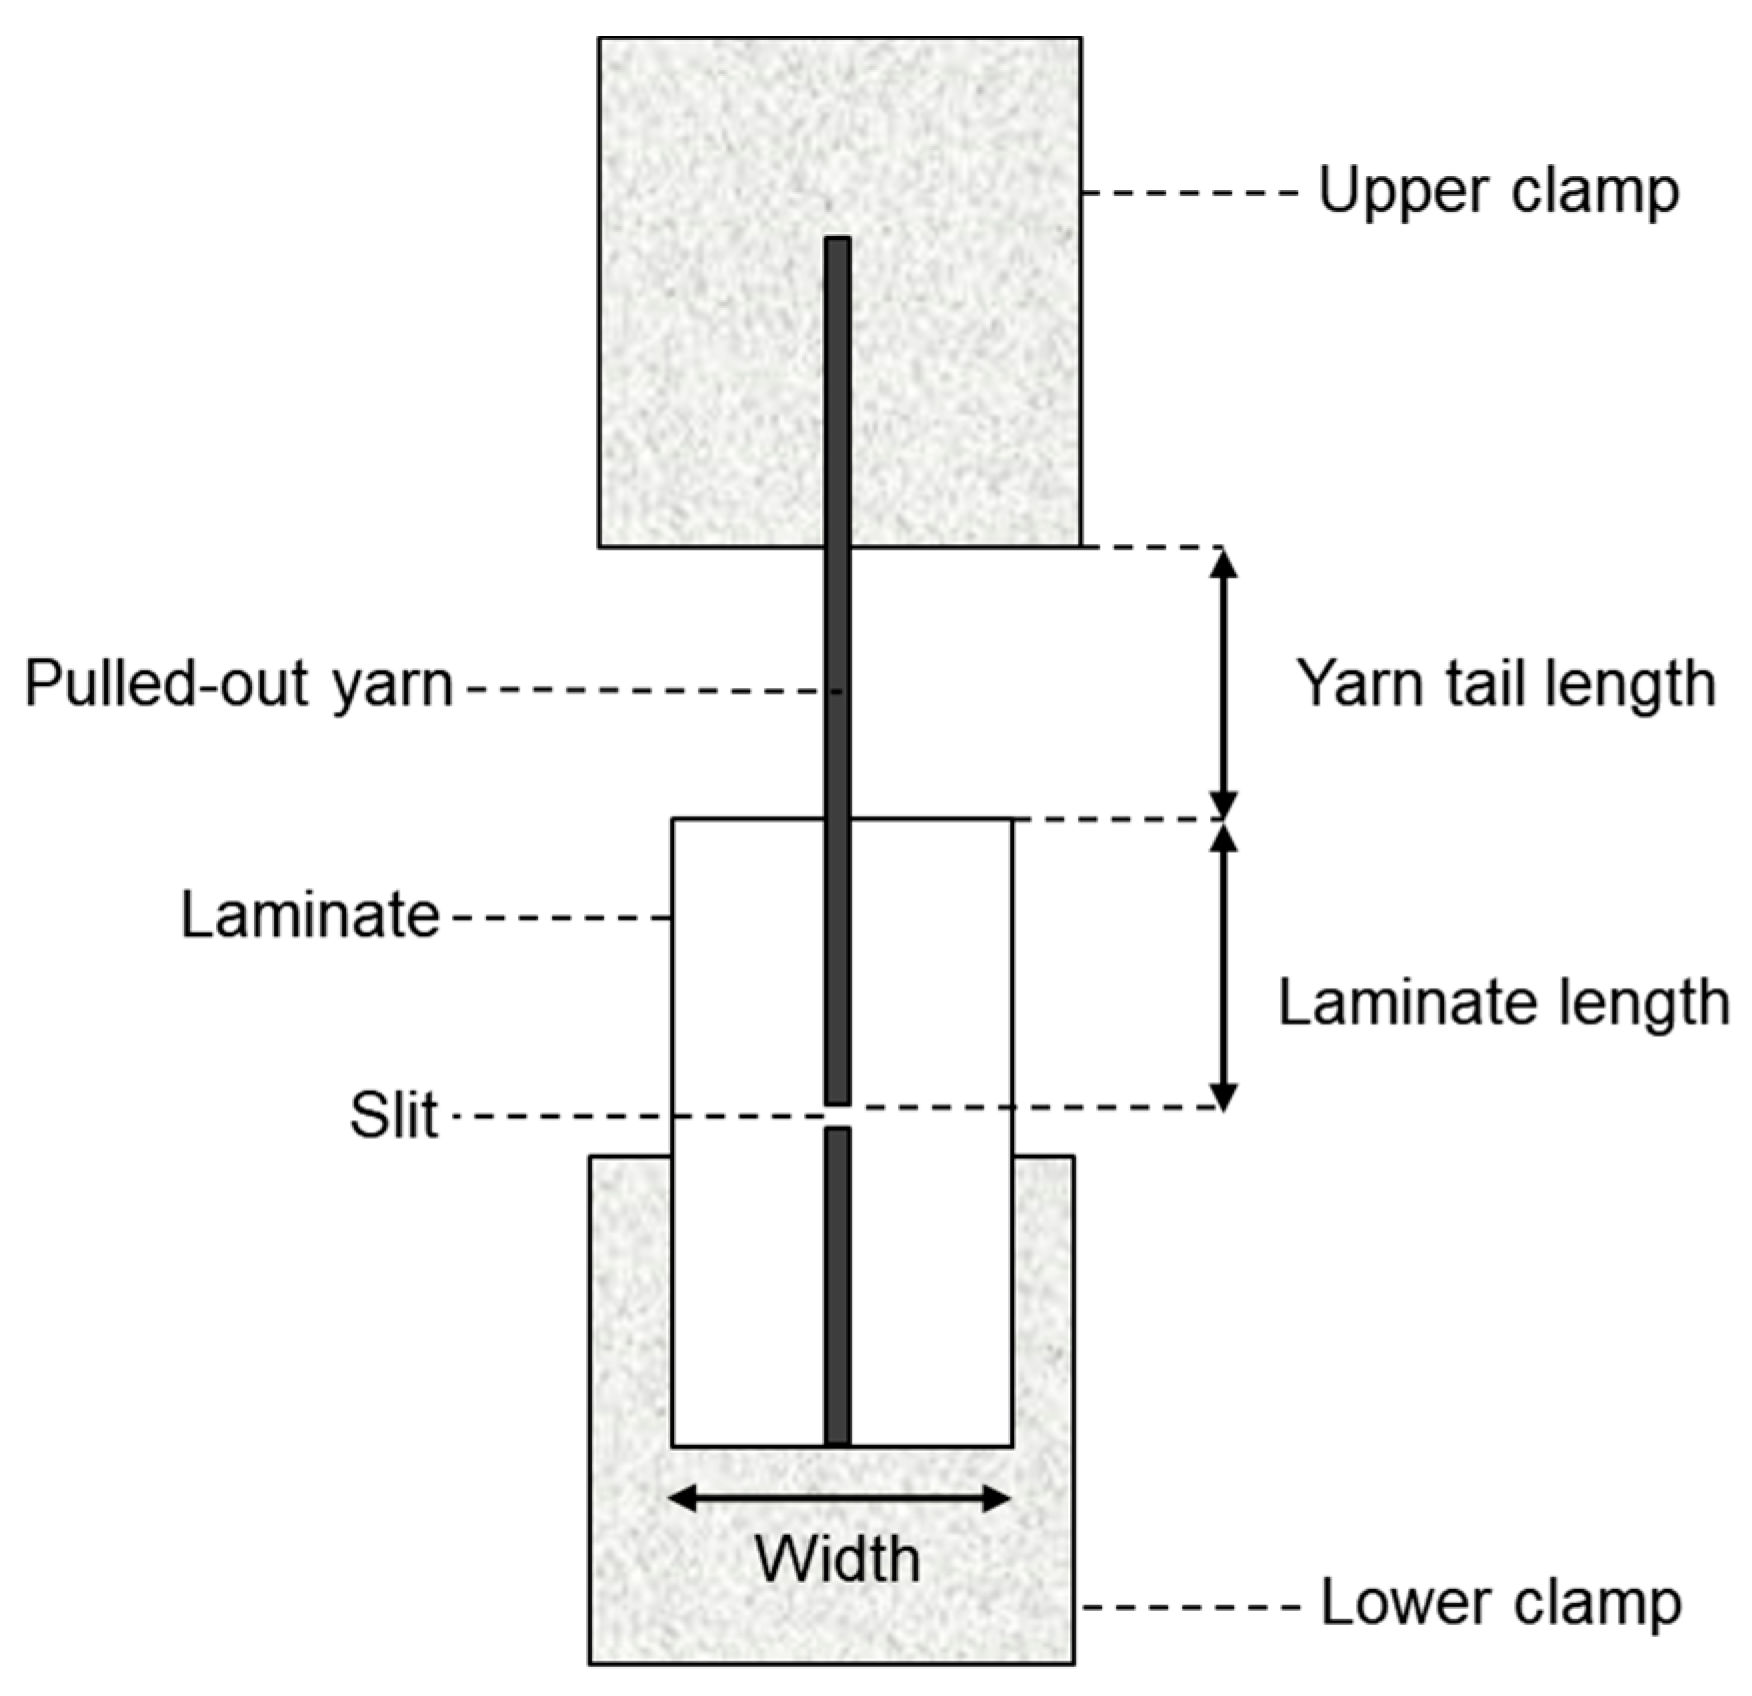
Yarn pullout in laminate test: For the yarn pullout in laminate test, a new schematic for the testing and the test samples has to be developed. The specifications shown in Figure 7 were determined to be adequate and consistent for testing the force to pull out a yarn from the laminate based on extensive preliminary work [23]. A test speed of 0.212 mm/s (0.5 inch/minute) was selected. To prepare the sample for testing, the film backing should be separated from the laminate by at least about 50 mm. Next, ten strips, each 15 mm wide and aligned parallel to the yarn, are cut from the material. Among these strips, one yarn located near the center is selected while the surrounding yarns in the same direction are removed from the laminate area. The laminate length is then marked, and a small slit is made in the middle, enclosing the selected yarn along with at least one yarn on either side which completes the preparation process. For precision, a magnifying glass is used to make sure the yarn as well as one yarn on either side is cut to ensure that the entire pullout yarn is separated from the rest of the laminate. The final step before testing involves attaching tabs to the ends using a material that facilitates gripping by the tensile machine’s jaw. It is important to ensure that the glue used for the tabs does not cover the slit. Leaving a small gap between the slit and the bottom jaw can prevent any obstruction during testing, as illustrated in Figure 7.

Figure 7.
Yarn pullout in laminate sample specifications.
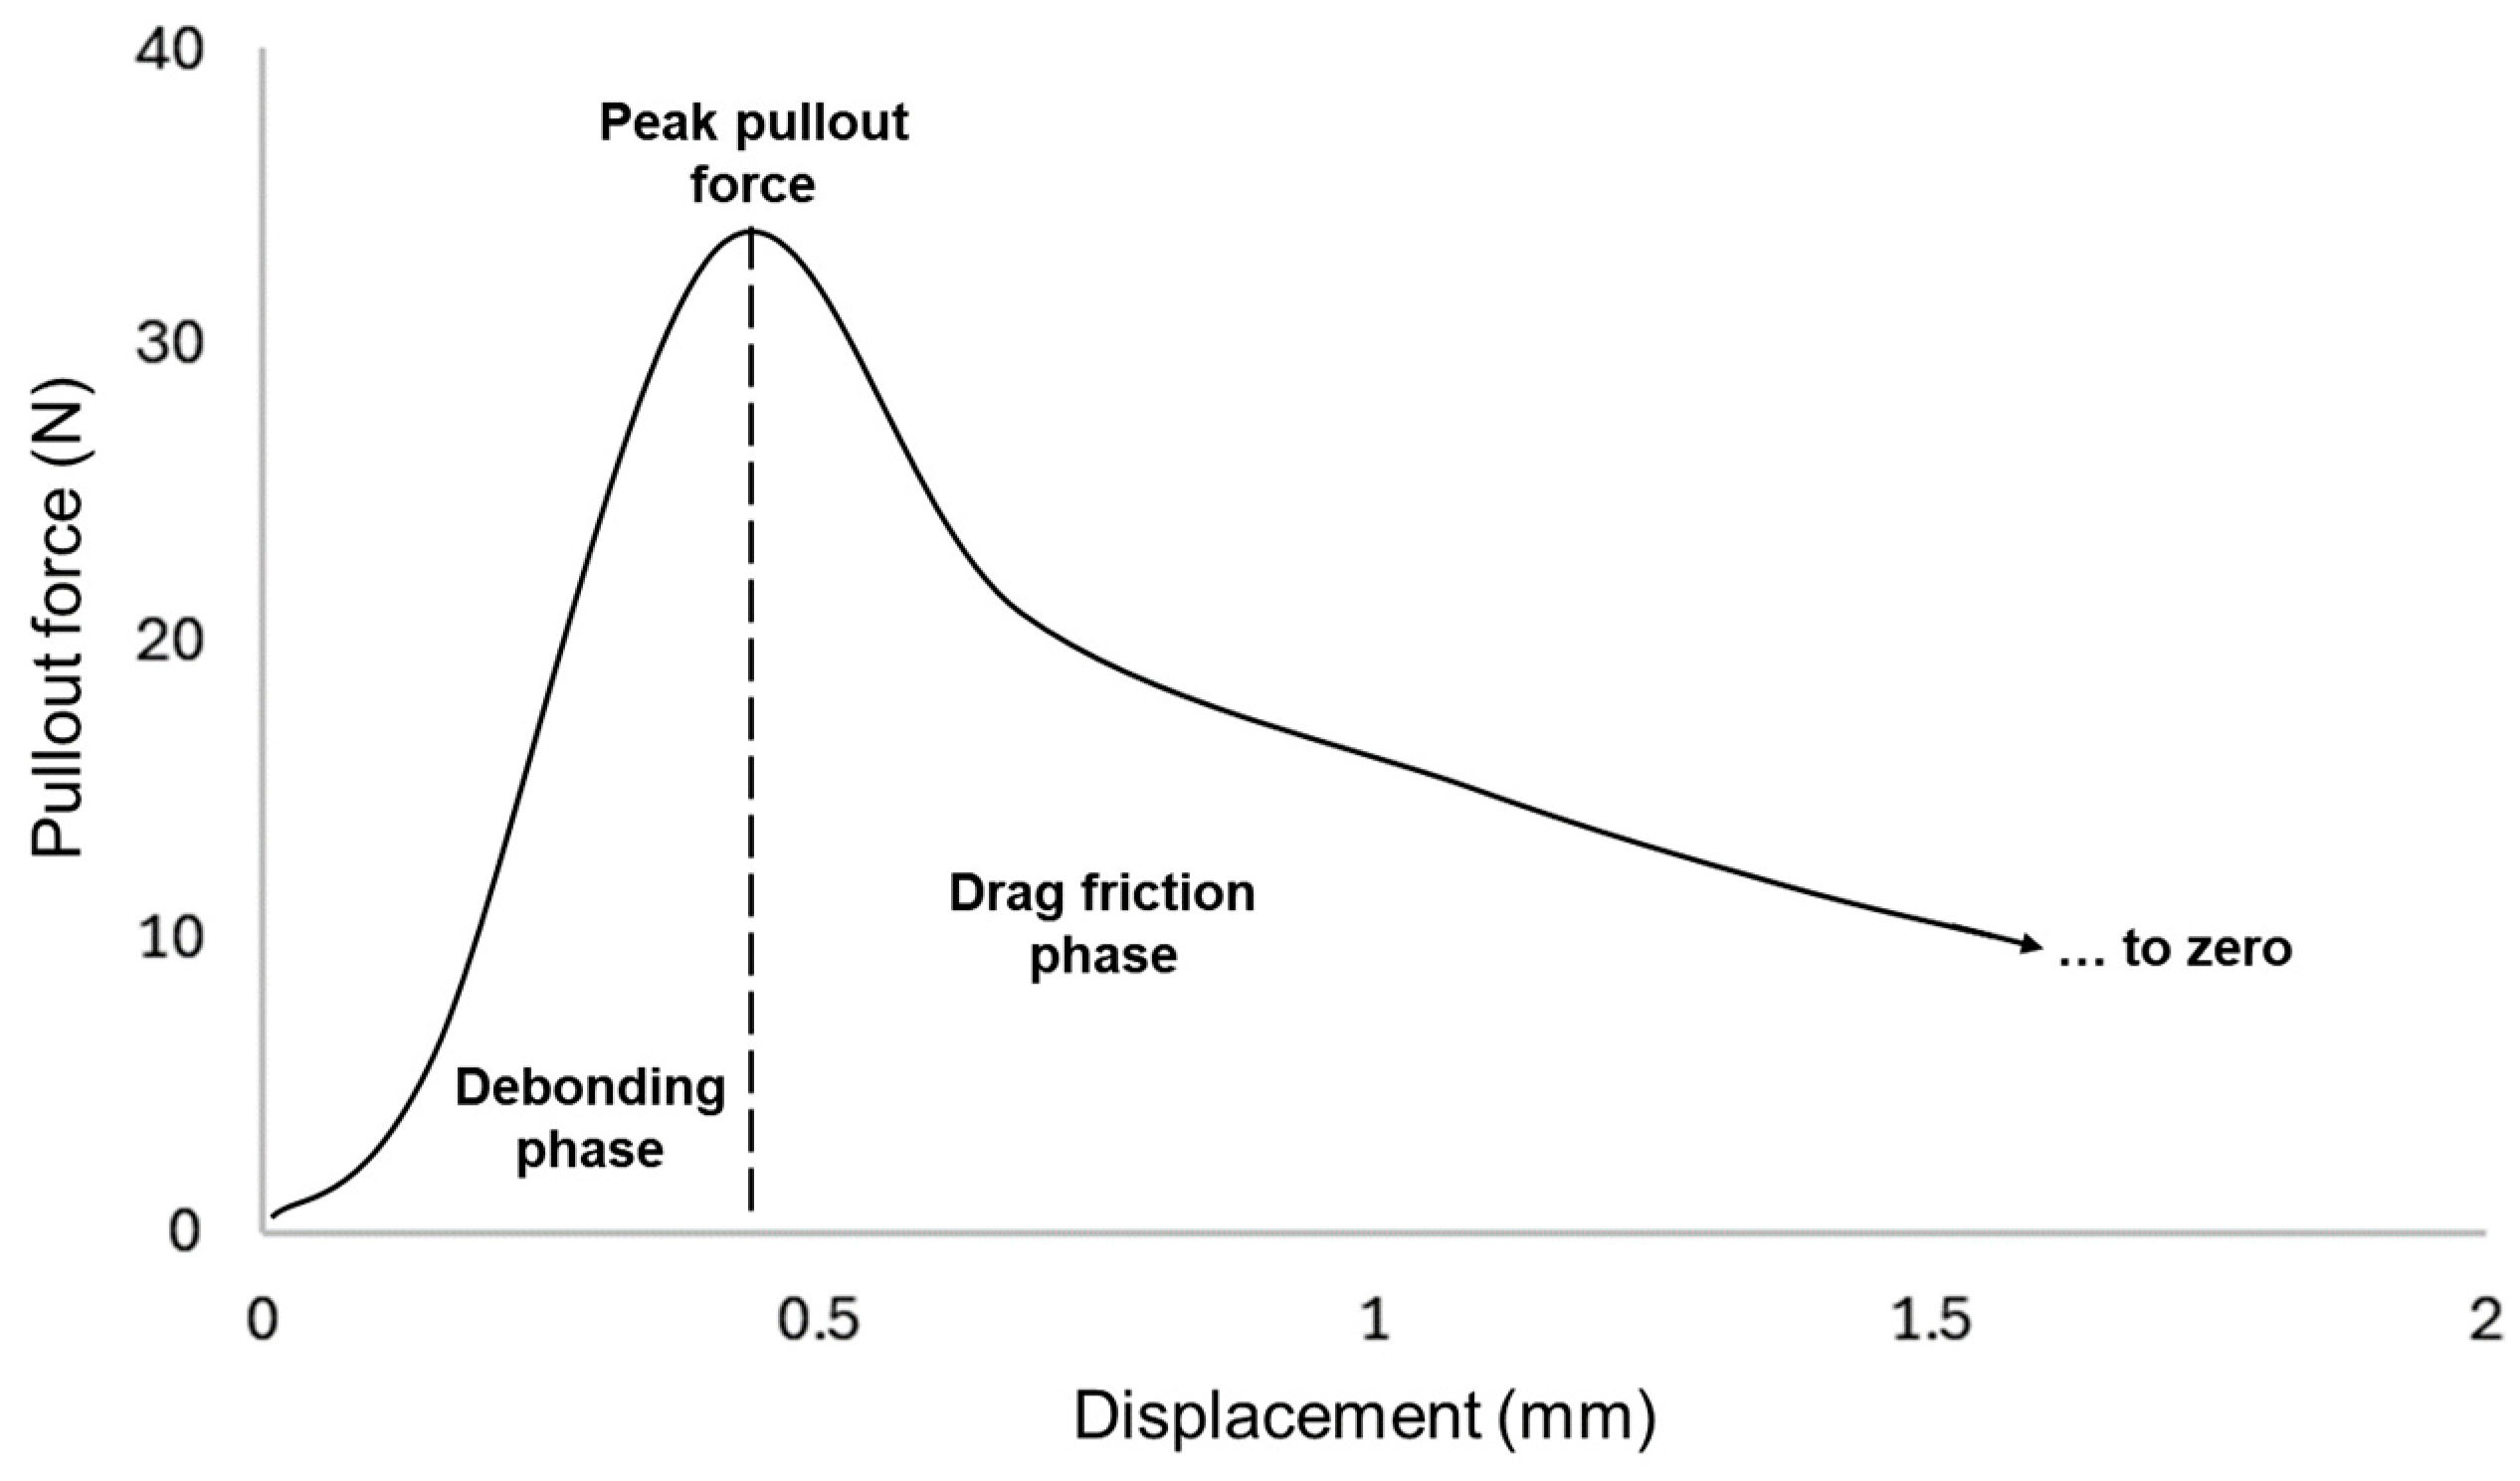
In Figure 8, an exemplary load-displacement curve from a yarn pullout in laminate test is depicted, which encompasses many aspects of the plain fabric pullout response [24]. When a yarn is pulled, the pullout force will reach a peak value. This peak pullout force is reported as an indication of the quality of the adhesion. The area under the curve preceding the dotted line is the energy required to cause the pullout yarn to break from the matrix and is dependent on the extent of adhesion between the fiber and the adhesive matrix.

Figure 8.
Typical load-displacement curve for yarn pullout in laminate test.
After it reaches the peak, there are drag frictional forces of the pullout yarn still in contact with the adhesive and crossing yarns in the laminate. The less contact the pullout yarn has in the laminate, the lower those drag forces will be. The drag forces will only reach zero once the yarn is fully out of the laminate. For stiff and rigid adhesives, it was observed that the drag forces are much lower than those for more elastic adhesives. Because rigid and stiff adhesives tend to ‘snap’ or break suddenly once peak pullout force has been reached, elastic matrixes tend to yield or bend before finally detaching. Additionally, in rare cases, when the yarn breaks instead of being pulled out, the curve reflects a single-yarn tensile property. In this case, the datum is considered an outlier and discarded.
3. Results and Discussions
3.1. T-Peel Test
The peel samples were prepared in two forms. For the unbonded area of the peel sample, the adhesive in between the woven fabric and film was bonded to the film side for one method (Ad to film) and to the woven fabric side for the other (Ad to fabric). For the samples made with EVOH adhesive, the T-peel test was not able to be performed as the film would break off on those samples before the test could be successfully propagated. This is due to EVOH having strong adhesion between the reinforcing Kevlar fabric and film. This indicates a disadvantage of the T-peel test. Furthermore, it was confirmed by using the yarn pullout in laminate test that the EVOH adhesive does have the strongest adhesion compared to the TPU and EVA films. For the TPU and EVA samples, t-test statistical analysis of the two forms of T-peel sample preparation classified as ‘Ad to fabric’ and ‘Ad to film’ showed that there was a statistical difference between them for some samples, while there was no difference for other samples. Visually, there was no difference in the failure mode; there was a mixture of adhesive and cohesive failures in both ‘Ad to fabric’ and ‘Ad to film’ samples. For the samples that did have a statistical difference, there was no consistent trend to which of the ‘Ad to fab’ or ‘Ad to film’ samples had higher or lower peak force, as seen in Table 4. The question of whether there was a significant difference between ‘Ad to fab’ and ‘Ad to film’ sample preparation methods of T-peel test led to the conclusion that the variations in the values were due to other factors such as natural variability. Also, higher peaks were observed during the test propagation when there was adhesive failure compared with cohesive failure. However, no two samples across all tests had the exact same pattern of adhesive versus cohesive failure, and during the test, the failure mode would jump from one to the other. This is the probable cause for the significant differences in the data for the two sample forms.
Table 4.
Question of whether there is a significant difference between ‘Ad to fab’ and ‘Ad to film’ sample preparation methods of T-peel test.
As expected, the Kevlar fabrics had better adhesion than UHMWPE fabrics, evident from the higher peel force values and confirmed by a statistically significant difference in the t-test, shown in Figure 9.
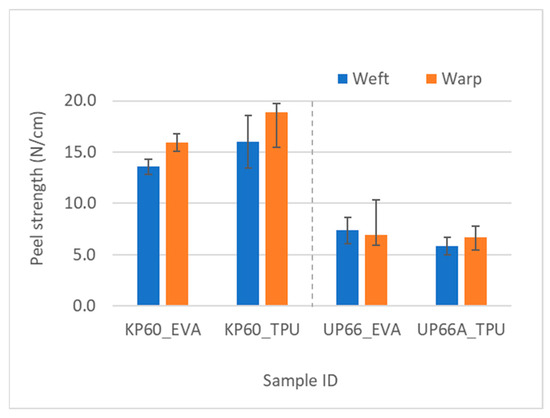
Figure 9.
Comparison of adhesion using T-peel test in Kevlar and UHMWPE woven fabrics with analogous areal density.
As the fabric weight increased, the peel strength lowered because the thicker fabrics with higher areal density would require thicker adhesive layers to properly wet the fabric surface and penetrate through the fibers. The effect of adhesive type on the peel strength was also substantial. Kevlar’s robust molecular structure, characterized by polymeric aromatic amide groups, provided a fertile ground for strong hydrogen bonding interactions, with TPU showcasing superior adhesion owing to its urethane groups’ resilience. Conversely, EVA, while offering potential bonding through polar acetate groups, grappled with repulsive forces, resulting in comparatively weaker adhesion. With UHMWPE, EVA exhibited higher peel strength, likely facilitated by a higher number of weak hydrogen bonding. The Kevlar fabrics were square fabrics; that is, the fabric linear density and the cover of the fabrics were the same in both warp and weft directions. As far as the peel strength goes for the two fabric directions, the t-test revealed no statistically significant difference between the warp and weft directions for the Kevlar fabrics. However, the warp values were consistently higher than weft values for all the Kevlar fabrics, which could be an indication of pre-weaving treatments on the warp yarns.
For the UHMWPE fabrics, the yarn densities were different in the warp and weft directions (UP66 epi × ppi: 40 × 30, UP80 epi × ppi: 5 × 35). The 66 g/m2 fabric showed there was a statistical difference in the peel strength, with the weft values being higher than the warp values, with a confidence value of 0.95. This is logical given that the yarn densities in the weft direction were lower, meaning there was lower cover in that direction (Table 2). Lower cover means that the adhesive is able to wet more of the fibers and thereby leads to an increase in the peel strength. A correlation analysis between cover and peel strength was also conducted to confirm this. There was statistically significant negative correlation between them, as the cover increases, the area the adhesive has to wet increases, and for the same amount of adhesive, the higher cover will lead to lower peel strength.
3.2. Correlation between Peel and Pullout in Laminate Test
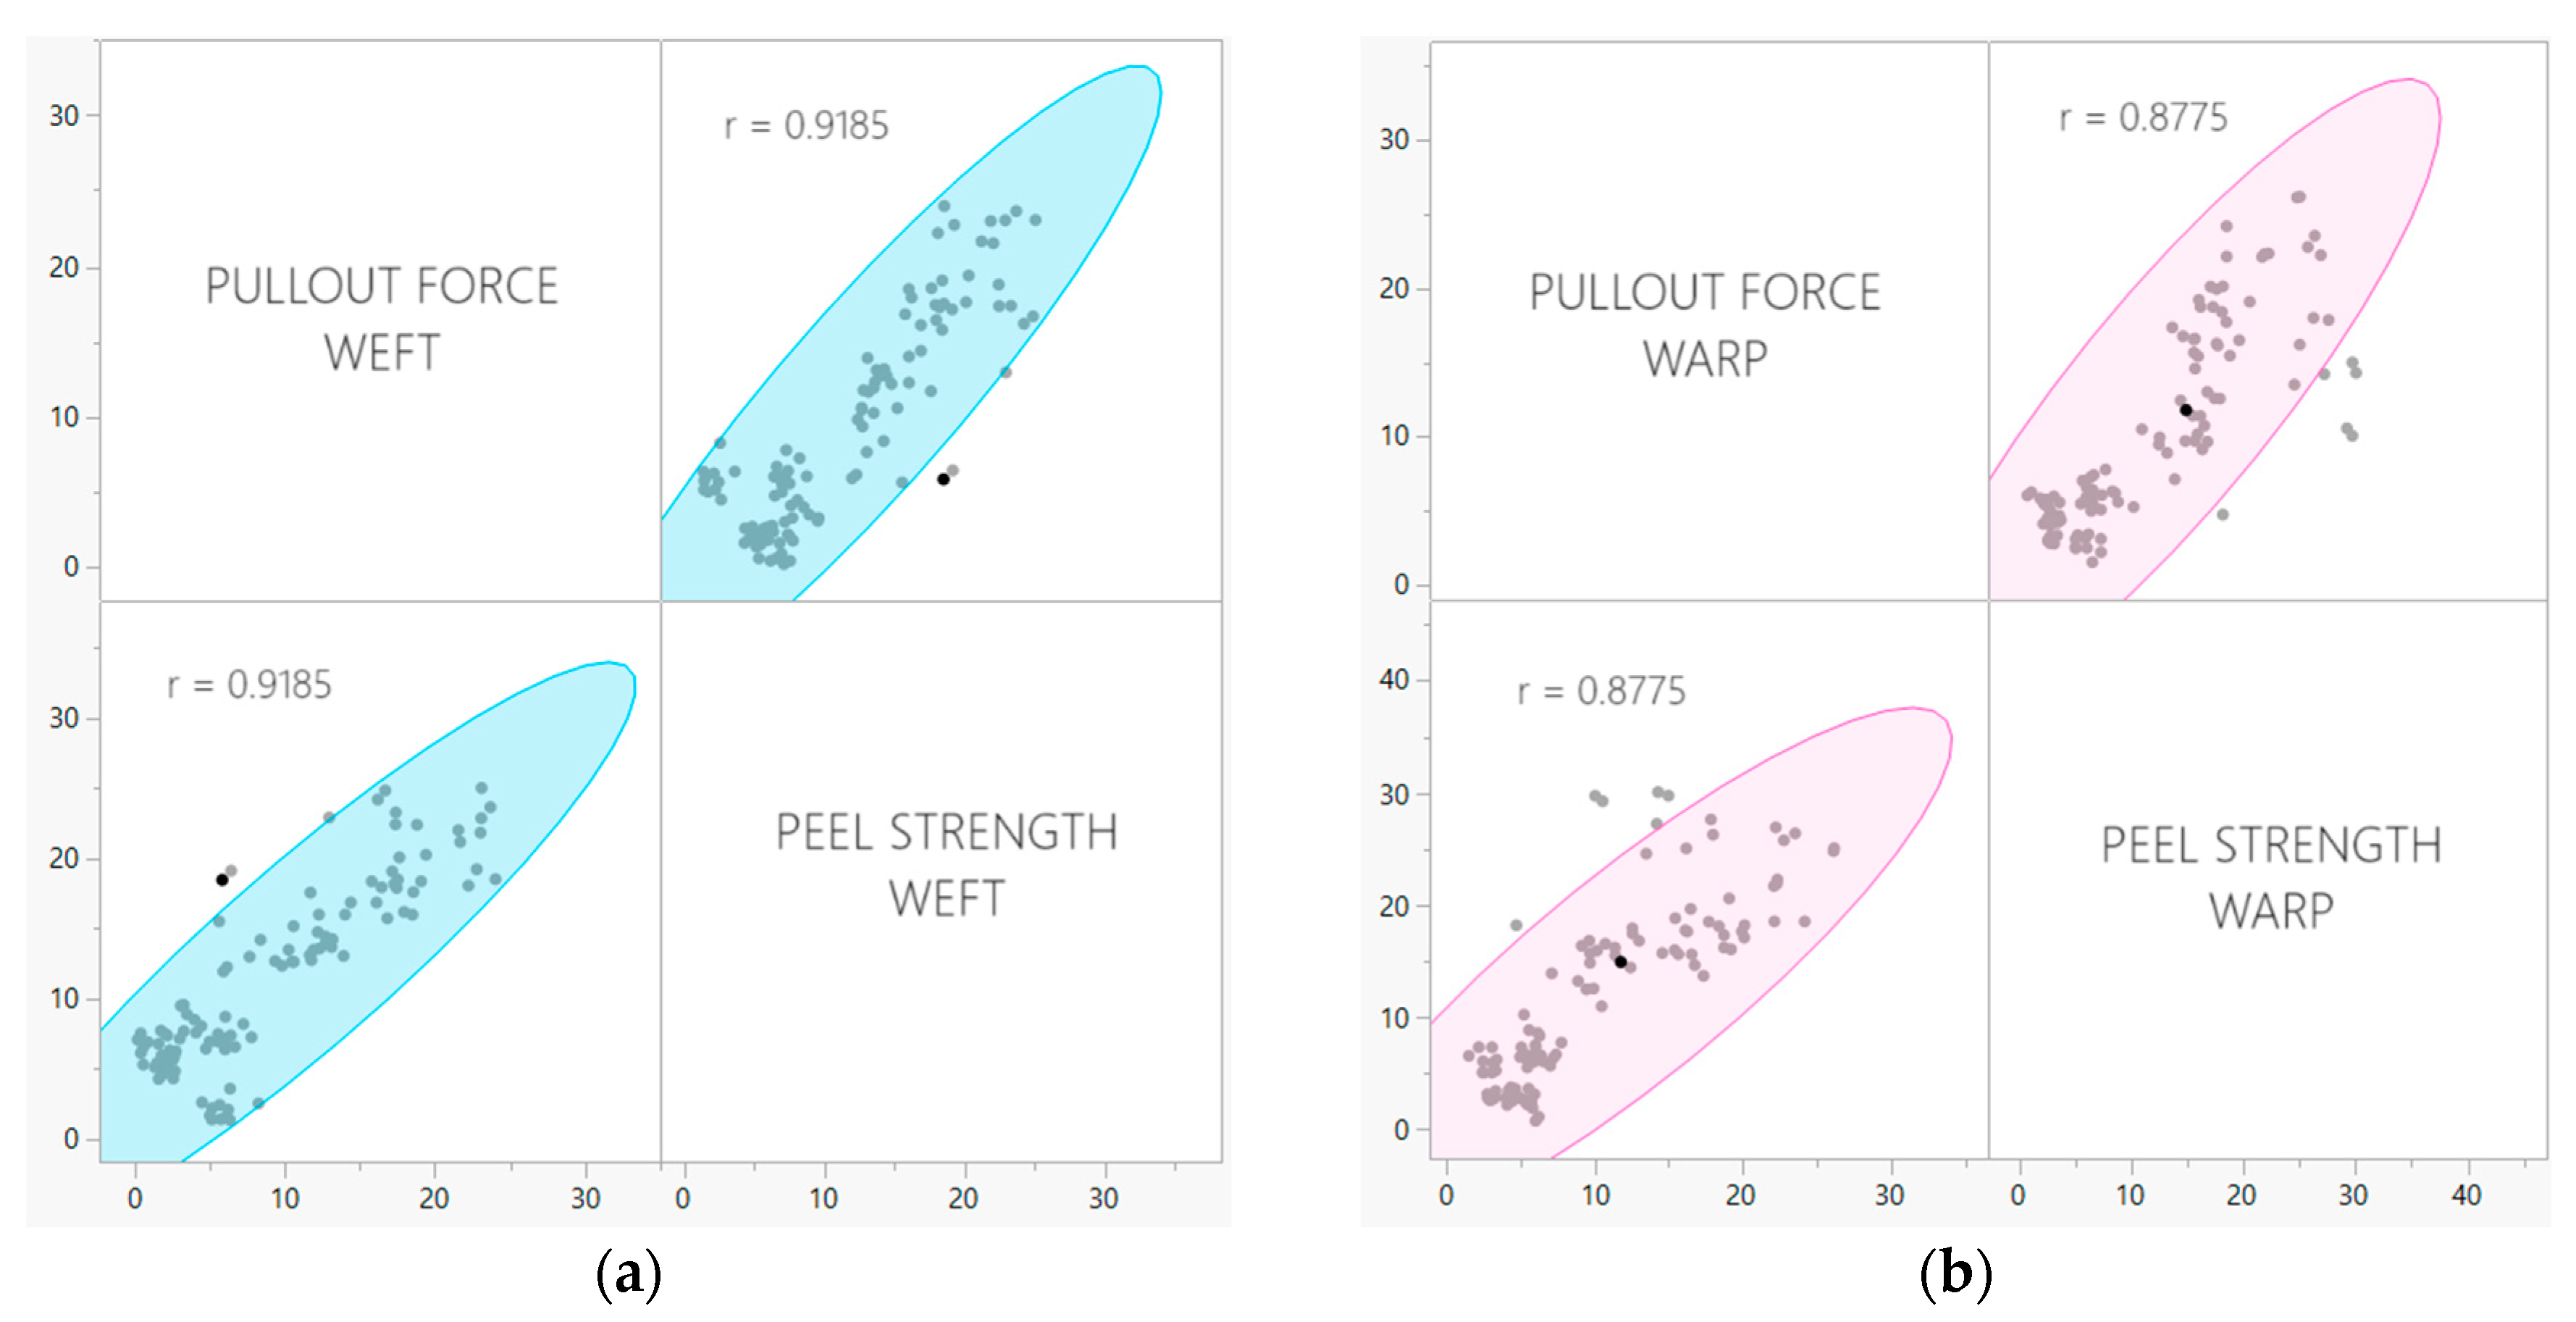
The pullout test developed by our research group as previously discussed, is a novel way of measuring the property of adhesion specifically in woven-fabric-reinforced laminates. Yarn pullout testing in laminates is a valuable alternative to traditional peel tests in cases where the latter may fail to accurately assess adhesion qualities in flexible FRLs. While peel tests primarily evaluate the interfacial adhesion between the laminate’s layers, they may not fully capture the complex mechanics at play in certain laminates, especially those with specialized fiber orientations or unique reinforcement structures. Yarn pullout in laminate testing offers a more detailed examination of the adhesion at the fiber–matrix interface. By focusing on the individual reinforcing fibers, it provides insights into the specific mechanisms of adhesion failure and the strength of the bond at a closer level. This method is particularly advantageous when dealing with laminates where delamination primarily initiates at the fiber–matrix interface as it directly simulates the critical failure mode. The outcomes of the pullout examination were compared to those of the T-peel test, revealing a strong correlation; 0.9185 for the weft samples and 0.8775 for warp samples (Figure 10).
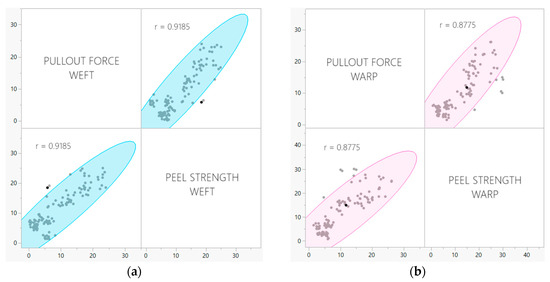
Figure 10.
Correlation between pullout force and peel strength for (a) weft samples and (b) warp samples.
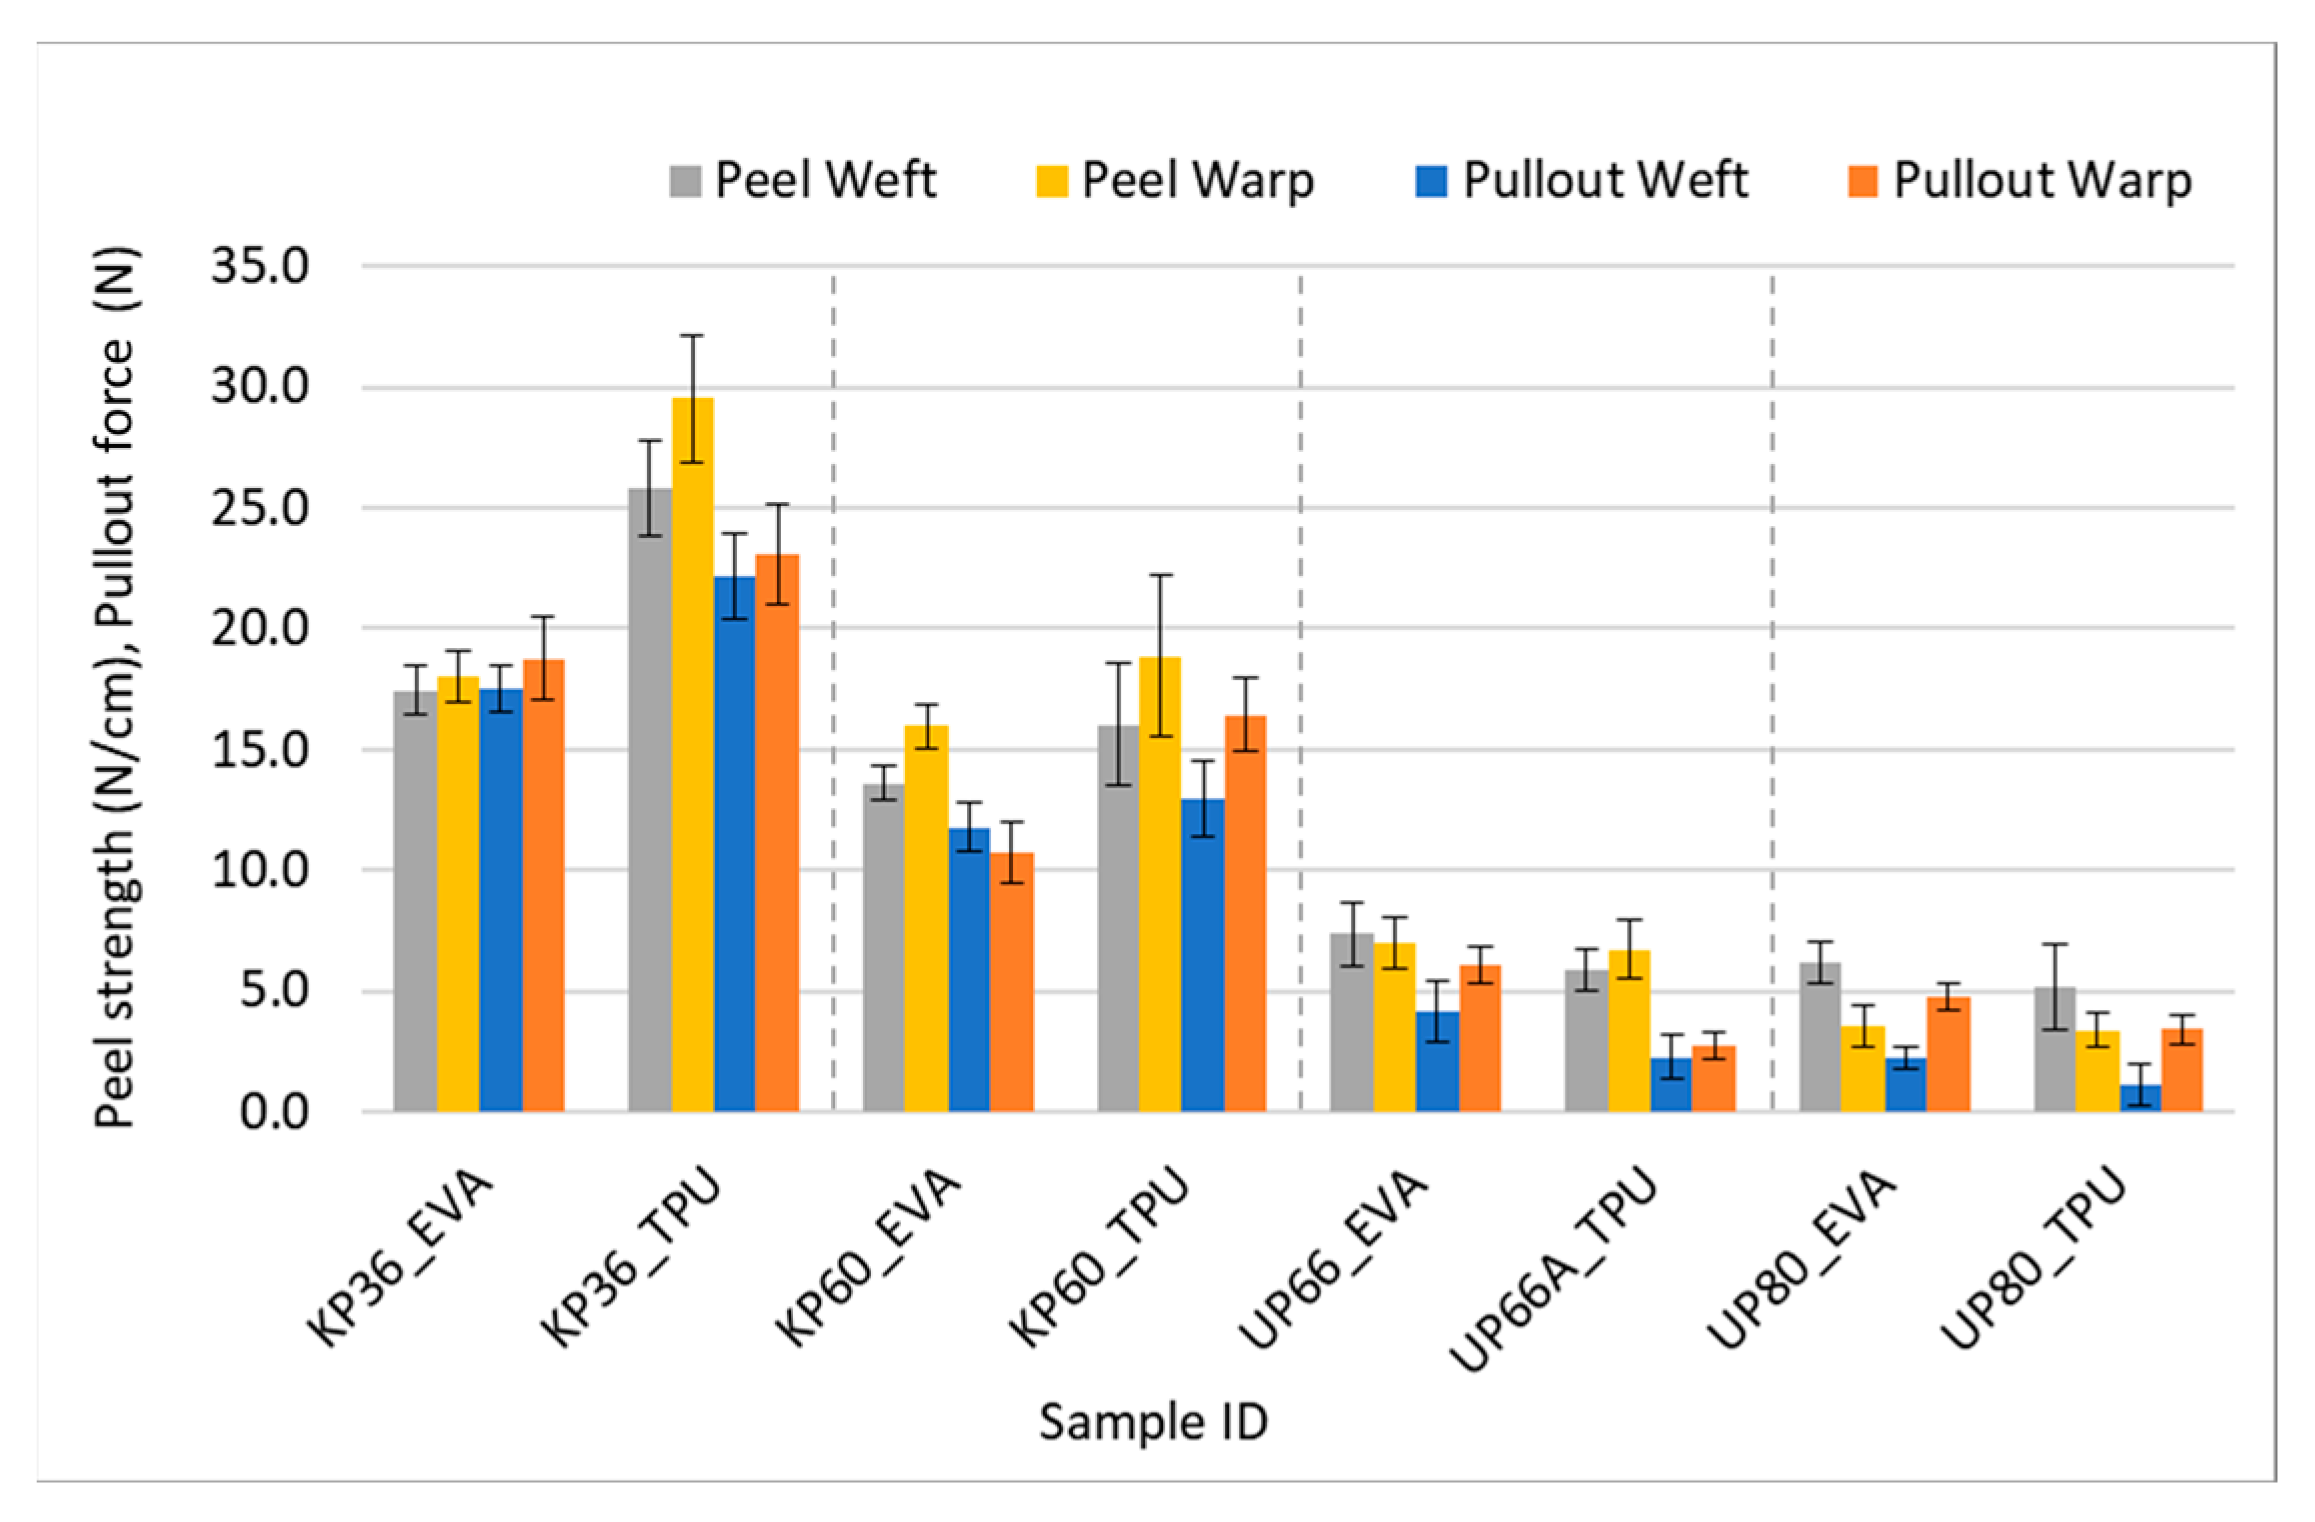
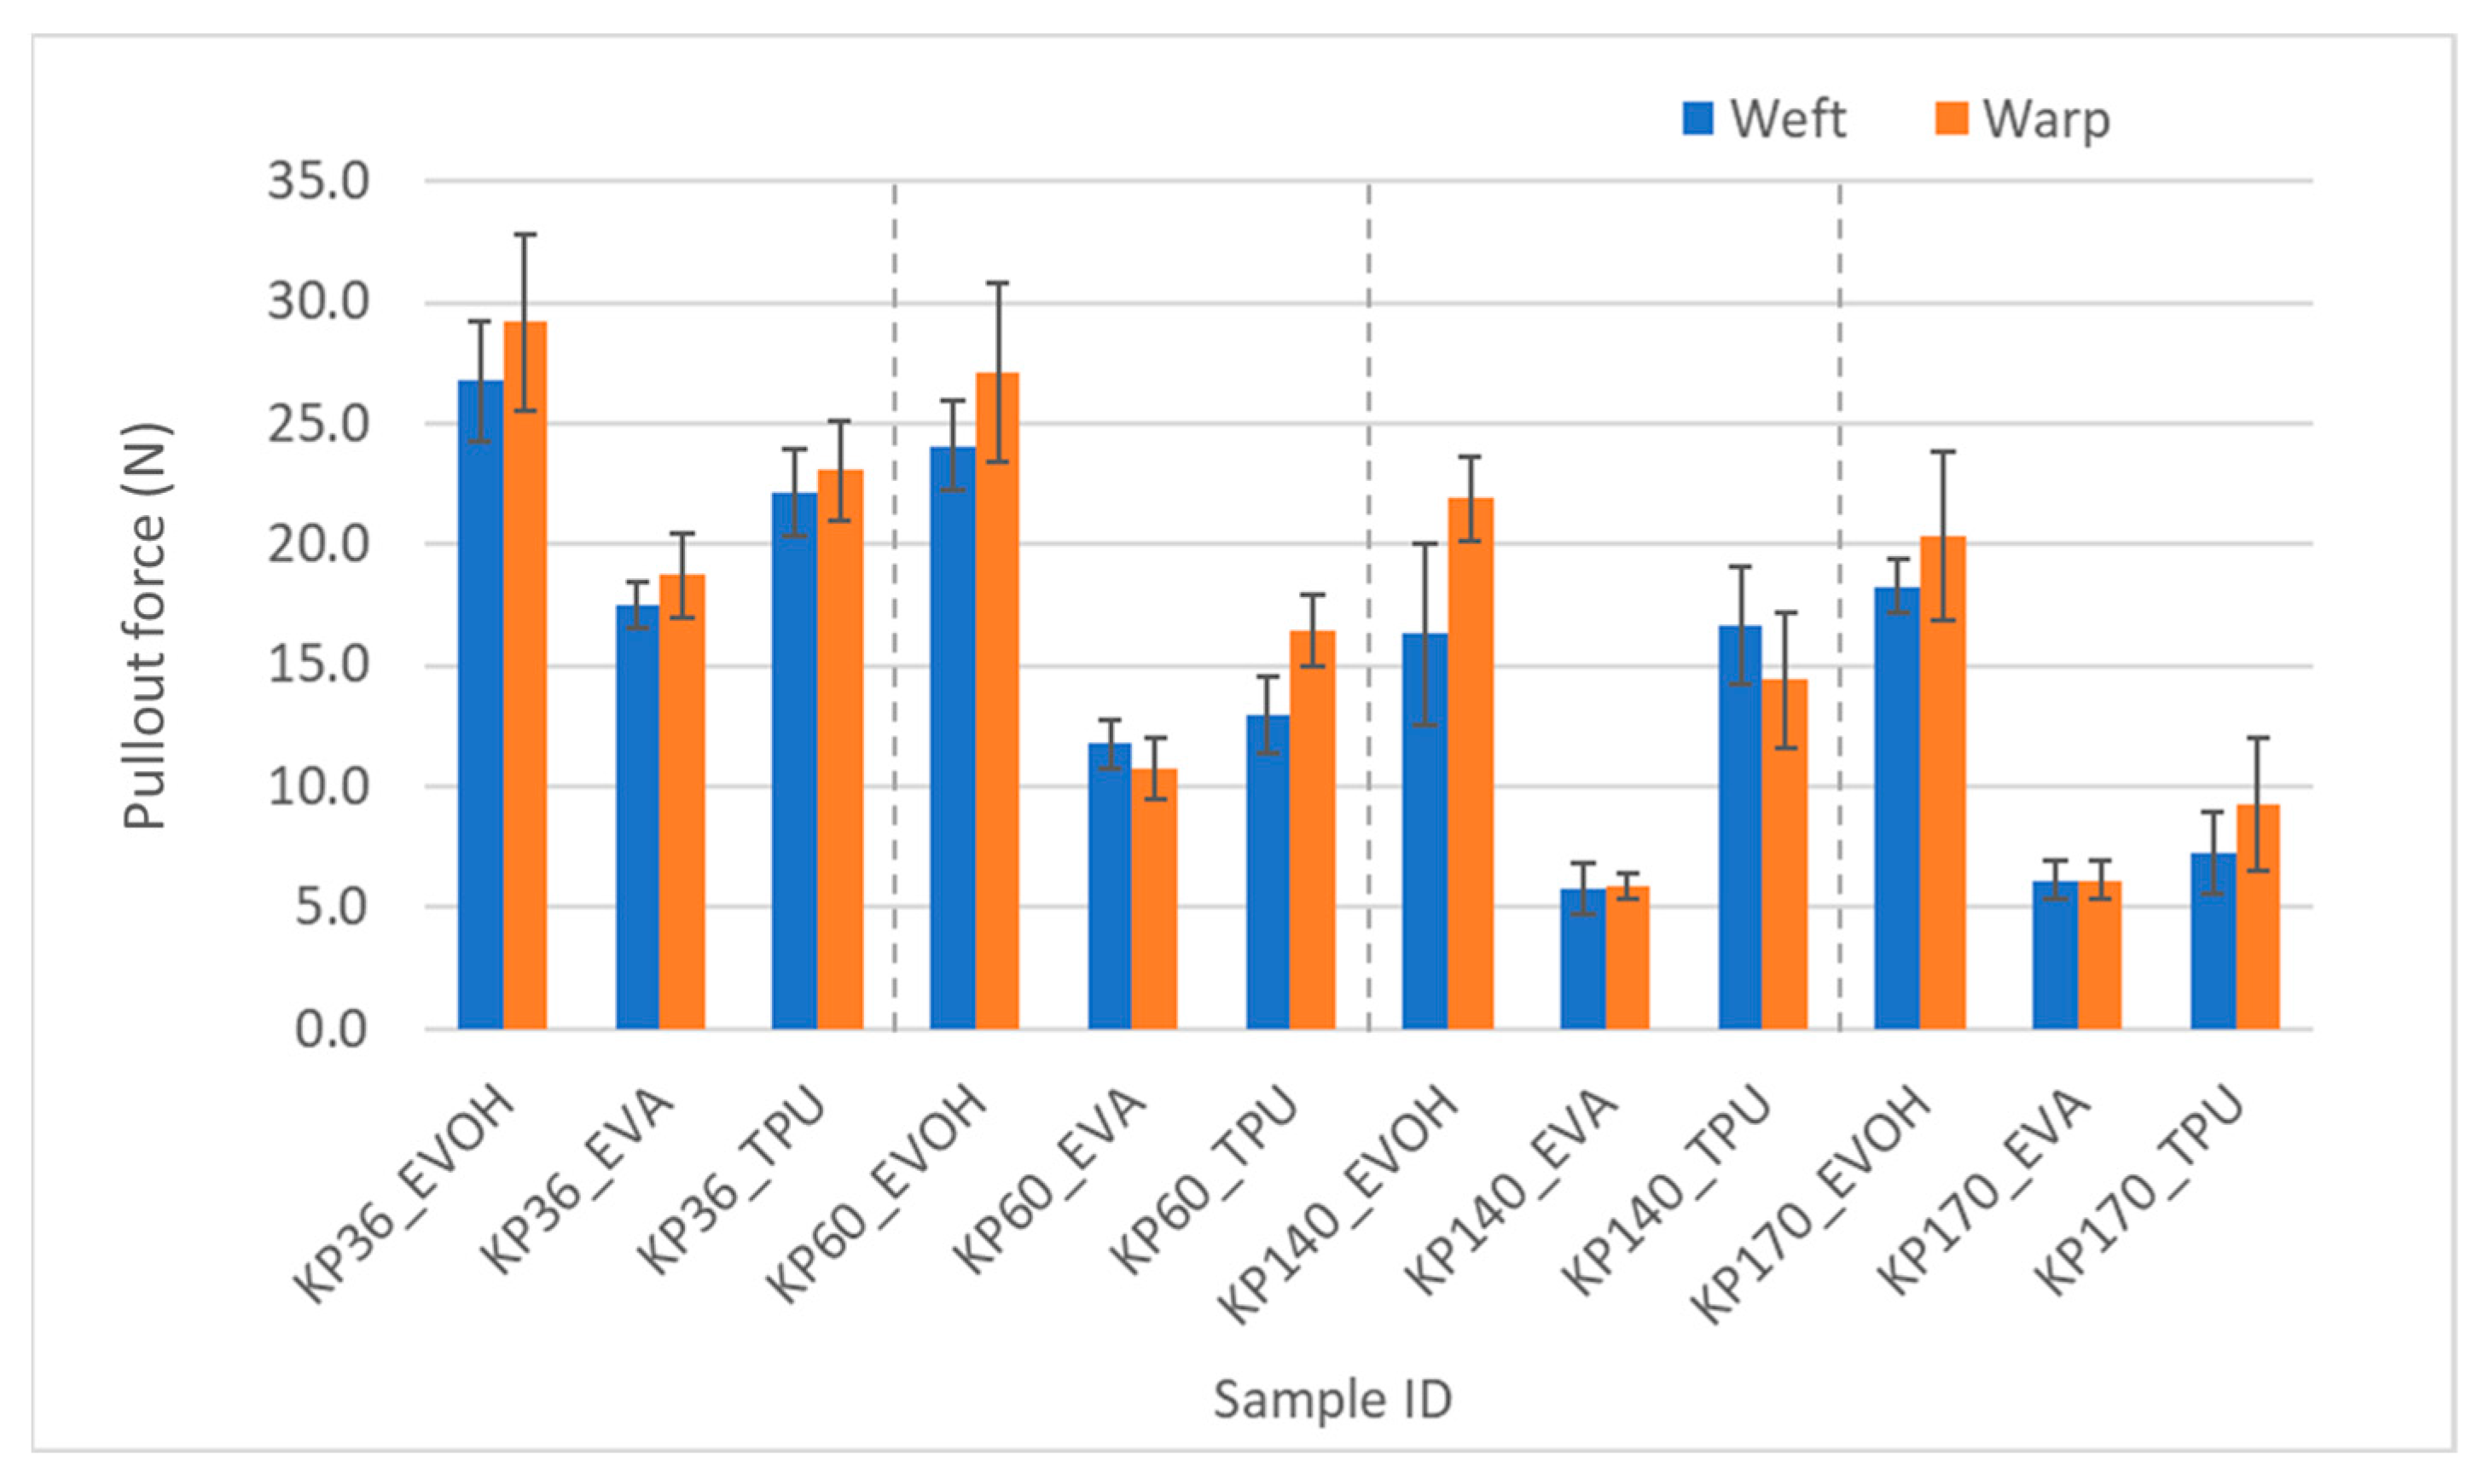
This correlation is visually evident in certain data points displayed on the bar chart in Figure 11. The findings obtained from the peel test ultimately corroborated the pullout force results. Although the values obtained from both testing methods are approximately equal in magnitude, they cannot be substituted for each other due to their distinct units of measurement. Nevertheless, it is safe to assert that they lead to the same conclusions.

Figure 11.
Comparison of peel and yarn pullout in laminate values.
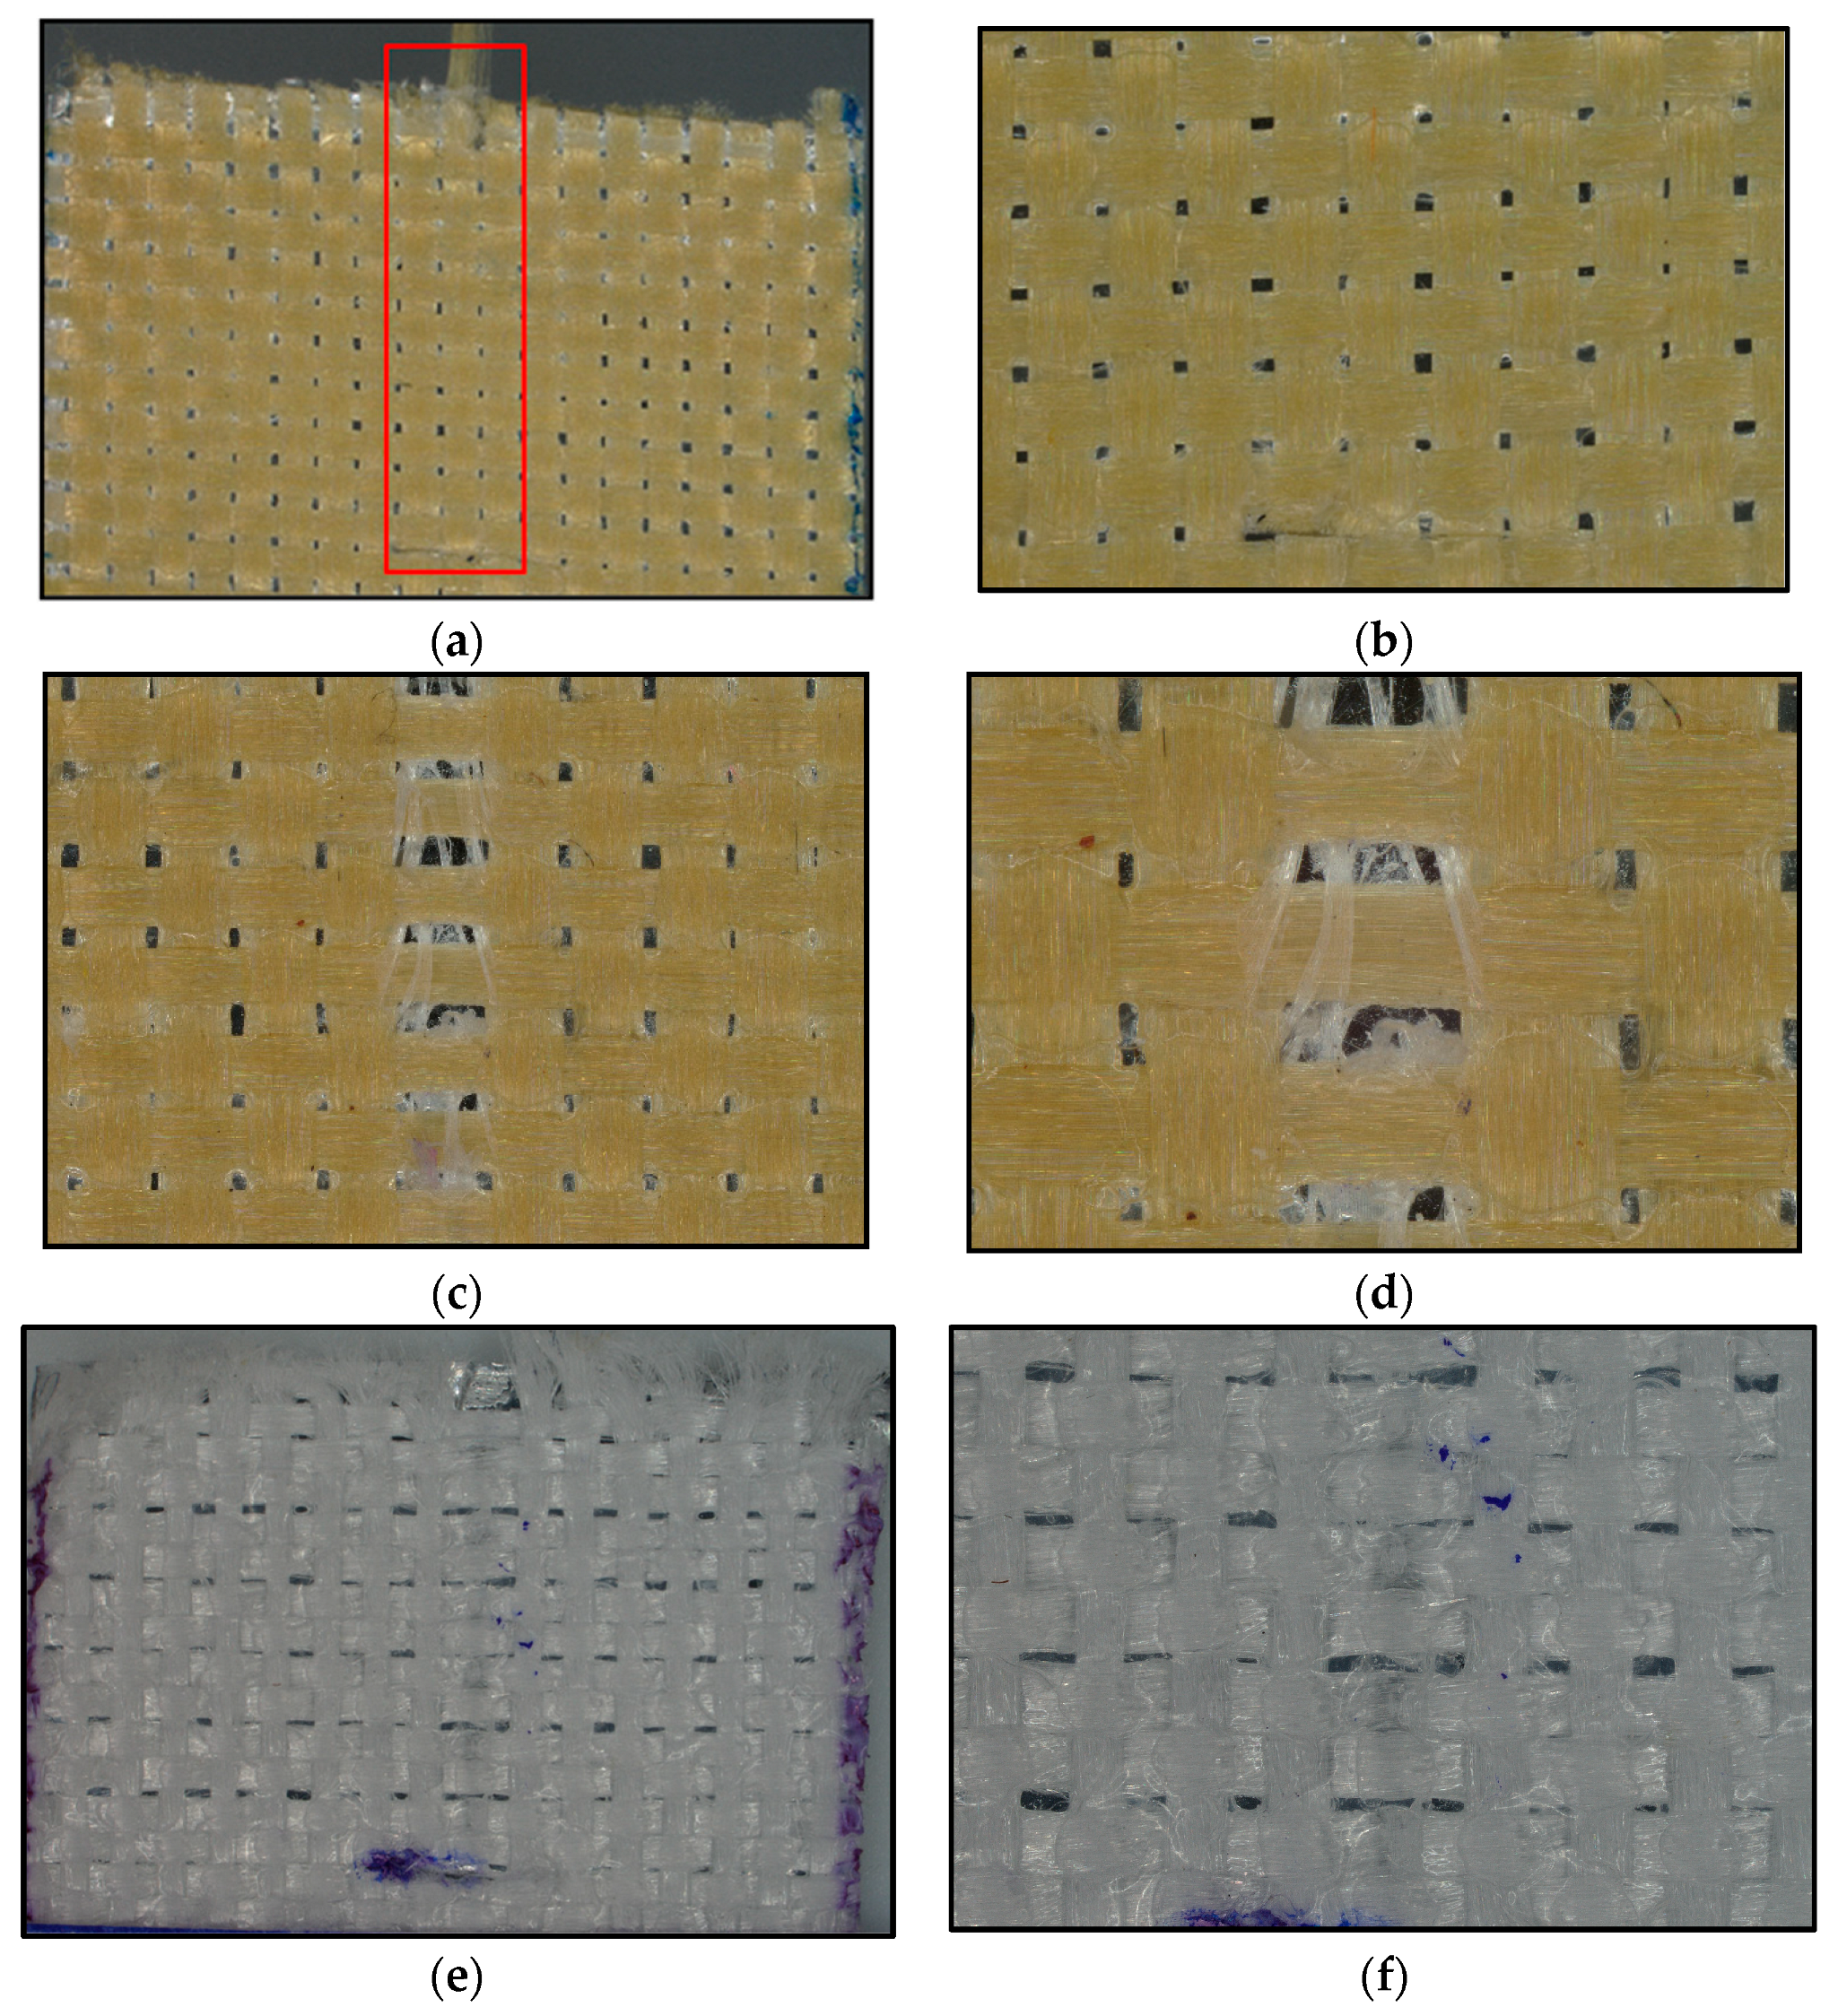
The pulled out yarn pretesting can be seen in the red box in Figure 12a. It is clear that the yarn pullout in laminate test measures adhesive property as microscopic images taken from tested samples in Figure 12c–f show the flow of adhesive in the direction of the pull. Also, pullout was conducted for just plain woven fabrics, and the force was negligible, meaning the contribution from friction was also negligible.
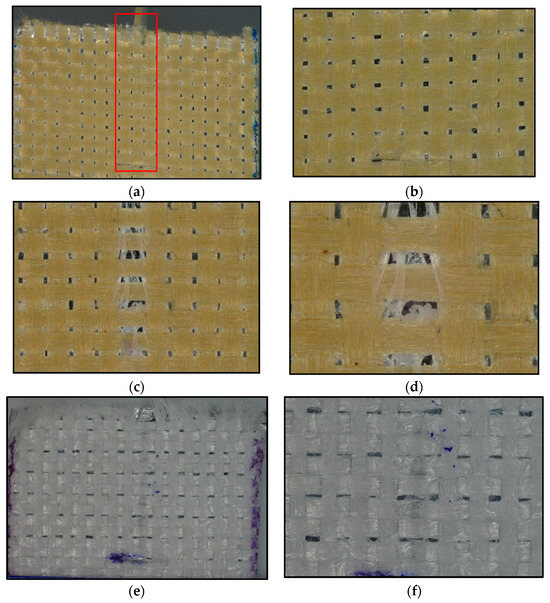
Figure 12.
Microscopic images of yarn pullout in laminate test: (a) KP60_EVOH before testing in X20 mag, (b) KP60_EVOH before testing in X40 mag, (c) KP60_EVOH after testing in X40 mag, (d) KP60_EVOH after testing in X80 mag, (e) UP66_TPU after testing in X20 mag, and (f) UP66_TPU after testing in X40 mag.
3.3. Yarn Pullout in FRL Test
The effect of adhesive types on the pullout force was substantial. The pullout in laminate test results agreed with the T-peel strength in that TPU consistently showed higher force values, which were statistically significant, than EVA in the Kevlar FRLs; however, EVOH was the highest of all three adhesives. It could have been assumed from the failed T-peel test for the EVOH samples that EVOH had the highest adhesion among all three adhesives, but the yarn pullout in laminate test was able to confirm this postulation. This was consistent across all the Kevlar fabrics as shown in Figure 13.
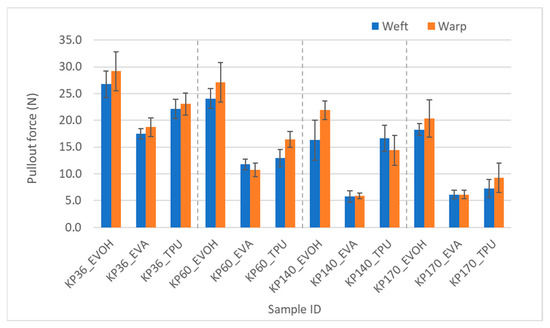
Figure 13.
Pullout force of Kevlar samples in weft and warp directions.
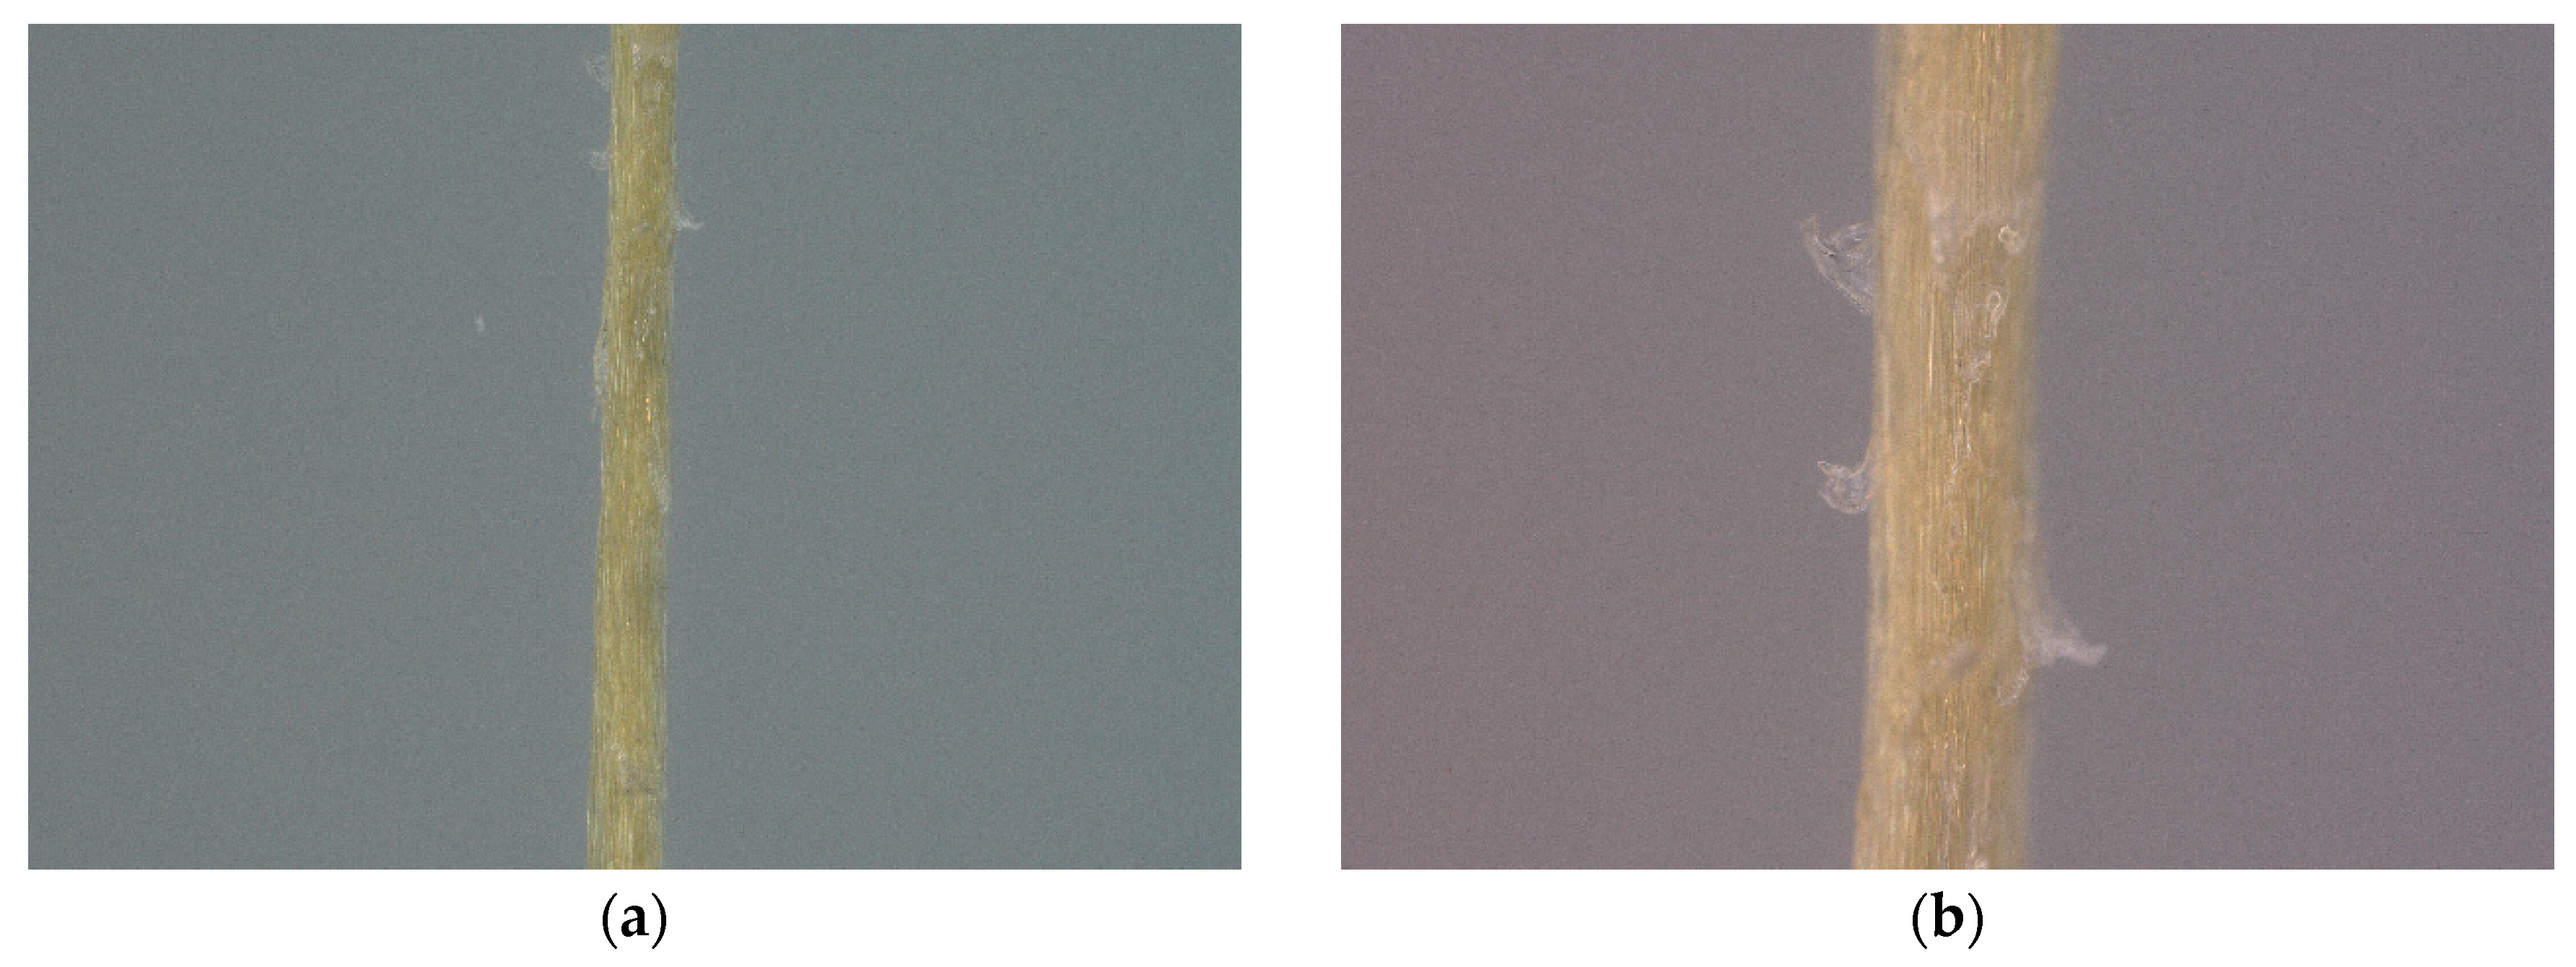
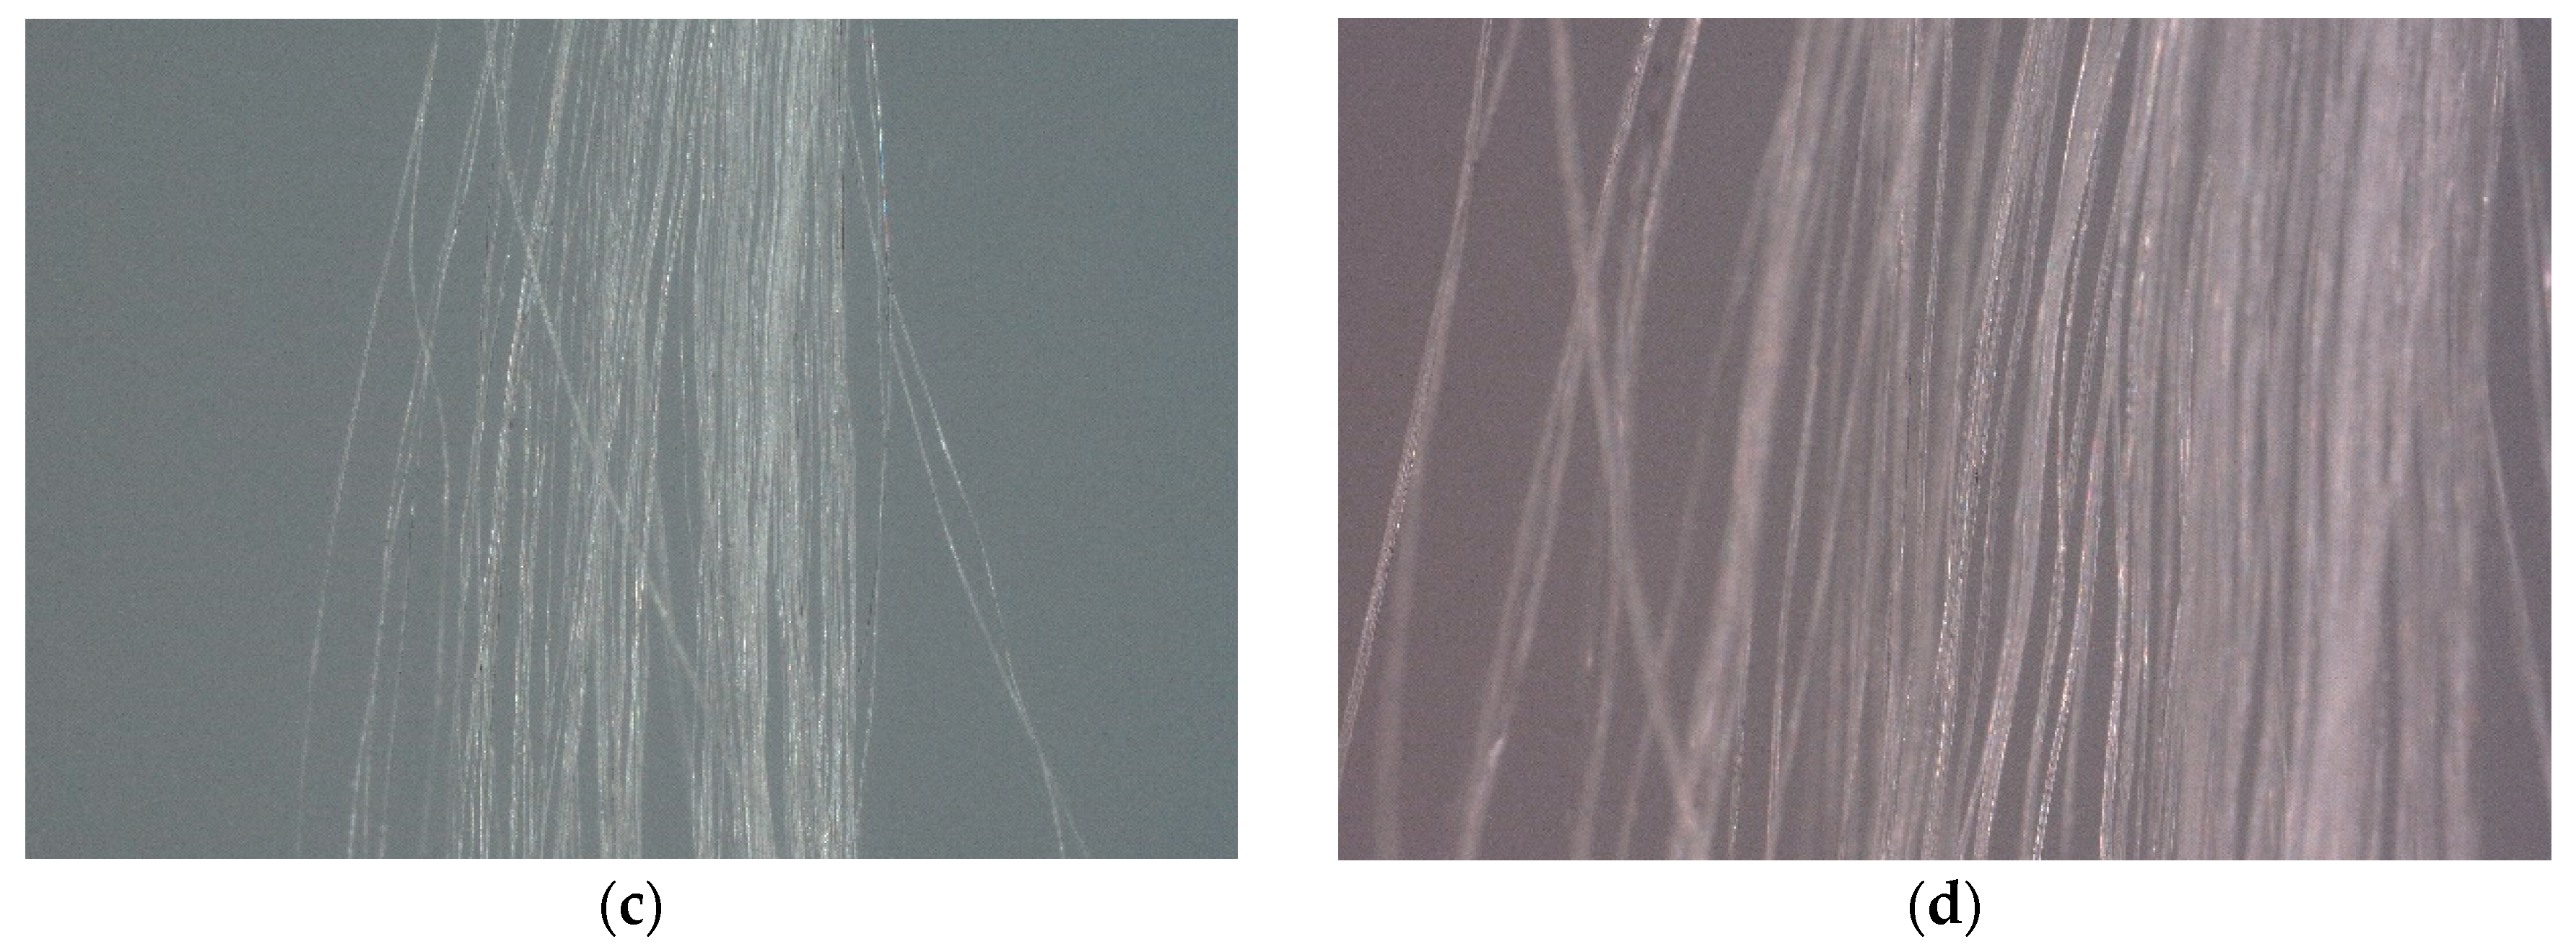
The adhesion to the UHMWPE fabrics was notably lower compared to the Kevlar fabrics. This difference is evident not only from the values of pullout force but also from the microscopic images of the yarns after they were pulled out in Figure 14. In the case of Kevlar, the adhesive effectively binds the single filaments together, indicating proper wetting. However, with UHMWPE, individual filaments remain visibly separated, and no adhesive is seen on the yarns.
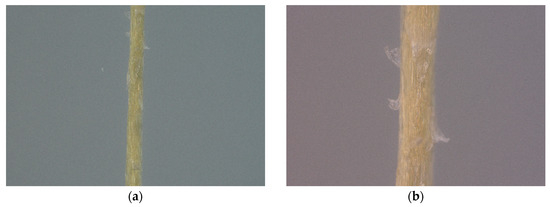
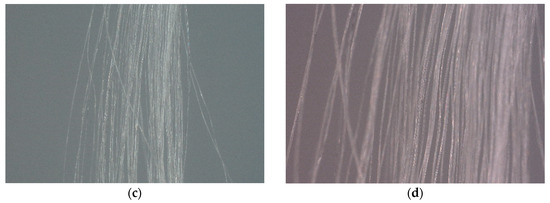
Figure 14.
Microscopic images of yarn after being pulled out of laminate: (a) Kevlar yarn in 40× mag, (b) Kevlar yarn in 100× mag, (c) UHMWPE yarn in 40× mag, and (d) UHMWPE yarn in 100× mag.
For the UHMWPE-fabric-reinforced laminate samples, in the peel test, EVA performed better than TPU. This is also clearly seen in the yarn pullout in laminate test as there were statistically significant differences between the two adhesives for both UP66 and UP80 (Figure 15). This shows that EVA has more affinity for UHMWPE than TPU, while TPU had more affinity for the Kevlar fabrics (Figure 2). As far as differences in the pullout strength in the fabric directions, the t-test revealed that there was no statistically significant difference between the warp and weft difference for the Kevlar square fabrics, just like the peel test. However, most of the warp values were also consistently higher.
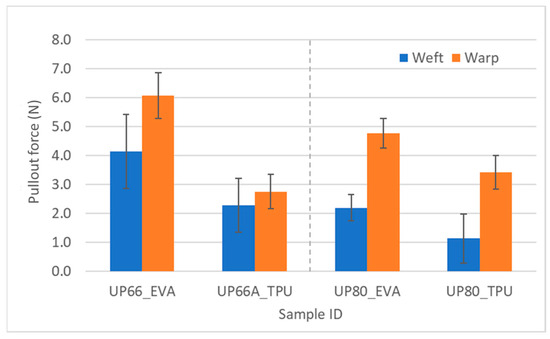
Figure 15.
Pullout force of UHMWPE samples in weft and warp directions.
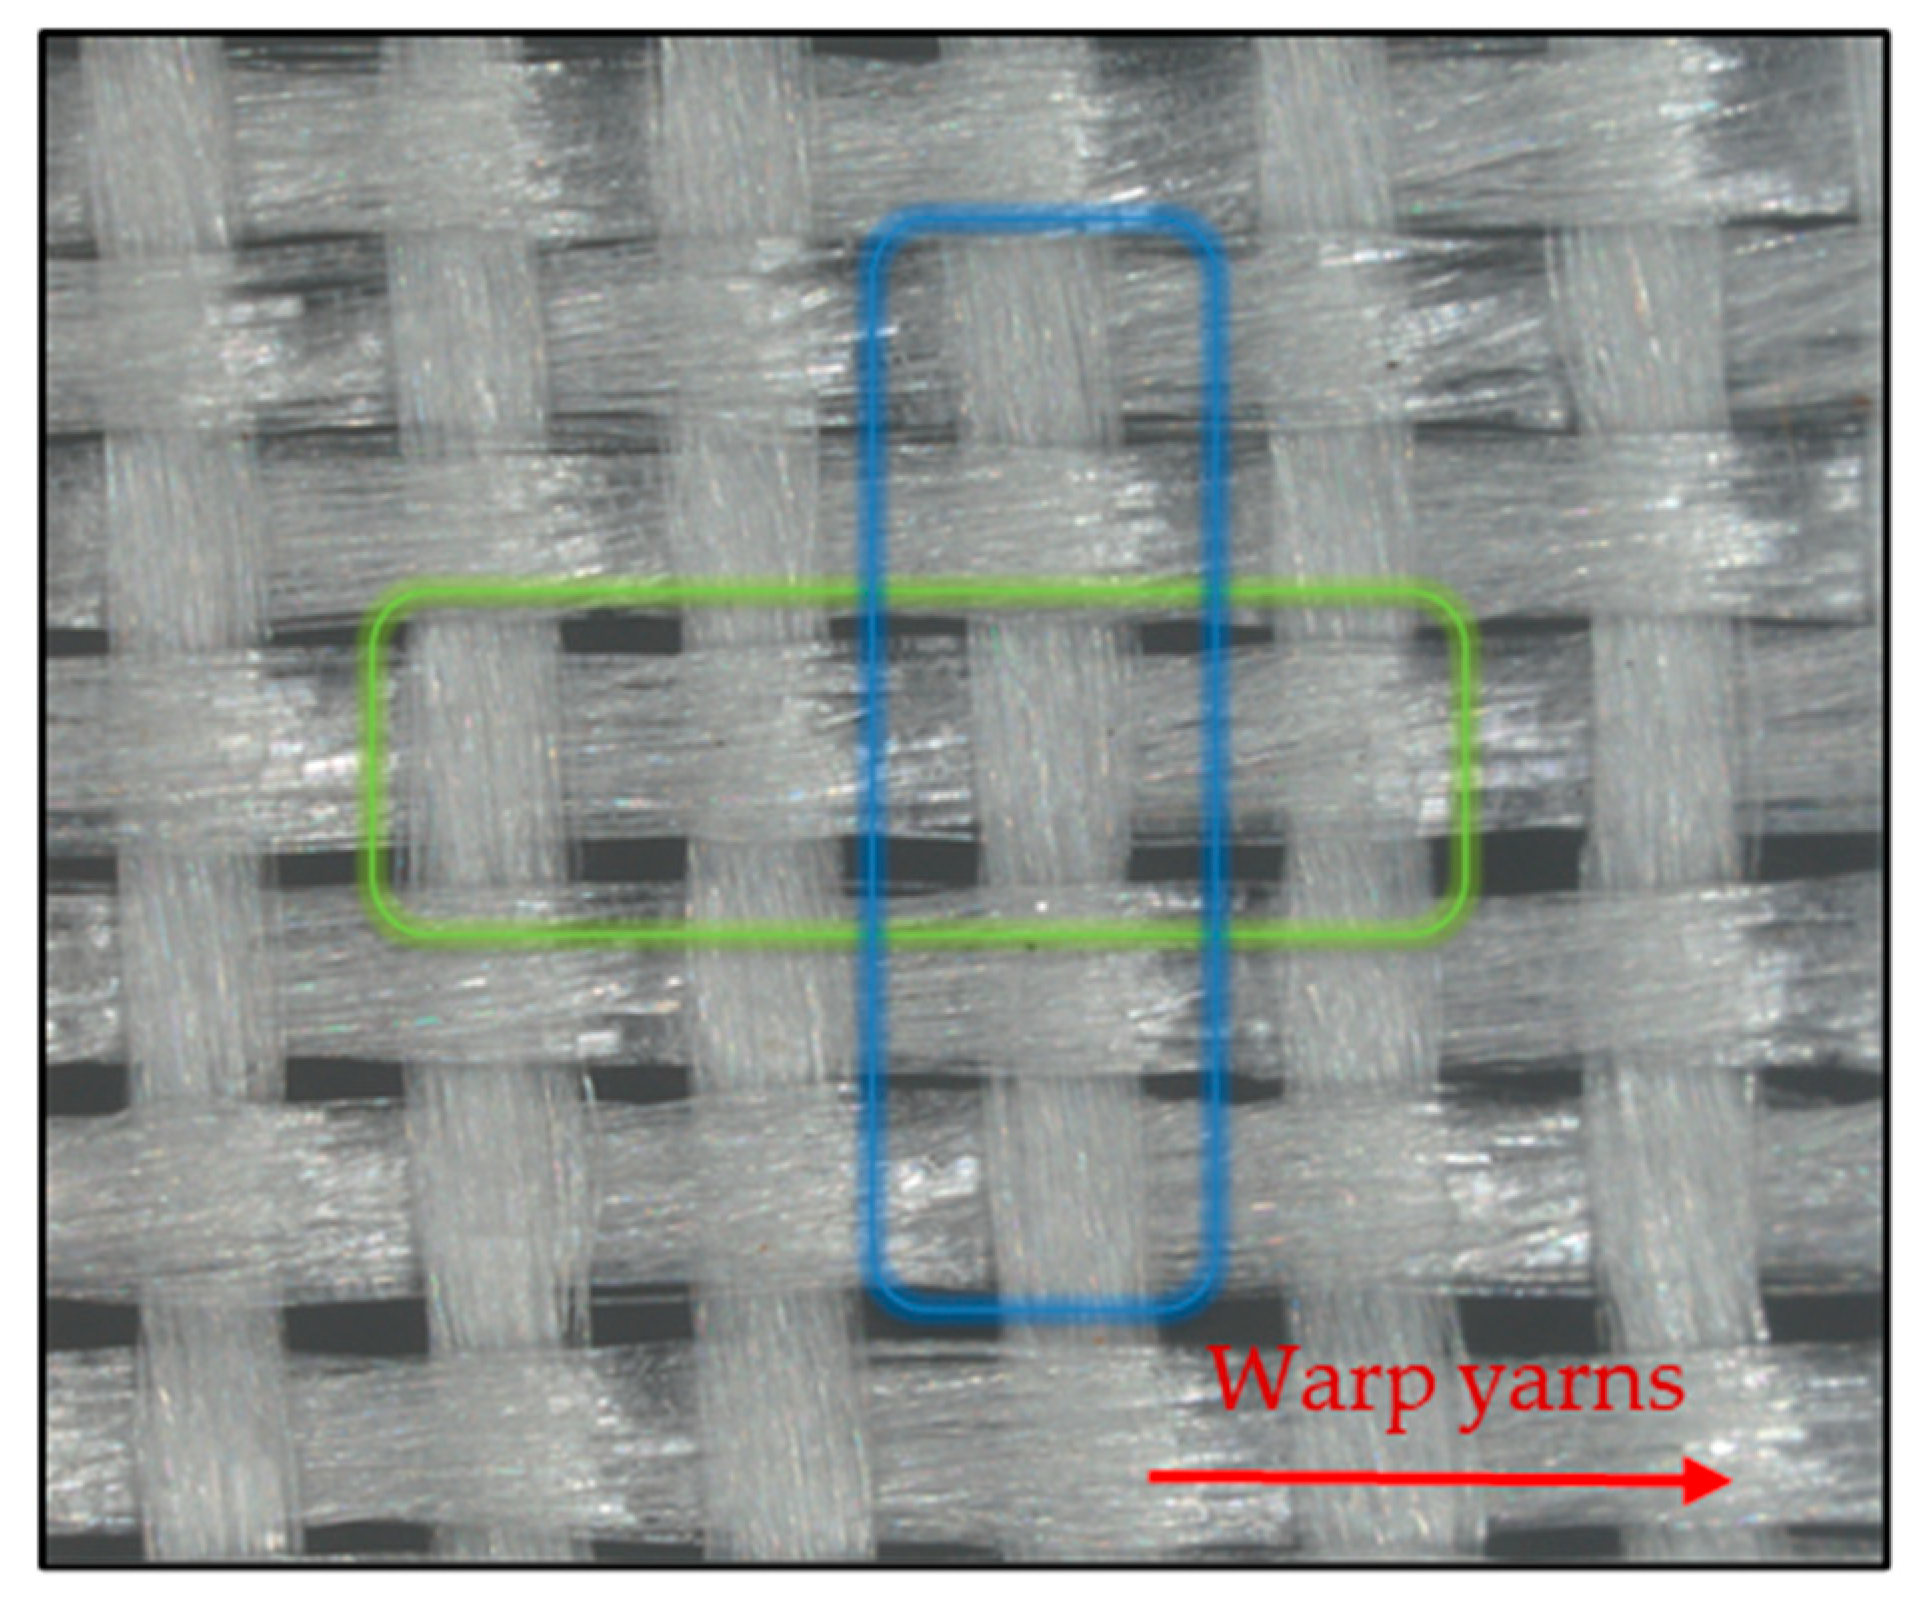
For the UHMWPE fabrics where the fabric densities were different in the warp and weft directions, there were statistically significant differences in the warp and weft directions. In the case of the pullout force, the warp values were higher than the weft values. This depends on the path the yarns travelled. Figure 16 shows the warp and weft density of UP66 and, for the same dimension (blue and green rectangle), it can be observed that there is a higher warp density. The path the warp yarns travelled had fewer weft yarns in the cross direction, as seen in the green rectangle. Fewer cross yarns in the path means that the adhesive is able to wet more of the yarn being pulled out and thereby leads to an increased pullout force. On the contrary, the weft yarns being pulled have more warp yarns in the cross direction as seen in the blue rectangle which would lead to less adhesive wetting the yarn and eventually a lower pullout force.
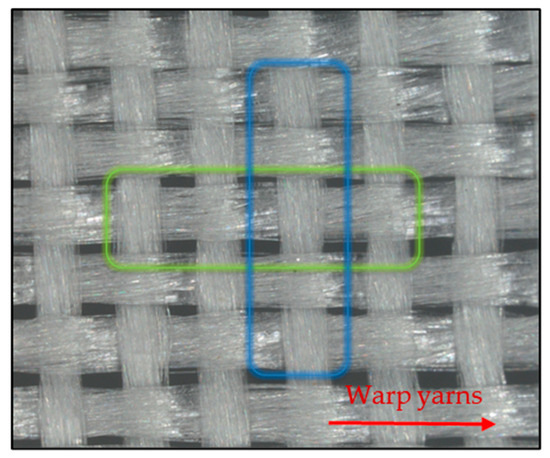
Figure 16.
Microscopic image of UP60 showing number of yarns in warp and weft directions.
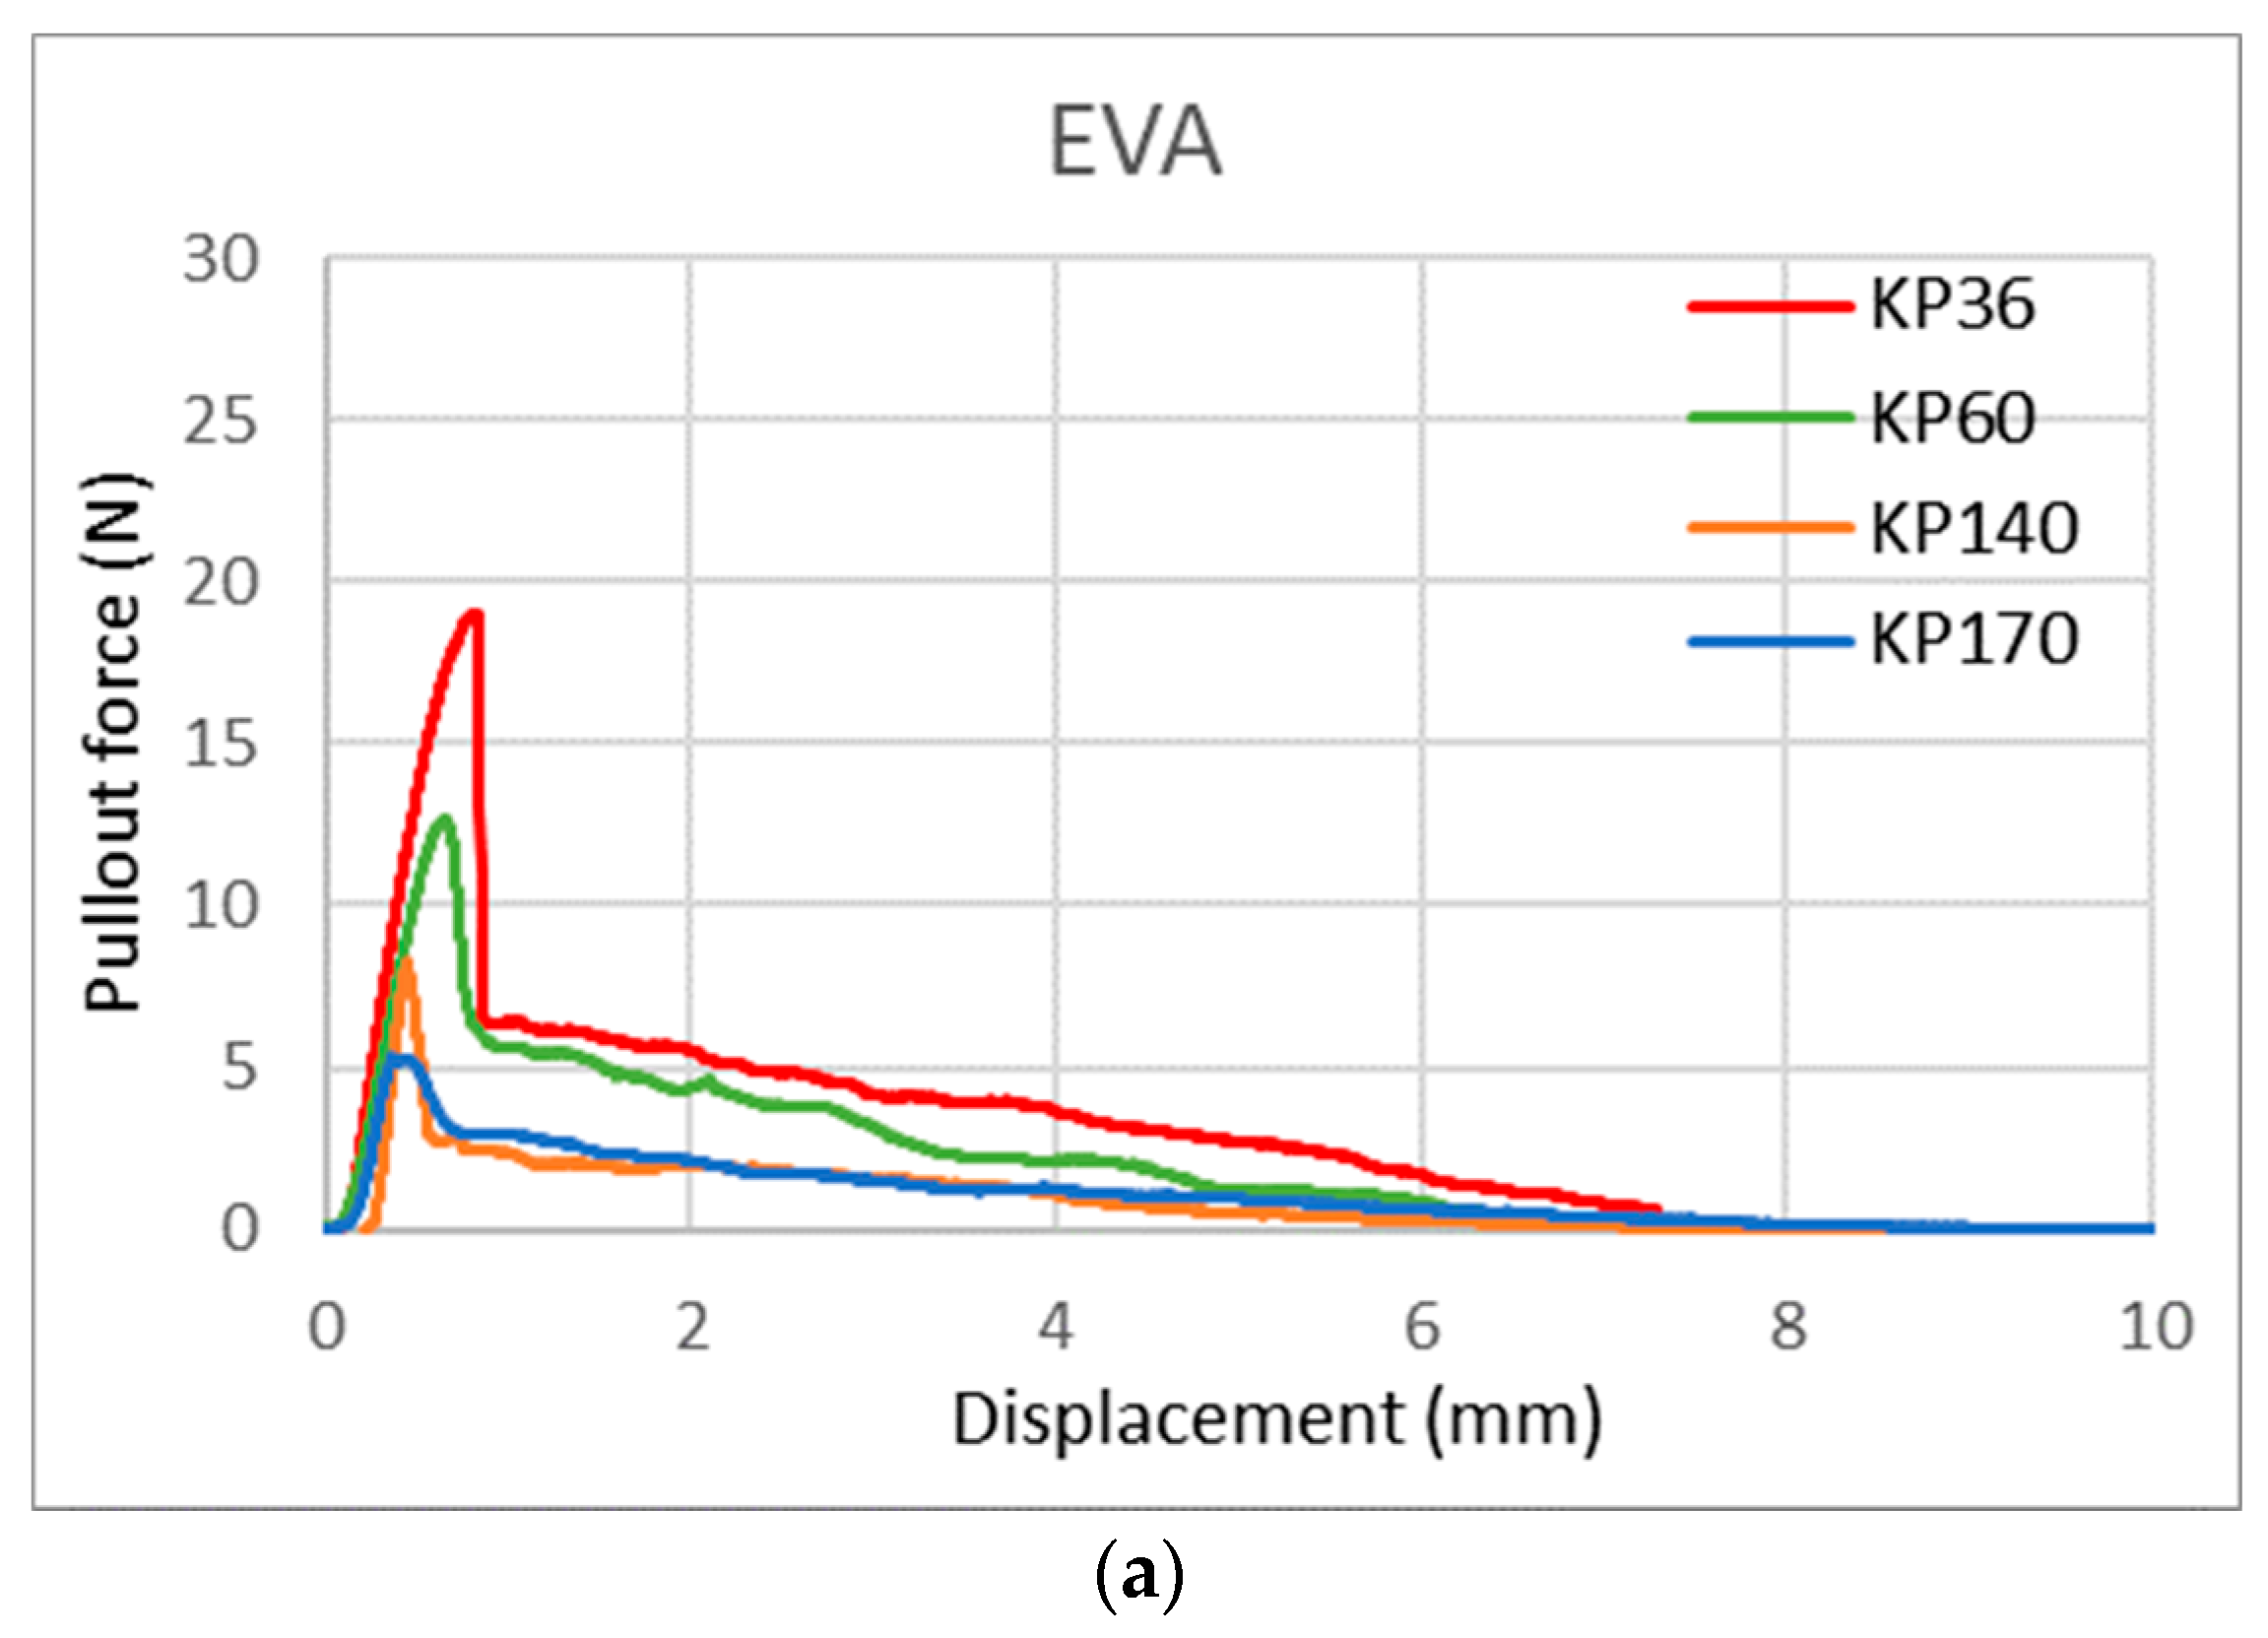
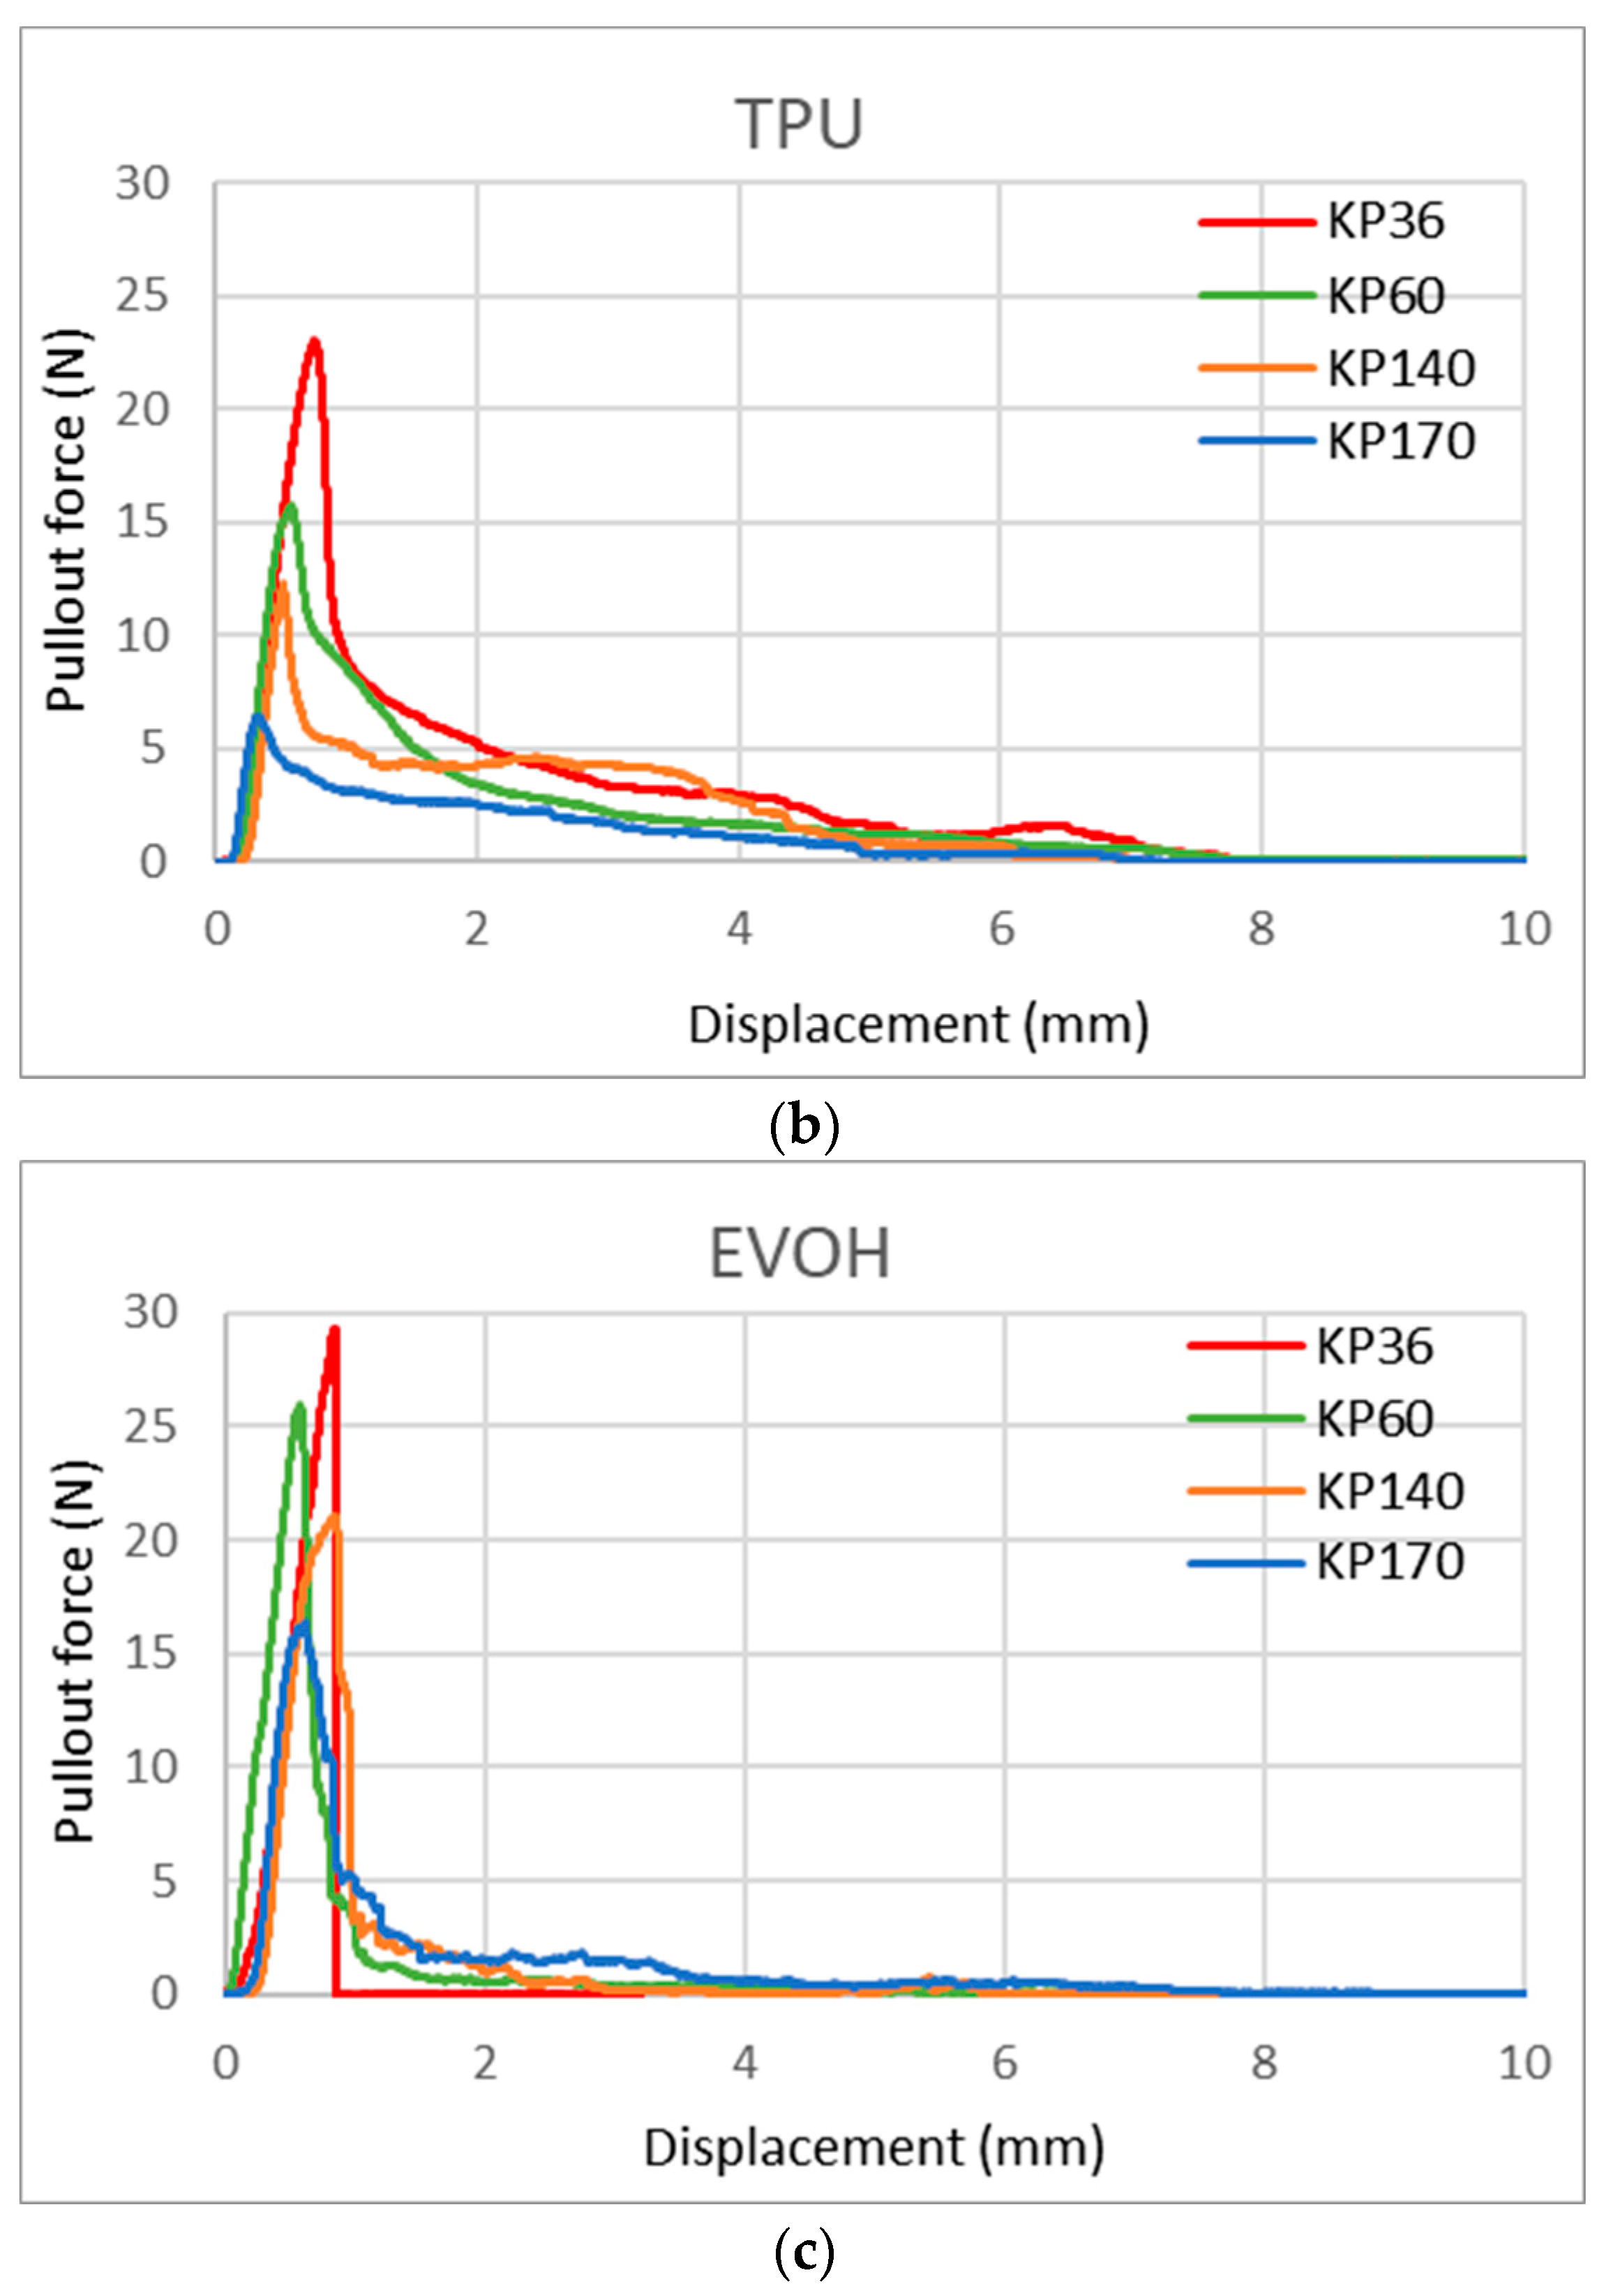
With this new test method, we can also observe the shape of the curve/area under the curve, which gives us more information about the FRLs’ adhesion properties. Figure 17 shows the curve shape of the three adhesives for KP36, KP60, KP140, and KP170 FRLs in the weft direction. It can be seen that the shapes of the curves varied across each adhesive but remained the same across the different areal densities of the fabrics, with the maximum force lowered in the heavier fabrics. This indicates that the shape of the curve is determined by the adhesive type. For EVOH known for its stiffness and brittleness, it can be seen that the break in the curve is more abrupt contrary to the more elastic TPU and EVA adhesives where the curves are rounder in shape and take a longer time for the pullout force to reach zero.
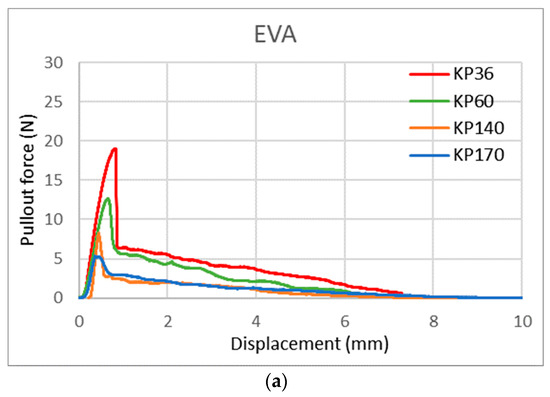

Figure 17.
Yarn pullout in laminates KP36, KP60, KP140, and KP170, graphs for: (a) EVA, (b) TPU, and (c) EVOH.
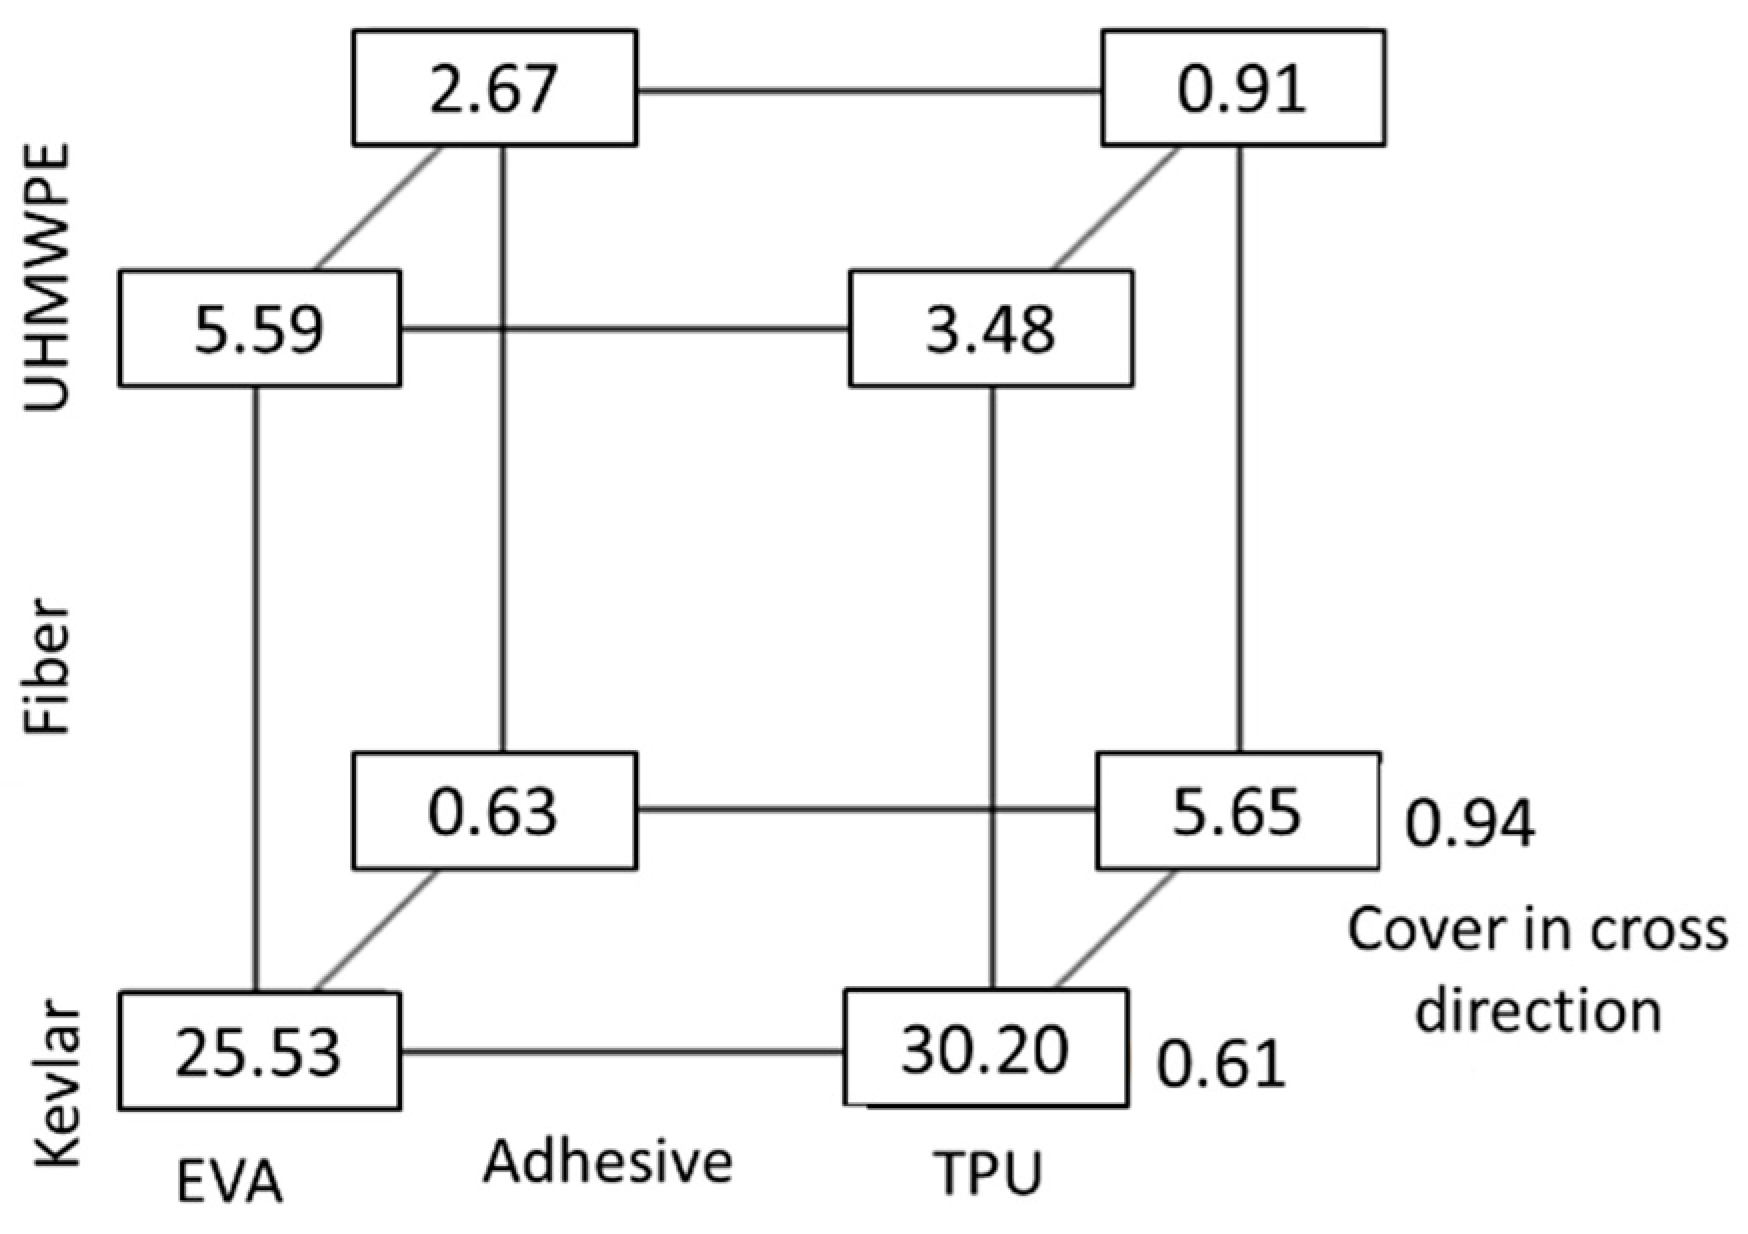
Although it is useful to see how the individual variables affected the yarn pullout force, it is even more valuable to assess the impact of changing input variable values on the response variable value. JMP Pro 17 software (v17.2, JMP Statistical Discovery LLC, Cary, NC, USA) was used and is able to produce prediction profile graphs to efficiently predict the value of the response variable for any combination of the explanatory variables. Three independent variables were chosen for the prediction profiler: they were fiber type, adhesive type, and cover in the cross direction. The prediction can be used as an optimizer for FRL manufacturers to find the optimal explanatory variables to improve adhesion. Although the prediction is more accurate for the fibers and adhesives used in this study, inferences can still be made for other FRLs from this prediction profile.
The first fit, which included up to three-level interactions, showed that there were significant two-order interactions between the variables but no three order interactions, so it was rerun with only the single-order and two-order interactions, which were all significant with an R-Square value of 0.88 for yarn pullout force. From the box plot in Figure 18, it is clearly seen that TPU and Kevlar have the best results, followed by Kevlar and EVA. However, there was a steep decrease in yarn pullout force when the cover in the cross direction increased. The decrease in yarn pullout force is most likely as a result of the fact that there are more cross yarns in the yarn path as the cover increases that caused a reduction in the adhesive wetting of fibers.

Figure 18.
Box plot of pullout force (N).
4. Conclusions
The primary goal of this paper was to examine how various woven fabric parameters—such as fiber type, fabric count (warp thread density × weft thread density), fabric areal density, and fabric cover—affect the bonding of laminates, particularly Fabric Reinforced Laminates (FRLs). This study identified significant variations in adhesion quality influenced by factors including fiber type, adhesive type, and woven fabric specifications. A comprehensive analysis was conducted using standard T-peel tests (ASTM D1876) and a newly developed yarn pullout test in laminates made with different woven fabric reinforcements.
Regarding the two fiber types investigated, Kevlar showed better compatibility with TPU, while UHMWPE demonstrated superior compatibility with EVA adhesives. Lower fabric cover resulted in better adhesion with the same amount of adhesive, implying that tighter fabrics require more adhesive to perform as well as less tight fabrics as the adhesive needs to sufficiently wet the yarns in fabrics with lower cover factors. Also, as fabric weight increased, peel strength decreased. Thicker fabrics with higher areal density also need thicker adhesive layers to properly wet the fabric surface and penetrate the fibers. There was a statistically significant negative correlation between cover factor and peel strength; as cover increases, the adhesive area that needs to be wetted increases, leading to lower peel strength with the same amount of adhesive.
The yarn pullout test in laminates was also introduced, developed by our research group, as a novel method for measuring adhesion properties in woven fabric reinforced laminates. Yarn pullout in laminte testing is a valuable alternative to traditional peel tests, particularly for assessing adhesion qualities in flexible FRLs. The validation of yarn pullout test results through high correlation coefficients with peel test results highlights its potential for consistently and reliably assessing adhesion in FRLs. This method is especially useful for laminates where delamination primarily starts at the fiber-matrix interface, as it directly simulates this critical failure mode. The pullout test also provides additional insights into laminate qualities, as evidenced by the variation in curve shapes observed with different adhesives. The shape of the curve and the area under the curve provide more information about FRL adhesion properties. The curve shapes varied across each adhesive (EVOH, TPU, and EVA) but remained consistent across different fabric areal densities, with maximum force decreasing as areal density increased, indicating that curve shape is determined by adhesive type. For EVOH, known for its stiffness and brittleness, the break in the curve is more abrupt, whereas the more elastic TPU and EVA adhesives exhibit rounder curves with a longer pullout force duration.
Further studies incorporating different weave designs, fibers, and adhesives will be crucial in refining a predictive model for the yarn pullout test. This iterative refinement process is essential to ensure that predictive tools remain at the forefront of advancements in the field. The implications of this findings extend beyond this study, particularly for industries reliant on inflatable structures, such as aerospace and defense. Enhanced understanding of the interplay between materials, adhesion, and mechanical properties has the potential to drive significant improvements in the performance, durability, and safety of inflatable systems.
Author Contributions
Conceptualization, F.A., A.L., R.V. and A.-F.M.S.; Data curation, F.A.; Formal analysis, F.A.; Funding acquisition, A.-F.M.S.; Investigation, F.A.; Methodology, F.A. and A.-F.M.S.; Project administration, A.-F.M.S.; Resources, A.-F.M.S.; Supervision, A.L., R.V. and A.-F.M.S.; Validation, F.A.; Visualization, F.A.; Writing—original draft, F.A.; Writing—review & editing, F.A., A.L. and A.-F.M.S. All authors have read and agreed to the published version of the manuscript.
Funding
This research received no external funding.
Data Availability Statement
The raw data supporting the conclusions of this article will be made available by the authors on request.
Acknowledgments
We extend our heartfelt appreciation to our undergraduate student researchers, Arissa Acosta and Gracey Ripley, for their indispensable contributions to the preparation of samples and testing procedures in this study. Additionally, we are deeply grateful to Jan Genzer from the Department of Chemical Engineering at NCSU for his invaluable insights into understanding the chemical interactions among our components. His expertise greatly enhanced the depth of our analysis.
Conflicts of Interest
The authors declare no conflicts of interest.
References
- Litteken, D.A. Inflatable Technology: Using Flexible Materials to Make Large Structures. In Proceedings of the Electroactive Polymer Actuators and Devices (EAPAD) XXI, Denver, CO, USA, 4–7 March 2019. [Google Scholar] [CrossRef]
- Mandlekar, N.; Joshi, M.; Butola, B.S. A Review on Specialty Elastomers Based Potential Inflatable Structures and Applications. Adv. Ind. Eng. Polym. Res. 2022, 5, 33–45. [Google Scholar] [CrossRef]
- Abramowitch, A. The Advantages of Inflatable Structures. Giant Inflatables Industrial. Available online: https://www.industrysearch.com.au/the-advantages-of-inflatable-structures/f/19393 (accessed on 8 April 2022).
- Veldman, S.L.; Vermeeren, C.A.J.R. Inflatable Structures in Aerospace Engineering—An Overview. Compos. Mater. Struct. 2001, 468, 93. [Google Scholar]
- Li, A. Evaluation of Laminated Hull Material for High Altitude Airship. Ph.D. Thesis, North Carolina State University, Raleigh, NC, USA, 2018. [Google Scholar]
- Smith, M.; Rainwater, L. Applications of Scientific Ballooning Technology to High Altitude Airships. Aerosp. Res. Cent. 2012, 17–19. [Google Scholar] [CrossRef]
- Li, H.; Hu, Y.; Fu, X.; Zheng, X.; Liu, H.; Tao, J. Effect of Adhesive Quantity on Failure Behavior and Mechanical Properties of Fiber Metal Laminates Based on the Aluminum–Lithium Alloy. Compos. Struct. 2016, 152, 687–692. [Google Scholar] [CrossRef]
- Čuk, M.; Bizjak, M.; Kočevar, T.N. Influence of Simple and Double-Weave Structures on the Adhesive Properties of 3D Printed Fabrics. Polymers 2022, 14, 755. [Google Scholar] [CrossRef] [PubMed]
- Lin, M.-C.; Lou, C.-W.; Lin, J.-Y.; Lin, T.A.; Lin, J.-H. Mechanical Property Evaluations of Flexible Laminated Composites Reinforced by High-Performance Kevlar Filaments: Tensile Strength, Peel Load, and Static Puncture Resistance. Compos. Part B Eng. 2019, 166, 139–147. [Google Scholar] [CrossRef]
- Macchi, P.; Sironi, A. Chemical Bonding in Transition Metal Carbonyl Clusters: Complementary Analysis of Theoretical and Experimental Electron Densities. Coord. Chem. Rev. 2003, 238–239, 383–412. [Google Scholar] [CrossRef]
- Grabowski, S.J.; Leszczynski, J. Hydrogen Bonding—New Insights; Springer: Berlin/Heidelberg, Germany, 2006. [Google Scholar]
- Chowdhury, S.C.; Sockalingam, S.; Gillespie, J.W., Jr. Inter-molecular interactions in ultrahigh molecular weight polyethylene single crystals. Comput. Mater. Sci. 2020, 172, 109306. [Google Scholar] [CrossRef]
- Deshpande, V.S. Ultra-Strong Molecules, Ballistic Performance of Ultra-High Molecular Weight Polyethylene Composites. In High-Entropy Materials, Ultra-Strong Molecules, and Nanoelectronics; National Academies of Sciences, Engineering, and Medicine: Washington, DC, USA, 2019; pp. 3–4. [Google Scholar] [CrossRef]
- Abbott, S. Sticking Together: The Science of Adhesion; Royal Society of Chemistry: London, UK, 2020. [Google Scholar]
- Chhetri, S.; Bougherara, H. A comprehensive review on surface modification of UHMWPE fiber and interfacial properties. Compos. Part A Appl. Sci. Manuf. 2021, 140, 106146. [Google Scholar] [CrossRef]
- Galuszynski, S. Structure and Tightness of Woven Fabrics. Indian J. Text. Res. 1987, 12, 71–77. [Google Scholar] [CrossRef]
- Peirce, F.T. Geometry of Cloth Structure. Text. Res. J. 1937, 28, 45–96. [Google Scholar] [CrossRef]
- El Messiry, M.; Mito, A.-B.; Al-Oufy, A.; El-Tahan, E. Effect of Fabric Material and Tightness on the Mechanical Properties of Fabric–Cement Composites. Alex. Eng. J. 2014, 53, 785–801. [Google Scholar] [CrossRef]
- ASTM Standard D1876; Standard Test Method for Peel Resistance of Adhesives (T-Peel Test). ASTM International: West Conshohocken, PA, USA, 2016.
- Hussain, M.; Imad, A.; Saouab, A.; Kanit, T.; Nawab, Y.; Herbelot, C.; Kashif, M. Properties and Characterization of Novel 3D Jute Reinforced Natural Fibre Aluminium Laminates. J. Compos. Mater. 2020, 55, 1879–1891. [Google Scholar] [CrossRef]
- Broughton, W.R.; Mera, R.D.; Hinopoulos, G. Creep Testing of Adhesive Joints T-Peel Test; National Physical Laboratory: Teddington, UK, 1999. [Google Scholar]
- Dhaliwal, G.S.; Newaz, G.M. Effect of Resin Rich Veil Cloth Layers on the Uniaxial Tensile Behavior of Carbon Fiber Reinforced Fiber Metal Laminates. J. Compos. Sci. 2018, 2, 61. [Google Scholar] [CrossRef]
- Adekunle, F. Evaluation and Enhancement of Adhesion in Fiber-Reinforced Laminated Structures. Ph.D. Thesis, North Carolina State University, Raleigh, NC, USA, 2024. [Google Scholar]
- Nilakantan, G.; Gillespie, J.W., Jr. Yarn Pull-out Behavior of Plain Woven Kevlar Fabrics: Effect of Yarn Sizing, Pullout Rate, and Fabric Pre-Tension. Compos. Struct. 2013, 101, 215–224. [Google Scholar] [CrossRef]


Disclaimer/Publisher’s Note: The statements, opinions and data contained in all publications are solely those of the individual author(s) and contributor(s) and not of MDPI and/or the editor(s). MDPI and/or the editor(s) disclaim responsibility for any injury to people or property resulting from any ideas, methods, instructions or products referred to in the content. |
© 2024 by the authors. Licensee MDPI, Basel, Switzerland. This article is an open access article distributed under the terms and conditions of the Creative Commons Attribution (CC BY) license (https://creativecommons.org/licenses/by/4.0/).