Abstract
A simple approach was used to create Fe3O4-methylcellulose (MC) nanocomposites, which were then analyzed using XRD, FTIR, and FE-SEM to determine their structure. The effective factors for enhancing the ratio of magnetite NPs in the samples were investigated using RTFM and optical absorbance. Fe3O4 was synthesized utilizing the reverse co-precipitation technique and magnetic characteristics. Fe3O4/MC nanocomposites with magnetite/MC weight ratios of 0, 0.07, 0.15, and 0.25 have been developed. The diffraction pattern of magnetite is well indexed in accordance with the spinal reference pattern of Fe3O4 (space group: R¯3m), as confirmed by the Rietveld analysis of XRD data of magnetite NPs with an average crystallite size of 50 nm. Magnetite’s insertion into the MC network causes a red shift in the band gap energy (Eg) as the weight percentage of magnetite nanoparticles in the samples rises. The MC, MC-7, MC-15, and MC-25 samples have Eg values of 5.51, 5.05, 2.84, and 2.20 eV, respectively.
1. Introduction
Numerous studies have focused on magnetite (Fe3O4) nanoparticles (NPs) in comparison to other transition metal oxides because of their strong magnetic properties, which are a result of their inverse spinel structure [1,2,3]. Magnetite is frequently used for its paramagnetic characteristics, small particle size, and low toxicity. Magnetite is commonly known as black iron oxide or ferrous metal oxide [4]. Magnetite is utilized in various fields, such as nanomagnetite fluids [5], drug administration [6], magnetic hyperthermia therapy [7], and magnetic resonance imaging (MRI) as a contrast agent [8], and extensively employed in catalysis.
Controlling the surface morphology of nanoparticles, as well as their chemical stability in the environment, depends on the synthetic route used during the preparation and/or processing of Fe3O4 NPs. Depending on the goals for use in specific applications, several methods for preparing Fe3O4 NPs may be employed, such as the sol-gel method [9], co-precipitation [10], and other used methods as described in [11]. One of the simplest methods used to prepare magnetite is the reverse co-precipitation method. In the typical reverse co-precipitation process, the alkaline solution is mixed with the iron salt solution with no organic solvent, as only a basic reaction environment is needed [3,4,5,6,7,8,9,10,11]. Then, an increase in the pH value would result in an increase in crystallites and/or particle size compared to that of the conventional method [4,12].
On the other hand, magnetic nanocomposites are widely used as adsorbents for the removal of various types of pollutants and wastewater treatments with high effectiveness and well-defined properties due to their high photoactivity and nanoscale structure [13,14]. The properties of Fe3O4 NPs include a large surface area due to their smaller particle size, and they are environmentally friendly as they prevent the formation of any toxic contamination during their processing [15]. Many efforts are being made to develop new, highly efficient, durable, and biodegradable magnetic materials that meet the needs of different types of applications. Such types of materials have attracted attention due to their unique properties of soft magnetic nanostructures, compared to their bulk counterparts. These nanocomposites are useful in high-frequency applications, drug delivery, and magnetic storage media, among many other fields [3,4]. The magnetic properties inside the polymer matrix interact with each other to influence the magnetism of the nanocomposites. Interparticle interactions occur through exchange forces between the particles that are in direct contact or through long-range magnetic dipole–dipole interactions. Therefore, significant coupling results in ferromagnetism. The range of magnetic order will be longer when the combination of interacting forces is strong. However, the paramagnetic state is achieved when the moments of nearby particles interact weakly. In this case, each magnetic moment of each nanoparticle changes independently and the magnetic order collapses [16].
Biodegradable polymers are synthetic or natural polymers. Methylcellulose (MC) is one of the most important cellulose ether derivatives and has been used in many industrial applications. MC as an ether derivative of cellulose is considered the simplest cellulose derivative, in which methyl groups (-CH3) replace the hydroxyl positions [17]. The combination of MC and magnetic nanoparticles creates a form of biomagnetic agent that can be effective in the photodegradation of organic contaminants found in wastewater, expanding its use in some industrial applications [17,18].
Furthermore, Kim et al. [19] discovered that MC’s low molecular weight might be used in medicine delivery. Kim et al. discovered that MC gelled at body temperature, gradually releasing a drug in vivo, and then disintegrated into a lower molecular weight chemical that was less harmful to human beings. Magnetic hydrogels are highly valued in the biomedical field for their applications in tissue engineering, soft actuators, magnetic resonance imaging, hyperthermia treatments, and drug release systems [20]. Compared to other stimulation-sensitive drug release systems, they are more appealing due to their considerable advantages, including their short response times, remotely controlled mobility, noninvasive heat production, and easy physical signal recognition [21]. Hence, it is crucial to create innovative magnetic hydrogels that possess biodegradability, strong magnetic properties, and superior mechanical qualities. In order to further understand their physical properties and assess their potential in biomedical applications, magnetic biodegradable nanocomposites must be synthesized and analyzed. This work aims to synthesize magnetite/MC nanocomposites containing up to 25% weight proportion of magnetite nanoparticles. To the best of our knowledge, no previously published examples of magnetite/MC nanocomposites exist that might add to the body of knowledge already available on MC nanocomposites. The reverse co-precipitation method was used to create the magnetite nanoparticles. The effect of magnetite loading on the optical and magnetic characteristics of the nanocomposites was investigated.
2. Materials
2.1. Synthetization of Magnetite Nanoparticles
The synthesis of magnetite nanoparticles (NPs) has been conducted by the reverse co-precipitation approach, as documented in a previous study [1]. To achieve the desired objective, a solution of NaOH in distilled water with a volume of 350 mL was made, having a pH value of 13. In a separate procedure, a solution of ferrous sulfate (FeSO4·7H2O) with a concentration of 0.3 M was generated by combining an iron salt precursor with deionized water. The resulting mixture was subjected to magnetic dispersion for a duration of 15 min, followed by an additional 10 min of ultrasonic mixing to guarantee complete dissolution of the ferrous salt. Subsequently, the solution containing the iron salt precursor was gradually introduced into the aqueous solution of NaOH, followed by a one-hour mixing period. The resulting mixture was promptly rinsed with distilled water until the pH reached a value of 9. Magnetite powder of high quality was acquired after undergoing a drying process at 50 °C for 24 h. Magnetite NPs were examined for their strong magnetization through simple attraction with an external magnet, as shown in Figure 1.
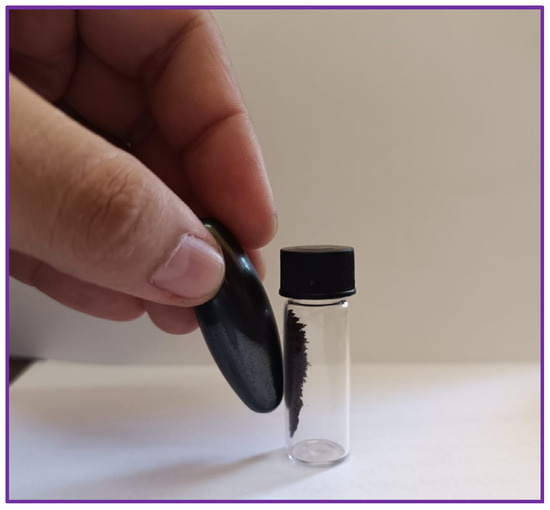
Figure 1.
The photograph depicts magnetite nanoparticle powders being drawn to an external magnet.
2.2. Fabrication of MC/Magnetite Nanocomposites
The MC powder provided by Aldon Chemical Inc, Woodbridge, ON, Canada (viscosity 4000 cps for 2% solution in water) was used for the fabrication of MC/magnetite nanocomposites. The desired mass of magnetite NPs is distributed into a 15 mL solution of distilled water at a temperature of 75 °C, using sonication for a duration of 10 min. The weight percentage ratios of magnetite nanoparticles to MC were 0, 0.07, 0.15, and 0.25. The dispersed nanoparticles were mixed with 0.6 g of MC powder for each sample, and the sonication procedure was run for 15 min at a temperature between 75 and 80 °C to dissolve the MC. The obtained MC/magnetite blend was carefully transferred into a Petri dish and afterward maintained at room temperature for a duration of 72 h. The nanocomposite (NC) sheets that were acquired exhibited homogeneity, with an average thickness of around 0.25 ± 0.015 mm. The samples were designated with labels corresponding to the magnetite/MC weight ratios of 0, 0.07, 0.15, and 0.25, denoted as MC, MC-7, MC-15, and MC-25, respectively.
2.3. Characterizations
X-ray diffraction (XRD) measurements were employed to characterize the structural properties of the (Fe3O4) magnetite NPs. An XR-Phillips X’pert diffractometer X-ray (MPD 3040) machine (Philips X’Pert-MPD, Malvern, UK) was used for XRD measurements, using a CuKα (λ = 1.5406 Å) in a 2θ range of 10–80° with 0.03° steps. Fourier transform infrared (FTIR) measurements were performed on both NPs for profound structural and compositional studies. The transmission FTIR spectrums were collected with a (Jasco Inc., Tokyo, Japan) FT/IR–4100 spectrometer in the wavenumber range of 400 to 4000 cm−1. The surface morphological characteristics of the investigated NPs and the fabricated nanocomposites were studied using the Thermo-Fisher Quanta S field-emission scanning electron microscope (FE–SEM, Thermo-Fisher Scientific Inc., Waltham, MA, USA). The morphology of magnetite nanoparticles was investigated using a JEM-2100 high-resolution transmission electron microscope (HRTEM, JEOL Ltd., Tokyo, Japan). The UV-Vis measurements were performed using the Cary 5000 UV–Vis–NIR spectrophotometer (Agilent Technologies Inc., Santa Clara, CA, USA). A vibrating sample magnetometer (VSM) system, the Lake Shore 7400 VSM system (Lake Shore Cryotronics, Inc., Westerville, OH, USA) was used to evaluate the magnetic properties of the materials under investigation at room temperature (RT). The magnetization measurements under an external magnetic field were recorded ranging from −20 kOe to 20 kOe.
3. Results and Discussion
3.1. Structure and Morphologic Characterization of Magnetite Nanoparticles (Fe3O4 NPs)
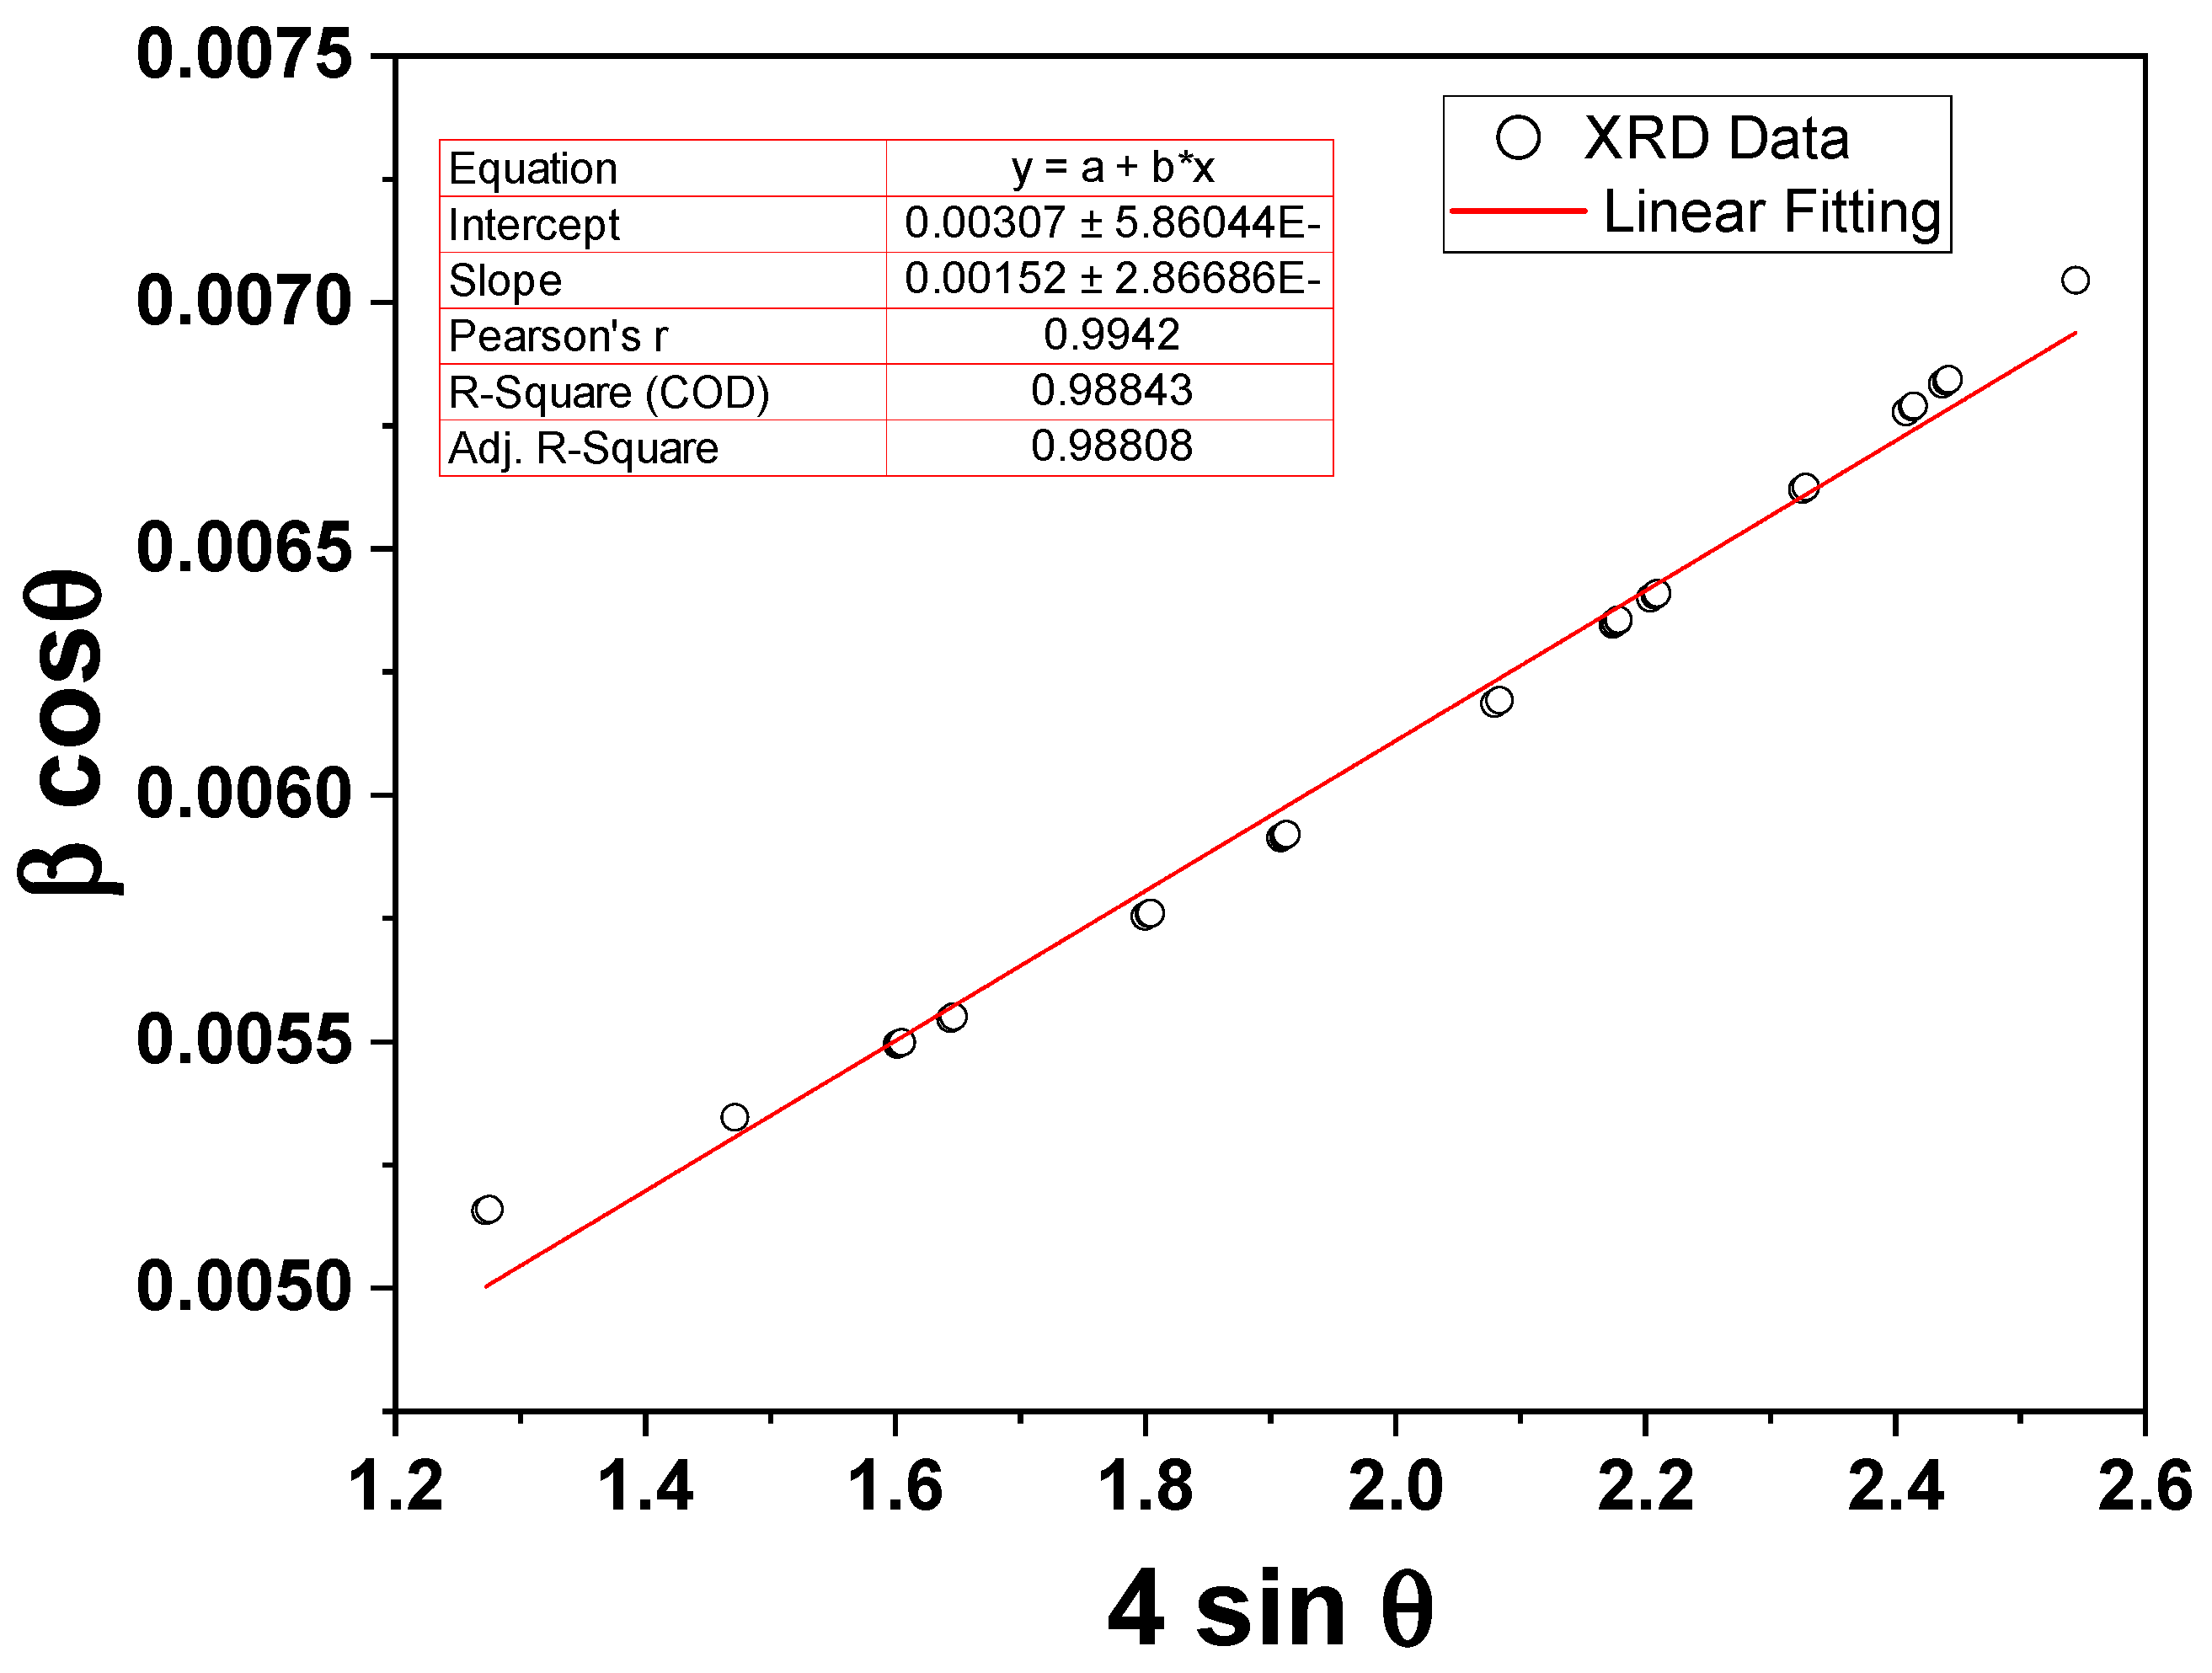
Figure 2 shows the XRD pattern of the prepared reverse co-precipitated Fe3O4 NPs. The phase identification and data refinements of the XRD pattern were computed using Rietveld analysis with FullProf Suite (5.10) software, and the resulting parameters are shown in Figure 2. The diffraction peaks of magnetite NPs are well indexed according to the spinal reference pattern of Fe3O4 (space group: R¯3m). The absence of any extra peaks outside of the desired phase indicates a distinct crystalline character of the synthesized NPs. It should be noted that the recognized phase is the same as the standard data. Furthermore, the lattice parameters a, b, and c are 5.9162, 5.9162, and 14.5333 Å, respectively, and with cell direct cell volume = 440.543 Å3. The Williamson–Hall (W–H) function was used from the FullProf refinement data to compute the crystallite size and lattice strain of the NPs. Figure 3 shows the W-H plot of βcosθ vs. 4sinθ of the magnetite NPs under investigation, where β is the FWHM obtained from FullProf refinements and θ is the diffraction angle. The obtained average crystallite size and lattice microstrain are identified as ~46 nm and ~0.0015 for Fe3O4 NPs, respectively.
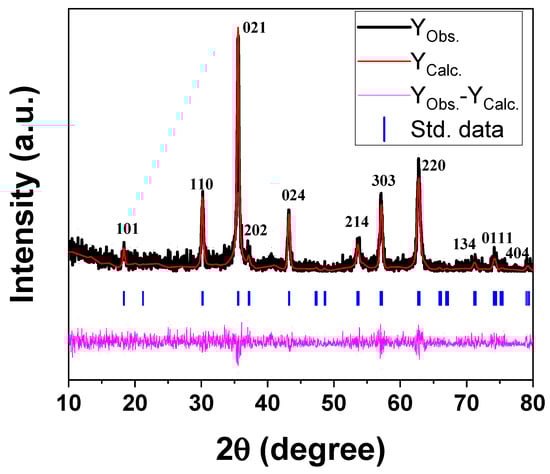
Figure 2.
XRD pattern of the magnetite NPs under investigation.
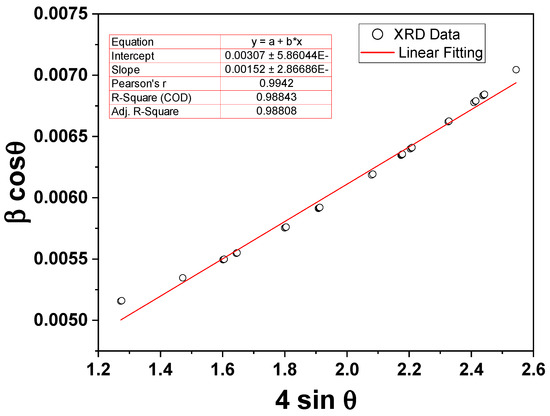
Figure 3.
The W-H plot of βcosθ vs. 4sinθ of the magnetite NPs under investigation.
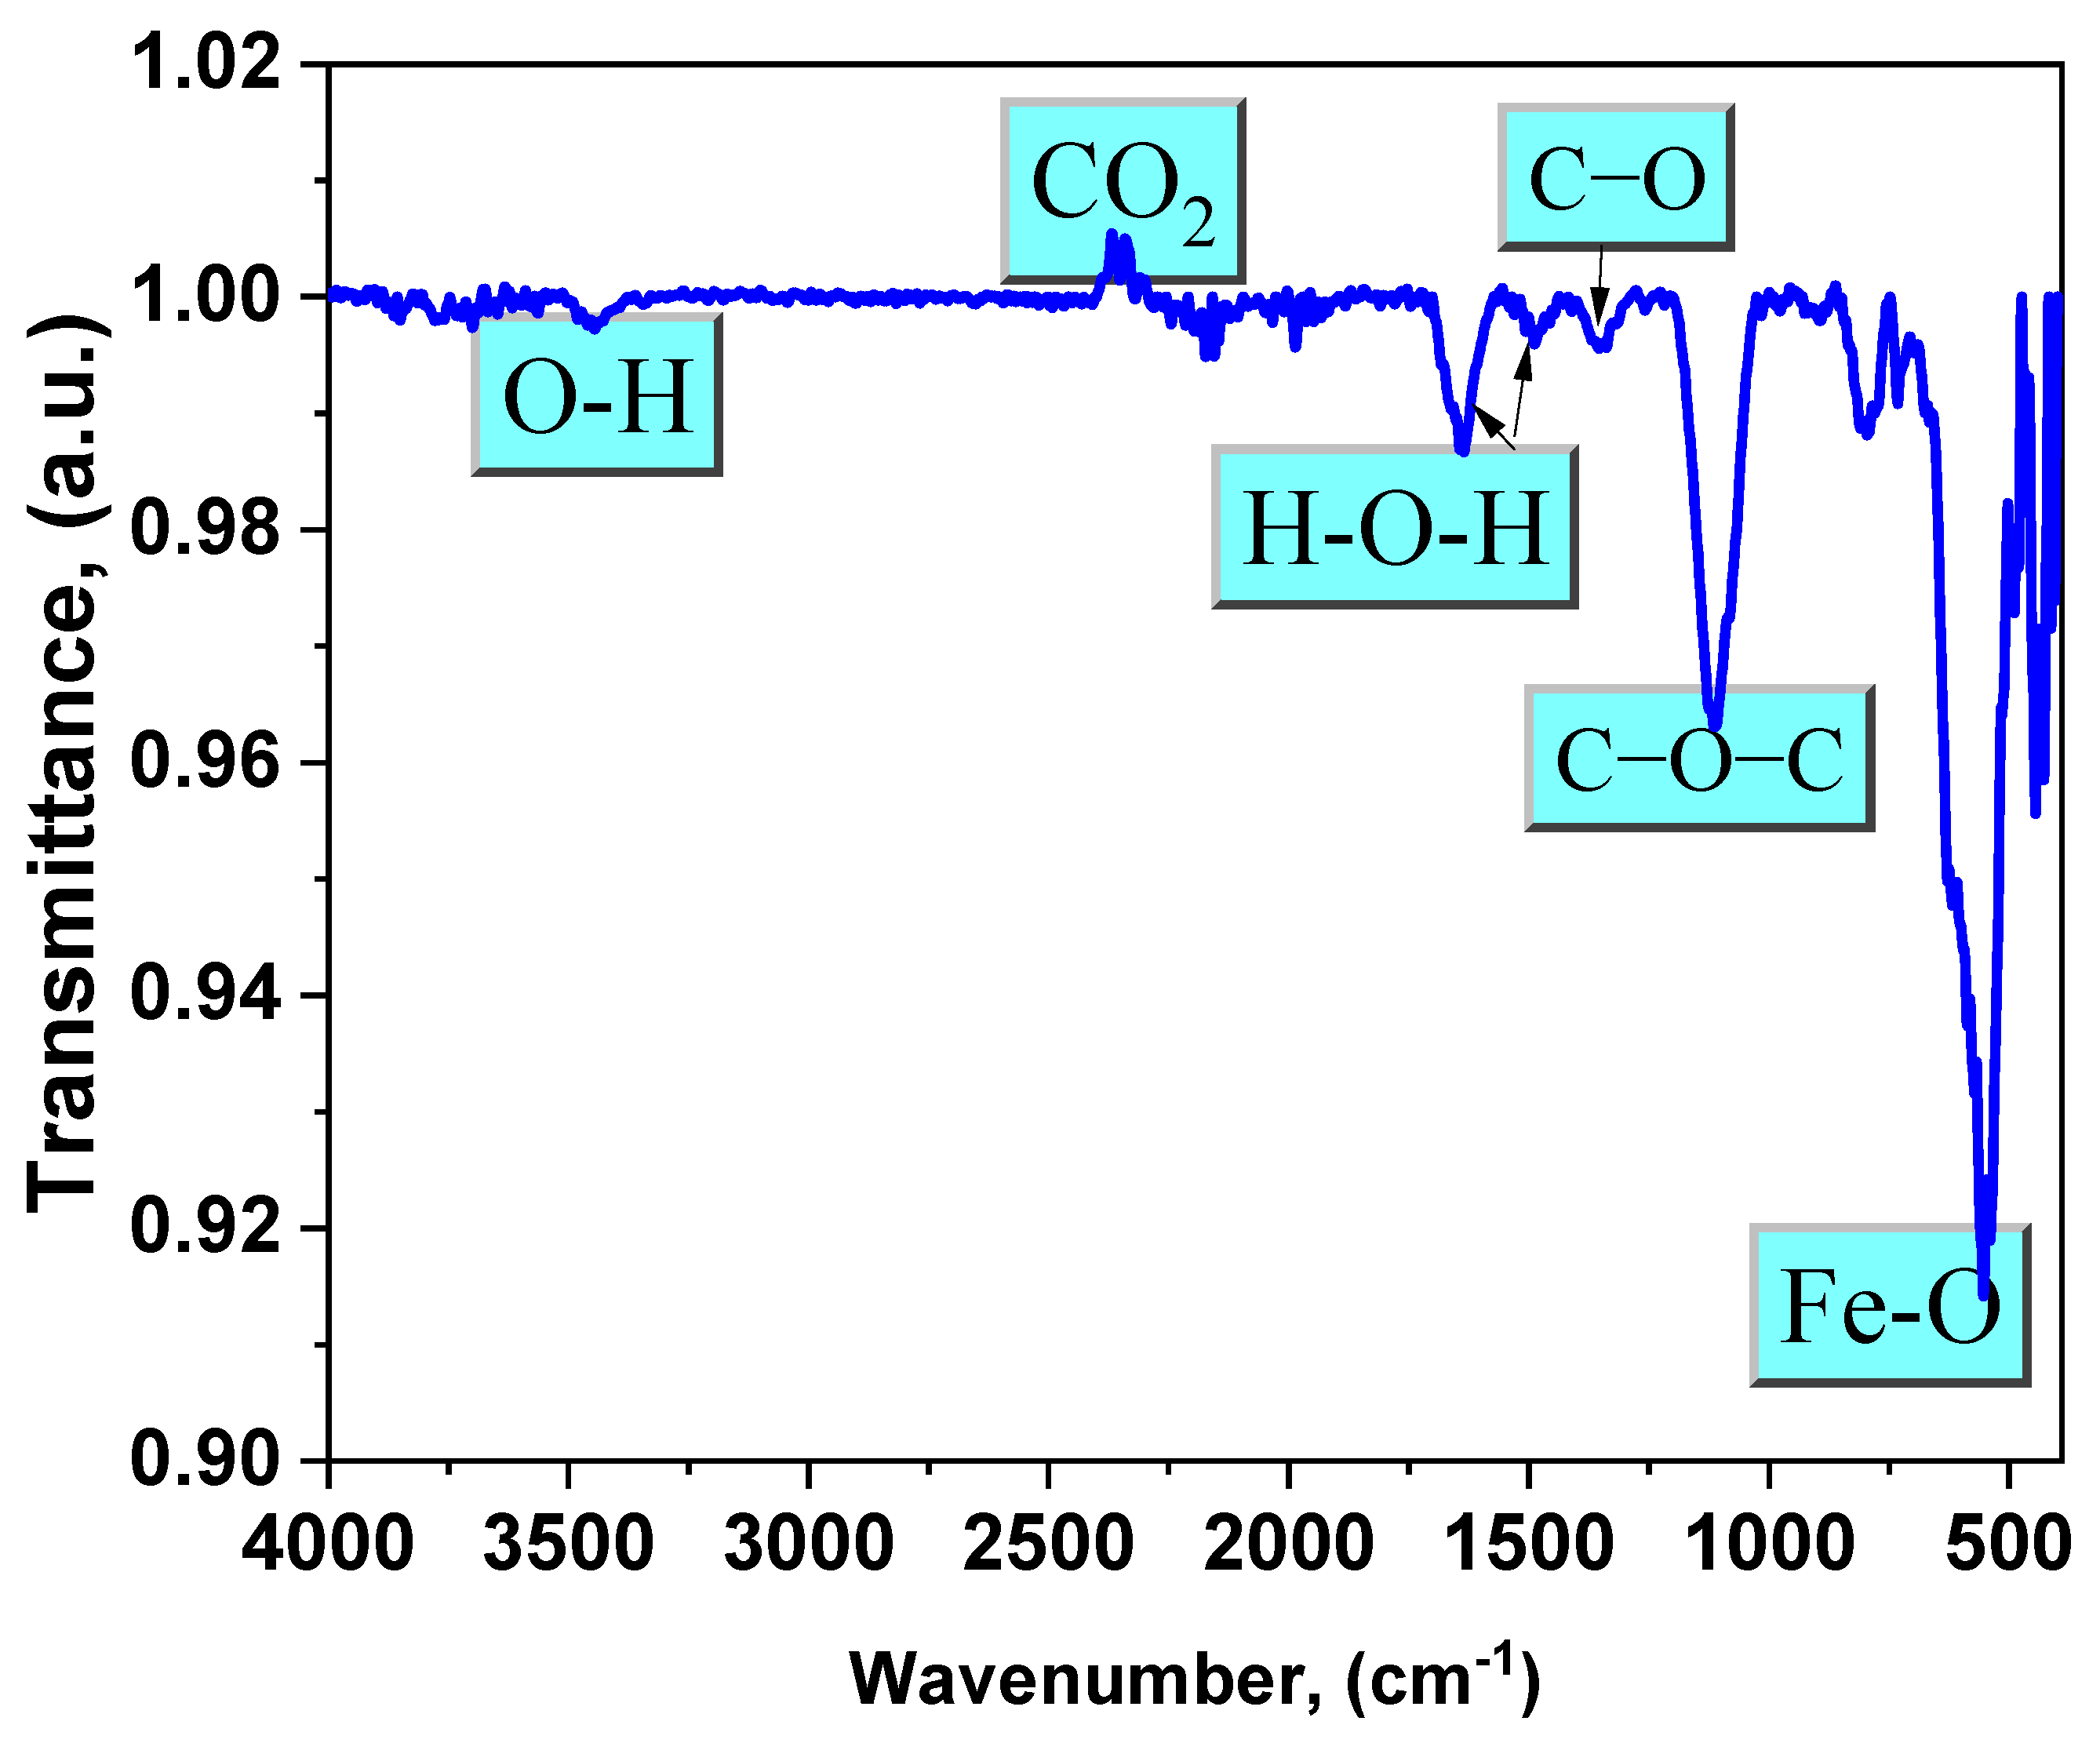
FTIR spectra revealed the structure and functional groups of synthetic Fe3O4 NPs. The Fe−O band is characterized by a prominent absorption peak at around 553 cm−1. Figure 4 shows significant bands of magnetite in the lower frequency range (500–1000 cm−1), which are caused by the iron oxide structure [3,22]. The absorption peak at 3440 cm−1 is clearly associated with the OH groups. The absorption peak at 1350 cm−1 is caused by the stretching vibration of the C–O bond. Additionally, the signal at 1110 cm−1 reveals the stretching vibration of the C−O−C group [12]. The bands at 1640 cm−1 and 1490 cm−1 are attributed to H−O−H bending. The presence of these bands verifies the formation of water adsorbed on the surface of Fe3O4 NPs, as magnetite NPs were generated in an aqueous media. The band at 2367 cm−1 is distinctly prominent because of the CO2 that is desorbed from the environment [10,23].

Figure 4.
FTIR spectrum of the magnetite NPs under investigation.
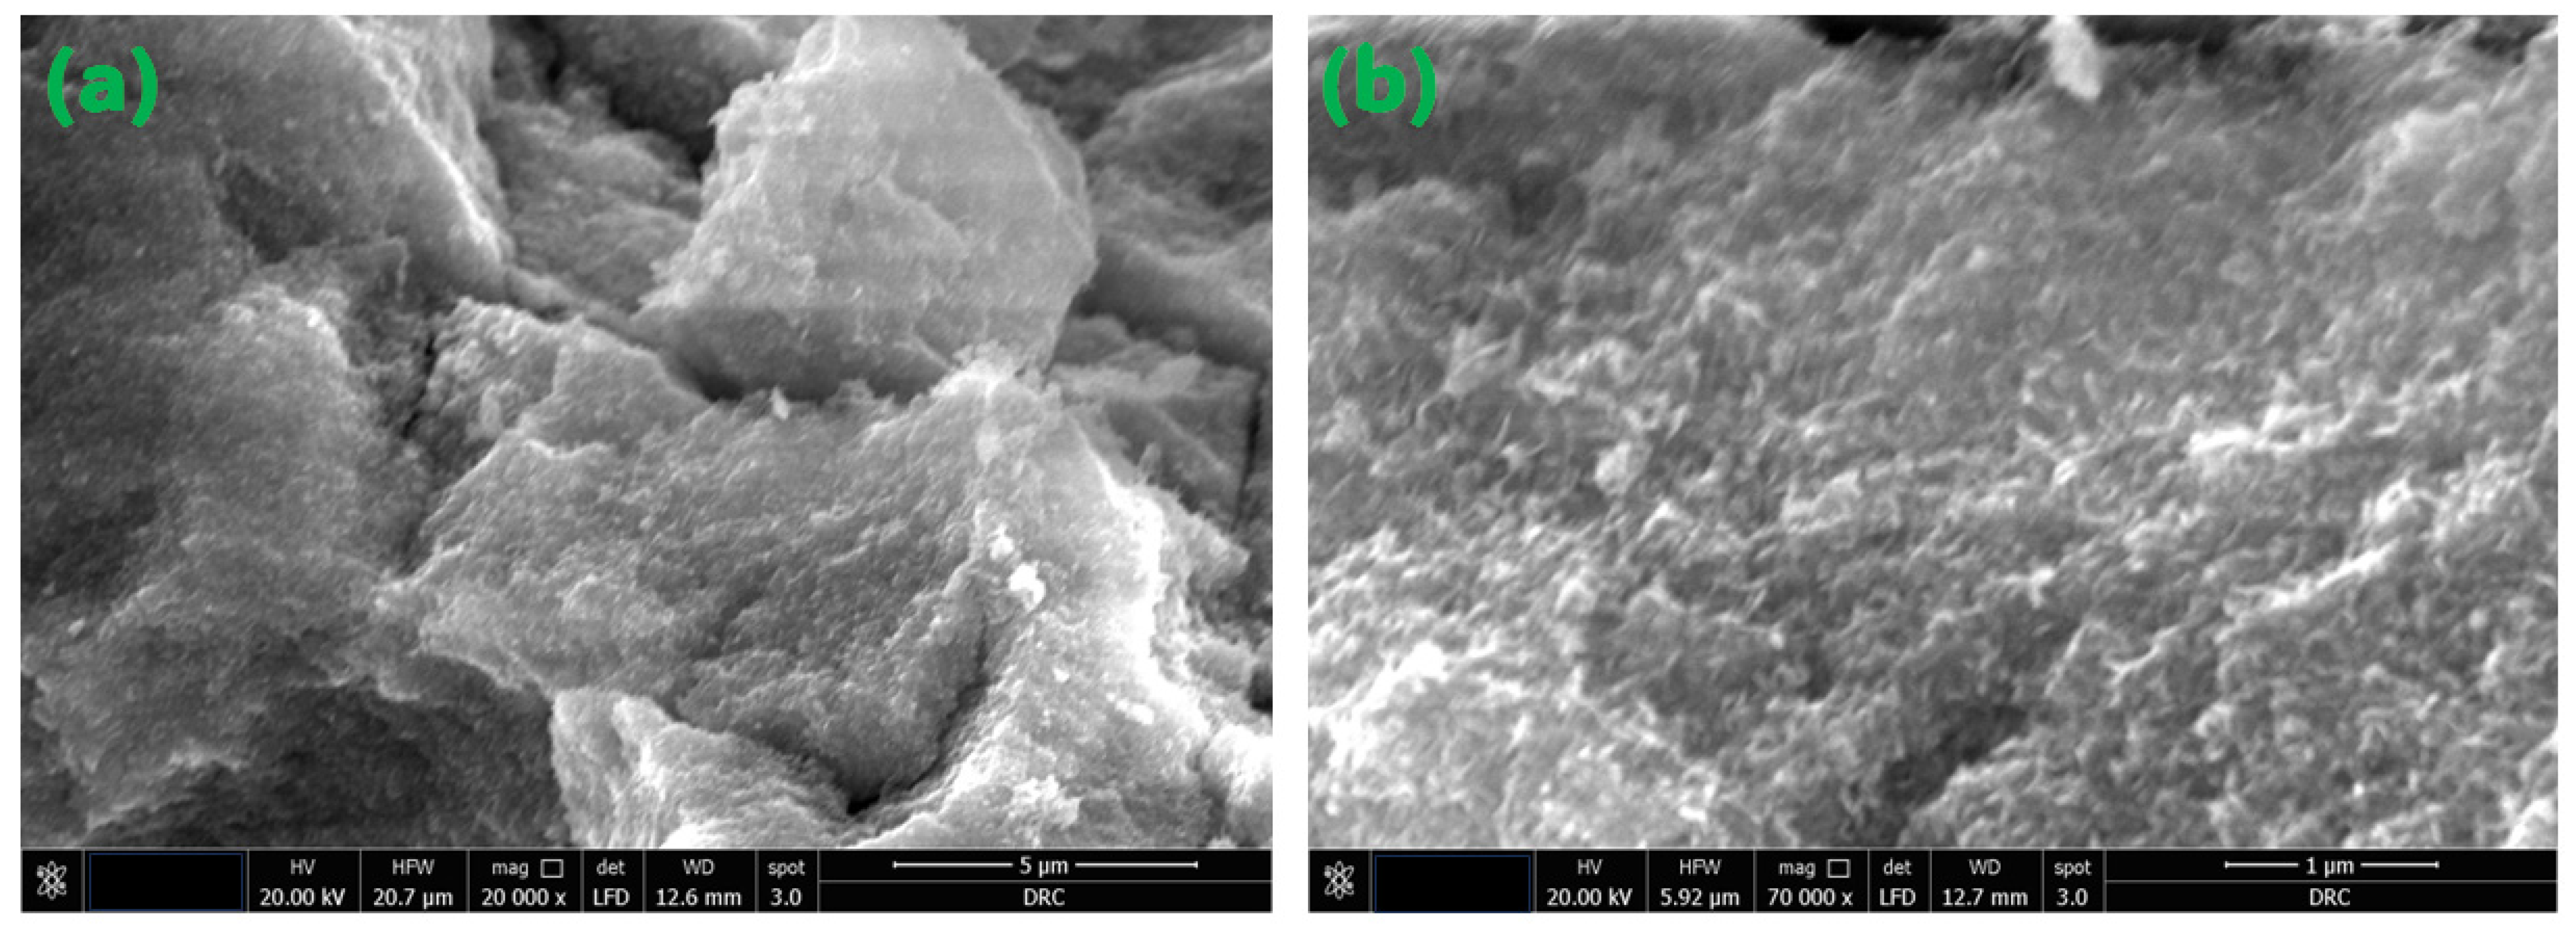
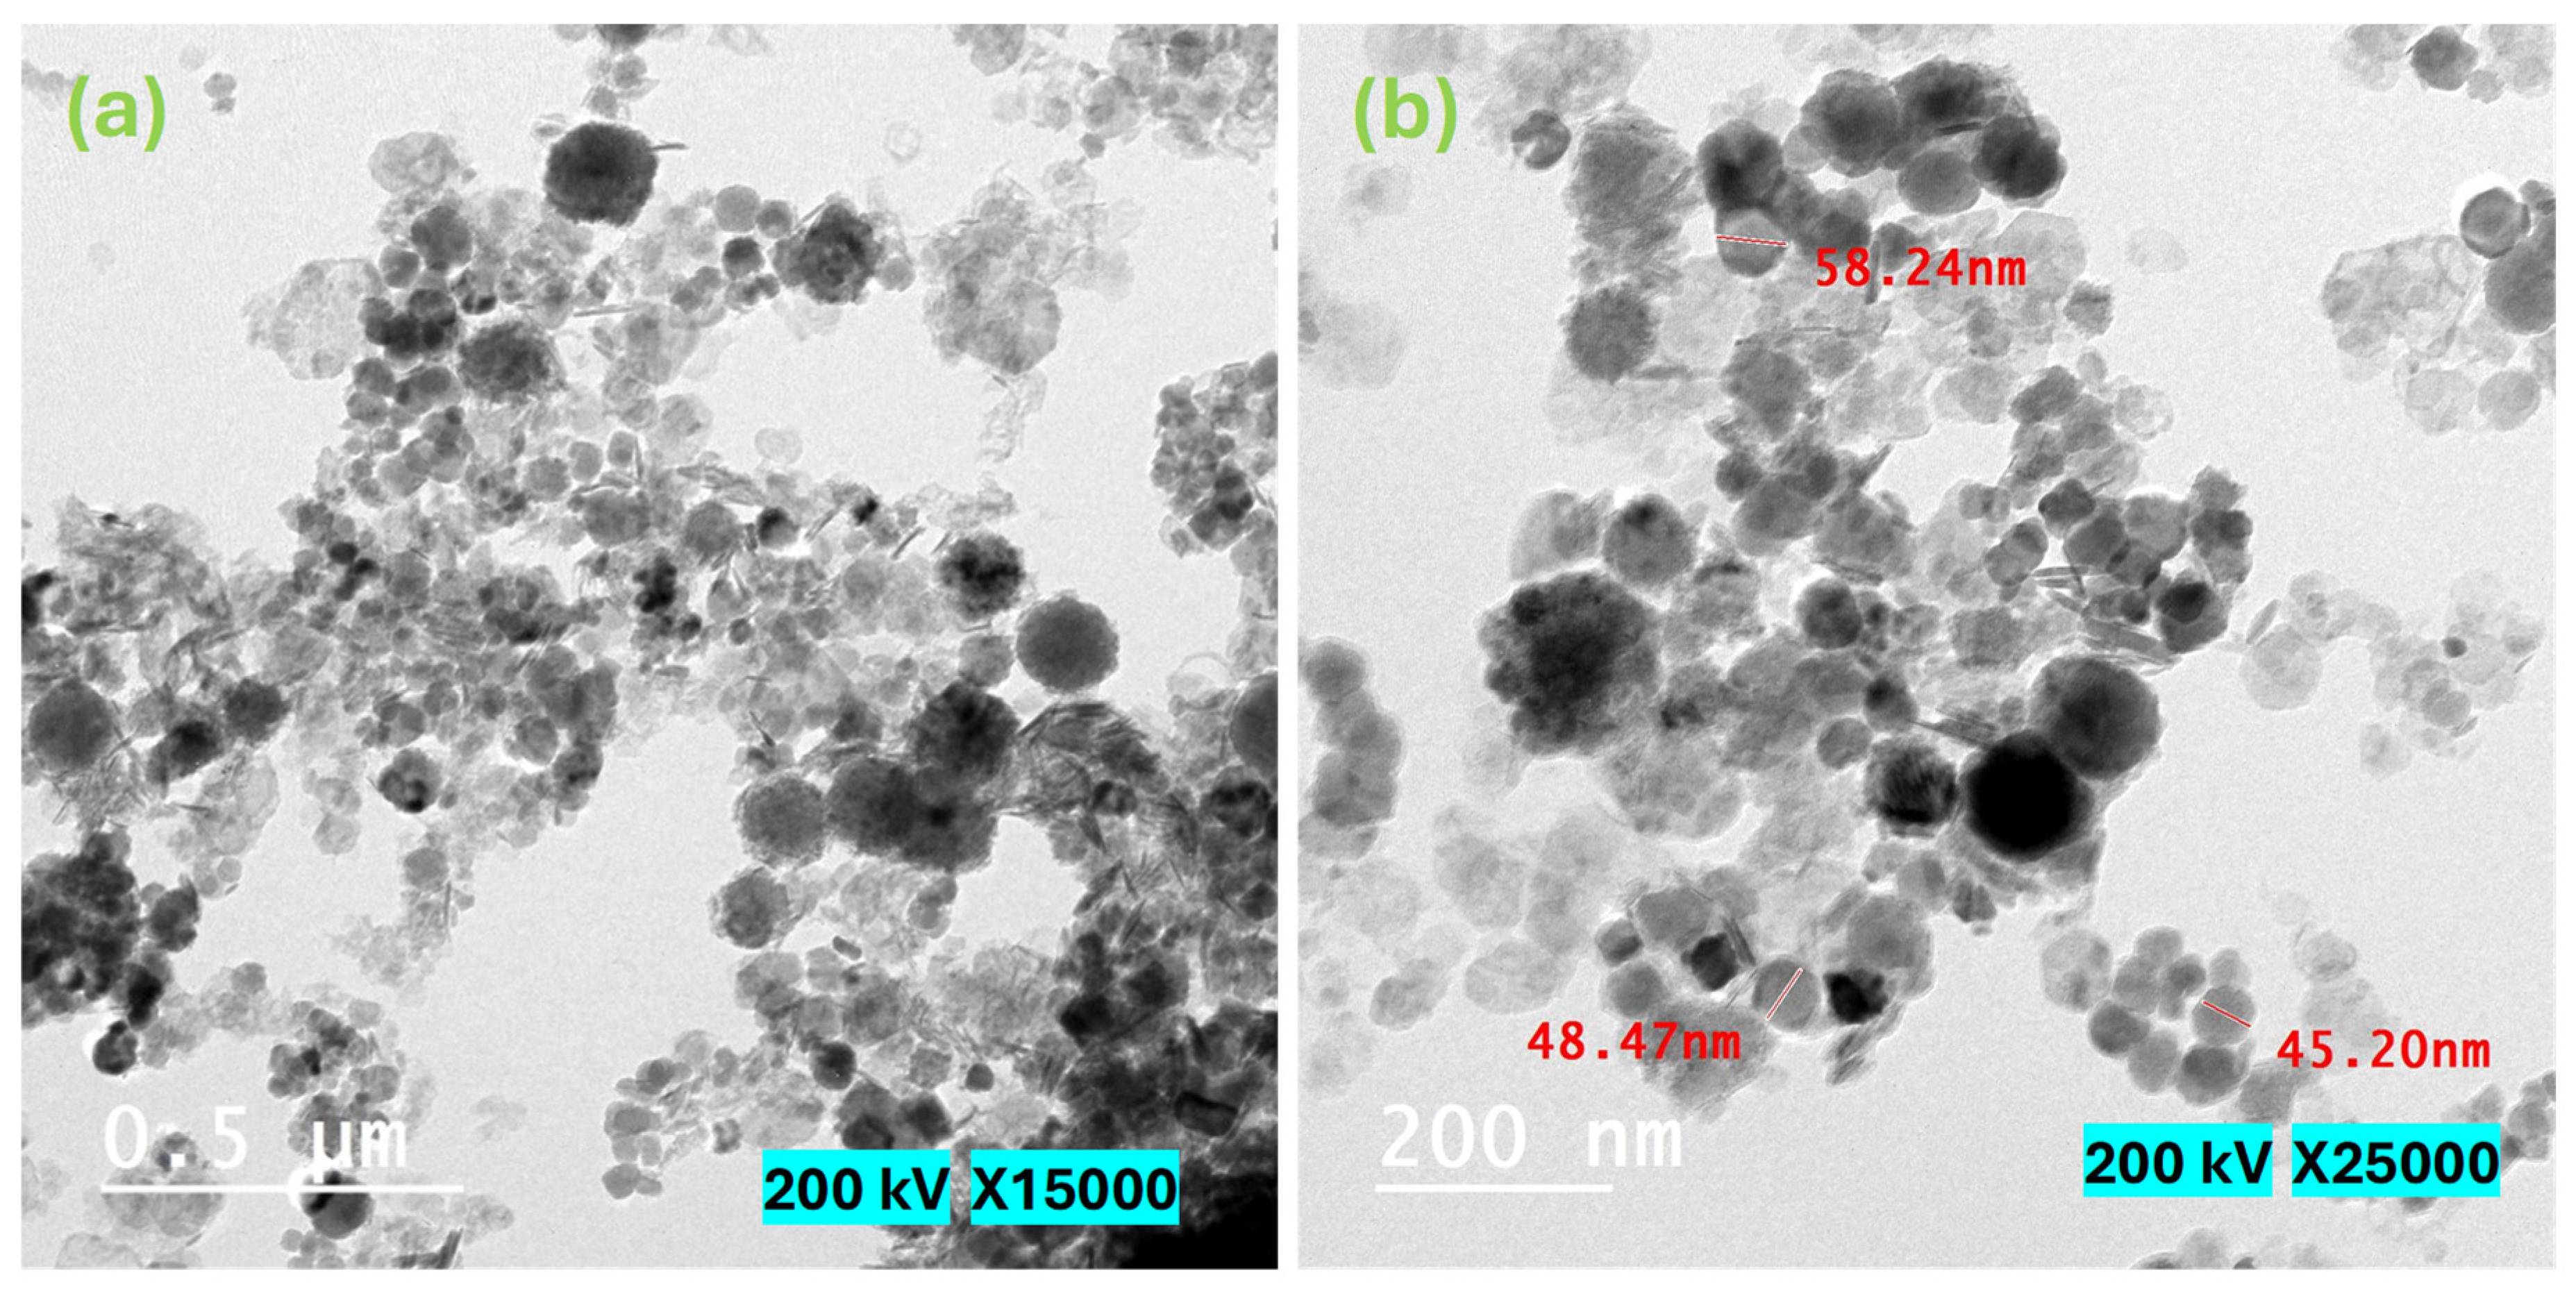
Figure 5 displays the SEM micrographs of the magnetite NPs that were examined in this study. The acquired SEM pictures illustrate that the particles exhibited a rough surface texture and displayed varying degrees of aggregation. Undoubtedly, the diminutive particles at the nanoscale exhibit a propensity to aggregate as a result of their elevated surface energy, which arises from the amplified surface-to-volume ratio. Furthermore, the potential influence of magnetic moment on this agglomeration phenomenon cannot be disregarded, given the inherent magnetic properties of the NPs, as elaborated upon in the subsequent section dedicated to the investigation of magnetization [24]. Figure 6 depicts HRTEM micrographs of the as-synthesized Fe3O4 NPs. Figure 6 shows that the produced particles have a spherical form. Furthermore, the majority of the detected particles range in diameter from 30 to 60 nm, with some particles aggregating due to their high magnetic properties. The acquired result validates the nanostructure of the examined Fe3O4 NPs.
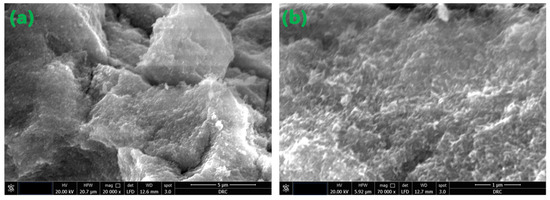
Figure 5.
FE-SEM micrographs of the magnetite NPs under investigation. (a) 20,000×. magnification and 5 μm scale; (b) 70,000× magnification and 1 μm scale.

Figure 6.
HRTEM micrographs of the investigated magnetite nanoparticles. (a) 15,000×. magnification and 0.5 μm scale; (b) 25,000× magnification and 200 nm scale.
FE-SEM was utilized to investigate the surface morphology of the produced nanocomposites. FE-SEM micrographs of the MC and MC-7 nanocomposite films are shown in Figure 7. Figure 7a depicts a thorough investigation of the morphology of the FE-SEM image for a pristine MC sample, revealing a homogeneous film surface with minimal roughness. However, the introduction of Fe3O4 NPs into the MC matrix, as seen in Figure 7b for MC-7, results in well-distributed NPs, allowing for a reasonable density of interfacial zones between the nanoparticles and the MC matrix. The acquired FE-SEM micrograph of MC-7 verifies the successful fabrication procedure for achieving an acceptable dispersion of NPs across the host MC matrix. Also, Figure 7b shows the production of micron-sized agglomerations from Fe3O4 nanoparticles which influence the optical and magnetic properties of the samples.
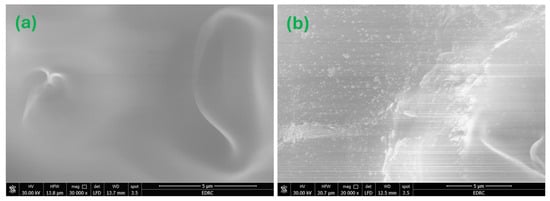
Figure 7.
FE-SEM micrographs for the investigated MC/Fe3O4 nanocomposites: (a) for MC film and (b) for MC-7. The magnification is 20,000× with a scale of 5 μm for both micrographs.
3.2. Optical Characterization
The UV-VIS absorbance of the samples was measured at room temperature. Figure 8 depicts the UV-VIS absorbance spectra for magnetite/MC nanocomposites. As the wavelength drops, all of the samples exhibit an increase in absorption. As shown in Figure 8, all the samples demonstrated significant absorptions, as identified by strong absorbance peaks. These absorbance peaks occurred at so-called cut-off wavelengths of 225, 245, 436, and 563 nm for the MC, MC-7, MC-15, and MC-25 samples, respectively. The absorption edge shows a red shift as the weight percentage of magnetite nanoparticles increases in the samples. Such a red shift is an indication of narrowing the band gap due to the incorporation of magnetite into the MC network. Accordingly, the optical band gap (Eg) was determined to be 5.51, 5.05, 2.84, and 2.20 eV for the MC, MC-7, MC-15, and MC-25 samples, respectively, as tabulated in Table 1. This demonstrates that the band gap energy lessens with the addition of nanoparticles. The absorption coefficient (α) vs. photon energy curves of the under investigation MC/magnetite nanocomposites are depicted in Figure 9.
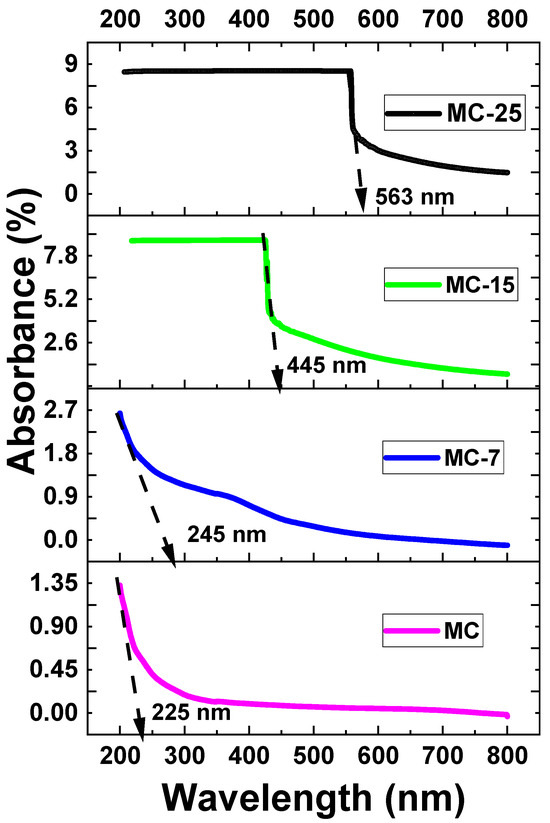
Figure 8.
UV-VIS absorption spectra at room temperature of MC/magnetite nanocomposites under investigation.

Table 1.
Energy band gap and opacity values of magnetite/MC nanocomposites.
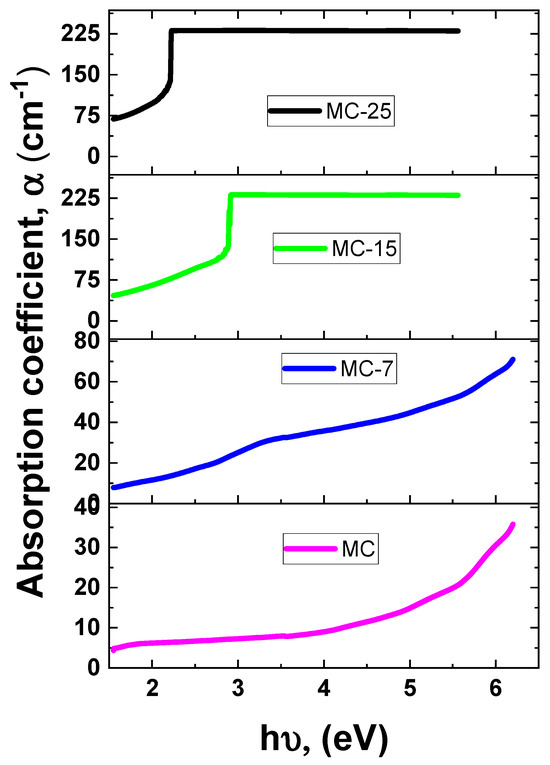
Figure 9.
The absorption coefficient (α) vs. photon energy of the MC/magnetite nanocomposites under investigation.
Similarly, the band gap (Eg) values were derived from the absorption coefficient (α) and the photon energy (). The direct band gap Tauc relation is used where represents the proportionality constant. Accordingly, Figure 10 depicts graphs of vs. for the investigated samples. The Eg value was calculated for each sample at the intersection between the extrapolation of the linear component of the curve at . The obtained Eg values decreased as the magnetite concentration in the sample increased. The creation of sub-band defect states may have caused the band gap to narrow.
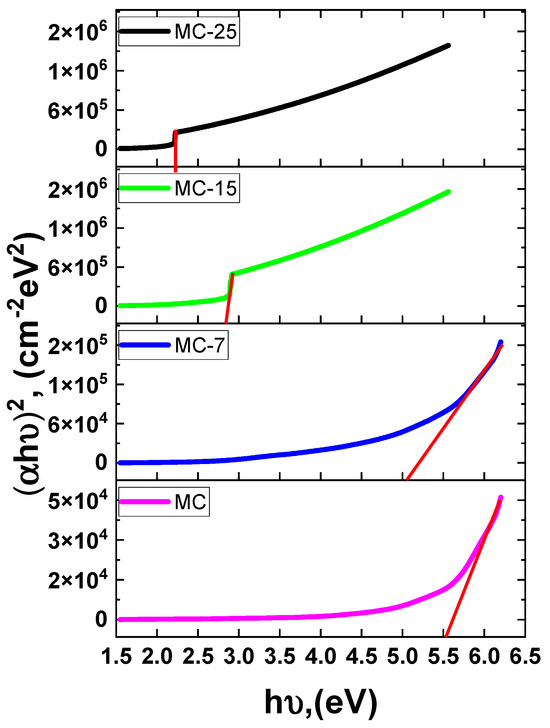
Figure 10.
Tauc plot of versus photon energy MC/magnetite nanocomposites. The solid red lines represent least-squares fitting.
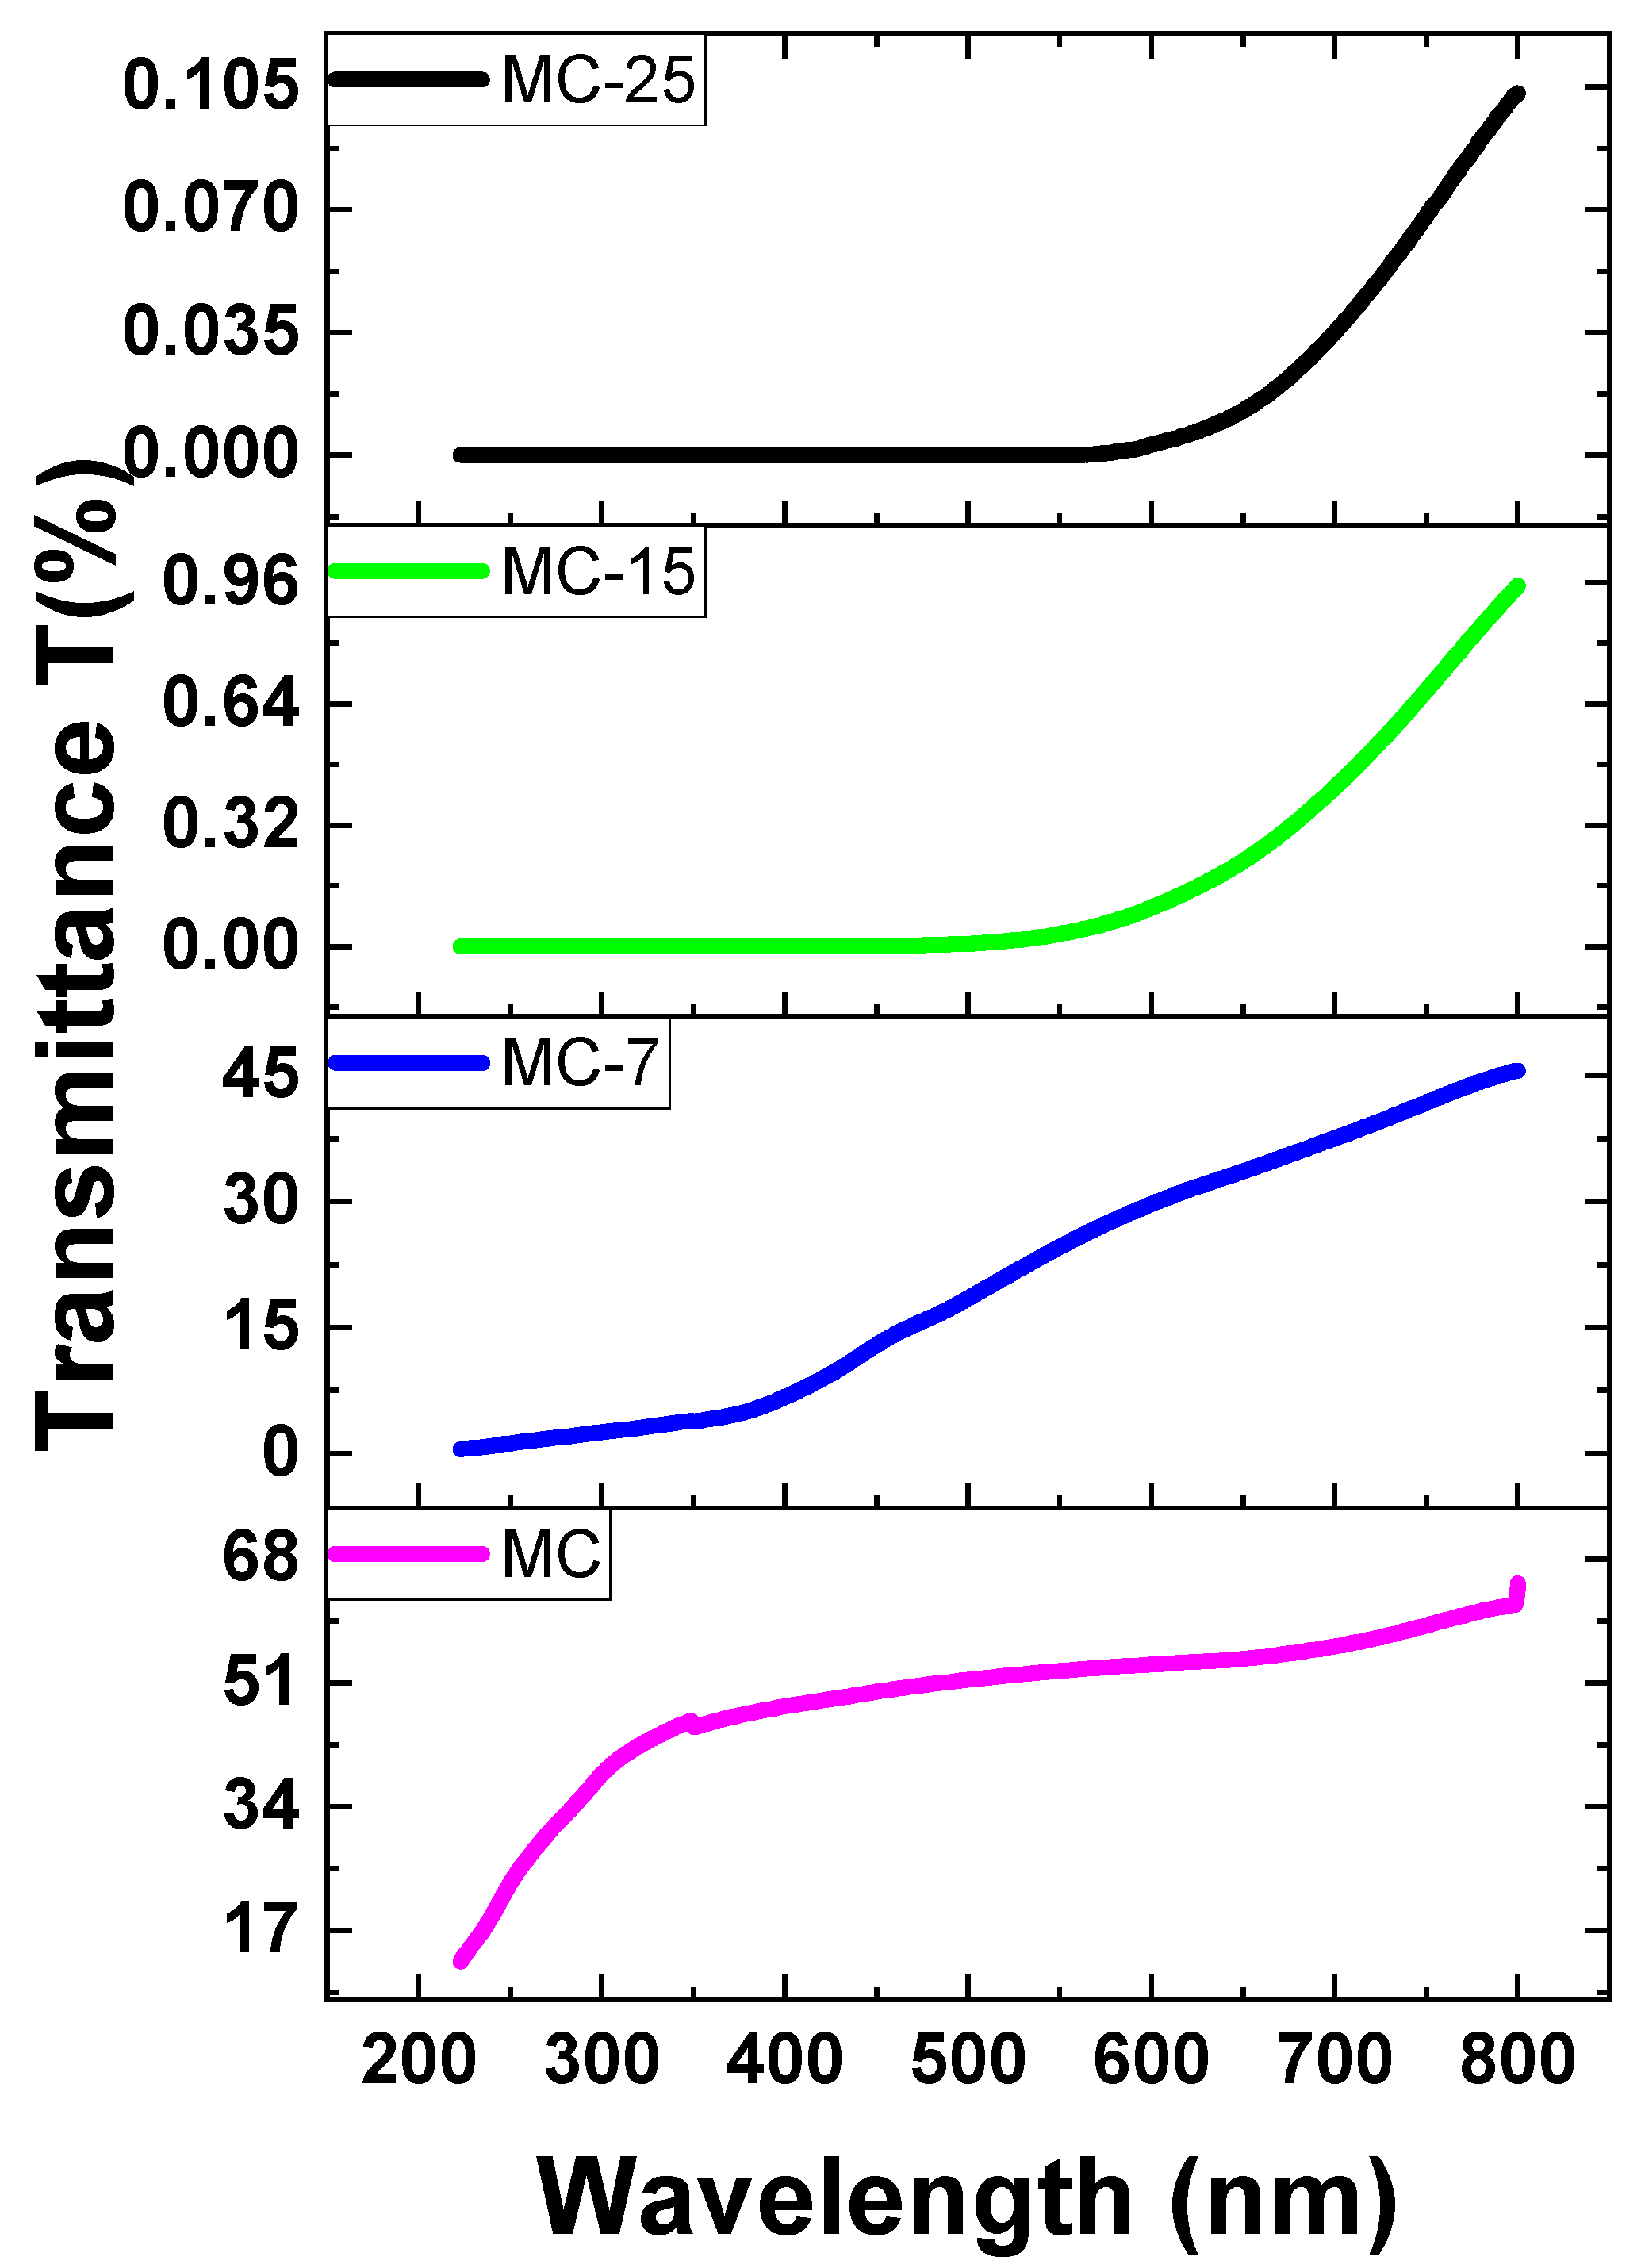
Based on the absorbance data (A), the Beer–Lambert law was utilized to determine the transmittance (T%) of both pure and doped MC samples. The transmittance values are obtained by converting the absorbance measurements using the following formula: [25]. The transmittance T% of various concentrations of magnetite in MC nanocomposites is displayed in Figure 11. According to this figure, the pristine MC sample has great transparency in the visible zone (above 50%), and transparency increases beyond this region. Nevertheless, when the amount of magnetite NPs in the samples increased, the transparency dropped. Transparency decreases with increasing magnetite concentration in the sample, as seen in Figure 11. The decrease in transparency of the heavily doped films was brought on by a significant scattering effect. This is because the inclusion of magnetite nanoparticles led to a reduction in transparency. The strong scattering in magnetite/MC nanocomposites is caused by the embedded additions of magnetite nanoparticles [26,27].
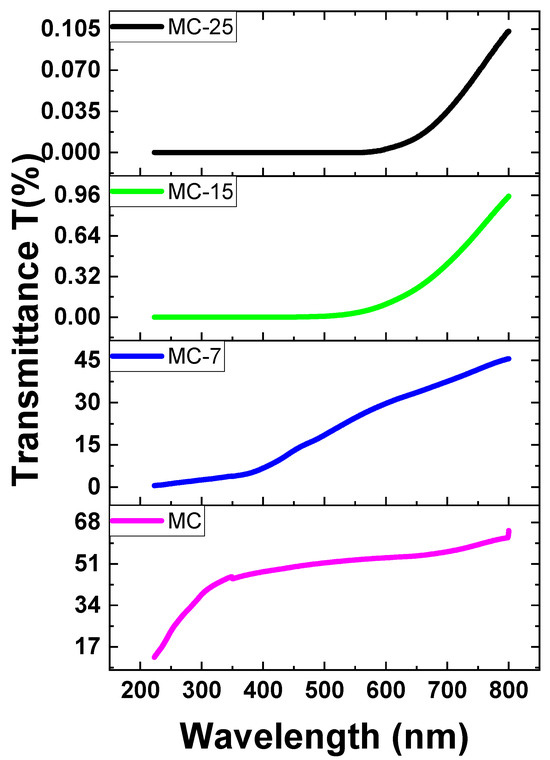
Figure 11.
The transmittance spectra of MC/magnetite nanocomposites.
The opacity of the magnetite/MC nanocomposites was determined from the following equation [27]: , where is the value of absorbance at 600 nm and t is the magnetite/MC nanocomposites thickness (cm). The calculated values of opacity using the above equation are given in Table 1. The opacity values of magnetite/MC nanocomposites increase in the order 2.7, 5.2, 29.8, and 45.3 for MC, MC-7, MC-15, and MC-25, respectively.
3.3. Magnetization Analysis
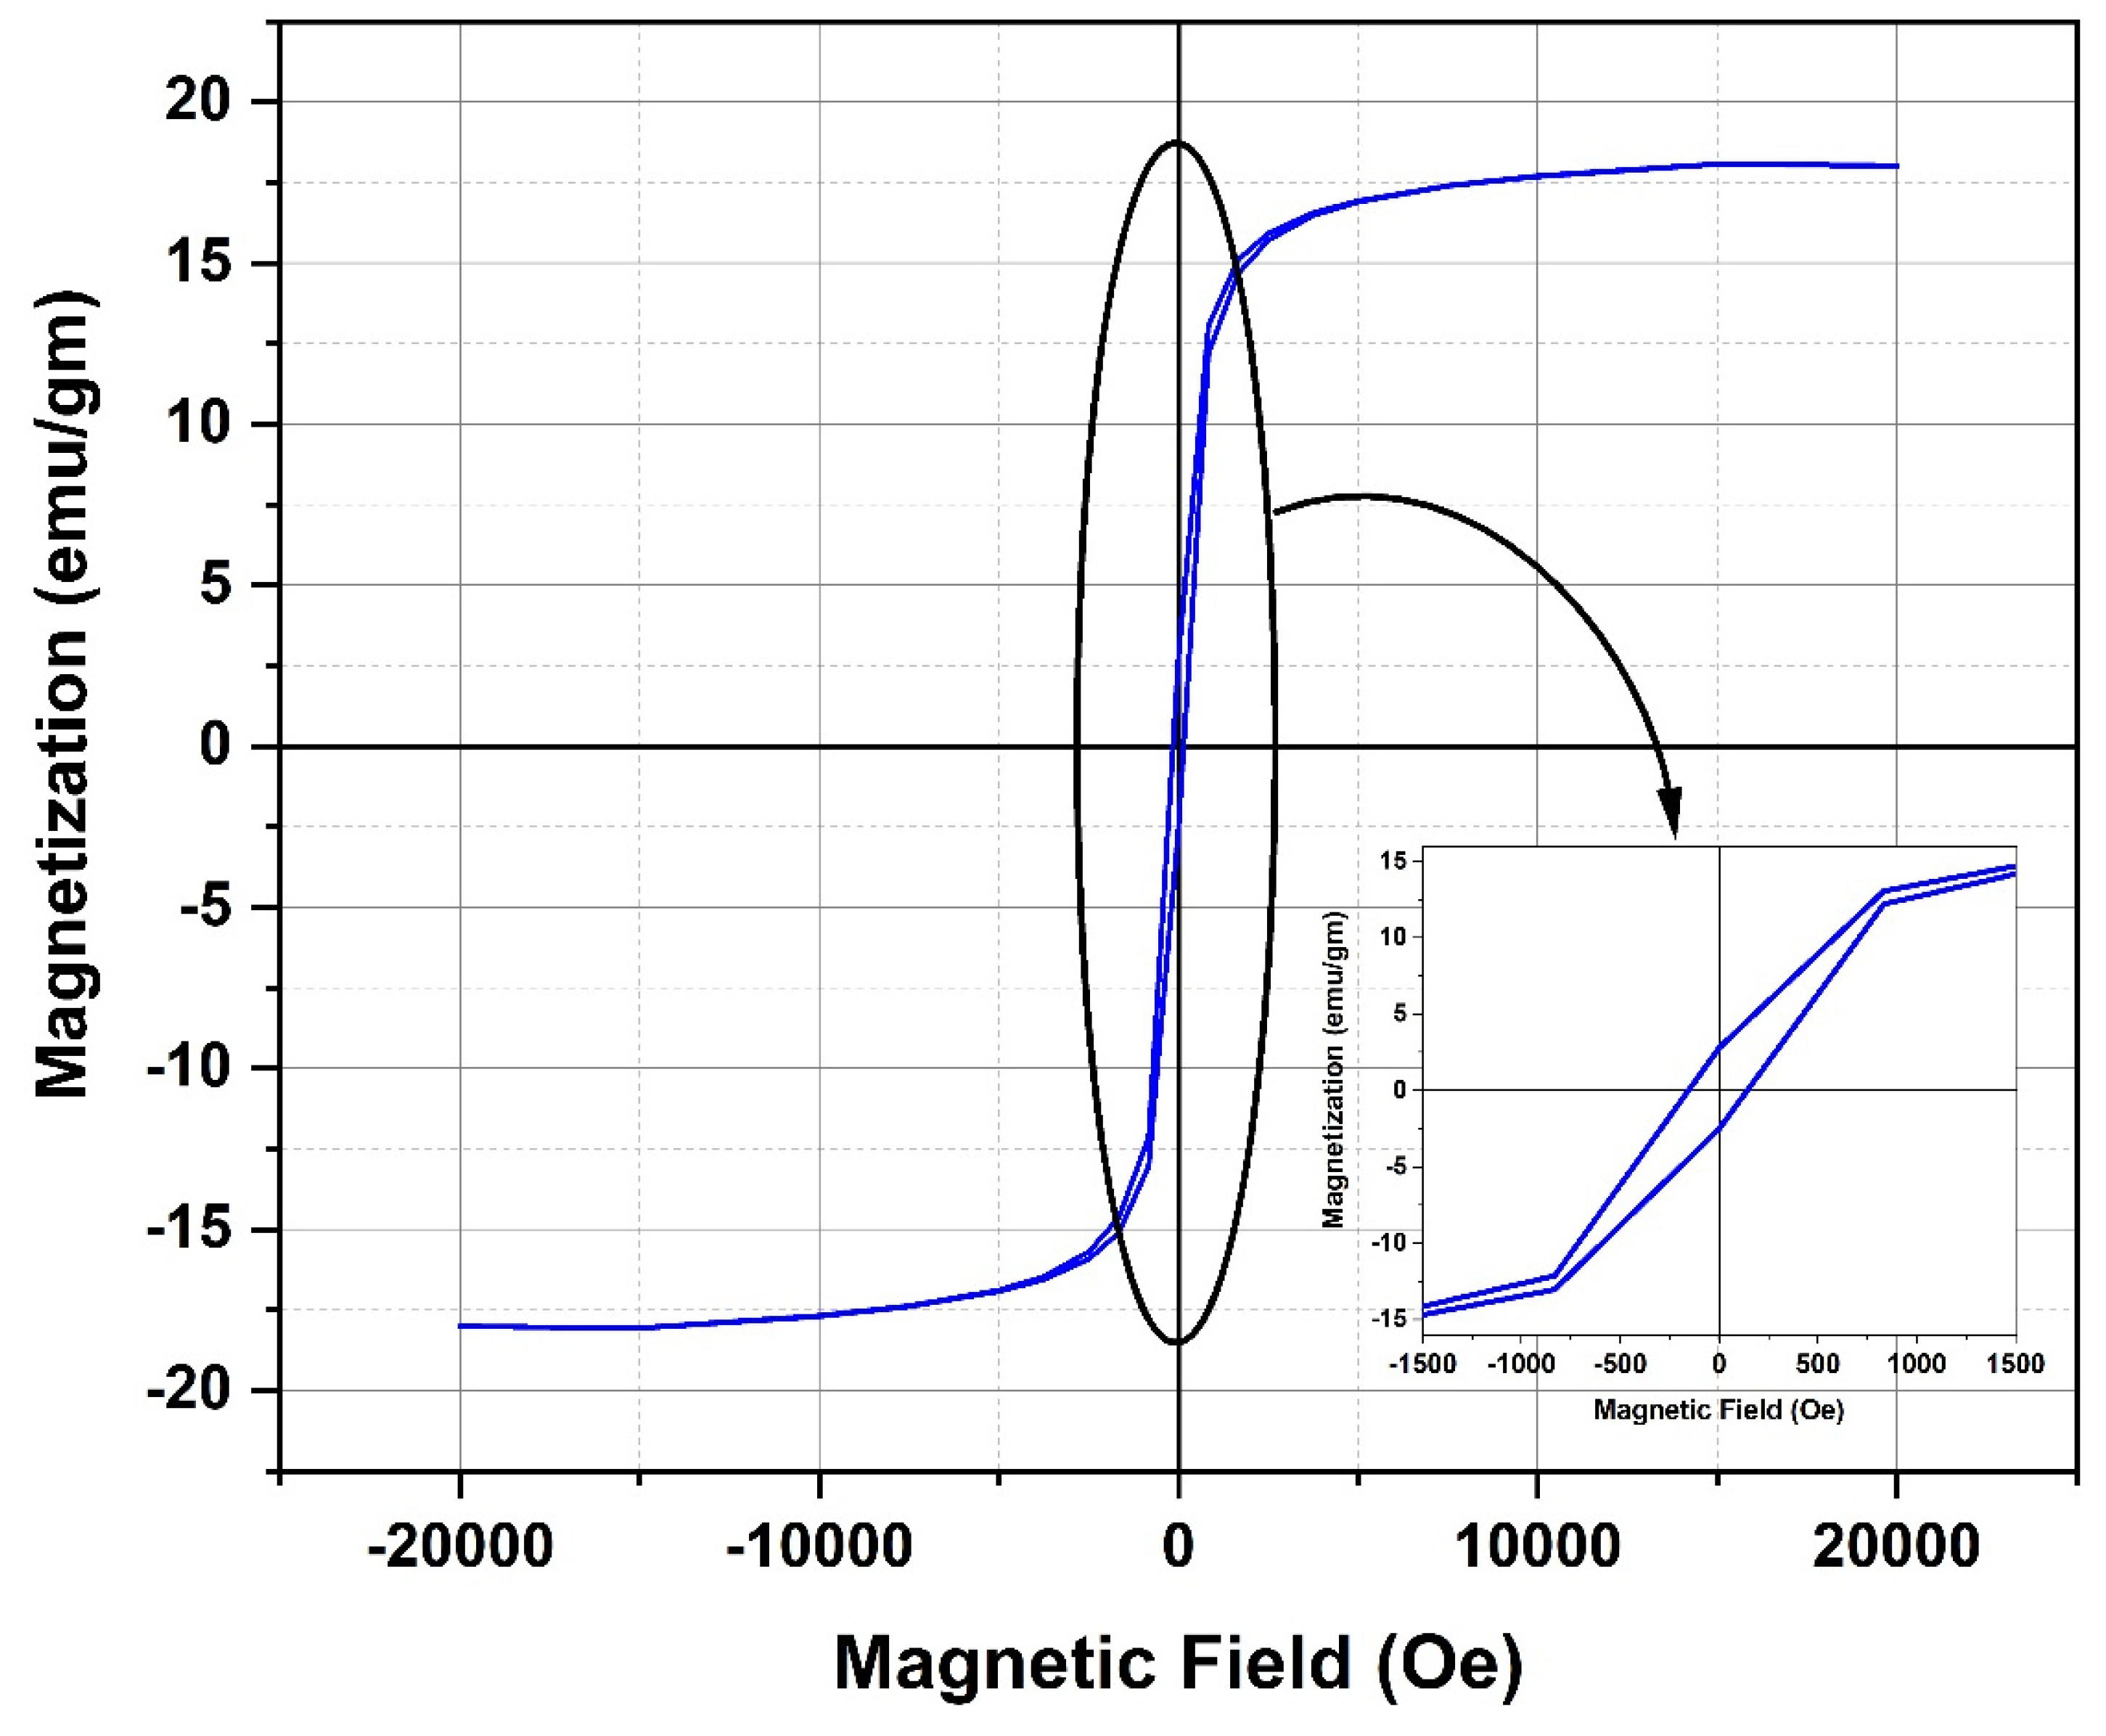
Figure 12 displays the plot depicting the relationship between magnetization and the applied external magnetic field for the Fe3O4 NPs. The aforementioned data indicate that the magnetite nanoparticles under investigation have a superparamagnetic characteristic, characterized by a low retentivity (Mr) value of 2.65 emu/g and minimal hysteresis loss. The obtained saturation magnetization (Ms) was found to be 18.08 emu/g, which indicates a rather small value when compared to the typically observed saturation magnetization values for magnetite NPs. The magnetic properties of magnetite NPs are known to be influenced by the specific synthesis process employed and the corresponding conditions under which the synthesis takes place. In order to achieve the necessary magnetic characteristics of magnetite NPs, it is imperative to meticulously select and regulate the synthesis process and conditions. In a study conducted by Mizukoshi et al., the researchers examined how different feeding conditions of FeSO4·7H2O solution into the base solution influenced the magnetic characteristics of magnetite NPs [28]. The study revealed that variables such as feeding rates and the length of sonication exposure exerted a significant impact on the characteristics of magnetite NPs. Consistent with these results, it was observed that magnetite NPs exhibited superparamagnetic characteristics, which was indicated by a rather moderate saturation magnetization value of approximately 32.8 emu/g. The aforementioned behavior was witnessed after the introduction of a solution of FeSO4·7H2O into the base solution, with a flow rate of 1 mL/min [28]. The observed low value of Ms for the magnetite NPs under investigation can be attributed to the gradual addition of FeSO4·7H2O solution to the NaOH solution. Furthermore, the measured Ms value for the examined magnetite NPs is low compared to that of bulk magnetite (92 emu/g) as reported in the referenced study [29]. The decrease in Ms can be ascribed to the presence of disorder on the surface of particles and/or the phenomenon of spin canting occurring at the particle surface [30,31].
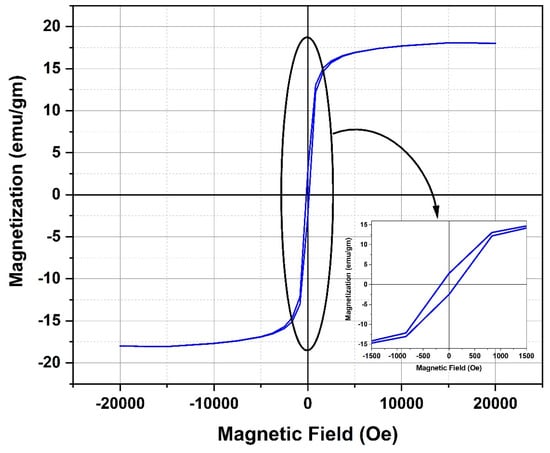
Figure 12.
Magnetic hysteresis loops measured at room temperature of the magnetite NPs under investigation.
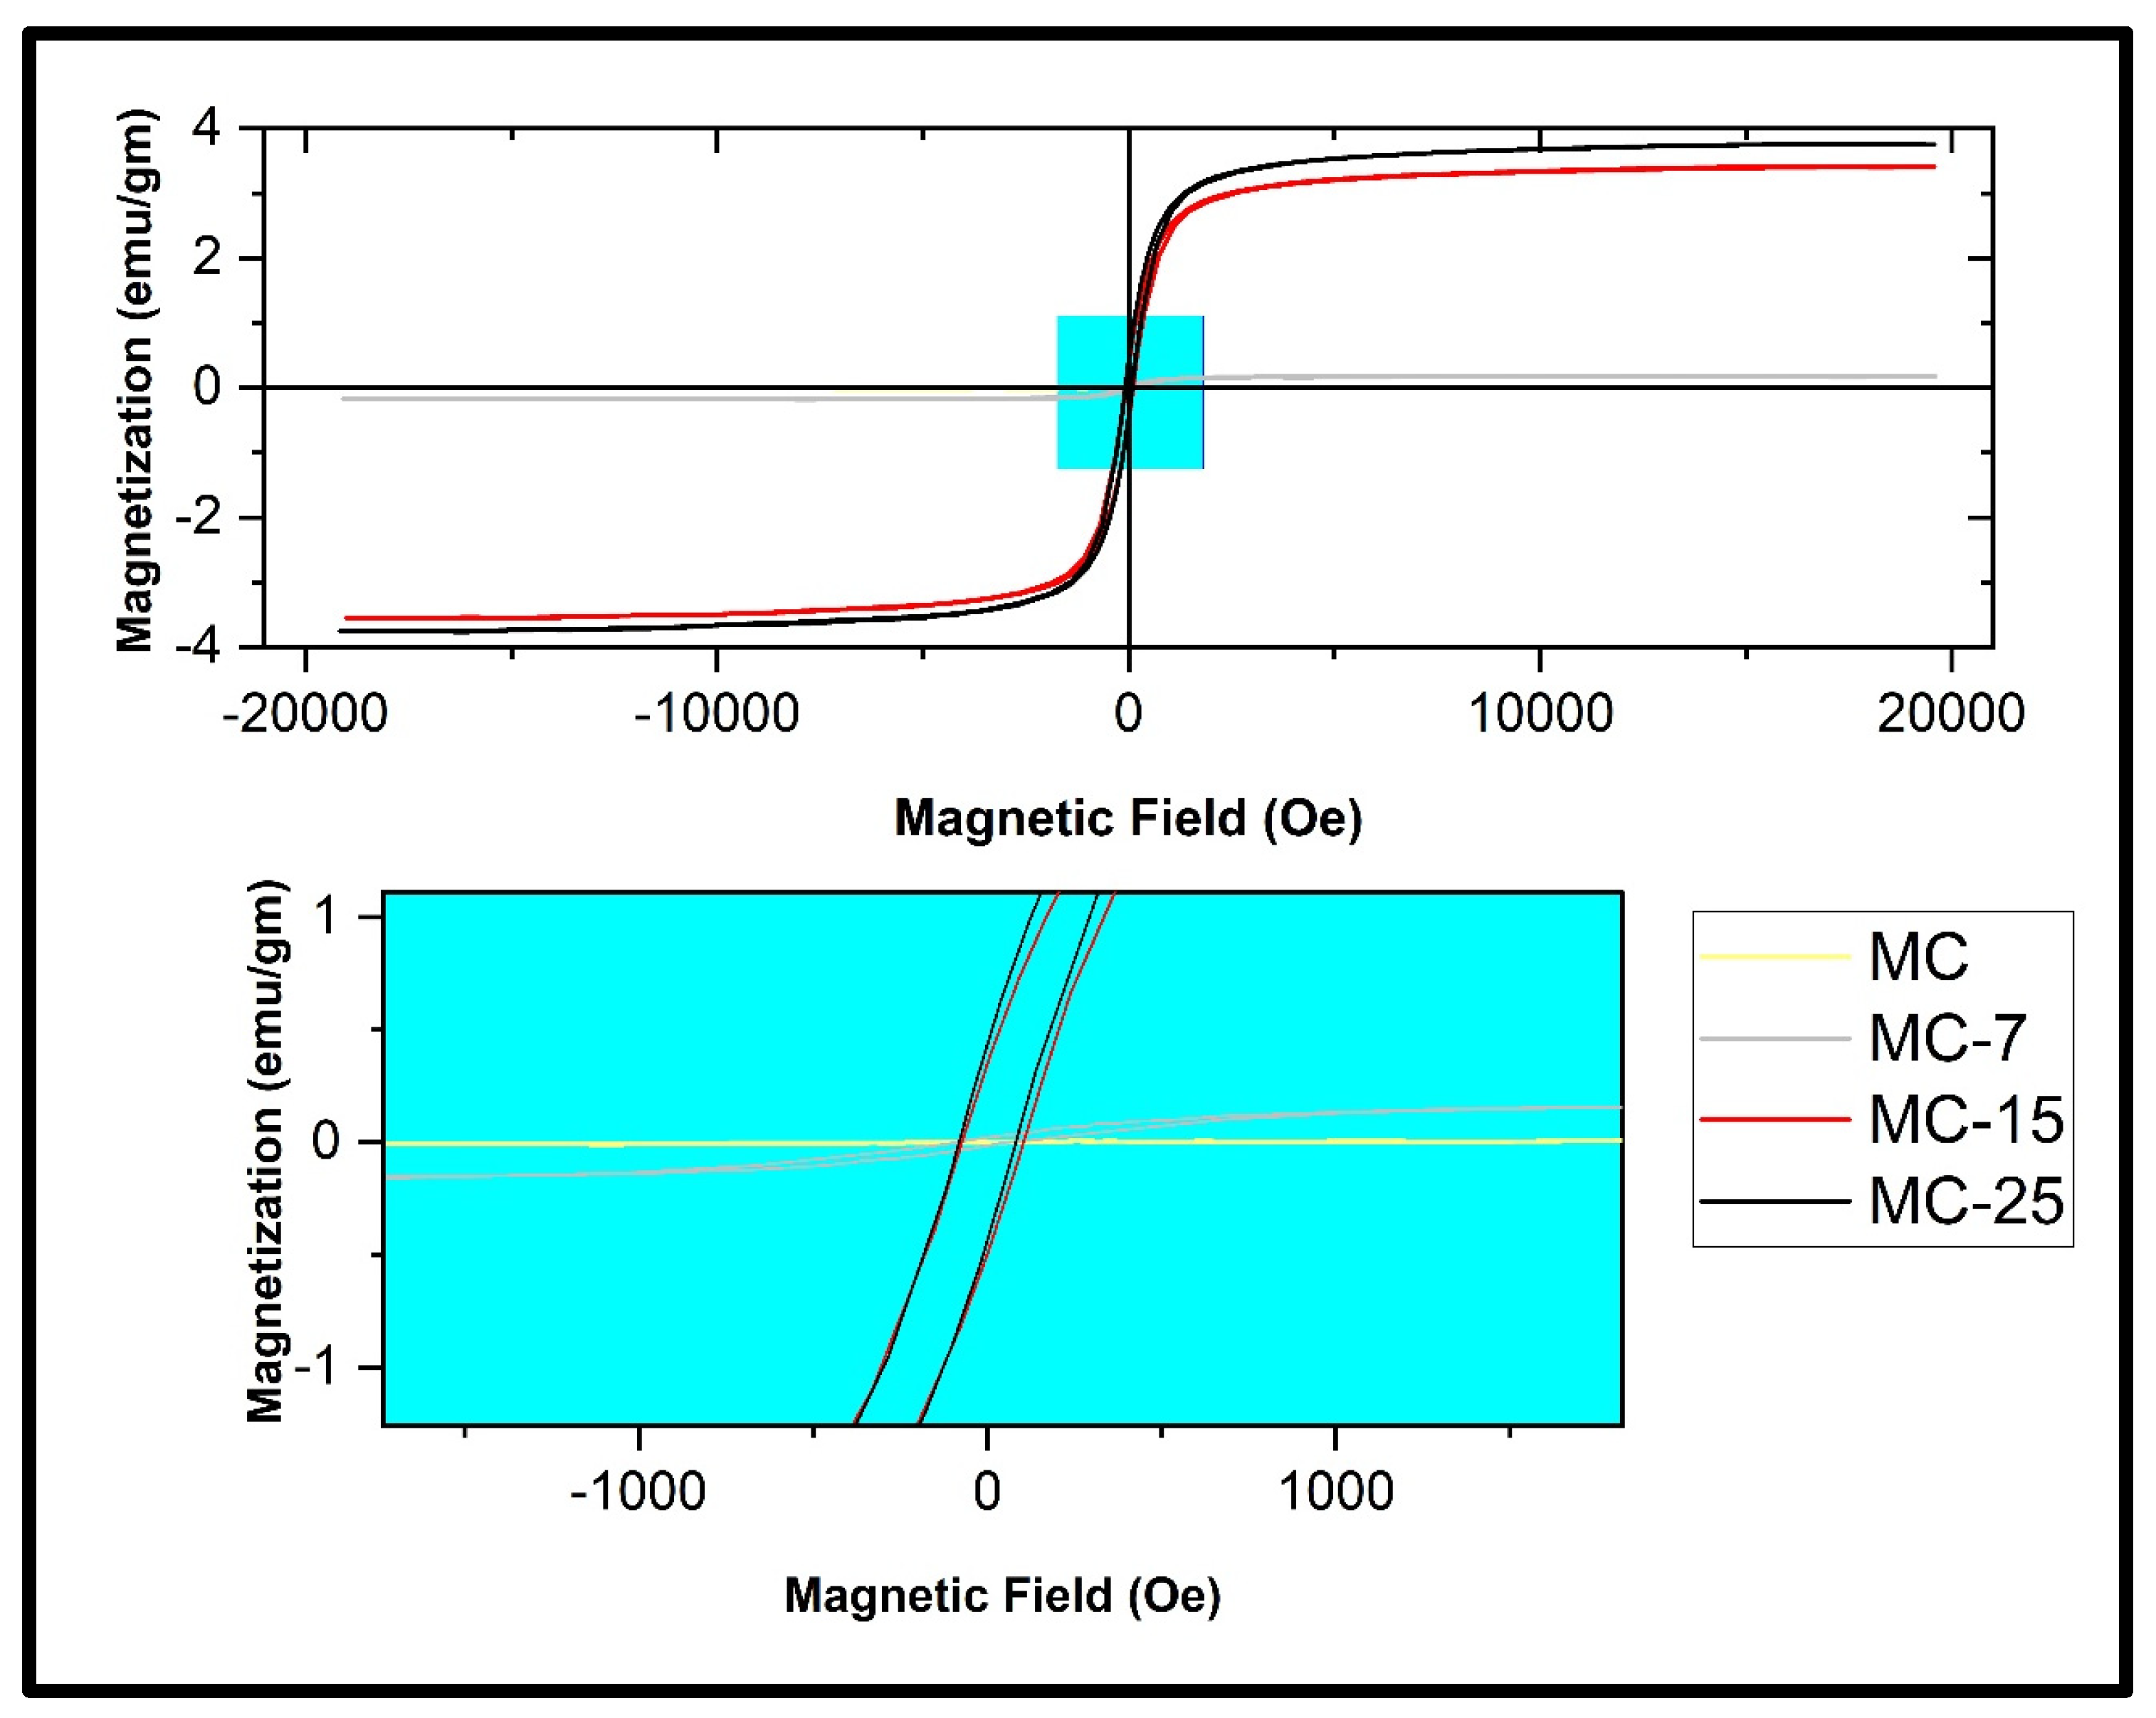
Figure 13 displays the magnetization curves of the MC/magnetite NC samples under various applied magnetic fields, ranging up to 20,000 Oe, while maintaining room temperature conditions. The pure MC sample did not exhibit hysteresis loop behavior, which is typically indicative of diamagnetic activity. Nevertheless, the incorporation of Fe3O4 nanoparticles (NPs) into the MC matrix resulted in the formation of a magnetic hysteresis loop, which exhibited variations depending on the amount of NPs loaded. This phenomenon is visually depicted in Figure 13. The obtained outcome affirms that the weight percentages of Fe3O4 NPs in the produced nanocomposites were adequate in counteracting the diamagnetic characteristics of the host magnetic composite matrix [24,32].
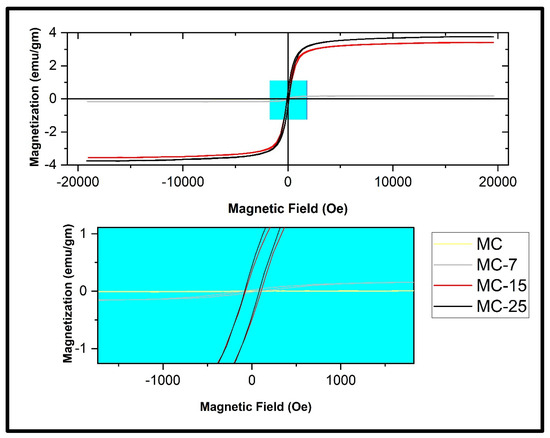
Figure 13.
Magnetic hysteresis loops measured at room temperature of the MC/magnetite nanocomposites under investigation.
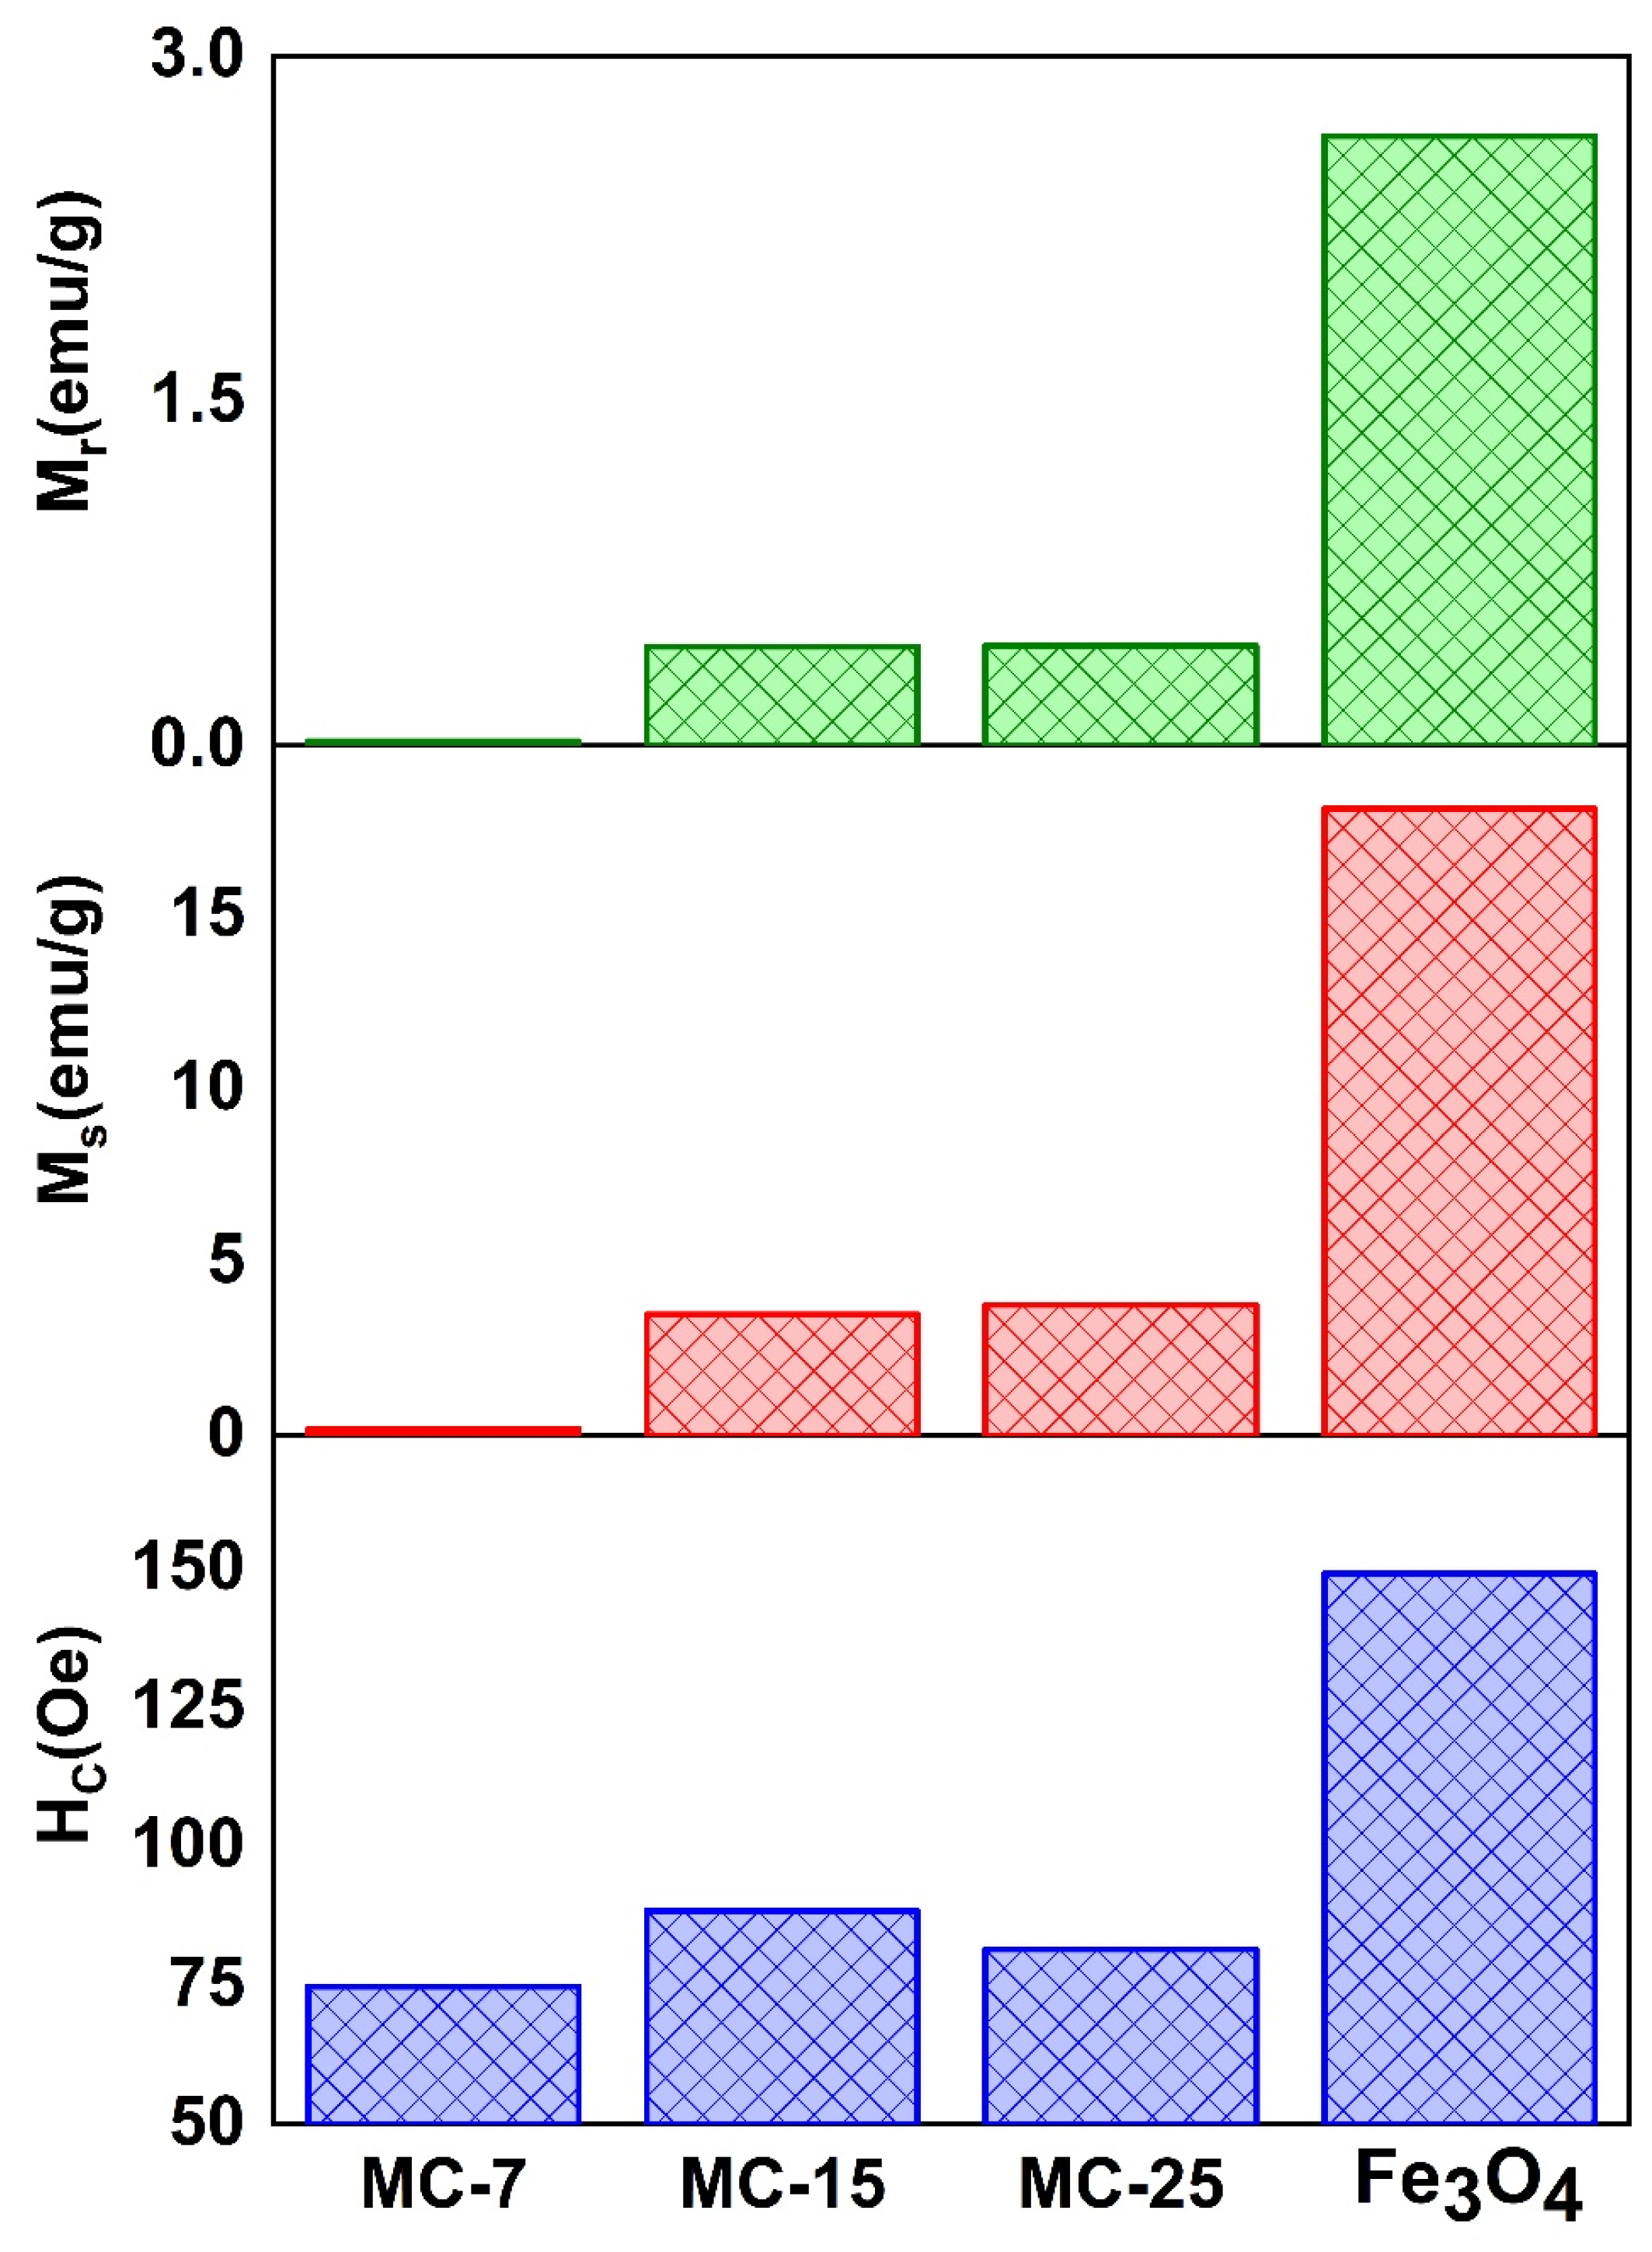
Figure 13 displays the magnetic characteristic parameters Ms, Mr, and coercive field (Hc) variations for the MC/magnetite NCs, as depicted in the zoomed-in region. Figure 14 displays the values of Ms, Mr, and the coercive field (Hc) for both the synthesized magnetite NPs and the fabricated MC/magnetite NCs. A monotonically increasing trend of Ms (magnetization saturation) and Mr (retentivity) with respect to the weight percentage of magnetite NPs was observed. It is evident that there is a significant enhancement in the Ms and Mr values as the content of magnetite NPs increases. On the other hand, the measured coercivity (Hc) values of the examined NCs did not exhibit a consistent trend with the rise in the Fe3O4 concentration. The Hc value of MC-15 was measured to be 88.4 Oe, which is more than the Hc value of MC-25 (81.47 Oe). The relationship between the Hc value and the magnetic filler content in NCs was investigated for carbon-cased iron carbide/poly(vinyl chloride) NCs [16]. In the conducted study, it was shown that an increase in coercivity was achieved for Nc when the filler content remained below the percolation threshold. This phenomenon was explained by the influence of dipolar interactions between polymers and magnetic nanoparticles on the coercivity [16].

Figure 14.
The characteristic parameters obtained from the magnetic hysteresis loops of the examined samples: coercive field (Hc), saturation magnetization (Ms), and retentivity (Mr) of MC/magnetite nanocomposites.
4. Conclusions
Biodegradable MC polymer and magnetite nanoparticles obtained by the reverse co-perception technique were combined to create MC/magnetite nanocomposites. The XRD pattern of reverse co-precipitated Fe3O4 nanoparticles was computed using Rietveld analysis with FullProf software. The diffraction peaks are well indexed, indicating a distinct crystalline character. The lattice parameters are consistent with standard data. The Williamson–Hall function was used to compute crystallite size and lattice strain. The average crystallite size and lattice microstrain were identified as around 46 nm and 0.0015 for Fe3O4 nanoparticles.
Analyzing the optical properties of the nanocomposite films showed that the MC/nanocomposite with 25% magnetite nanoparticles had a much smaller MC optical band gap than the other films, going from 5.5 eV to 2.20 eV. The decrease in band gap value is indicative of a stronger bond between magnetite nanoparticles and the MC polymer matrix. This, in turn, promotes a more effective transfer of electric charge along the polymer chains by increasing the number of trap sites located between the valence and conduction bands. Substantial improvements in both the saturation magnetization (Ms) and the remanent magnetization (Mr) were seen in the MC/Fe2O3 NCs under research when supermagnetic magnetite nanoparticles were added. However, when the concentration of Fe2O3 grew, the coercivity (Hc) values of the investigated nanocomposites (NCs) did not show a consistent trend, possibly because the concentration was higher than the percolation threshold. All things considered, the exploration of the novel MC/magnetite NCs yielded the first physical characterization of these NCs, which might enable the assessment of their possible behavior in real-world practical applications.
Author Contributions
All authors (A.H.F., A.A., O.S. and S.A.M.) are designed and performed the experiments, analysis and calculations, helped shape the research and final manuscript representation. All authors have read and agreed to the published version of the manuscript.
Funding
This research was funded by [the Deanship of Scientific Research, Vice Presidency for Graduate Studies and Scientific Research, King Faisal University, Saudi Arabia] grant number [GrantA446].
Data Availability Statement
Data are contained within the article.
Acknowledgments
This work was supported by the Deanship of Scientific Research, Vice Presidency for Graduate Studies and Scientific Research, King Faisal University, Saudi Arabia [GrantA446].
Conflicts of Interest
The authors declare no conflict of interest.
References
- Mahmed, N.; Heczko, O.; Söderberg, O.; Hannula, S.P. Room Temperature Synthesis of Magnetite (Fe3−δO4) Nanoparticles by a Simple Reverse Co-Precipitation Method. IOP Conf. Ser. Mater. Sci. Eng. 2011, 18, 032020. [Google Scholar] [CrossRef]
- Liu, S.; Yu, B.; Wang, S.; Shen, Y.; Cong, H. Preparation, surface functionalization and application of Fe3O4 magnetic nanoparticles. Adv. Colloid Interface Sci. 2020, 281, 102165. [Google Scholar] [CrossRef]
- Mohammadi, H.; Nekobahr, E.; Akhtari, J.; Saeedi, M.; Akbari, J.; Fathi, F. Synthesis and characterization of magnetite nanoparticles by co-precipitation method coated with biocompatible compounds and evaluation of in-vitro cytotoxicity. Toxicol. Rep. 2021, 8, 331–336. [Google Scholar] [CrossRef]
- Rahmayanti, M. Synthesis of Magnetite Nanoparticles Using The Reverse Co-precipitation Method With NH4OH as Precipitating Agent and Its Stability Test at Various pH. Nat. Sci. J. Sci. Technol. 2020, 09, 54–58. [Google Scholar] [CrossRef]
- Dudchenko, N.; Pawar, S.; Perelshtein, I.; Fixler, D. Magnetite Nanoparticles: Synthesis and Applications in Optics and Nanophotonics. Materials 2022, 15, 2601. [Google Scholar] [CrossRef]
- Kalubowilage, M.; Janik, K.; Bossmann, S.H. Magnetic Nanomaterials for Magnetically-Aided Drug Delivery and Hyperthermia. Appl. Sci. 2019, 9, 2927. [Google Scholar] [CrossRef]
- Fatima, H.; Charinpanitkul, T.; Kim, K.-S. Fundamentals to Apply Magnetic Nanoparticles for Hyperthermia Therapy. Nanomaterials 2021, 11, 1203. [Google Scholar] [CrossRef]
- Fernández-Barahona, I.; Muñoz-Hernando, M.; Ruiz-Cabello, J.; Herranz, F.; Pellico, J. Iron Oxide Nanoparticles: An Alternative for Positive Contrast in Magnetic Resonance Imaging. Inorganics 2020, 8, 28. [Google Scholar] [CrossRef]
- Challagulla, S.; Nagarjuna, R.; Ganesan, R.; Roy, S. Acrylate-based Polymerizable Sol-Gel Synthesis of Magnetically Recoverable TiO2 Supported Fe3O4 for Cr(VI) Photoreduction in Aerobic Atmosphere. ACS Sustain. Chem. Eng. 2016, 4, 974–982. [Google Scholar] [CrossRef]
- Wei, Y.; Han, B.; Hu, X.; Lin, Y.; Wang, X.; Deng, X. Synthesis of Fe3O4 Nanoparticles and their Magnetic Properties. Procedia Eng. 2012, 27, 632–637. [Google Scholar] [CrossRef]
- Petcharoen, K.; Sirivat, A. Synthesis and characterization of magnetite nanoparticles via the chemical co-precipitation method. Mater. Sci. Eng. B 2012, 177, 421–427. [Google Scholar] [CrossRef]
- Kazemzadeh, H.; Ataie, A.; Rashchi, F. Synthesis of Magnetite Nano-Particles by Reverse Co-Precipitation. Int. J. Mod. Phys. Conf. Ser. 2012, 05, 160–167. [Google Scholar] [CrossRef]
- Kupracz, P.; Coy, E.; Grochowska, K.; Karczewski, J.; Rysz, J.; Siuzdak, K. The pulsed laser ablation synthesis of colloidal iron oxide nanoparticles for the enhancement of TiO2 nanotubes photo-activity. Appl. Surf. Sci. 2020, 530, 147097. [Google Scholar] [CrossRef]
- Pouretedal, H.R.; Bashiri, Z.; Nasiri, M.; Arab, A. Photo-treatment of TNT wastewater in the presence of nanocomposite of WO3/Fe3O4. Part. Sci. Technol. 2021, 39, 971–980. [Google Scholar] [CrossRef]
- Hasanpour, M.; Motahari, S.; Jing, D.; Hatami, M. Statistical analysis and optimization of photodegradation efficiency of methyl orange from aqueous solution using cellulose/zinc oxide hybrid aerogel by response surface methodology (RSM). Arab. J. Chem. 2021, 14, 103401. [Google Scholar] [CrossRef]
- Shekhar, S.; Sajitha, E.; Subramanyam, S. High coercivity below percolation threshold in polymer nanocomposite. J. Appl. Phys. 2008, 104, 083910. [Google Scholar] [CrossRef]
- Nasatto, P.L.; Pignon, F.; Silveira, J.L.M.; Duarte, M.E.R.; Noseda, M.D.; Rinaudo, M. Methylcellulose, a Cellulose Derivative with Original Physical Properties and Extended Applications. Polymers 2015, 7, 777–803. [Google Scholar] [CrossRef]
- Mostafa, M.; Saleh, O.; El-Shahawy, M.; Ghazy, R.; Hemeda, O.; Abd El-Kareem, S.; Dorgham, A. Effect of Methyl Cellulose "MC" on some physical properties of Nickel Magnesium Ferrite—MC nanocomposite. Arab J. Nucl. Sci. Appl. 2022, 55, 16–28. [Google Scholar] [CrossRef]
- Kim, J.K.; Won, Y.-W.; Lim, K.S.; Kim, Y.-H. Low-Molecular-Weight Methylcellulose-Based Thermo-reversible Gel/Pluronic Micelle Combination System for Local and Sustained Docetaxel Delivery. Pharm. Res. 2012, 29, 525–534. [Google Scholar] [CrossRef]
- Bordbar-Khiabani, A.; Gasik, M. Smart Hydrogels for Advanced Drug Delivery Systems. Int. J. Mol. Sci. 2022, 23, 3665. [Google Scholar] [CrossRef]
- Adepu, S.; Ramakrishna, S. Controlled Drug Delivery Systems: Current Status and Future Directions. Molecules 2021, 26, 5905. [Google Scholar] [CrossRef] [PubMed]
- Nyquist, R.A.; Kagel, R.O. Handbook of Infrared and Raman Spectra of Inorganic Compounds and Organic Salts: Infrared Spectra of Inorganic Compounds; Academic Press: Cambridge, MA, USA, 2012; Volume 4. [Google Scholar]
- Anamika; Singh, V.; Yadav, B.K. Adsorption study of Heavy Metals from Aqueous Solutions using Magnetite Nanoparticles. J. Phys. Conf. Ser. 2020, 1504, 012011. [Google Scholar] [CrossRef]
- Mansour, S.A.; Farha, A.H.; Tahoun, B.A.; Elsad, R.A. Novel magnetic polyaniline nanocomposites based on as-synthesized and surface modified Co-doped ZnO diluted magnetic oxide (DMO) nanoparticles. Mater. Sci. Eng. B 2021, 265, 115032. [Google Scholar] [CrossRef]
- Tunç, S.; Duman, O. Preparation and characterization of biodegradable methyl cellulose/montmorillonite nanocomposite films. Appl. Clay Sci. 2010, 48, 414–424. [Google Scholar] [CrossRef]
- Aziz, S.B.; Rasheed, M.A.; Ahmed, H.M. Synthesis of Polymer Nanocomposites Based on [Methyl Cellulose](1−x):(CuS)x (0.02 M ≤ x ≤ 0.08 M) with Desired Optical Band Gaps. Polymers 2017, 9, 194. [Google Scholar] [CrossRef] [PubMed]
- Rao, Y.; Chen, S. Molecular Composites Comprising TiO2 and Their Optical Properties. Macromolecules 2008, 41, 4838–4844. [Google Scholar] [CrossRef]
- Mizukoshi, Y.; Shuto, T.; Masahashi, N.; Tanabe, S. Preparation of superparamagnetic magnetite nanoparticles by reverse precipitation method: Contribution of sonochemically generated oxidants. Ultrason. Sonochem. 2009, 16, 525–531. [Google Scholar] [CrossRef] [PubMed]
- Han, D.H.; Wang, J.P.; Luo, H.L. Crystallite size effect on saturation magnetization of fine ferrimagnetic particles. J. Magn. Magn. Mater. 1994, 136, 176–182. [Google Scholar] [CrossRef]
- Lin, C.-R.; Chu, Y.-M.; Wang, S.-C. Magnetic properties of magnetite nanoparticles prepared by mechanochemical reaction. Mater. Lett. 2006, 60, 447–450. [Google Scholar] [CrossRef]
- Kong, I.; Ahmad, S.; Abdullah, M.; Yusoff, A. The Effect of Temperature on Magnetic Behavior of Magnetite Nanoparticles and Its Nanocomposites. AIP Conf. Proc. 2009, 1136, 830–834. [Google Scholar]
- Jacobo, S.E.; Aphesteguy, J.C.; Lopez Anton, R.; Schegoleva, N.N.; Kurlyandskaya, G.V. Influence of the preparation procedure on the properties of polyaniline based magnetic composites. Eur. Polym. J. 2007, 43, 1333–1346. [Google Scholar] [CrossRef]


Disclaimer/Publisher’s Note: The statements, opinions and data contained in all publications are solely those of the individual author(s) and contributor(s) and not of MDPI and/or the editor(s). MDPI and/or the editor(s) disclaim responsibility for any injury to people or property resulting from any ideas, methods, instructions or products referred to in the content. |
© 2024 by the authors. Licensee MDPI, Basel, Switzerland. This article is an open access article distributed under the terms and conditions of the Creative Commons Attribution (CC BY) license (https://creativecommons.org/licenses/by/4.0/).