Article

Bridging Behavior of Palm Fiber in Cementitious Composite

by
Selamawit Fthanegest Abrha
1,
Helen Negash Shiferaw
1 and
Toshiyuki Kanakubo
2,*
1
Degree Program in Engineering Mechanics and Energy, University of Tsukuba, Tsukuba 305-8573, Japan
2
Division of Engineering Mechanics and Energy, University of Tsukuba, Tsukuba 305-8573, Japan
*
Author to whom correspondence should be addressed.
J. Compos. Sci. 2024, 8(9), 361; https://doi.org/10.3390/jcs8090361
Submission received: 20 August 2024 / Revised: 12 September 2024 / Accepted: 14 September 2024 / Published: 16 September 2024
(This article belongs to the Special Issue Composites: A Sustainable Material Solution)

Abstract

:
This study addresses the growing need for sustainable construction materials by investigating the mechanical properties and behavior of palm fiber-reinforced cementitious composite (FRCC), a potential eco-friendly alternative to synthetic fiber reinforcements. Despite the promise of natural fibers in enhancing the mechanical performance of composites, challenges remain in optimizing fiber distribution, fiber–composite bonding mechanism, and its balance to matrix strength. To address these challenges, this study conducted extensive experimental programs using palm fiber as reinforcement, focusing on understanding the fiber–matrix interaction, determining the pullout load–slip relationship, and modeling fiber bridging behavior. The experimental program included density calculations and scanning electron microscope (SEM) analysis to examine the surface morphology and diameter of the fibers. Single fiber pullout tests were performed under varying conditions to assess the pullout load, slip behavior, and failure modes of the palm fiber, and a relationship between the pullout load and slip with the embedded length of the palm fiber was constructed. A trilinear model was developed to describe the pullout load–slip behavior of single fibers, and a corresponding palm-FRCC bridging model was constructed using the results from these tests. Section analysis was conducted to assess the adaptability of the modeled bridging law calculations, and the analysis result of the bending moment–curvature relationship shows a good agreement with the experimental results obtained from the four-point bending test of palm-FRCC. These findings demonstrate the potential of palm fibers in improving the mechanical performance of FRCC and contribute to the broader understanding of natural fiber reinforcement in cementitious composites.

1. Introduction

In recent decades, the construction industry has shifted towards the development of sustainable materials that meet the structural demands of modern infrastructure while minimizing environmental impact. This shift is driven by the growing awareness of the need to reduce carbon emissions and resource consumption associated with traditional construction materials [1,2]. Among these innovations, fiber-reinforced cementitious composites (FRCCs) have emerged as promising candidates, offering superior mechanical properties, durability, and environmental benefits compared to conventional cement-based materials [3,4,5]. FRCCs, including engineered cementitious composites (ECC), strain-hardening cement composites (SHCC), and ductile fiber-reinforced cementitious composites (DFRCC), have been extensively researched for their strain-hardening, deflection-hardening, and multiple cracking behaviors, making them ideal for structural applications that require enhanced durability and resistance to cracking [6,7].
One of the most significant advancements in FRCC development is the incorporation of natural fibers, which offer an environmentally friendly alternative to synthetic fibers. Natural fibers, derived from plant or animal sources, are gaining attention for their renewability, biodegradability, and low embodied energy [8,9]. Plant fibers, such as jute, flax, hemp, kenaf, bamboo, and sisal, have been widely explored for their potential to reinforce cement-based composites [10,11,12,13,14,15,16,17,18,19]. Recent research highlights the benefits of natural fibers, including improved tensile strength, bending strength, fracture toughness, and ductility, which contribute to the overall enhancement of composite performance. Among these fibers, sisal fiber, derived from the Agave plant, has garnered significant attention in recent research due to its mechanical properties and environmental advantages. Recent studies highlight the effectiveness of sisal fibers in enhancing the tensile and flexural strength of cement-based composites, with findings indicating that the optimal inclusion of sisal fibers can improve crack resistance overall [20,21,22]. The ability of sisal fibers to effectively bond with the cement matrix is attributed to their high cellulose content and rough surface, which enhance the mechanical interlocking within the composite [23,24,25].
Natural fibers possess a complex cellular structure comprising varying proportions of cellulose, hemicellulose, and lignin, which play a crucial role in their mechanical properties [26,27,28,29]. Current research underscores the promising outcomes in terms of increased tensile strength, bending strength, fracture toughness, and ductility, coupled with greater resistance to cracking, which contributes to enhanced overall strength and toughness [30,31,32]. Natural fibers, with their low density and high specific strength, are ideal for lightweight construction materials [33,34]. Sisal fibers, in particular, have shown impressive properties such as high tensile strength, low density, and good flexibility, making them suitable for lightweight construction materials [20]. Their reduced density not only decreases the overall weight of the composite but also eases handling, transportation, and installation. Furthermore, these fibers are more cost-effective than synthetic fibers, contributing to the practicality and affordability of natural fiber-reinforced cementitious composites (NFRCs) [35,36,37].
Among the wide range of natural fibers, palm fibers have also demonstrated significant potential in reinforcing cementitious composites [38,39]. As abundant by-products of the palm oil industry, palm fibers are characterized by their high aspect ratio, low density, and biodegradability [40]. These fibers exhibit excellent tensile strength and modulus, contributing to the enhancement of ductility and toughness in FRCCs [41,42,43,44,45,46]. Importantly, palm fibers have shown good compatibility with the alkaline environment of cement, which reduces concerns related to chemical degradation over time [47,48,49]. Incorporating palm fiber into FRCCs offers a sustainable approach to improving the mechanical and environmental performance of cement-based materials [50].
However, the application of palm fibers in cementitious composites has encountered several challenges. One of the key issues is the limited fiber–matrix compatibility, which can lead to poor bonding and reduced load transfer efficiency. The hydrophilic nature of natural fibers also raises concerns about moisture absorption, which can affect the long-term durability of the composite. Moreover, the variability in fiber morphology and quality, along with difficulties in achieving uniform fiber distribution within the cement matrix, further complicates their practical use in construction materials. Therefore, more research is needed to fully understand the pullout behavior, mechanical interlocking, and long-term performance of these fibers in FRCC applications.
Therefore, the current research seeks to address these challenges by investigating the fiber–matrix interaction, particularly focusing on the pullout behavior of palm fibers embedded in a cementitious matrix. This study aims to evaluate the effectiveness of palm fibers in enhancing the tensile performance of FRCC.
The assessment of tensile performance in FRCC relies on a bridging law calculation. The bridging law concept plays a pivotal role in explaining the tensile behavior of FRCC. Bridging refers to the ability of fibers to span across cracks and distribute loads, thereby impeding crack propagation and enhancing the material’s post-cracking performance [51,52]. This law establishes a relationship between the fibers’ tensile force and crack width, involving a detailed analysis of fiber bridging performance within the FRCC [53]. The bridging law calculates the bridging stress by summing up the behaviors of individual fibers pulled out experimentally and bridging them across multiple fibers on the crack surface. By utilizing the bridging rule, it is possible to evaluate the tensile properties of FRCC based on material constituents such as fiber–matrix bond characteristics and fiber fracture strength [54].
Tensile characteristics are influenced by many factors, such as fiber type, volume fraction, fiber orientation and distribution, matrix property, and so on [51,55]. Different fibers exhibit distinct mechanical properties and bond characteristics with the matrix. The type and content of fibers significantly influence the bridging mechanism and, consequently, the tensile performance of FRCC. Furthermore, as the pullout behavior varies significantly depending on the type of fibers and matrix [56], it is necessary to construct specific bridging rules for the targeted FRCC.
Therefore, a critical component of the research involves conducting single-fiber pullout tests to observe and understand the pullout behavior of palm fibers. By understanding the interaction between palm fibers and the cementitious matrix at the microscale level, valuable insights can be gained into the load transfer mechanisms and failure modes governing the behavior of FRCC. Additionally, the research encompasses a comprehensive analysis of the physical and mechanical properties of palm fibers, including their density, morphology, and diameter. Special emphasis is placed on characterizing the surface morphology of palm fibers to assess their potential for mechanical interlocking with the cementitious matrix.
To assess the effect of the pullout behavior of palm fibers on the tensile performance of FRCC, the bridging law calculations are also conducted based on the modeling of single-fiber pullout behavior. After that, the results of the four-point bending test for FRCC are compared with the section analysis results to check the adaptability of the bridging law calculations. The flow of current research, including both experimental and analytical programs, is fully shown in Figure 1.

2. Experimental Program

2.1. Palm Fiber

The fiber used in this research is palm fiber, as shown in Figure 2. The fiber was prepared by cutting a palm rope using a shredder. The palm rope, manufactured in China, is commercially available in the regular market as a gardening product. Since the fibers were prepared using a shredder, the length of the fibers is not constant. Thirty samples of fiber were measured using a ruler, as shown in Figure 3a. Figure 3b shows the distribution of the fiber length with an average length of 12 mm.

2.1.1. Density of Palm Fiber

Fiber density was calculated using the Archimedes principle. This principle states that the volume of liquid displaced is equal to the volume of an object completely immersed in liquid. The palm rope was sampled before cutting, and the dry weight at room temperature was measured. The sample was soaked in water for 22 h, and the wet weight was measured after squeezing. The sample was then immersed in a full glass funnel, and the mass of water displaced was measured as the fiber volume. Density calculation methods are shown in Figure 4, and the average density is 0.723 g/cm3.

2.1.2. Diameter and Morphology of Palm Fiber

An observation by scanning electron microscope (SEM) was carried out to check the fiber configuration and measure the diameter. All the samples have a cylindrical shape, as shown in Figure 5a. Figure 5b shows the wax and impurities on the surface, and Figure 5c shows the array of bulges, which are silica bodies embedding circular holes. In Figure 5d, the silica is removed, leaving an empty hole that may facilitate the mechanical interlocking of the fiber and the matrix. Sample fibers were scanned using SEM to measure the diameter, and then, using the image from SEM, the diameter of individual fiber was measured using ImageJ. The measured diameter varied from 127 µm to 208 µm. The distribution of fiber diameters is shown in Figure 6, with an average fiber diameter of 171 µm.

2.2. Mixture Proportion

The mixture proportion adopted in this research is shown in Table 1. In this research, to balance the mechanical characteristics of palm fiber with those of matrix, a mixture proportion with target compressive strength of 24 MPa class was adopted.

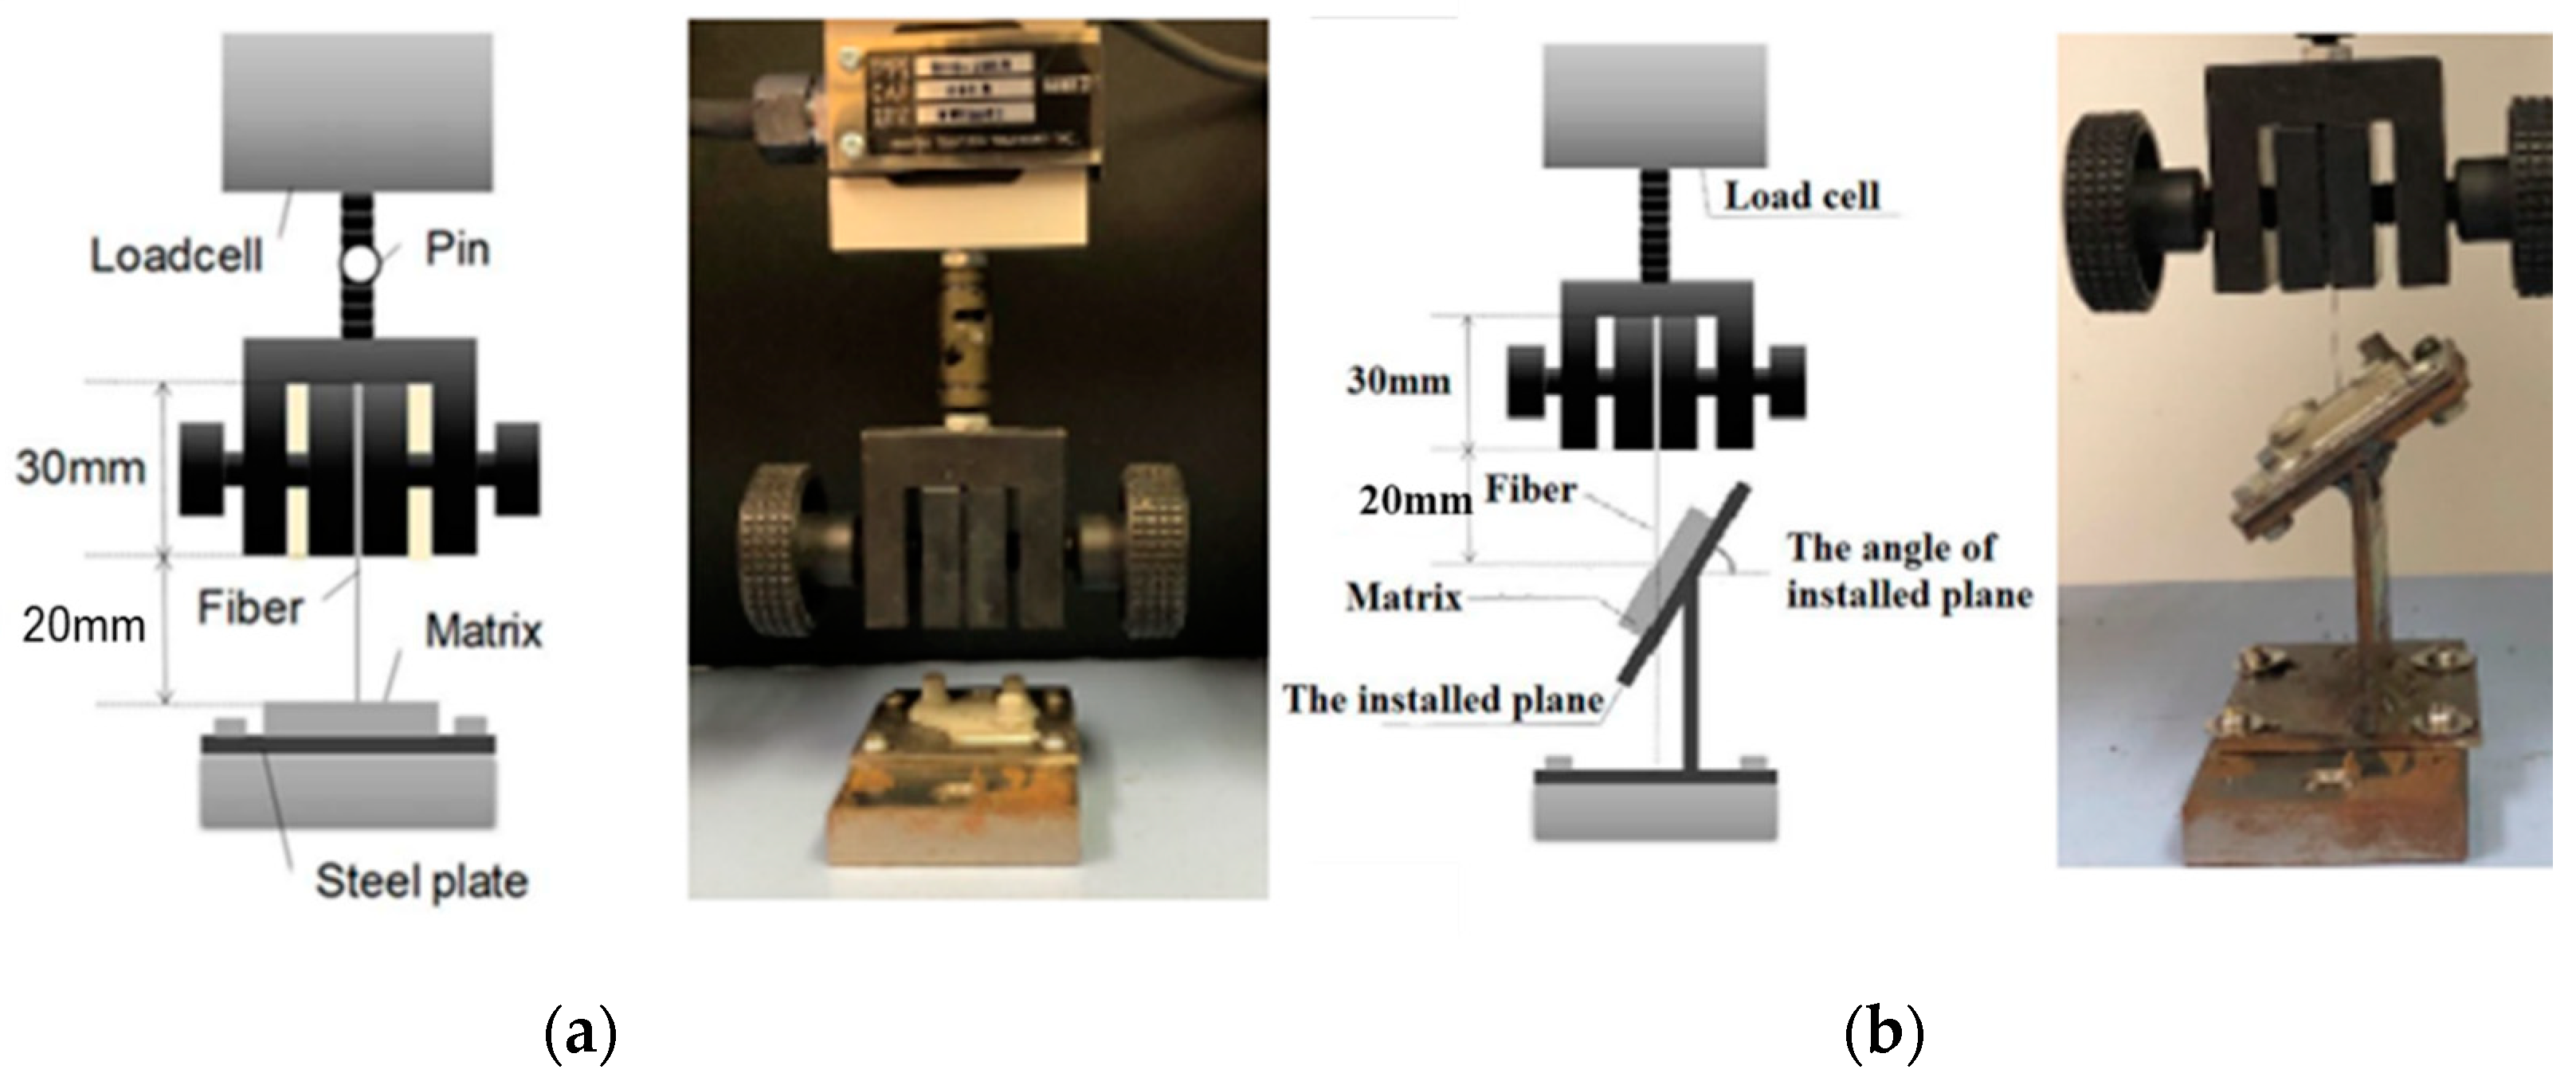
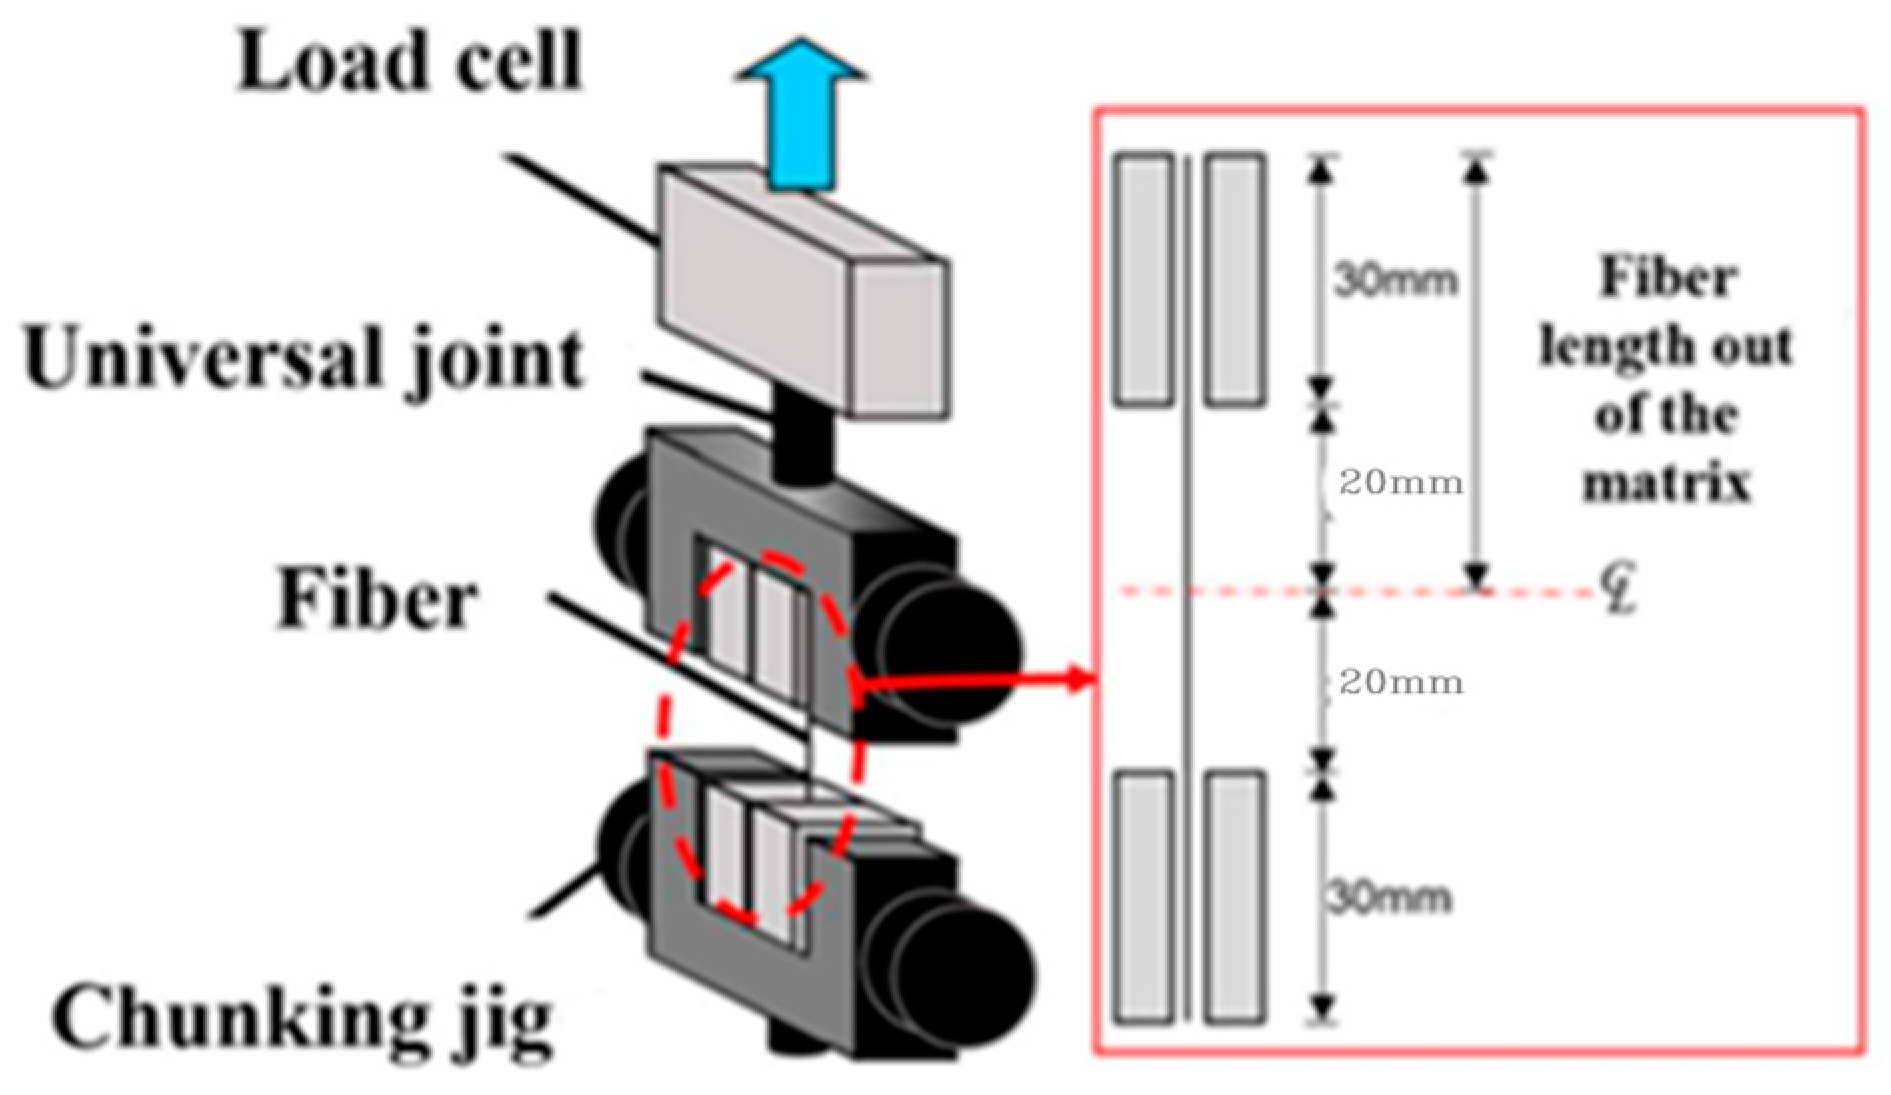
2.3. Specimens for Single Fiber Pullout Test of Palm Fiber

Figure 7 shows the mold design and the dimensions of the specimen for the pullout test of single palm fiber. The specimen mold consists of three rubber plates sandwiched between two acrylic plates and tightened with bolts. The specimen is formed of a matrix with a single fiber implanted in the center. The dimension of the specimens in the plane section is 30 × 30 mm, as shown in Figure 6. The embedded length (2, 4, and 6 mm) and fiber inclination angle (0, 15, 30, 45, and 60°) are the main parameters for this research. Since the palm fiber has an average length of 12 mm, embedded lengths smaller than half of the fiber length were chosen. The embedded length of the fiber, which is equal to the thickness of the specimen, is adjusted by the thickness of the rubber plate at the center. Table 2 shows the list of parameters and the number of specimens adopted in this research.

2.4. Loading and Measurement

A single fiber pullout test was conducted using an electronic system universal testing machine (LSC-02/30-2, Tokyo Testing Machine Co., Ltd., Tokyo, Japan) with a capacity of 200 N. As shown in Figure 8, the specimen was attached to a steel plate prepared for each inclination angle by bolting the steel plate bonded to the specimen, and the single fiber was directly clamped by the gripping chuck. The fiber length out of the matrix was set to 50 mm. The pullout load and head displacement of the testing machine were recorded.

3. Test Result and Modeling Pullout Behavior

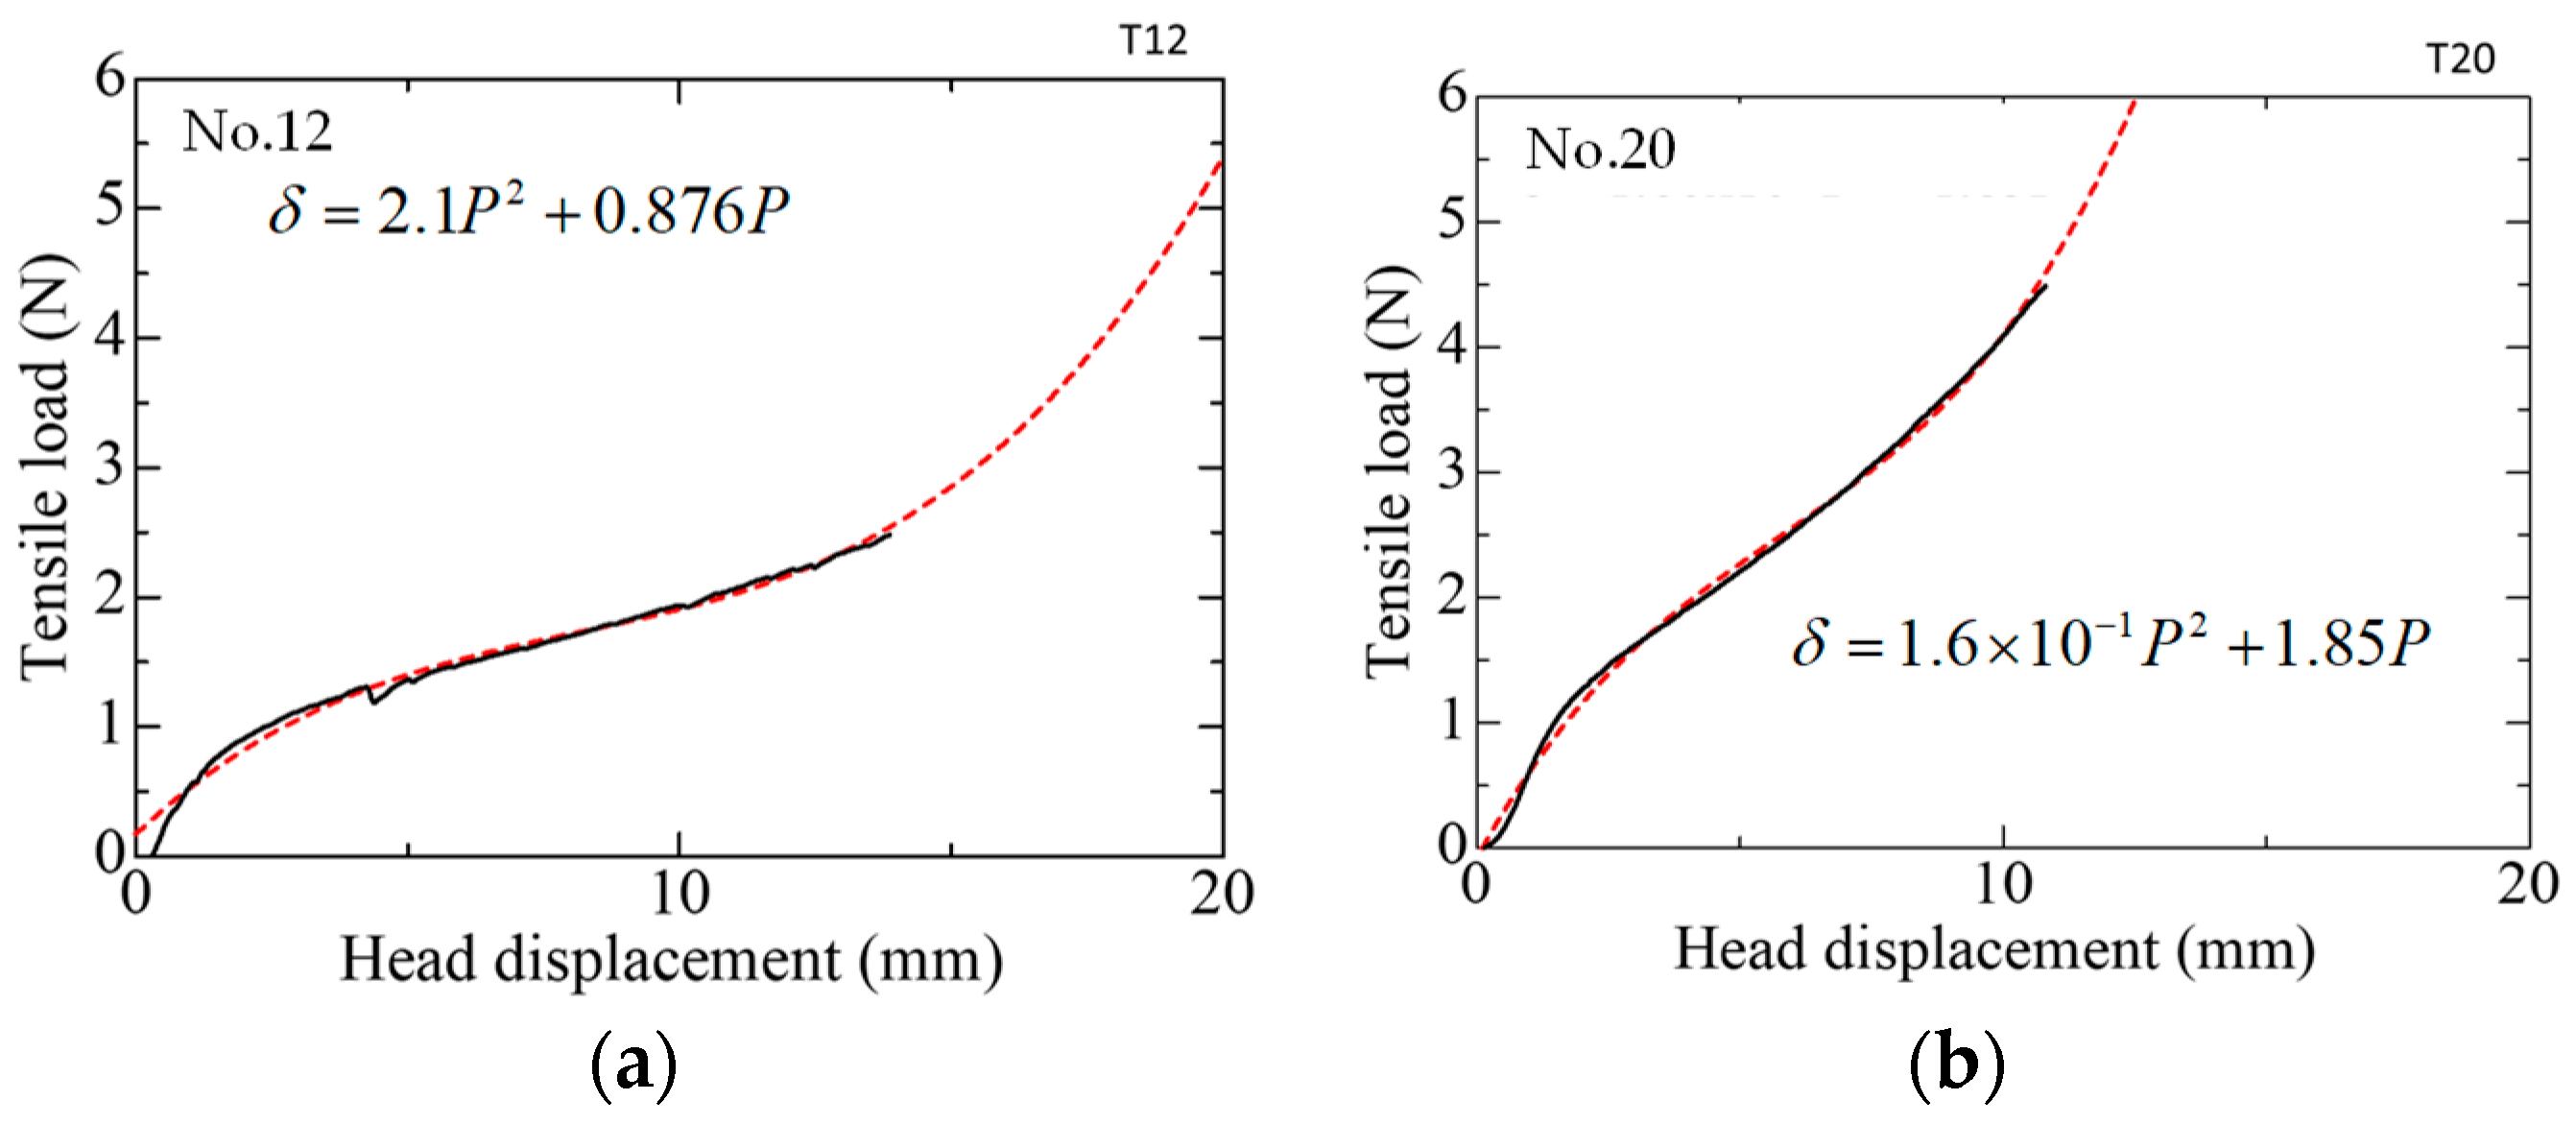
3.1. Uniaxial Tension Test for Single Palm Fiber

Preliminary to the single fiber pullout test, a uniaxial tension test was conducted on a single palm fiber to derive an expression for predicting the elongation of the fiber outside the matrix. This test involved a single fiber pullout analysis in which the slip was determined by subtracting the elongation of the fiber outside the matrix from the head displacement of the testing machine. Thirty sample fibers were subjected to testing.
The fiber was directly clamped by the chunking jig at both ends, and the fiber length was 100 mm, which is twice the length outside the matrix section in the single fiber pullout test. A monotonic tensile loading was applied using the same testing machine, as shown in Figure 9.
Figure 10 shows the results of the uniaxial tension test, and Figure 11 shows examples of the approximate equation of the tensile load–head displacement relationship. The approximate equation of the tensile load–head displacement relationship up to the maximum load for each test result was obtained by the least-squares method. In the figure, the solid line represents the test result, while the dashed lines depict the approximations. It is assumed that the variability in the test results occurred due to the difference in fiber diameter and the section of extraction of the fiber. The cause of these variations is considered to be unavoidable for natural fibers. Some show an increase and decrease in the tensile load; this is assumed to be due to the decomposition of the cellulose microstructure of the palm fiber.
Given that the fiber under investigation is a natural cellulose material with varying diameters, the elongation of the fiber outside the embedment region in the pullout test is determined as follows. The elongation at a tensile load of 0.5 N is determined for each fiber based on the uniaxial tension test results. The equation with the closest correspondence to the displacement at 0.5 N in the pullout test is selected as the method for calculating fiber elongation outside the embedded region in the pullout test. Half of the value computed from the equations estimates the elongation of the fiber outside the embedment region in the pullout test. This value is then subtracted from the measured head displacement to correct for relative displacement, as Equation (1) outlines.
s = xδ/2
where s is the slip (mm), x is the recorded head displacement in the pullout test (mm), and δ is the displacement calculated by approximation from the uniaxial tension test (mm).

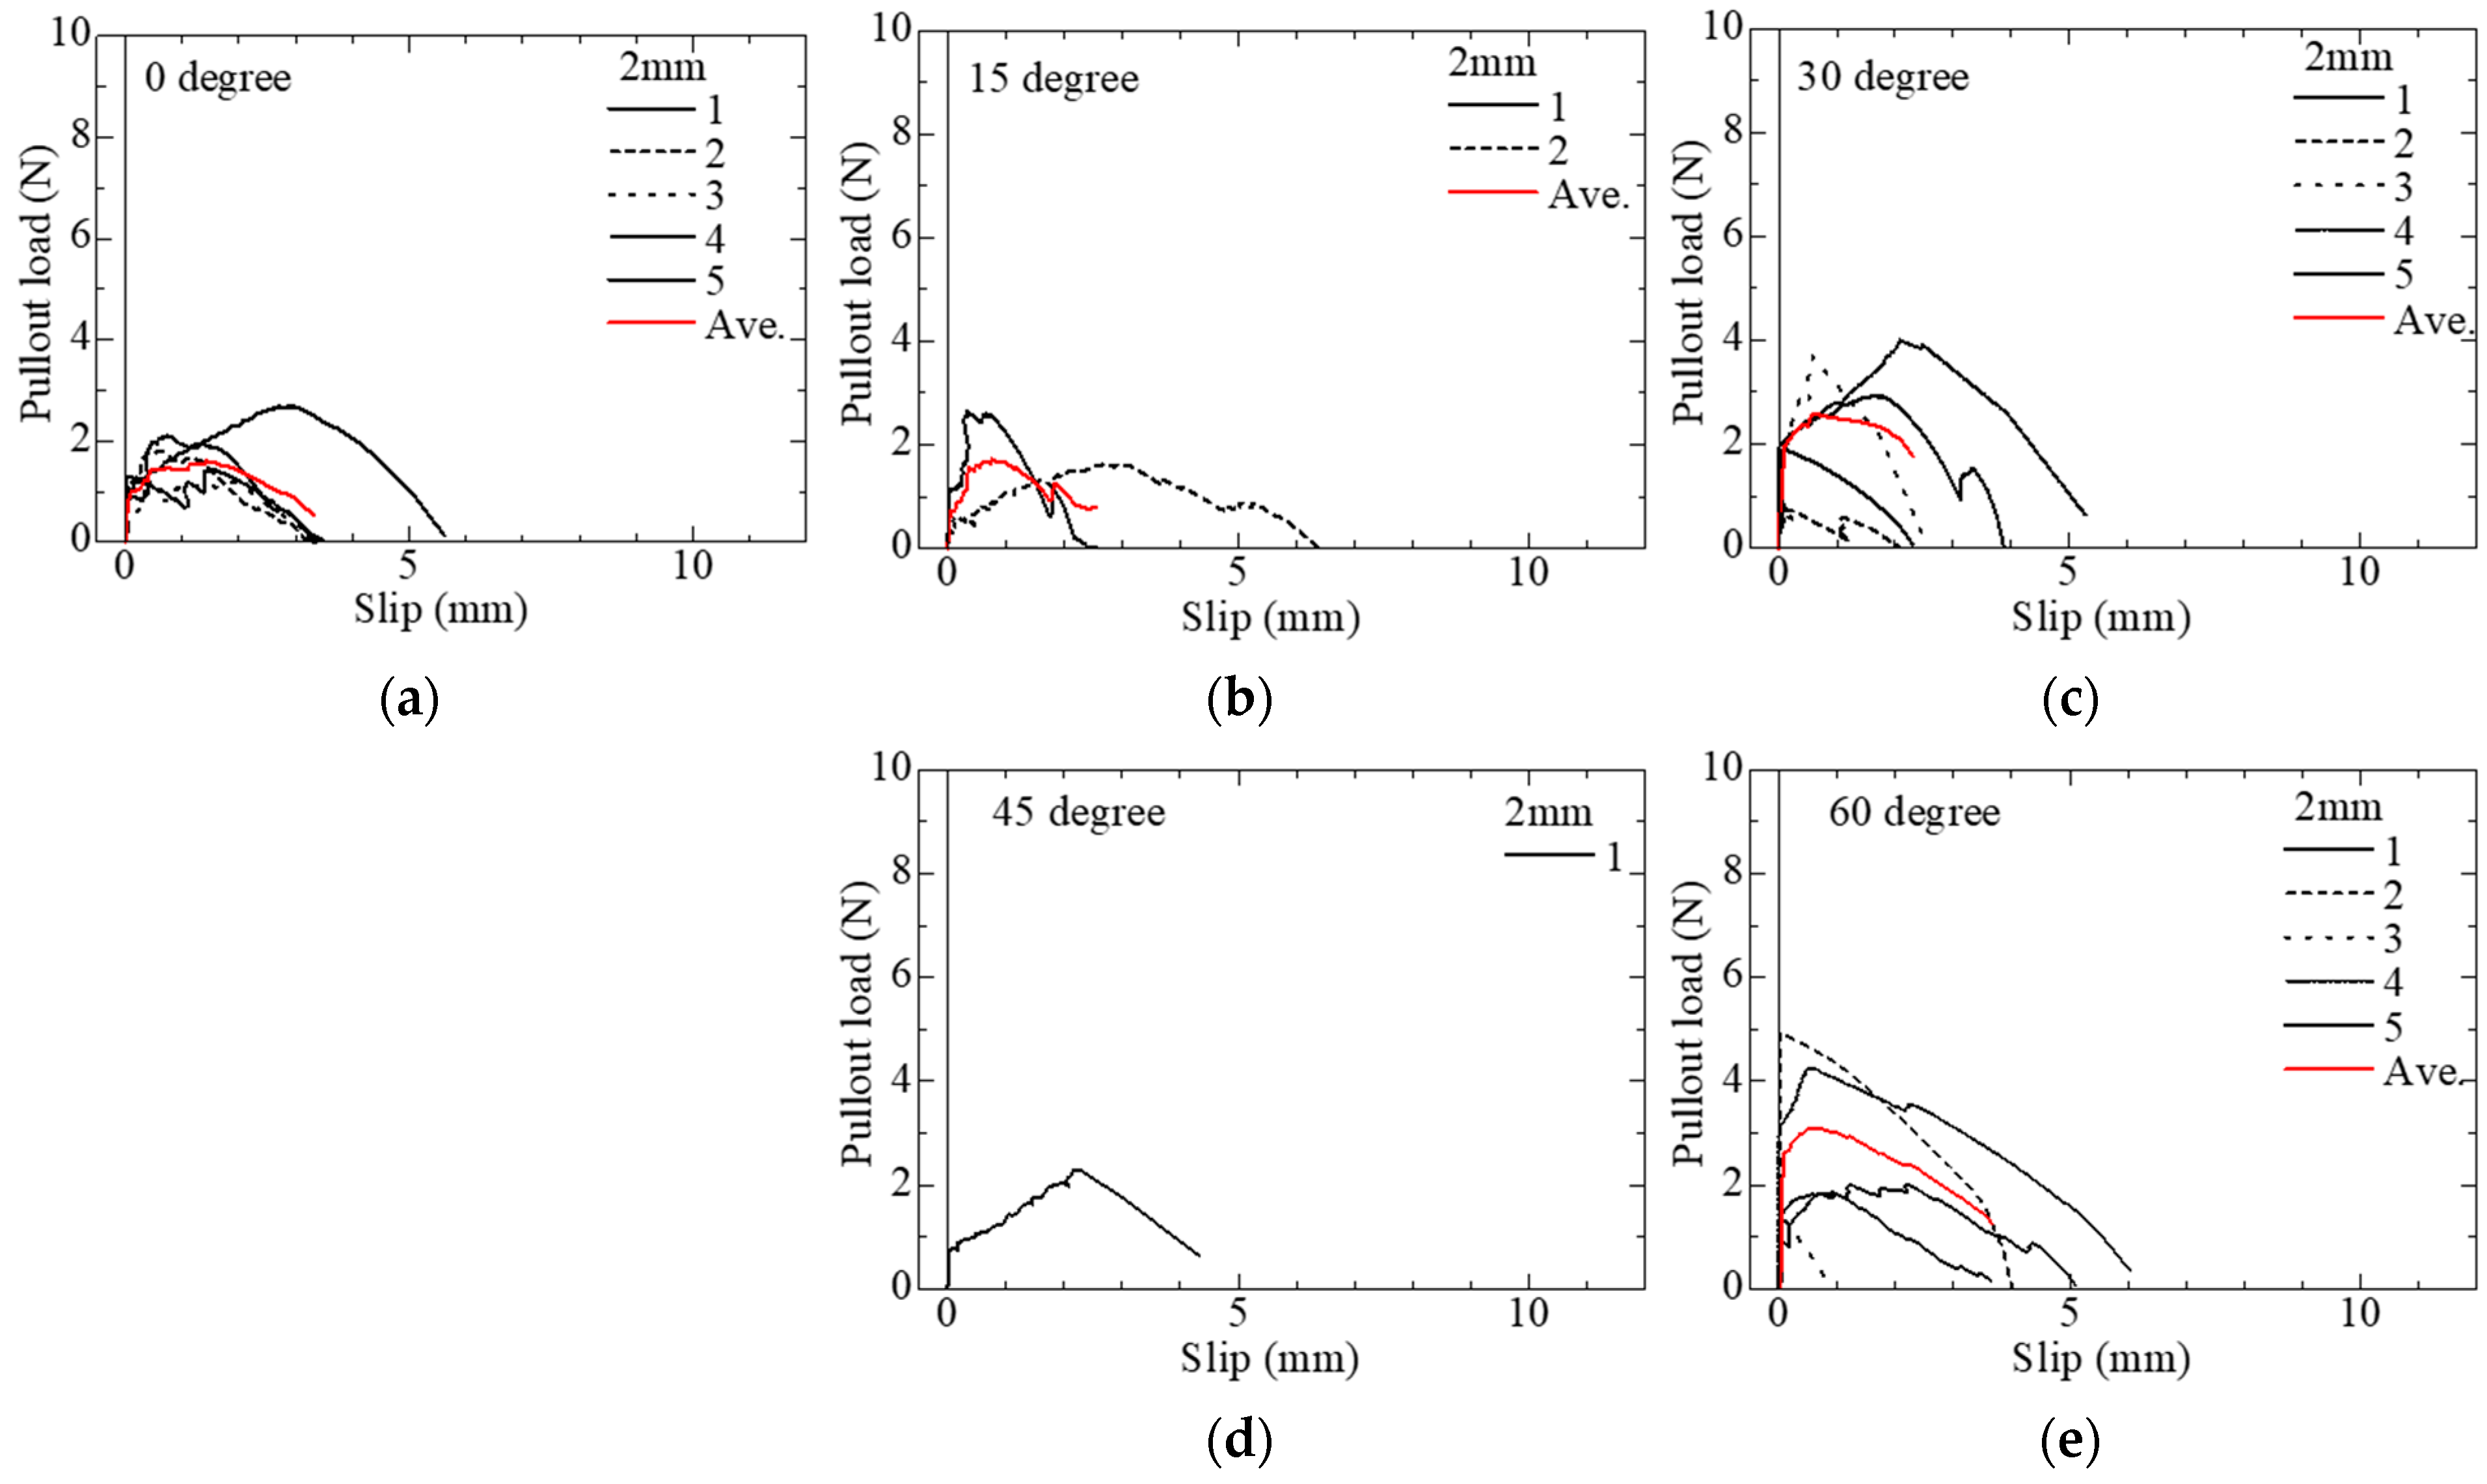
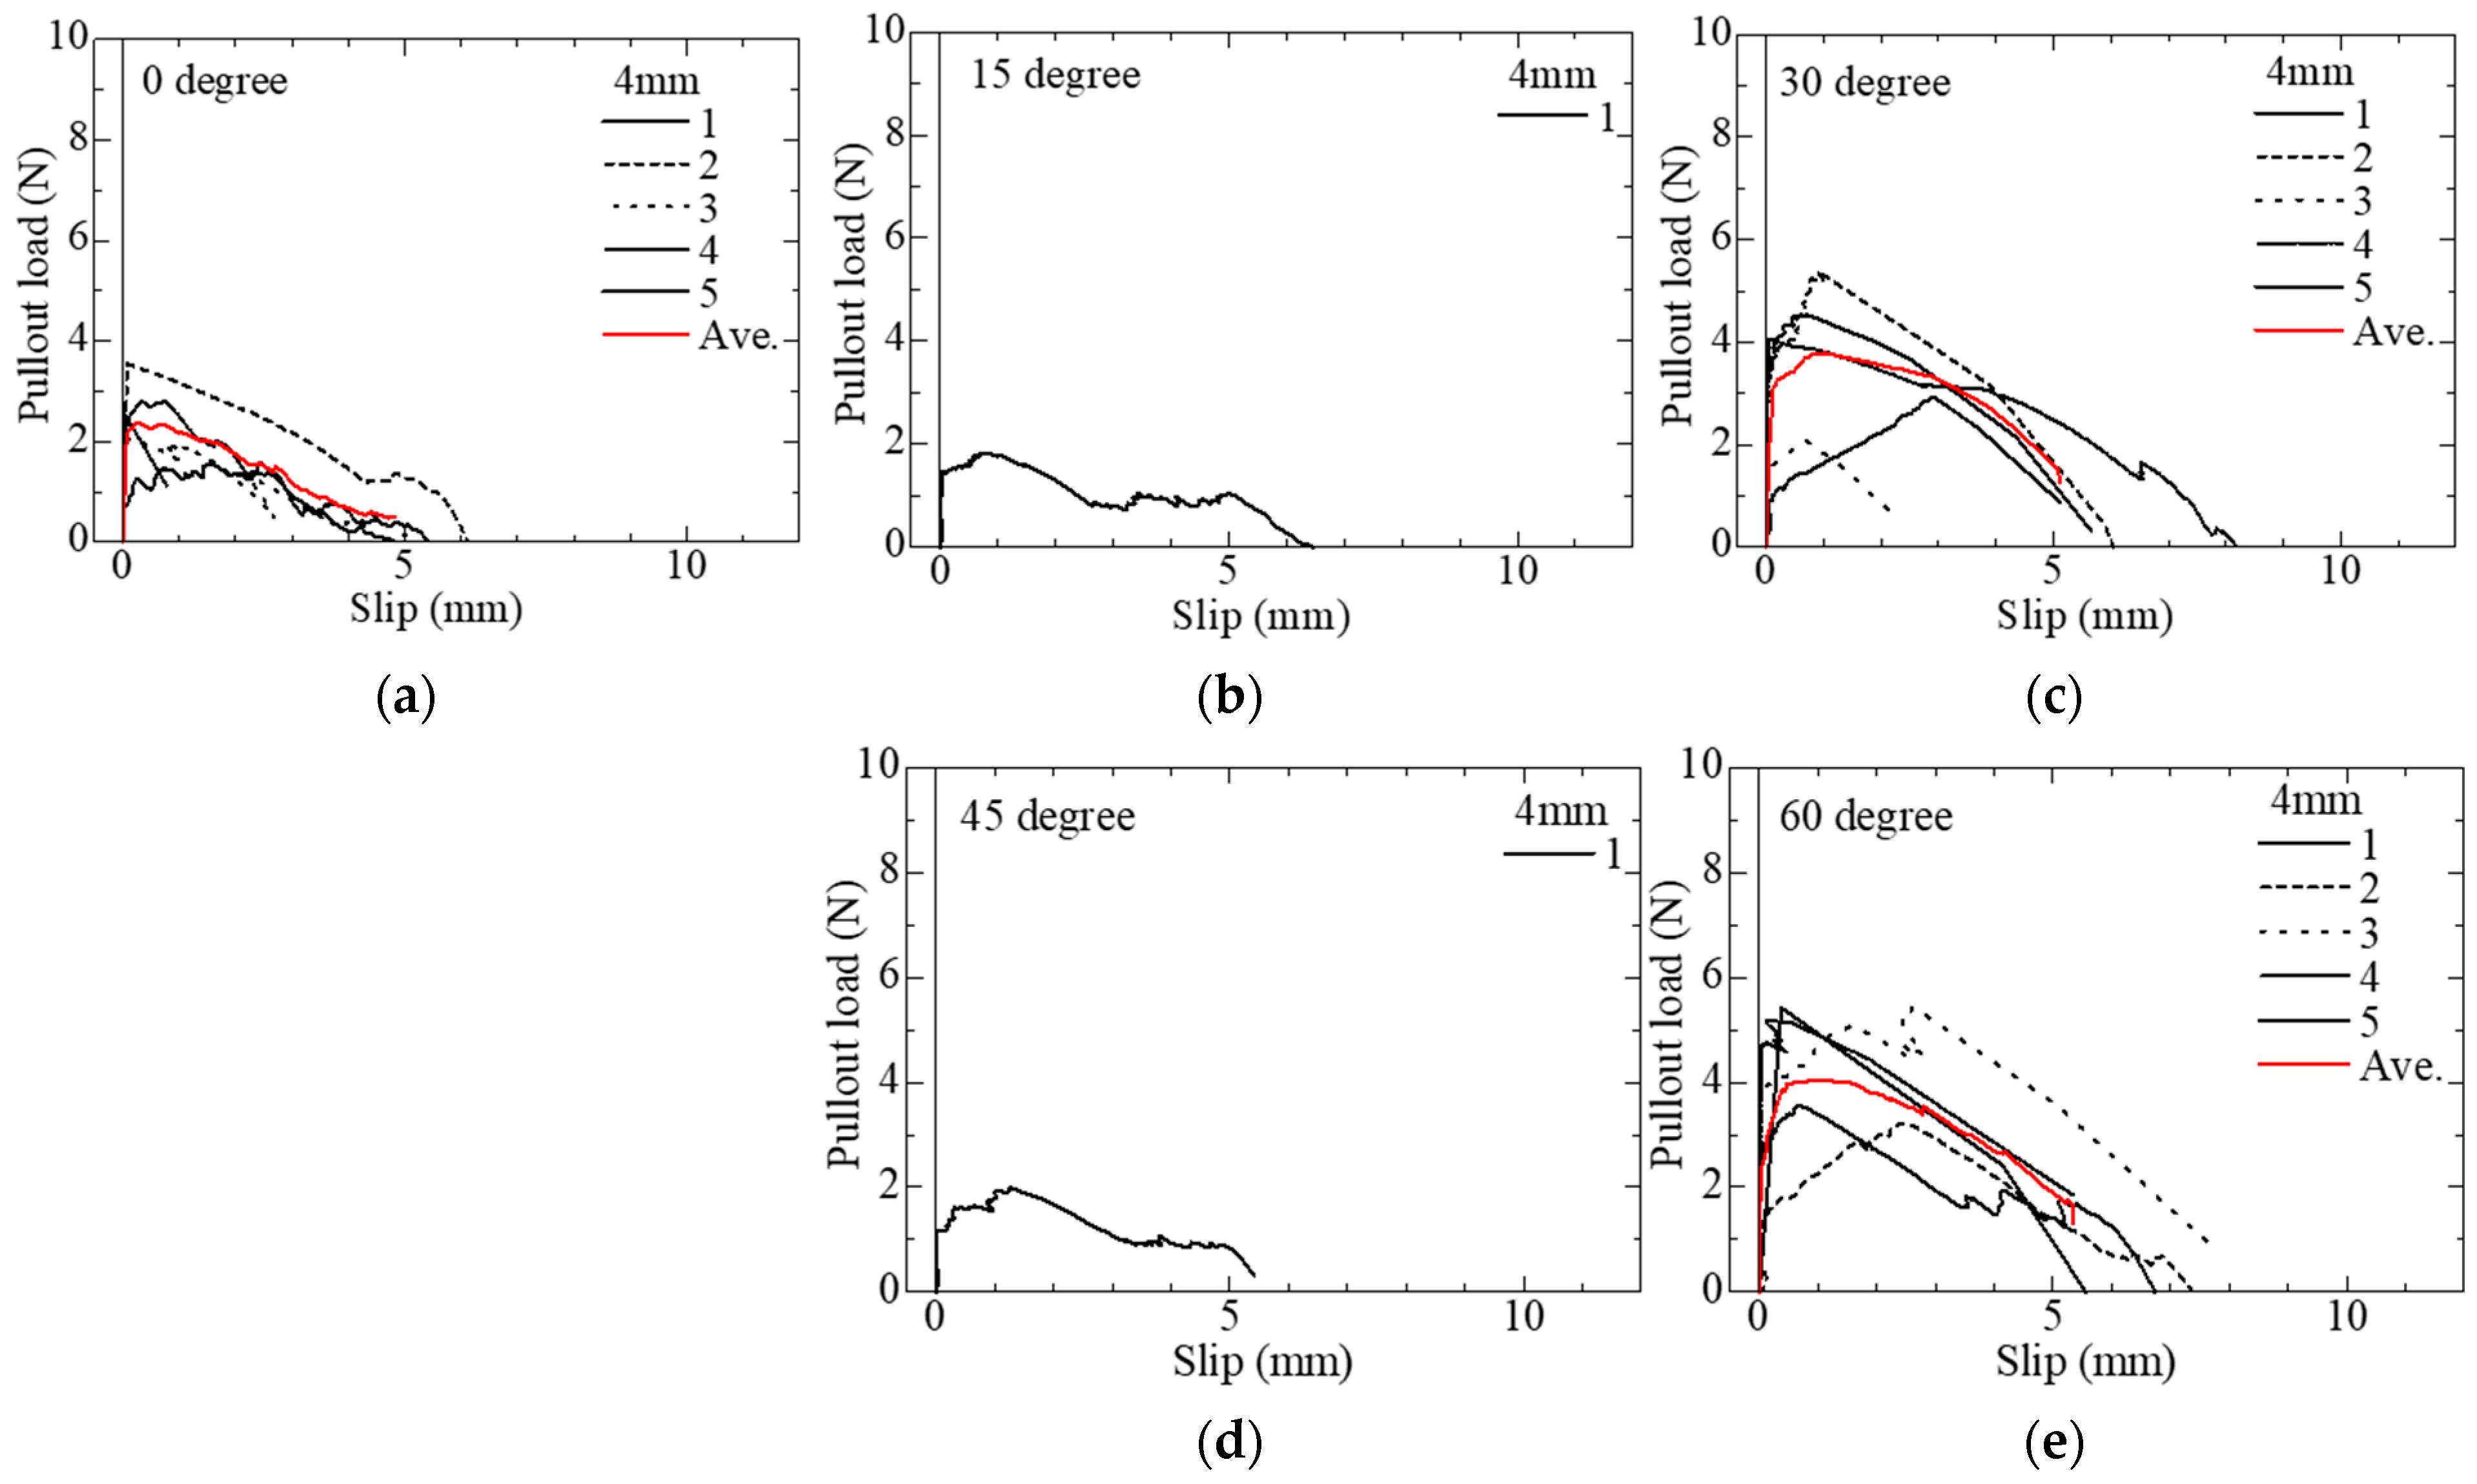
3.2. Single Fiber Pullout Test for Palm Fiber

The head displacement obtained from the pullout test includes fibers’ elongation outside the matrix’s embedded region. As described in Section 3.1, the corrected displacement obtained from the uniaxial tension test is used to adjust the slip. The corrected pullout load (P)–slip (s) relationship obtained from the pullout test is shown in Figure 12, Figure 13 and Figure 14. Due to the fiber diameter dispersion, it can be observed that there are some differences between fiber pullout load results even under the same parameters. A total of seventy-five specimens were prepared, as presented in Table 2, but only fifty-seven were tested because specimens were broken during demolding before loading.
It is assumed that the microscale adhesion progresses with the pullout, and when it detaches throughout the entire embedded length, the load decreases once. The surface of the fiber is somewhat roughened and has irregularities after the chemical adhesion is detached. The frictional resistance to pullout is polarized depending on the degree of irregularities, leading to two scenarios: an increase in load followed by rupture or a gradual decrease in load as the fiber continues to be pulled out from the matrix. Here, the load and slip at the loss of chemical adhesion are defined as the first peak load (Pa) and slip (Sa), and the maximum load and slip as Pmax and Smax, respectively. These experimental values are presented in Table 3, Table 4 and Table 5. The tables also include the measured thickness of the embedded length near the fiber pore after completing the loading of each specimen. The failure mode is categorized into pullout (PO) and rupture (R).

3.3. Single Fiber Pullout Model

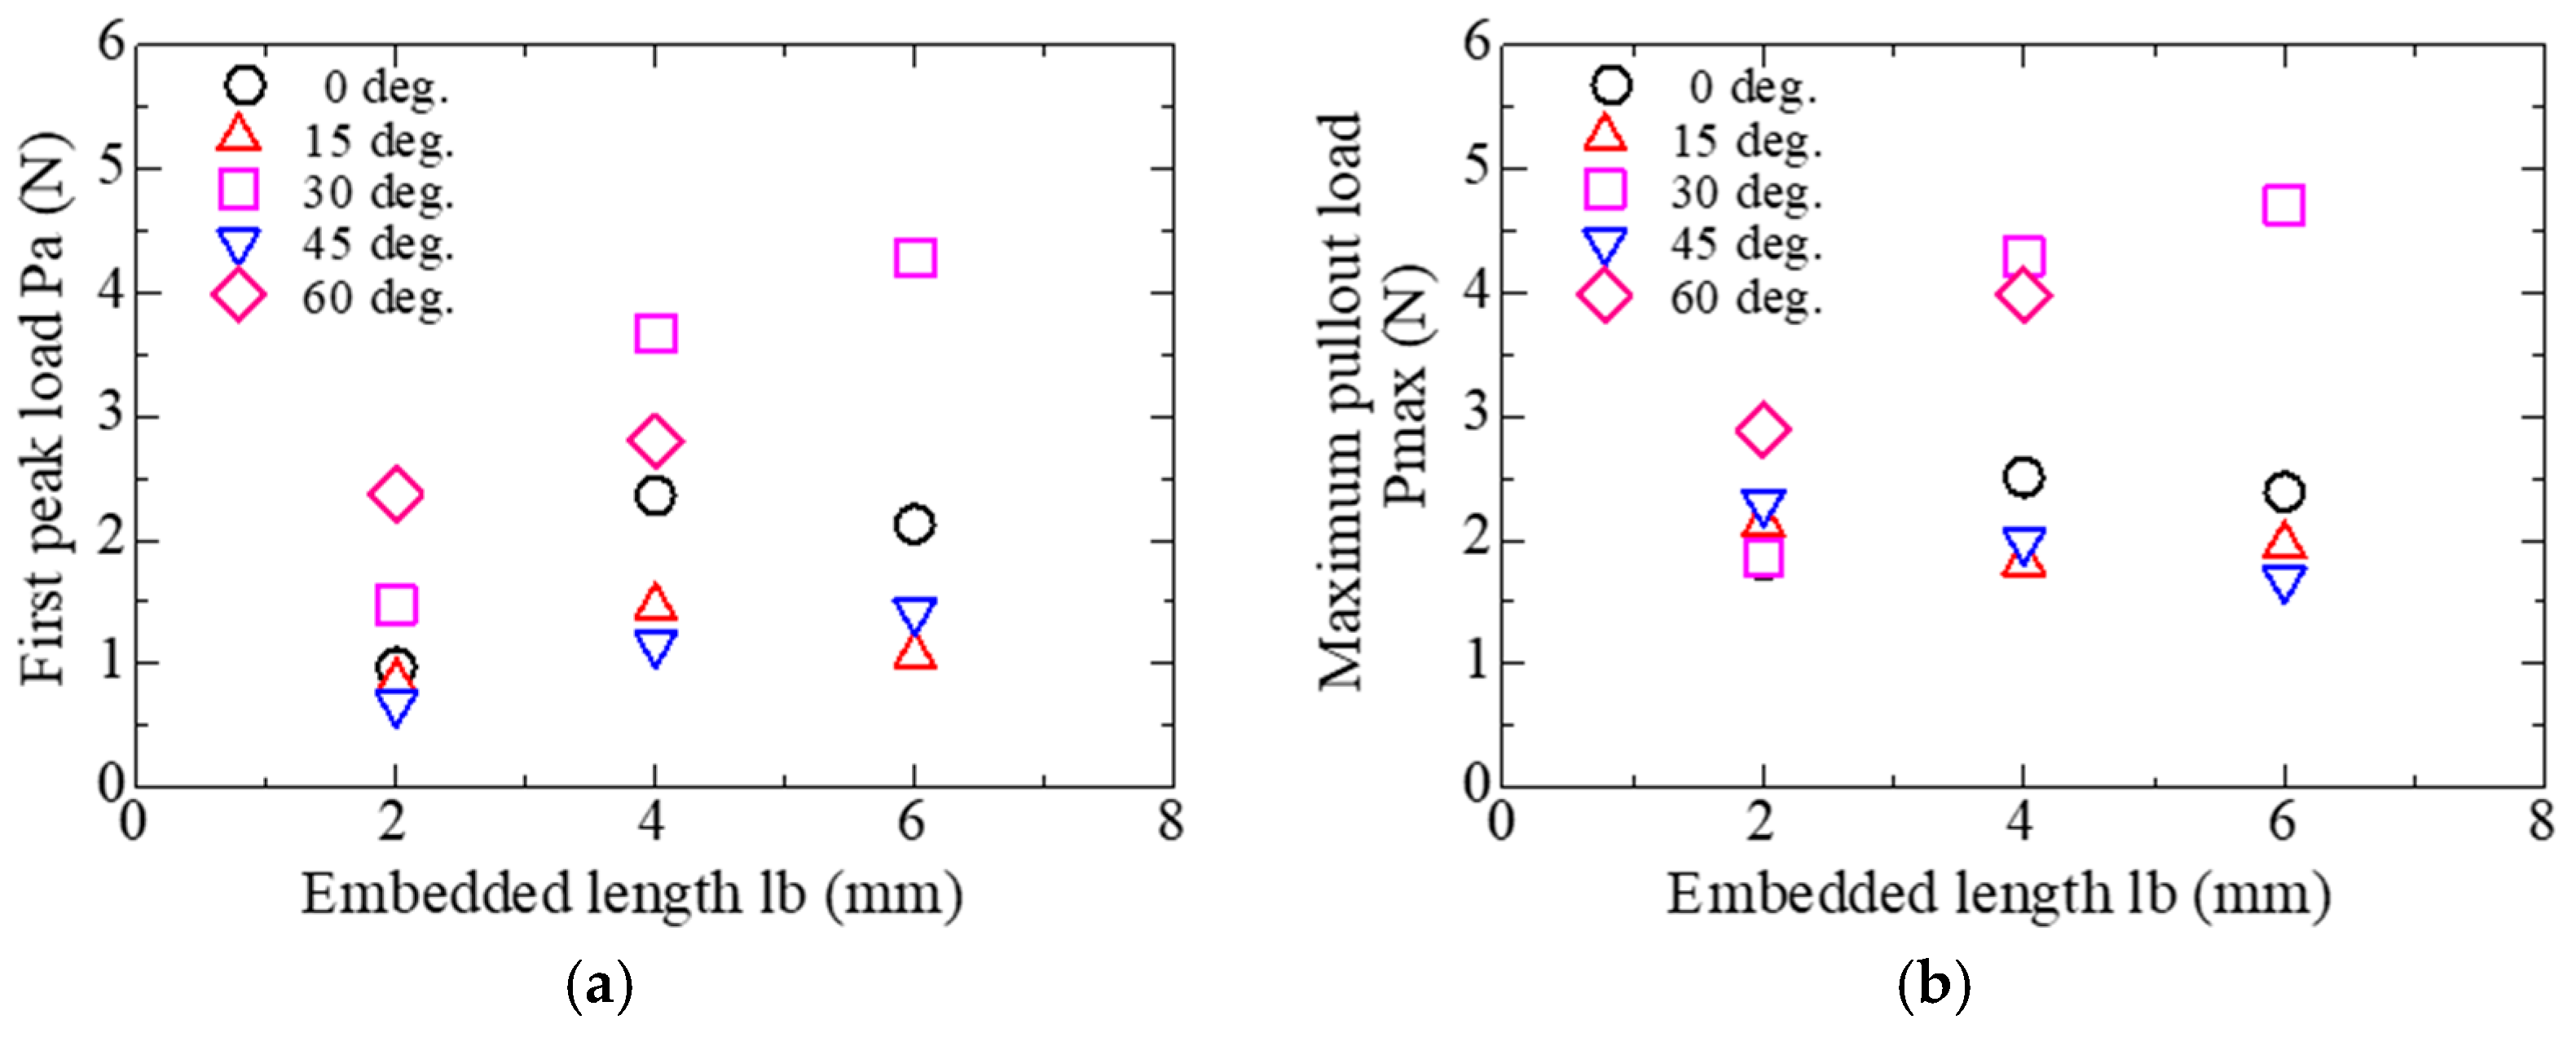
3.3.1. Evaluation of Pullout Load

The relationship between the first peak load (Pa) and the maximum load (Pmax) to the embedded length for all specimens is shown in Figure 15. The plots show the averaged values of the pullout load of the specimens in which their failure mode is pullout (PO). Specimens with 15° and 45° angles of inclination contain fewer numbers due to specimen failure before loading. For specimens with some series of inclination angles, an increase in the first peak load and the maximum load with the increase in the inclination angle and embedded length was observed. This is caused by the increase in reaction force around the embedded area due to the increase in the inclination angle and embedded length. For specimens with fewer number series, a clear increase was not distinctly observed.

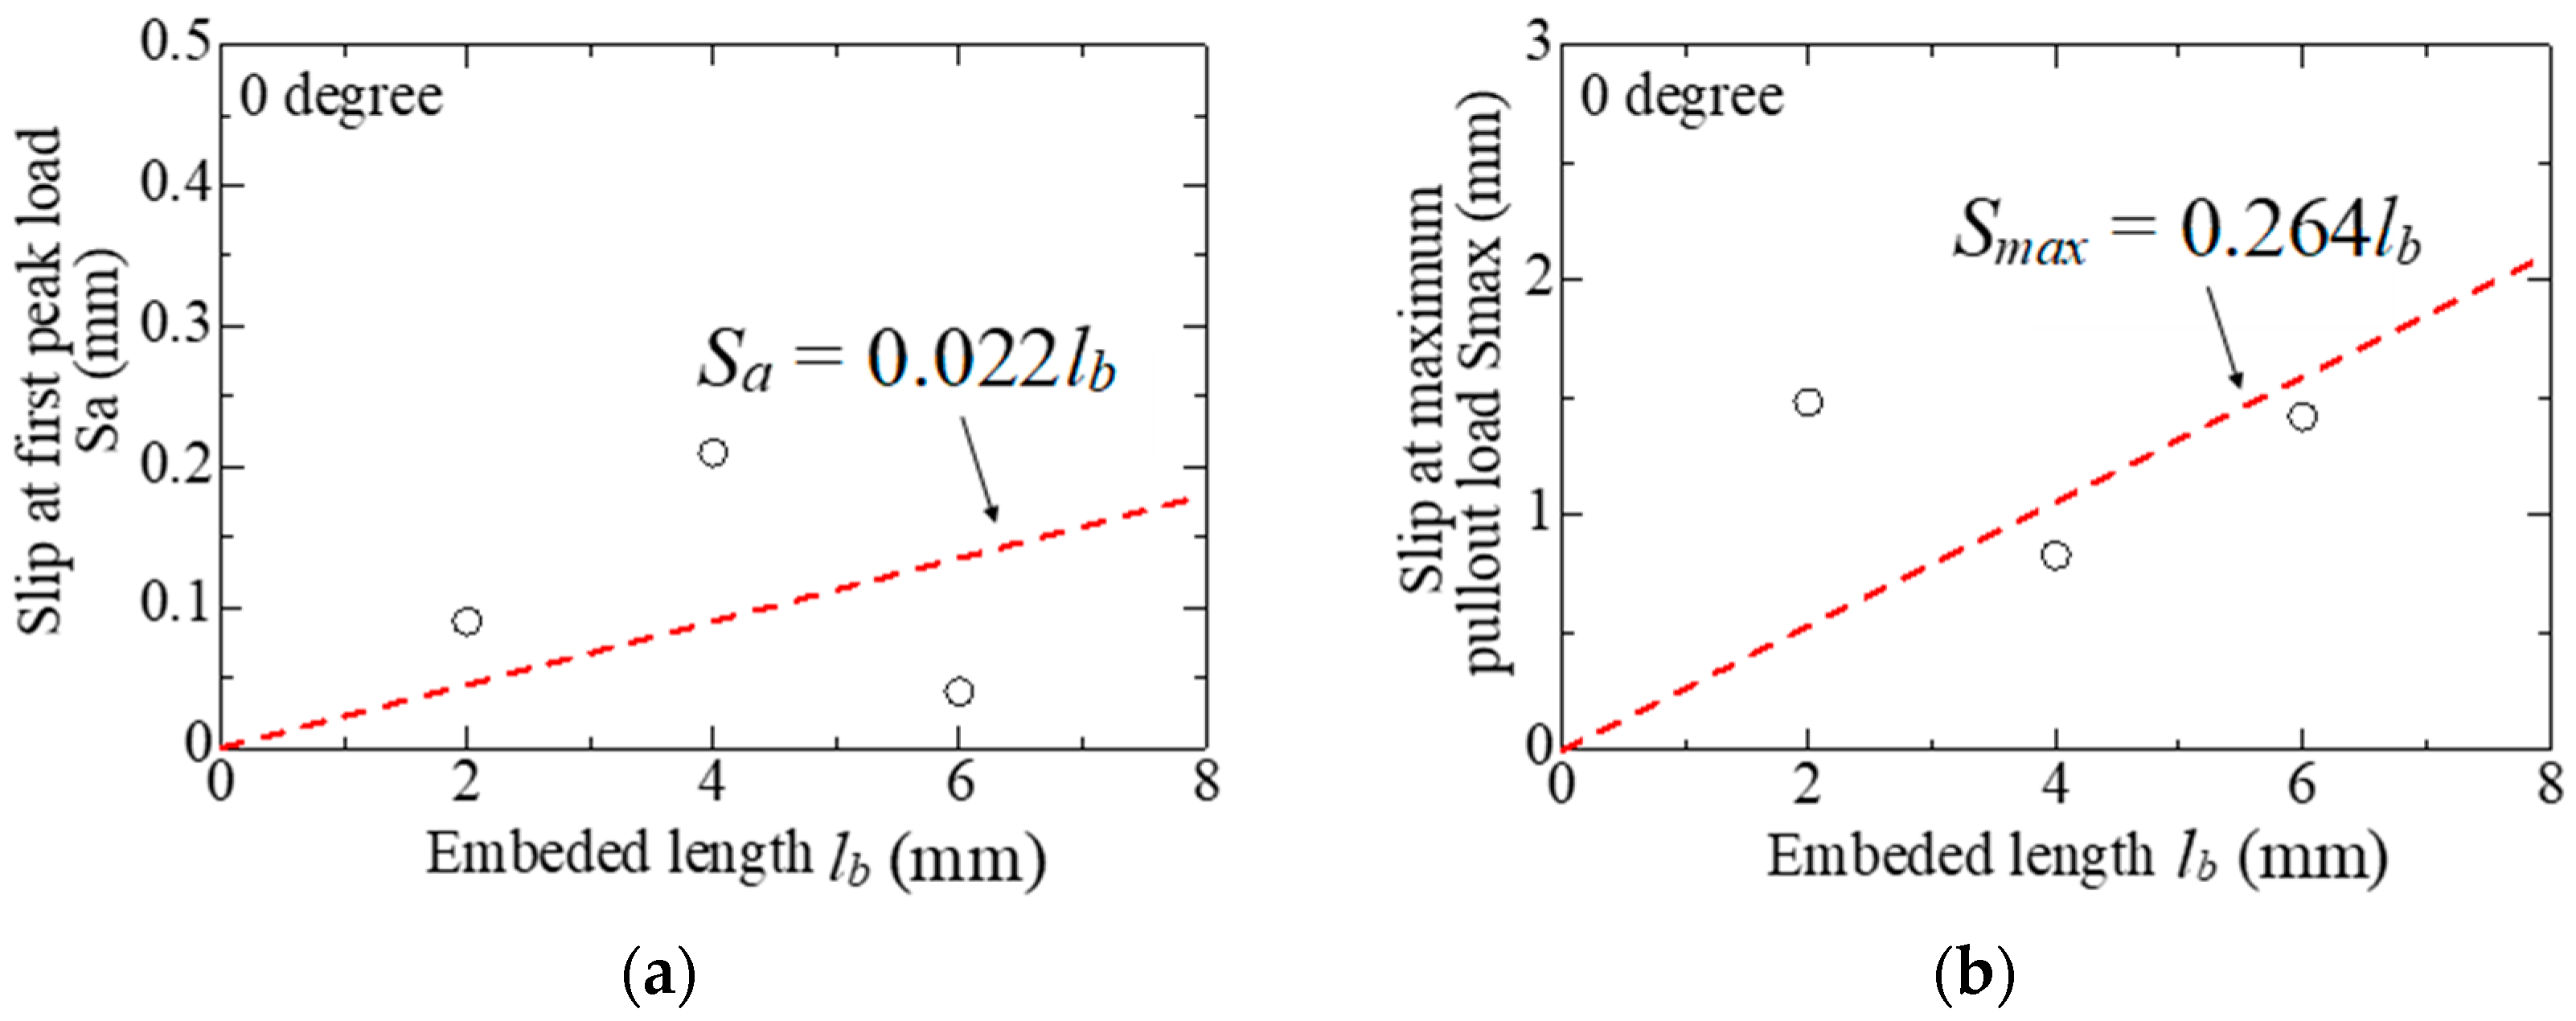
3.3.2. Evaluation of Slip

The relationship between slip values, Sa, slip at the first peak load and Smax, slip at the maximum load, and the embedded length for all specimens is shown in Figure 16. As the inclination angle increases, there is an apparent increase in the slip at the maximum load for specimens with embedded length variation. The figure does not show a clear correlation between slip values and embedment length. The significant variability in experimental data makes it challenging to assess correlations for each parameter individually.

3.3.3. Snubbing Effect

In FRCC, when fibers have an orientation angle (θ), a snubbing effect has been reported in previous studies [57,58,59]. This effect leads to an apparent increase in pullout resistance due to concentrated reaction forces at the fiber embedding edge. To quantitatively express the snubbing effect, a snubbing coefficient (f) has been introduced [58]. The maximum pullout load, accounting for the snubbing effect, can be represented using the snubbing coefficient in the form of Equation (2).
Pmax = P0efθ
where Pmax is the maximum pullout load, P0 is the load at an inclination angle of 0°, f is the coefficient of the snubbing effect for pullout load, and θ is the inclination angle.
As shown in Equation (2), the definition of the snubbing coefficient indicates the degree of increase in the maximum pullout load. However, when the fiber ruptures before reaching the maximum pullout load, the load value cannot be evaluated. In the case of determining the snubbing coefficient from experimental results, the data for ruptured loads need to be excluded. For the first peak load, the first peak load Pa is normalized by the average of the first peak load Pa,0 for specimens with an inclination angle of 0°. The relationship between the normalized load and the inclination angle is shown in Figure 17. The curves in the figure represent the results of approximating Equation (2) using the least squares method, yielding a snubbing coefficient f of 0.31. Similarly, for the maximum pullout load, the relationship between the normalized load and the inclination angle is illustrated in Figure 18, resulting in a snubbing coefficient f of 0.42. In both cases, the snubbing coefficients are nearly similar, suggesting that the influence of the first peak load is also a significant factor in determining the snubbing coefficient. The average of the two, which is 0.35, is used in the bridging law calculation in Section 4.

3.3.4. Apparent Fiber Strength

In the single fiber pullout test, fiber rupture was observed in some specimens. The reduction of apparent fiber strength due to surface roughening is expressed using the fiber strength reduction coefficient f′ in the following equation [57,58].
σfu = σnfue−f’.θ
where σfu is the apparent strength of the fiber, σnfu is the rupture strength at an inclination angle of 0°, f′ is the apparent fiber strength reduction factor, and θ is the inclination angle.
The relationship between the rupture strength, calculated by dividing the maximum pullout load in specimens with confirmed fiber rupture by the average fiber cross-sectional area, and the inclination angle is illustrated in Figure 19. The solid line in the figure represents the fitted curve. The intercept of the fitted equation, 110 MPa, corresponds to the apparent fiber strength when the angle of inclination is 0°, and the coefficient −0.006 is considered as the fiber strength reduction coefficient f′. Previous studies [57,58] reported a decrease in rupture strength with an increasing inclination angle, but experimental results show that the rupture strength increases with a larger inclination angle. This discrepancy is expected to be due to the fiber breaking during the process of increased pullout load due to the snubbing effect and the microscale composition of the natural fiber.

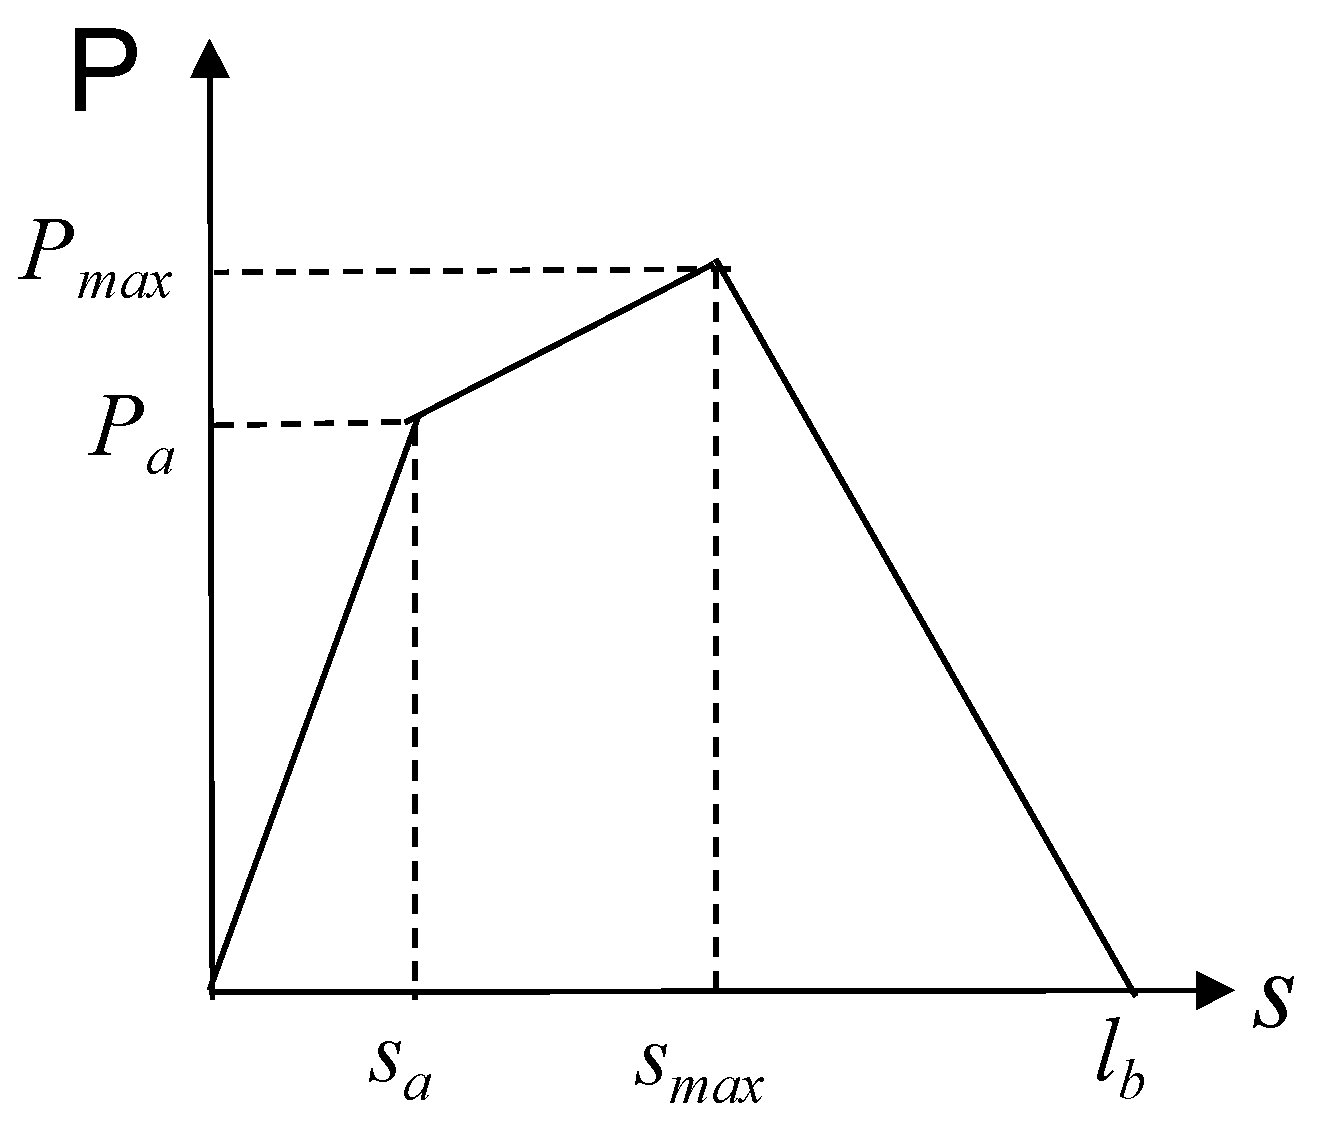
3.4. Trilinear Model of Pullout–Slip Curve

Based on the experimental results presented in the previous sections, modeling the pullout behavior of a single fiber is conducted. By summing the modeled pullout behavior of a single fiber, it becomes possible to calculate the bridging law at any cross-section of a given specimen. The pullout load–slip curve of a single fiber is modeled using a trilinear model with three linear segments, as illustrated in Figure 20 and Figure 21.
The first peak load (Pa) is the load at the point when the detachment of microscale adhesion occurs across the entire embedded length during the single fiber pullout test. After the first peak, the load increases due to frictional resistance, reaching the maximum load (Pmax). Further pullout leads to load loss when the slip reaches the embedded length (lb).
The first peak load, Pa, and the maximum pullout load, Pmax, are expressed from the pullout load–embedded length relationship for specimens with a 0° angle of inclination, as shown in Figure 21. To clearly distinguish the relationship between the first peak load and maximum pullout load with embedded length, excluding the effect of angle of inclination, specimens with 0° angle of inclination were examined, as shown in Figure 22. The data in Figure 22 show the average of pullout loads for the same embedded length. A power relationship is adopted for the relationship between the first peak load and maximum load with the embedded length. The approximate equations obtained through the least square method are represented with dashed lines in the figures.
The slip at the first peak load, Sa, and slip at the maximum load, Smax, are expressed using the slip–embedded length relationship for specimens with a 0° angle of inclination, as shown in Figure 23. The data represent the average of slips with the same embedded length. A linear relationship is adopted for the relationship between slip at the first peak load, Sa, and slip at the maximum load, Smax, with the embedded length. The approximate equations obtained through the least square method are represented with dashed lines in the figures.

4. Bridging Law of Palm-FRCC

4.1. Calculation Method

In this section, a bridging model based on the single-fiber pullout load–slip model is employed to perform bridging law calculations. The bridging law is obtained by the summation of forces carried by bridging fibers across the crack [51]. The crack width at the first peak load is set as two times the slip because the fiber slips out from both embedded sides and is expressed as in Equation (4). The maximum crack width at the maximum pullout load is set to be 1.5 times the slip and is expressed by Equation (5) [51].
wa = 2 × Sa = 2 × 0.022lb = 0.04lb
wmax = 1.5 × Smax = 1.5 × 0.264lb = 0.4lb
where wa is the crack width at the first peak load, wmax is the crack width at maximum pullout load, and lb is the embedded length.
Table 6 shows the parameters for the bridging law calculation. The calculation is conducted using a trilinear model for a single fiber, and inclined fiber angle and rupture of fiber are also considered. The orientation intensity, k, which represents the fiber orientation distribution [51], is set to be 1, assuming a random fiber orientation distribution. The principal orientation angle θr is set to be 0.

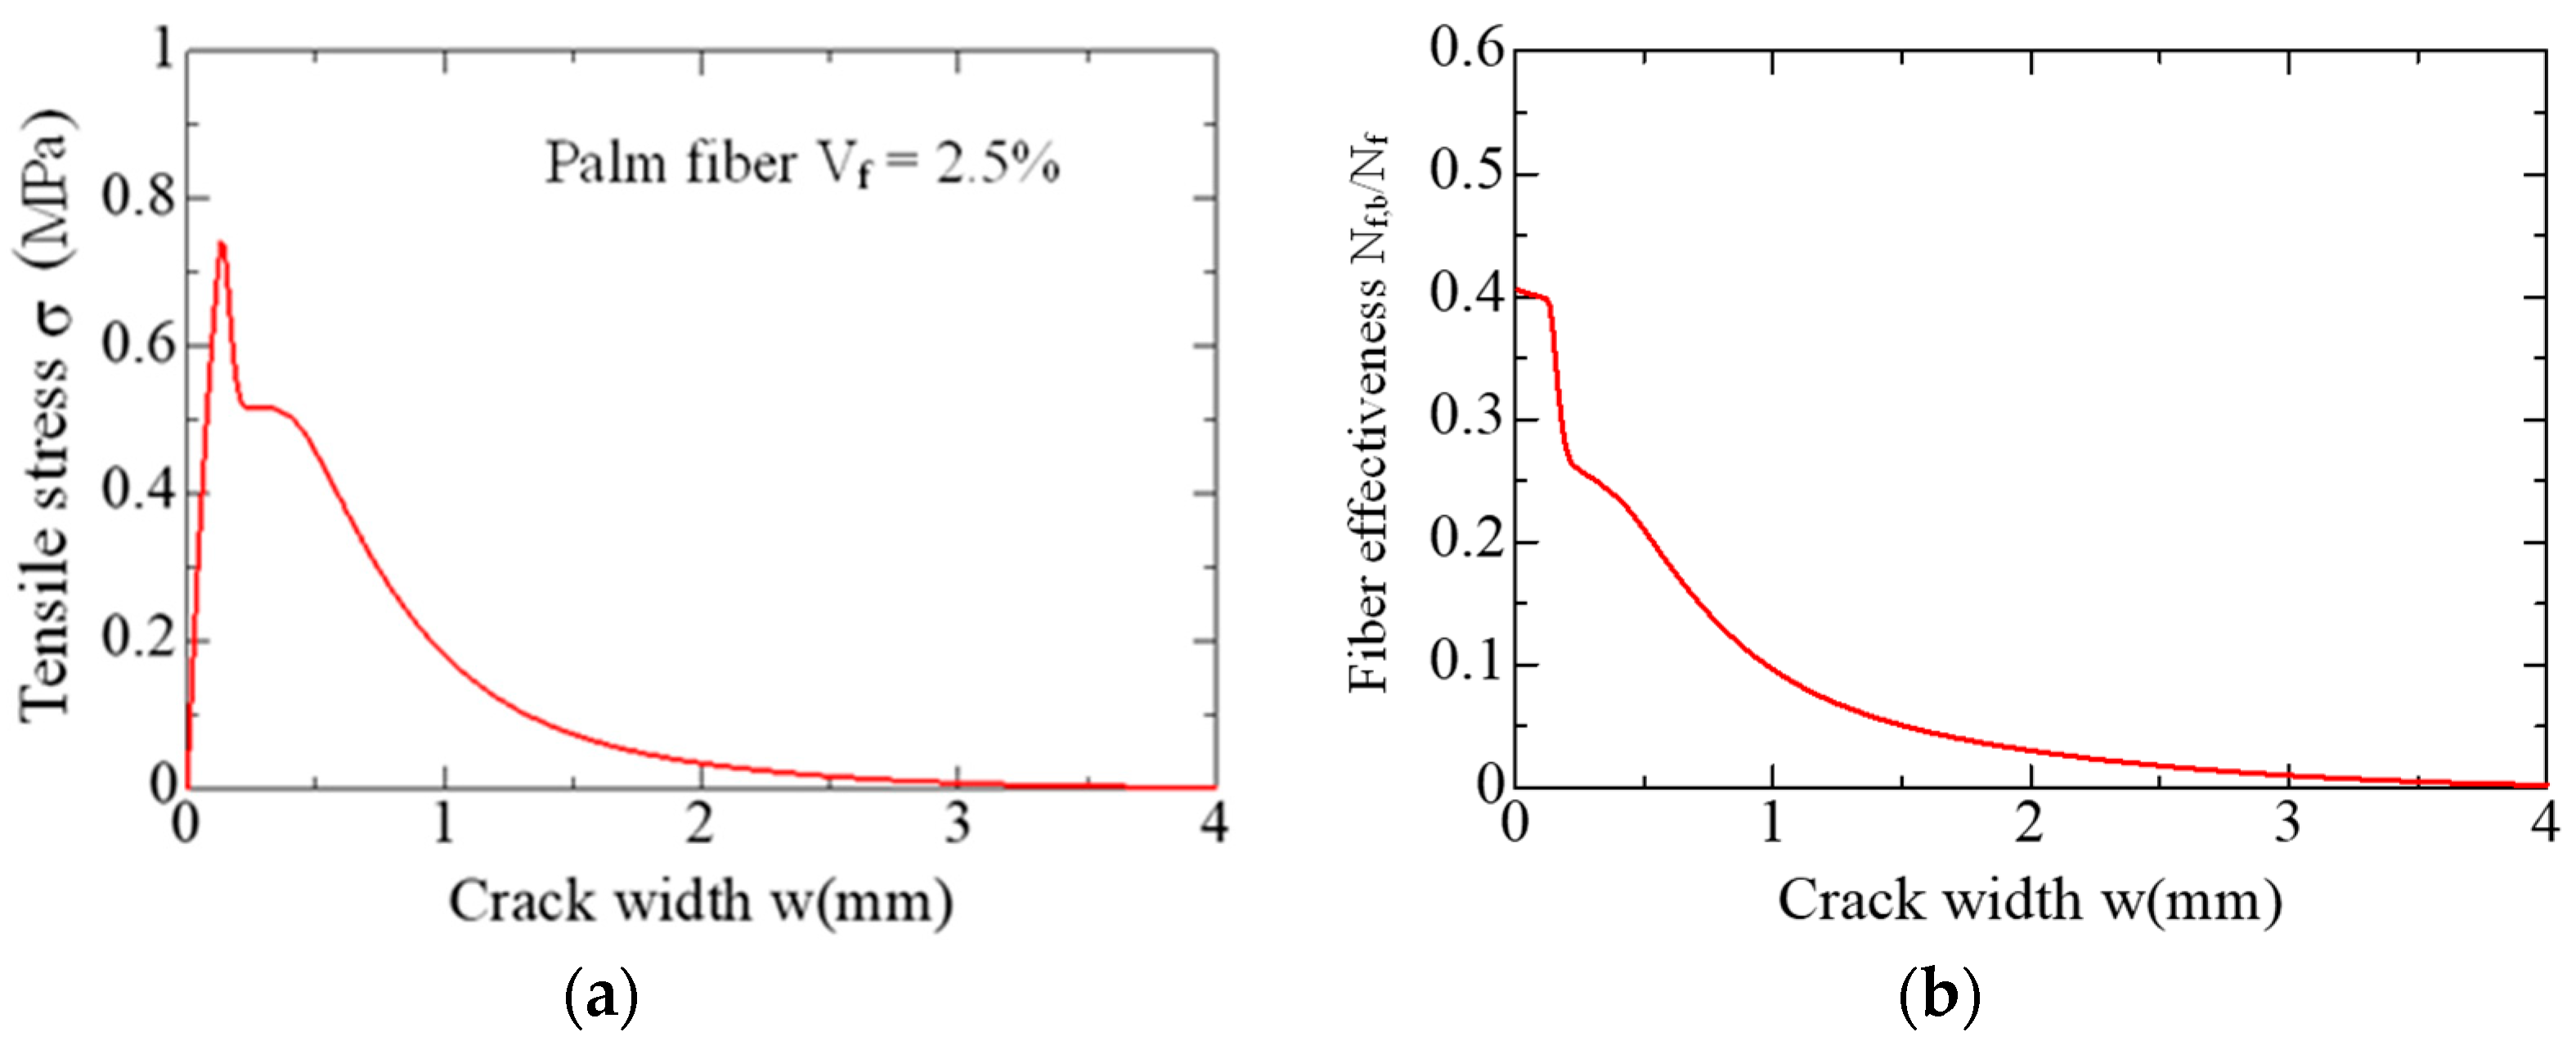
4.2. Calculation Results

The results of the calculations are shown in Figure 24. The relationship between fiber effectiveness (Nf,b/Nf) and crack width from the bridging law calculation is shown in Figure 24b. Fiber effectiveness represents the ratio of the number of effective bridging fibers that are not pulled out or ruptured and supporting bridging forces, denoted as Nf,b to the theoretical number of fibers Nf within a target volume. In Figure 24a, it is observed that the tensile stress approaches zero before the crack width reaches half of the length of the fiber, 6 mm; it is assumed that most of the fibers are ruptured before being fully pulled out of the matrix.

4.3. Adaptability Assessment of Bridging Law

4.3.1. Four-Point Bending Test

A four-point bending test with a pure bending length of 100 mm using a 500 kN universal testing machine is carried out to investigate the flexural characteristics of palm-FRCC. The specimen was a prism with a cross-section of 100 mm × 100 mm and a length of 400 mm, and three specimens with a 3% fiber volume fraction were prepared. The materials used are the same as those described in Section 2.2 and Section 2.3. Two π-type LVDTs are affixed on the side of the specimen to measure axial deformations in the constant bending moment region, as shown in Figure 25. The average curvature is determined from the disparity between upper and lower strains calculated by axial deformations.
A compression test using ϕ100–200 mm cylinder test pieces is conducted, and the results are shown in Table 7.

4.3.2. Section Analysis

The fiber volume fraction was initially set to 3% during the four-point bending test. However, it is important to note that the fibers were prepared using a shredder, and some of them turned out to be very small. Given their size, their impact on bridging characteristics was assumed to be negligible. To quantify this, the percentage of these small fibers was determined by the measurement of the weight difference of samples before and after passing through a 2 mm diameter sieve. Five samples were used, and the weights were measured, as illustrated in Figure 26. The excluded fiber percentage, based on the weight difference, was found to be 15%, as indicated in Table 8. For analysis purposes, by excluding 15% of the fiber volume fraction from that used in the four-point bending test, the fiber volume fraction was set to 2.5%.
Section analysis is conducted to assess the adaptability of the bridging law calculations in Section 4.2. The section analysis is carried out based on the assumption that a plain section remains plain. The trilinear stress–strain model for the tension side is shown in Figure 27. The points σmax, σ2, εmax, ε2, and εu in the tensile stress–strain model are defined by previously calculated bridging law. For strains, the following equations are used to convert crack width to strains. The parabolic curve is chosen for the model of the compressive stress–strain curve, with the compressive strength and strain at the maximum derived from the compression test results.
εmax = wmax/l
ε2 = w2/l
εu = wu/l
where σmax = 0.742 MPa, σ2 = 0.517 MPa, wmax = 0.006 mm, w2 = 0.3 mm, and wu = 3.5 mm. These values correspond to the results of the bridging law calculation, and l is the length of the pure bending moment region in the four-point bending test (=100 mm).

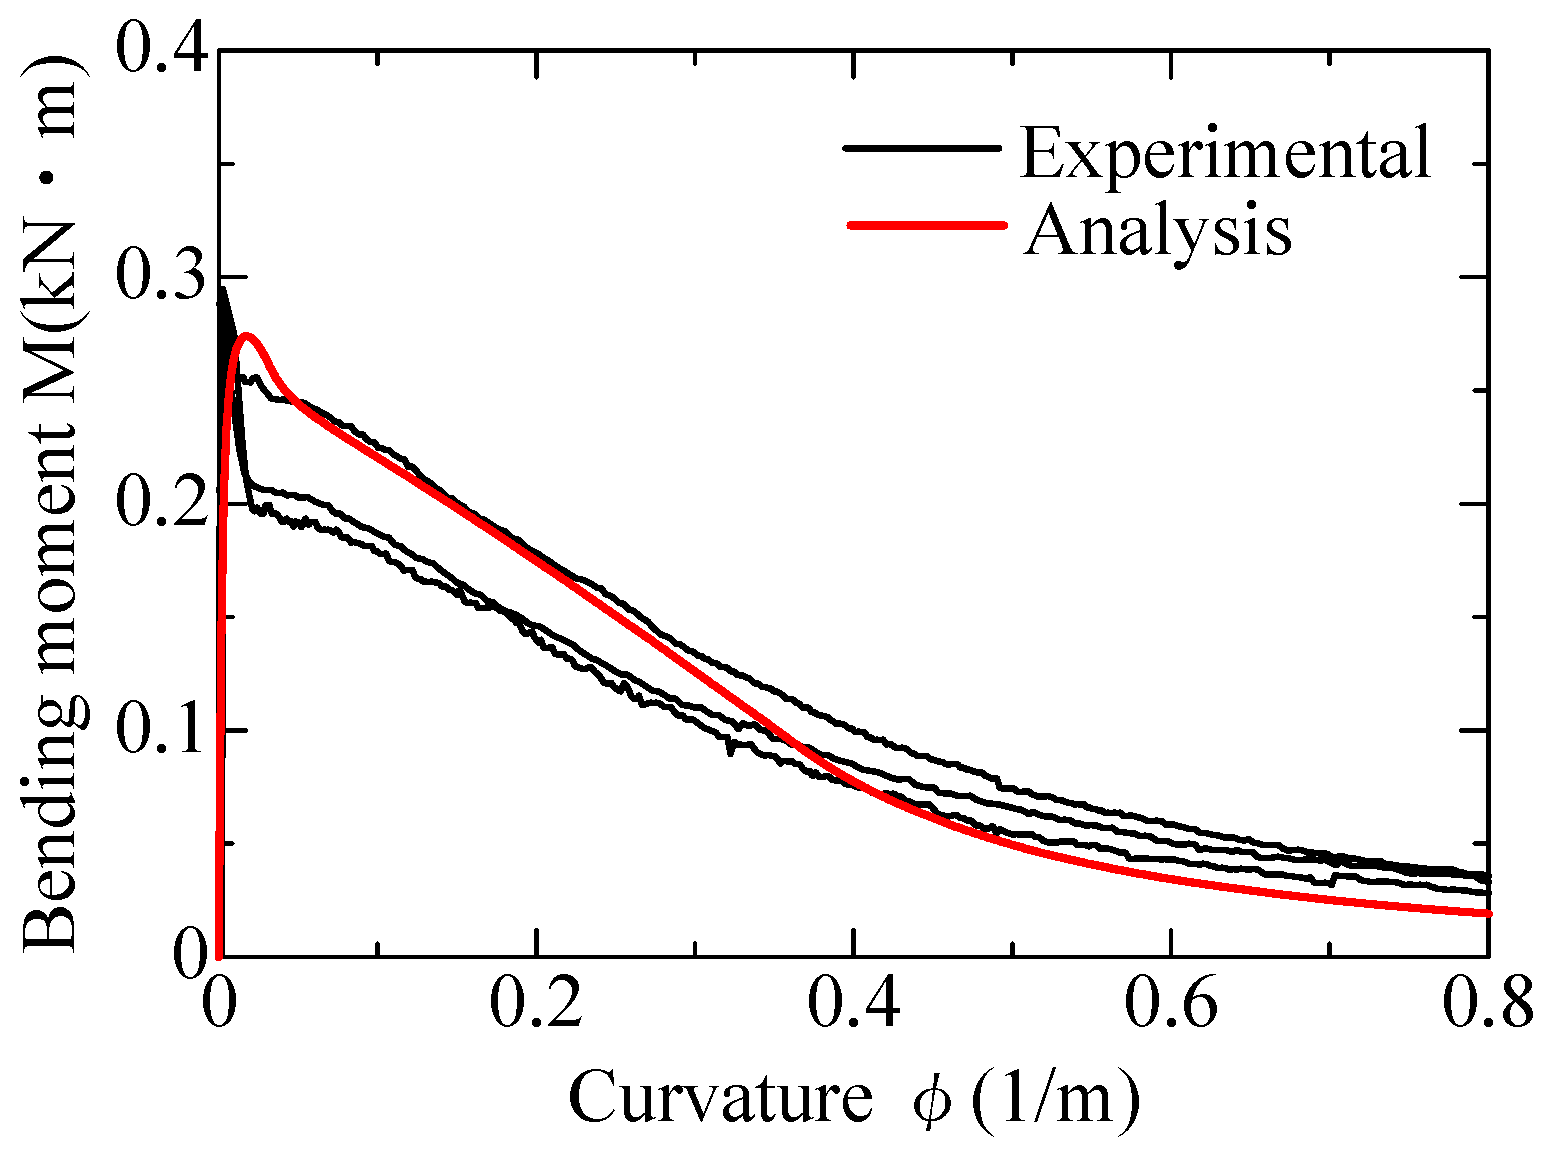
4.3.3. Comparison of Analysis and Experimental Results

Figure 28 shows the bending moment–curvature relationship, where the black lines show the experimental results obtained from the four-point bending test, and the red lines show the analysis results. As shown in Figure 28, the analysis result shows a good agreement with the experimental results.

5. Conclusions

To investigate the crack-bridging behavior of palm fiber in FRCC, a single fiber pullout test of palm fiber was conducted. The pullout test was performed for specimens with and without inclination angles. Pullout load–slip curves were modeled based on the results of the single fiber pullout test, and the calculation of the bridging law was conducted. The adaptability of bridging law was assessed using a section analysis for a four-point bending test. The following conclusions are drawn based on the results:
  • In the single fiber pullout test result, the pullout of the fiber from the matrix and fiber rupture were observed. Even though there is variability in the experimental results, a correlation between the slip, embedded length, and angle of inclination was confirmed to some extent.
  • A power function relationship between the first peak load and the maximum pullout load with embedded length was found for specimens with 0° angle of inclination. Whereas a linear function relationship was adopted between the slip at the first peak load and at the maximum pullout load with the embedded length.
  • The relationship between the normalized pullout load and the inclination angle was examined based on the experimental results. Snubbing effects were considered for the first peak load and maximum pullout load.
  • The pullout behavior of a single fiber was modeled using a trilinear model. A tensile stress–crack width relationship model for palm-FRCC was created using the bridging law calculation based on the trilinear model.
  • Section analysis was conducted to assess the adaptability of the modeled bridging law calculations. The analysis result of the bending moment–curvature relationship shows a good agreement with the experimental results obtained from the four-point bending test of palm-FRCC.

6. Discussions for Further Research

The current research provides valuable insights into the mechanical properties and behavior of palm-FRCC. Notably, palm fibers were evaluated through a comprehensive analysis of their physical and mechanical properties, including density, morphology, and diameter distribution. The study emphasizes characterizing the surface morphology of palm fibers, as this is crucial for assessing their potential for effective mechanical interlocking with the cementitious matrix.
The pullout tests conducted revealed critical relationships between the embedded length of the palm fibers and the pullout load, which were influenced by various fiber inclination angles. These findings indicate that optimizing the orientation and embedding length of palm fibers within the matrix can significantly enhance the composite’s performance. The trilinear model developed to describe the pullout load–slip behavior further explains the mechanics underlying fiber–matrix interactions, providing a structured approach to predict performance under stress.
Despite the promising outcomes, certain challenges were identified in the application of palm fibers in cementitious composites. Variability in fiber morphology and quality complicates the uniform distribution of fibers within the matrix, which is essential for optimal mechanical performance. To address these challenges, future research should focus on developing enhanced processing techniques that improve fiber–matrix adhesion and optimize fiber distribution within the cementitious matrix. Understanding the mechanisms underlying the pullout behavior of palm fibers will also be critical for optimizing their performance in FRCC applications. Continued exploration into the compatibility of palm fibers within the alkaline environment of cement and fiber–matrix compatibility is necessary, as this property can mitigate concerns related to chemical degradation and poor load transfer mechanisms.

Supplementary Materials

The following supporting information can be downloaded at: https://www.mdpi.com/article/10.3390/jcs8090361/s1, Figure S1: Uniaxial tension test result of palm fiber; Excel: Pullout test result.

Author Contributions

Conceptualization, S.F.A. and T.K.; methodology, S.F.A., H.N.S., and T.K.; validation, S.F.A. and T.K.; formal analysis, S.F.A.; investigation, S.F.A., H.N.S., and T.K.; data curation, S.F.A.; writing—original draft preparation, S.F.A.; writing—review and editing, T.K.; visualization, S.F.A. and T.K.; supervision, T.K.; project administration, T.K. All authors have read and agreed to the published version of the manuscript.

Funding

This research received no external funding.

Data Availability Statement

The original contributions presented in the study are included in the Supplementary Materials. Further inquiries can be directed to the corresponding author.

Conflicts of Interest

The authors declare no conflicts of interest.

References

  1. Naik, T.R. Sustainability of Concrete Construction. Pract. Period. Struct. Des. Constr. 2008, 13, 98–103. [Google Scholar] [CrossRef]
  2. Akan, M.Ö.A.; Dhavale, D.G.; Sarkis, J. Greenhouse gas emissions in the construction industry: An analysis and evaluation of a concrete supply chain. J. Clean. Prod. 2017, 167, 1195–1207. [Google Scholar] [CrossRef]
  3. Kim, D.J.; Naaman, A.E.; El-Tawil, S. Comparative flexural behavior of four fiber reinforced cementitious composites. Cem. Concr. Compos. 2008, 30, 917–928. [Google Scholar] [CrossRef]
  4. Mechtcherine, V. Towards a durability framework for structural elements and structures made of or strengthened with high-performance fibre-reinforced composites. Constr. Build. Mater. 2012, 31, 94–104. [Google Scholar] [CrossRef]
  5. Fakharifar, M.; Dalvand, A.; Arezoumandi, M.; Sharbatdar, M.K.; Chen, G.; Kheyroddin, A. Mechanical properties of high performance fiber reinforced cementitious composites. Constr. Build. Mater. 2014, 71, 510–520. [Google Scholar] [CrossRef]
  6. Jiang, F.; Li, X.; Tian, L.; Yan, T.; Yu, J. Tensile strain-hardening cementitious composites and its practical exploration without reinforcement: A review. Front. Mater. 2022, 9, 1066796. [Google Scholar] [CrossRef]
  7. Ding, Y.; Yu, K.; Li, M. A review on high-strength engineered cementitious composites (HS-ECC): Design, mechanical property and structural application. Structures 2022, 35, 903–921. [Google Scholar] [CrossRef]
  8. Onuaguluchi, O.; Banthia, N. Plant-based natural fibre reinforced cement composites: A review. Cem. Concr. Compos. 2016, 68, 96–108. [Google Scholar] [CrossRef]
  9. Elanchezhian, C.; Ramnath, B.V.; Ramakrishnan, G.; Rajendrakumar, M.; Naveenkumar, V.; Saravanakumar, M.K. Review on mechanical properties of natural fiber composites. Mater. Today Proc. 2018, 5, 1785–1790. [Google Scholar] [CrossRef]
  10. Croccolo, D.; Agostinis, M.D.; Fini, S.; Liverani, A.; Marinelli, N.; Nisini, E.; Olmi, G. Mechanical Characteristics of Two Environmentally Friendly Resins Reinforced with Flax Fibers. Stroj. Vestn. J. Mech. Eng. 2015, 61, 227–236. [Google Scholar] [CrossRef]
  11. Mohammed, L.; Ansari, M.N.M.; Pua, G.; Jawaid, M.; Islam, M.S. A Review on Natural Fiber Reinforced Polymer Composite and Its Applications. Int. J. Polym. Sci. 2015, 243947. [Google Scholar] [CrossRef]
  12. Lotfi, A.; Li, H.; Dao, D.; Prusty, B. Natural fiber–reinforced composites: A review on material, manufacturing, and machinability. J. Thermoplast. Compos. Mater. 2019, 34, 238–284. [Google Scholar] [CrossRef]
  13. Pacheco-Torgal, F.; Jalali, S. Cementitious building materials reinforced with vegetable fibres: A review. Constr. Build. Mater. 2011, 25, 575–581. [Google Scholar] [CrossRef]
  14. Laverde, V.; Marin, A.; Benjumea, J.M.; Ortiz, M.R. Use of vegetable fibers as reinforcements in cement-matrix composite materials: A review. Constr. Build. Mater. 2022, 340, 127729. [Google Scholar] [CrossRef]
  15. Islam, M.S.; Ahmed, S.J. Influence of jute fiber on concrete properties. Constr. Build. Mater. 2018, 189, 768–776. [Google Scholar] [CrossRef]
  16. Elsaid, A.; Dawood, M.; Seracino, R.; Bobko, C. Mechanical properties of kenaf fiber reinforced concrete. Constr. Build. Mater. 2011, 25, 1991–2001. [Google Scholar] [CrossRef]
  17. Ren, G.; Yao, B.; Huang, H.; Gao, X. Influence of sisal fibers on the mechanical performance of ultra-high performance concretes. Constr. Build. Mater. 2021, 286, 122958. [Google Scholar] [CrossRef]
  18. Ali, B.; Azab, M.; Ahmed, H.; Kurda, R.; Ouni, M.H.E.; Elhag, A.B. Investigation of physical, strength, and ductility characteristics of concrete reinforced with banana (Musaceae) stem fiber. J. Build. Eng. 2022, 61, 105024. [Google Scholar] [CrossRef]
  19. Huang, J.K.; Young, W.B. The mechanical, hygral, and interfacial strength of continuous bamboo fiber reinforced epoxy composites. Compos. Part B Eng. 2019, 166, 272–283. [Google Scholar] [CrossRef]
  20. Lilargem Rocha, D.; Tambara Júnior, L.U.D.; Marvila, M.T.; Pereira, E.C.; Souza, D.; de Azevedo, A.R.G. A Review of the Use of Natural Fibers in Cement Composites: Concepts, Applications and Brazilian History. Polymers 2022, 14, 2043. [Google Scholar] [CrossRef]
  21. Qu, W.; Niu, B.; Lv, C.; Liu, J. A Review of Sisal Fiber-Reinforced Geopolymers: Preparation, Microstructure, and Mechanical Properties. Molecules 2024, 29, 2401. [Google Scholar] [CrossRef] [PubMed]
  22. Ren, G.; Yao, B.; Ren, M.; Gao, X. Utilization of natural sisal fibers to manufacture eco-friendly ultra-high performance concrete with low autogenous shrinkage. J. Clean. Prod. 2021, 332, 130105. [Google Scholar] [CrossRef]
  23. Thyavihalli Girijappa, Y.G.; Mavinkere Rangappa, S.; Parameswaranpillai, J.; Siengchin, S. Natural Fibers as Sustainable and Renewable Resource for Development of Eco-Friendly Composites: A Comprehensive Review. Front. Mater. 2019, 6, 226. [Google Scholar] [CrossRef]
  24. Lee, C.H.; Khalina, A.; Lee, S.H. Importance of Interfacial Adhesion Condition on Characterization of Plant-Fiber-Reinforced Polymer Composites: A Review. Polymers 2021, 13, 438. [Google Scholar] [CrossRef]
  25. Aruna, M.; Shehhi, M. Influence of surface treatments in natural fibre reinforced composites. Int. J. Multiphys. 2020, 14, 129–141. [Google Scholar]
  26. Santana, H.A.; Júnior, N.S.A.; Ribeiro, D.V.; Cilla, M.S.; Dias, C.M.R. Vegetable fibers behavior in geopolymers and alkali-activated cement based matrices: A review. J. Build. Eng. 2021, 44, 103291. [Google Scholar] [CrossRef]
  27. Labib, W.A. Plant-based fibres in cement composites: A conceptual framework. J. Eng. Fibers Fabr. 2022, 17, 15589250221078922. [Google Scholar] [CrossRef]
  28. Oladele, I.O.; Michael, O.S.; Adediran, A.A.; Balogun, O.P.; Ajagbe, F.O. Acetylation Treatment for the Batch Processing of Natural Fibers: Effects on Constituents, Tensile Properties and Surface Morphology of Selected Plant Stem Fibers. Fibers 2020, 8, 73. [Google Scholar] [CrossRef]
  29. Karimah, A.; Ridho, M.R.; Munawar, S.S.; Adi, D.S.; Ismadi, D.R.; Subiyanto, B.; Fatriasari, W.; Fudholi, A. A review on natural fibers for development of eco-friendly bio-composite: Characteristics, and utilizations. J. Mater. Res. Technol. 2021, 13, 2442–2458. [Google Scholar] [CrossRef]
  30. Adamu, M.; Alanazi, F.; Ibrahim, Y.E.; Alanazi, H.; Khed, V.C. A Comprehensive Review on Sustainable Natural Fiber in Cementitious Composites: The Date Palm Fiber Case. Sustainability 2022, 14, 6691. [Google Scholar] [CrossRef]
  31. Saini, K.; Matsagar, V.A.; Kodur, V.R. Recent advances in the use of natural fibers in civil engineering structures. Constr. Build. Mater. 2024, 411, 134364. [Google Scholar] [CrossRef]
  32. Ardanuy, M.; Claramunt, J.; Filho, R.D.T. Cellulosic fiber reinforced cement-based composites: A review of recent research. Constr. Build. Mater. 2015, 79, 115–128. [Google Scholar] [CrossRef]
  33. Fan, M.; Fu, F. Introduction: A perspective—Natural fibre composites in construction. In Advanced High Strength Natural Fibre Composites in Construction; Woodhead Publishing: Cambridge, UK, 2017; pp. 1–20. [Google Scholar] [CrossRef]
  34. Malkapuram, R.; Kumar, V.; Yuvraj, S.N. Recent Development in Natural Fiber Reinforced Polypropylene Composites. J. Reinf. Plast. Compos. 2009, 28, 1169–1189. [Google Scholar] [CrossRef]
  35. Ahmad, H.; Chhipi-Shrestha, G.; Hewage, K.; Sadiq, R. A Comprehensive Review on Construction Applications and Life Cycle Sustainability of Natural Fiber Biocomposites. Sustainability 2022, 14, 15905. [Google Scholar] [CrossRef]
  36. Lu, J.X. Recent advances in high strength lightweight concrete: From development strategies to practical applications. Constr. Build. Mater. 2023, 400, 132905. [Google Scholar] [CrossRef]
  37. Dittenber, D.B.; GangaRao, H.V.S. Critical review of recent publications on use of natural composites in infrastructure. Compos. Part A Appl. Sci. Manuf. 2012, 43, 1419–1429. [Google Scholar] [CrossRef]
  38. Alhijazi, M.; Zeeshan, Q.; Safaei, B.; Asmael, M.; Qin, Z. Recent Developments in Palm Fibers Composites: A Review. J. Polym. Environ. 2020, 28, 3029–3054. [Google Scholar] [CrossRef]
  39. Momoh, E.O.; Osofero, A.I. Recent developments in the application of oil palm fibers in cement composites. Front. Struct. Civ. Eng. 2020, 14, 94–108. [Google Scholar] [CrossRef]
  40. Bamaga, S.O. A Review on the Utilization of Date Palm Fibers as Inclusion in Concrete and Mortar. Fibers 2022, 10, 35. [Google Scholar] [CrossRef]
  41. Khelifa, H.; Bezazi, A.; Boumediri, H.; del Pino, G.G.; Reis, P.N.B.; Scarpa, F.; Dufresne, A. Mechanical characterization of mortar reinforced by date palm mesh fibers: Experimental and statistical analysis. Constr. Build. Mater. 2021, 300, 124067. [Google Scholar] [CrossRef]
  42. Momoh, E.O.; Osofero, A.I. Behaviour of oil palm broom fibres (OPBF) reinforced concrete. Constr. Build. Mater. 2019, 221, 745–761. [Google Scholar] [CrossRef]
  43. Bopda Fokam, C.; Toumi, E.; Kenmeugne, B.; Wiryikfu, N.C.; Mevaa, L. Experimental study of the addition of oil palm mesocarp fiber on the physical and mechanical properties of fiber cement mortar composites. SN Appl. Sci. 2021, 3, 85. [Google Scholar] [CrossRef]
  44. Lertwattanaruk, P.; Suntijitto, A. Properties of natural fiber cement materials containing coconut coir and oil palm fibers for residential building applications. Constr. Build. Mater. 2015, 94, 664–669. [Google Scholar] [CrossRef]
  45. Kareche, A.; Agoudjil, B.; Haba, B.; Boudenne, A. Study on the Durability of New Construction Materials Based on Mortar Reinforced with Date Palm Fibers Wastes. Waste Biomass Valorization 2020, 11, 3801–3809. [Google Scholar] [CrossRef]
  46. Zanichelli, A.; Carpinteri, A.; Fortese, G.; Ronchei, C.; Scorza, D.; Vantadori, S. Contribution of date-palm fibres reinforcement to mortar fracture toughness. Procedia Struct. Integr. 2018, 13, 542–547. [Google Scholar] [CrossRef]
  47. Aziez, M.N.; Achour, A. Physical and Mechanical Properties of Cement-Based Mortars Reinforced with Treated Date Palm Fibres. All Sciences Preceedings. 2023. Available online: https://as-proceeding.com/index.php/icmar (accessed on 11 September 2024).
  48. Bonnet-Masimbert, P.A.; Gauvin, F.; Brouwers, H.J.H.; Amziane, S. Study of modifications on the chemical and mechanical compatibility between cement matrix and oil palm fibres. Results Eng. 2020, 7, 100150. [Google Scholar] [CrossRef]
  49. Oushabi, A.; Sair, S.; Hassani, F.O.; Abboud, Y.; Tanane, O.; Bouari, A.E. The effect of alkali treatment on mechanical, morphological and thermal properties of date palm fibers (DPFs): Study of the interface of DPF–Polyurethane composite. S. Afr. J. Chem. Eng. 2017, 23, 116–123. [Google Scholar] [CrossRef]
  50. Alatshan, F.; Altlomate, A.M.; Mashiri, F.; Alamin, W. Effect of date palm fibers on the mechanical properties of concrete. Int. J. Sustain. Build. Technol. Urban Dev. 2017, 8, 68–80. [Google Scholar] [CrossRef]
  51. Kanakubo, T.; Miyaguchi, M.; Asano, K. Influence of Fiber Orientation on Bridging Performance of Polyvinyl Alcohol Fiber-Reinforced Cementitious Composite. ACI Mater. J. 2016, 113, 131–141. [Google Scholar] [CrossRef]
  52. Ozu, Y.; Miyaguchi, M.; Kanakubo, T. Modeling of Bridging Law for PVA Fiber-Reinforced Cementitious Composite Considering Fiber Orientation. J. Civ. Eng. Archit. 2018, 12, 651–661. [Google Scholar] [CrossRef]
  53. Sunaga, D.; Koba, T.; Kanakubo, T. Modeling of Bridging Law for Bundled Aramid Fiber-Reinforced Cementitious Composite and its Adaptability in Crack Width Evaluation. Materials 2021, 14, 179. [Google Scholar] [CrossRef] [PubMed]
  54. Kanakubo, T.; Shi, H.; Wang, J. Influence of Matrix Strength on Bridging Performance of Fiber-Reinforced Cementitious Composite with Bundled Aramid Fiber. J. Compos. Sci. 2022, 6, 131. [Google Scholar] [CrossRef]
  55. Plagué, T.; Desmettre, C.; Charron, J.P. Influence of fiber type and fiber orientation on cracking and permeability of reinforced concrete under tensile loading. Cem. Concr. Res. 2017, 94, 59–70. [Google Scholar] [CrossRef]
  56. Kanakubo, T.; Echizen, S.; Wang, J.; Mu, Y. Pullout Behavior of Bundled Aramid Fiber in Fiber-Reinforced Cementitious Composite. Materials 2020, 13, 1746. [Google Scholar] [CrossRef]
  57. Zhang, J.; Li, V.C. Effect of inclination angle on fiber rupture load in fiber reinforced cementitious composites. Compos. Sci. Technol. 2002, 62, 775–781. [Google Scholar] [CrossRef]
  58. Kanda, T.; Li, V.C. Interface Property and Apparent Strength of High-Strength Hydrophilic Fiber in Cement Matrix. J. Mater. Civ.Eng. ASCE 1998, 10, 5–13. [Google Scholar] [CrossRef]
  59. Li, V.C.; Wang, Y.; Backer, S. Effect of inclining angle, bundling and surface treatment on synthetic fibre pull-out from a cement matrix. Composites 1990, 21, 132–140. [Google Scholar] [CrossRef]
Figure 1. Research program outline.
Jcs 08 00361 g001
Figure 2. Chopped palm fiber.
Jcs 08 00361 g002
Figure 3. Fiber length: (a) fiber length measurement and (b) fiber length distribution.
Jcs 08 00361 g003
Figure 4. Measurement of fiber volume.
Jcs 08 00361 g004
Figure 5. Surface observation: (a) shape sample, (b) surface sample, (c) array of bulges, and (d) empty hole.
Jcs 08 00361 g005
Figure 6. Fiber diameter distribution.
Jcs 08 00361 g006
Figure 7. Specimen for pullout test.
Jcs 08 00361 g007
Figure 8. Pullout test setup: (a) specimen at 0 inclination angle and (b) specimen with inclination angle.
Jcs 08 00361 g008
Figure 9. Uniaxial tension test setup for single fiber.
Jcs 08 00361 g009
Figure 10. Uniaxial tension test result.
Jcs 08 00361 g010
Figure 11. Typical examples in uniaxial tension test with regression curve: (a) specimen No.12 and (b) specimen No.20.
Jcs 08 00361 g011
Figure 12. Pullout load–slip relationship: embedded length of 2 mm, inclined angle of (a) 0°, (b) 15°, (c) 30°, (d) 45°, and (e) 60°.
Jcs 08 00361 g012
Figure 13. Pullout load–slip relationship: embedded length of 4 mm, inclined angle of (a) 0°, (b) 15°, (c) 30°, (d) 45°, and (e) 60°.
Jcs 08 00361 g013
Figure 14. Pullout load–slip relationship: embedded length of 6 mm, inclined angle of (a) 0°, (b) 15°, (c) 30°, (d) 45°, and (e) 60°.
Jcs 08 00361 g014
Figure 15. Pullout load–embedded length relationship: (a) first peak load and (b) maximum pullout load.
Jcs 08 00361 g015
Figure 16. Slip–embedded length relationship: (a) slip at first peak load and (b) slip at the maximum pullout load.
Jcs 08 00361 g016
Figure 17. Snubbing coefficient at first peak load.
Jcs 08 00361 g017
Figure 18. Snubbing coefficient at maximum pullout load.
Jcs 08 00361 g018
Figure 19. Apparent rupture strength of palm fiber.
Jcs 08 00361 g019
Figure 20. Trilinear model.
Jcs 08 00361 g020
Figure 21. Example of trilinear model: (a) experiment result and (b) trilinear model.
Jcs 08 00361 g021
Figure 22. Estimation of the pullout load as a function of embedded length for 0° angle of inclination: (a) first peak load and (b) maximum pullout load.
Jcs 08 00361 g022
Figure 23. Estimation of slip as a function of embedded length for 0° angle of inclination: (a) slip at first peak load and (b) slip at the maximum pullout load.
Jcs 08 00361 g023
Figure 24. Calculation result of bridging law: (a) tensile stress–crack width relationship and (b) fiber effectiveness–crack width relationship.
Jcs 08 00361 g024
Figure 25. Four-point bending test setup.
Jcs 08 00361 g025
Figure 26. Quantification of the smaller-size fibers.
Jcs 08 00361 g026
Figure 27. Stress–strain model applied in the section analysis.
Jcs 08 00361 g027
Figure 28. Bending moment–curvature relationship.
Jcs 08 00361 g028
Table 1. Mixture proportion.
W/CFA/BUnit Weight (kg/m3)
WaterCementFly AshSand
0.7850.5380484484484
W—water, C—cement (high early-strength Portland cement), FA—fly ash (type II of JIS A 6201), B—binder (=C + FA), S—sand (size under 0.2 mm).
Table 2. List of specimens.
Specimen NameEmbedded Length
(mm)
Inclination Angle
(°)
Number of Specimens
P-2mm-0205
P-2mm-15155
P-2mm-30305
P-2mm-45455
P-2mm-60605
P-4mm-0405
P-4mm-15155
P-4mm-30305
P-4mm-45455
P-4mm-60605
P-6mm-0605
P-6mm-15155
P-6mm-30305
P-6mm-45455
P-6mm-60605
Table 3. Pullout test results for 2 mm embedded length.
NameAngle of
Inclination (°)
Embedded Length + (mm)Pa
(N)
Pmax
(N)
Sa
(mm)
Smax
(mm)
Failure Mode
2mm-0-102.060.962.690.0392.880PO
2mm-0-20.861.790.0060.352PO
2mm-0-30.891.180.3121.921PO
2mm-0-41.291.450.0281.545PO
2mm-0-50.852.100.0880.717PO
2mm-15-1152.101.152.640.1040.340PO
2mm-15-20.551.620.1002.677PO
2mm-30-1302.031.911.91- *0.071PO
2mm-30-20.470.740.0820.123PO
2mm-30-31.983.690.1160.582R
2mm-30-42.004.000.0482.087R
2mm-30-52.052.930.1561.619PO
2mm-45-1451.900.682.300.0172.268PO
2mm-60-1602.011.391.840.0400.704PO
2mm-60-24.934.93- *0.017PO
2mm-60-31.441.44- *0.013PO
2mm-60-43.194.250.0640.535PO
2mm-60-50.922.010.0461.224PO
+ Averaged value among the same specimens. * Pa = Pmax, and the values of Sa and Smax are the same.
Table 4. Pullout test results for 4 mm embedded length.
NameAngle of
Inclination (°)
Embedded Length + (mm)Pa
(N)
Pmax
(N)
Sa
(mm)
Smax
(mm)
Failure Mode
4mm-0-104.051.221.590.2182.422PO
4mm-0-23.553.55- *0.074PO
4mm-0-32.072.07- *0.072PO
4mm-0-42.592.820.1970.733PO
4mm-0-52.582.58- *0.019R
4mm-15-1154.051.461.820.1030.750PO
4mm-30-1304.093.294.530.0600.705PO
4mm-30-23.665.390.0610.901R
4mm-30-31.542.070.0380.685R
4mm-30-44.054.05- *0.036PO
4mm-30-50.892.930.0852.901R
4mm-45-1454.051.161.990.0671.250PO
4mm-60-1604.105.425.42- *0.378R
4mm-60-21.183.210.0222.372PO
4mm-60-33.895.440.0562.620R
4mm-60-44.725.180.1130.200PO
4mm-60-52.493.550.0270.665PO
+ Averaged value among the same specimens. * Pa = Pmax, and the values of Sa and Smax are the same.
Table 5. Pullout test results for 6mm embedded length.
NameAngle of
Inclination (°)
Embedded Length + (mm)Pa
(N)
Pmax
(N)
Sa
(mm)
Smax
(mm)
Failure Mode
6mm-0-106.122.173.100.0202.746PO
6mm-0-21.771.880.0600.727PO
6mm-0-31.721.720.0332.040PO
6mm-0-42.862.86- *0.175PO
6mm-0-50.781.580.0862.306R
6mm-15-1156.031.462.520.0242.171PO
6mm-15-20.671.400.0210.324PO
6mm-15-31.973.600.0051.863R
6mm-30-1306.068.318.31- *0.453PO
6mm-30-23.663.66- *0.040PO
6mm-30-33.203.20- *0.745PO
6mm-30-41.953.620.0563.211PO
6mm-30-52.043.520.0222.271R
6mm-45-1456.061.612.120.3731.360PO
6mm-45-21.322.110.1000.659R
6mm-45-31.241.24- *0.052PO
6mm-45-42.303.210.0720.220R
6mm-60-1606.083.823.82- *0.188R
6mm-60-22.704.300.0480.695R
6mm-60-30.531.090.1340.251R
6mm-60-42.614.020.0691.239R
6mm-60-52.263.690.1522.100R
+ Averaged value among the same specimens. * Pa = Pmax, and the values of Sa and Smax are the same.
Table 6. Parameters for bridging law calculation.
ParameterInput Value
Cross-sectional area of the fiber, Af (mm2)0.023
Length of fiber, lf (mm)12
Fiber volume fraction (See Section 4.3.2)0.025
Snubbing coefficient0.35
Apparent rupture strength of fiber (MPa)σfu = 110e0.006ψ
Trilinear modelMaximum pullout load, Pmax (N)Pmax = 1.6lb0.26
First peak load, Pa (N)Pa = 0.62lb0.78
Crack width at Pmax, wmax (mm)wmax = 0.4lb
Crack width at Pa, wa (mm)wa = 0.04lb
Elliptic distribution [51]Orientation intensity, k (kxy = kzx)1
Principal orientation angle, θr0
Table 7. Compressive strength and elastic modulus.
SpecimenCompressive
Strength
(MPa)
Elastic
Modulus
(GPa)
Palm-FRCC 3%25.211.8
Table 8. Measurement of fiber weight before and after passing through a sieve.
SampleWeight of
Fiber
(g)
Weight of Fiber
Passing 2 mm Sieve
(g)
14.710.65
26.170.88
35.060.82
48.551.13
56.520.96
Avg.6.200.89
Percentage of smaller fibers14.3%
Disclaimer/Publisher’s Note: The statements, opinions and data contained in all publications are solely those of the individual author(s) and contributor(s) and not of MDPI and/or the editor(s). MDPI and/or the editor(s) disclaim responsibility for any injury to people or property resulting from any ideas, methods, instructions or products referred to in the content.

