Article

Tensile Strength Predictive Modeling of Natural-Fiber-Reinforced Recycled Aggregate Concrete Using Explainable Gradient Boosting Models

1
GameAbove College of Engineering and Technology, Eastern Michigan University, Ypsilanti, MI 48197, USA
2
Department of Civil Engineering, Istanbul University-Cerrahpasa, 34320 Istanbul, Turkey
3
College of IT Convergence, Gachon University, Seongnam 13120, Republic of Korea
*
Authors to whom correspondence should be addressed.
J. Compos. Sci. 2025, 9(3), 119; https://doi.org/10.3390/jcs9030119
Submission received: 13 February 2025 / Revised: 26 February 2025 / Accepted: 1 March 2025 / Published: 4 March 2025

Abstract

:
Natural fiber composites have gained significant attention in recent years due to their environmental benefits and unique mechanical properties. These materials combine natural fibers with polymer matrices to create sustainable alternatives to traditional synthetic composites. In addition to natural fiber reinforcement, the usage of recycled aggregates in concrete has been proposed as a remedy to combat the rapidly increasing amount of construction and demolition waste in recent years. However, the accurate prediction of the structural performance metrics, such as tensile strength, remains a challenge for concrete composites reinforced with natural fibers and containing recycled aggregates. This study aims to develop predictive models of natural-fiber-reinforced recycled aggregate concrete based on experimental results collected from the literature. The models have been trained on a dataset consisting of 482 data points. Each data point consists of the amounts of cement, fine and coarse aggregate, water-to-binder ratio, percentages of recycled coarse aggregate and natural fiber, and the fiber length. The output feature of the dataset is the splitting tensile strength of the concrete. Extreme gradient boosting (XGBoost), light gradient boosting machine (LightGBM) and extra trees regressor models were trained to predict the tensile strength of the specimens. For optimum performance, the hyperparameters of these models were optimized using the blended search strategy (BlendSearch) and cost-related frugal optimization (CFO). The tensile strength could be predicted with a coefficient of determination greater than 0.95 by the XGBoost model. To make the predictive models accessible, an online graphical user interface was also made available on the Streamlit platform. A feature importance analysis was carried out using the Shapley additive explanations (SHAP) approach.

1. Introduction

Concrete is the most widely utilized construction material globally, due to its availability and versatility. However, its inherent weaknesses include low tensile strength, limited ductility, and poor energy absorption. Global urbanization has led to a rapid increase in construction and demolition (C&D) waste, which comprises nearly 30–40% of the total solid waste generated globally [1]. To address these challenges, recycled coarse aggregates (RCA) derived from C&D waste have gained attention as an eco-friendly substitute for natural aggregates. The use of recycled coarse aggregate (RCA) as a substitute for natural coarse aggregate (NCA) has been extensively investigated in the literature. While RCA offers a sustainable alternative, research indicates that recycled aggregate concrete (RAC) often demonstrates lower performance compared to natural aggregate concrete (NAC) in terms of workability, compressive and tensile strength, unit weight, and modulus of elasticity. This decline is primarily attributed to the presence of attached mortar on the surface of RCA [1,2,3]. Researchers have experimented with RCA replacement levels ranging from partial (25–50%) to full (100%) substitution [4,5,6]. It has been observed that replacing NCA with 25–50% RCA has a minimal negative effect on the mechanical properties of concrete, making it a practical and environmentally viable option [2,7,8].
Regarding the tensile properties of concrete, many studies have observed a decrease in tensile strength with the addition of recycled coarse aggregate [1,5,9]. However, fibers can mitigate this strength reduction. For fiber-reinforced recycled aggregate concrete (FRRAC), it was noted that fibers contribute to enhancing tensile and flexural strength. Nonetheless, when RCA content increases for the same fiber dosage, the beneficial influence of the fibers becomes minimal [1,5,9,10,11].
Another major factor contributing to concrete’s insufficient tensile behavior is its low toughness, combined with internal defects. Enhancing the toughness of concrete and minimizing defect size and frequency is essential for improving its overall performance. One proven method for increasing concrete toughness is the incorporation of short fibers (typically 0.5–2% by volume) into the concrete mix during preparation. As a sustainable alternative to synthetic fibers, natural fibers such as bamboo, coconut, straw, and hemp have emerged as a promising solution. On the other hand, there are only a limited number of studies in literature involving the effects of natural fiber addition to concrete. Bittner and Oettel [12] experimentally investigated the flexural behavior of ultra-high performance concrete beams reinforced with bamboo fibers. The addition of bamboo fibers was observed to increase the maximum load up to 37% in these experiments. Joachim and Oettel [13] carried out compressive tests with ultra-high-performance concrete reinforced with bamboo, coir and flax fibers. The addition of natural fibers was observed to reduce the brittle behavior of concrete under compression. Beskopylny et al. [14] evaluated the efficiency of using hemp and flax fibers for concrete reinforcement. The addition of fibers was found to increase the compressive and flexural strength and to decrease the water absorption. Jamshaid et al. [15] investigated the strength, weight loss percentage and surface degradation of jute, sugarcane, coconut, sisal and basalt fibers. It was found that the basalt fibers imparted the greatest compressive strength followed by jute and sisal fibers. Zhao et al. [16] conducted an experimental study to investigate the effects of adding pineapple leaf and ramie fibers on the strength, durability, and permeability of cement-based materials. The addition of fibers was observed to significantly increase capillary absorption and chloride diffusion. Sadouri et al. [17] investigated the effect of juncus fiber addition to cementitious materials on the compressive strength and ultrasonic pulse velocity. The addition of juncus fibers was observed to reduce the ultrasonic pulse velocity and compressive strength. Da Costa Santos and Archbold [18] investigated the effect of surface treatment application on the biodegradability of hemp fibers. The addition of NaOH 10% for 24 h was found to decrease the degradability of hemp fibers in an alkaline solution. Wu et al. [19] carried out experiments with rice straw fiber-reinforced concrete in wall panels. The rice straw fiber was combined with magnesium oxychloride cement to produce a kind of fiber-reinforced concrete with a high content of straw and suitable for light steel keel wall panels. It was found that the mass content of rice straw in concrete used in the wall panel can reach about 12%. Jamshaid et al. [20] carried out experimental investigations related to the effect of jute, sisal, sugarcane, and coconut fibers on the mechanical properties of concrete. Jute and sisal fibers showed the most significant improvement in tensile and compressive strength (11.6% and 20.2%, respectively) compared to plain concrete when 2% fiber was added to the concrete mix.
In recent years, many studies applied machine learning models to predict the mechanical properties of recycled aggregate and fiber-reinforced concrete. However, to the best of the authors’ knowledge, none of these machine learning-based studies investigated the combination of recycled aggregates with natural fibers. Momeni et al. [21] focused on estimating the flexural strength of recycled aggregate concrete beams. They developed a predictive model using an artificial neural network (ANN) optimized by particle swarm optimization and imperialist competition algorithms based on an experimental dataset. Similarly, Dantas et al. [22] built an ANN model to predict the compressive strength of concrete with different curing ages (3, 7, 28, and 91 days) made with construction and demolition waste. A total of 1178 data points were used for modeling the ANN model. Of these, 77.76% were used in the training phase and 22.24% in the testing phase. R2 scores of 0.928 and 0.971 were achieved on the training and test sets, respectively. Felix et al. [23] introduced an ANN and a nonlinear regression model to estimate the elastic modulus of recycled aggregate concrete. A coefficient of determination of 0.91 could be obtained in predicting the elastic modulus. Dai et al. [24] used multi-layer perceptron and AdaBoost models to predict the compressive strength of high-strength fiber-reinforced concrete using steel fibers. An R2 score of 0.94 could be achieved by the AdaBoost model. Yuan et al. [25] developed gradient boosting and random forest models to predict the compressive and flexural strength of recycled aggregate concrete using a dataset of 638 mixes. They found that the random forest model most accurately predicted strength, achieving R2 scores of 0.91 for compressive strength and 0.86 for flexural strength. Abed and Mehryaar [26] used multiple machine learning models including M5p decision trees, ridge and LASSO regression techniques. The models were trained to predict the degradation of concrete’s mechanical properties after exposure to high temperatures. The compressive strength, elasticity modulus, flexural strength and splitting tensile strength were predicted with R2 scores of 0.91, 0.90, 0.94 and 0.959, respectively. Rodsin et al. [27] investigated the use of cotton ropes for confining recycled aggregate concrete by conducting experiments on both full-wrap and strip confinement, and by developing neural network models to predict the material’s compressive strength. Their neural network model achieved an R² score of 0.931 for fully wrapped specimens and an R² score of 0.951 for strip-wrapped specimens. Zhu et al. [28] developed gene expression programming, artificial neural networks, and a bagging ensemble model to predict the splitting tensile strength of recycled aggregate concrete. They found that the bagging ensemble model achieved the highest accuracy with an R² score of 0.95.
This study is based on a series of experimental studies recently published by Aayaz [29] which contain the tensile strength of recycled aggregate concrete reinforced by six different types of natural fiber, namely jute, kenaf, bamboo, sisal, coir and ramie (Figure 1). Based on this dataset of experimental results, the current study presents the development of accurate predictive models using state of the art decision tree ensemble machine learning techniques. After presenting the predictive performance of these models, the effects of various input features on the tensile strength were quantified. These input features are the fiber type, superplasticizer amount, natural fiber percentage, cement amount, water-to-binder ratio, fine aggregate amount, coarse aggregate amount and the recycled coarse aggregate percentage in the concrete mixture. Furthermore, an online graphical user interface has been made available which delivers for a certain range of input features the corresponding tensile strength of concrete. The current study is unique in the sense that it combines the effects of recycled coarse aggregate and natural fibers on the mechanical behavior of concrete. To the best of the authors’ knowledge, this is a research area which has not been sufficiently investigated using a data-driven approach. One of the reasons for the lack of sufficient investigation in this area is the biodegradability of natural fibers resulting in pure durability of concrete in the long term. Another reason is that natural fibers exhibit large variability in their mechanical properties which makes it difficult to predict their structural response. The accurate prediction of concrete properties in the presence of recycled coarse aggregate and natural fibers using machine learning techniques can be greatly beneficial for design engineers due to the lack of predictive equations in the design codes. The current study also contributes to the knowledge base related to the application of natural fibers in composites technology. Because of the sustainability benefits of the inclusion of construction and demolition waste and natural fibers in construction, the availability of accurate prediction techniques is highly important.

2. Materials and Methods

In this section, the methods applied in data preprocessing, training the predictive models and interpreting the model outputs are explained. The section starts with a brief theoretical background on the gradient boosting algorithms used in predictive model development. Afterward, the hyperparameter optimization technique is explained followed by a brief background information on the Shapley additive explanations (SHAP) technique used for feature importance analysis. The statistical properties of the dataset are presented and the outlier detection and visualization techniques used for improving predictive model performance are explained.

2.1. Gradient Boosting Algorithms

Gradient boosting models such as XGBoost, LightGBM, and extra trees work as ensembles of decision trees where each subsequent decision tree in the ensemble improves upon the predictions of the previous decision trees. By correcting the predictions of the previous decision trees in the ensemble, the difference between the true and predicted values of the output feature is being minimized [32]. This process can be visualized as in Equation (1) where f k is a function that determines the output of the decision tree with index k , y ^ is the predicted output of the entire decision tree ensemble, N is the total number of decision trees, n is the total number of points in the dataset, and x is a vector of input features.
y ^ = k = 1 N f k ( x ) ,       m i n i m i z e j = 1 n   y j y ^ j

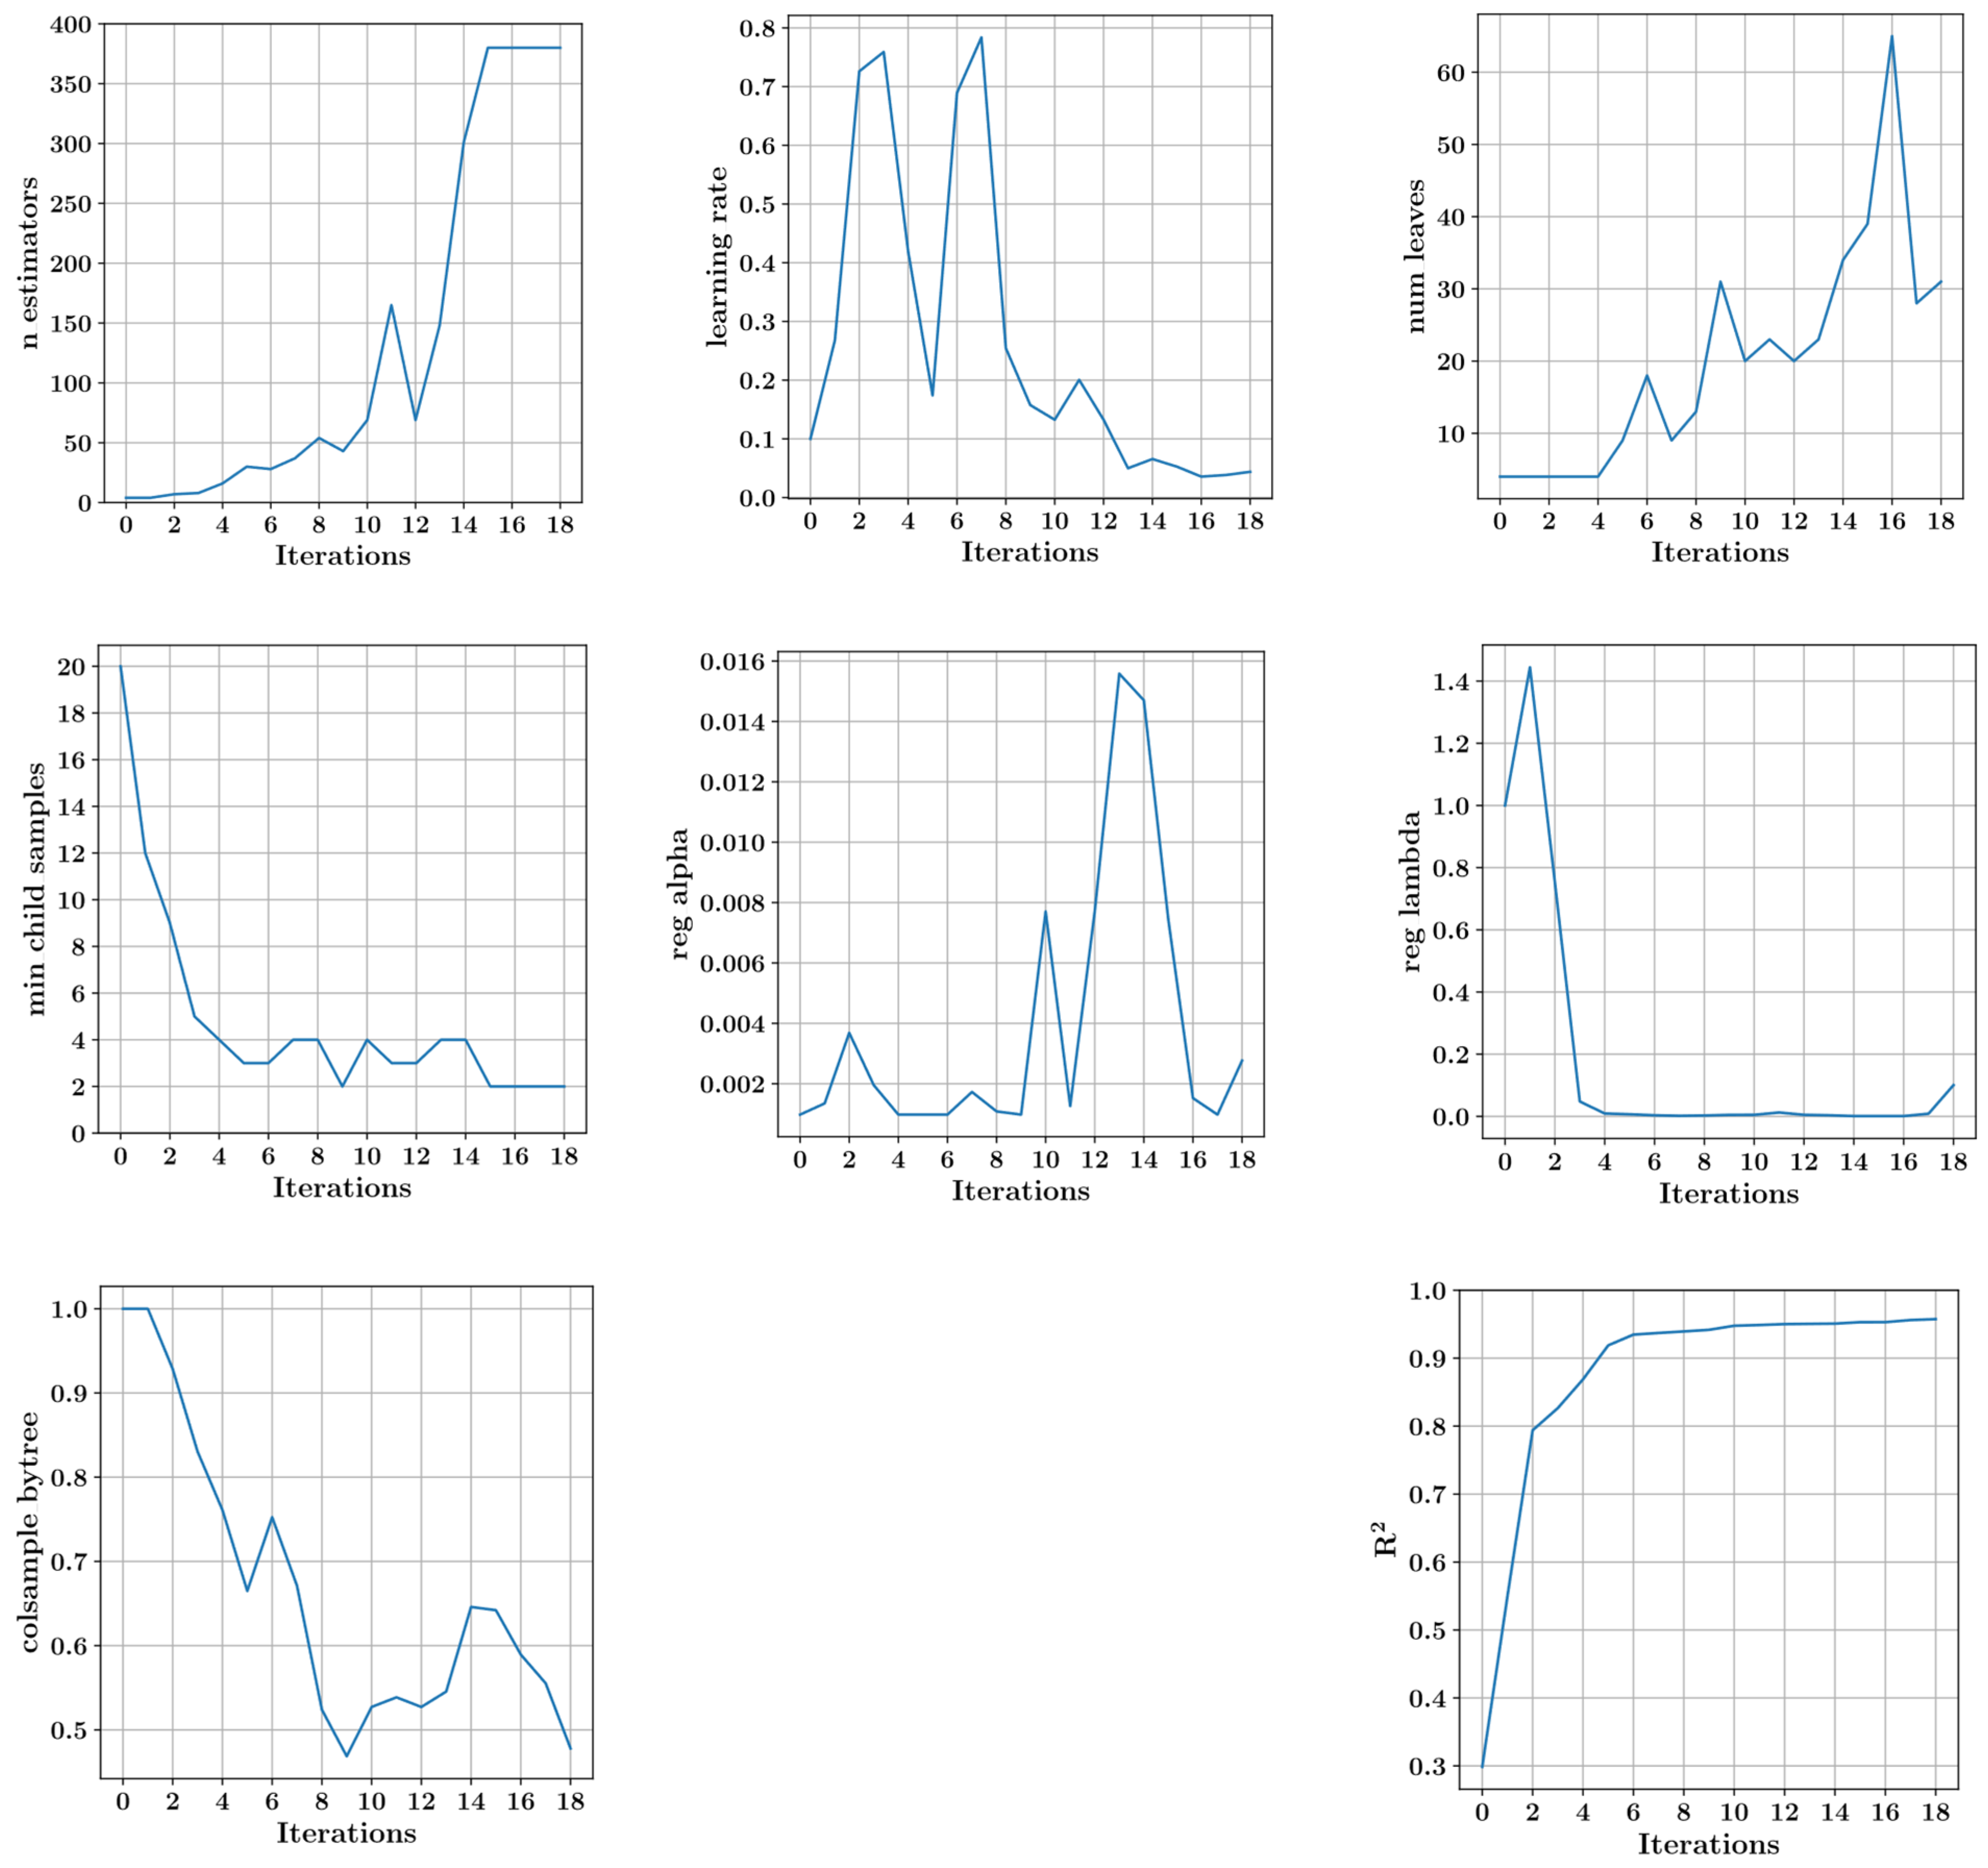
2.2. Optimization of the Hyperparameters

The performance of a predictive model can significantly fluctuate with respect to the set of hyperparameters. In this study, the blended search strategy (BlendSearch) and cost-related frugal optimization (CFO) algorithm implemented in the FLAML package were used to obtain the optimal hyperparameter configurations for the XGBoost, LightGBM and extra trees models. The BlendSearch and CFO algorithms are used in the exploration and exploitation phases of the optimization, respectively. In this sense, the BlendSearch and CFO algorithms are combined in the FLAML package for global and local search, respectively. The CFO algorithm uses the randomized direct search technique whereas the BlendSearch algorithm uses global search and enables the optimization process to escape local optimum points. Further details of the CFO and BlendSearch techniques can be found in [33,34].

2.3. Shapley Additive Explanations (SHAP) Methodology

SHAP (Shapley additive explanations) methodology works by assigning importance scores called Shapley values to each input feature. These Shapley values are used as a means for measuring how much each feature contributes to the predictive model’s output. The SHAP technique is valuable in that it enables the interpretation of the predictive model’s decision-making process. The computation of the Shapley values can be summarized as in Equation (2). In Equation (2), the Shapley value of the variable with index i is denoted with ϕ i . F denotes the set of all input features, S denotes a subset of the feature set which does not have the feature with index i and x denotes a vector of input variables. The prediction of the machine learning model is represented by the function f . The differences between the model predictions with and without a certain input variable are used as an indicator of the impact of that input variable on the predictive model [35,36,37,38].
ϕ i = S F \ { i } S ! F S 1 ! F ! [ f S i x S i f S ( x S ) ]

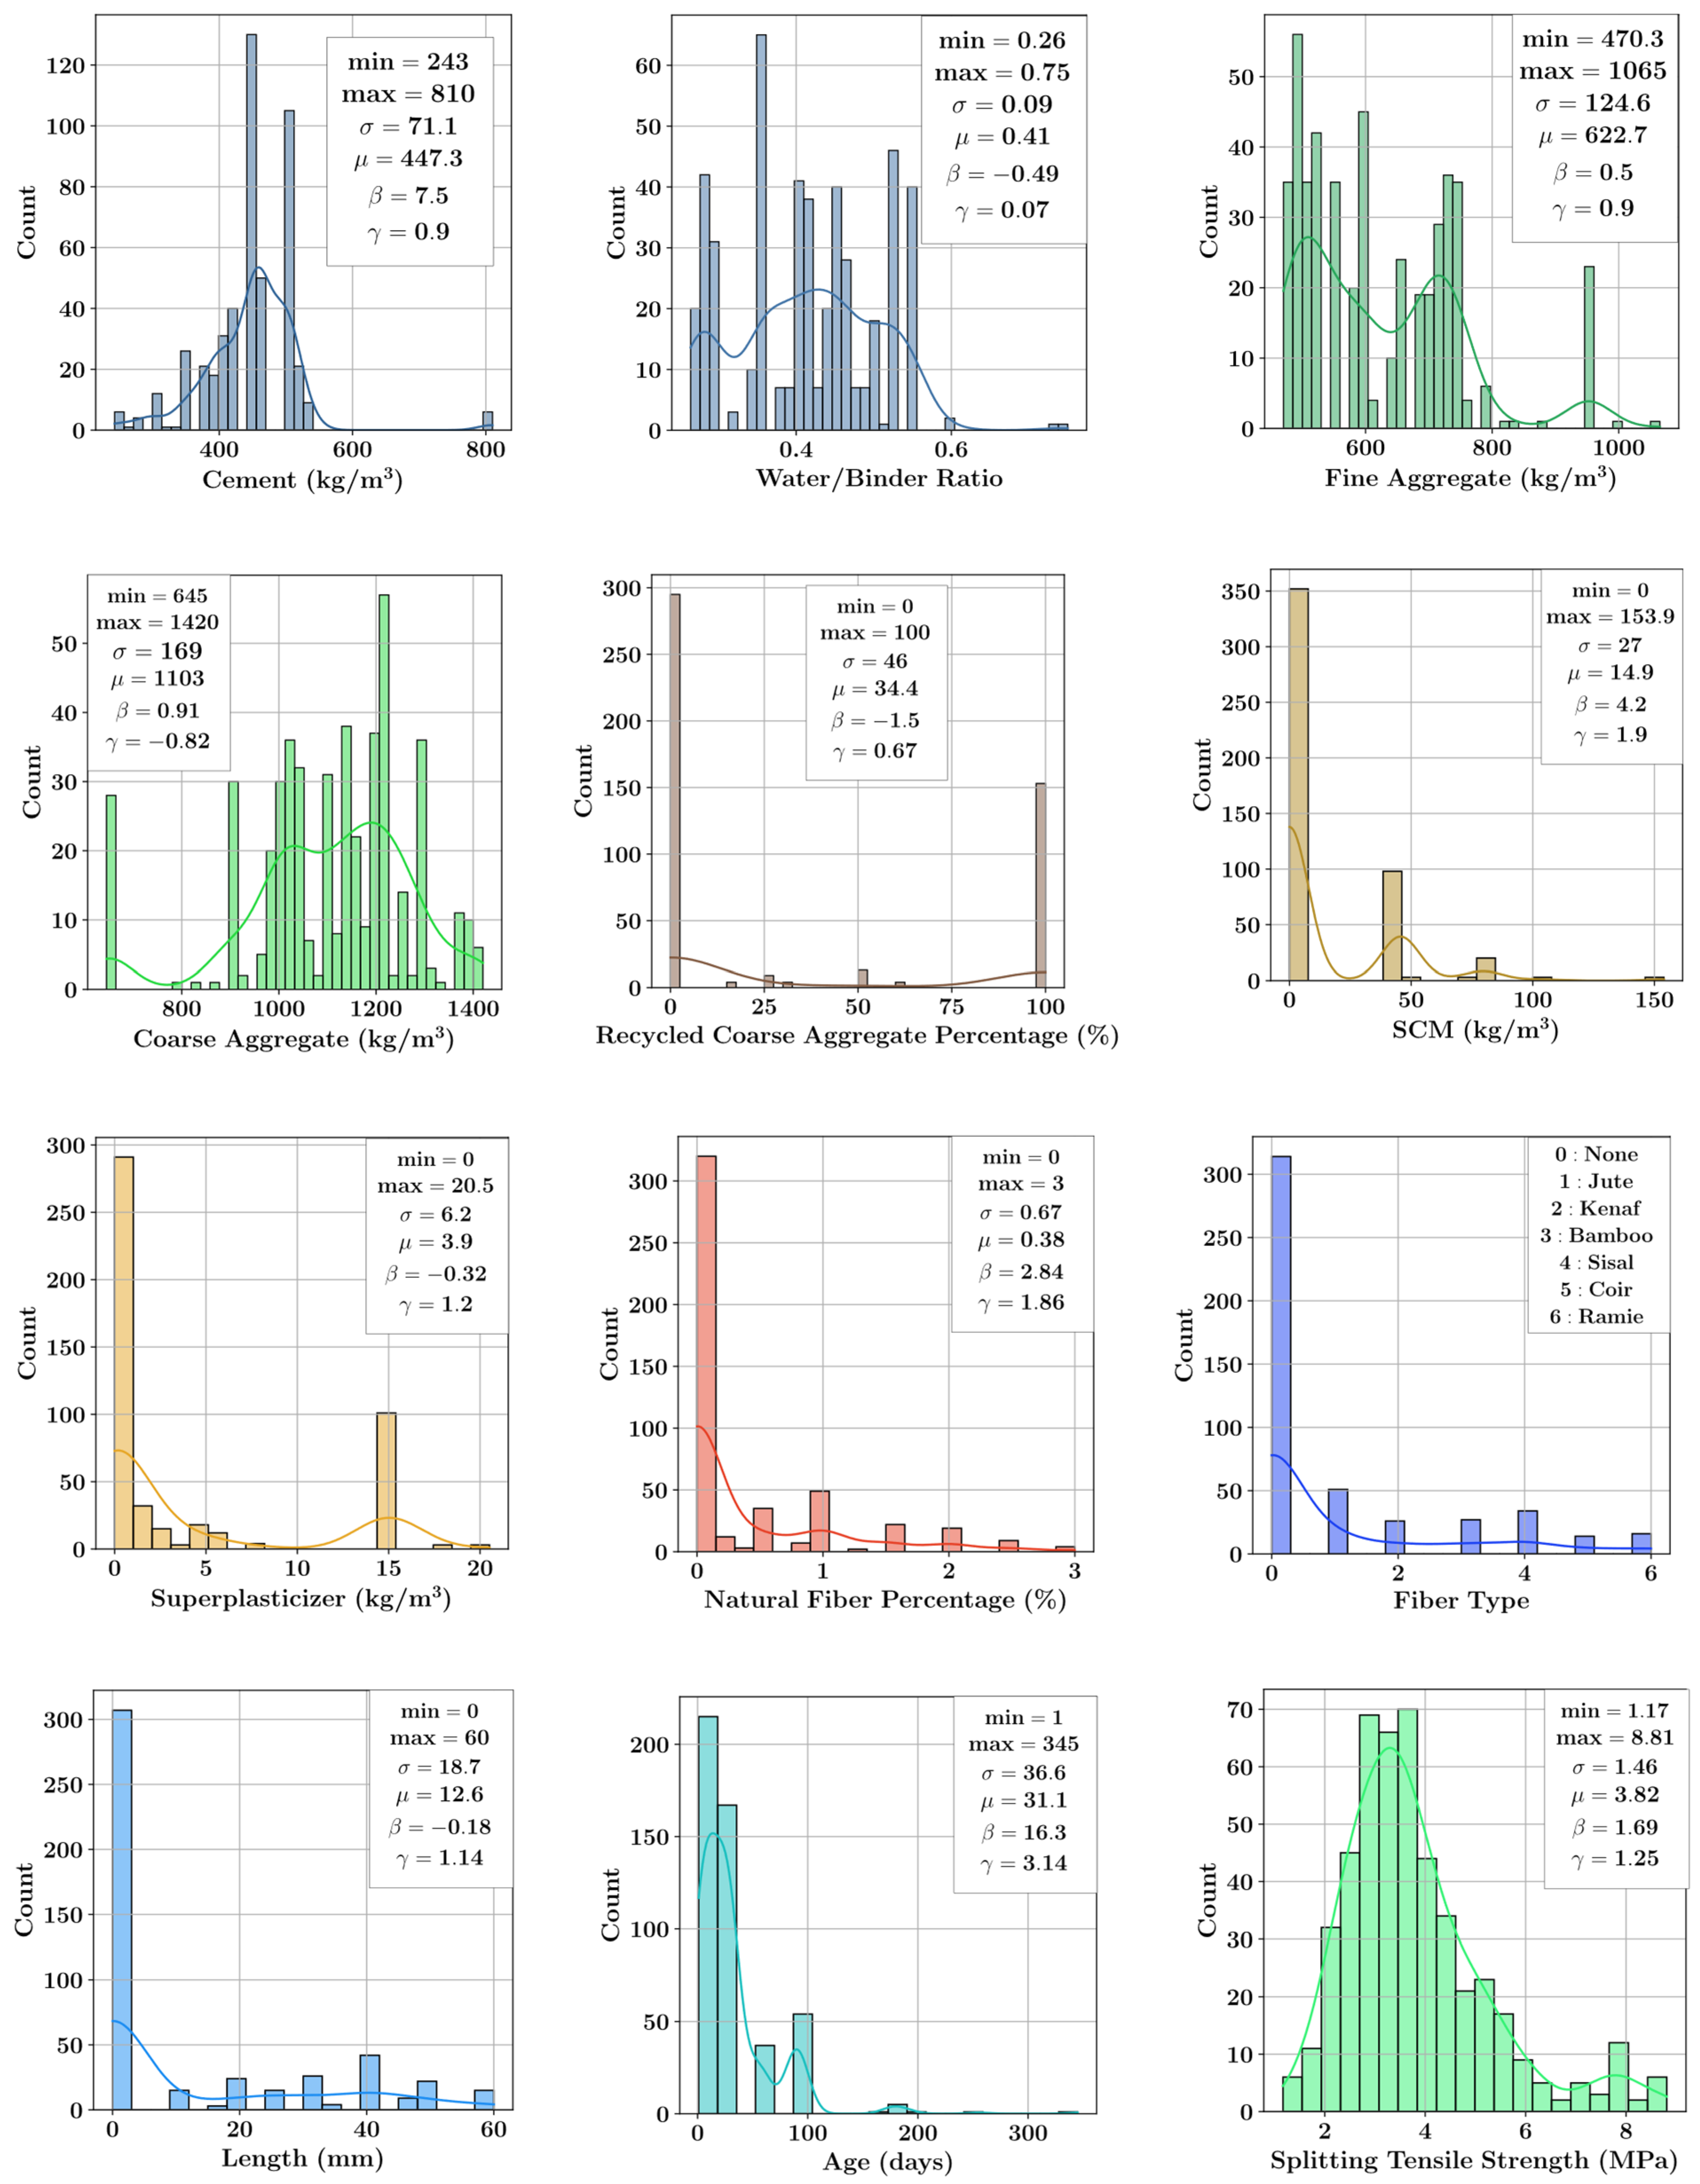
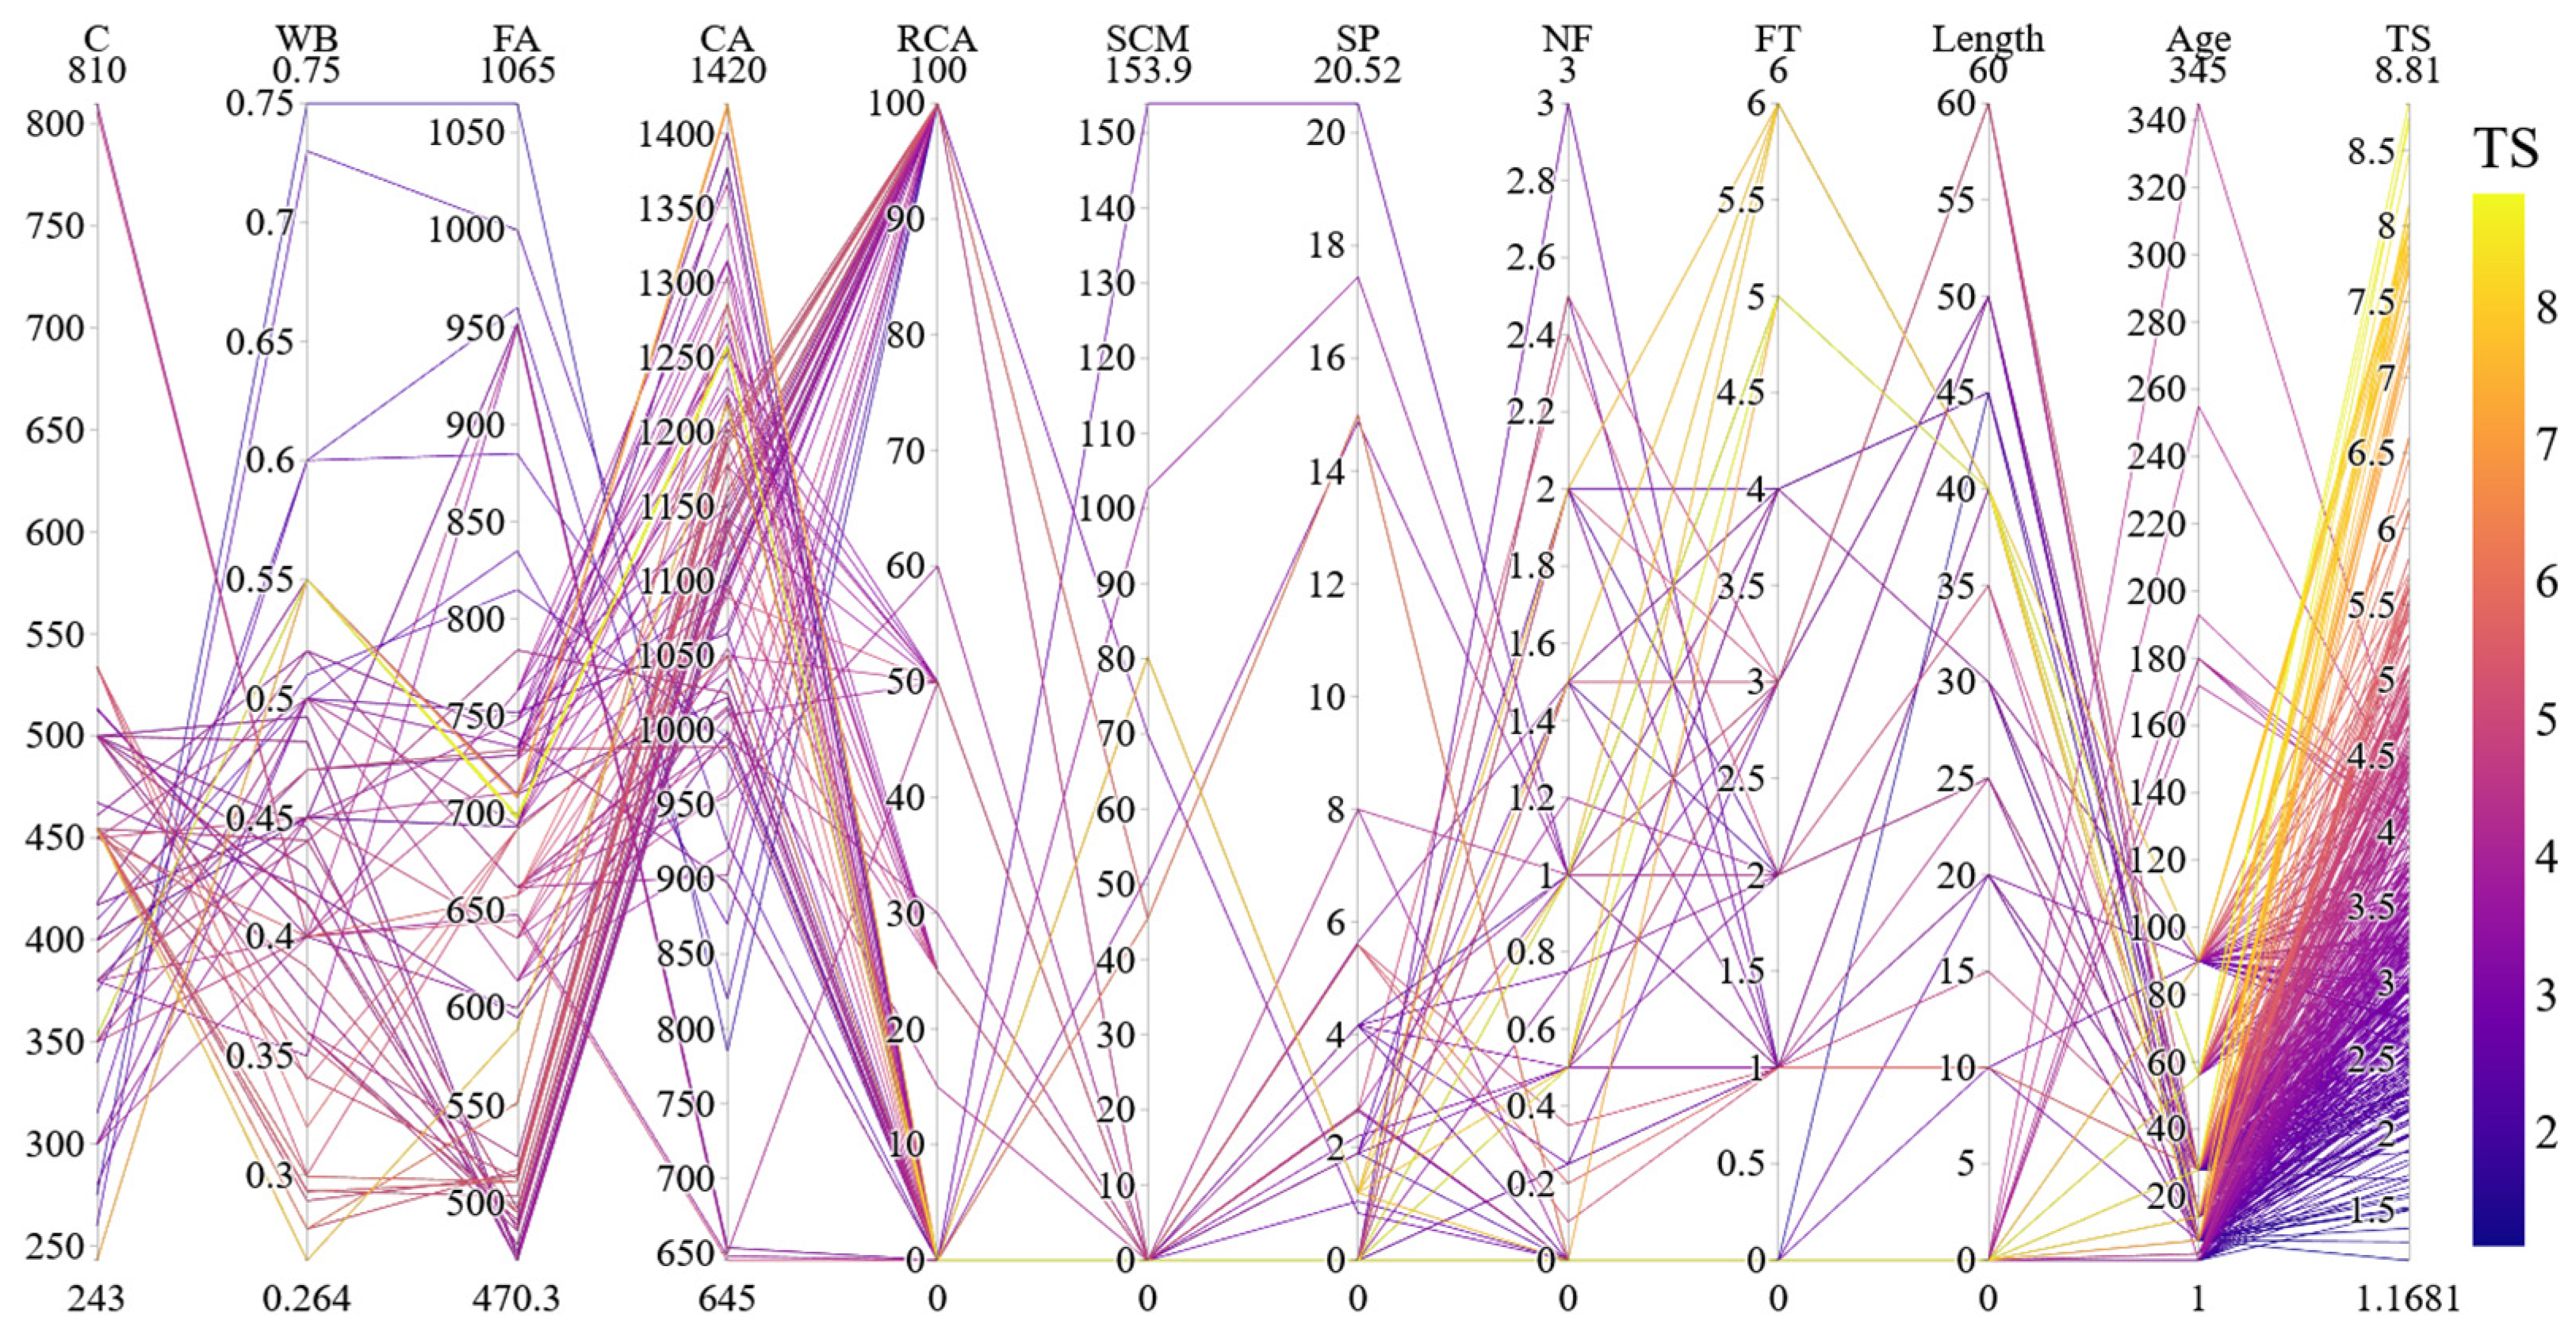
2.4. Statistical Analysis of the Dataset

The dataset consisting of 482 data points was collected from the literature [29]. The input features of this dataset are the amounts of cement, fine aggregate, coarse aggregate, superplasticizer, supplementary cementitious materials (SCM), such as fly ash and silica fume, water-to-binder ratio, percentages of recycled coarse aggregate and natural fiber, the type and length of fiber and age of concrete, whereas the output feature is the splitting tensile strength of concrete. The distributions of each one of these features are shown in Figure 2 in histogram format. Each histogram plot contains a kernel density estimator function in addition to the minimum and maximum values of the feature, the standard deviation ( σ ), the mean value ( μ ), kurtosis ( β ) and skewness ( γ ) values.
The ranges of each input and output feature are also presented in Figure 3, in a parallel coordinates plot. In Figure 3, each data point is represented by a line connecting the corresponding values of the input features with the corresponding output feature. The lines are also colored with respect to the corresponding tensile strength value. As the tensile strength values increase, the line color of the data points changes from tones of purple to tones of yellow. In Figure 3, FT, TS, SP, NF, C, WB, FA, CA and RCA stand for the fiber type, splitting tensile strength, superplasticizer amount, natural fiber percentage, cement amount, water-to-binder ratio, fine aggregate amount, coarse aggregate amount and the recycled coarse aggregate percentage, respectively. The parallel coordinates plot in Figure 3 also presents an alternative visualization for the distribution of the different features. As an example, it can be observed that, data points with fiber types 6 and 5 corresponding to coir and ramie fibers result in higher tensile strength.

2.5. Outlier Detection Techniques

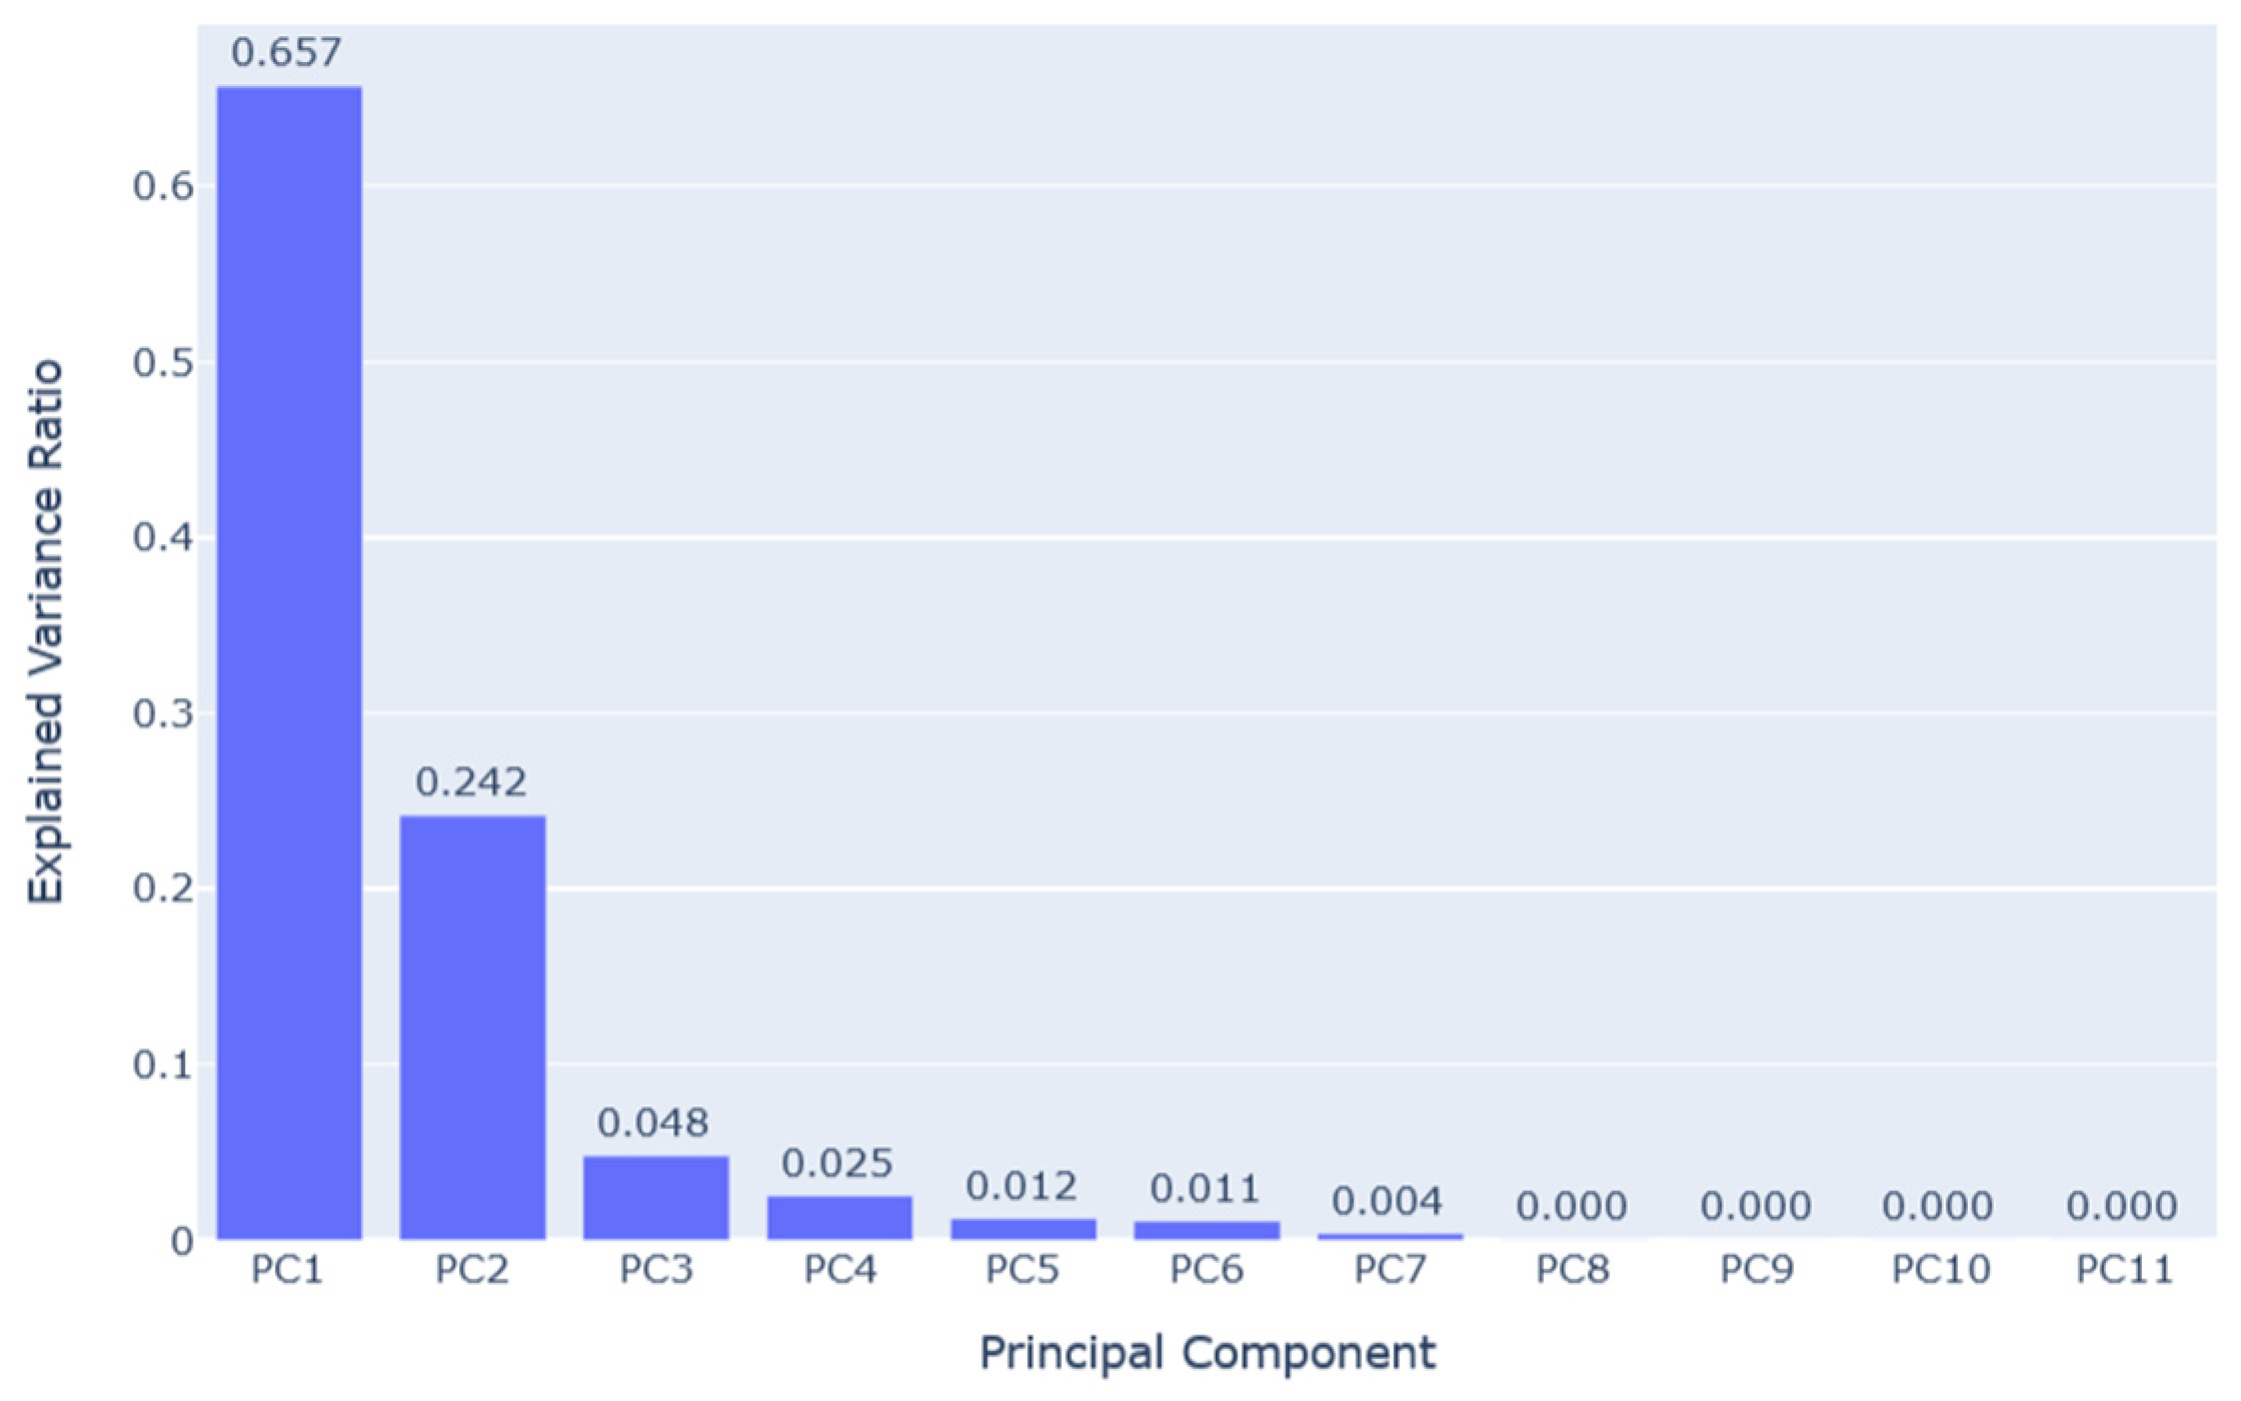
2.5.1. Principal Component Analysis (PCA)

PCA is a statistical technique used for dimensionality reduction. The method is particularly efficient in the case of datasets with a large number of input features. The PCA algorithm maps the data into a new vector space whose dimensions are called the principal components. Using the PCA technique, the dataset can be mapped into a lower dimensional vector space while avoiding any significant loss of information about the characteristics of the dataset. The principal components are ranked in such a way that the first components capture the largest variance in the dataset. As a result, the PCA technique makes the visualization and interpretation of higher dimensional datasets in a 2 or 3 dimensional vector space possible. However, it should be noted that the omission of the lower ranked principal components in the interpretation of datasets in 2 or 3 dimensions results in a loss of information [39]. In this study, the first 2 principal components have been used for visualization of the data points in the 2-dimensional Euclidean vector space. The positions of data points and their distances from the rest of the points in the dataset in 2-dimensional Euclidean space are used as an indicator of the normalcy or anomaly of a data point. The mapping of a dataset X into its principal components can be summarized as in Equation (3) [40].
X = X W ,     C o v X = 1 p 1 X μ T ( X μ )
In Equation (3), W is a transformation matrix whose columns are the eigenvectors of the covariance matrix of X in the decreasing order of the eigenvalues of C o v ( X ) . The transformed dataset in the vector space spanned by the principal components is denoted by X . The total number of data points and the matrix of mean values of each input feature are denoted with p and μ , respectively. Further details of the PCA procedure can be found in [40].

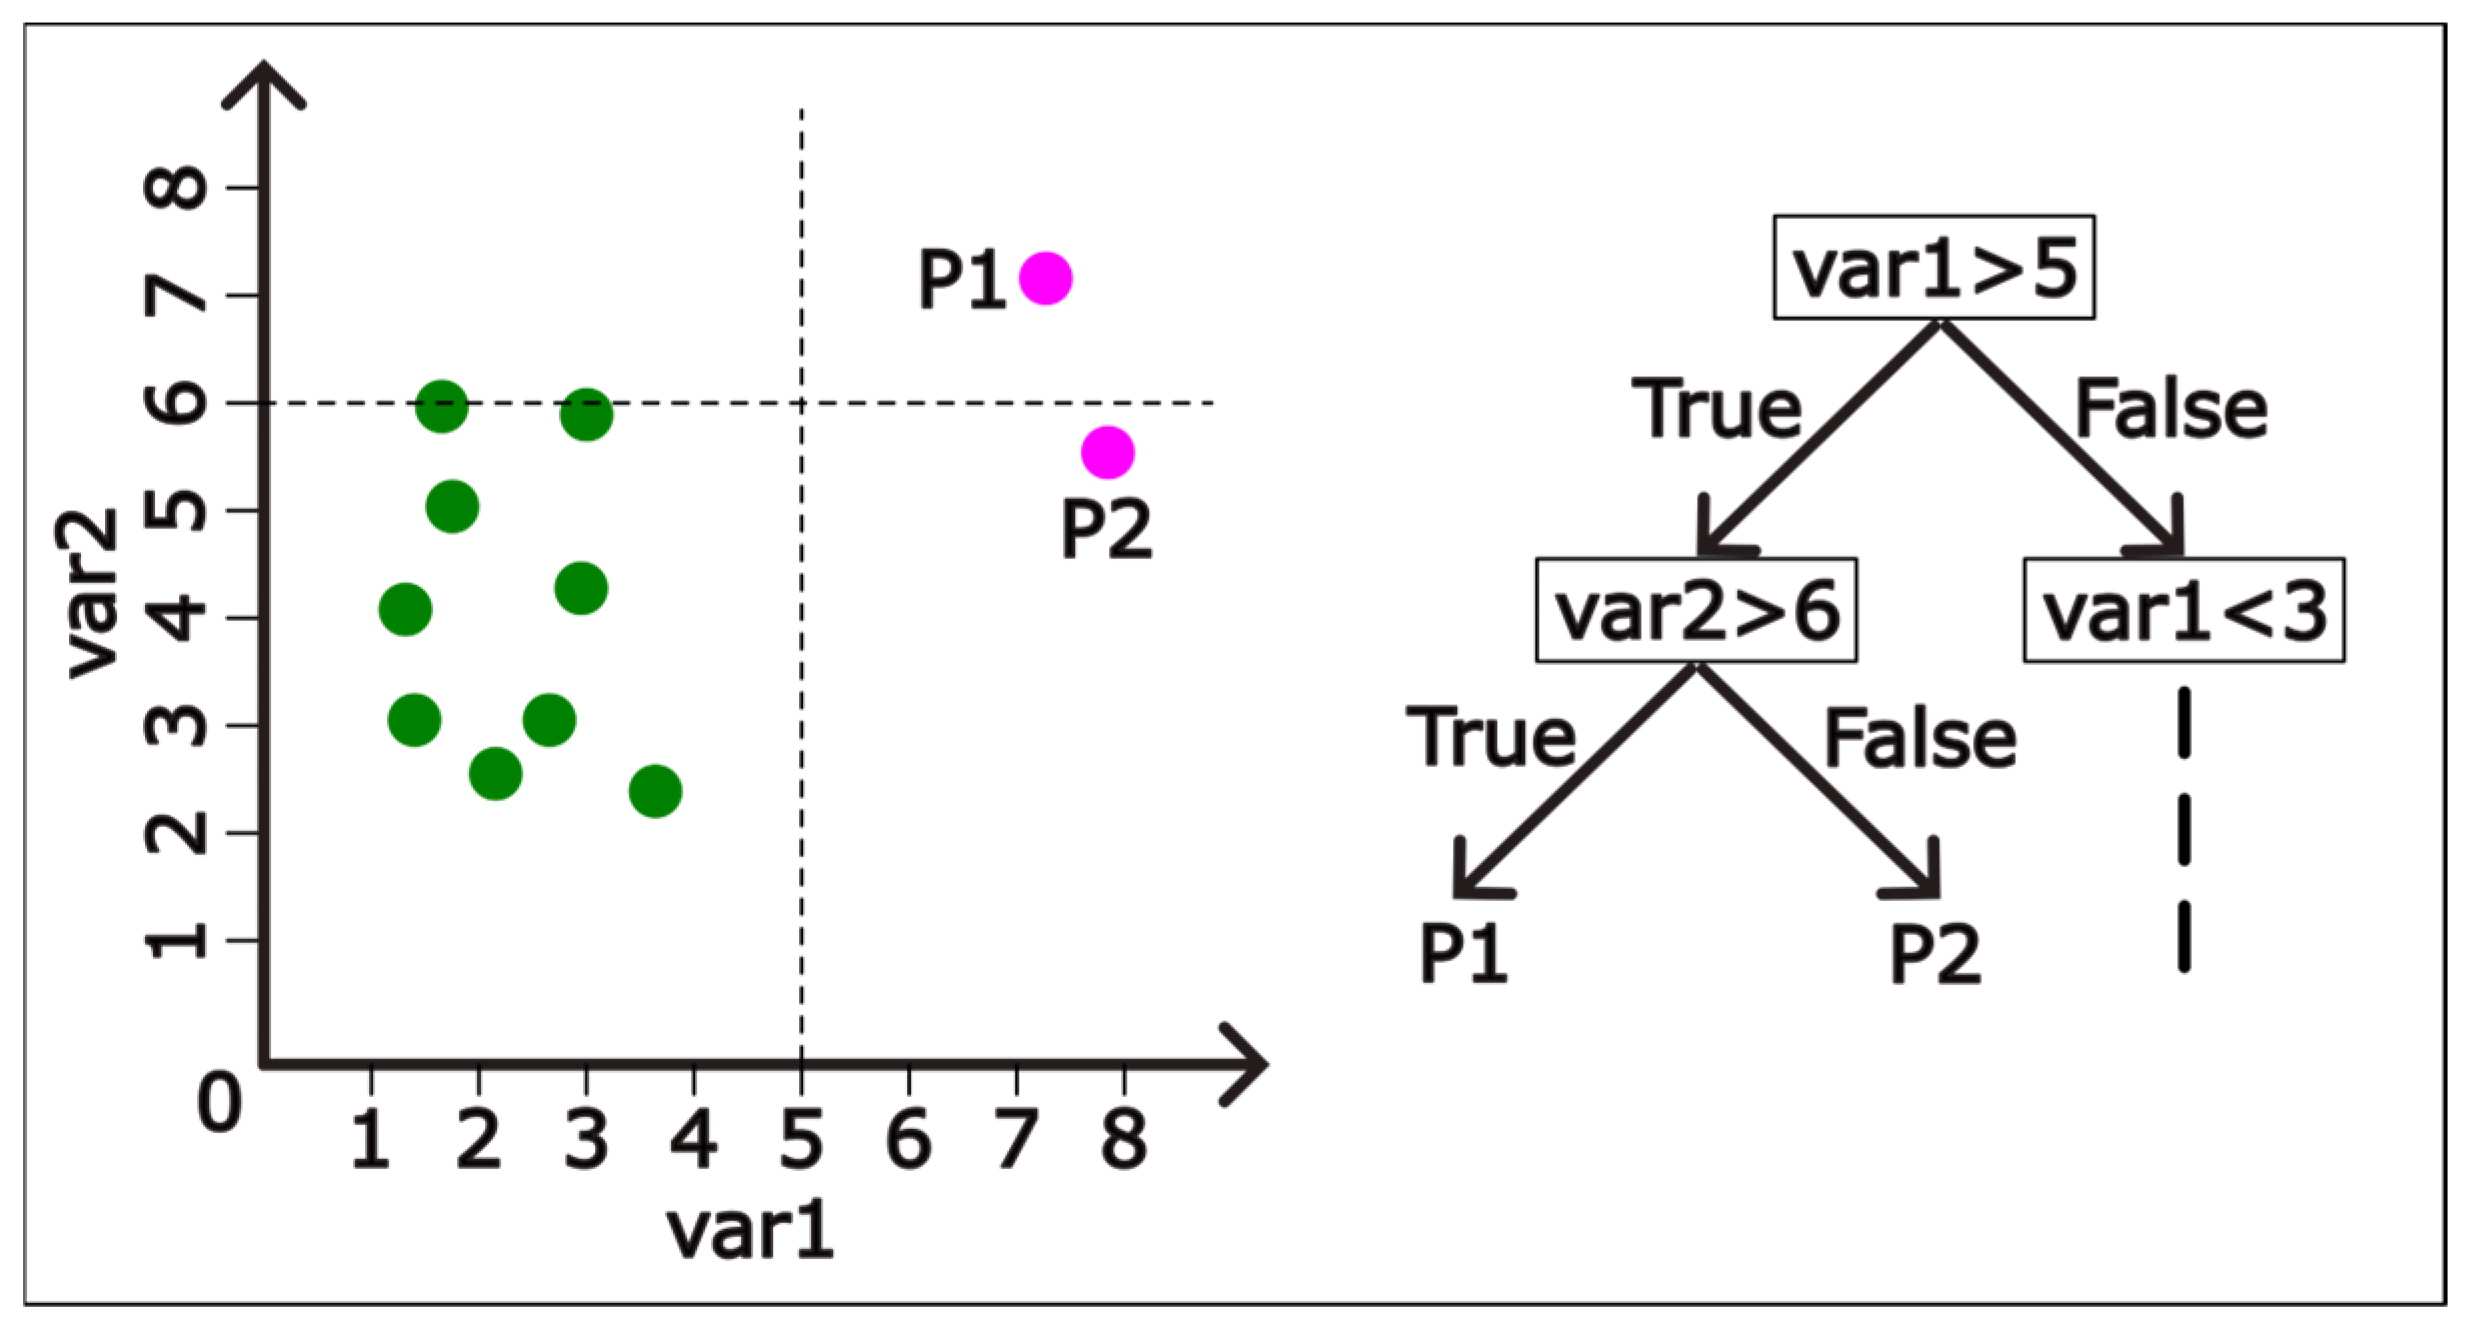
2.5.2. Isolation Forest

The isolation forest algorithm is based on separating each data point using binary decision trees with the goal of identifying anomalous data points. The decision trees used for this purpose consist of nodes that include conditions about the values of different features of the data. Each node separates the dataset into two sections. One of these sections includes those data points that fulfill the condition of the node and the other section includes those data points that do not fulfill the condition. The procedure is repeated with different conditions on the feature values until one of the sections contains only one isolated data point. Since anomalous data points tend to be farther away from the rest of the points in the dataset with respect to distance metrics such as the Euclidean distance, it takes on average a smaller number of node branching to isolate the anomalous points. This concept is further illustrated on a dataset consisting of 2-dimensional data points in Figure 4.
In Figure 4, it can be observed that it took only 2 conditional branches to isolate the data points P1 and P2 which are positioned farther away from the rest of the points in the dataset. In the particular example of Figure 4, the points P1 and P2 could be designated as the outliers of the dataset, whereas the remaining data points are deemed as the inliers. The operation illustrated in Figure 4 could be repeated with different conditions in the nodes of the binary tree. After repeating this operation a certain number of times, the average number of conditional branchings necessary to isolate each point in the dataset is calculated. For the outlier points, this number is expected to be significantly smaller than the inliers which builds the basis of the isolation forest methodology. Further details of the isolation forest algorithm can be found in [41,42]. A summary of the entire machine learning model development and interpretation procedure can be seen in Figure 5.

3. Results

This section presents the performance of the machine learning models in predicting the ultimate tensile strength ( f t ). The predictions of XGBoost, LightGBM, and extra trees regressor models were plotted against the experimental measurements. The performances of each predictive model were quantified using state-of-the-art error metrics such as the coefficient of determination and the root mean squared error. The predictive models were ranked according to their performance and the best performing model was analyzed in terms of the feature importance and the impacts of different input features on the model outputs. The Shapley additive explanations (SHAP) technique was used for analyzing the interdependencies of the features and the impacts of the features. The variation in the model output with respect to variations in different input features was visualized using individual conditional expectation (ICE) plots. Furthermore, using genetic programming, a new predictive closed form equation is proposed for the prediction of f t .

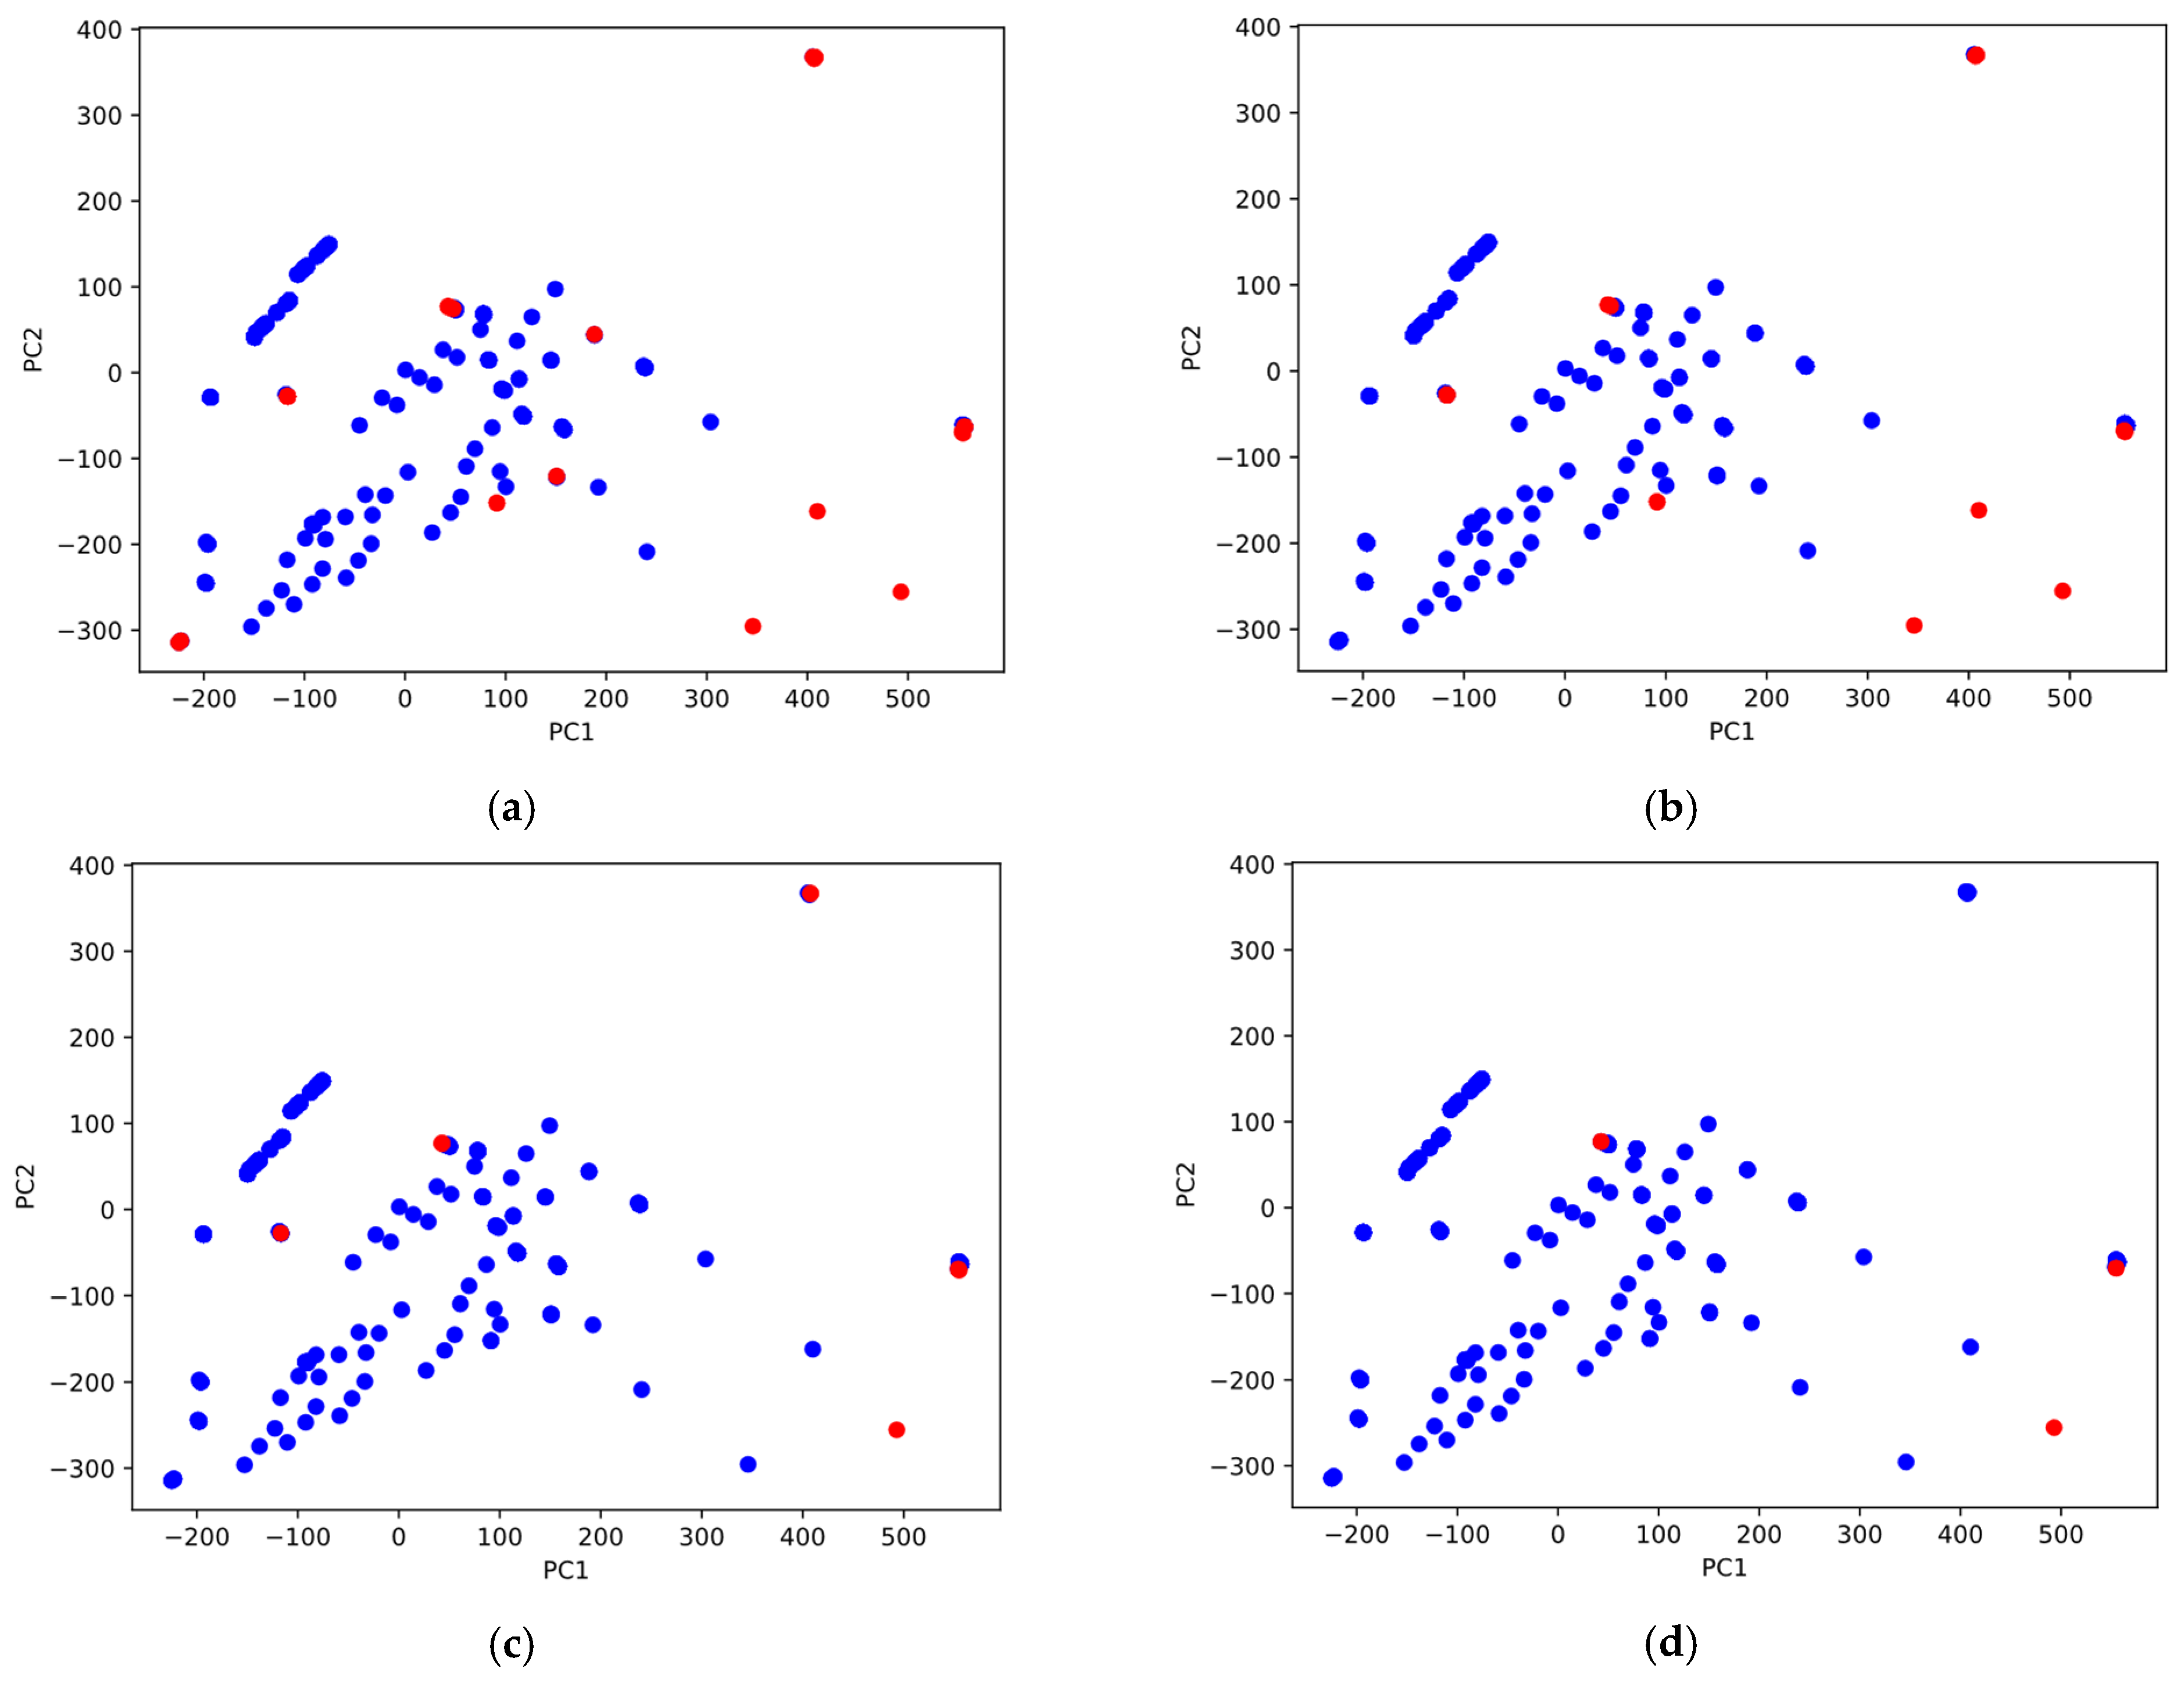
3.1. Outlier Detection Using Isolation Forest and Principal Component Analysis

The performance of a predictive machine learning model can be significantly altered due to outliers in the dataset. Therefore, prior to training the predictive models, the outliers were detected using the isolation forest algorithm and principal component analysis. The isolation forest algorithm was used to determine the indices of the data points that were potentially anomalous. Afterwards, the dataset was mapped into two dimensions using the first two principal components of the dataset in order to facilitate the visualization of the data points. The first two principal components were found to capture 90% of the variance in the dataset. The contribution of each principal component to explain the total variance in the dataset is shown in Figure 6. From Figure 6, it can be observed that the principal components with index 7, 8, 9, 10 and 11 contain near zero information about the variance in the dataset.
Figure 7 shows the distribution of the data points with respect to their first and second principal components. In Figure 7, the inlier data points are colored in blue whereas the outlier data points are colored in red. The data points were classified as inliers and outliers based on the results of the isolation forest algorithm. Figure 7 shows the outlier data points for four different levels of the contamination coefficient which determines the number of data points deemed as outliers. The largest number of outliers can be observed in Figure 7a for a contamination of 0.1 which corresponds to 10% of the data points being deemed as outliers.

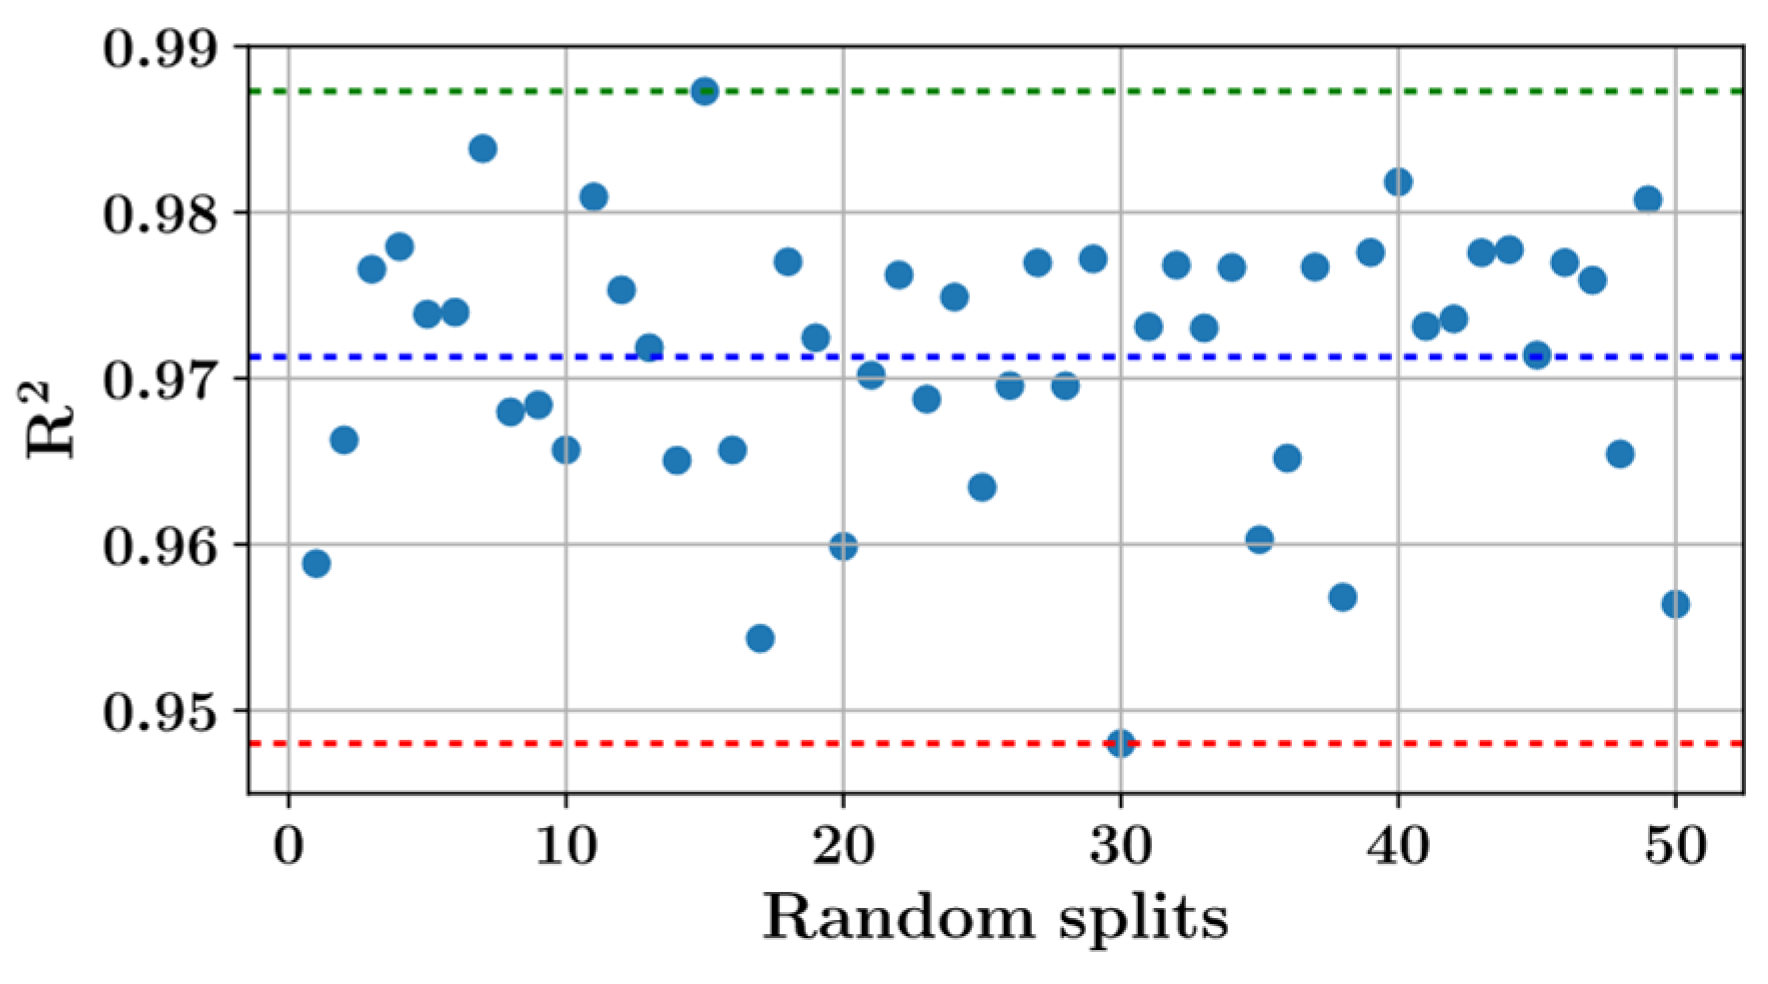
3.2. Predictions of the LightGBM, XGBoost and Extra Trees Regressors

In this section, the predictions of three predictive models are presented. Before training the models, 1% of the data points were removed as outliers. This percentage was selected in order to maximize the model performances. Figure 8 shows the variation in the predictive performances with respect to the amount of removed outliers represented by the contamination variable. In Figure 8, a contamination of 0.01 corresponds to 1% of the data points being removed from the dataset as outliers according to the isolation forest methodology. For each level of contamination in Figure 8, the inlier points of the dataset were randomly split into a training and test set in an 80% to 20% ratio. The model performances were measured on the test set after training the models on the training set. The average model performances resulting from 50 different random splits are presented in Figure 8. For all models in Figure 8, the contamination level of 0.01 delivered the best model performance. Therefore, this level of contamination was adopted for the rest of the analysis in this paper. It should be noted that increasing the contamination level beyond 0.02 is found to adversely affect the predictions.
Figure 8 shows that, on average, the best model performance could be obtained from the extra trees regressor. The fluctuation in the extra trees model performance for 50 different random splits of the inlier dataset can be seen in Figure 9. According to Figure 9, the extra trees model performance fluctuated between 0.948 and 0.987 on the test set with an average value of 0.971. In Figure 9, the maximum, minimum and average values of the R2 scores are shown with green, red and blue dashed lines, respectively.
The hyperparameters of the LightGBM, extra trees and XGBoost models were optimized using the blended search strategy (BlendSearch) and cost-related frugal optimization (CFO) algorithm implemented in the FLAML package. The steps of the optimization are presented in Figure 10 for the hyperparameters of the LightGBM model. The optimized values of the hyperparameters for all three predictive models and the performances of the predictive models are listed in Table 1 and Table 2, respectively.
For each predictive model, the predictions on the training and test set are visualized in Figure 11 for the random split corresponding to the best model performance. The predictions on the training and test sets are plotted in different colors. Furthermore, the ±10% deviation lines from a perfect prediction are plotted as dashed lines. In addition, for each predictive model, a linear curve was fitted which approximates the relationship between the predicted and true tensile strength values. In addition to the R2 score, the slope of the fitted curve can be used as an indicator of predictive performance such that slopes closer to 1 indicate more accurate prediction.

3.3. Graphical User Interface

In order to make the developed models available, an online graphical user interface was developed using the Streamlit platform. The online graphical user interface can be accessed through the link https://splitting-tensile-composite.streamlit.app (accessed on 6 January 2025). A screenshot of this user interface can be seen in Figure 12. The user interface is responsive to user input such that every time a new input feature value is entered by the user, the output value is automatically updated. The updated tensile strength value is then printed in the lower right portion of the screen in blue color. The input boxes only accept input feature values in certain predefined ranges based on the dataset on which the predictive model has been trained. In this sense, the predictive model is limited by the upper and lower bounds of the feature values included in the training set. The user interface is based on the extra trees regressor which delivered the best performance in terms of the coefficient of determination (R2 score).

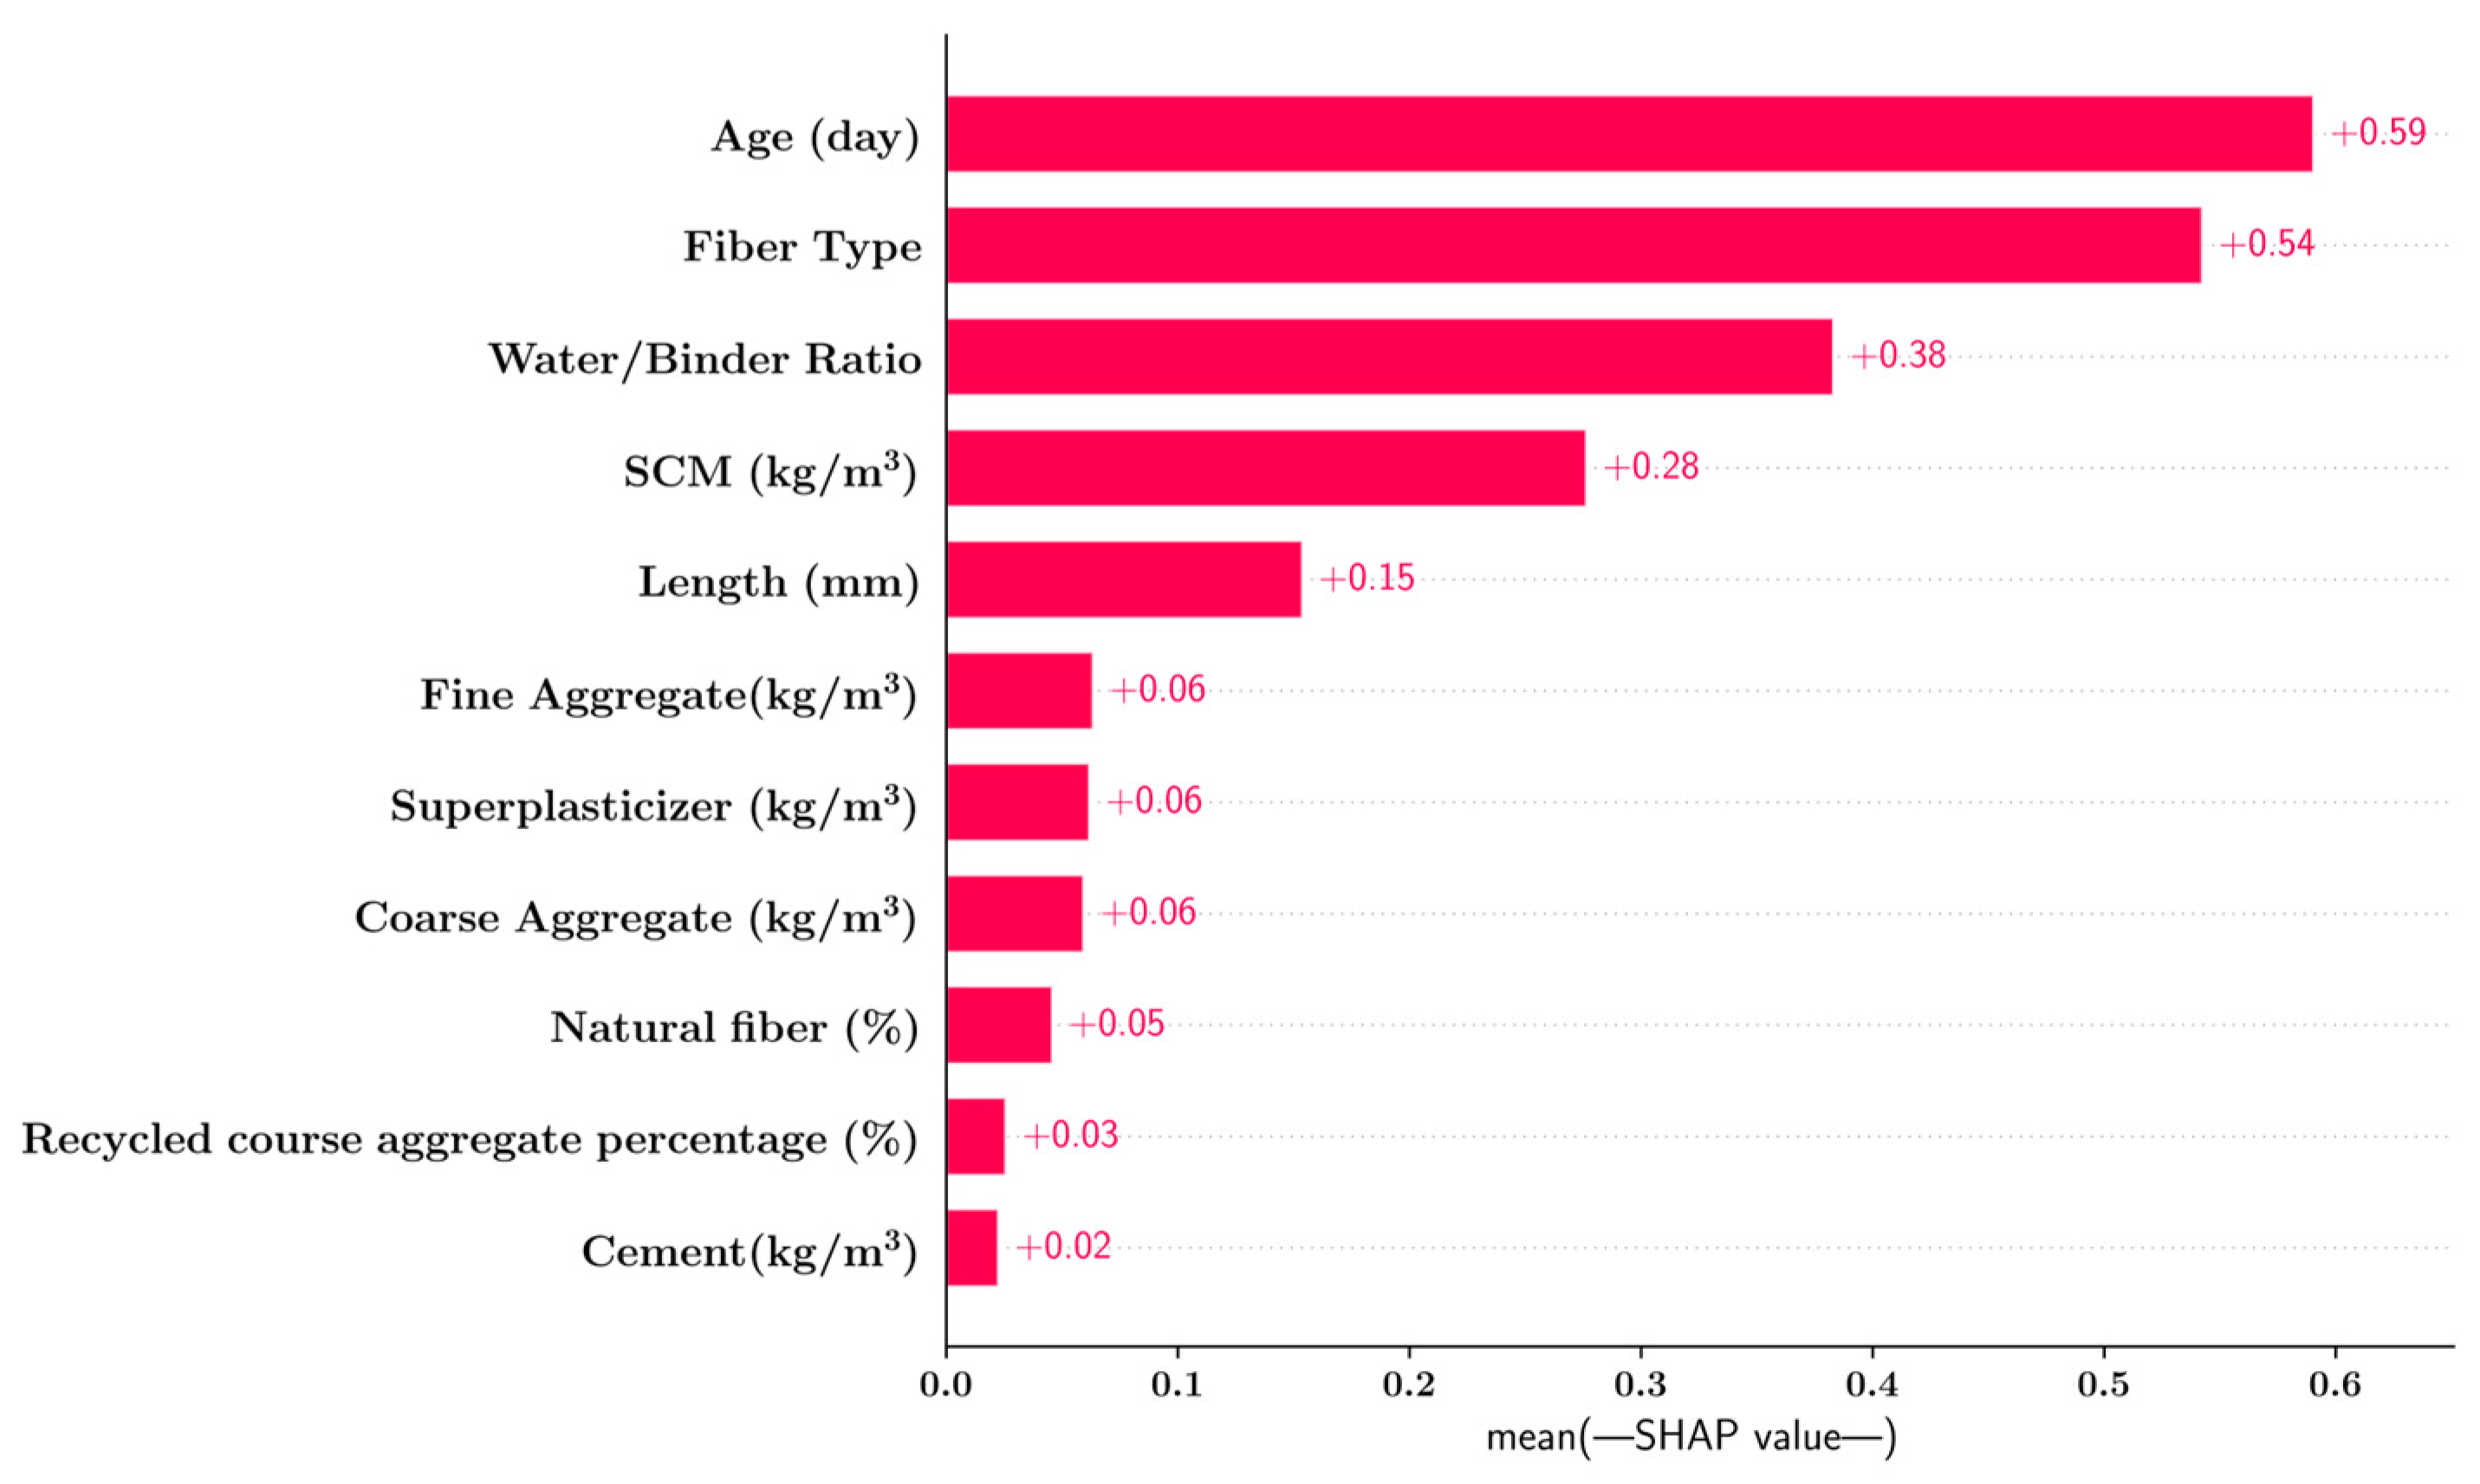
3.4. Feature Importance Analysis Using Shapley Additive Explanations (SHAP)

In this section, the impacts of the input features on the extra trees model predictions were quantified using a feature importance bar plot (Figure 13), a summary plot (Figure 14) and a heatmap plot (Figure 15) generated through the SHAP algorithm. Each one of these plots indicated that the age of the specimen, fiber type and water-to-binder ratio had the greatest impact on the predictive model output. The bar plot in Figure 13 is generated by calculating the SHAP value of each input feature and taking the mean absolute value of these SHAP values over the entire dataset. Figure 13 shows that the amount of cement, the percentage of the recycled coarse aggregate and the natural fiber percentage had the least impact on the model predictions.
The SHAP summary plot in Figure 14 contains additional information about the impacts of different input features in a color-coded way. In Figure 14, each data point is represented by a dot which has a certain color ranging between the tones of blue and red. The color is used as an indicator of the feature value in the summary plot such that high values of a feature lead to data points colored in red tones whereas low values lead to data points colored in blue. Furthermore, the position of a dot in the horizontal direction contains information about the impact of an input feature on the model output. For any input feature, as the position of a data point is further away from the zero SHAP value, the impact of that feature on the model output increases. Data points positioned to the right side of the zero SHAP value indicate a positive SHAP value and an increasing effect of the input feature on the model output. On the other hand, data points positioned to the left-hand side of the zero SHAP value indicate a negative SHAP value and a decreasing effect of that input feature on the model output. Accordingly, it can be observed that the inclusion of the specimen age as a predictive feature has an increasing effect on the model predictions for all data points. On the other hand, there is no clear indication about the effect of the age value on the model prediction since both blue and red colored data points are in equal distance from the zero SHAP point. The inclusion of the water-to-binder ratio is observed to have the opposite effect on the model outputs since all data points are on the left-hand side of the zero SHAP point. The effect of fiber type is such that the coir and ramie type fibers are coded with the integer values of five and six, respectively, as the two highest values of this feature. Since red colored data points at fiber-type level are far from the zero value to the right side, it can be inferred that the usage of coir and ramie as fiber types have an increasing effect on the tensile strength. The fiber types, jute and kenaf are coded with the integer values of one and two, respectively, as the two lowest values of this feature, in addition to the no fiber case coded with 0. Since the blue colored data points at the fiber type level are situated at the left and side of the zero SHAP value, it can be inferred that the usage of jute or kenaf or the omission of fibers has a decreasing effect on the tensile strength.
The SHAP heatmap plot in Figure 15 presents an alternative visualization of the feature impacts where each data point is represented with a vertical line colored according to the SHAP value of a feature. High SHAP values indicating high impact on the model output are color-coded in tones of red whereas low SHAP values are color-coded in blue tones. The heatmap plot also includes the predicted tensile strength values for each data point as the function f ( x ) at the upper side of the plot. Furthermore, feature importances are included at the right-hand side of the plot as black horizontal bars. It can be observed that features with the lowest impact, such as cement amount and recycled course aggregate percentage, are colored in tones of white since these features are associated with low SHAP values.

4. Conclusions

The inclusion of recycled coarse aggregate as a component of concrete in an attempt to replace natural aggregates has the potential to improve the sustainability of the construction industry significantly. However, the replacement of natural aggregates with recycled aggregates has been observed to reduce concrete strength. In order to remedy this effect of aggregate replacement, the addition of fibers into the concrete mix has been proposed as a viable option. However, in the literature, there is only a limited number of studies investigating the effect of natural fibers on the concrete properties. Furthermore, most structural design codes are lacking closed form equations that describe the behavior of concrete with recycled coarse aggregate and natural fiber. This study attempts to address this lack of information about the behavior of concrete using a data-driven approach. To this end, a recently published dataset of 482 experimental results was used to train state-of-the-art decision tree-based machine learning models. The predictions of these models were visualized and their performances quantified using the coefficient of determination (R2 score) which is a suitable metric for regression tasks since, unlike metrics such as mean absolute error or mean squared error, the R2 score does not depend on the order of magnitude of the predicted quantity. The main findings and contributions of this study can be summarized as follows:
(1)
The gradient boosting predictive models predicted the splitting tensile strength of natural fiber reinforced recycled coarse aggregate concrete with an R2 score greater than 0.95. The most accurate predictions were obtained from the extra trees regressor with an R2 score of 0.971 on the test set.
(2)
The prediction accuracy of the models could be improved by using principal component analysis and isolation forest as outlier detection techniques. By designating 1% of the data points positioned farthest from the rest of the dataset as outliers, the R2 score of the extra trees model could be enhanced from 0.965 to 0.971 on the test set.
(3)
An online graphical user interface has been made available on the Streamlit platform which can be accessed through the link https://splitting-tensile-composite.streamlit.app (accessed on 6 January 2025). It should be noted that the accuracy of the predictions made by the online tool is limited to the range of feature values included in the dataset on which the models were trained. The ranges of the input features are presented in Section 2.4. Further research needs to be carried out in order to expand the range of applicability of the machine learning models.
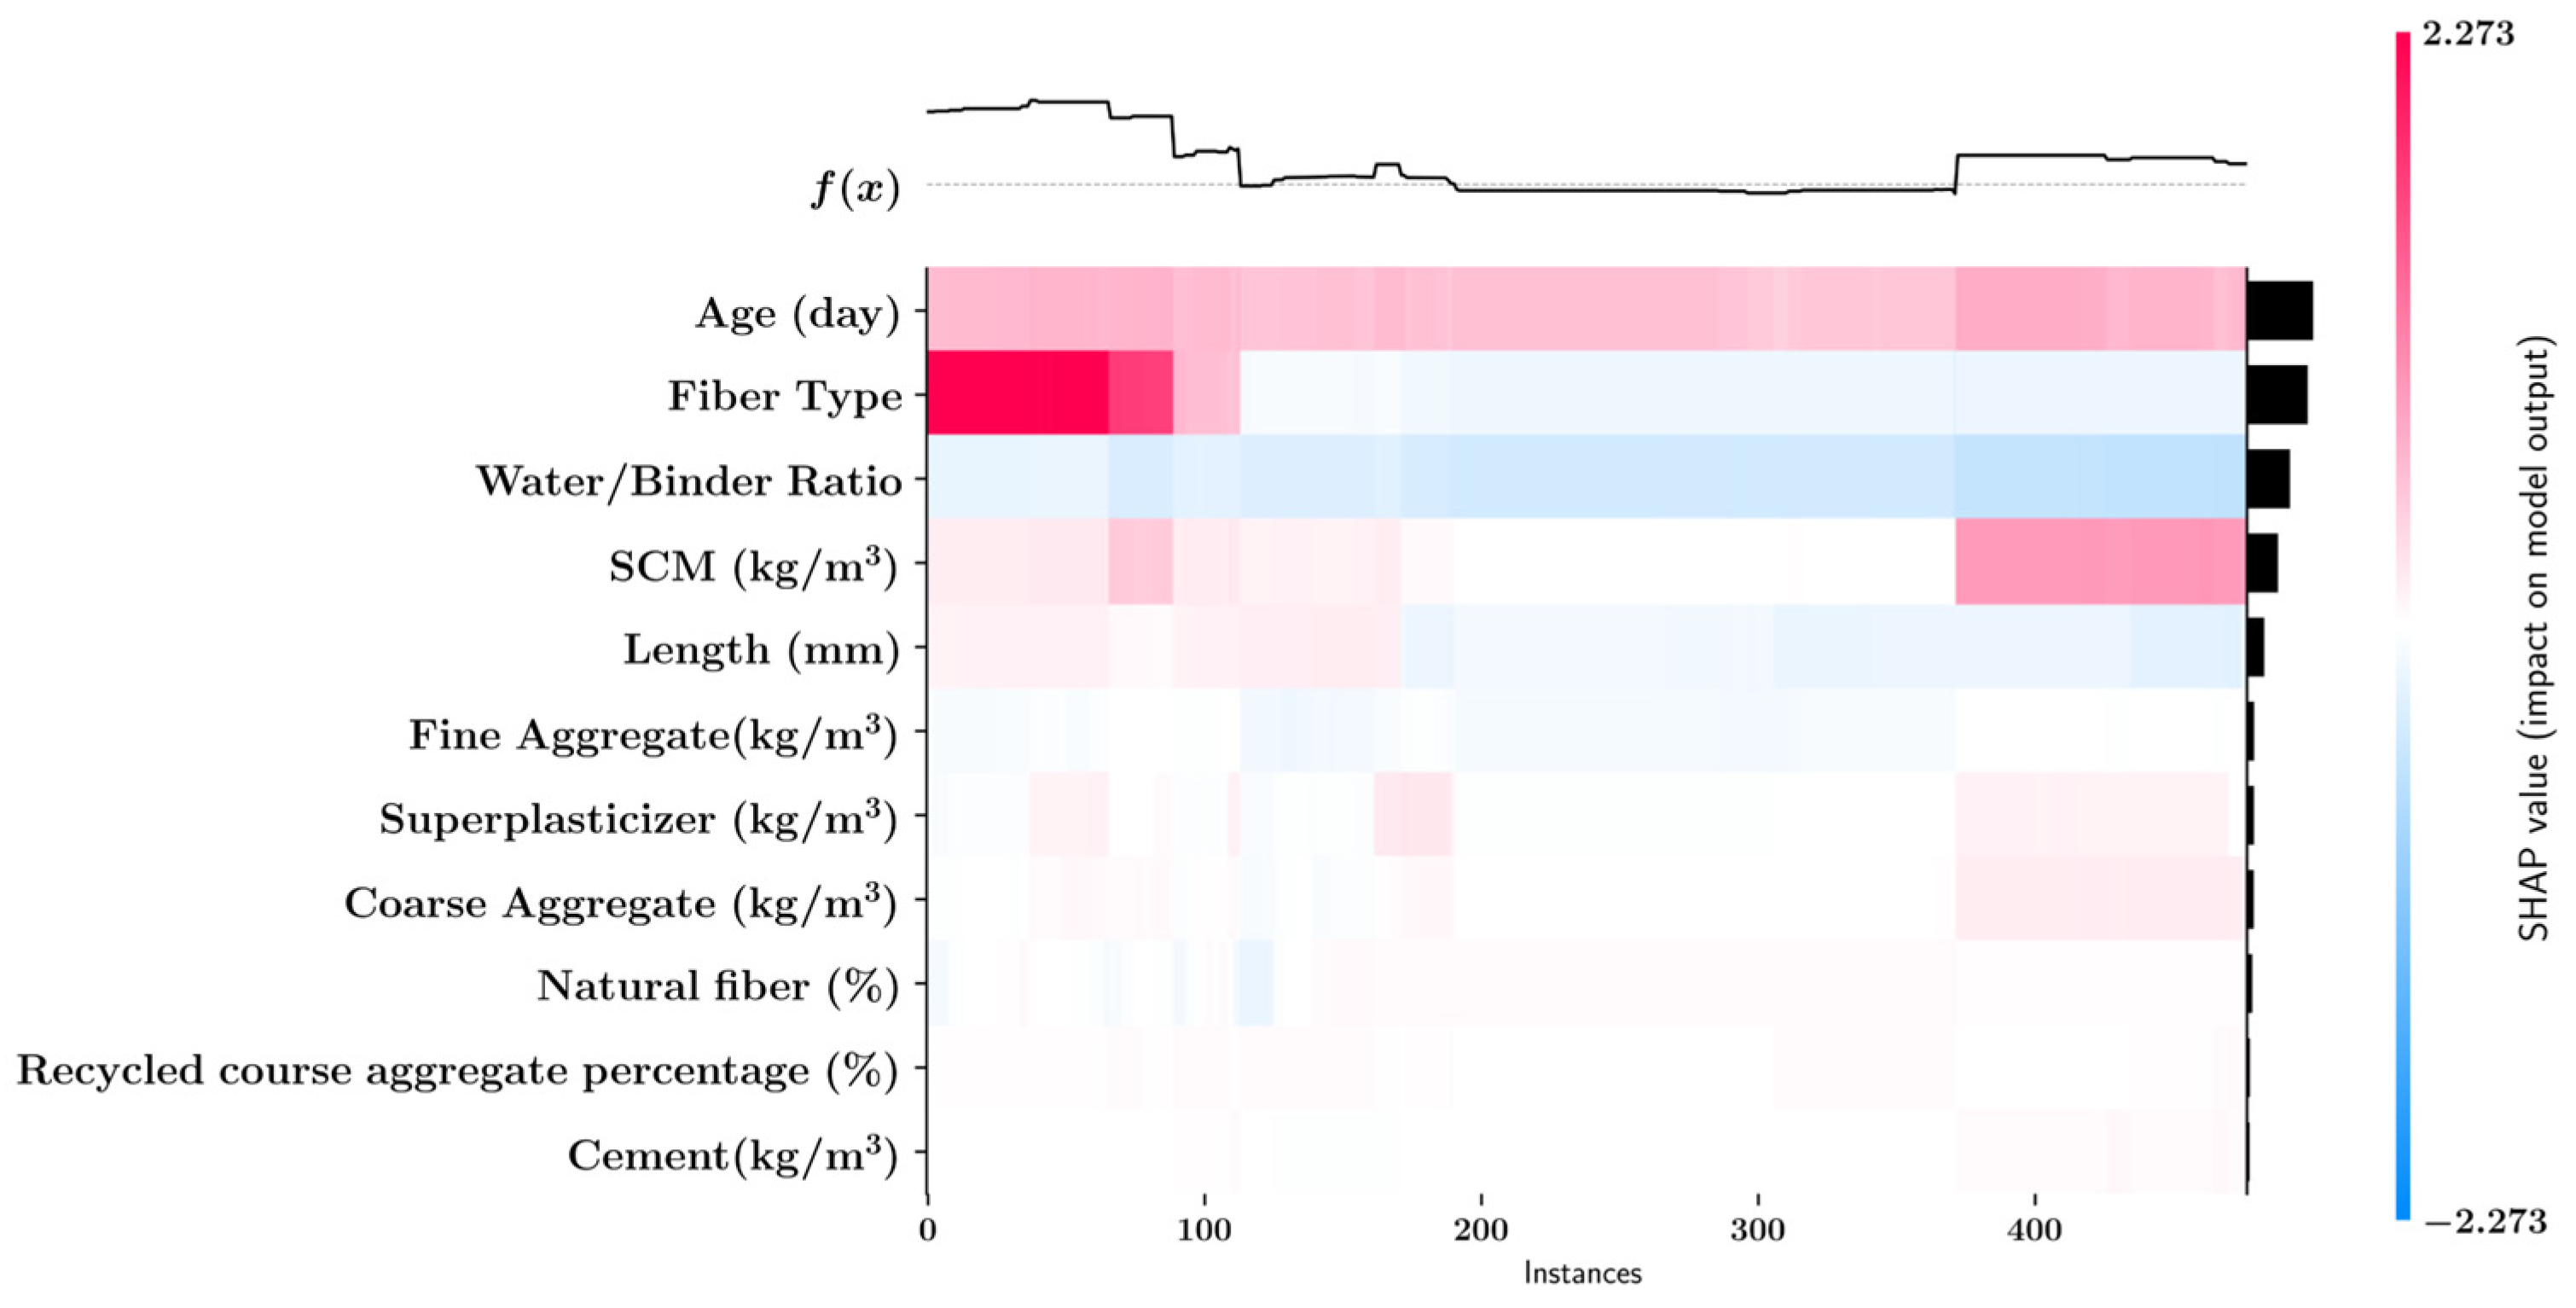
(4)
The impacts of the input features on the machine learning model predictions were quantified using the SHAP methodology. It was observed that the age of the concrete specimens, the type of fiber used and the water/binder ratio had the highest impact on the predicted tensile strength whereas the amount of cement and the percentages of the recycled coarse aggregate and natural fiber had the least impact.
Although the results of this data-driven approach to the prediction of mechanical properties were accurate, it should be noted that the applicability of the models is limited to the input feature ranges available in the training set. In order to achieve widely applicable data-driven predictive models, it is necessary to significantly expand the dataset to include wide ranges of input features. Future research in this area should include larger datasets in this area as they become available. As an alternative, the datasets could be enhanced with the results obtained from numerical simulations or by synthetic data generation using generative neural networks. In addition, future research could focus on the compressive strength prediction of natural fiber-reinforced recycled aggregate concrete which is a more important parameter in concrete design compared to the tensile strength.

Author Contributions

Conceptualization, G.B. and Z.W.G.; methodology, C.C.; software, C.C.; validation, C.C., G.B. and F.A.; formal analysis, C.C.; investigation, C.C.; data curation, G.B.; writing—original draft preparation, C.C. and F.A.; writing—review and editing, C.C., G.B., Z.W.G. and F.A.; visualization, C.C.; supervision, G.B. and Z.W.G. All authors have read and agreed to the published version of the manuscript.

Funding

This research received no external funding.

Data Availability Statement

The dataset used in this paper can be accessed through the following GitHub link: https://github.com/cakirogl/natural_fiber_recycled_aggregate/tree/main.

Conflicts of Interest

The authors declare no conflicts of interest.

References

  1. Hossain, F.M.Z.; Shahjalal, M.; Islam, K.; Tiznobaik, M.; Alam, M.S. Mechanical properties of recycled aggregate concrete containing crumb rubber and polypropylene fiber. Construct. Build. Mater. 2019, 225, 983–996. [Google Scholar] [CrossRef]
  2. Huda, S.B.; Alam, M.S. Mechanical and freeze-thaw durability properties of recycled aggregate concrete made with recycled coarse aggregate. J. Mater. Civ. Eng. 2015, 27, 04015003. [Google Scholar] [CrossRef]
  3. Revilla-Cuesta, V.; Ortega-Lopez, V.; Faleschini, F.; Espinosa, A.B.; Serrano-Lopez, R. Hammer rebound index as an overall-mechanical-quality indicator of self-compacting concrete containing recycled concrete aggregate. Construct. Build. Mater. 2022, 347, 128549. [Google Scholar] [CrossRef]
  4. Huda, S.B.; Alam, M.S. Mechanical behavior of three generations of 100% repeated recycled coarse aggregate concrete. Construct. Build. Mater. 2014, 65, 574–582. [Google Scholar] [CrossRef]
  5. Tamanna, K. Mechanical Properties of Rubberized Concrete Containing Recycled Concrete Aggregate and Polypropylene Fiber. Ph.D. Thesis, University of British Columbia, Vancouver, BC, Canada, 2018. [Google Scholar]
  6. Su, H. Properties of Concrete with Recycled Aggregates as Coarse Aggregate and As-Received/Surface-Modified Rubber Particles as Fine Aggregate. Ph.D. Thesis, University of Birmingham, Birmingham, UK, 2015. [Google Scholar]
  7. Alam, M.S.; Slater, E.; Billah, A.H.M.M. Green concrete made with RCA and FRP scrap aggregate: Fresh and hardened properties. J. Mater. Civ. Eng. 2013, 25, 1783–1794. [Google Scholar] [CrossRef]
  8. Limbachiya, M.C.; Leelawat, T.; Dhir, R.K. Use of recycled concrete aggregate in high-strength concrete. Mater. Struct. 2000, 33, 574. [Google Scholar] [CrossRef]
  9. Islam, M.J.; Shahjalal, M. Effect of polypropylene plastic on concrete properties as a partial replacement of stone and brick aggregate. Case Stud. Constr. Mater. 2021, 15, e00627. [Google Scholar] [CrossRef]
  10. Chen, A.; Han, X.; Chen, M.; Wang, X.; Wang, Z.; Guo, T. Mechanical and stress-strain behavior of basalt fiber reinforced rubberized recycled coarse aggregate concrete. Construct. Build. Mater. 2020, 260, 119888. [Google Scholar] [CrossRef]
  11. Alfayez, S.F. Eco-Effifficient Preplaced Recycled Aggregate Concrete Incorporating Recycled Tire Waste Rubber Granules and Steel Wire Fibre Reinforcement. Master’s Thesis, The University of Western Ontario, London, ON, Canada, 2018. [Google Scholar]
  12. Bittner, C.M.; Oettel, V. Fiber Reinforced Concrete with Natural Plant Fibers—Investigations on the Application of Bamboo Fibers in Ultra-High Performance Concrete. Sustainability 2022, 14, 12011. [Google Scholar] [CrossRef]
  13. Joachim, L.; Oettel, V. Experimental Investigations on the Application of Natural Plant Fibers in Ultra-High-Performance Concrete. Materials 2024, 17, 3519. [Google Scholar] [CrossRef]
  14. Beskopylny, A.N.; Shcherban’, E.M.; Stel’makh, S.A.; Chernilnik, A.; Elshaeva, D.; Ananova, O.; Mailyan, L.D.; Muradyan, V.A. Optimization of the Properties of Eco-Concrete Dispersedly Reinforced with Hemp and Flax Natural Fibers. J. Compos. Sci. 2025, 9, 56. [Google Scholar] [CrossRef]
  15. Jamshaid, H.; Ali, H.; Mishra, R.K.; Nazari, S.; Chandan, V. Durability and Accelerated Ageing of Natural Fibers in Concrete as a Sustainable Construction Material. Materials 2023, 16, 6905. [Google Scholar] [CrossRef] [PubMed]
  16. Zhao, K.; Xue, S.; Zhang, P.; Tian, Y.; Li, P. Application of Natural Plant Fibers in Cement-Based Composites and the Influence on Mechanical Properties and Mass Transport. Materials 2019, 12, 3498. [Google Scholar] [CrossRef] [PubMed]
  17. Sadouri, R.; Kebir, H.; Benyoucef, M. The Effect of Incorporating Juncus Fibers on the Properties of Compressed Earth Blocks Stabilized with Portland Cement. Appl. Sci. 2024, 14, 815. [Google Scholar] [CrossRef]
  18. da Costa Santos, A.C.; Archbold, P. Suitability of Surface-Treated Flax and Hemp Fibers for Concrete Reinforcement. Fibers 2022, 10, 101. [Google Scholar] [CrossRef]
  19. Wu, Y.; Wu, Y.; Wu, Y. Research on a New Plant Fiber Concrete-Light Steel Keel Wall Panel. Sustainability 2023, 15, 8109. [Google Scholar] [CrossRef]
  20. Jamshaid, H.; Mishra, R.K.; Raza, A.; Hussain, U.; Rahman, M.L.; Nazari, S.; Chandan, V.; Muller, M.; Choteborsky, R. Natural Cellulosic Fiber Reinforced Concrete: Influence of Fiber Type and Loading Percentage on Mechanical and Water Absorption Performance. Materials 2022, 15, 874. [Google Scholar] [CrossRef]
  21. Momeni, E.; Omidinasab, F.; Dalvand, A.; Goodarzimehr, V.; Eskandari, A. Flexural Strength of Concrete Beams Made of Recycled Aggregates: An Experimental and Soft Computing-Based Study. Sustainability 2022, 14, 11769. [Google Scholar] [CrossRef]
  22. Dantas, A.T.A.; Leite, M.B.; de Jesus Nagahama, K. Prediction of compressive strength of concrete containing construction and demolition waste using artificial neural networks. Constr. Build. Mater. 2013, 38, 717–722. [Google Scholar] [CrossRef]
  23. Felix, E.F.; Possan, E.; Carrazedo, R. A New Formulation to Estimate the Elastic Modulus of Recycled Concrete Based on Regression and ANN. Sustainability 2021, 13, 8561. [Google Scholar] [CrossRef]
  24. Dai, L.; Wu, X.; Zhou, M.; Ahmad, W.; Ali, M.; Sabri, M.M.S.; Salmi, A.; Ewais, D.Y.Z. Using Machine Learning Algorithms to Estimate the Compressive Property of High Strength Fiber Reinforced Concrete. Materials 2022, 15, 4450. [Google Scholar] [CrossRef] [PubMed]
  25. Yuan, X.; Tian, Y.; Ahmad, W.; Ahmad, A.; Usanova, K.I.; Mohamed, A.M.; Khallaf, R. Machine Learning Prediction Models to Evaluate the Strength of Recycled Aggregate Concrete. Materials 2022, 15, 2823. [Google Scholar] [CrossRef] [PubMed]
  26. Abed, M.; Mehryaar, E. A Machine Learning Approach to Predict Relative Residual Strengths of Recycled Aggregate Concrete after Exposure to High Temperatures. Sustainability 2024, 16, 1891. [Google Scholar] [CrossRef]
  27. Rodsin, K.; Ejaz, A.; Wang, H.; Saingam, P.; Joyklad, P.; Khaliq, W.; Hussain, Q.; Boonmee, C. Machine Learning and Regression Models for Evaluating Ultimate Performance of Cotton Rope-Confined Recycled Aggregate Concrete. Buildings 2025, 15, 64. [Google Scholar] [CrossRef]
  28. Zhu, Y.; Ahmad, A.; Ahmad, W.; Vatin, N.I.; Mohamed, A.M.; Fathi, D. Predicting the Splitting Tensile Strength of Recycled Aggregate Concrete Using Individual and Ensemble Machine Learning Approaches. Crystals 2022, 12, 569. [Google Scholar] [CrossRef]
  29. Aayaz, R. Natural Fiber-Recycled Aggregate Concrete; Mendeley Data, V1; Elsevier: Amsterdam, The Netherlands, 2024. [Google Scholar] [CrossRef]
  30. Guruswamy, K.P.; Thambiannan, S.; Anthonysamy, A.; Jalgaonkar, K.; Dukare, A.S.; Pandiselvam, R.; Jha, N. Coir fibre-reinforced concrete for enhanced compressive strength and sustainability in construction applications. Heliyon 2024, 10, e39773. [Google Scholar] [CrossRef]
  31. Dayananda, N.; Keerthi Gowda, B.S.; Easwara Prasad, G.L. A study on compressive strength attributes of jute fiber reinforced cement concrete composites. In Proceedings of the IOP Conference Series: Materials Science and Engineering, Beijing, China, 16–18 March 2018; IOP Publishing: Bristol, UK, 2018; Volume 376, p. 012069. [Google Scholar] [CrossRef]
  32. Aladsani, M.A.; Burton, H.; Abdullah, S.A.; Wallace, J.W. Explainable Machine Learning Model for Predicting Drift Capacity of Reinforced Concrete Walls. ACI Struct. J. 2022, 119, 191–204. [Google Scholar] [CrossRef]
  33. Wang, C.; Wu, Q.; Huang, S.; Saied, A. Economic hyperparameter optimization with blended search strategy. In Proceedings of the Ninth International Conference on Learning Representations (ICLR 2021), Virtual, 3–7 May 2021. [Google Scholar]
  34. Wu, Q.; Wang, C.; Huang, C. Frugal Optimization for Cost-related Hyperparameters. In Proceedings of the Thirty-Fifth AAAI Conference on Artificial Intelligence (AAAI-21), Virtual, 2–9 February 2021. [Google Scholar]
  35. Lundberg, S.M.; Lee, S.I. A unified approach to interpreting model predictions. In Proceedings of the 31st Conference on Neural Information Processing Systems (NIPS 2017), Long Beach, CA, USA, 4–9 December 2017. [Google Scholar]
  36. Mangalathu, S.; Hwang, S.H.; Jeon, J.S. Failure mode and effects analysis of RC members based on machine-learning-based SHapley Additive exPlanations (SHAP) approach. Eng. Struct. 2020, 219, 110927. [Google Scholar] [CrossRef]
  37. Mangalathu, S.; Shin, H.; Choi, E.; Jeon, J.S. Explainable machine learning models for punching shear strength estimation of flat slabs without transverse reinforcement. J. Build. Eng. 2021, 39, 102300. [Google Scholar] [CrossRef]
  38. Lyngdoh, G.A.; Zaki, M.; Krishnan, N.A.; Das, S. Prediction of concrete strengths enabled by missing data imputation and interpretable machine learning. Cem. Concr. Compos. 2022, 128, 104414. [Google Scholar] [CrossRef]
  39. Chen, M.; Park, Y.; Mangalathu, S.; Jeon, J.S. Effect of data drift on the performance of machine-learning models: Seismic damage prediction for aging bridges. Earthq. Eng. Struct. Dyn. 2024, 53, 4541–4561. [Google Scholar] [CrossRef]
  40. Gewers, F.L.; Ferreira, G.R.; Arruda, H.F.D.; Silva, F.N.; Comin, C.H.; Amancio, D.R.; Costa, L.D.F. Principal component analysis: A natural approach to data exploration. ACM Comput. Surv. (CSUR) 2021, 54, 1–34. [Google Scholar] [CrossRef]
  41. Liu, F.T.; Ting, K.M.; Zhou, Z.-H. Isolation Forest. In Proceedings of the ICDM ’08: Proceedings of the 2008 Eighth IEEE International Conference on Data Mining, Pisa, Italy, 15–19 December 2008; pp. 413–422. [Google Scholar] [CrossRef]
  42. Liu, F.T.; Ting, K.M.; Zhou, Z.-H. Isolation-based anomaly detection. ACM Trans. Knowl. Discov. Data (TKDD) 2012, 6, 3. [Google Scholar] [CrossRef]
Figure 1. (a) Coir [30], (b) ramie [16], (c) jute [31] fibers.
Jcs 09 00119 g001
Figure 2. Distribution of the input and output features.
Jcs 09 00119 g002
Figure 3. Parallel coordinates’ plot of the dataset.
Jcs 09 00119 g003
Figure 4. Isolation of data points.
Jcs 09 00119 g004
Figure 5. Predictive model development and interpretation.
Jcs 09 00119 g005
Figure 6. Explained variance ratios.
Jcs 09 00119 g006
Figure 7. Outliers for (a) contamination = 0.1, (b) contamination = 0.06, (c) contamination = 0.02, (d) contamination = 0.01.
Jcs 09 00119 g007
Figure 8. Model performances with respect to contamination.
Jcs 09 00119 g008
Figure 9. Extra trees model performance fluctuations on the test set.
Jcs 09 00119 g009
Figure 10. Hyperparameter optimization steps.
Jcs 09 00119 g010
Figure 11. Predicted and true values for (a) extra trees, (b) LightGBM, (c) XGBoost.
Jcs 09 00119 g011
Figure 12. Online graphical user interface.
Jcs 09 00119 g012
Figure 13. SHAP feature importances.
Jcs 09 00119 g013
Figure 14. SHAP summary plot.
Jcs 09 00119 g014
Figure 15. SHAP heatmap plot.
Jcs 09 00119 g015
Table 1. Optimal hyperparameters.
AlgorithmOptimal Hyperparameters
LightGBMn_estimators: 380, learning_rate: 0.0438, num_leaves: 31, max_depth: −1, min_child_samples: 2, subsample: 1.0, colsample_bytree: 0.4779, reg_alpha: 0.0028, reg_lambda: 0.1005, min_split_gain: 0.0, min_child_weight: 0.001
Extra Treesn_estimators: 13, max_depth: None, min_samples_split: 2, min_samples_leaf:1, min_weight_fraction_leaf:0.0, max_leaf_nodes: 191, min_impurity_decrease: 0.0, ccp_alpha: 0.0, max_samples: None
XGBoostn_estimators: 96, learning_rate: 0.1868, max_depth: 0, subsample: 0.5599, colsample_bytree: 0.6668, reg_alpha: 0.3023, reg_lambda: 0.00097, min_child_weight: 0.218
Table 2. Performances of the optimized models.
AlgorithmR2 Score
Training SetTest Set
LightGBM0.9930.946
Extra Trees0.9920.971
XGBoost0.9910.864
Disclaimer/Publisher’s Note: The statements, opinions and data contained in all publications are solely those of the individual author(s) and contributor(s) and not of MDPI and/or the editor(s). MDPI and/or the editor(s) disclaim responsibility for any injury to people or property resulting from any ideas, methods, instructions or products referred to in the content.

