Article

Investigating the Effects of H2 Additions to Helium and Argon Shielding Gases on TIG-Welded AISI 316L Stainless Steel

1
Industrial Engineering Department, Jordan University of Science and Technology, P.O. Box 3030, Irbid 22110, Jordan
2
Aeronautical Engineering Department, Jordan University of Science and Technology, P.O. Box 3030, Irbid 22110, Jordan
3
Department of Architectural Engineering and Construction Management, King Fahd University of Petroleum and Minerals, Dhahran 31261, Saudi Arabia
*
Author to whom correspondence should be addressed.
J. Compos. Sci. 2025, 9(5), 199; https://doi.org/10.3390/jcs9050199
Submission received: 22 February 2025 / Revised: 14 April 2025 / Accepted: 18 April 2025 / Published: 22 April 2025
(This article belongs to the Special Issue Welding and Friction Stir Processes for Composite Materials)

Abstract

:
Adding hydrogen (H2) to shielding gas in Tungsten Inert Gas (TIG) welding has garnered attention for its potential to enhance weld quality. This study explores the effects of H2 and helium (He) content on AISI 316L stainless steel welding, focusing on their influence on weld bead geometry, microstructural properties, and mechanical properties. The H2 (1.5%, 3%, 4.5%) and He (10%, 20%, 30%) concentrations were evaluated in a shielding gas primarily composed of argon (Ar). The study underscores the need for precise gas blend control to balance enhanced performance with material safety. These findings offer insights into optimizing welding parameters for AISI 316L, with implications for broader applications in industries demanding high quality. The result shows that H2 (1.5–3.0%) improves penetration, geometry, and surface finish, while He (10–20%) enhances arc stability and smoothness; however, excessive levels of H2 (>4.5%) cause defects. Optimal mechanical properties (UTS: 714.54 MPa, YS: 449.03 MPa, hardness: 93.34 HRB, impact toughness: 34.45 J) are achieved with 3% H2, 30% He, and 150 A arc current.

1. Introduction

Adding H2 to the shielding gas during TIG welding is a technique that offers several advantages for welding applications. Primarily, it enhances weld quality, geometry, penetration, and surface finish. However, this technique requires careful control, as excessive H2 can cause H2 embrittlement, especially in metals such as carbon steels and high-strength alloys [1,2].
Research shows that adding small amounts of H2 (1–5%) to inert shielding gases such as Ar or He can improve weld penetration, making it valuable for welding thicker materials by creating a hotter plasma arc and deeper fusion. This approach enables faster welding speeds and more fluid weld pools, reducing the need for multi-pass welding and increasing productivity. However, H2 levels must be controlled to prevent porosity, cracking, and H2 embrittlement, especially in AISI 316L stainless steel. Pre-weld cleaning and precise H2 concentration management help minimize these risks [3,4,5]. Studies indicate that H2-enriched shielding gases can improve the surface finish of weld bead geometry. H2 promotes a smooth, shiny surface finish, reducing oxidation and producing cleaner welds compared to pure Ar or He shielding. This is especially important for applications where aesthetics and corrosion resistance are crucial, such as in the food and pharmaceutical industries [6,7]. While H2 additions can improve surface finish, they may also affect the corrosion resistance of certain stainless steels, such as SS 304 and SS 316 [8,9,10,11], by promoting a cleaner, oxide-free surface. Excessive H2 in the shielding gas can lead to H2 embrittlement, a phenomenon where H2 atoms diffuse into the metal lattice, causing brittleness and reducing the material’s corrosion resistance over time. Research indicates that H2-induced porosity may also occur if the H2 concentration is too high, impacting the weld’s mechanical integrity and potentially leading to cracks under stress or in corrosive environments [12].
H2 gas can be used in a mixture of shielding gas in welding for specific applications as it promotes deep penetration and helps reduce oxide films, resulting in cleaner welds [10]. However, it requires precise control to prevent issues, such as poverty, and must be handled with caution due to its flammability. Despite these benefits, H2 shielding is rarely used in TIG welding, which typically relies on inert gases such as Ar and He. These unreactive gases effectively protect the molten metal and tungsten electrode from atmospheric contamination, ensuring clean, high-quality welds without introducing reactive elements [13,14,15]. H2 gas used in plasma welding offers high heat capacity and creates a reactive environment, making it suitable for welding reactive metals such as titanium and zirconium. It generates extremely high temperatures and prevents oxidation layer. However, H2’s flammability requires strict safety protocols and specialized equipment and has limited material compatibility [16,17]. Furthermore, H2 is considered an active gas when used in shielding gas (Ar, He, N2, etc.) during welding processes. In welding, gases are classified into two broad categories: inert gases and active gases. Mixing gases, including H2, Ar, and He, in welding procedures is a widely practiced technique for customizing shielding gas combinations to fulfill specific welding requirements [18,19] These gases provide a flexible mechanism for managing temperature, arc steadiness, and the depth of weld penetration, endowing them with great worth across a spectrum of welding tasks. Welders can fine-tune their welding parameters to attain superior outcomes, enhancing both the depth and cleanliness of the weld [20,21]. The selection of the gas mixture hinges on variables such as the material being welded, the welding approach utilized, and the preferred welding attributes. Achieving an efficient equilibrium between the benefits delivered by the gas mixture and the welding prerequisites in play remains a critical consideration [22,23,24].
AISI 316L represents a stainless steel variety renowned for its outstanding corrosion resistance, primarily attributable to its notably low carbon content. This specific stainless steel grade finds extensive utilization in sectors where safeguarding against corrosion stands as an utmost priority, notably within pharmaceutical, medical, and food-related domains. Its innate biocompatibility renders it well-suited for medical implants and surgical instrumentation applications. Beyond its corrosion resistance, AISI 316L is characterized by its commendable tensile strength and enduring durability, thereby conferring substantial worth in the aerospace sector. Its weldability further bolsters its versatility across an array of industries. The sterling capacity of this stainless steel to endure in hostile environments while retaining its intrinsic properties has firmly established it as a favored material in a diverse array of applications [25,26,27]. Using H2, Ar, and He as shielding gases in welding offers advantages but presents challenges. H2 is highly flammable, requiring strict safety measures. Argon’s chemical inertness may limit its effectiveness in some applications. Helium gas is costly, which raises the overall expenses. Achieving the right gas blend for optimal welding results can be complex. The choice of gas significantly influences welding properties, and safety precautions are essential, especially with H2 flammability. Addressing these challenges requires careful handling and an understanding of the specific welding requirements and materials [28].
The study investigates the impact of different shielding gas compositions on the TIG welding process for AISI 316L stainless steel. It focuses on assessing their effects on weld bead geometry, the welded material’s microstructure, and mechanical properties. The study varies H2 content at 1.5%, 3%, and 4.5% and He content at 10%, 20%, and 30%, with the remaining gas being Ar. The study provides insights into optimizing the welding process, improving welding quality, and offering material-specific knowledge. This research has the potential to enhance welding outcomes for AISI 316L and may have broader applications in welding various materials.

2. Experiment Setup

2.1. Welding Machine

The TIG welding machine used in this study was the Miller Syncrowave 350 LX, supplied by Miller Electric Mfg. LLC, headquartered at 1635 W. Spencer St., Appleton, WI, USA. It operates within an amperage range of 3A to 400A. This machine is compatible with various metals, including aluminum, stainless steel, and mild steel.

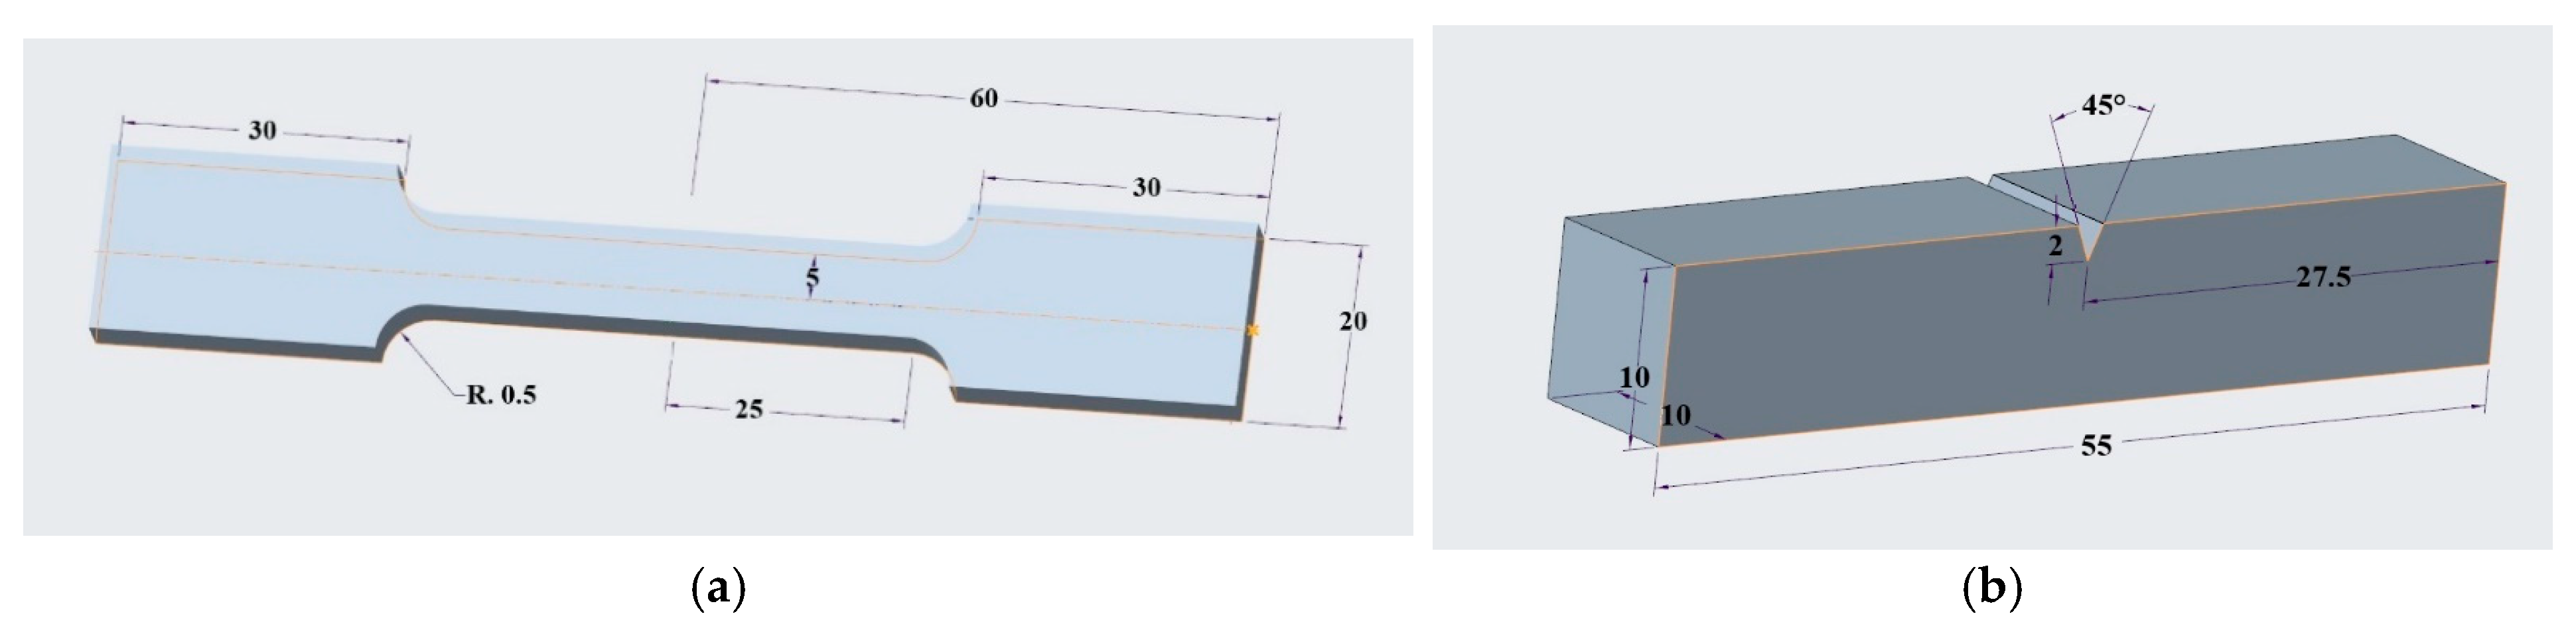
2.2. Preparation of AISI 316L Specimen

The AISI 316L stainless steel base metal has the following typical chemical composition: 0.03% carbon, 2.0% manganese, 1.0% silicon, 16.5–18.5% chromium, 8–13% nickel, 2–2.25% molybdenum, 0.04% phosphorus, 0.001% sulfur, and 0.11% nitrogen, and the balance is iron, as shown in Table 1. This composition provides the material with enhanced corrosion resistance, particularly in chloride environments, and good weldability, along with improved mechanical properties such as strength and toughness. The specimens, each measuring 100 × 100 × 5 mm, were cut using a sewing machine. Afterward, a V-shaped edge was created with a 60-degree angle and a depth of 3 mm, as illustrated in Figure 1a,b. The specimens were prepared with specific dimensions (100 × 100 × 5 mm) and a 60-degree V-groove with a 3 mm depth to ensure standardized testing and optimal weld quality. The V-groove design enhances weld penetration, improves fusion, and minimizes defects, making it suitable for TIG welding applications. A 60-degree angle balances weldability and strength, preventing incomplete fusion while avoiding excessive heat input. These specifications also align with mechanical testing requirements, ensuring reliable evaluation of tensile strength and impact toughness. Furthermore, the standard procedures for testing mechanical properties include tensile and Charpy impact tests. For Ultimate Tensile Strength (UTS), standards such as ASTM E8/E8M and ISO 6892-1 [29,30] are used, involving preparation of standardized specimens, mounting in a universal testing machine, and applying a controlled tensile load until fracture to determine the maximum stress. For Charpy Impact Testing, ASTM E23 and ISO 148-1 [14] are followed, which involve using a V-notched specimen placed in a pendulum impact tester to measure the energy absorbed during fracture. Figure 2a,b illustrate the UTS and Charpy impact standard dimensions.

2.3. Filler Material

The ER316L filler material is low-carbon stainless steel with outstanding corrosion resistance, particularly against chlorides. It contains 16–18% chromium, 10–14% nickel, and 2–3% molybdenum for improved strength, toughness, and pitting resistance. The material also has low phosphorus and sulfur content for better weldability, with added manganese and silicon for deoxidation and improved toughness. The balance is iron, making it ideal for welding austenitic stainless steel in corrosive environments. The filler electrode has a diameter of 1 mm, and the chemical composition of the filler material is presented in Table 2.

2.4. Shielding Gas Composition for L-27 Orthogonal Array Experimental Design

This study, using the L27 Taguchi approach, is structured to take 27 experimental variables, each set at three different levels. This approach facilitates an efficient examination of both the individual impacts and interactions of these factors, requiring fewer experimental trials. The process includes running L-27 experiments with three levels for each of the nine control factors, allowing for the identification of optimal level [27]. Hence, the main factors studied included welding arc current (120 A, 150 A, 180 A), H2 content (1.5%, 3%, 4.5%), and He content (10%, 20%, 30%), with Ar kept as the stabilizing gas. The fixing pressure is 0.021 MPa, the flow rate is 14 l/min, and the pressure is per Mvola and Kah [18]. The selection of 120 A and 150 A welding currents in this study is well sup-ported by TIG welding literature, considering key factors such as electrode size, base material thickness, heat input control, and weld quality. In TIG welding, 120 A is typically used for welding thin to medium-thickness materials (around 2–4 mm), offering precise arc control and minimal heat distortion, while 150 A is suitable for slightly thicker sections, enabling deeper penetration without excessive heat input [30]. These current values fall within the commonly recommended range for TIG welding stainless steel and similar alloys, providing optimal conditions for stable arc behavior and high-quality welds. Additionally, TIG welding is highly sensitive to heat input, and studies have shown that higher currents, such as 180 A, can increase the risk of grain coarsening, loss of corrosion resistance, or residual stress development in the weld zone [31]. Thus, selecting 120 A and 150 A provides a balanced approach, ensuring effective fusion while preserving the mechanical and metallurgical integrity of the weld.
Table 3 shows the proportion of different shielding gas mixtures. The L-27 orthogonal array is generated through the use of MINITAB statistical software 22.1.0. The heat input (HI) during welding is measured in joules per millimeter (J/mm) and is determined by Formula (1). Here, V represents the voltage (in volts), I is the welding current (in amperes), and S denotes the welding travel speed in millimeters per minute. Given that the welding speed is 1.68 mm/s, it translates to 100.8 mm/min (calculated as 1.68 × 60 = 100.8 mm/min).
HI = V × I S × 60

2.5. Experiment Procedure

All bead runs are automatically laid using a dedicated automatic TIG fixture, ensuring a consistent welding feed rate throughout the process. The substrates were positioned on an aluminum base, supported by a rotating shaft. They moved 10 mm at a constant speed of 1.68 mm/s, controlled by a motor. The welding torch was fixed at a 45-degree angle by a clamp arm in the center of the mainframe. The weld drops were deposited using a single pass with a 3 mm diameter AISI 316L austenitic stainless steel positive electrode. The total shielding gas flow was maintained at 10 L per minute (l/min) under constant pressure. The welding test was carried out with three different shielding gas mixtures: Ar, He, and H2. Every single composition shielding gas used is deposited under three values of current, 120 A, 150 A, and 180 A, the same as reported by Khrais et al. [13].

2.6. Material Characterization

In this study, four types of material characterization techniques were used to analyze the material’s appearance and compositional properties. All measurements were conducted at the Nano Institute at Jordan University of Science and Technology. A phone camera with a 10 mm scale was utilized for capturing macro-scale images to observe the overall structure. Optical microscopy, with a magnification scale of 1000 µm, was employed to examine the microstructural features in more detail. SEM was used at a 20 µm scale to provide high-resolution imaging of the material’s surface morphology. Additionally, EDX was conducted to analyze the chemical composition and elemental distribution within the material.

3. Results and Discussion

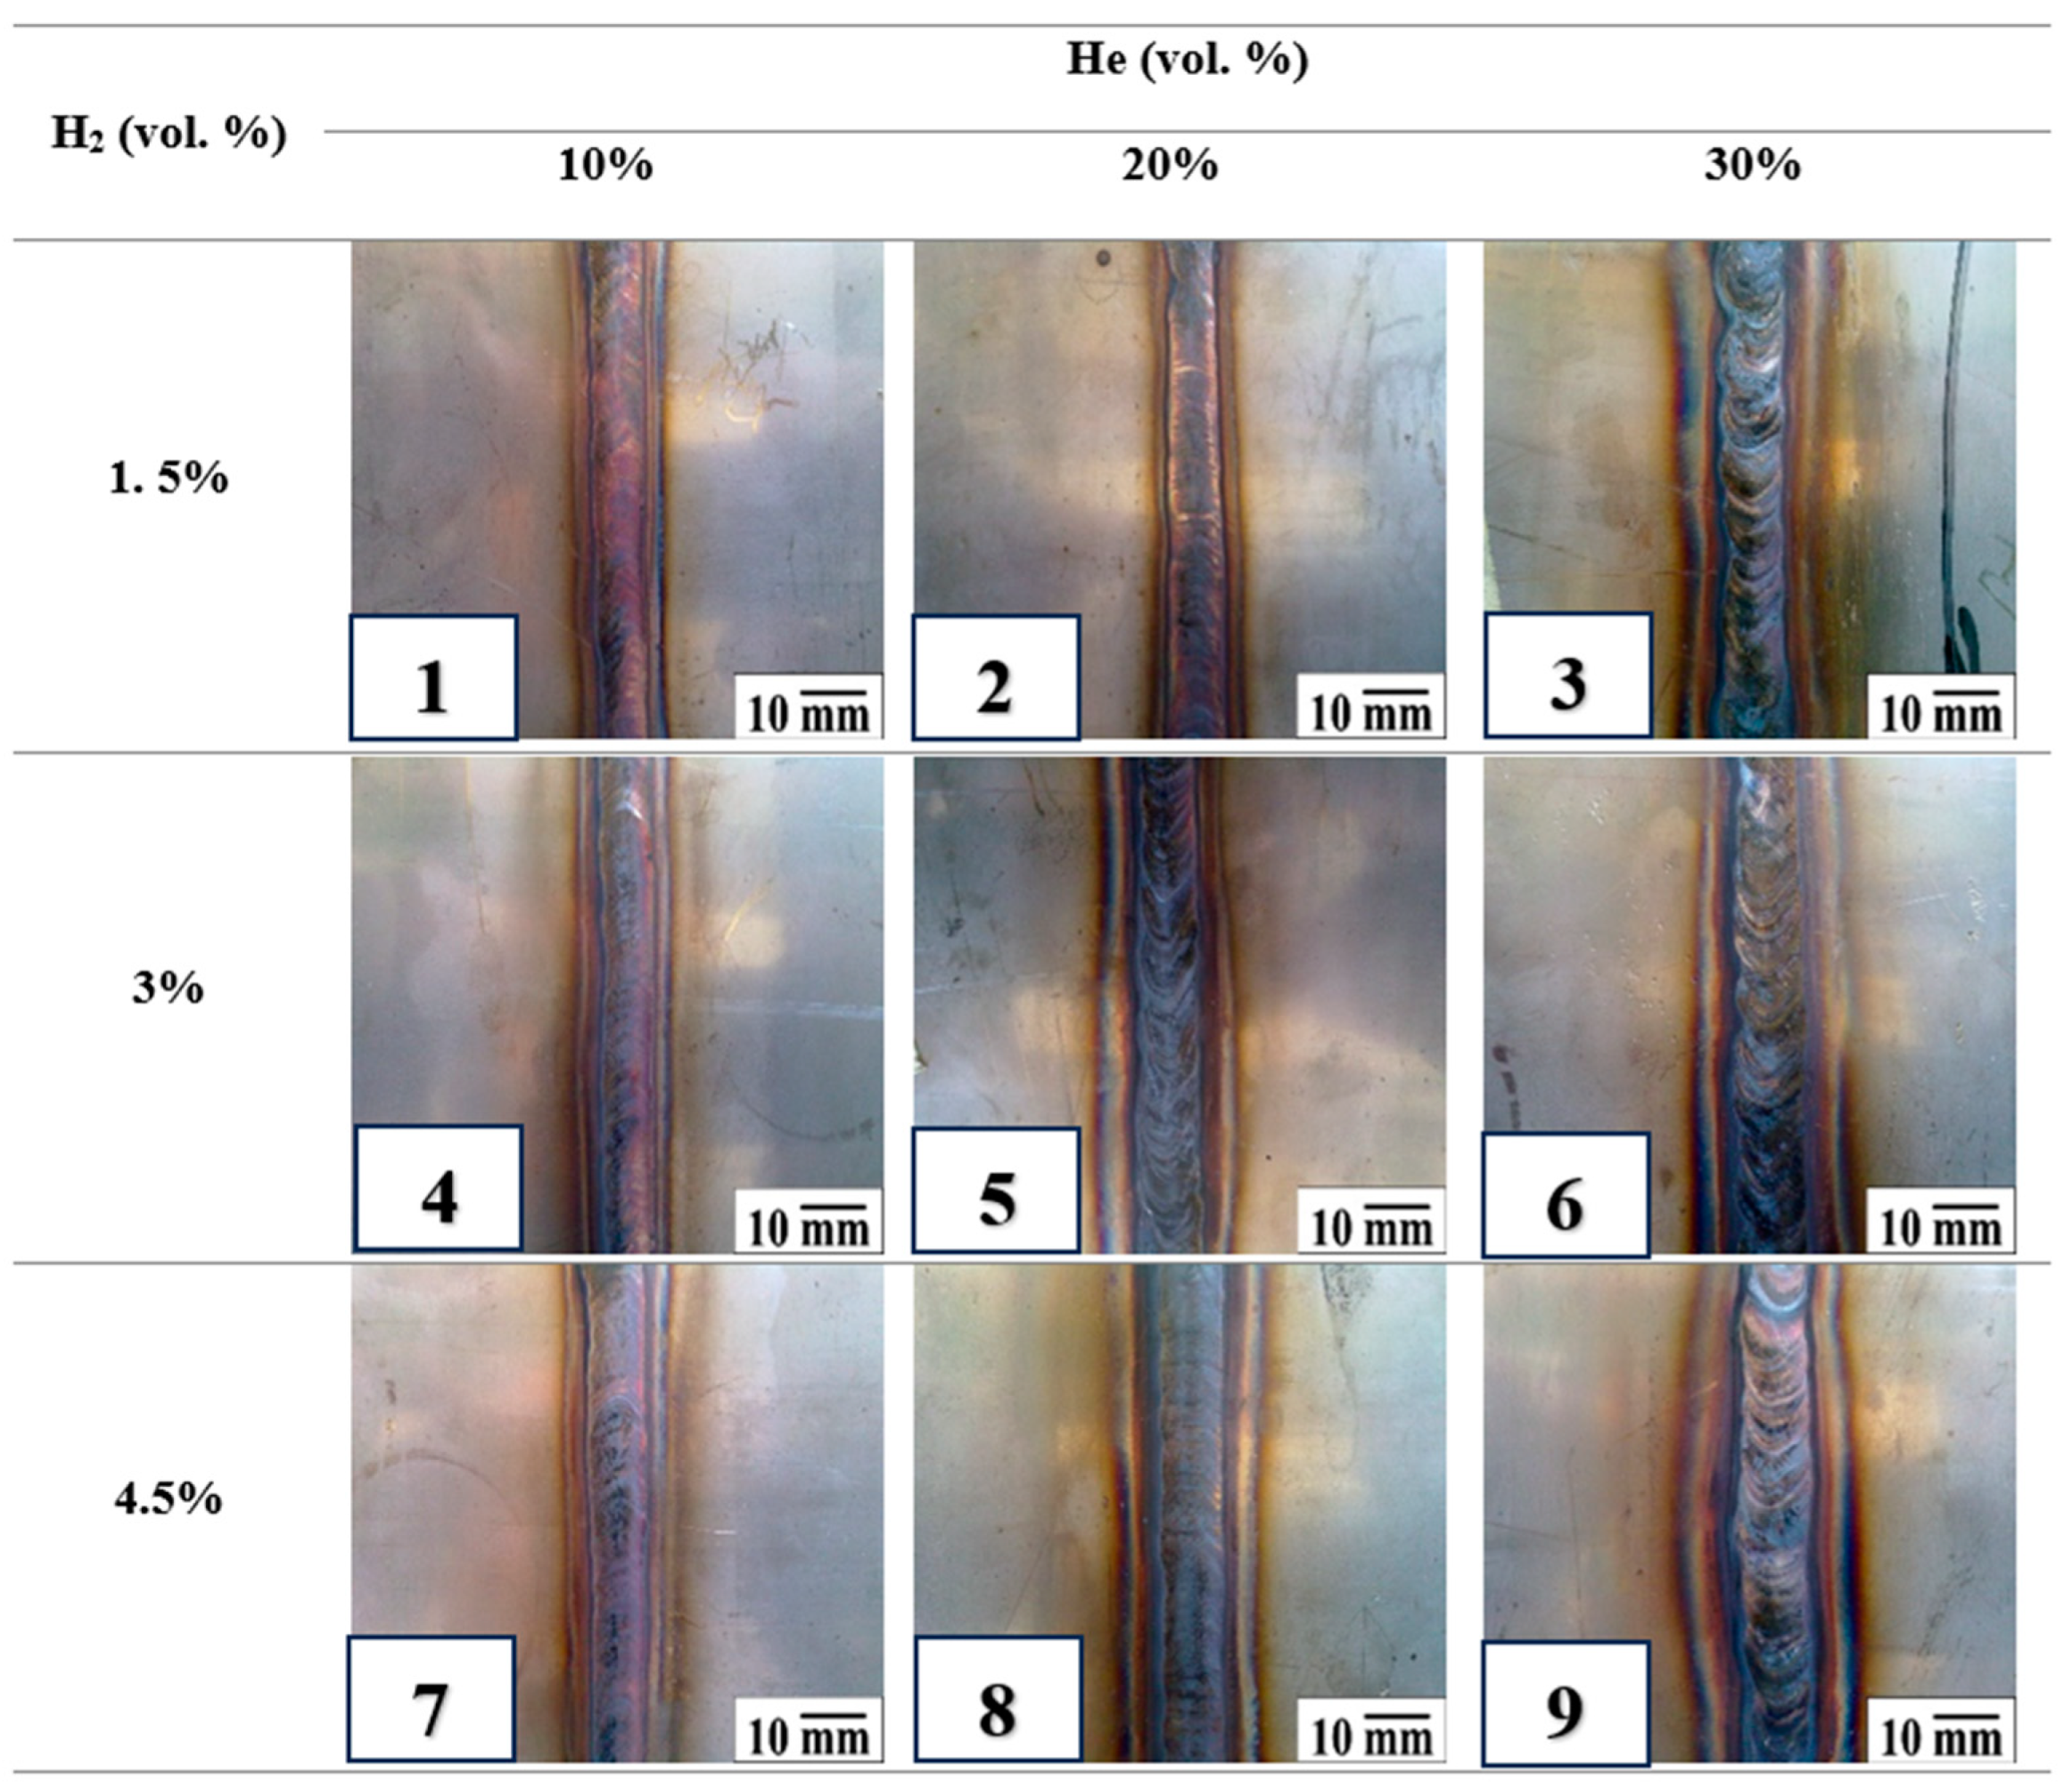
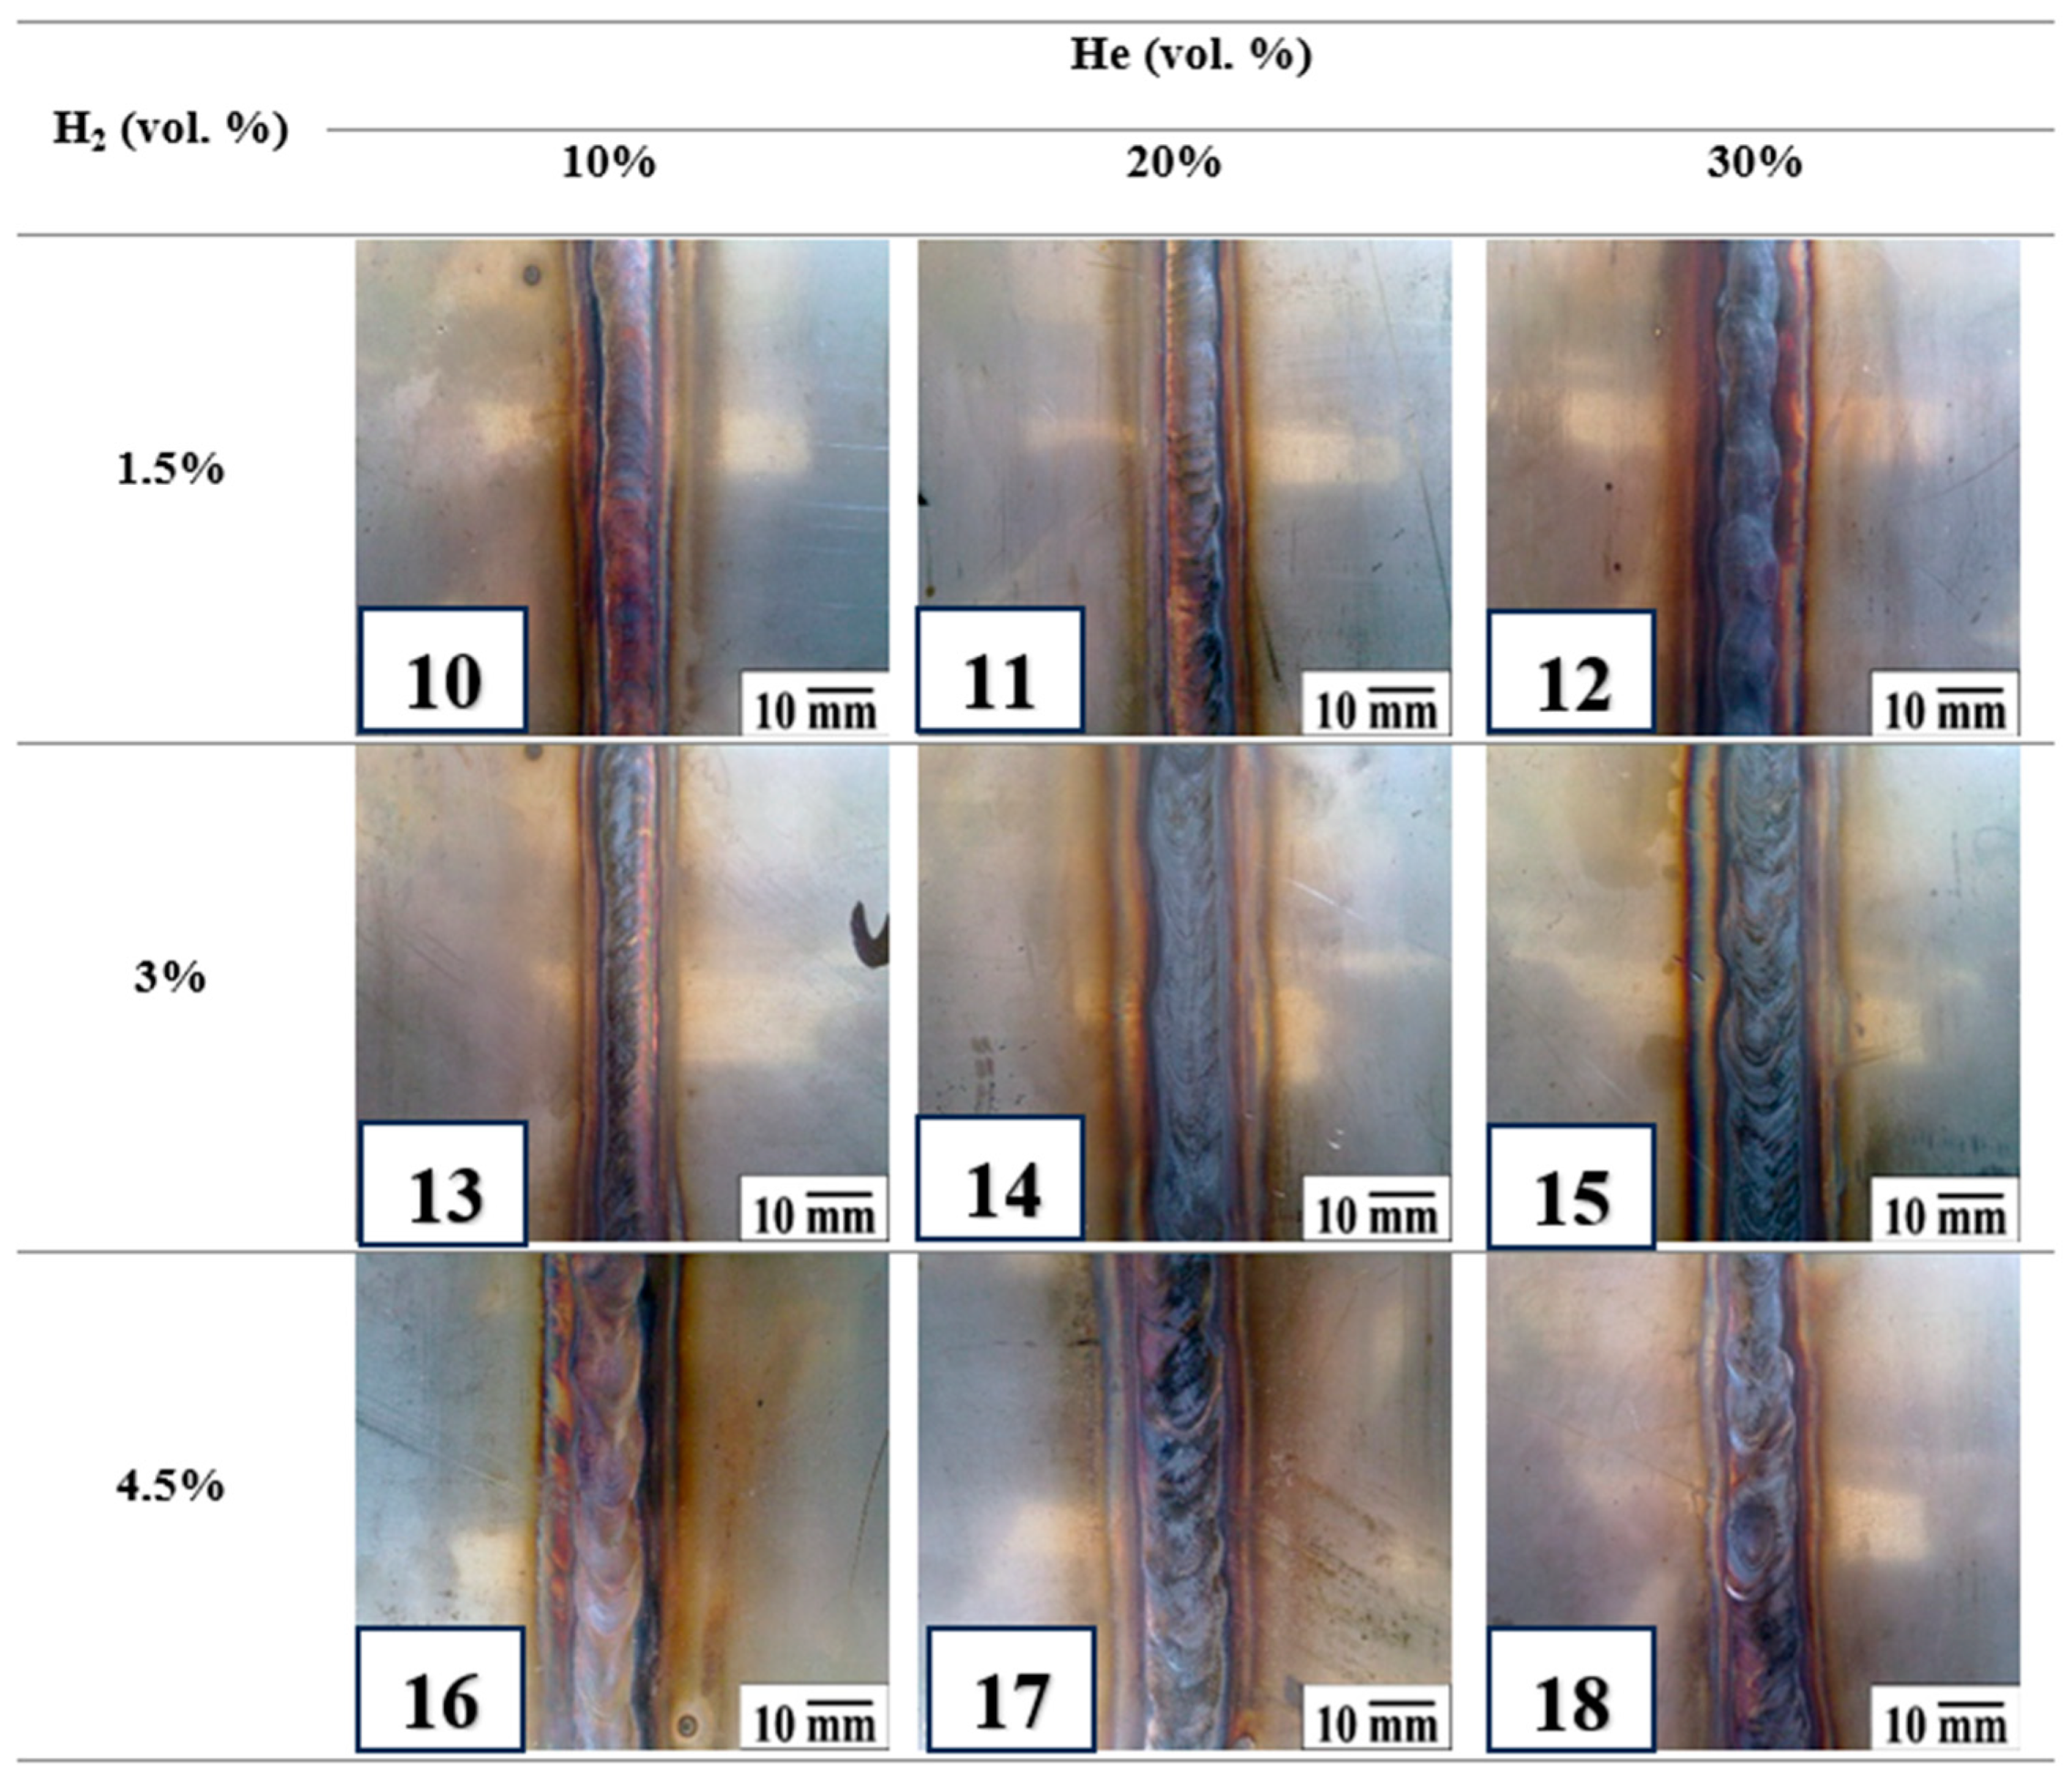
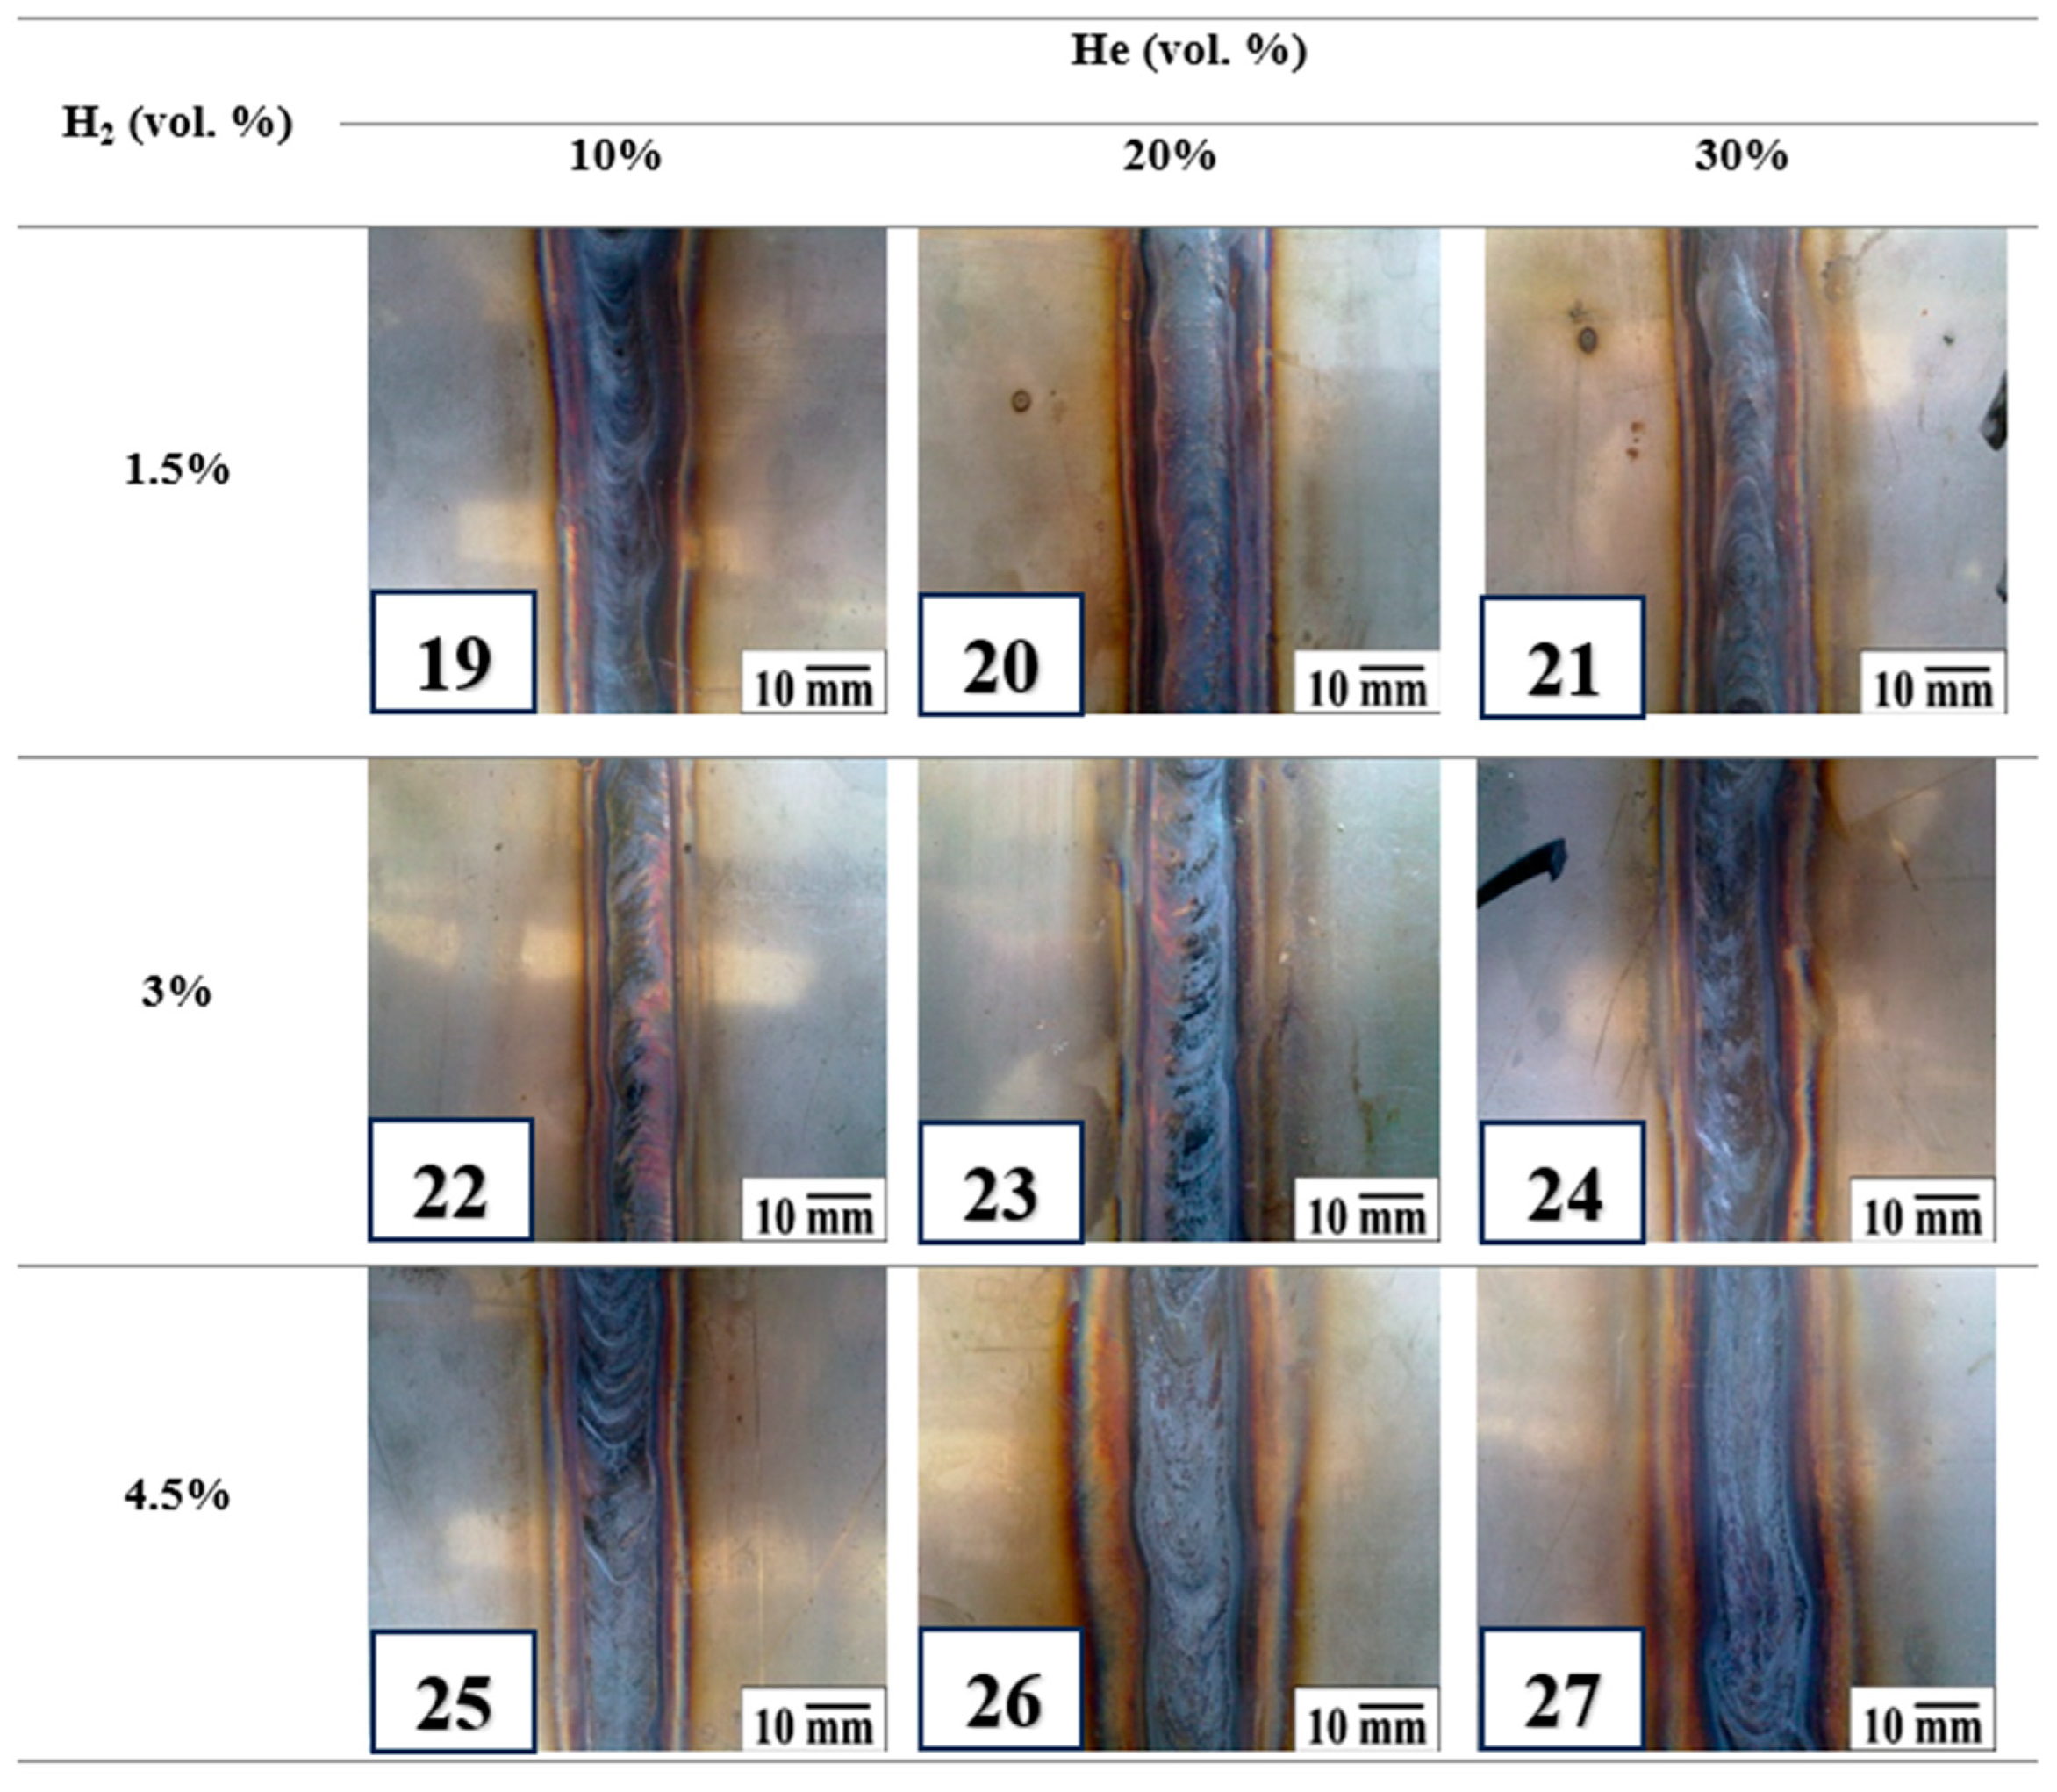
3.1. Bead Geometry Appearance

Figure 3, Figure 4 and Figure 5 show the weld appearance and geometry, including weld penetration width, height, and the heat-affected zone (HAZ). The welding factors affecting weld geometry include arc current and shielding gas composition [25] and welding speed [32]. Changes in weld bead geometry, surface quality, and overall appearance are observed as the arc current increases and with variations in gas composition such as H2 [19], Ar, and He [23,33]. The primary purpose of shielding gas in welding is to protect the weld pool from atmospheric contamination, such as oxygen and water vapor, which can cause defects such as porosity, oxidation, and weakening of the weld [24]. This study used H2, He, and Ar shielding gas. Another factor that strongly affects bead geometry and appearance is arc current welding [34]. Increasing the arc current from 120 A to 180 A results in greater bead width and penetration. Additionally, increasing the H2 content from 1.5% to 4.5% and the He content from 10% to 30% significantly influences the weld bead appearance, such as bead profile, surface finish, discoloration, defects, and consistency. Increasing the H2 content from 1.5% to 3% and using 10% He at an arc current of 120 A to 150 A enhances weld penetration and fluidity, resulting in a cleaner and shinier surface. However, at 4.5% H2, sagging, excessive fluidity, and over-penetration become more pronounced, especially at an arc current of 180 A. Additionally, raising the He content to 20–30% increases profile irregularities and weld bead discoloration. Hence, at 180 A arc welding, increased H2 causes irregular bead profiles due to overly fluid weld pools, which result in a wider bead and a larger HAZ. Furthermore, excessive heat and high currents can lead to sagging in the weld bead due to increased fluidity. At moderate He levels (10% and 20%) with currents of 120 A and 150 A, the weld bead achieves a shiny, smooth appearance with a regular profile, as reported by Khrais et al. [13,25]. The blackened appearance observed in welds at higher currents (180 A) and He (30%) is attributed to oxidation caused by increased exposure of the molten metal to atmospheric gases. This oxidized layer negatively impacts the weld’s mechanical properties, highlighting the necessity of managing shielding gas composition and environmental factors to minimize defects and achieve high-quality welds. To achieve this optimal appearance, the recommended shielding gas concentrations are 10–20% He and 1.5–3% H2, with He enhancing arc stability and heat transfer and H2 improving penetration and fluidity.

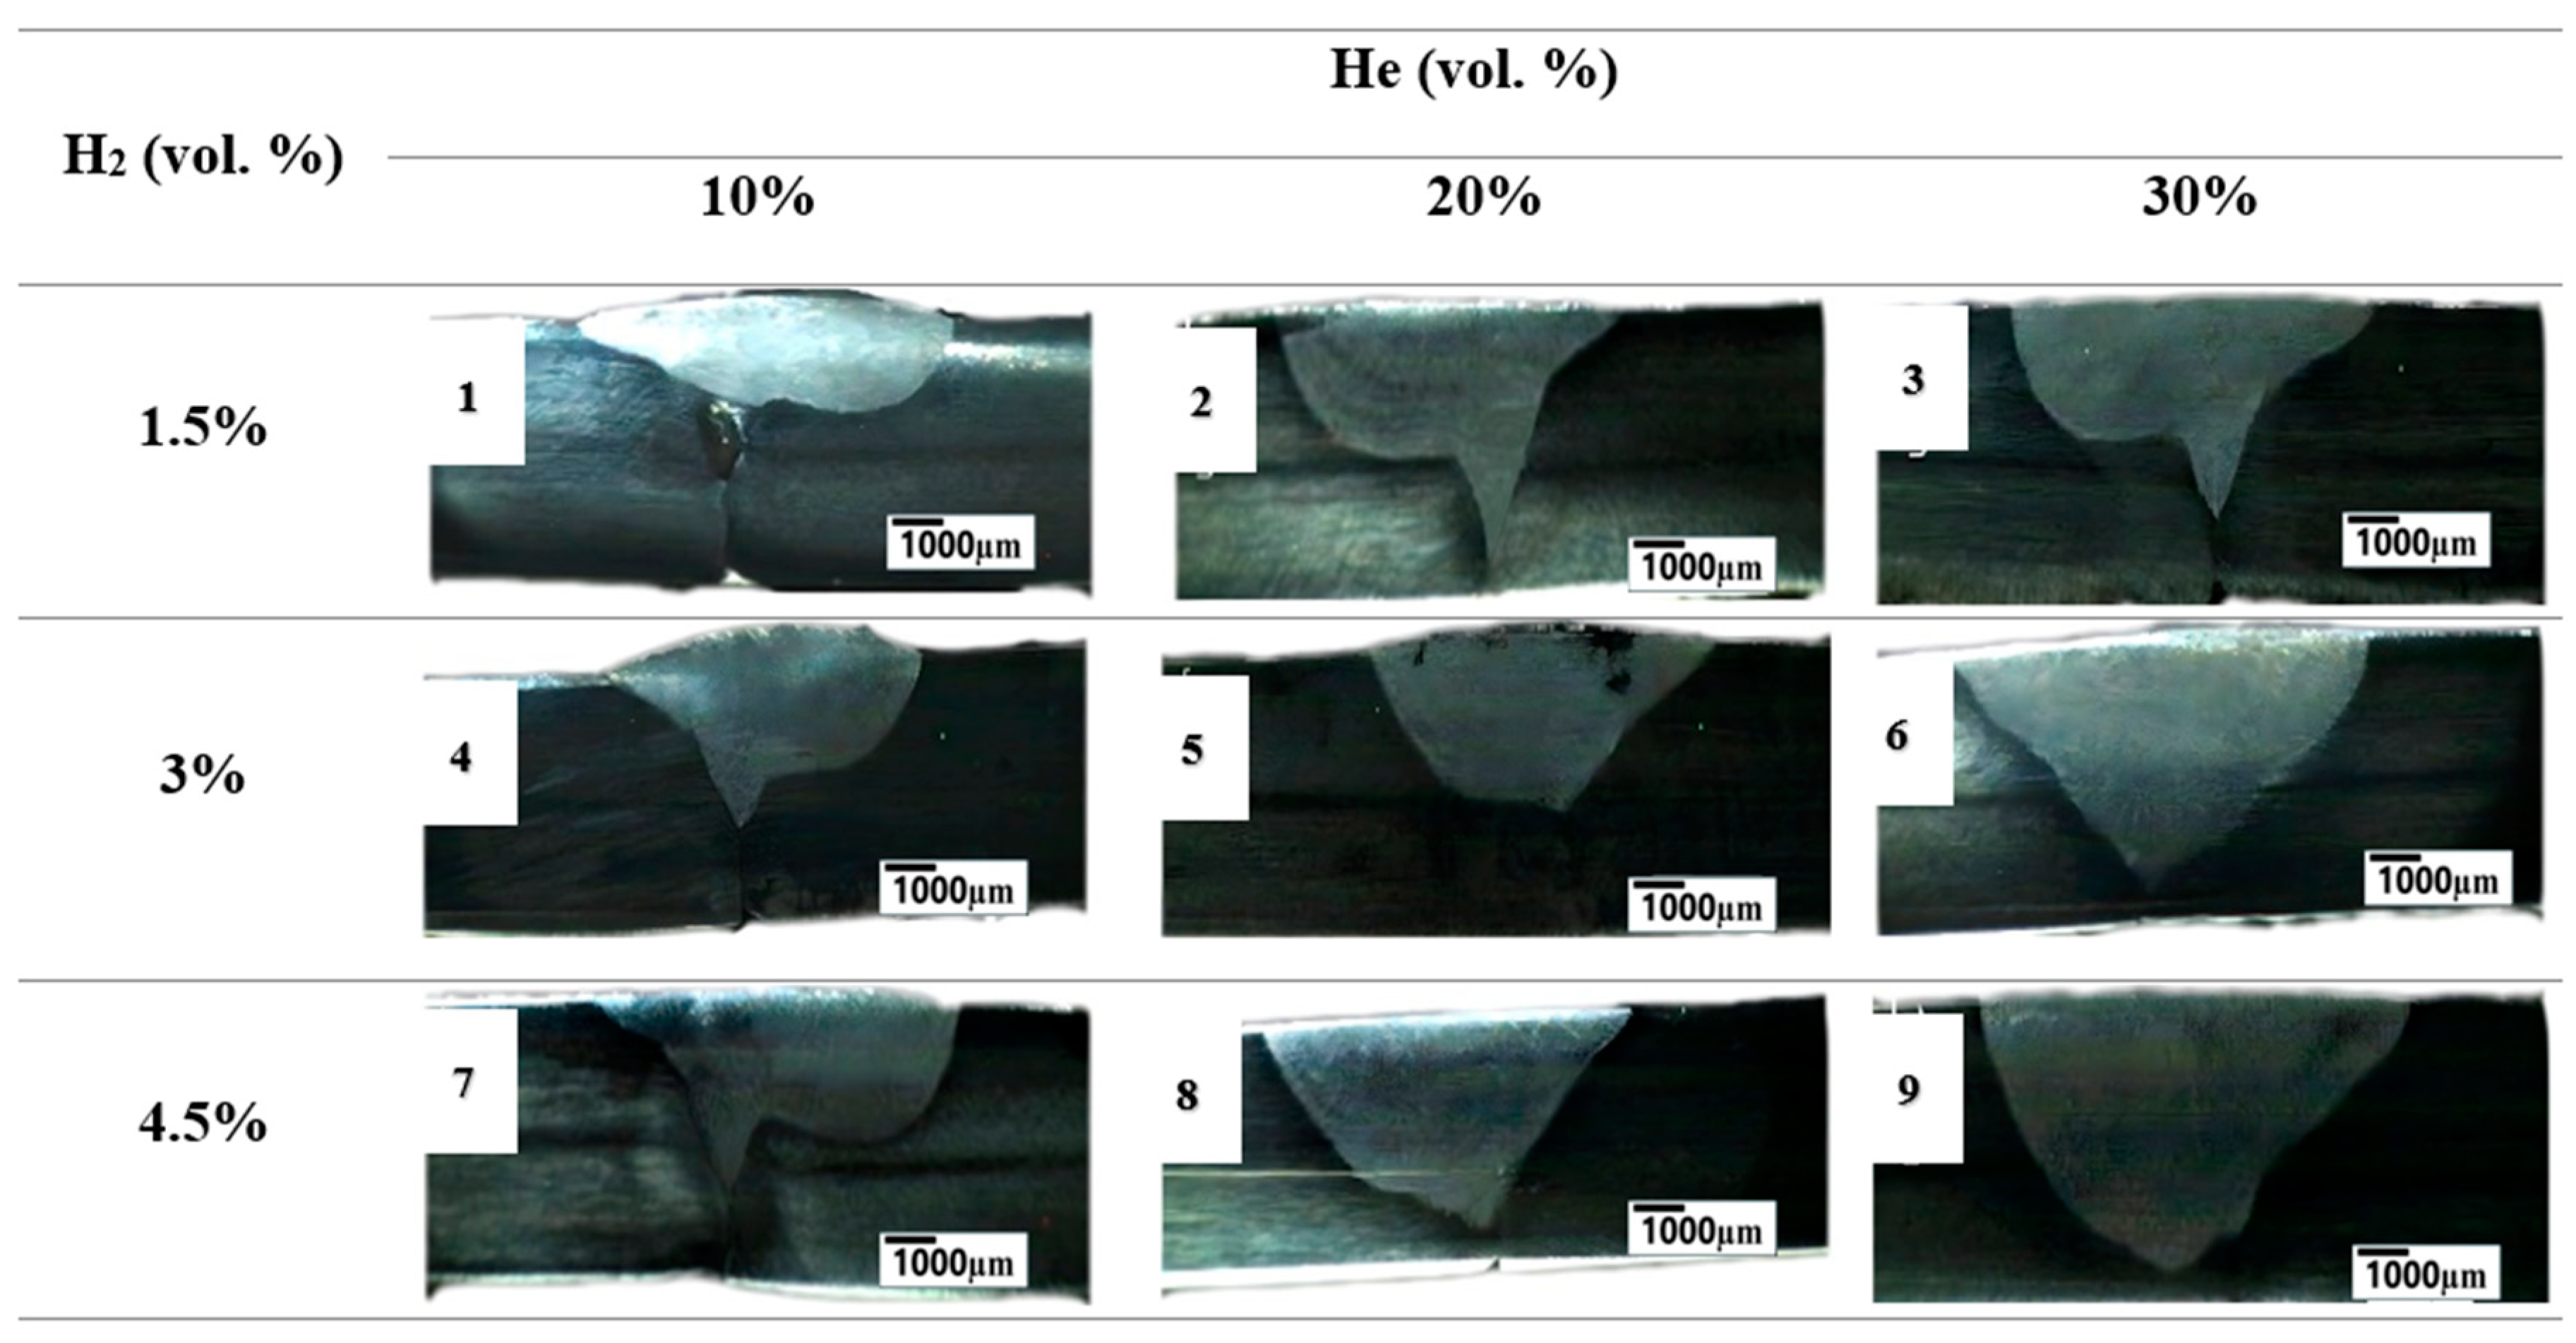
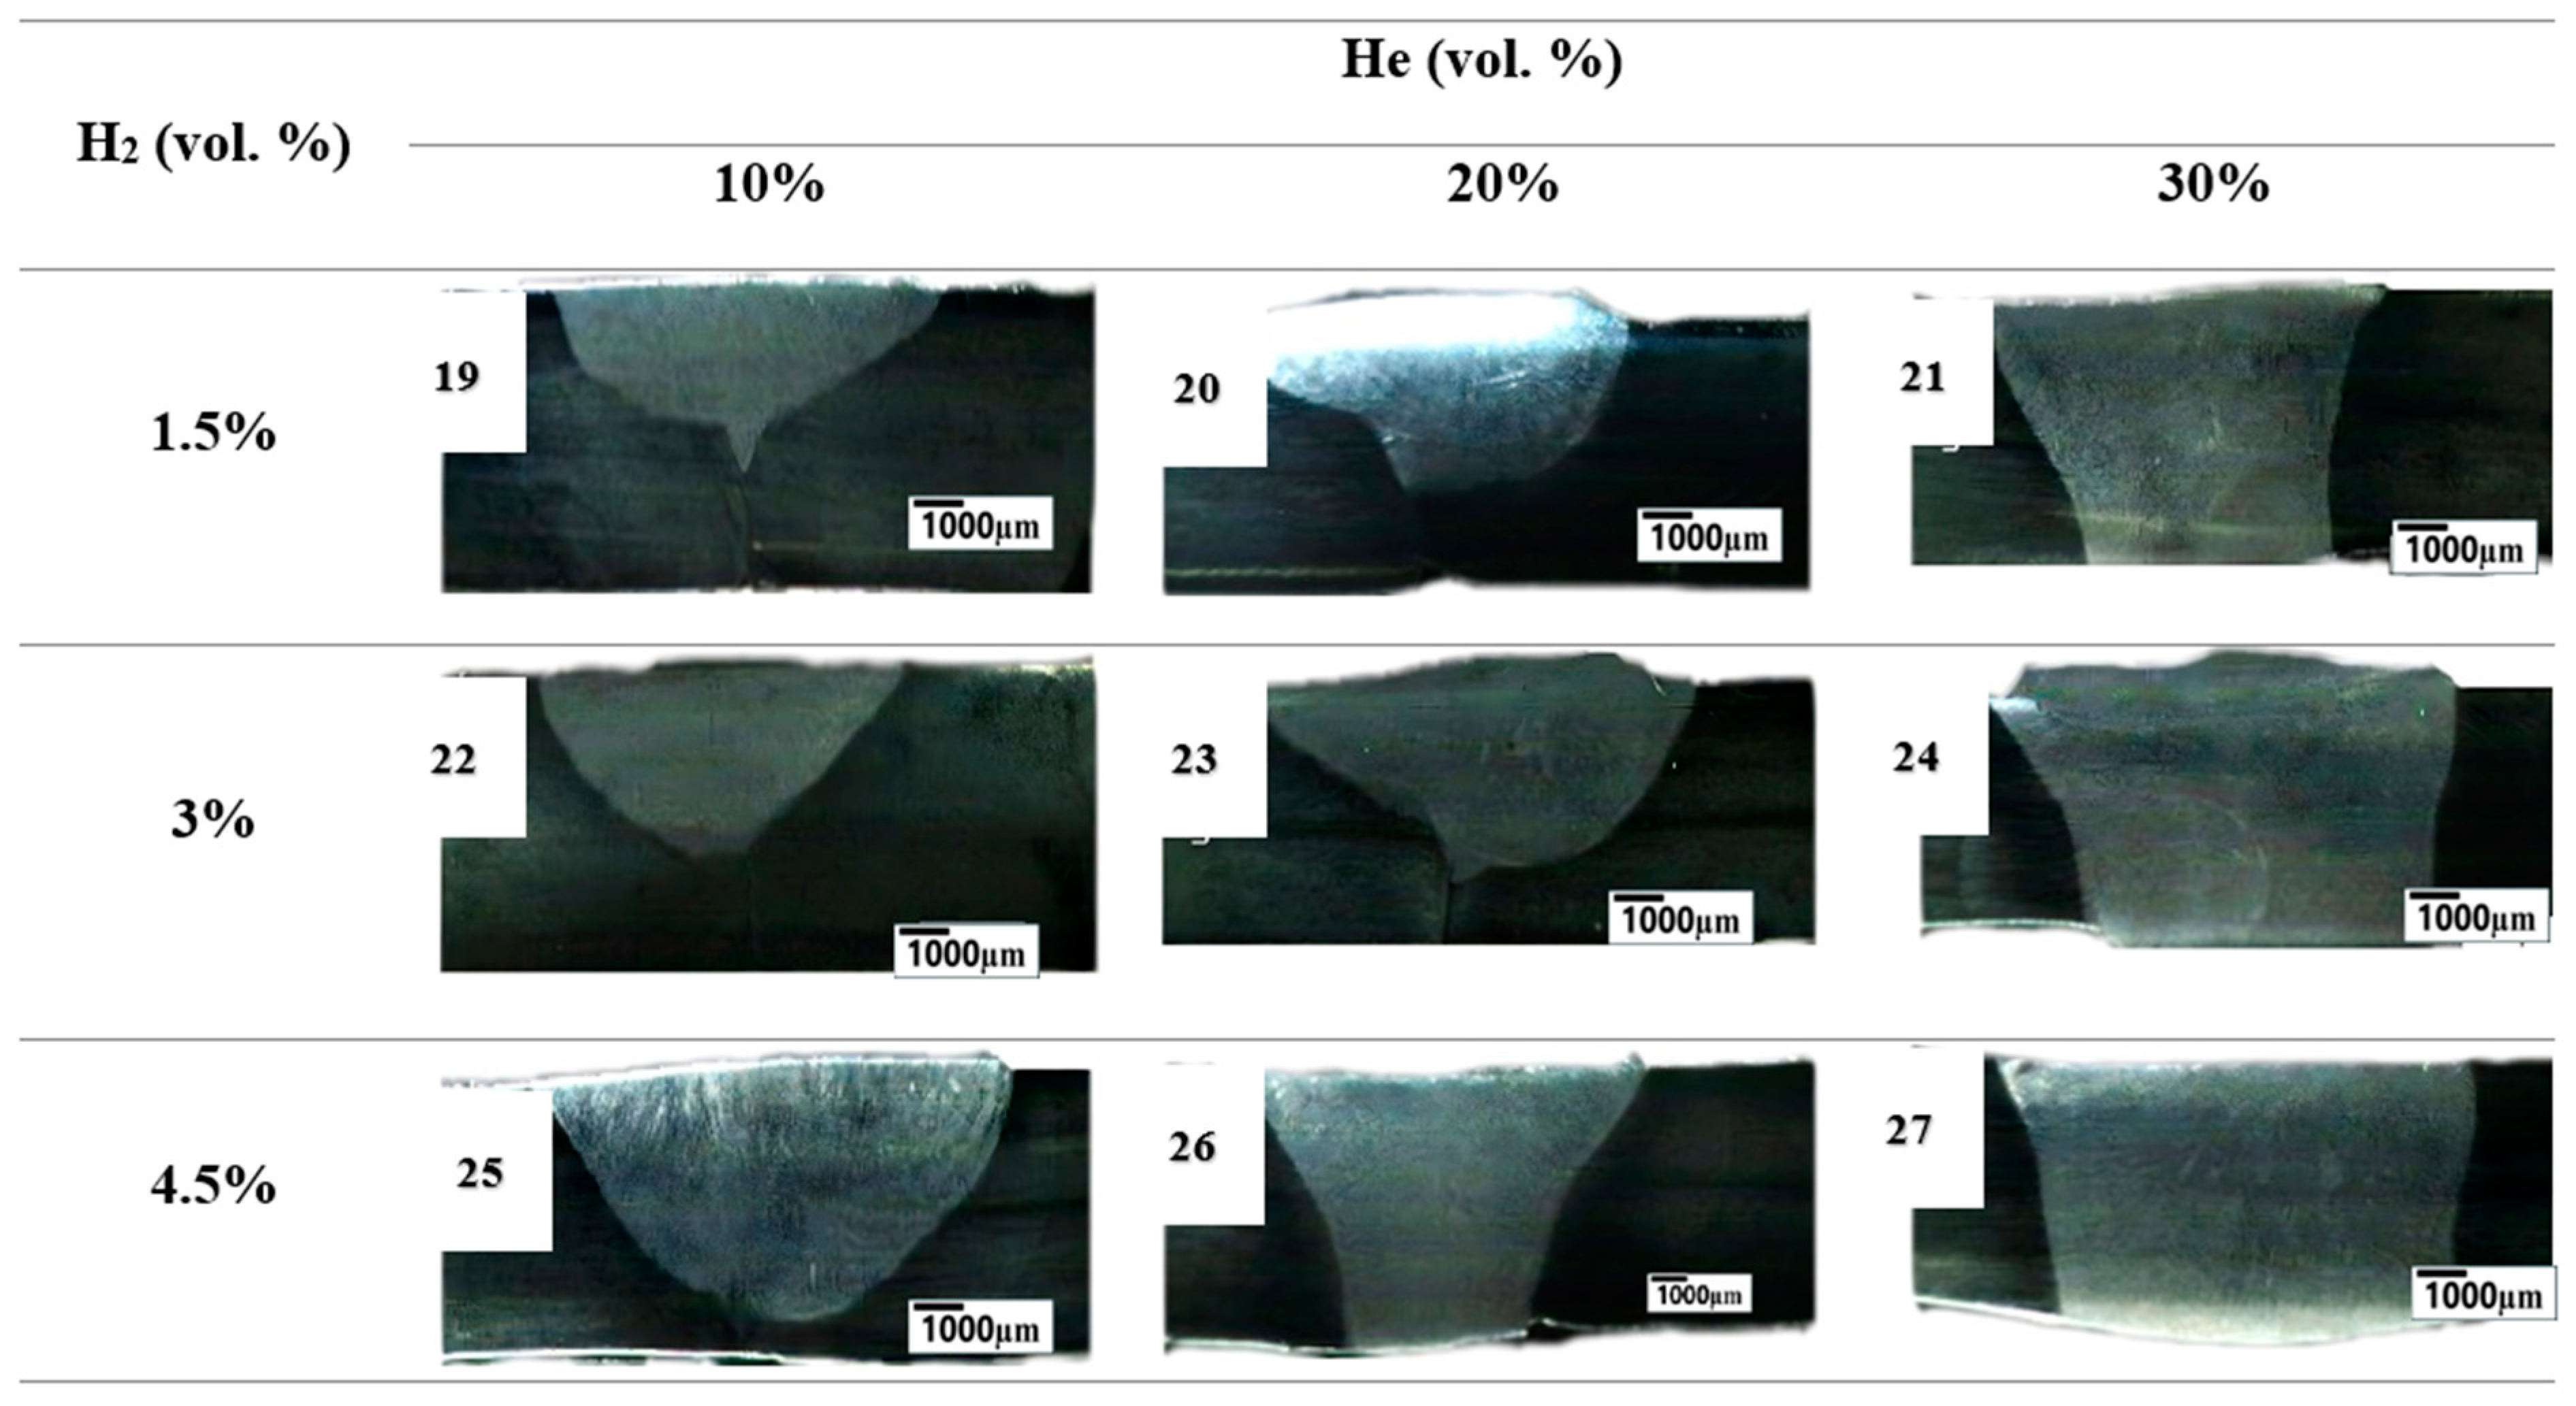
3.2. Cross-Sectional View

The cross-sectional views of the weld beads at arc currents of 120 A, 150 A, and 180 A, respectively, with different shielding gas compositions. Changing the content of H2 and He to an Ar shielding composition affects the weld bead geometry [35] and Marangoni flow [36]. Firstly, Figure 6 demonstrates that at an arc current of 120 A, increasing H2 enhances penetration, resulting in a wider bead. Helium (He) also broadens the bead—by 30%—potentially due to increased fluidity of the filler material. Figure 7 demonstrates that at 150 A, H2 levels at 3–4.5% improve penetration and create a shiny bead, though 20–30% He may cause slight sagging. Figure 8, at 180 A, shows that 4.5% H2 generates a hot, fluid pool with high penetration, risking over-fusion and irregular profiles, while 30% He expands the width but can cause distortion. This had a negative impact on bead geometry and mechanical properties. Optimal geometry is achieved with 20–30% He and 1.5–3% H2 at arc current 120–150 A, balancing penetration, bead width, and fusion across currents for stable, defect-minimized welds. This provides stable arcs and balanced bead geometry, which tends to have good mechanical properties. Reaching 30% He and slightly increasing H2 contents enhance weld bead geometry by affecting arc temperature. He, with its high thermal conductivity, increases heat transfer, making the arc hotter, which leads to a wider bead and a larger molten pool, as reported by Khrais et al. [13]. However, at 30% He, this can cause enhanced filler fluidity and deeper penetration at higher currents (120 A and 150 A) due to good heat input at 76.19 and 95.24 J/mm and lower cooling by shielding gas. Hence, increasing H2 content raises the arc temperature and fluidity of the weld pool, leading to deeper penetration as the molten material flows more easily into the root of the base metal, as reported by Xue et al., as well as Chuaiphan and Srijaroenpramong [7,37]. However, when using a shielding gas composition containing 20% to 30% He and varying levels of H2 from 1.5% to 4.5% at arc welding 180 A, as shown in Sample No. 21, 24, 26, and 27, excessive fluidity of the weld pool occurs, causing instability and making the weld challenging to control. This over-fluidity can result in defects such as the distribution of alloying elements, excessive penetration, or burn-through. The molten metal may spread too widely or sag, especially in vertical or overhead welding, leading to irregular bead geometry and over-complete fusion. To mitigate these issues, welding factors such as current, travel speed, and shielding gas composition should be carefully adjusted, potentially reducing H2 or He content. Additionally, using proper techniques such as maintaining a consistent torch angle, controlled weaving, and employing preheating or heat sinks for thinner materials can help stabilize the weld pool. A proper balance of these factors is essential to ensure a controlled, defect-free weld. Together, He and H2 balance heat and fluidity.

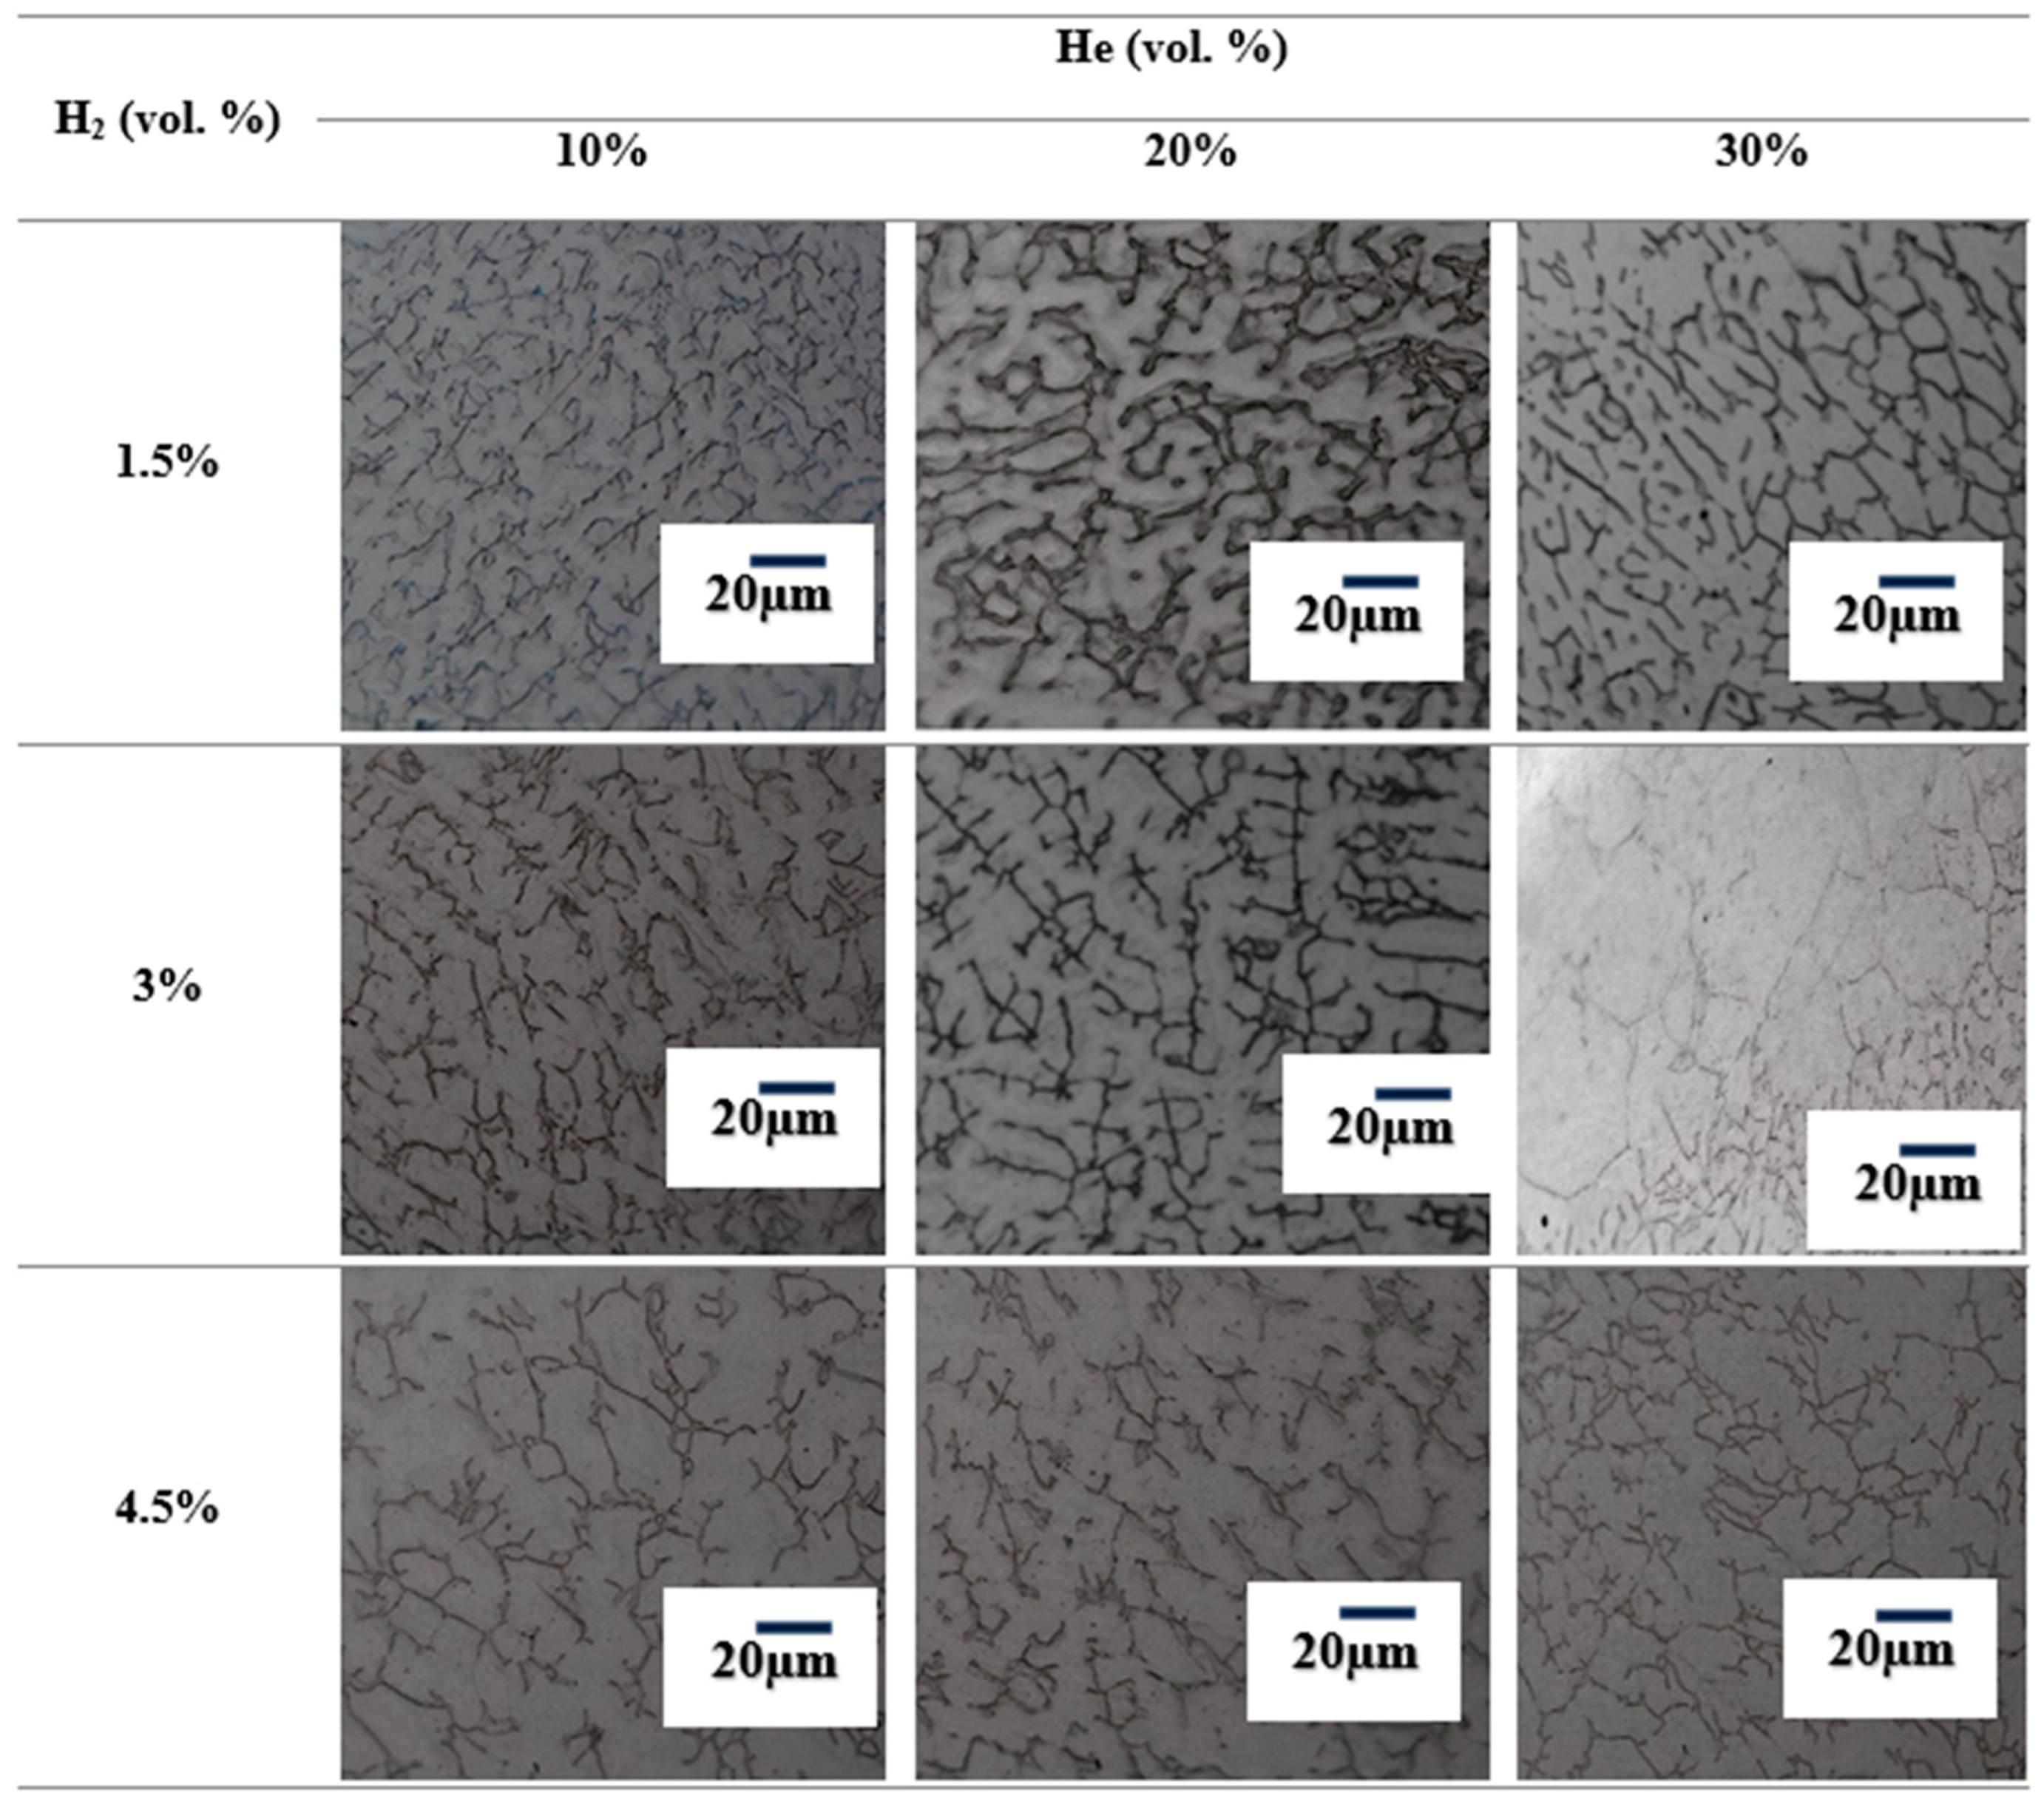
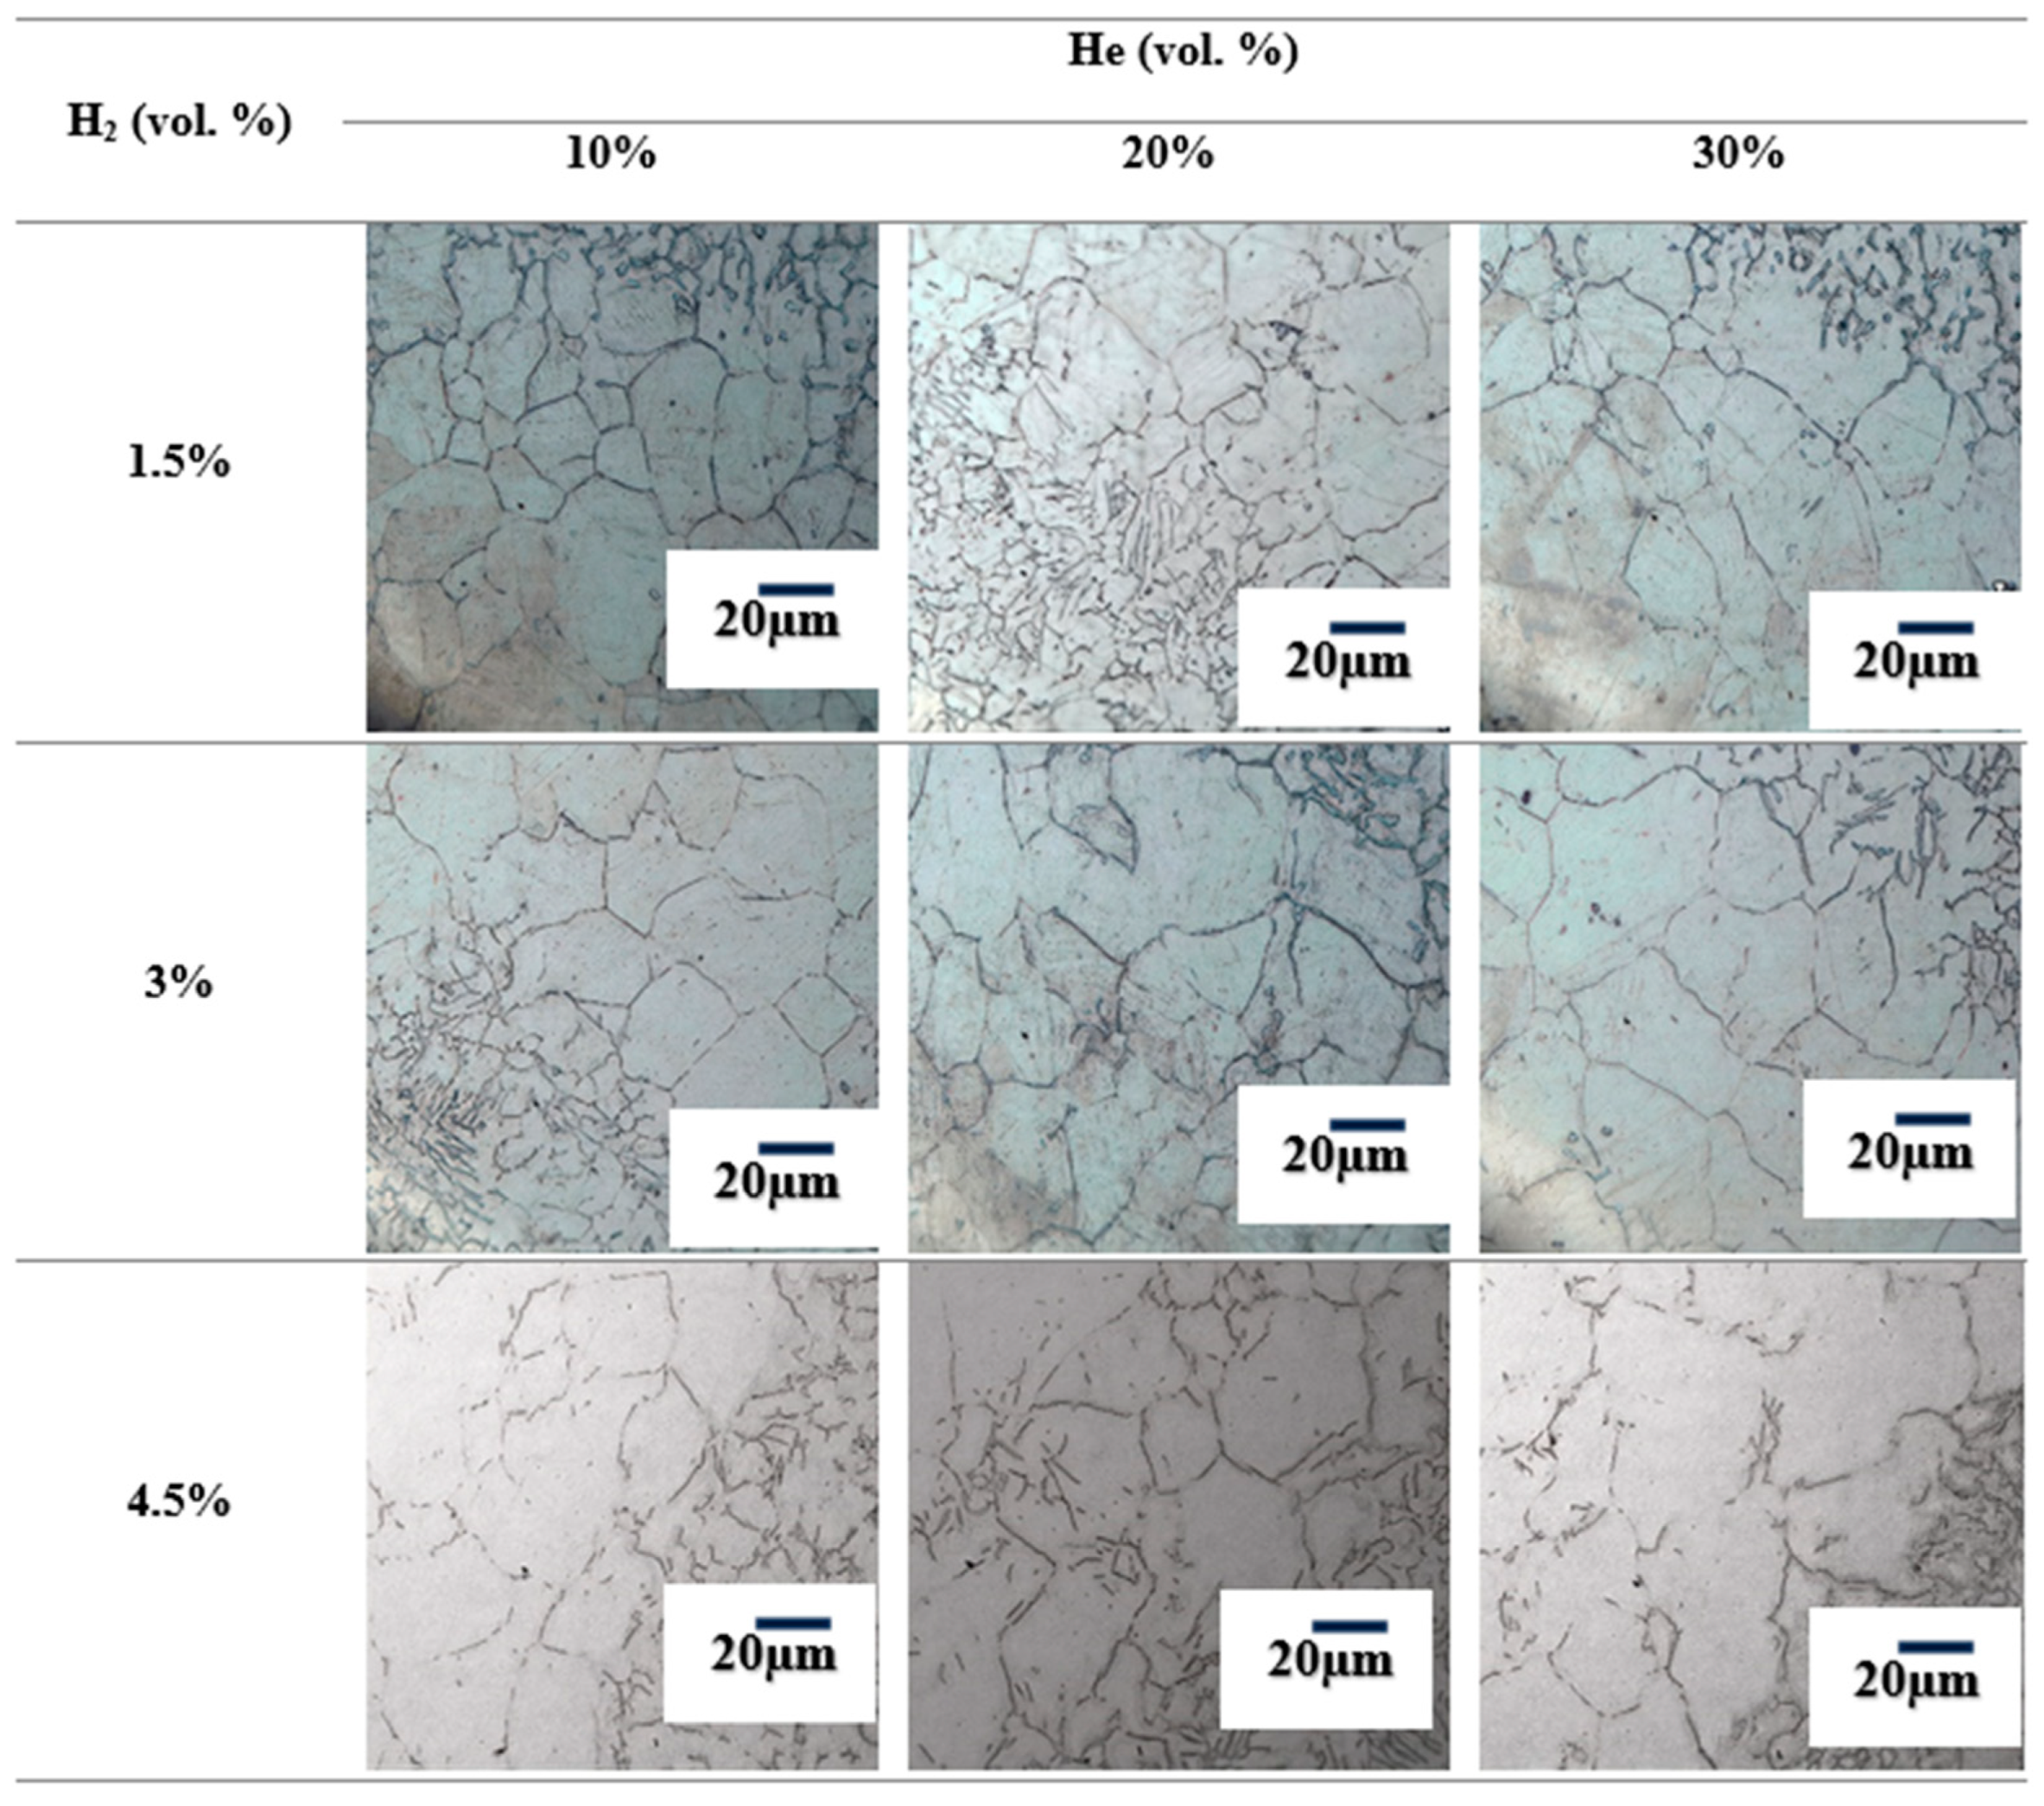
3.3. Microstructure Analysis

The microstructure formation in the weld zone is influenced by the welding factors, shielding gas composition and solidification rate, and heat input, as noted by Mvola and Kah [18], as well as Gao et al. [38]. Furthermore, the microstructure of welds is highly influenced by the shielding gas compositions and the heat input during the welding process. In the welded region, primary austenite (γ) appears as white grains, encircled by both continuous and discontinuous networks of ferrite (δ), which are gray. Also, δ-ferrite is typically found along the grain boundaries of austenite and can also be present within the austenite phase itself, as noted by Yu et al. [39]. Figure 9 demonstrates that increasing the H2 content in the shielding gas up to 4.5% enhances the fluidity of the weld pool, promoting better fusion and the illustrate that results in a finer grain structure at the microstructural scale., which improves the strength of the weld by acting as obstacles to dislocation movement. The higher H2 concentration also helps reduce surface tension, promoting a more uniform and stable molten pool, which leads to short dendrites [40,41]. This improvement in grain structure strengthens the material, as finer grains act as obstacles to dislocation movement, increasing both UTS and YS. Additionally, He, due to its high thermal conductivity, plays a critical role in stabilizing the arc. As the concentration of He rises from 10% to 30%, the weld pool becomes more stable, which leads to a more uniform microstructure. The higher concentration of He also promotes the formation of short dendrites, which are indicative of a more refined, equiaxed grain structure and twin grains. On the other hand, Ar, when present in higher amounts (e.g., 88.5%), reduces heat input and limits penetration, leading to a coarser grain structure and longer dendrites. The cooling rate is too fast due to insufficient heat input; it can lead to a coarser grain structure because the molten metal does not have sufficient time to solidify in a refined manner. This occurs because argon’s low thermal conductivity makes it less effective at stabilizing the arc and increasing the heat transfer to the base material, resulting in slower cooling rates and larger grain formation [17]. Coarse grains and longer dendrites are detrimental to mechanical properties, as they reduce strength and toughness [13,33]. Heat input is another crucial factor, as it dictates the cooling rate and, consequently, the grain size. Figure 10 demonstrates, at an arc current of 150 A, that the heat input is optimized for grain refinement, resulting in a fine-grained microstructure with a balanced distribution of γ and δ-ferrite, typically 3–12% δ-ferrite to prevent hot cracking while maintaining ductility and toughness. Short, smooth, and equiaxed dendrites contribute to a uniform and refined grain structure, enhancing strength and minimizing weak points, as per Chuaiphan and Srijaroenpramong [42]. However, Figure 11 demonstrates that excessive heat input, such as that provided by an arc welding current of 180 A, leads to slower cooling rates and promotes the formation of coarse grains and long dendrites, which degrade the material’s properties, reducing both tensile strength and hardness. Therefore, the optimal combination of 4.5% H2, 30% He, and a 150 A arc current produces the best mechanical properties by ensuring a fine-grained structure with reduced defects, while higher argon content and excessive heat input lead to coarser, weaker microstructures with lower tensile strength, hardness, and impact toughness. This combination ensures a balance between adequate penetration, arc stability, and a refined microstructure, which is crucial for achieving the highest strength and performance in welded materials.

3.4. EDX- Analysis

Table 4 summarizes the EDX analysis and Ferrite Number (FN) that provides the chemical composition and phase stability of various weld samples, focusing on key alloying elements (Fe, N, C, Si, Mn, Cr, Ni, Mo) that influence microstructure and mechanical properties. It includes Creq. and Nieq., which help assess the ferrite and austenite stabilizing elements in the weld. The Creq./Nieq. ratio is used to predict the phase formation, with a ratio less than 1.35 indicating austenite formation and more than 1.35 favoring ferrite formation. This ratio is essential for optimizing welding parameters to achieve the desired microstructure and mechanical properties in the weld. The Cr/Ni equivalent ratio (Creq./Nieq.) is employed to forecast the solidification characteristics of alloys, determining whether the weld will predominantly form austenite (γ-phase) or ferrite (δ-phase). A ratio below 1.35 suggests the formation of austenite, which improves ductility and toughness, whereas a ratio above 1.35 favors the formation of ferrite, improving thermal stability and resistance to hot cracking, but potentially reducing toughness [43]. When optimizing welding parameters, this ratio should be considered alongside other factors such as heat input and shielding gas composition to balance phase formation, microstructure, and mechanical performance, as stated by Bansod et al. [44]. The Creq. and Nieq. values are determined using the weight percentages of the alloying elements in the weld metal, with the following formulas:
Creq. = %Cr + %Mo + 1.5%Si + 0.5%Nb + 2%Ti
Nieq. = %Ni + 30%C + 0.5%Mn
The Creq./Nieq. ratios for the samples vary based on the shielding gas composition and heat input [45,46], with samples 1–9 showing higher ratios (1.49 to 1.47) due to lower He content (10–20%) and 1.5% H2, resulting in higher ferrite content, which enhances resistance to cracking. As He increases (20–30%) and H2 rises (3–4.5%), the ratios decrease, indicating a shift towards austenite stabilization (with Ni increasing), particularly in samples 16–18 (1.47). This trend is associated with improved fluidity and penetration but at the cost of coarser grain structure and lower mechanical properties due to over-fluidity [47], especially in samples 19–27 (1.47), where higher heat input (180 A) exacerbates grain coarsening and Ni segregation. Therefore, samples 10–15, with 3% H2 and 20–30% He at 150 A, strike the best balance between grain refinement, uniform alloy distribution, and mechanical properties, offering the optimal Creq./Nieq. ratio (around 1.48) [48].
The FN is a critical parameter used to estimate the amount of delta ferrite present in welds, particularly in stainless steel alloys such as AISI 316L [49]. The delta FN across all samples ranges from 29.03 to 29.28, indicating consistent ferrite content with minimal variation in chemical composition. Key factors influencing FN include Chromium Equivalent Creq. values between 20.2 and 20.55, Nieq. between 13.58 and 13.99, and Creq./Nieq. ratios from 1.47 to 1.49. Low and stable levels of carbon (0.03–0.05%) and nitrogen (0.04–0.06%) minimize strong austenite-stabilizing effects, while chromium (18–18.6%), nickel (11–11.5%), and molybdenum (2.1–2.28%) contribute to predictable phase balance. The FN values above 25 ensure adequate ferrite content to resist solidification cracking and enhance weldability, ductility, and corrosion resistance, making this range ideal for AISI 316L welds. Minor FN variations reflect slight changes in Creq./Nieq., with higher molybdenum and chromium increasing Creq. and FN stability [50].

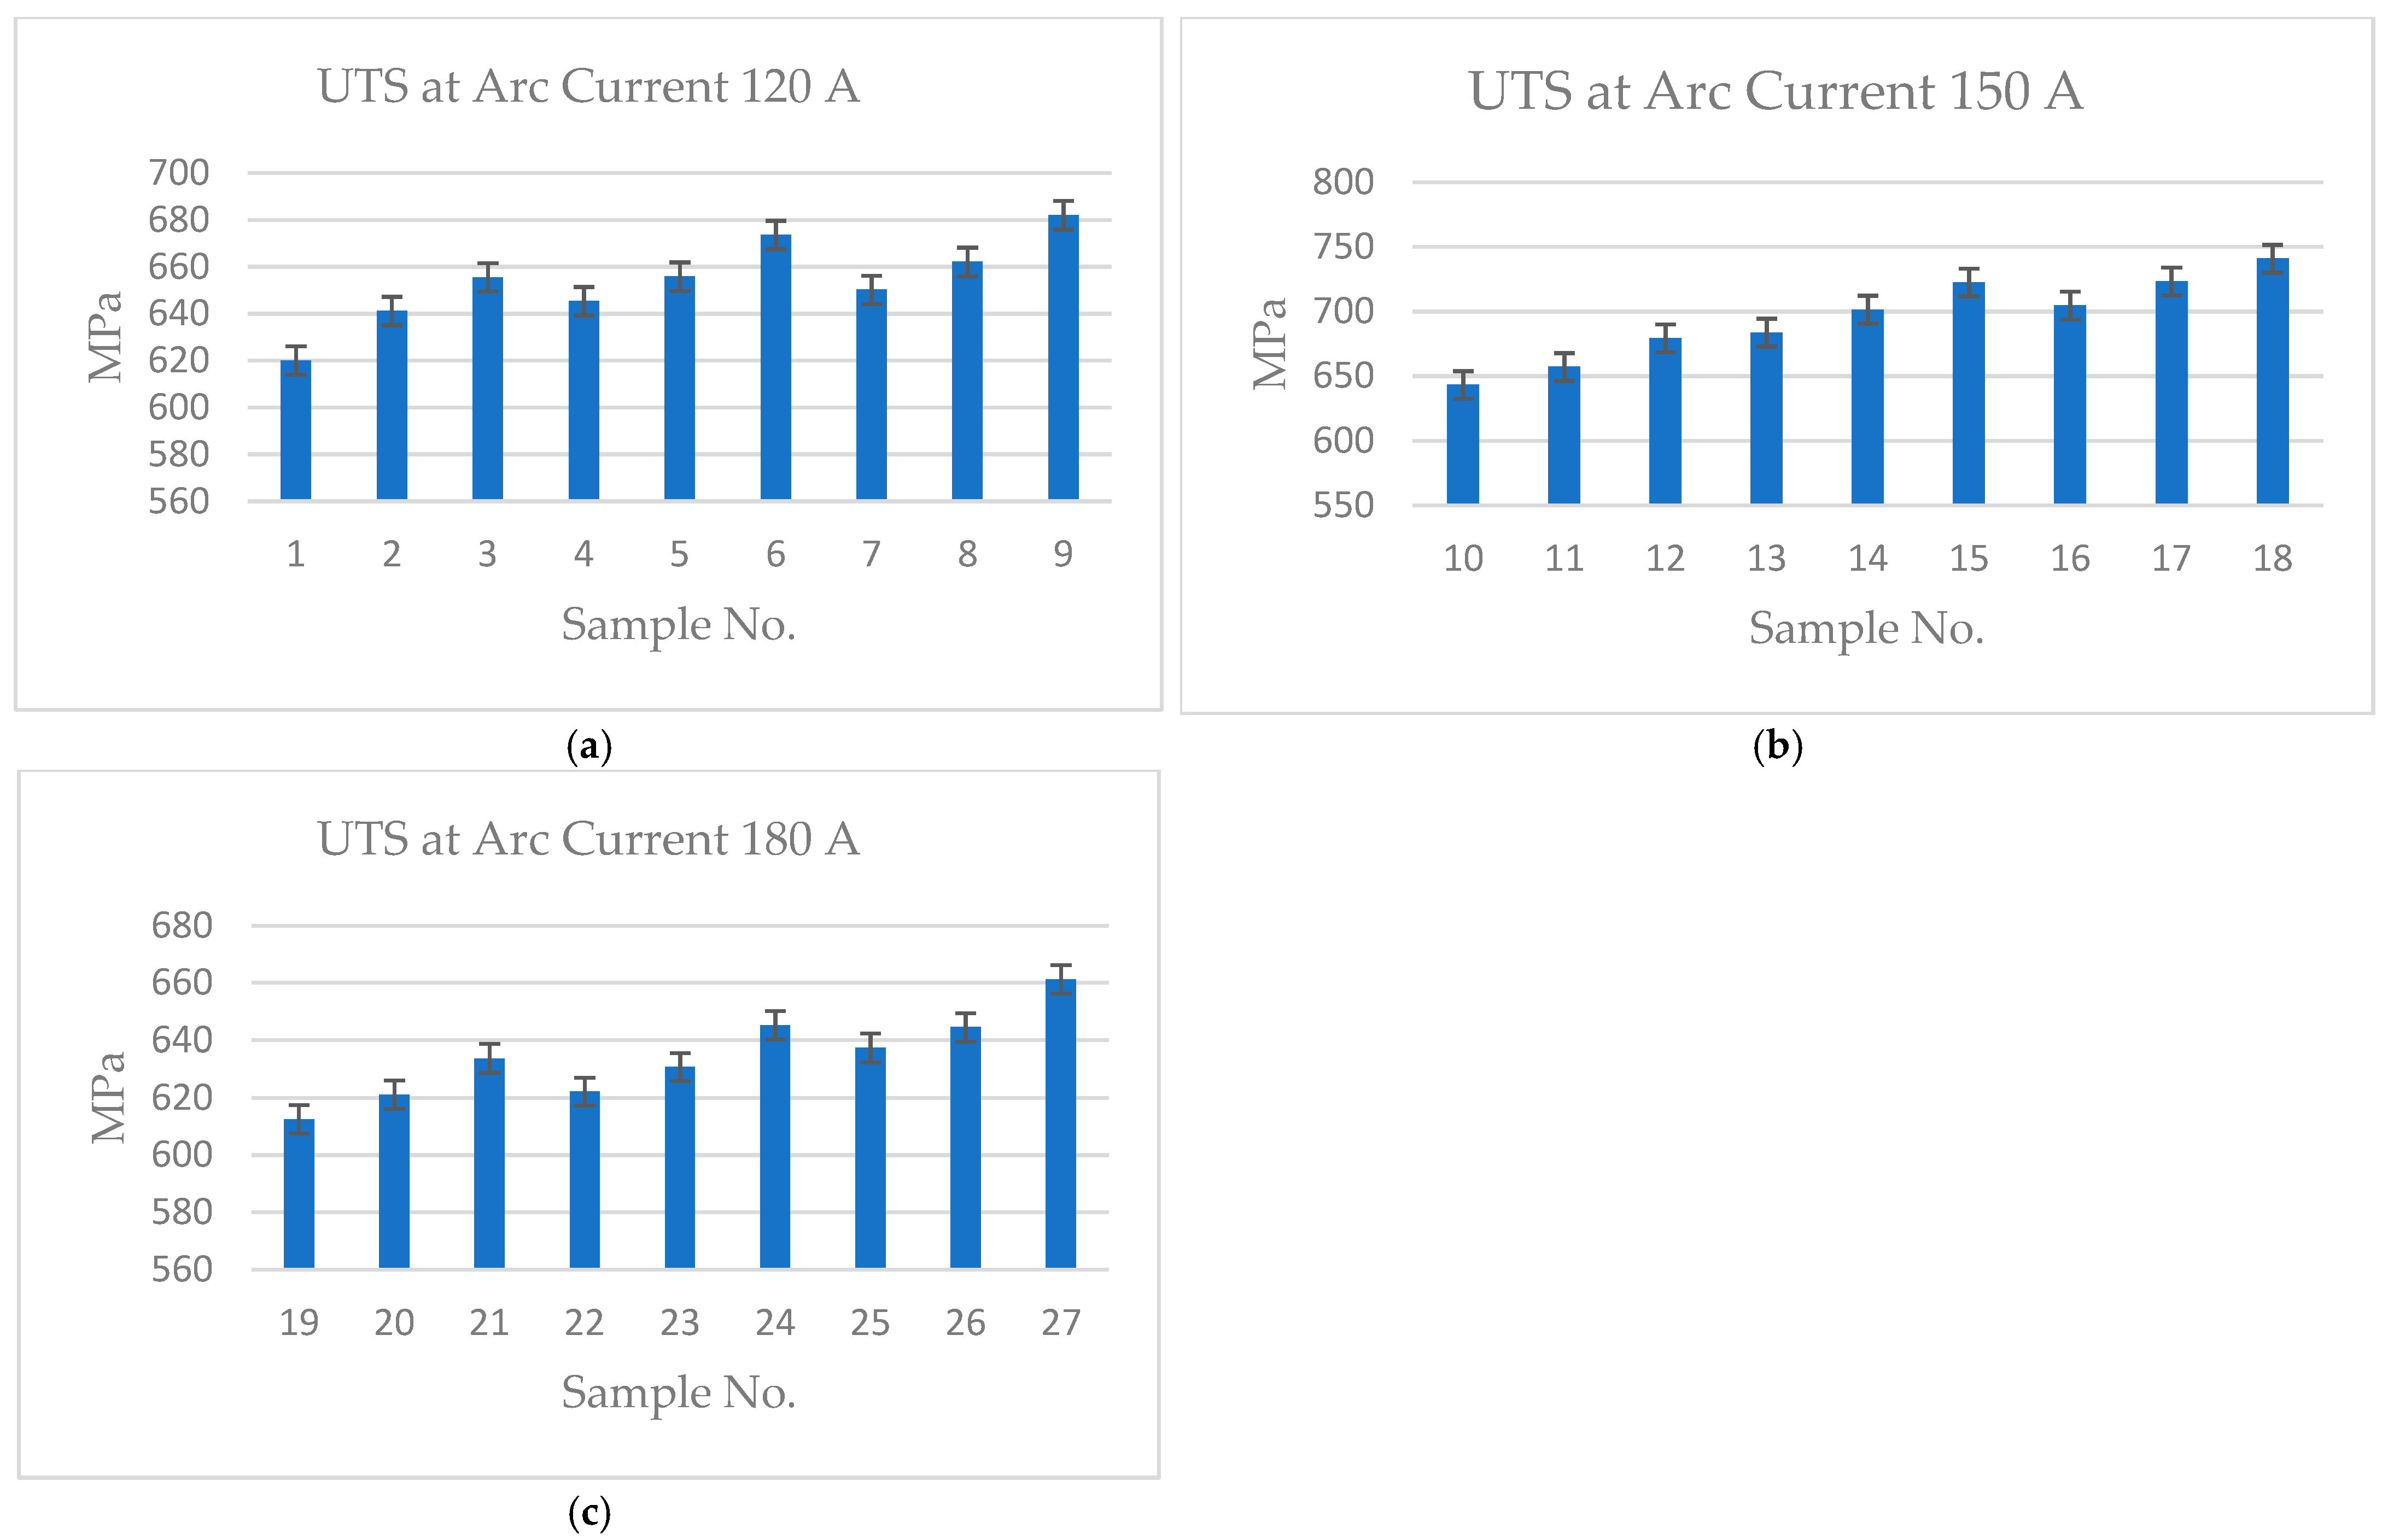
3.5. Tensile Strength and Yield Strength Analysis

Figure 12a–c presents the UTS results of 27 samples, highlighting the impact of welding factors. Increasing H2 content from 1.5% to 4.5% improves UTS, with values rising from 620.1 MPa at 1.5% H2 to 740.92 MPa at 4.5% H2. A higher arc current also enhances UTS, with 120 A, 150 A, and 180 A yielding progressively better results; the UTS of Sample No. 16, 722.6 MPa, was observed at 150 A, 3% H2, and 30% He. Similarly, increasing He content from 10% to 30% boosts UTS, further strengthening the welds. The optimal conditions for maximum UTS (~740 MPa) of Sample No. 18 are achieved at 150 A, 4.5% H2, and 30% He. 150 A current ensures balanced heat input for refined grain structure, while 4.5% H2 enhances arc stability and reduces surface tension, improving weld quality without causing embrittlement. Additionally, 30% He increases thermal conductivity and arc energy density, resulting in deeper penetration and uniform fusion [13]. These conditions minimize defects, refine the microstructure, and reduce residual stresses, collectively enhancing the tensile strength of the material [7,19].
Furthermore, Figure 13a–c demonstrates the effects of shielding gas composition and arc current on YS are attributed to metallurgical reasons, along with an increasing arc current from 120 A to 180 A. Increasing H2 content from 1.5% to 4.5% enhances weld pool fluidity, penetration, and grain refinement, leading to higher UTS and YS, with UTS rising from 679.35 MPa to 740.92 MPa and YS from 432 MPa to 477 MPa at 150 A and 30% He [7,19]. Similarly, increasing He from 10% to 30% improves arc stability and reduces porosity, further enhancing UTS (from 704.76 MPa to 740.92 MPa) and YS (from 447 MPa to 477 MPa) at 4.5% H2 [13,25]. Arc current is crucial, with 150 A providing the optimal balance of heat input and cooling rate, yielding the highest UTS (740.92 MPa) and YS (477 MPa) compared to 120 A (UTS = 673.68 MPa, YS = 429 MPa) and 180 A (UTS = 645.16 MPa, YS = 417 MPa) under the same gas conditions [13,33]. Excessive heat at 180 A leads to grain coarsening and reduced strength, while Table 5 presents the best welding combination of 4.5% H2, 150 A, and 30% He that creates a synergistic effect, producing a fine-grained, defect-free microstructure with maximum UTS and YS.

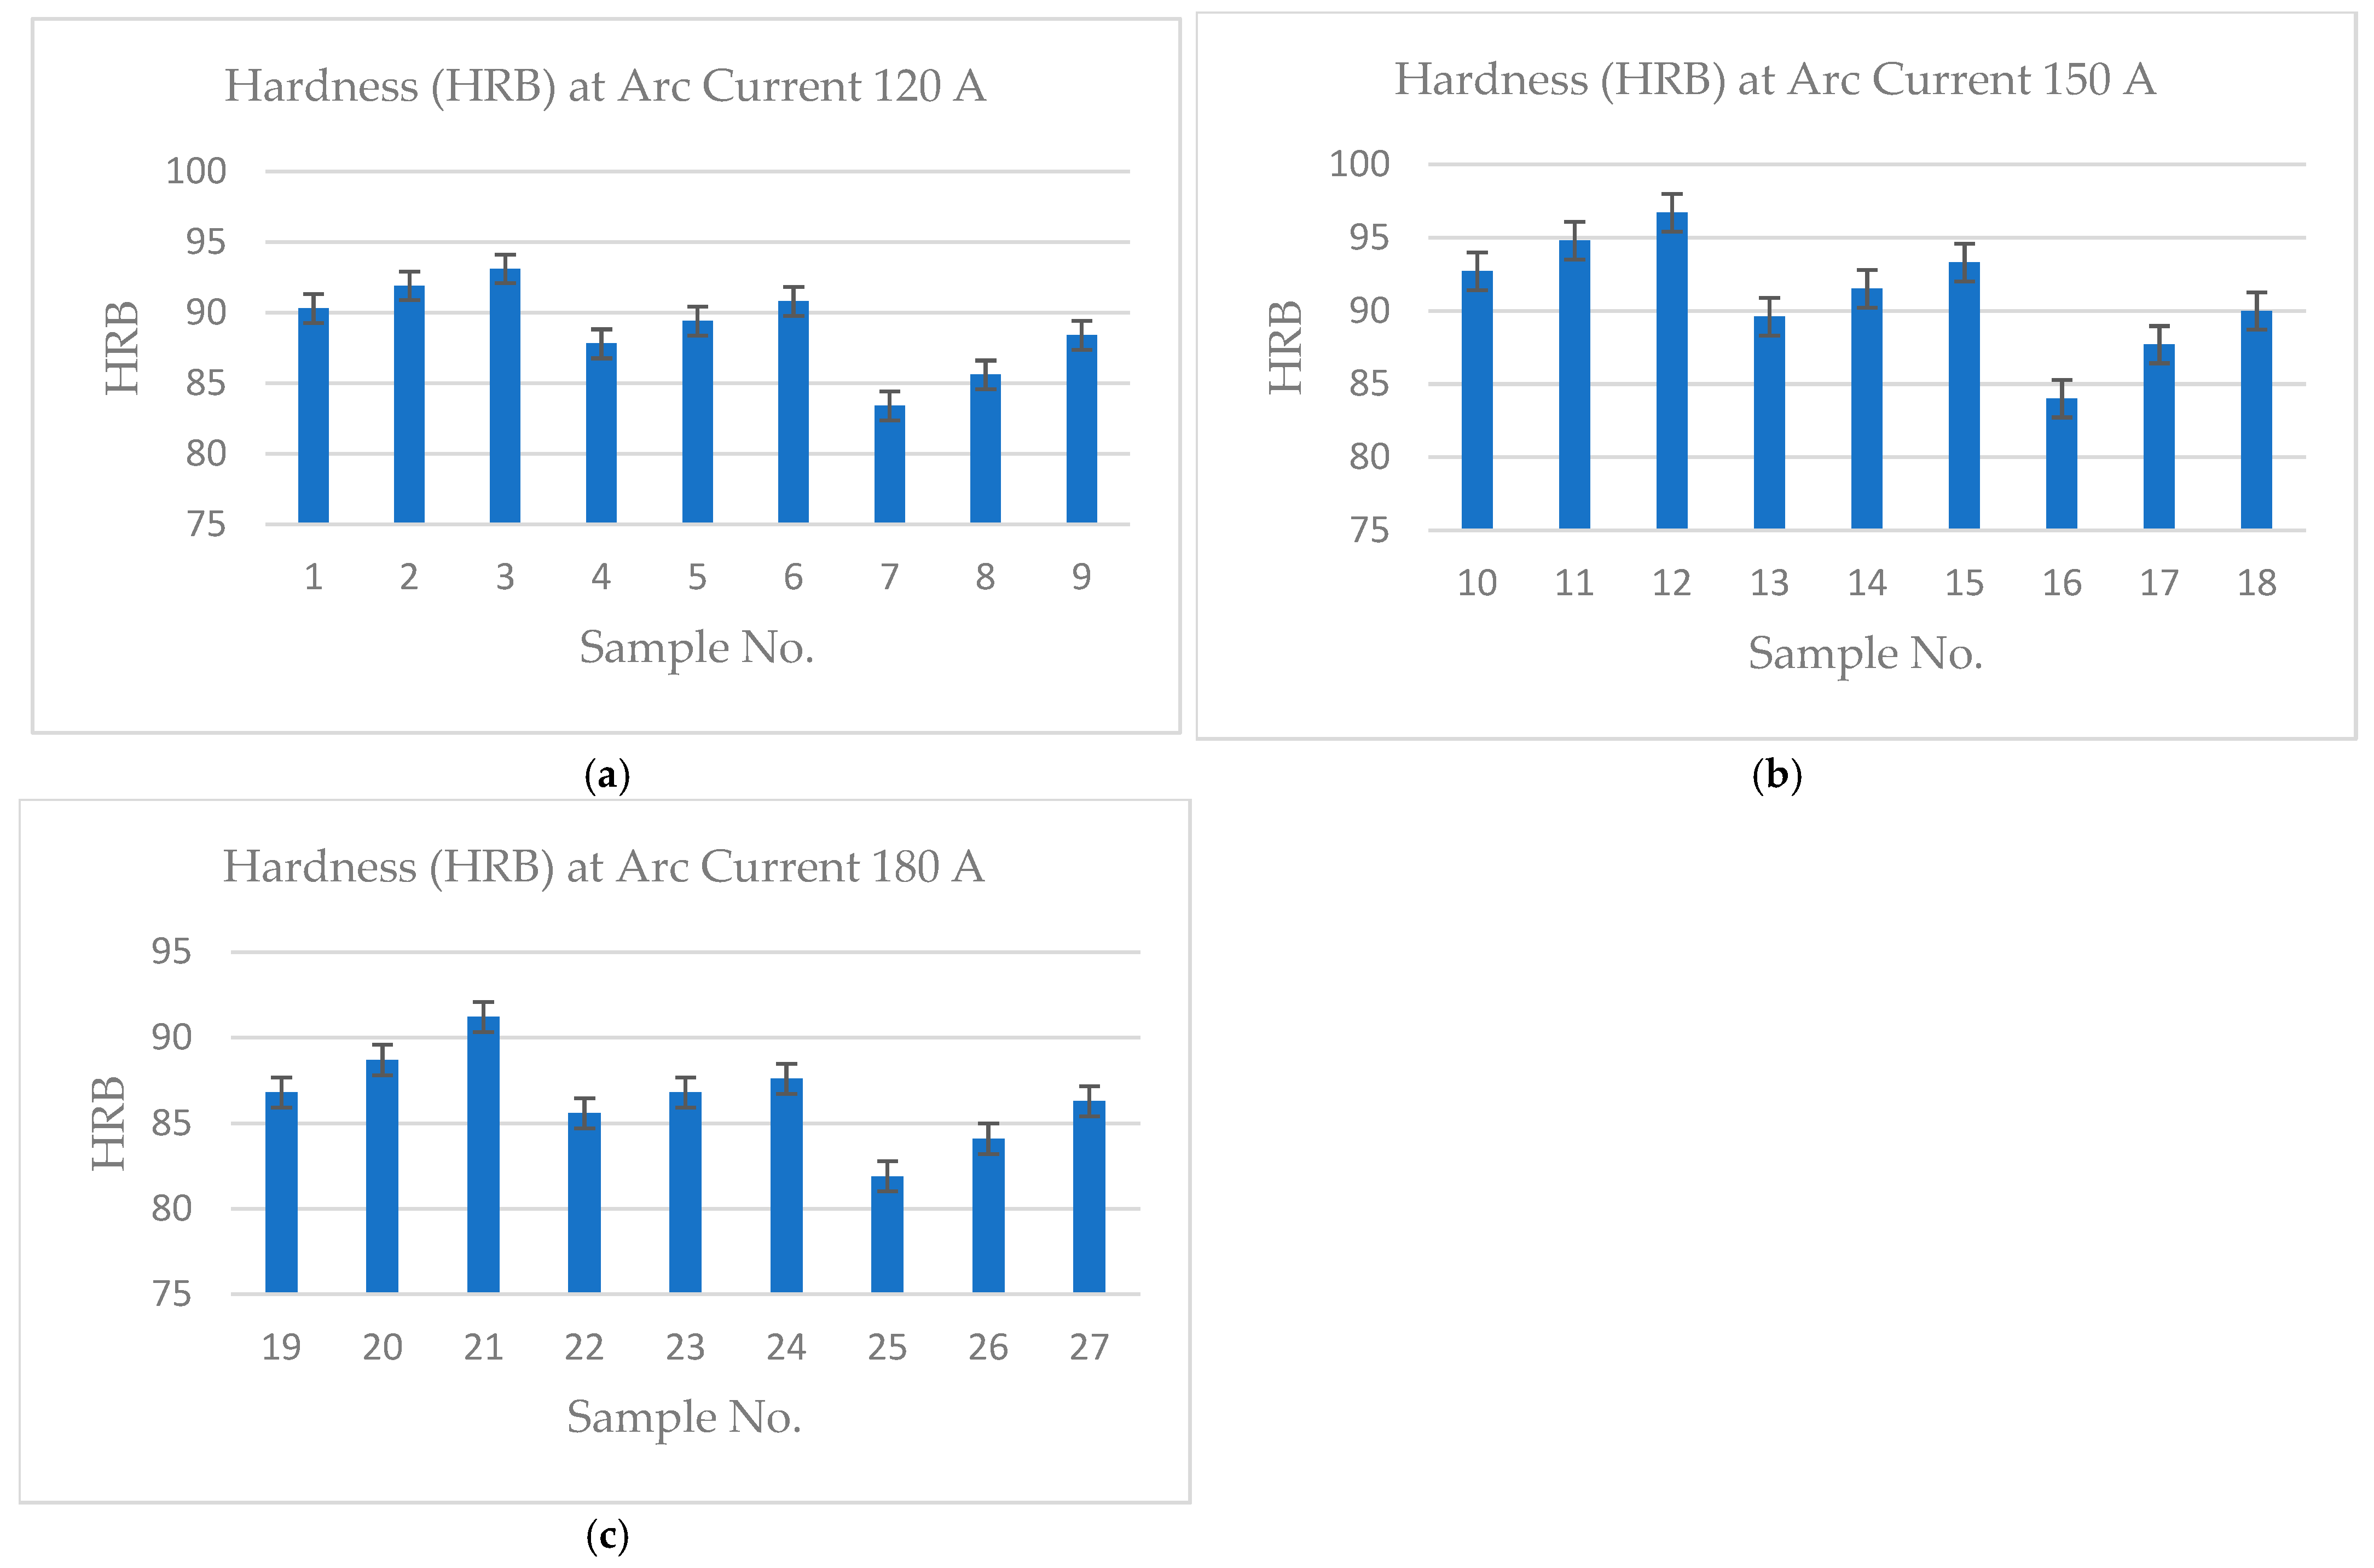
3.6. Rockwell Hardness (HRB) Analysis

HRB, or Hardness measured on the Rockwell B scale, evaluates the resistance of a material to plastic deformation under an applied load. In the given data, HRB values vary with welding parameters such as current, shielding gas composition, and heat input. These variations reflect changes in the microstructure, grain size, and thermal effects during welding, providing insights into the weld’s mechanical properties and its ability to resist wear or deformation under stress. The HRB values represent the average of five hardness measurements taken along the weld bead (fusion zone) of the welding joint. These average values reflect the influence of welding parameters, similar to ASTM E384 and ISO 9015-1 [51,52]. For HRB testing, the standard specific load applied is 100 kgf (kilogram-force), after an initial minor load of 10 kgf. The hardness of the welds is significantly influenced by the shielding gas composition and arc current. At 120 A, increasing H2 content, hardness increases from 90.3 HRB (1.5% H2) to 93.1 HRB (3% H2) and reaches 90.8 HRB at 4.5% H2, indicating a positive effect of H2 on hardness due to improved weld pool fluidity and finer grain structure, as shown in Figure 14a. He plays a role, with hardness rising from 92.7 HRB at 10% He to 96.7 HRB at 30% He when used with 150 A and 1.5% H2, as shown in Figure 14b, suggesting that higher He content leads to improved weld fusion and a more uniform microstructure. At constant He levels, increasing H2 content tends to slightly decrease hardness. For example, at 30% He and 150 A, the hardness drops from 96.7 (1.5% H2, Sample 12) to 90 (4.5% H2, Sample 18). In contrast, when Ar is used in higher proportions (e.g., 88.5% Ar), hardness decreases, as seen at 120 A, where hardness drops to 83.4 HRB at 4.5% H2 and 10% He, indicating a coarser grain structure and less efficient arc stabilization. Additionally, at 180 A, hardness tends to decrease further, with values dropping to 81.9 HRB at 10% He and 4.5% H2, reflecting the negative impact of excessive heat input on grain size and mechanical properties, as shown in Figure 14c. Hence, the weld hardness increases with He content at all current levels, peaking at 93.1 HRB for 120 A (Sample No. 3) and 96.7 HRB for 150 A (Sample No. 12), as the optimized heat input promotes refined microstructures. However, at 180 A, hardness is slightly lower, with a maximum of 91.2 HRB (Sample No. 21), likely due to excessive heat causing grain coarsening. Therefore, the hardness of welds is influenced by heat input and cooling rate [33]. Moderate heat input (e.g., 120 A and 150 A) with faster cooling rates promotes finer grain structures, increasing hardness, especially with helium-enhanced heat transfer (e.g., 96.7 HRB at 150 A, 30% He) [13]. In contrast, excessive heat input (e.g., 180 A) slows cooling, causing grain coarsening and reduced hardness (e.g., 81.9 HRB) [40]. Optimal hardness requires a balance of heat input and cooling rate to refine the microstructure and avoid grain growth. Overall, Table 6 presents the highest hardness (96.7 HRB), achieved in Sample No. 12 (150 A, 1.5% H2, 30% He, 65.5% Ar). This is the optimal combination for achieving a refined microstructure and high mechanical strength.

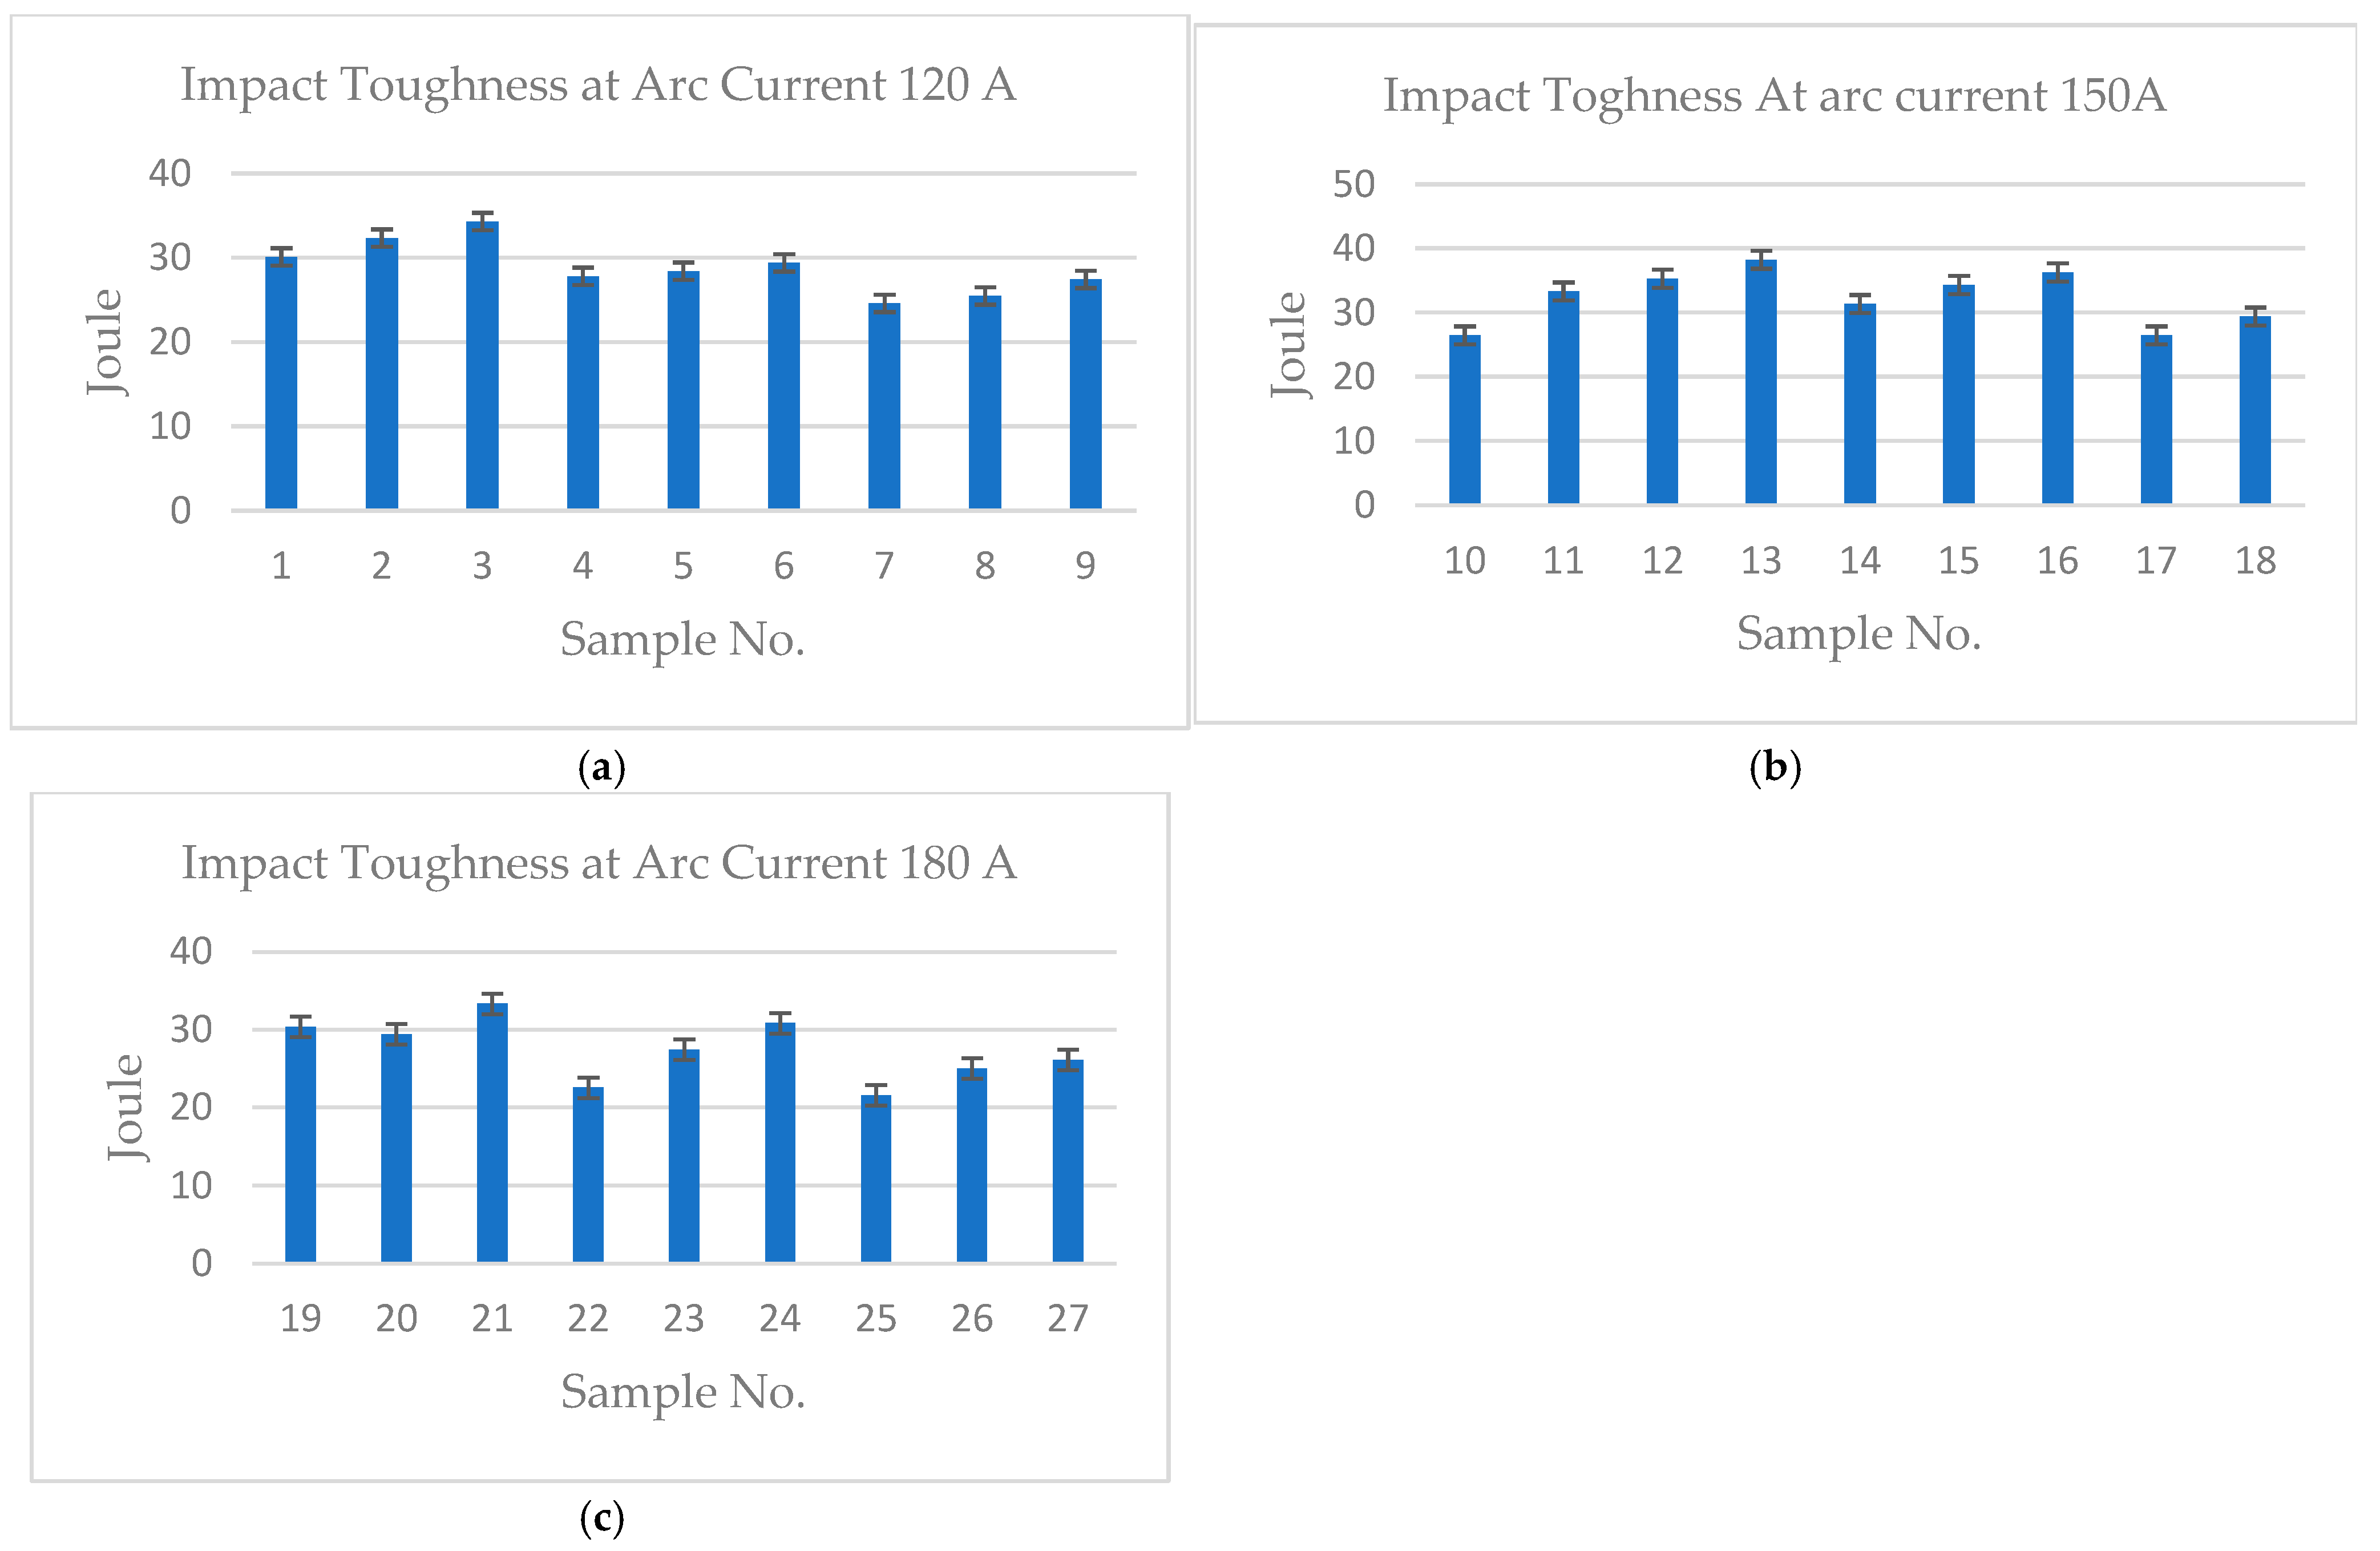
3.7. Impact Toughness Analysis

Toughness, as measured in Figure 15a–c, represents the weld’s ability to absorb energy during impact without fracturing. It is influenced by welding parameters such as current, shielding gas composition, and heat input. As arc current increases from 120 A to 180 A, impact toughness tends to fluctuate, with some decrease in toughness at 180 A (e.g., Sample No. 19, toughness = 30.38 J, Sample No. 25, toughness = 21.56 J). Increasing H2 from 1.5% to 4.5% does not show a consistent pattern, but, for example, Sample No. 1 (H2 1.5%, toughness = 30.1) has lower toughness than Sample No. 3 (H2 30%, toughness = 34.3). Higher He content (e.g., 30% in Sample No. 3, toughness = 34.3) generally correlates with lower toughness. Hence, at 120 A, impact toughness increases with higher H2 content, rising from 30.1 J at 1.5% H2 to 34.3 J at 3% H2, but decreases to 24.6 J at 4.5% H2, indicating that while H2 improves weld pool fluidity and fusion, excessive H2 content may lead to embrittlement. The addition of He significantly enhances impact toughness, with values increasing from 26.46 J at 10% He to 35.28 J at 30% He when combined with an arc current of 150 A and 1.5% H2. This suggests that He improves the arc stability, reduces porosity, and contributes to a more uniform microstructure, enhancing toughness. At 180 A, despite a higher current, impact toughness decreases, with values of 21.56 J at 10% He and 4.5% H2 to 26.1 J at 30% He and 4.5% H2, reflecting the negative impact of excessive heat input on toughness due to coarser grain structures [7]. The highest impact toughness is observed at 150 A with 3% H2 and 10% He of Sample No. 13, where the toughness reaches 36.26 J, indicating the optimal combination of shielding gases and heat input for achieving improved resistance to impact. Thus, Table 7 presents the optimal combination for superior mechanical properties (high UTS, YS, hardness, and impact toughness) is a 150 A arc current, 3% H2, and 10% He. Thus, the heat input (linked to amperage and gas content) significantly affects the microstructure [33,40], which in turn impacts weld toughness. High heat input generally results in a coarse microstructure that reduces toughness, while lower heat input produces a finer microstructure that is typically tougher. Additionally, the helium content increases heat input, leading to a decrease in toughness, whereas higher hydrogen content at lower amperage can improve toughness by refining the microstructure [13,14].

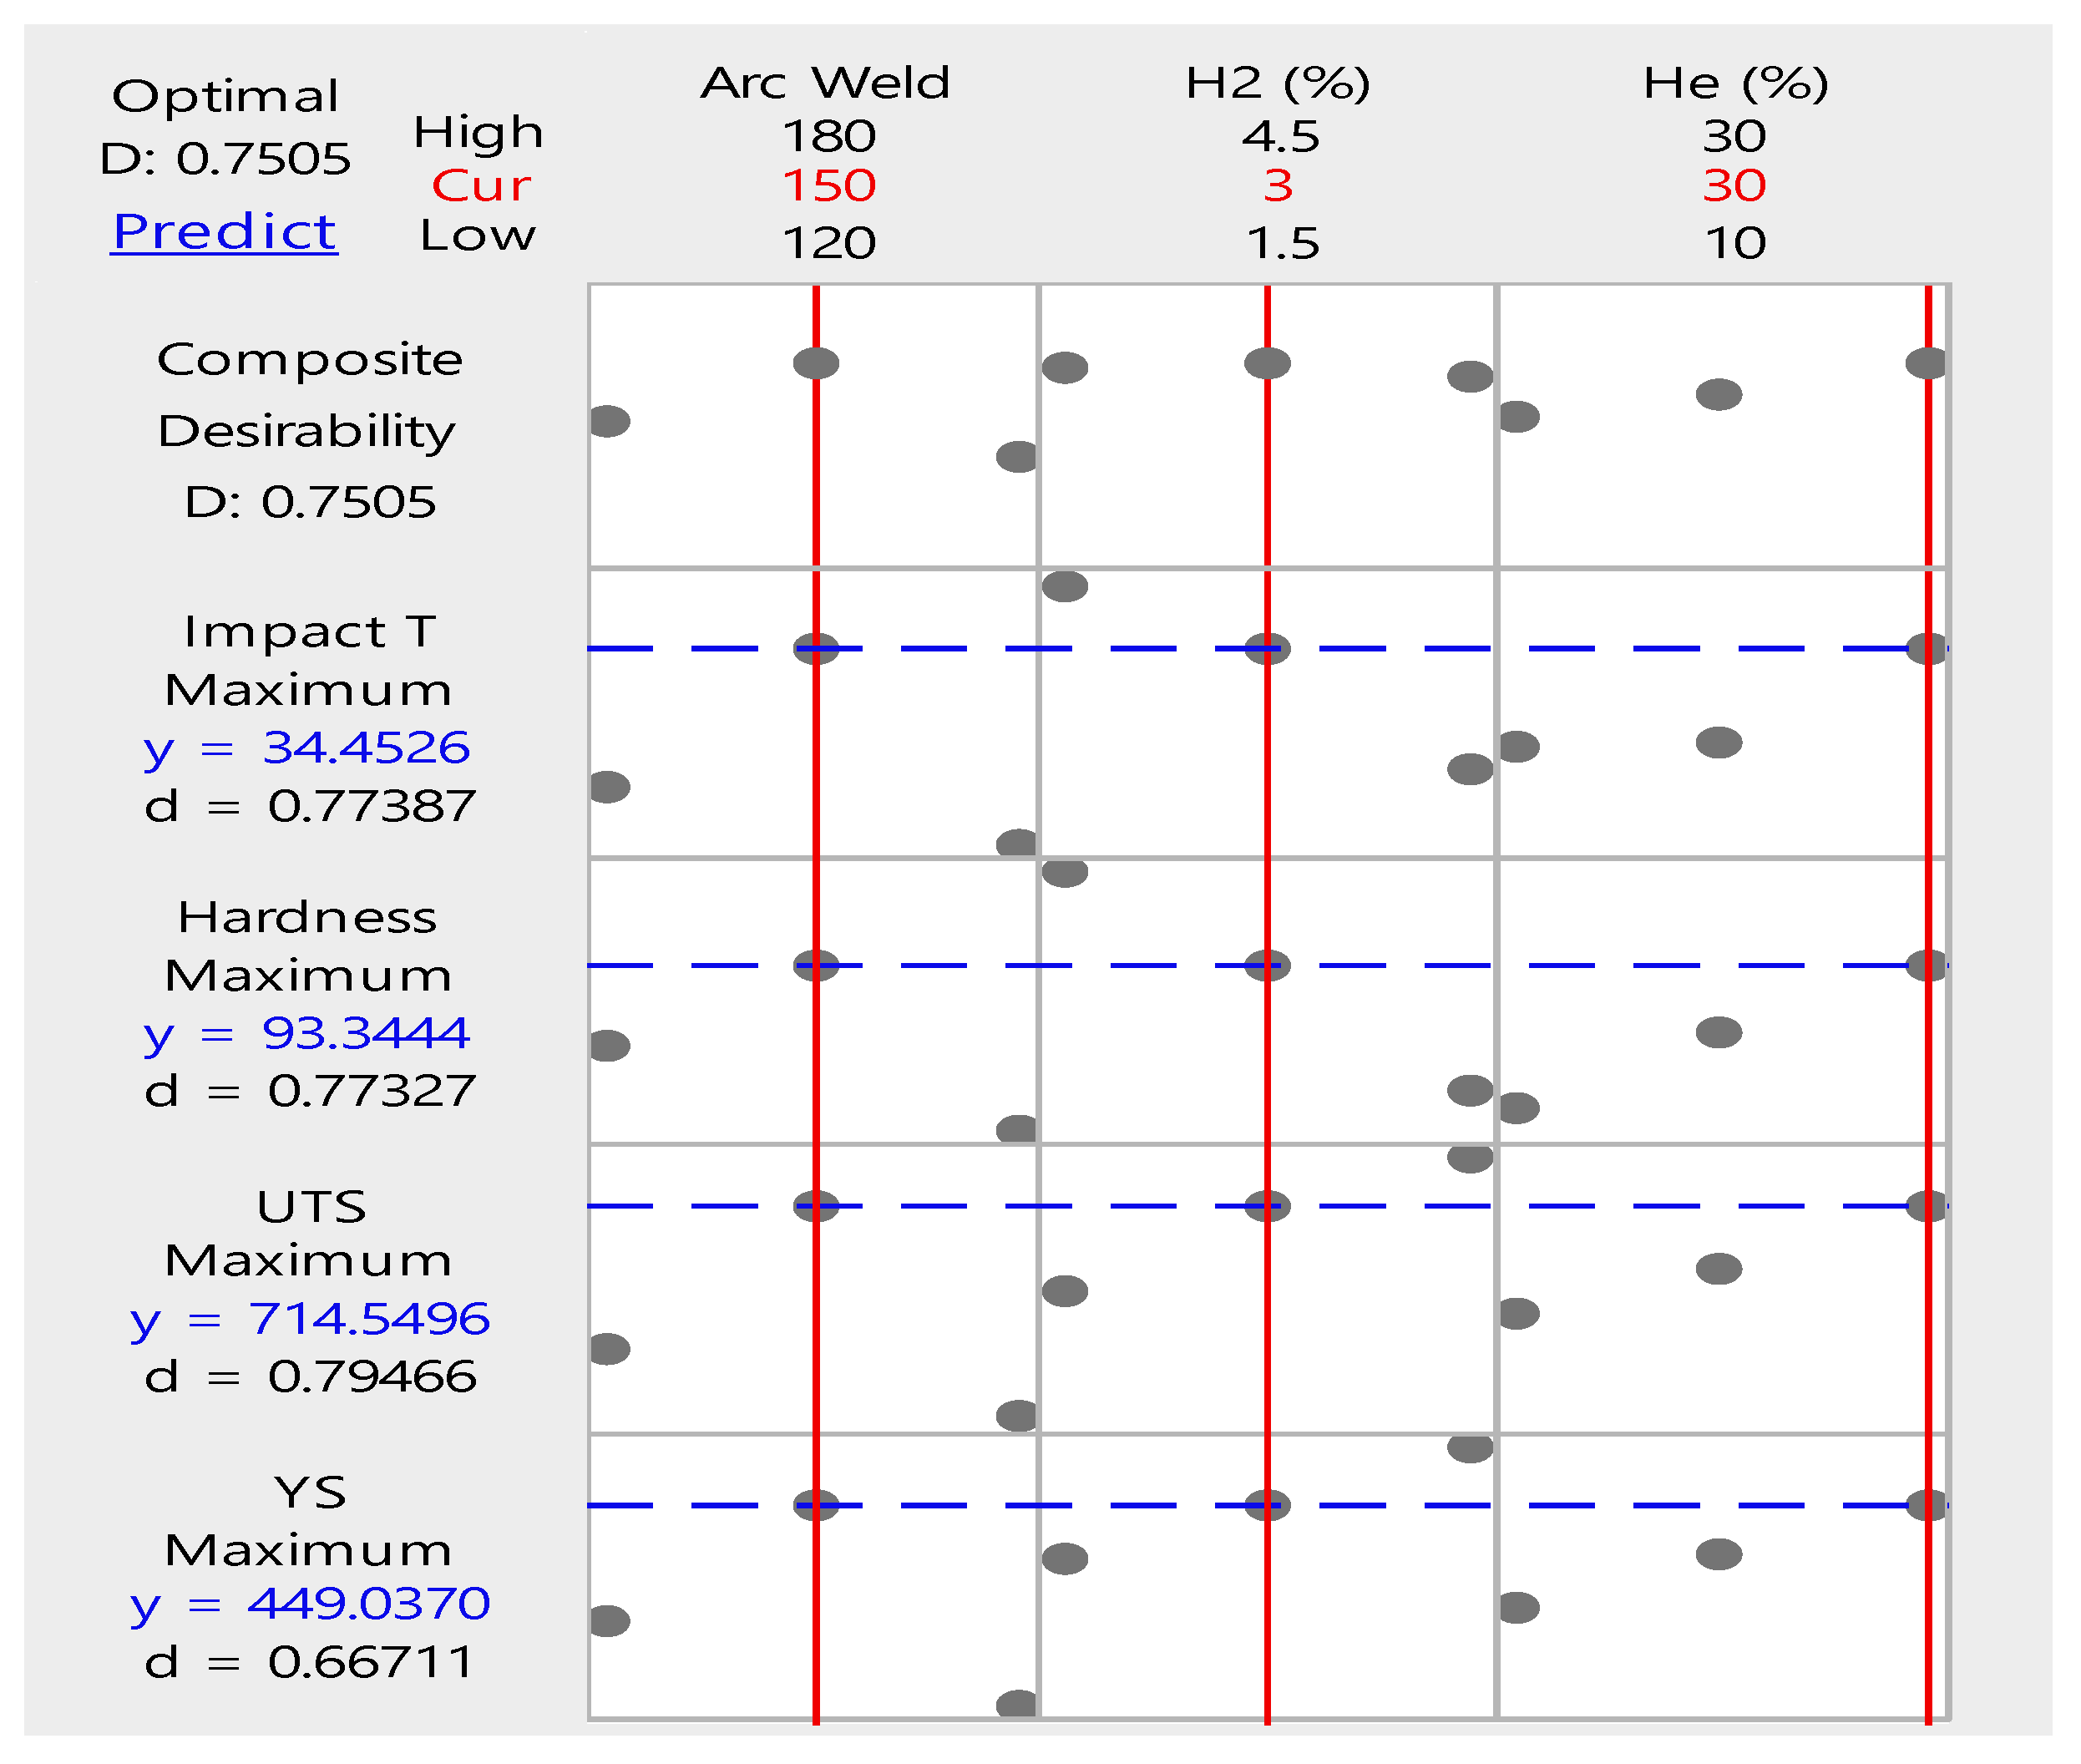
3.8. Taguchi Analysis

Figure 16 presents the optimal parameters for achieving the best mechanical properties in TIG-welded AISI 316L stainless steel. The Signal-to-Noise ratio (S/N) measures system quality and robustness by comparing the desired signal to background variation. A higher S/N ratio indicates greater resistance to variations. This reveals that an 150 A arc current provides the best balance of heat input and cooling rate, leading to higher UTS, YS, hardness, and toughness. He concentrations of 20–30% improve arc stability, heat transfer, and penetration, with 30% He yielding optimal results; however, excessive He (>30%) leads to an overly fluid weld pool, causing defects. The optimal welding parameters for the best mechanical properties of UTS: 714.54 MPa, YS: 449.03 MPa, hardness: 93.34 HRB, and impact toughness: 34.45 J are 3% H2, 30% He, and 150 A arc current [13,14,25].
Figure 17 and Figure 18 illustrate the optimal welding parameters for UTS and YS, using a welding arc of 150 A, 4.5% H2, and 30% He. Similarly, Figure 19 and Figure 20 show the best welding parameters for hardness, toughness, and UTS with a welding arc of 150 A, 1.5% H2, and 30% He, as in Krais et al. [25].
Table 8 presents the results of an analysis of variance (ANOVA) for the impact of welding parameters on UTS. The factors considered are Arc Welding Ampere (A), H2 (%), and He (%). Arc Welding Ampere has the highest effects on the variability (57.77%), with a significant F-value of 96.02 and a p-value of 0.000, indicating a strong effect on the response. H2 and He also contribute significantly, with contributions of 22.19% and 14.03%, respectively, having low p-values (0.000), suggesting that these factors also have a significant impact. The results demonstrate that all the factors have a statistically significant effect on the outcome at the 95% confidence level. Furthermore, the ANOVA in Table 9 for YS shows that Arc Welding Ampere (A) has the largest impact, contributing 51.41% to the variability, followed by H2 (%) with 29.83%, and He (%) with 10.92%. All factors have significant effects, with F-values of 65.64, 38.09, and 13.94, respectively, and p-values of 0.000. The error term accounts for 7.83% of the variability. All factors are statistically significant at the 95% confidence level.
The ANOVA Table 10 for hardness shows that H2 (%) has the largest impact, contributing 48.79% to the variability, followed by Arc Welding Ampere (A) with 27.57%, and He (%) with 20.14%. All factors have significant effects, with F-values of 139.37, 78.77, and 57.53, respectively, and p-values of 0.0. The error term contributes only 3.50% to the total variability. All factors are statistically significant at the 95% confidence level. The ANOVA Table 11 for Impact Toughness shows that H2 (%) has the largest contribution, accounting for 44.59% of the variability, followed by Arc Welding Ampere (A) with 37.58%, and He (%) with 8.92%. All factors have significant effects, with F-values of 50.03, 42.16, and 10.01, respectively, and p-values of 0.0, 0.0, and 0.001. The error term contributes 8.91% to the total variability. All factors are statistically significant at the 95% confidence level.

4. Conclusions

This study investigates the impact of H2 and He additions to the shielding gas in TIG welding of AISI 316L stainless steel, with a focus on weld quality, microstructure, and the resulting mechanical properties. The addition of H2 and He improves weld quality, with H2 concentrations of 1.5% to 3.0% enhancing penetration, fluidity, and surface finish, while He concentrations of 10% to 20% improve arc stability and smoothness. However, excessive H2 (4.5%) or He (30%) can lead to defects such as porosity and irregular bead profiles. Additionally, H2 (up to 4.5%) and He (up to 30%) improve the microstructure by enhancing weld pool fluidity, promoting a fine-grained structure that increases mechanical properties. In contrast, high levels of Ar slow cooling result in larger grains and reduced mechanical properties. Thus, the optimal He content is 30%, as higher levels can harm weld quality due to excessive heat and instability. Similarly, H2 content is capped at 4.5% to prevent defects such as porosity and cracking, ensuring improved arc performance without compromising weld integrity. Furthermore, statically, the main results from the ANOVA analyses indicate that H2 (%) has the most significant impact on both Hardness (48.79% contribution) and Impact Toughness (44.59% contribution), followed by Arc Welding Ampere (A), with 27.57% for Hardness and 37.58% for Impact Toughness, and He (%) with 20.14% for Hardness and 8.92% for Impact Toughness. All factors are statistically significant, with F-values ranging from 10.01 to 139.37 and p-values of 0.000 to 0.001. The error terms contribute only a small percentage to the total variability (3.50% for Hardness and 8.91% for Impact Toughness), and all factors are significant at the 95% confidence level. The optimal TIG welding condition of 3% H2, 30% He, and a 150 A arc current yields the best mechanical properties, including high UTS, YS, hardness, and impact toughness, supported by a refined microstructure that enhances the performance of the material.

Author Contributions

Conceptualization, S.K. and T.D.; methodology, S.K., T.D., A.M. and A.A.A.; software, A.M. and A.A.A.; validation, S.K., T.D., A.M. and A.A.A.; formal analysis, S.K., T.D., A.M. and A.A.A.; investigation, A.M. and A.A.A.; resources S.K. and T.D.; data curation, S.K. and T.D.; writing—original draft preparation, S.K., A.M. and A.A.A.; writing—review and editing, T.D.; visualization, S.K. and T.D.; supervision, S.K. and T.D.; project administration, S.K. and T.D.; funding acquisition, S.K. All authors have read and agreed to the published version of the manuscript.

Funding

The research was funded by the Deanship of Research, Jordan University of Science and Technology (JUST), Jordan, Grant No. 20100199.

Data Availability Statement

All data that support the findings of this study are included within the article.

Conflicts of Interest

The authors declare no conflicts of interest.

References

  1. Durgutlu, A. Experimental investigation of the effect of hydrogen in argon as a shielding gas on TIG welding of austenitic stainless steel. Mater. Des. 2004, 25, 19–23. [Google Scholar] [CrossRef]
  2. Gülenç, B.; Develi, K.; Kahraman, N.; Durgutlu, A. Experimental study of the effect of hydrogen in argon as a shielding gas in MIG welding of austenitic stainless steel. Int. J. Hydrogen Energy 2005, 30, 1475–1481. [Google Scholar] [CrossRef]
  3. Chuaiphan, W.; Srijaroenpramong, L. Effect of hydrogen in argon shielding gas for welding stainless steel grade SUS 201 by GTA welding process. J. Adv. Join. Process. 2020, 1, 100016. [Google Scholar] [CrossRef]
  4. Kah, P.; Martikainen, J. Influence of shielding gases in the welding of metals. Int. J. Adv. Manuf. Technol. 2013, 64, 1411–1421. [Google Scholar] [CrossRef]
  5. Huang, H.-Y. Argon-hydrogen shielding gas mixtures for activating flux-assisted gas tungsten arc welding. Metall. Mater. Trans. A 2010, 41, 2829–2835. [Google Scholar] [CrossRef]
  6. Eliezer, D.; Nissim, Y.; Kannengießer, T. Effects of shielding with various hydrogen-argon mixtures on supermartensitic stainless steel TIG welds. Mater. Test. 2010, 52, 306–315. [Google Scholar] [CrossRef]
  7. Xue, J.; Wu, H.; Zhou, C.; Zhang, Y.; He, M.; Yan, X.; Xie, H.; Yan, R.; Yin, Y. Effect of heat input on hydrogen embrittlement of TIG welded 304 austenitic stainless steel. Metals 2022, 12, 1943. [Google Scholar] [CrossRef]
  8. Mahajan, A.; Singh, H.; Kumar, S.; Kumar, S. Mechanical properties assessment of TIG welded SS 304 joints. Mater. Today Proc. 2022, 56, 3073–3077. [Google Scholar] [CrossRef]
  9. Sakthivel, P.; Sivakumar, P. Effect of vibration in Tig and arc welding using AISI 316 stainless steel. Int. J. Eng. Res. Sci. Technol. 2014, 3, 116–130. [Google Scholar]
  10. Pandya, D.; Badgujar, A.; Ghetiya, N. A novel perception toward welding of stainless steel by activated TIG welding: A review. Mater. Manuf. Process. 2021, 36, 877–903. [Google Scholar] [CrossRef]
  11. Ramachandran, R. Analysis and experimental investigations of weld characteristics for a TIG welding with SS316l. Int. J. Adv. Eng. Res. 2015, 10, 1–6. [Google Scholar]
  12. Olden, V.; Aune, R.; Ro̸rvik, G.; Akselsen, O.M. Hydrogen Pick Up and Diffusion in TIG Welding of Super martensitic 13% Cr Stainless Steel With Superduplex Wire. In Proceedings of the International Conference on Offshore Mechanics and Arctic Engineering, Halkidiki, Greece, 12–17 June 2005; Volume 41979, pp. 269–274. [Google Scholar]
  13. Khrais, S.; Mohammed, A.; Al, A.A.; Darabseh, T. Effect of TIG welding parameters on 316 L stainless steel joints using taguchi L27 approach. Mater. Res. Express 2024, 11, 016512. [Google Scholar] [CrossRef]
  14. Khrais, S.; Al Hmoud, H.; Al, A.A.; Darabseh, T. Experimental investigation of the impact of GMAW welding parameters on the mechanical properties of AISI 316L/ER 316L using quaternary shielding gas. Mater. Res. Express 2024, 11, 046501. [Google Scholar] [CrossRef]
  15. Lippold, J.C.; Kotecki, D.J. Welding Metallurgy and Weldability of Stainless Steels; Wiley: Hoboken, NJ, USA, 2005. [Google Scholar]
  16. Zhang, H.; Shen, M.; Tian, X.; Zhang, Q.; Chen, Z.; Yao, J. Investigating the Influence Mechanism of Different Shielding Gas Types on Arc Characteristics and Weld Quality in TA2 Laser–Arc Hybrid Welding. Metals 2024, 14, 946. [Google Scholar] [CrossRef]
  17. Wang, Y.; Liu, W.; Li, W.; Su, X.; Zhao, W.; Xu, G.; Zhu, J. Effects of He-Ar shielding gas compositions on arc plasma physical properties in rotating laser+ GMAW hybrid fillet welding: Numerical simulation. Opt. Laser Technol. 2024, 178, 111231. [Google Scholar] [CrossRef]
  18. Mvola, B.; Kah, P. Effects of shielding gas control: Welded joint properties in GMAW process optimization. Int. J. Adv. Manuf. Technol. 2017, 88, 2369–2387. [Google Scholar] [CrossRef]
  19. Pandya, D.; Badgujar, A.; Ghetiya, N. Effect of hydrogen additions to shielding gas on activated TIG austenitic stainless steel weld. Mater. Today Proc. 2021, 47, 1025–1029. [Google Scholar] [CrossRef]
  20. Hosseini Farzaneh, S.; Belbasi, M. Effects of Shielding Gas on the Depth, Width and Hardness of 17-4PH Stainless Steel during TIG Welding. J. Environ. Friendly Mater. 2020, 4, 25–29. [Google Scholar]
  21. Aljufri, A.; Sofyan, S.; Rizki, M.N.; Putra, R.; Mawardi, I. Influence of shielding gas flow on the TIG welding process using stainless steel 304 material. J. Weld. Technol. 2024, 6, 38–45. [Google Scholar] [CrossRef]
  22. Abd Rahman, M.N.; Zulkipli, N.H.; Kasim, M.S.; Jamli, M.R.; Budi, E. Impact of argon gas shielding flow rate on the hardness of weld joint. J. Adv. Manuf. Technol. (JAMT) 2022, 16, 1–8. [Google Scholar]
  23. Mendoza, H. Effects of a Binary Argon-Helium Shielding Gas Mixture on Ultra-Thin Features Produced by Laser-Powder Bed Fusion Additive Manufacturing. Master’s Thesis, The Ohio State University, Columbus, OH, USA, 2021. [Google Scholar]
  24. Guo, J.; Wang, F.; Zhou, L.; Zhao, Y.; Fu, J.; Chen, G.; Qin, Y. The Synergistic Enhancement Effect of H2 in the Shielding Gas on High Welding Efficiency and Corrosion Resistance in TIG Welding of Stainless Steel. Metall. Mater. Trans. B 2024, 56, 46–63. [Google Scholar] [CrossRef]
  25. Khrais, S.; Al Hmoud, H.; Al, A.A.; Darabseh, T. Impact of gas metal arc welding parameters on bead geometry and material distortion of AISI 316L. J. Manuf. Mater. Process. 2023, 7, 123. [Google Scholar] [CrossRef]
  26. Ghumman, K.Z.; Ali, S.; Khan, N.B.; Khan, M.I.; Ali, H.T.; Ashurov, M. Optimization of TIG welding parameters for enhanced mechanical properties in AISI 316L stainless steel welds. Int. J. Adv. Manuf. Technol. 2024, 136, 353–365. [Google Scholar] [CrossRef]
  27. Casanueva, R.; Brañas, C.; Diaz, F.J.; Azcondo, F.J.; Ferreño, D.; Setien, J. Characterization of an energy efficient pulsed current TIG welding process on AISI 316 and 304 stainless steels. Heliyon 2023, 9, e19819. [Google Scholar] [CrossRef]
  28. Tathgir, S.; Rathod, D.W.; Batish, A. Process enhancement using hydrogen-induced shielding: H2-induced A-TIG welding process. Mater. Manuf. Process. 2020, 35, 1084–1095. [Google Scholar] [CrossRef]
  29. Kardak, A.A.; Sinclair, G.B. Stress concentration factors for ASTM E8/E8M-16a standard round specimens for tension testing. J. Test. Eval. 2020, 48, 711–719. [Google Scholar] [CrossRef]
  30. Baghel, P.K. Effect of SMAW process parameters on similar and dissimilar metal welds: An overview. Heliyon 2022, 8, e12161. [Google Scholar] [CrossRef]
  31. Aegerter, J.; Kühn, H.J.; Frenz, H.; Weißmüller, C. EN ISO 6892-1: 2009 tensile testing: Initial experience from the practical implementation of the new standard. Mater. Test. 2011, 53, 595–603. [Google Scholar] [CrossRef]
  32. Mupoperi, T.; Pita, M. An investigation of the effect of welding current on the mechanical properties of mild steel joints when using arc welding. In Proceedings of the 2022 IEEE 13th International Conference on Mechanical and Intelligent Manufacturing Technologies (ICMIMT), Cape Town, South Africa, 25–27 May 2022; IEEE: Piscataway, NJ, USA, 2022. [Google Scholar]
  33. Chowdhury, S.; Nirsanametla, Y.; Muralidhar, M.; Bag, S.; Paul, C.; Bindra, K. Identification of modes of welding using parametric studies during ytterbium fiber laser welding. J. Manuf. Process. 2020, 57, 748–761. [Google Scholar] [CrossRef]
  34. Pavan, A.; Chandrasekar, N.; Arivazhagan, B.; Kumar, S.; Vasudevan, M. Study of arc characteristics using varying shielding gas and optimization of activated-tig welding technique for thick AISI 316L (N) plates. CIRP J. Manuf. Sci. Technol. 2021, 35, 675–690. [Google Scholar] [CrossRef]
  35. Ghumman, K.Z.; Ali, S.; Din, E.U.; Mubashar, A.; Khan, N.B.; Ahmed, S.W. Experimental investigation of effect of welding parameters on surface roughness, micro-hardness and tensile strength of AISI 316L stainless steel welded joints using 308L filler material by TIG welding. J. Mater. Res. Technol. 2022, 21, 220–236. [Google Scholar] [CrossRef]
  36. Lowke, J.J.; Tanaka, M.; Ushio, M. Mechanisms giving increased weld depth due to a flux. J. Phys. D Appl. Phys. 2005, 38, 3438. [Google Scholar] [CrossRef]
  37. Chuaiphan, W.; Srijaroenpramong, L. Heat input and shielding gas effects on the microstructure, mechanical properties and pitting corrosion of alternative low cost stainless steel grade 202. Results Mater. 2020, 7, 100111. [Google Scholar] [CrossRef]
  38. Gao, S.; Geng, S.; Jiang, P.; Mi, G.; Han, C.; Ren, L. Numerical analysis of the deformation behavior of 2205 duplex stainless steel TIG weld joint based on the microstructure and micro-mechanical properties. Mater. Sci. Eng. A 2021, 815, 141303. [Google Scholar] [CrossRef]
  39. Yu, W.X.; Liu, B.X.; Chen, C.X.; Liu, M.Y.; Zhang, X.; Fang, W.; Ji, P.G.; He, J.N.; Yin, F.X. Microstructure and mechanical properties of stainless steel clad plate welding joints by different welding processes. Sci. Technol. Weld. Join. 2020, 25, 571–580. [Google Scholar] [CrossRef]
  40. Katherasan, D.; Sathiya, P.; Raja, A. Shielding gas effects on flux cored arc welding of AISI 316L (N) austenitic stainless steel joints. Mater. Des. 2013, 45, 43–51. [Google Scholar] [CrossRef]
  41. Phakpeetinan, P.; Chianpairot, A.; Viyanit, E.; Hartung, F.; Lothongkum, G. Effects of nitrogen and hydrogen in argon shielding gas on bead profile, delta-ferrite and nitrogen contents of the pulsed GTAW welds of AISI 316L stainless steel. Mater. Test. 2016, 58, 489–494. [Google Scholar] [CrossRef]
  42. Chuaiphan, W.; Srijaroenpramong, L. Microstructure, mechanical properties and pitting corrosion of TIG weld joints alternative low-cost austenitic stainless steel grade 216. J. Adv. Join. Process. 2020, 2, 100027. [Google Scholar] [CrossRef]
  43. Nedjad, S.H.; Yildiz, M.; Saboori, A. Solidification behaviour of austenitic stainless steels during welding and directed energy deposition. Sci. Technol. Weld. Join. 2023, 28, 1–17. [Google Scholar] [CrossRef]
  44. Bansod, A.V.; Patil, A.P.; Moon, A.P.; Shukla, S. Microstructural and electrochemical evaluation of fusion welded low-nickel and 304 SS at different heat input. J. Mater. Eng. Perform. 2017, 26, 5847–5863. [Google Scholar] [CrossRef]
  45. Sathiya, P.; Jaleel, M.A. Measurement of the bead profile and microstructural characterization of a CO2 laser welded AISI 904 L super austenitic stainless steel. Opt. Laser Technol. 2010, 42, 960–968. [Google Scholar] [CrossRef]
  46. Xu, K. Silicon electro-optic micro-modulator fabricated in standard CMOS technology as components for all silicon monolithic integrated optoelectronic systems. J. Micromech. Microeng. 2021, 31, 054001. [Google Scholar] [CrossRef]
  47. Hu, Y.; Shi, Y.; Wang, K.; Huang, J. Effect of heat input on the microstructure and mechanical properties of local dry underwater welded duplex stainless steel. Materials 2023, 16, 2289. [Google Scholar] [CrossRef] [PubMed]
  48. Açar, I.; Gülenç, B. Effect of shielding gas combination on microstructure and mechanical properties of MIG welded stainless steel 316. Mater. Test. 2021, 63, 97–101. [Google Scholar] [CrossRef]
  49. Kotecki, D.; Siewert, T. WRC-1992 constitution diagram for stainless steel weld metals: A modification of the WRC-1988 diagram. Weld. J. 1992, 71, 171–178. [Google Scholar]
  50. Kshirsagar, R.; Jones, S.; Lawrence, J.; Tabor, J. Measurement of ferrite content of stainless-steel sheet welds using a new Ferrite Density Number scale. J. Mater. Process. Technol. 2019, 274, 116278. [Google Scholar] [CrossRef]
  51. Zainon, F.; Ahmad, K.R.; Daud, R. Review on the tribology and hardness of aluminum AA332: Matrix composites reinforced with Mg2Si. Adv. Mater. Res. 2016, 5, 55–66. [Google Scholar] [CrossRef]
  52. LLuglla, A.I.; Martínez-Gómez, J.; Bustamante, V.D. QA/QC Validation of the GMAW Welding Process, Used in the Construction of Body Bodies in the Ecuadorian Industry. In Innovation and Research: A Driving Force for Socio-Econo-Technological Development 1st 2021; Springer International Publishing: Cham, Switzerland, 2021; pp. 416–427. [Google Scholar]
Figure 1. AISI 316L Specimen. (a) Schematic specimen; (b) specimen side view dimensions.
Jcs 09 00199 g001
Figure 2. (a) The UTS specimen standard dimensions. (b) The Charpy impact specimen standard dimensions.
Jcs 09 00199 g002
Figure 3. Impact of H2 content in Ar-He shielding gas on surface weld joint at 120 A arc current.
Jcs 09 00199 g003
Figure 4. Impact of H2 content in Ar-He shielding gas on surface weld joint at 150 A arc current.
Jcs 09 00199 g004
Figure 5. Impact of H2 content in Ar-He shielding gas on surface weld joint at 180 A arc current.
Jcs 09 00199 g005
Figure 6. Effect of H2 and He gases on penetration depth and weld area size at 120 A welding arc current.
Jcs 09 00199 g006
Figure 7. Effect of H2 and He gases on penetration depth and weld area size at 150 A welding arc current.
Jcs 09 00199 g007
Figure 8. Effect of H2 and He gases on penetration depth and weld area size at 180 A welding arc current.
Jcs 09 00199 g008
Figure 9. Weld zone microstructures with different shielding gases at an arc current of 120 A.
Jcs 09 00199 g009
Figure 10. Weld zone microstructures with different shielding gases at an arc current of 150 A.
Jcs 09 00199 g010
Figure 11. Weld zone microstructures with different shielding gases at an arc current of 180 A.
Jcs 09 00199 g011
Figure 12. UTS vs. shielding gas composition at arc currents (a) 120 A, (b) 150 A, and (c) 180 A.
Jcs 09 00199 g012
Figure 13. YS vs. shielding gas composition at arc currents (a) 120 A, (b) 150 A, and (c) 180 A.
Jcs 09 00199 g013
Figure 14. HRB vs. shielding gas composition at arc currents (a) 120 A, (b) 150 A, and (c) 180 A.
Jcs 09 00199 g014
Figure 15. Impact toughness vs. shielding gas composition at arc currents (a) 120 A, (b) 150 A, and (c) 180 A.
Jcs 09 00199 g015
Figure 16. The optimal welding factors of toughness, hardness, UTS, and YS.
Jcs 09 00199 g016
Figure 17. S/N Ratio for the UTS Larger-the-Better approach.
Jcs 09 00199 g017
Figure 18. S/N Ratio for the YS Larger-the-Better approach.
Jcs 09 00199 g018
Figure 19. S/N ratio for the HRB Larger-the-Better approach.
Jcs 09 00199 g019
Figure 20. S/N ratio for the Toughness Larger-the-Better approach.
Jcs 09 00199 g020
Table 1. Chemical composition of AISI 316L stainless steel (weight percent).
ElementCMnSiCrNiMoPSNFe
Wt.%0.032.01.016.5–18.58–132–2.250.040.0010.11Balance
Table 2. Chemical composition of ER316L filler material (weight percent).
ElementCMnSiCrNiMoPSNFe
Wt.%0.0320.7516–1810–142–30.0450.030.1Balance
Table 3. Welding parameters and heat input for various shielding gas compositions and arc currents.
Sample No.Arc Welding Ampere (A)H2 (%)He (%)Ar (%)Heat Input (J/mm)
11201.51088.576.19
21201.52078.576.19
31201.53068.576.19
41203108776.19
51203207776.19
61203306776.19
71204.51085.576.19
81204.52075.576.19
91204.53065.576.19
101501.51088.595.24
111501.52078.595.24
121501.53068.595.24
131503108795.24
141503207795.24
151503306795.24
161504.51085.595.24
171504.52075.595.24
181504.53065.595.24
191801.51088.5114.29
201801.52078.5114.29
211801.53068.5114.29
2218031087114.29
2318032077114.29
2418033067114.29
251804.51085.5114.29
261804.52075.5114.29
271804.53065.5114.29
Table 4. Chemical composition and phase stability analysis of weld samples based on Creq./Nieq. ratios.
SampleC (%)N (%)Si (%)Cr (%)Mn (%)Ni (%)Mo (%)Fe (%)Creq.Nieq.Creq./Nieq.FN
10.030.040.4181.8112.166.6320.213.581.4929.28
20.030.040.418.051.811.052.1266.5520.2213.621.4829.23
30.030.040.418.11.8111.12.1466.4820.2513.651.4829.22
40.030.050.4118.21.8211.152.1566.4420.313.71.4829.21
50.030.050.4118.251.8211.22.1766.3620.3313.731.4829.2
60.030.050.4118.31.8311.252.1866.2920.3513.771.4829.15
70.040.050.4218.41.8411.32.266.2420.413.821.4829.14
80.040.050.4218.451.8411.352.2266.1620.4313.851.4829.13
90.040.060.4318.51.8511.42.2366.0920.4513.891.4729.08
100.030.040.4181.811.052.1266.6320.2213.631.4829.2
110.030.040.418.051.8111.12.1466.5520.2513.671.4829.17
120.030.040.418.11.8111.152.1566.4820.2813.721.4829.12
130.030.050.4118.21.8211.22.1766.4420.3313.751.4829.15
140.030.050.4118.251.8311.252.1866.3620.3513.781.4829.13
150.030.050.4118.31.8311.32.266.2920.3813.821.4829.09
160.040.050.4218.41.8411.352.2266.2420.4313.871.4729.08
170.040.050.4218.451.8411.42.2366.1620.4513.911.4729.03
180.040.060.4318.51.8511.452.2566.0920.513.941.4729.07
190.040.040.4118.11.8211.12.1566.3820.2913.681.4829.24
200.040.040.4118.151.8311.152.1766.320.3213.721.4829.2
210.040.040.4218.21.8311.22.1866.2420.3513.761.4829.17
220.050.050.4218.31.8411.252.266.1420.413.81.4829.19
230.050.050.4218.351.8411.32.2266.0820.4213.841.4829.13
240.050.050.4218.41.8511.352.236620.4513.881.4729.1
250.050.050.4318.51.8511.42.2565.9520.513.911.4729.14
260.050.050.4318.551.8611.452.2765.8720.5313.961.4729.08
270.050.060.4318.61.8611.52.2865.820.5513.991.4729.05
Table 5. Effect of shielding gas composition and arc current on UTS and YS of welded joints.
ParameterConditionUTS (MPa)YS (MPa)
H2 Content Increase and
He Content Increase
1.5% to 4.5%
10% to 30%
620.1 → 740.92401 → 477
Arc Current—120 A3% H2, 30% He673.68429
Arc Current—150 A3% H2, 30% He722.6451
Arc Current—180 A3% H2, 30% He645.16417
Optimal ConditionsSample No. 18 (150 A, 4.5% H2, 30% He)~740477
Table 6. Effect of arc welding parameters on hardness.
ParameterConditionHardness (HRB)
H2 Content Increase and He Content Increase1.5% to 4.5%, 10% to 30%86.8 → 90.0
Arc Current—120 A3% H2, 30% He90.8
Arc Current—150 A3% H2, 30% He93.3
Arc Current—180 A3% H2, 30% He87.6
Optimal ConditionsSample No. 18 (150 A, 4.5% H2, 30% He)90
Table 7. Effect of arc welding parameters on Charpy impact toughness.
ParameterConditionCharpy Impact (J)
H2 Content Increase and He Content Increase1.5% to 4.5%, 10% to 30%21.56 → 35.28
Arc Current—120 A3% H2, 30% He29.4
Arc Current—150 A3% H2, 30% He34.3
Arc Current—180 A3% H2, 30% He30.83
Optimal ConditionsSample No. 18 (150 A, 4.5% H2, 30% He)29.4
Table 8. Analysis of variance of UTS.
SourceDFSeq SSContributionAdj SSAdj MSF-Valuep-Value
Arc Welding Ampere (A)217,38457.77%17,3848692.0996.020.000
H2 (%)2667722.19%66773338.2836.880.000
He (%)2422214.03%42222111.0823.320.000
Error2018116.02%181190.53
Total2630,093100.00%
Table 9. Analysis of variance of YS.
SourceDFSeq SSContributionAdj SSAdj MSF-Valuep-Value
Arc Welding Ampere (A)22422.951.41%2422.91211.4465.640.000
H2 (%)21406.029.83%1406.0703.0038.090.000
He (%)2514.710.92%514.7257.3313.940.000
Error20369.17.83%369.118.46
Total264712.7100.00%
Table 10. Analysis of variance of Hardness.
SourceDFSeq SSContributionAdj SSAdj MSF-Valuep-Value
Arc Welding Ampere (A)294.8427.57%94.8447.421178.770.000
H2 (%)2167.8048.79%167.8083.8978139.370.000
He (%)269.2720.14%69.2734.634457.530.000
Error2012.043.50%12.040.6020
Total26343.95100.00%
Table 11. Analysis of variance of Impact Toughness.
SourceDFSeq SSContributionAdj SSAdj MSF-Valuep-Value
Arc Welding Ampere (A)2122.7337.58%122.7361.36542.160.000
H2 (%)2145.6444.59%145.6472.81950.030.000
He (%)229.158.92%29.1514.57410.010.001
Error2029.118.91%29.111.455
Total26326.62100.00%
Disclaimer/Publisher’s Note: The statements, opinions and data contained in all publications are solely those of the individual author(s) and contributor(s) and not of MDPI and/or the editor(s). MDPI and/or the editor(s) disclaim responsibility for any injury to people or property resulting from any ideas, methods, instructions or products referred to in the content.

