Article

Effect of Printing Parameters on Mechanical Properties and Warpage of 3D-Printed PEEK/CF-PEEK Composites Using Multi-Objective Optimization Technique

by
Sorekunte Huchappa Adarsh
1 and
Mahadevappa Nagamadhu
2,*
1
Department of Mechanical Engineering, Siddaganga Institute of Technology, Tumkur 572103, Karnataka, India
2
Department of Mechanical Engineering, BMS Institute of Technology and Management, Bangalore 560064, Karnataka, India
*
Author to whom correspondence should be addressed.
J. Compos. Sci. 2025, 9(5), 208; https://doi.org/10.3390/jcs9050208
Submission received: 4 March 2025 / Revised: 19 April 2025 / Accepted: 20 April 2025 / Published: 25 April 2025
(This article belongs to the Special Issue Innovations of Composite Materials in Prosthetic Dentistry)

Abstract

:
Polyether ether ketone (PEEK) is a high-performance thermoplastic widely used in aerospace, automotive, and medical applications due to its exceptional strength, heat resistance, and chemical stability. However, warpage and mechanical property variations remain significant challenges in 3D printing PEEK parts. This study investigates the effect of key printing parameters, including nozzle temperature, layer thickness, platform temperature, and infill rate, on the mechanical properties and warpage of 3D-printed PEEK components. By systematically analyzing tensile and compressive loading conditions, this research aims to optimize printing settings to improve dimensional accuracy and structural integrity. The experimental results indicate that mechanical properties, such as tensile and compressive stress at break, vary significantly with printing conditions. The highest tensile strength and compressive strength achieved were 71.4 MPa and 167 MPa, respectively. Meanwhile, the lowest tensile (45.36 MPa) and compressive strengths (72.5 MPa) were also recorded. Higher nozzle and platform temperatures, coupled with increased infill rates, enhance layer adhesion, leading to improved tensile and compressive strength. However, a nozzle temperature of 400 °C, platform temperature of 130 °C, and 60% infill rate lead to optimal bonding between layers and thus a reduction in warpage. Considering warpage in all four corners and mechanical properties, a 400 °C nozzle temperature, 0.16 mm layer thickness, and 130 °C platform temperature, coupled with a 60% infill rate, provide optimal printing conditions. The 10% carbon fiber-reinforced PEEK composites exhibit an improved tensile strength that is 1.68 times higher compared to pure PEEK. To emphasize the importance of thermal and structural settings, the findings highlight the crucial role of printing parameters in minimizing warpage and enhancing mechanical properties in 3D-printed PEEK parts, which were analyzed by the multi-objective optimization method. Scanning electron microscopy analyses were carried out to analyze fracture morphology and printing layer orientation.

1. Introduction

Over the past decade, 3D printing has become a vital tool in manufacturing due to its efficiency, affordability, and rapid prototyping capabilities, allowing designers to refine models without disrupting main production lines [1]. Among various techniques, Fused Deposition Modeling (FDM) is the most widely used due to its cost effectiveness and ease of operation. It employs thermoplastic filaments like PLA, ABS, and PEEK, which are melted and extruded layer by layer to form solid structures [2,3,4,5,6]. However, the quality of printed components depends on key parameters such as printing temperature, layer thickness, and infill percentage, which influence mechanical strength and durability [7,8,9].
Additive manufacturing, including FDM, enables automated and precise fabrication of complex geometries directly from CAD models. High-performance polymers like PEEK, known for excellent mechanical properties and thermal stability, are increasingly used in advanced applications requiring superior strength and heat resistance [10,11,12,13]. Innovations in composite materials, such as resin-based and hybrid CAD/CAM options, have improved dental prostheses’ functionality, durability, and cost efficiency [13,14]. Studies have shown that optimizing conditions, such as a nozzle temperature of 440 °C and a controlled printing speed of 20 mm/s, enhances the density and integrity of PEEK components. With the rising demand for high-quality 3D-printed parts, continuous material and process improvements are necessary. PEEK is also replacing metals in some industries due to its exceptional thermal and mechanical properties. It is biocompatible, with a Young’s modulus of approximately 3.6 GPa and a tensile strength between 90 and 100 MPa, making it comparable to compact bone [15,16]. This helps address stiffness mismatches and stress shielding in medical implants while allowing easy bone growth evaluation due to its radiolucency [17,18].
A major challenge in FDM printing is warping, caused by uneven cooling and shrinkage, leading to dimensional inaccuracies and print failures [19,20]. Studies have investigated factors contributing to warping, including material properties, printing parameters, and environmental conditions [21]. Warping varies across materials; ABS is highly susceptible due to significant shrinkage, whereas PLA exhibits minimal warping due to its lower thermal expansion [22]. Moisture absorption also impacts print quality, affecting extrusion and increasing warping [23]. Researchers have explored composite materials and modified filament compositions to improve dimensional stability [24].
Printing parameters such as bed temperature, nozzle temperature, and print speed significantly affect warping. Higher bed temperatures improve adhesion, reducing thermal stress, while optimized nozzle temperatures enhance layer bonding without excessive extrusion or degradation [25,26]. Print speed also plays a role, as rapid cooling at high speeds increases thermal gradients and residual stress, whereas slower speeds allow for more uniform cooling [27]. Environmental factors like ambient temperature and air circulation influence warping, and enclosed print chambers with active heating help maintain temperature stability [28,29]. Post-processing methods like annealing can relieve residual stresses and enhance mechanical properties [30]. Software advancements, such as slicing algorithms and adaptive slicing techniques, further help mitigate warping by optimizing toolpaths and layer adhesion [31,32]. Additionally, raft and brim structures enhance print bed adhesion, reducing warping [33]. Despite these improvements, warping remains a challenge, necessitating ongoing research into novel solutions and materials, including self-healing smart materials and hybrid manufacturing approaches that combine FDM with laser sintering and ultrasonic welding [34,35]. Future directions should focus on real-time monitoring using AI and machine learning to predict and compensate for warping dynamically, ensuring consistent print quality [36].
The impact of printing parameters on warpage in 3D-printed PEEK parts is critical for improving the performance of this high-performance thermoplastic. PEEK’s high shrinkage rates during cooling can lead to dimensional inaccuracies and compromised mechanical properties. Understanding the interplay between extrusion temperature, print speed, layer height, and build plate temperature is essential to optimizing print quality. While previous research has explored individual parameters, a gap remains in understanding their combined effects on warpage in industrial applications. Additionally, the absence of standardized methodologies for measuring warpage limits the comparability of findings across studies. This research systematically investigates the combined effects of multiple printing parameters on warpage in 3D-printed PEEK parts, aiming to improve dimensional accuracy through optimized conditions and standardized measurement approaches. This study uniquely examines the combined effects of multiple printing parameters on warpage in PEEK components, addressing the lack of standardized methodologies for measurement and improving reproducibility. By offering industry-relevant recommendations, it enhances the understanding of high-performance polymer behavior in additive manufacturing, benefiting aerospace, automotive, and medical applications.

2. Materials and Methods

2.1. Materials

For the present study, KetaSpire® PEEK was procured from Solvay, Alorton, IL, USA. PEEK filament was used to fabricate the model; its properties include a natural color, a diameter of 1.75 mm, and a tolerance of ±0.05 mm. Step-growth polymerization was used to create PEEK polymers.
The ADVANCE HYREL 3D desktop FDM 3D printer (Hyrel 3D, Norcross, GA, USA) was utilized in this investigation. Its technical specifications are shown in Table 1. Fused Deposition Modeling (FDM) is a widely used 3D printing technology that builds parts by layering melted material. FDM printers use thermoplastic materials, which can be melted and re-solidified. These materials come in filament form, spooled and loaded into the printer. Commonly used filaments include PLA, ABS, PETG, and high-performance plastics such as polyether ether ketone (PEEK).

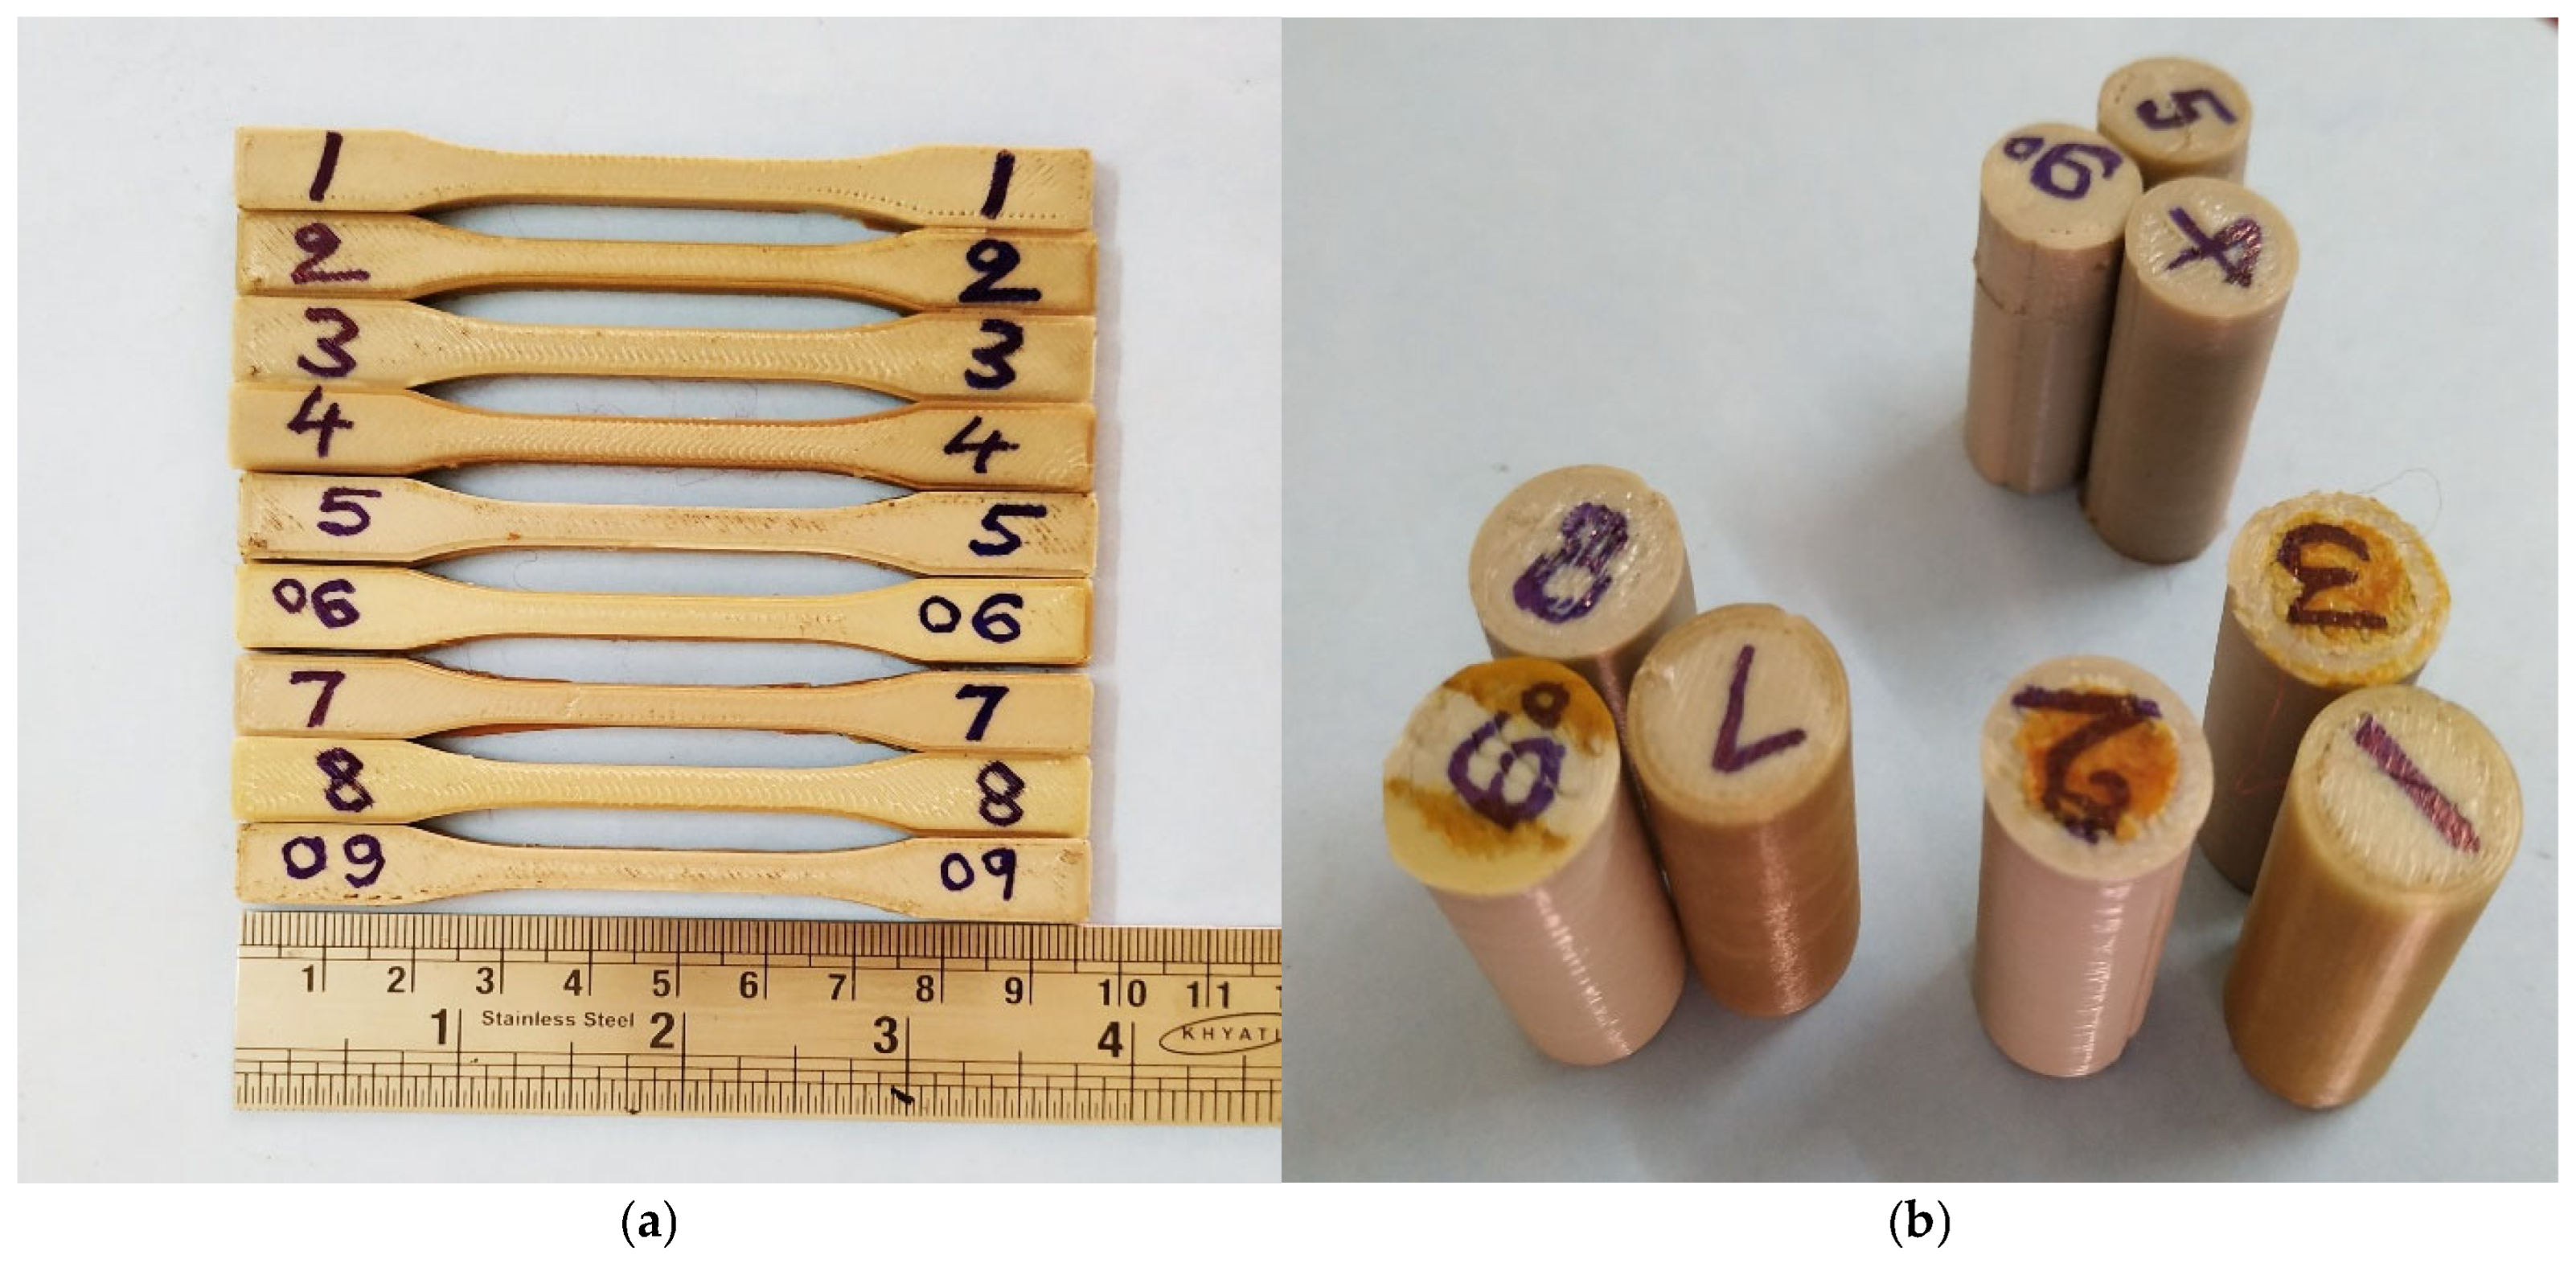
2.2. Processing of Samples

Figure 1 illustrates the methodology adopted in this study. The approach follows a systematic process for 3D printing, tensile, compressive, and warpage measurement. The process begins with the creation of a CAD model, which serves as the digital blueprint for the printed object. Next, key process parameters are defined, including layer height, infill density, bed temperature, and nozzle temperature, all of which significantly influence the quality and structural integrity of the final print. Once these parameters are set, the model undergoes slicing, where it is converted into a machine-readable format for the 3D printer. The printing process is then executed using the optimized settings. Finally, the printed object is evaluated through warpage measurement to analyze any deformations caused by thermal stresses and material shrinkage. This structured methodology ensures an efficient and optimized workflow, leading to high-quality 3D-printed components with minimal warpage.
A 3D cuboid model in STL format was created with dimensions of 100 mm in length, 30 mm in width, and 5 mm in height and was used for our warpage analysis. The STL (stereolithography) file format is a widely used format in 3D systems such as CAD (Computer-Aided Design) software. It is commonly utilized in rapid prototyping and Computer-Aided Manufacturing (CAM) and is supported by many other software programs. Next, the digital model was processed using slicing software, in our case Slicer, which converts it into thin-layer printing instructions for an open-source FDM 3D printer. This process generates a G-code (G programming language) file, which contains all the commands and instructions required by the 3D printer. The G-code file directs the extrusion head of the FDM 3D printer, specifying its precise motion control paths. The FDM 3D printer builds the physical object by depositing material in successive thin horizontal cross-sections, following the G-code instructions. The raw PEEK material is extruded through a circular nozzle, which moves horizontally in a piecewise linear path for each layer. After extruding the material along each line segment, the next layer is deposited once the previous layer has been completed. Either the printing platform or the circular nozzle moves vertically to continue the process. This layer-by-layer approach allows for the fabrication of complex 3D geometries, making it an efficient method for producing intricate 3D-printed components. FDM 3D fabrication is an additive manufacturing process where material is systematically deposited layer by layer to create a 3D object. The process starts with a digital CAD model, which is converted into an STL file and then processed using slicing software to generate layer-by-layer printing instructions. A thermoplastic filament like PEEK is heated in the extruder to its melting point (400–420 °C) and deposited onto a carbon fiber bed, which ensures even heat distribution. As each layer is deposited and solidified, it bonds with the previous layer, gradually forming the final 3D object.
Table 1 presents the technical parameters of the composite 3D printer. In this study, nine FDM 3D-printed specimens were fabricated and analyzed. Table 2 presents the constant parameters used in this work. Each specimen was printed with a flat orientation and a raster angle of +45°/−45° to the X-axis. This alternating raster pattern was selected over a unidirectional orientation, as it is the standard printing strategy for most FDM 3D-printed objects. Consequently, the manufacturing process of the FDM 3D-printed parts is directly linked to the results of this study.
In FDM 3D printing, nozzle temperature refers to the controlled heat applied to the nozzle to melt the thermoplastic filament, enabling precise layer-by-layer deposition. Layer height is the thickness of each deposited layer, which affects the print resolution, surface finish, and overall print time. Bed temperature is the heat maintained on the build platform to ensure proper adhesion of the first layer, reduce warping, and improve print quality. Infill percentage determines the density of the internal structure, with higher percentages resulting in stronger but heavier prints. Printing speed, measured in mm/s, refers to how quickly the 3D printer extrudes material, directly impacting print quality and efficiency. Lastly, chamber temperature is the controlled environment within the build chamber, crucial in FDM and SLS 3D printing, as it influences material behavior and print quality. In the experimental trial runs, different values of nozzle temperature, layer thickness, platform temperature, and infill rate were considered, as shown in Table 3. These parameters were found to have the most significant impact on the construction of parts in FDM 3D printing technology. The FDM 3D printing process parameters used in this study are presented in Table 4, which includes the independent variables (nozzle temperature, layer thickness, platform temperature, and infill rate).
Initially, the samples were prepared to assess the influence of various printing parameters (as listed in Table 3 and Table 4) on tensile and compression properties. A total of five identical samples were fabricated and tested under the relevant standards in alignment with the printing direction. Tensile tests were conducted on the 3D-printed PEEK parts at room temperature, following ISO 527-2 standards, as shown in Figure 2a. The tests were performed using a Zwick Roell series Z 020 Universal Testing Machine (UTM) (ZwickRoell Corporation, Yokohama, Japan) equipped with a 20 kN load cell. Tensile strength and elastic modulus were measured at a strain deformation rate of 5 mm/min. For compression tests, the ASTM D695 standard was applied, as shown in Figure 2b. The compression test was conducted using the Zwick Roell series UTM machine, with a constant displacement rate of 1.50 mm/min. The warpage measurement is shown in Figure 3.

3. Results and Discussion

The experiment utilized ImageJ software to measure warping deformation in FDM 3D-printed parts. Warpage occurs due to thermal contraction, impacting print accuracy and mechanical performance. ImageJ, an open-source tool, enables precise image processing, analysis, and measurement of warping effects. Key features include area selection, distance and angle measurements, and 3D visualization capabilities. Proper calibration ensures accurate scaling, making ImageJ a valuable resource for scientific imaging and additive manufacturing research.

3.1. Tensile Properties

The results of the tensile stress at break and strain at break for the nine different samples are presented in Table 5, showing both the averages and variability across individual measurements. The analysis of these parameters is critical for understanding the material’s mechanical properties, particularly its ability to withstand stress before failure and its ductility (strain at break). The variability in both tensile stress and strain indicates the consistency and reliability of the material under different testing conditions. The tensile stress at break measures the maximum stress a material can withstand before breaking. The average tensile stress at break for the samples varied from 45.36 MPa (Sample 1) to 71.4 MPa (Sample 8). Sample 1 exhibited the lowest average tensile stress, while Sample 8 showed the highest. Notably, the tensile stress at break did not vary excessively between the samples, with the standard deviations ranging from 1.202 MPa (Sample 5) to 1.701 MPa (Sample 1), indicating relatively stable performance across all samples. The minimum and maximum values for tensile stress varied across the samples, with Sample 1 showing the narrowest range between the minimum (43 MPa) and maximum (47.2 MPa), suggesting consistent performance. Meanwhile, Sample 9 had a wider range, from 49 MPa to 52 MPa, although the standard deviation of 1.294 MPa indicated some level of consistency in performance across the sample. The strain at break refers to the material’s ability to undergo deformation before breaking, providing insights into its ductility. Sample 9 had the highest average strain at break (27.5%), suggesting superior ductility compared to the other samples. In contrast, Samples 2 and 3 exhibited the lowest average strain at break, at 8.26% and 7.4%, respectively, highlighting their relatively brittle nature. The variability in strain at break was also significant across the samples, with Sample 9 having the highest standard deviation of 5.590%, indicating considerable variability in strain behavior. Conversely, Sample 2 had the lowest standard deviation of 1.545%, suggesting a more uniform strain behavior under tensile stress. The maximum tensile strength observed was 71.4 MPa when the nozzle temperature was set to 420 °C, with a layer height of 0.18 mm, a bed temperature of 130 °C, and an infill density of 100%. Under these conditions, the material demonstrates a high level of mechanical integrity. When 10% carbon fiber-reinforced PEEK (polyether ether ketone) was printed under identical conditions, the mechanical properties were significantly enhanced. This composite material exhibited a maximum tensile strength of 120.1 MPa, representing a notable increase in strength over the pure PEEK. Additionally, the strain at break—an indicator of the material’s ductility—was recorded at 8.85%, implying that the carbon fiber reinforcement improves both strength and flexibility compared to the unreinforced PEEK. This enhanced performance is a direct result of the carbon fibers, which reinforce the polymer matrix, leading to improved load-bearing capacity and better resistance to mechanical failure under stress.
From the data, it can be observed that while tensile stress at break remained relatively consistent across the samples, strain at break exhibited a greater range of variability. This disparity can be attributed to the different material compositions and testing conditions, which might have influenced the samples’ ductility to a greater extent than their tensile strength. Sample 9 stands out as a particularly interesting case, with both the highest tensile stress at break and the largest variation in strain at break. This suggests that while the material could withstand significant tensile stress before breaking, it demonstrated a wide range of ductility across individual tests. This variability may be a result of factors such as microscopic material flaws, inconsistencies in manufacturing, or differences in testing conditions. On the other hand, Sample 2, despite having a relatively high tensile stress at break (63.2 MPa), displayed a low strain at break (8.26%) and low variability (1.545%), suggesting it is a more brittle material compared to other samples. This could indicate a more rigid structure with less ability to deform plastically before failure.

3.2. Compression Properties
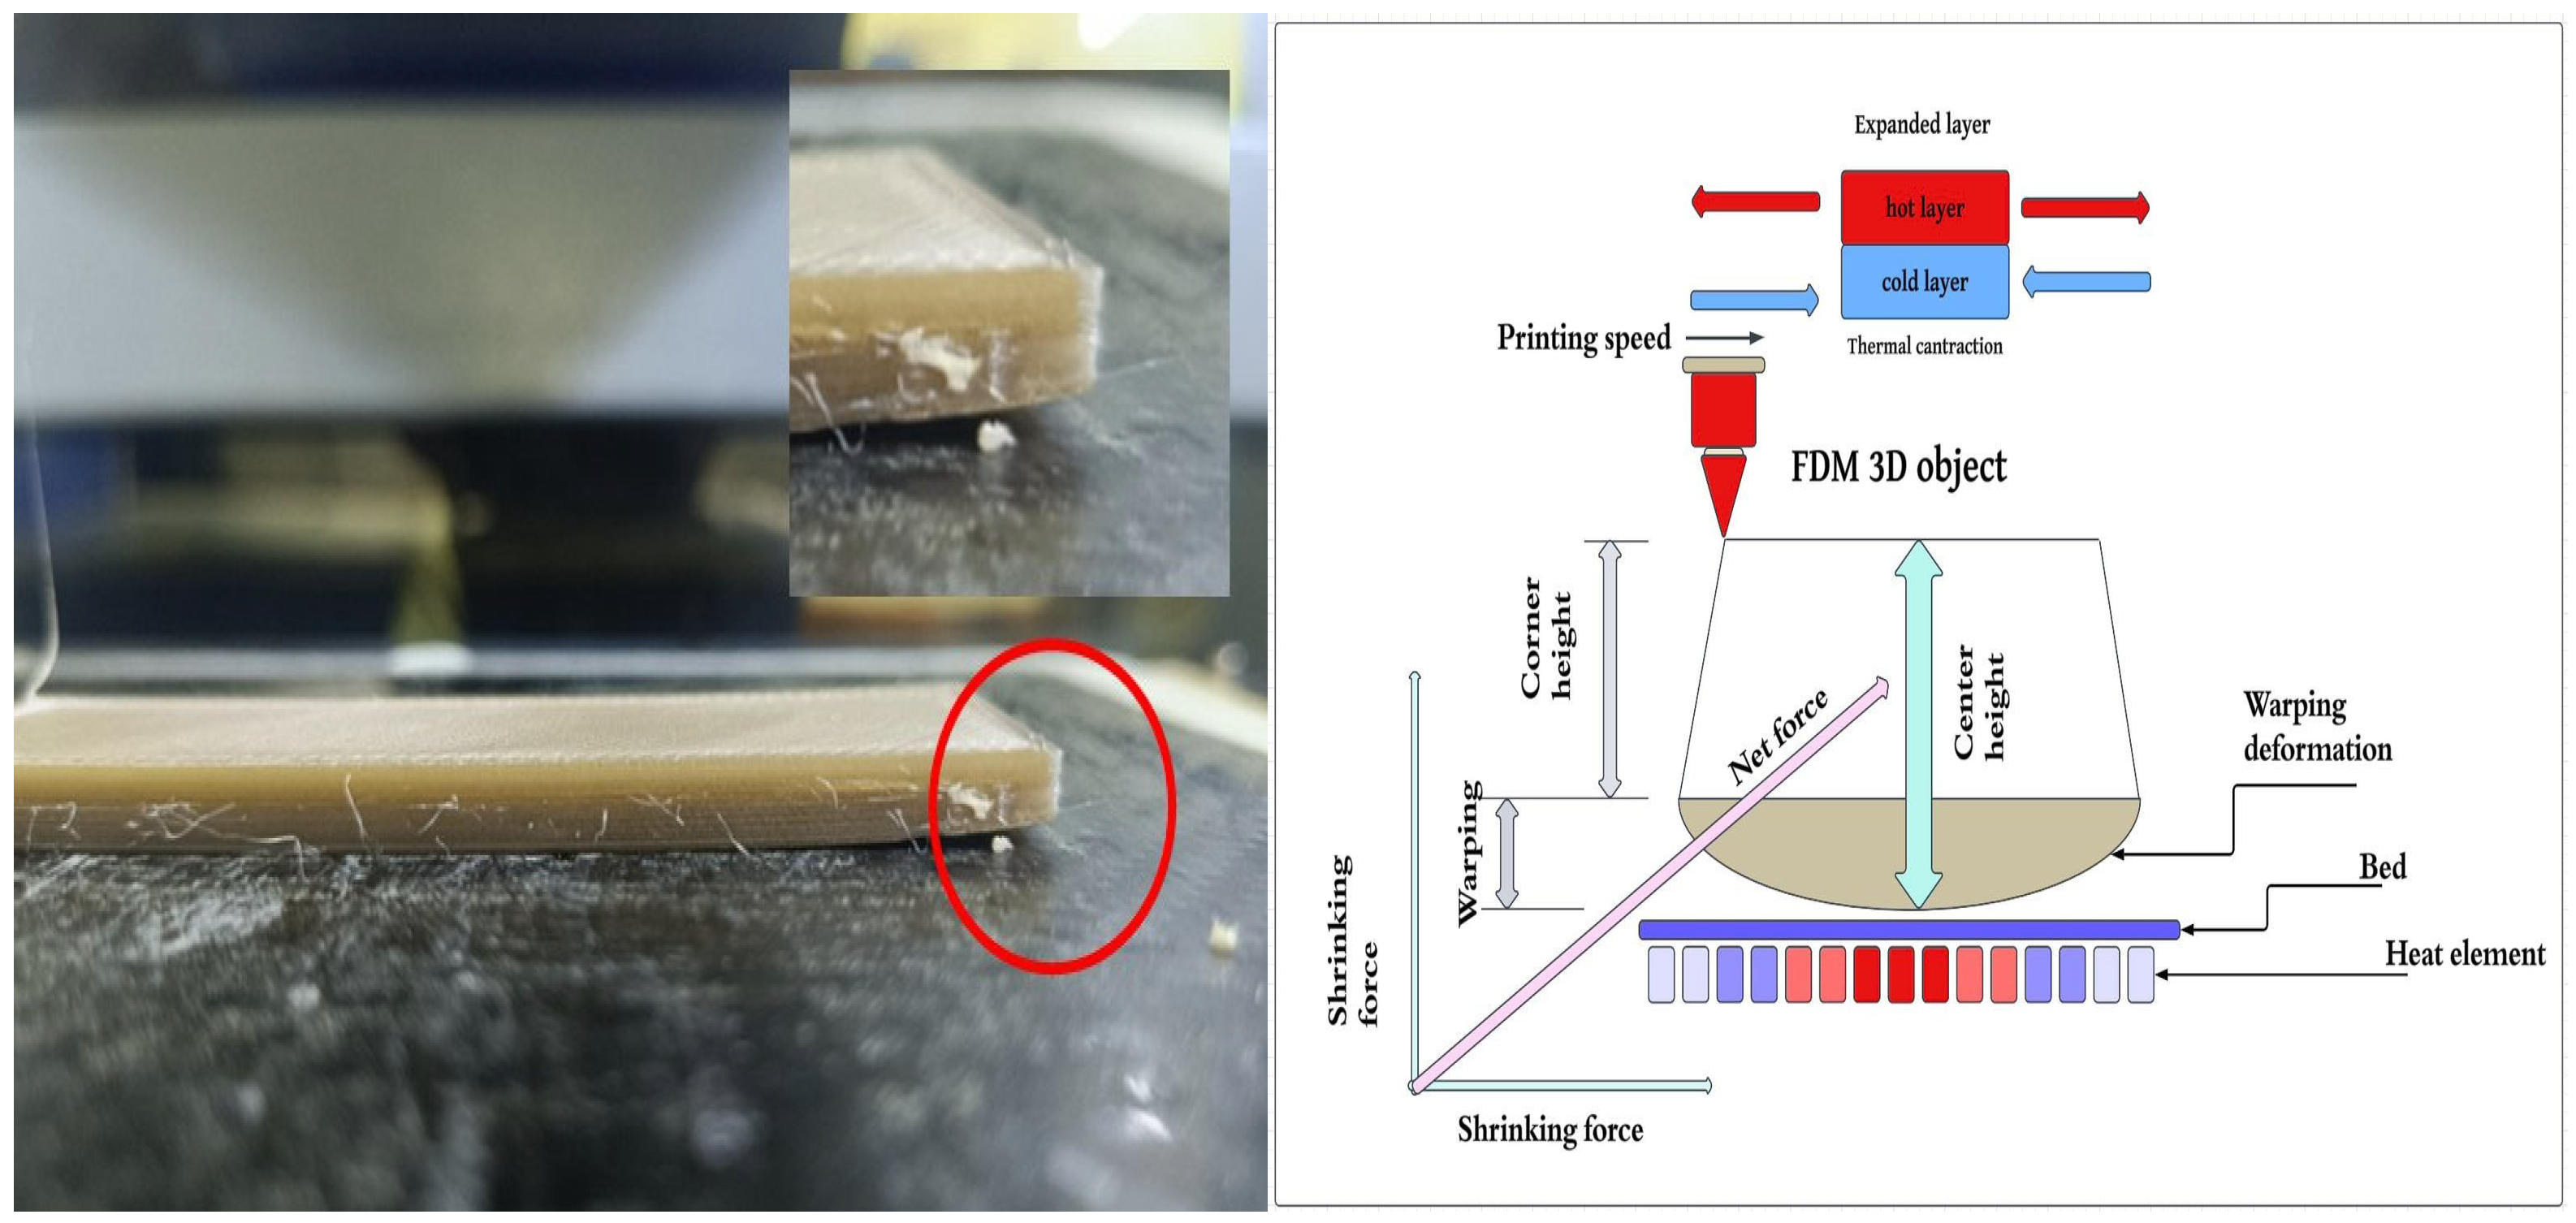
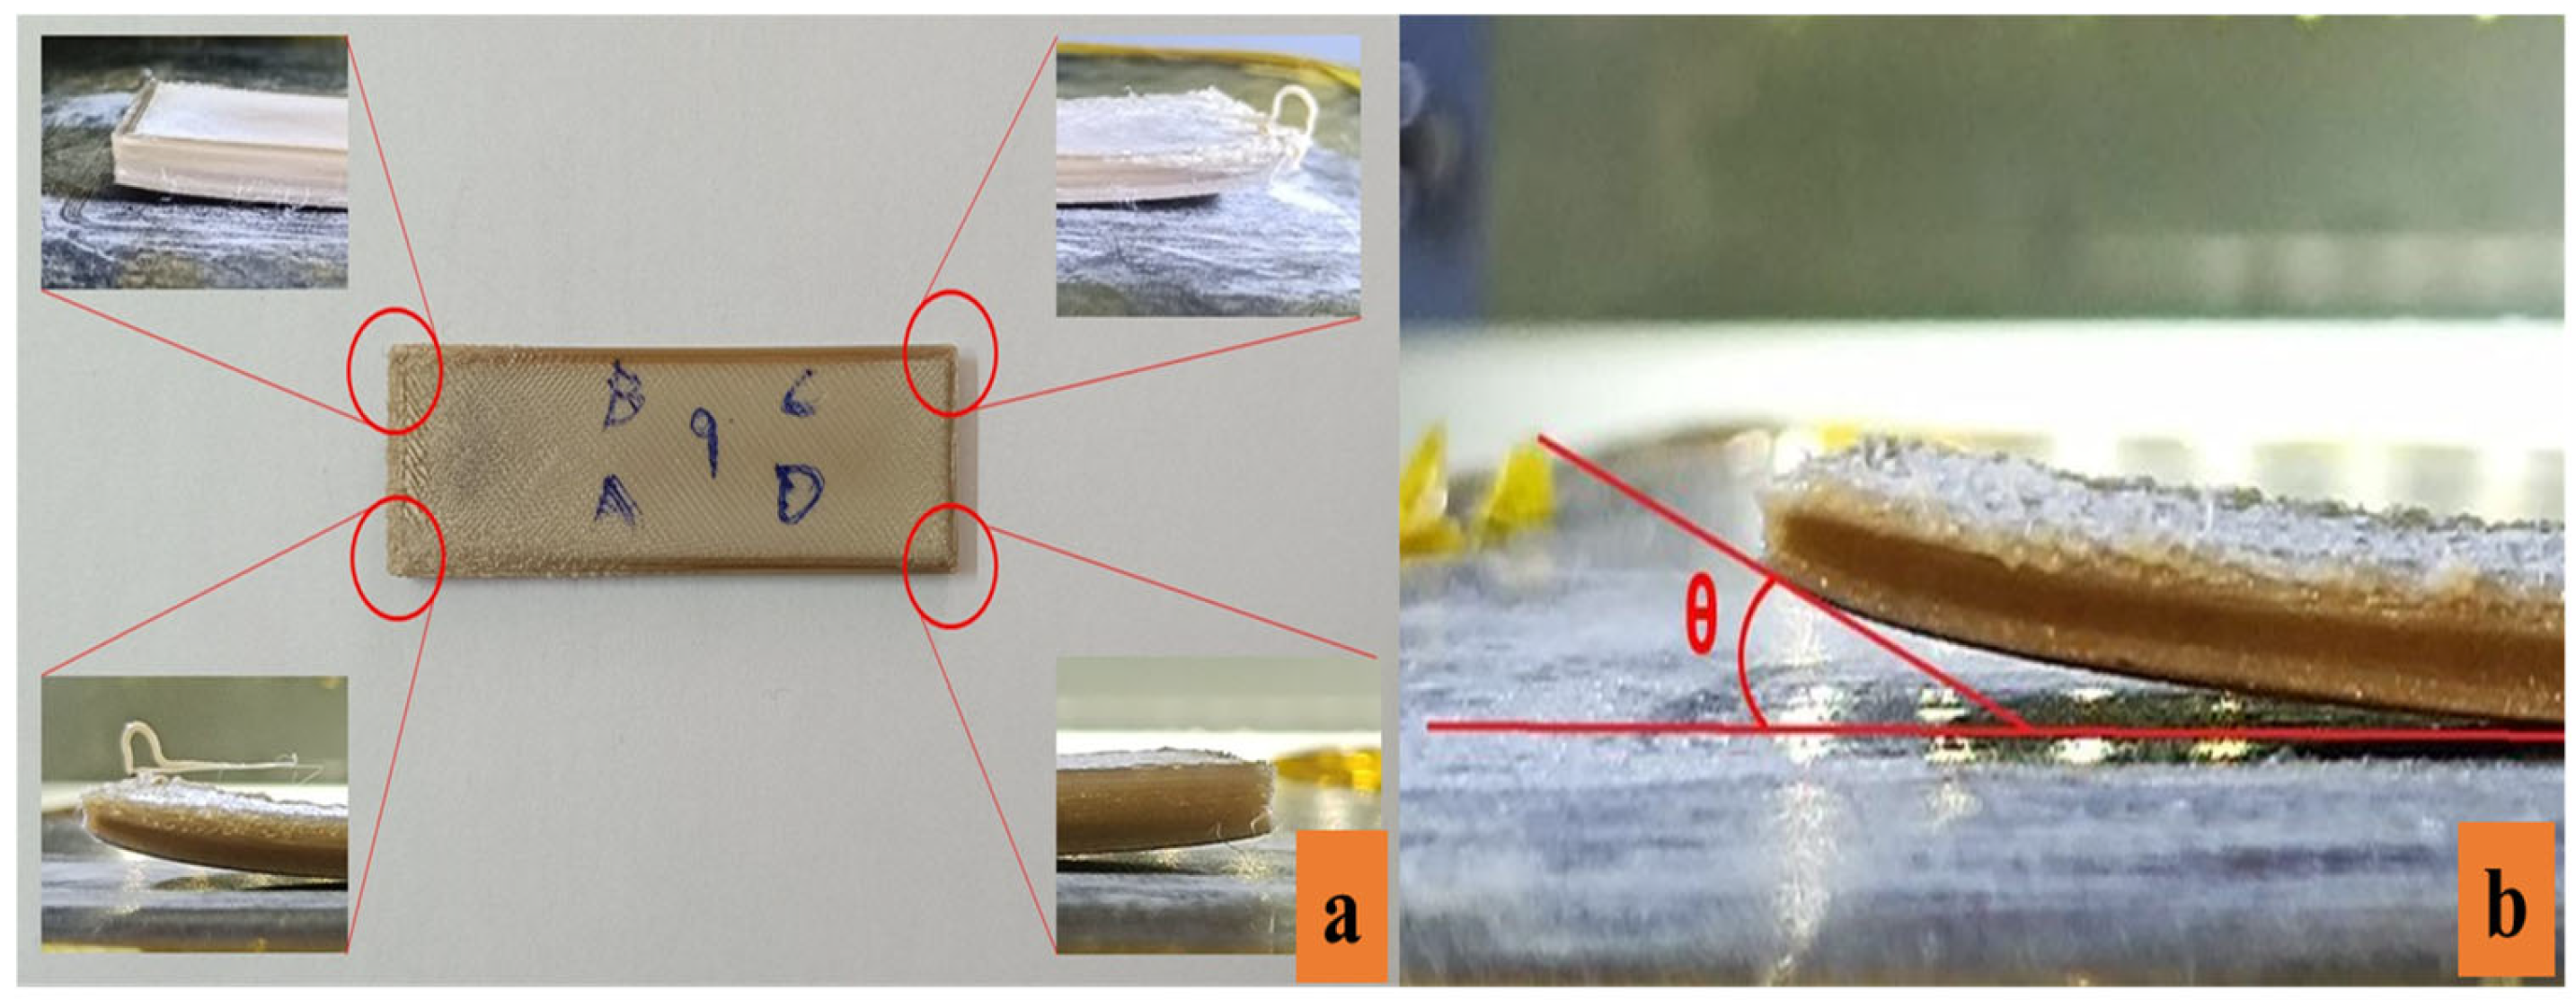
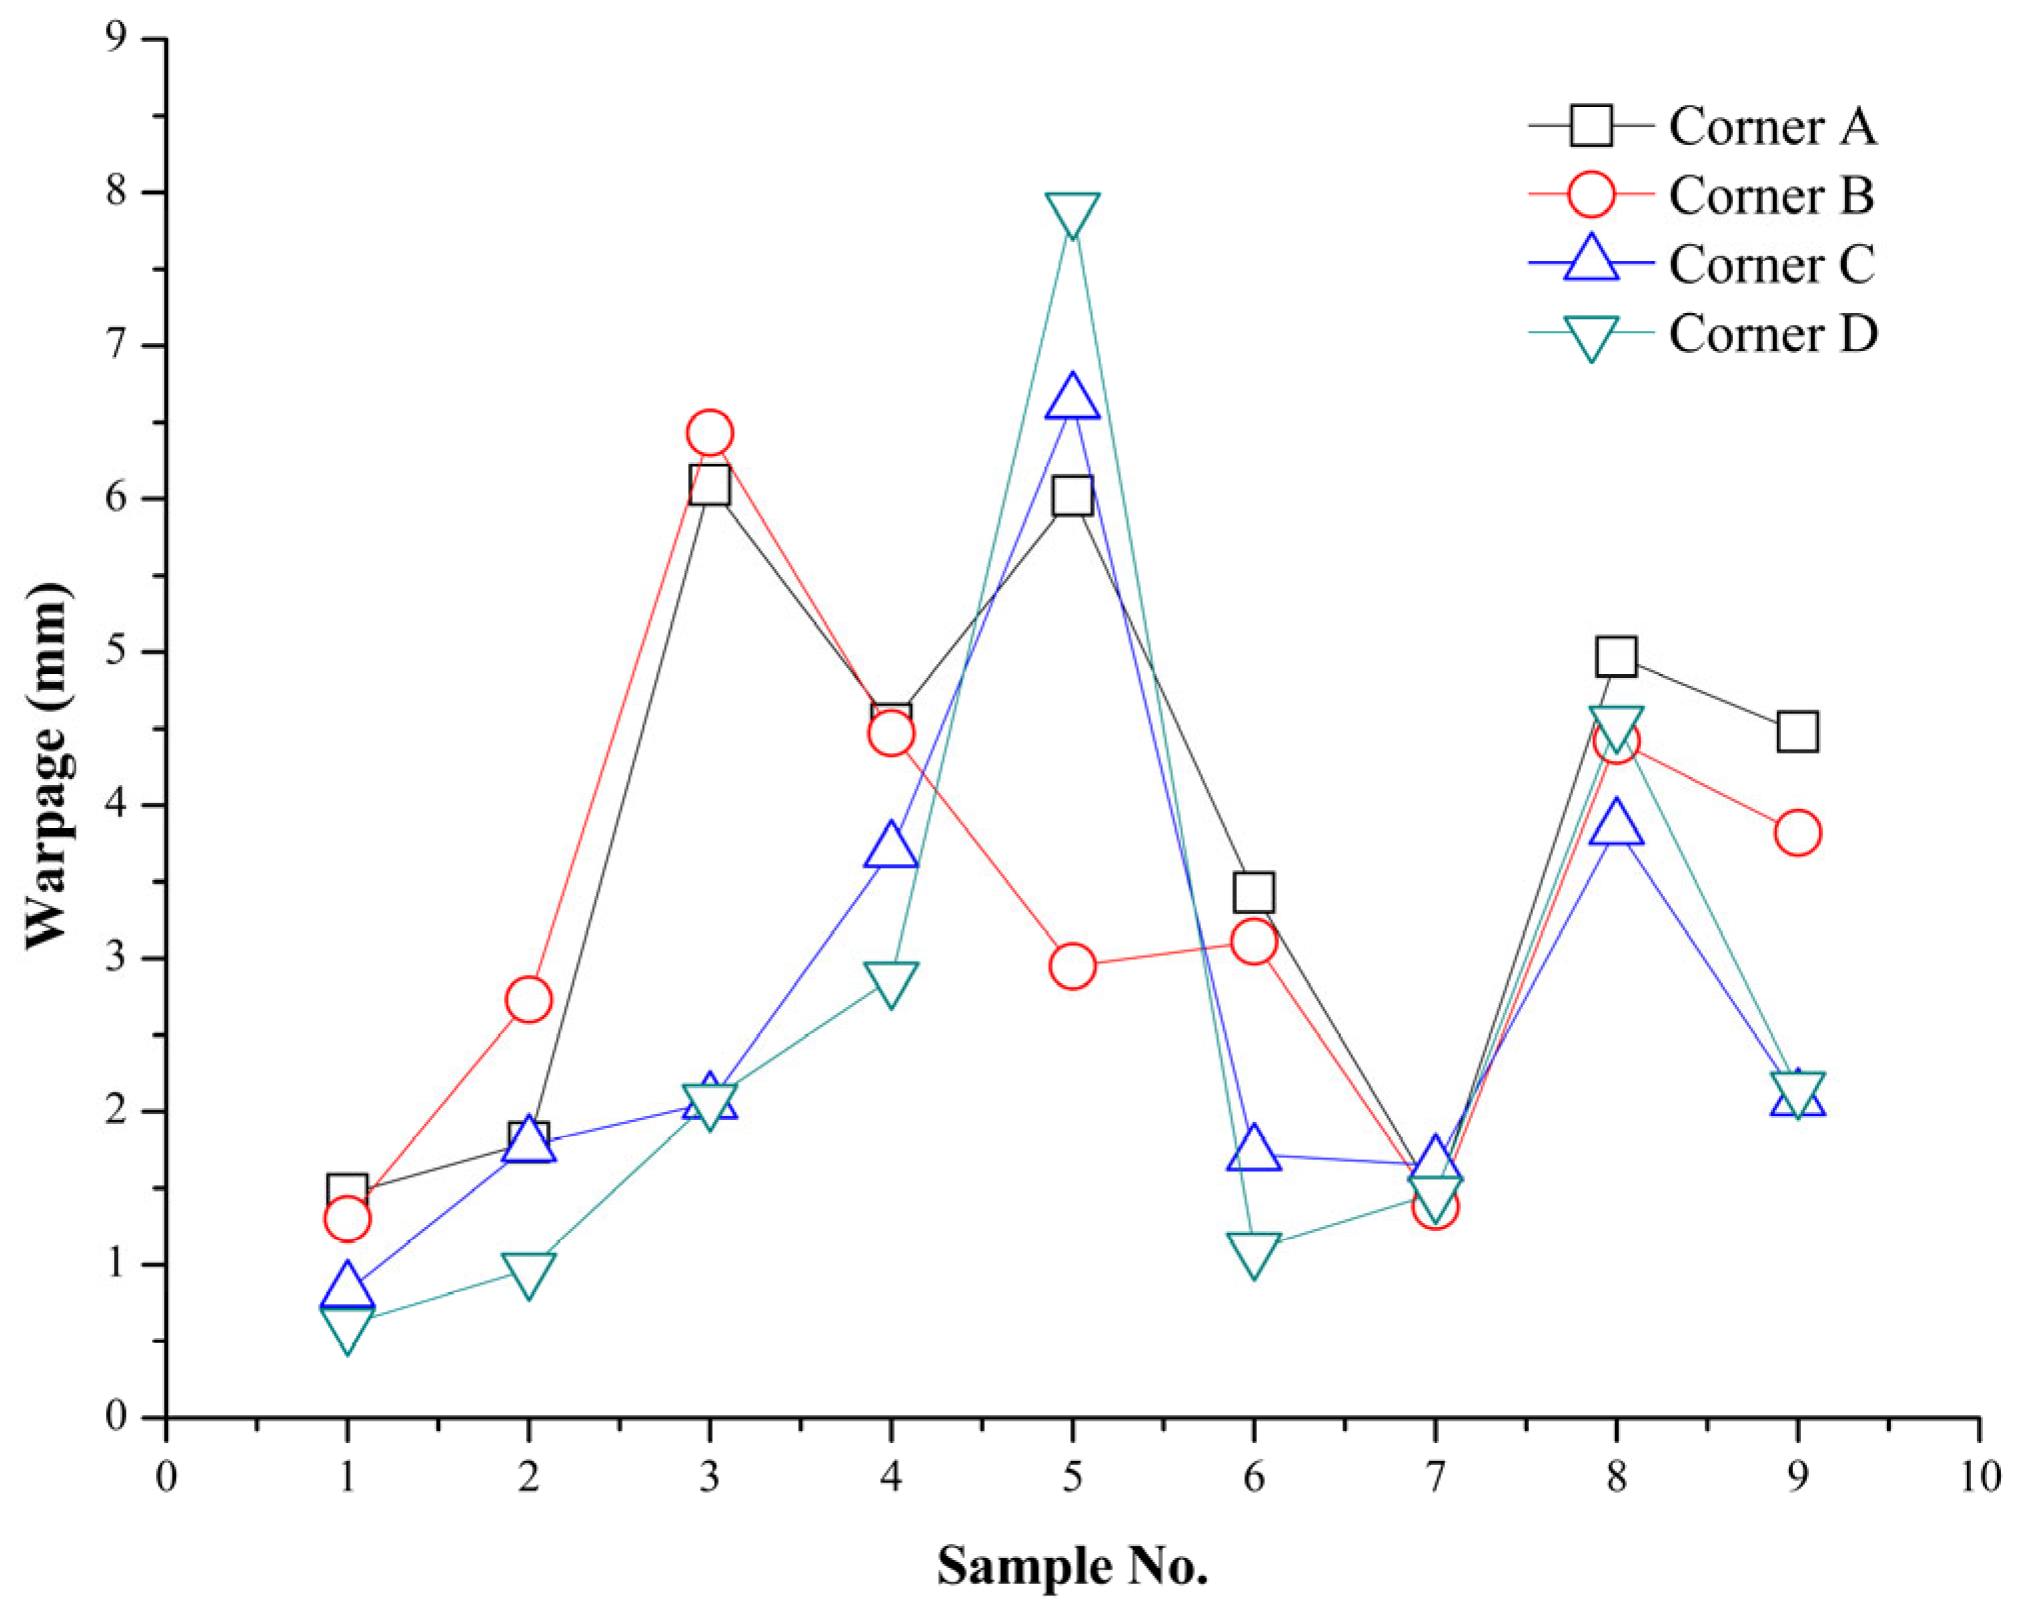
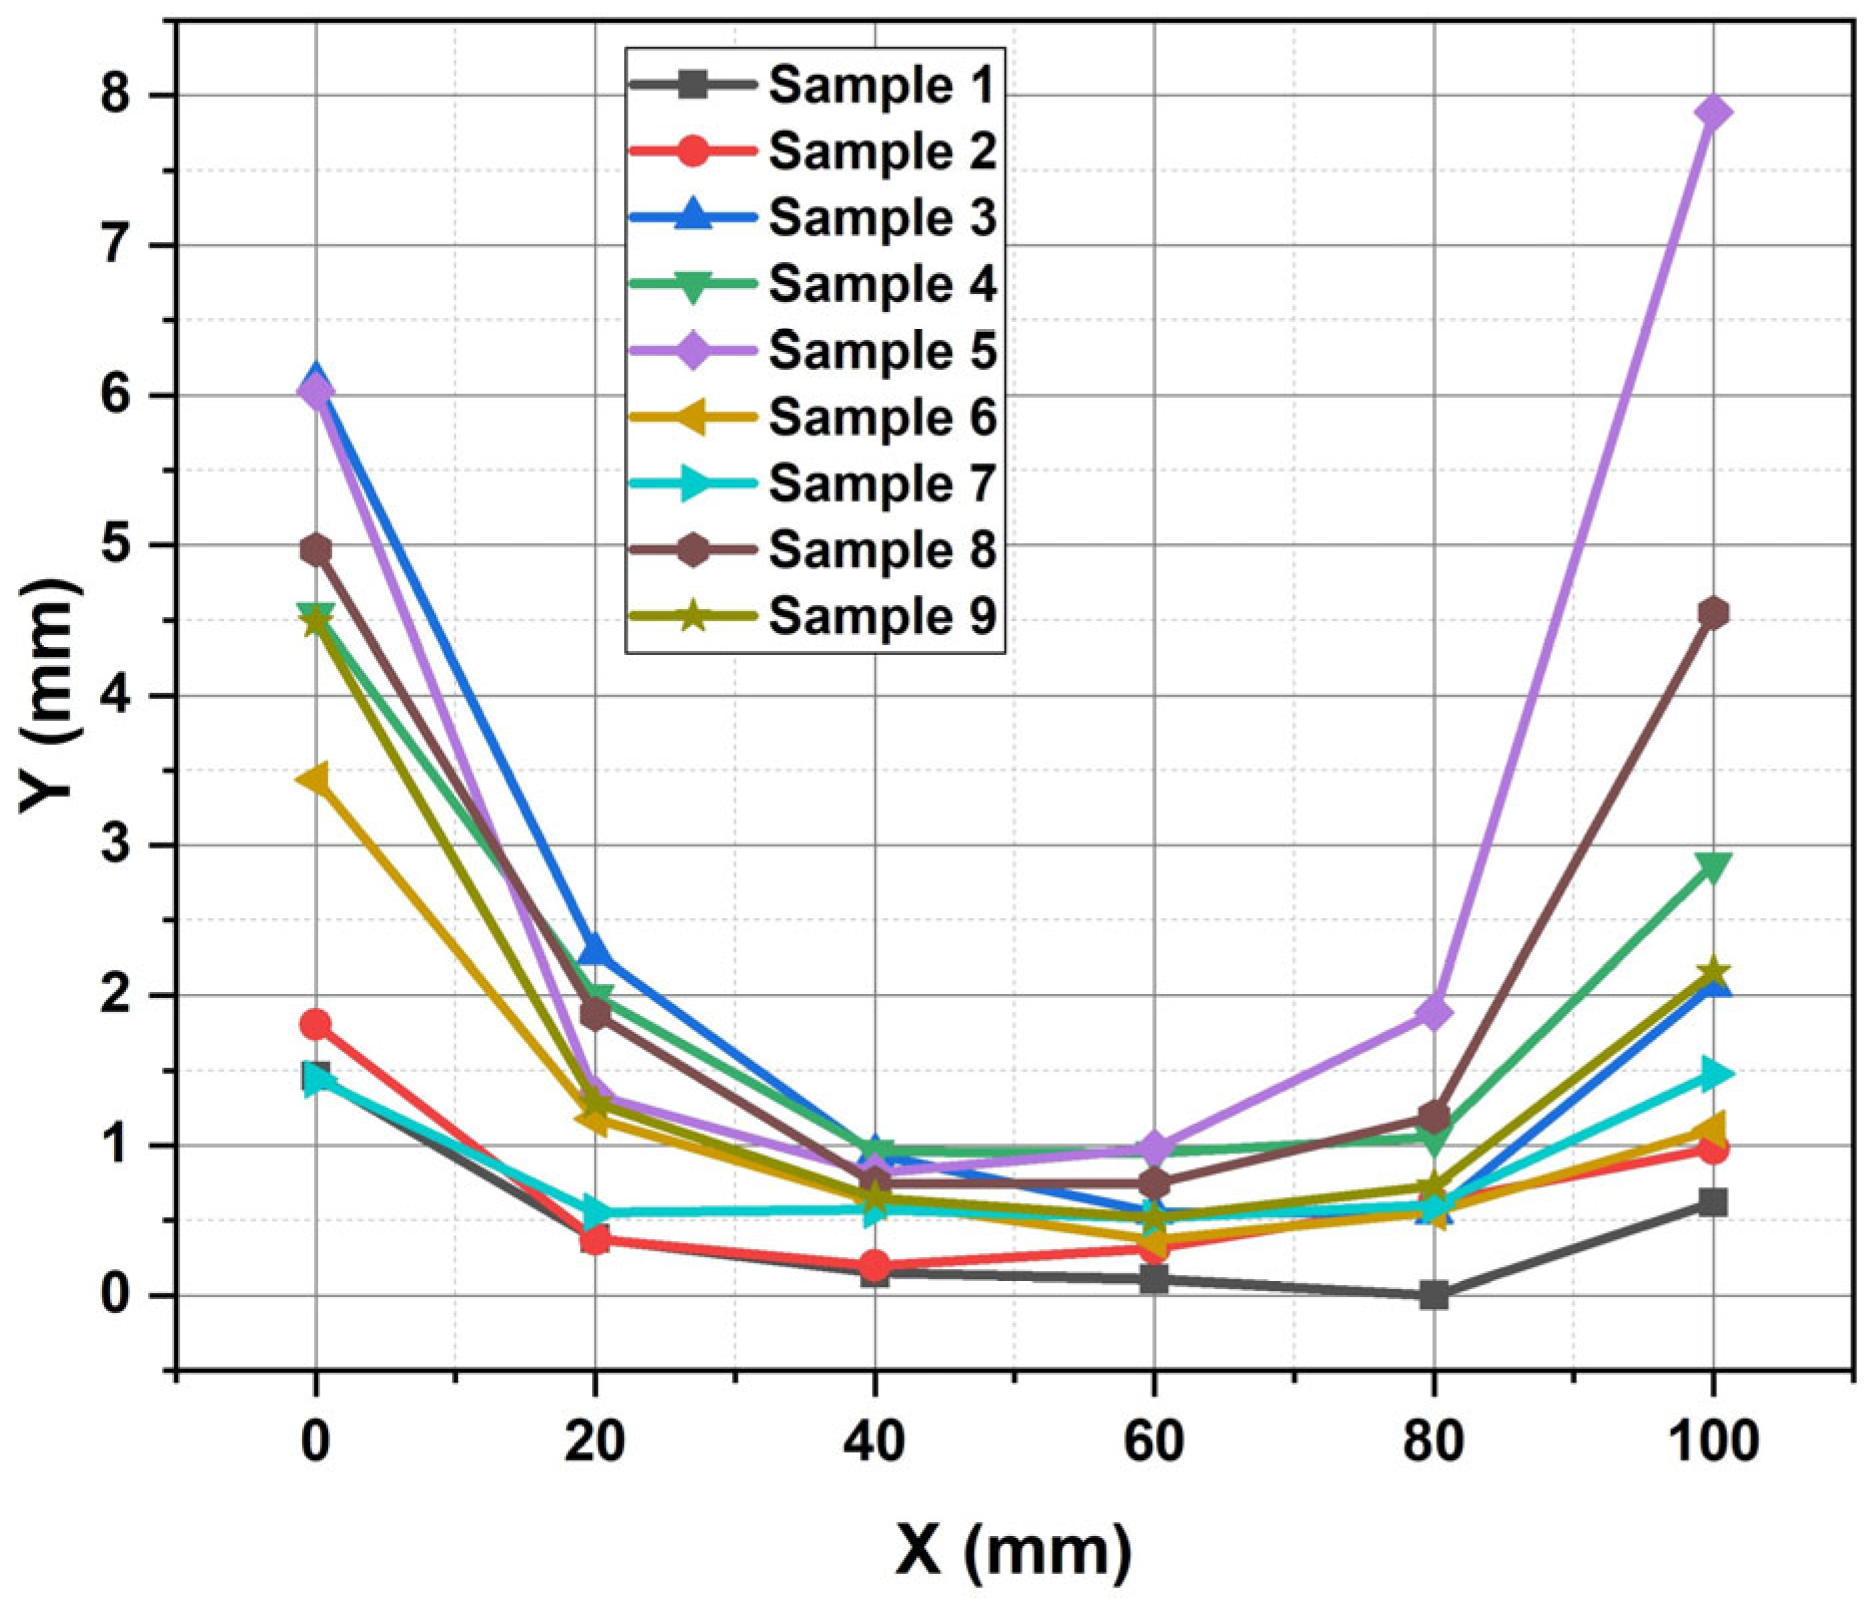
The average compressive stress at break across samples varies from 72.5 MPa to 167 MPa, as shown in Table 6. While PEEK is a high-performance thermoplastic known for its excellent mechanical properties (including compressive strength). The strain at break shows the amount of deformation each sample can endure before failure. The strain at break ranges from 15.5% to 90%. This variability suggests differences in the ductility of the samples. For PEEK, which typically has relatively low ductility compared to metals, a high strain at break (above 70%) would be atypical. Although PEEK is tough, 3D-printed PEEK may show reduced ductility due to layer bonding issues, leading to brittleness. Brittle materials fail suddenly under compressive loading without significant plastic deformation. This is evident in the samples with lower strain at break (e.g., Sample 1, 72.5 MPa, strain at break 25.8%). Higher strain at break could indicate a more ductile sample, which can better absorb energy before failure, but PEEK’s behavior in the 3D-printed state may lead to inadequate energy absorption capacity under compression if the layers are weakly bonded. The standard deviations in both compressive stress and strain at break suggest significant variability between samples. Some samples (e.g., Sample 4 and Sample 8) have a strain at break close to 80–90%. While these numbers are high, it is important to note that they may reflect the material’s capability to deform in compression before failure. However, this can also indicate that the material is undergoing significant deformation before breaking, which is not ideal for compressive strength under loads where minimal deformation is desirable. Even though some samples show high strain at break, they might still fail under prolonged compressive loads due to issues like creep or buckling. Three-dimensionally printed PEEK, especially under elevated temperatures or constant compressive forces, may start to deform plastically over time, leading to failure even if the initial compressive strength seems adequate.
The variation in compressive and tensile stress observed in the 3D-printed samples can be attributed to differences in printing conditions such as nozzle temperature, layer thickness, platform temperature, and infill rate. Nozzle temperature plays a critical role in material flow and layer adhesion, with higher temperatures (e.g., 420 °C) generally improving interlayer bonding, which enhances strength but may also introduce residual stresses, leading to variations in performance. Layer thickness affects the mechanical properties by influencing the bonding between adjacent layers; thinner layers (e.g., 0.16 mm) typically result in better adhesion but may introduce stress concentrations, while thicker layers (e.g., 0.2 mm) can lead to weaker bonding between layers, reducing mechanical strength. Platform temperature is another significant factor as higher temperatures (e.g., 150 °C) help reduce thermal gradients, minimizing warpage and improving overall part integrity, while lower temperatures (e.g., 130 °C) may cause uneven cooling and induce internal stresses that weaken the part. Additionally, the infill rate directly impacts the density and mechanical performance of the printed parts, with higher infill percentages (e.g., 100%) providing more material support and increasing compressive and tensile strength, while lower infill rates (e.g., 60%) introduce internal voids, reducing the overall mechanical resistance. The interplay of these parameters leads to the observed variations in stress, as seen in samples with higher temperatures and optimized conditions (e.g., Sample 4 and 8) exhibiting greater strength, while those with suboptimal parameters (e.g., Sample 9) show lower stress values due to insufficient bonding and structural inconsistencies. The maximum compression strength and strain of PEEK were found to be 164.4 MPa and 73%, respectively, at a nozzle temperature of 420 °C. The test was conducted with a layer height of 0.18 mm, a bed temperature of 130 °C, and an infill density of 100%. For the 10% carbon fiber-reinforced PEEK, printed under the same conditions, the mechanical performance was significantly enhanced. The maximum tensile strength increased to 171.32 MPa, while the strain at break decreased to 59.42%.
The variation in tensile and compressive loading properties across different groups is influenced by printing parameters such as nozzle temperature, layer thickness, platform temperature, and infill rate, as shown in Table 7. Higher nozzle temperatures and optimal platform temperatures improve interlayer adhesion, enhancing both tensile and compressive strength, as seen in Group 8. Groups with lower infill rates and suboptimal thermal conditions exhibit reduced mechanical performance due to weaker bonding and increased voids, as observed in Group 9. Variations in strain indicate differing material deformation behavior, with higher strain in compressive loading reflecting improved ductility under specific conditions. Unreinforced PEEK has a tensile strength of 71.4 MPa and good mechanical integrity. Carbon fiber-reinforced PEEK exhibits a tensile strength of 120.1 MPa and a reduced strain at break of 8.85%. The carbon fibers enhance strength but reduce flexibility compared to pure PEEK. The PEEK shows a compression strength of 164.4 MPa and a high strain at break of 73%. When reinforced with 10% carbon fiber, the tensile strength increases to 171.32 MPa, but the strain at break drops to 59.42%.

3.3. Warpage

Figure 4a shows the sample with corner mentioned for measurement, and Figure 4b shows the warpage measurement of the sample using ImageJ software. The measurement was performed with linear and angular dimensions to assess the impact of various printing parameters on the warpage behavior of the PEEK samples. The warpage of the samples was analyzed by measuring the dimensions of the test bar at each corner (A, B, C, and D) using ImageJ software. Each dimension at the corners was measured at least three times, and the average (mean) and standard deviation were calculated. The deviation for each dimension (corner) of the test bar was then computed.
Table 8 and Figure 5 show the warpage measurements for the samples at different corners in mm. It is evident that the maximum warpage is observed in Sample 3 (nozzle temperature: 400 °C, layer thickness: 0.2 mm, platform temperature: 150 °C, and infill rate: 100%) with a magnitude of 6.09 mm at corner A. The maximum warpage at corner B (6.43 mm) is also observed in Sample 3. In Sample 5 (nozzle temperature: 410 °C, layer thickness: 0.18 mm, platform temperature: 150 °C, and infill rate: 60%), the maximum warpage of 6.63 mm is observed at corner C. The maximum warpage at corner D (7.89 mm) is also found in Sample 5. Figure 4a shows Sample 9 with corners A, B, C, and D used to measure warpage in mm using ImageJ software. It also shows the relationship between the average value and different samples. Sample 5, with a nozzle temperature of 410 °C, layer thickness of 0.18 mm, platform temperature of 150 °C, and an infill rate of 60%, shows the highest warpage, while Sample 1, with a nozzle temperature of 400 °C, layer thickness of 0.16 mm, platform temperature of 130 °C, and infill rate of 60%, exhibits the lowest warpage.
Table 9 and Figure 6 show the warpage measurements for the samples at different corners in degrees. The results indicate that Sample 5 shows a significant mean warpage of 18.7°, while Sample 1 shows a much lower mean warpage of 3.35°. This difference can be attributed to the higher nozzle temperature used in Sample 5 (410 °C) compared to Sample 1 (400 °C). Higher nozzle temperatures increase thermal gradients between the printed layers, resulting in more pronounced warpage due to uneven cooling and contraction between layers. It is evident that the maximum warpage occurs in Sample 9 (nozzle temperature: 420 °C, layer thickness: 0.2 mm, platform temperature: 140 °C, and infill rate: 60%) with an angle of 22° at corner A. On the other hand, the minimum warpage is observed in Sample 1 (nozzle temperature: 400 °C, layer thickness: 0.16 mm, platform temperature: 130 °C, and infill rate: 60%) with an angle of 3.3° at corner A. At corner B, the maximum warpage (15.5°) is observed in Sample 4 (nozzle temperature: 410 °C, layer thickness: 0.16 mm, platform temperature: 140 °C, and infill rate: 100%), while the minimum warpage (5.7°) is seen in Sample 7 (nozzle temperature: 420 °C, layer thickness: 0.16 mm, platform temperature: 150 °C, and infill rate: 80%). At corner C, the maximum warpage (21.6°) is observed in Sample 5 (nozzle temperature: 410 °C, layer thickness: 0.18 mm, platform temperature: 150 °C, and infill rate: 60%), while the minimum warpage (1.6°) is observed in Sample 1. Similarly, at corner D, the maximum warpage (23.2°) is recorded in Sample 5, whereas the minimum warpage (2.1°) is observed in Sample 2.
Figure 7 shows the linear warpage of Sample 1 and Sample 2 along the length of the samples (100 mm). In Sample 1, the warpage at corner A is 1.46 mm, and at corner D, it is 0.61 mm. In Sample 2, the warpage at corner A is slightly higher at 1.80 mm, and at corner D, it is 0.97 mm. The increased warpage in Sample 2 suggests that the change in printing parameters (such as nozzle temperature) affects the overall deformation of the sample, with Sample 2 exhibiting slightly more warpage across both corners compared to Sample 1.
In Sample 3, the warpage at corner A is 6.09 mm, and at corner D, it is 2.07 mm. Sample 4, with a slightly different printing parameter set, shows warpage of 4.53 mm at corner A and warpage of 2.87 mm at corner D. The greater warpage at corner A in Sample 3 (6.09 mm vs. 4.53 mm in Sample 4) and the slightly higher warpage at corner D in Sample 4 (2.87 mm vs. 2.07 mm in Sample 3) suggest that variations in nozzle temperature, layer thickness, and infill rate significantly influence the degree of warpage, particularly in the earlier and later printed layers of the sample.
In Sample 5, the warpage at corner A is 6.02 mm, while at corner D, it is much larger, measuring 7.89 mm. In Sample 6, the warpage at corner A is 3.43 mm, and at corner D, it is significantly lower at 1.10 mm. Sample 5, with a higher nozzle temperature and a different layer thickness, exhibits considerably more warpage, especially at corner D, indicating that higher temperatures and thinner layers contribute to increased deformation due to more significant thermal gradients during the printing process. On the other hand, Sample 6 shows lower warpage, particularly at corner D, suggesting that certain printing settings may reduce the warpage effect.
In Sample 7, the warpage at corner A is 1.44 mm, and at corner D, it is 1.47 mm. In Sample 8, corner A shows warpage of 4.97 mm, while corner D shows 4.54 mm. The warpage in Sample 7 is relatively low, especially at corner A, suggesting minimal thermal deformation. In contrast, Sample 8 demonstrates higher warpage at both corners, indicating that the higher nozzle temperature (420 °C) in Sample 8 leads to a greater temperature differential and, consequently, more warping.
In Sample 9, at corner A, the warpage is 4.48 mm, while at corner D, it is 2.15 mm. This sample, which has the highest nozzle temperature of 420 °C, exhibits moderate warpage compared to Sample 5 but still shows notable deformation, particularly at corner A, where higher temperatures result in a more pronounced warpage effect. Ten-percent carbon fiber-reinforced PEEK exhibits warping at four corners: corner A (4.32°), corner B (5.21°), corner C (1.85°), and corner D (1.96°). The warpage at each corner measures 1.24 mm, 1.12 mm, 1.32 mm, and 1.14 mm, respectively. Despite this warping, the dimensional stability of carbon fiber-reinforced PEEK is improved compared to neat PEEK, indicating better resistance to deformation during the solidification process after each printing layer. The reduction in warpage at each corner highlights the reinforcement’s effectiveness in enhancing stability. Overall, the material demonstrates significant improvement in maintaining shape during processing.

3.4. Multi-Objective Optimization Technique

The Criteria Importance Through Inter-Criteria Correction (CIC) method is used to calculate weights for processing parameters based on their impact on multiple objectives, such as maximizing tensile and compressive stress and minimizing warpage. The Preference Selection Index (PSI) ranks the processing conditions by evaluating their effectiveness in achieving these objectives. Table 10 shows the calculated weights as per CIC methods. Table 11 shows different combinations of nozzle temperature, layer thickness, platform temperature, and infill rate with their corresponding ranks. Rank 1 represents the best combination of processing parameters, while Rank 9 indicates the least optimal combination. The results show that Sample 1 (400 °C nozzle, 130 °C platform, 0.16 mm layer thickness, 60% infill) achieved the best performance, likely due to minimal thermal stress and balanced adhesion. Sample 7 (420 °C, 150 °C, 0.16 mm, 80% infill) also performed well, ranking second, suggesting that higher temperatures with moderate infill improve mechanical strength. Conversely, Sample 9 (420 °C, 140 °C, 0.2 mm, 60% infill) ranked lowest, indicating that excessive temperature and low infill reduce structural stability. These findings highlight the importance of optimizing multiple parameters to achieve high-quality PEEK prints.

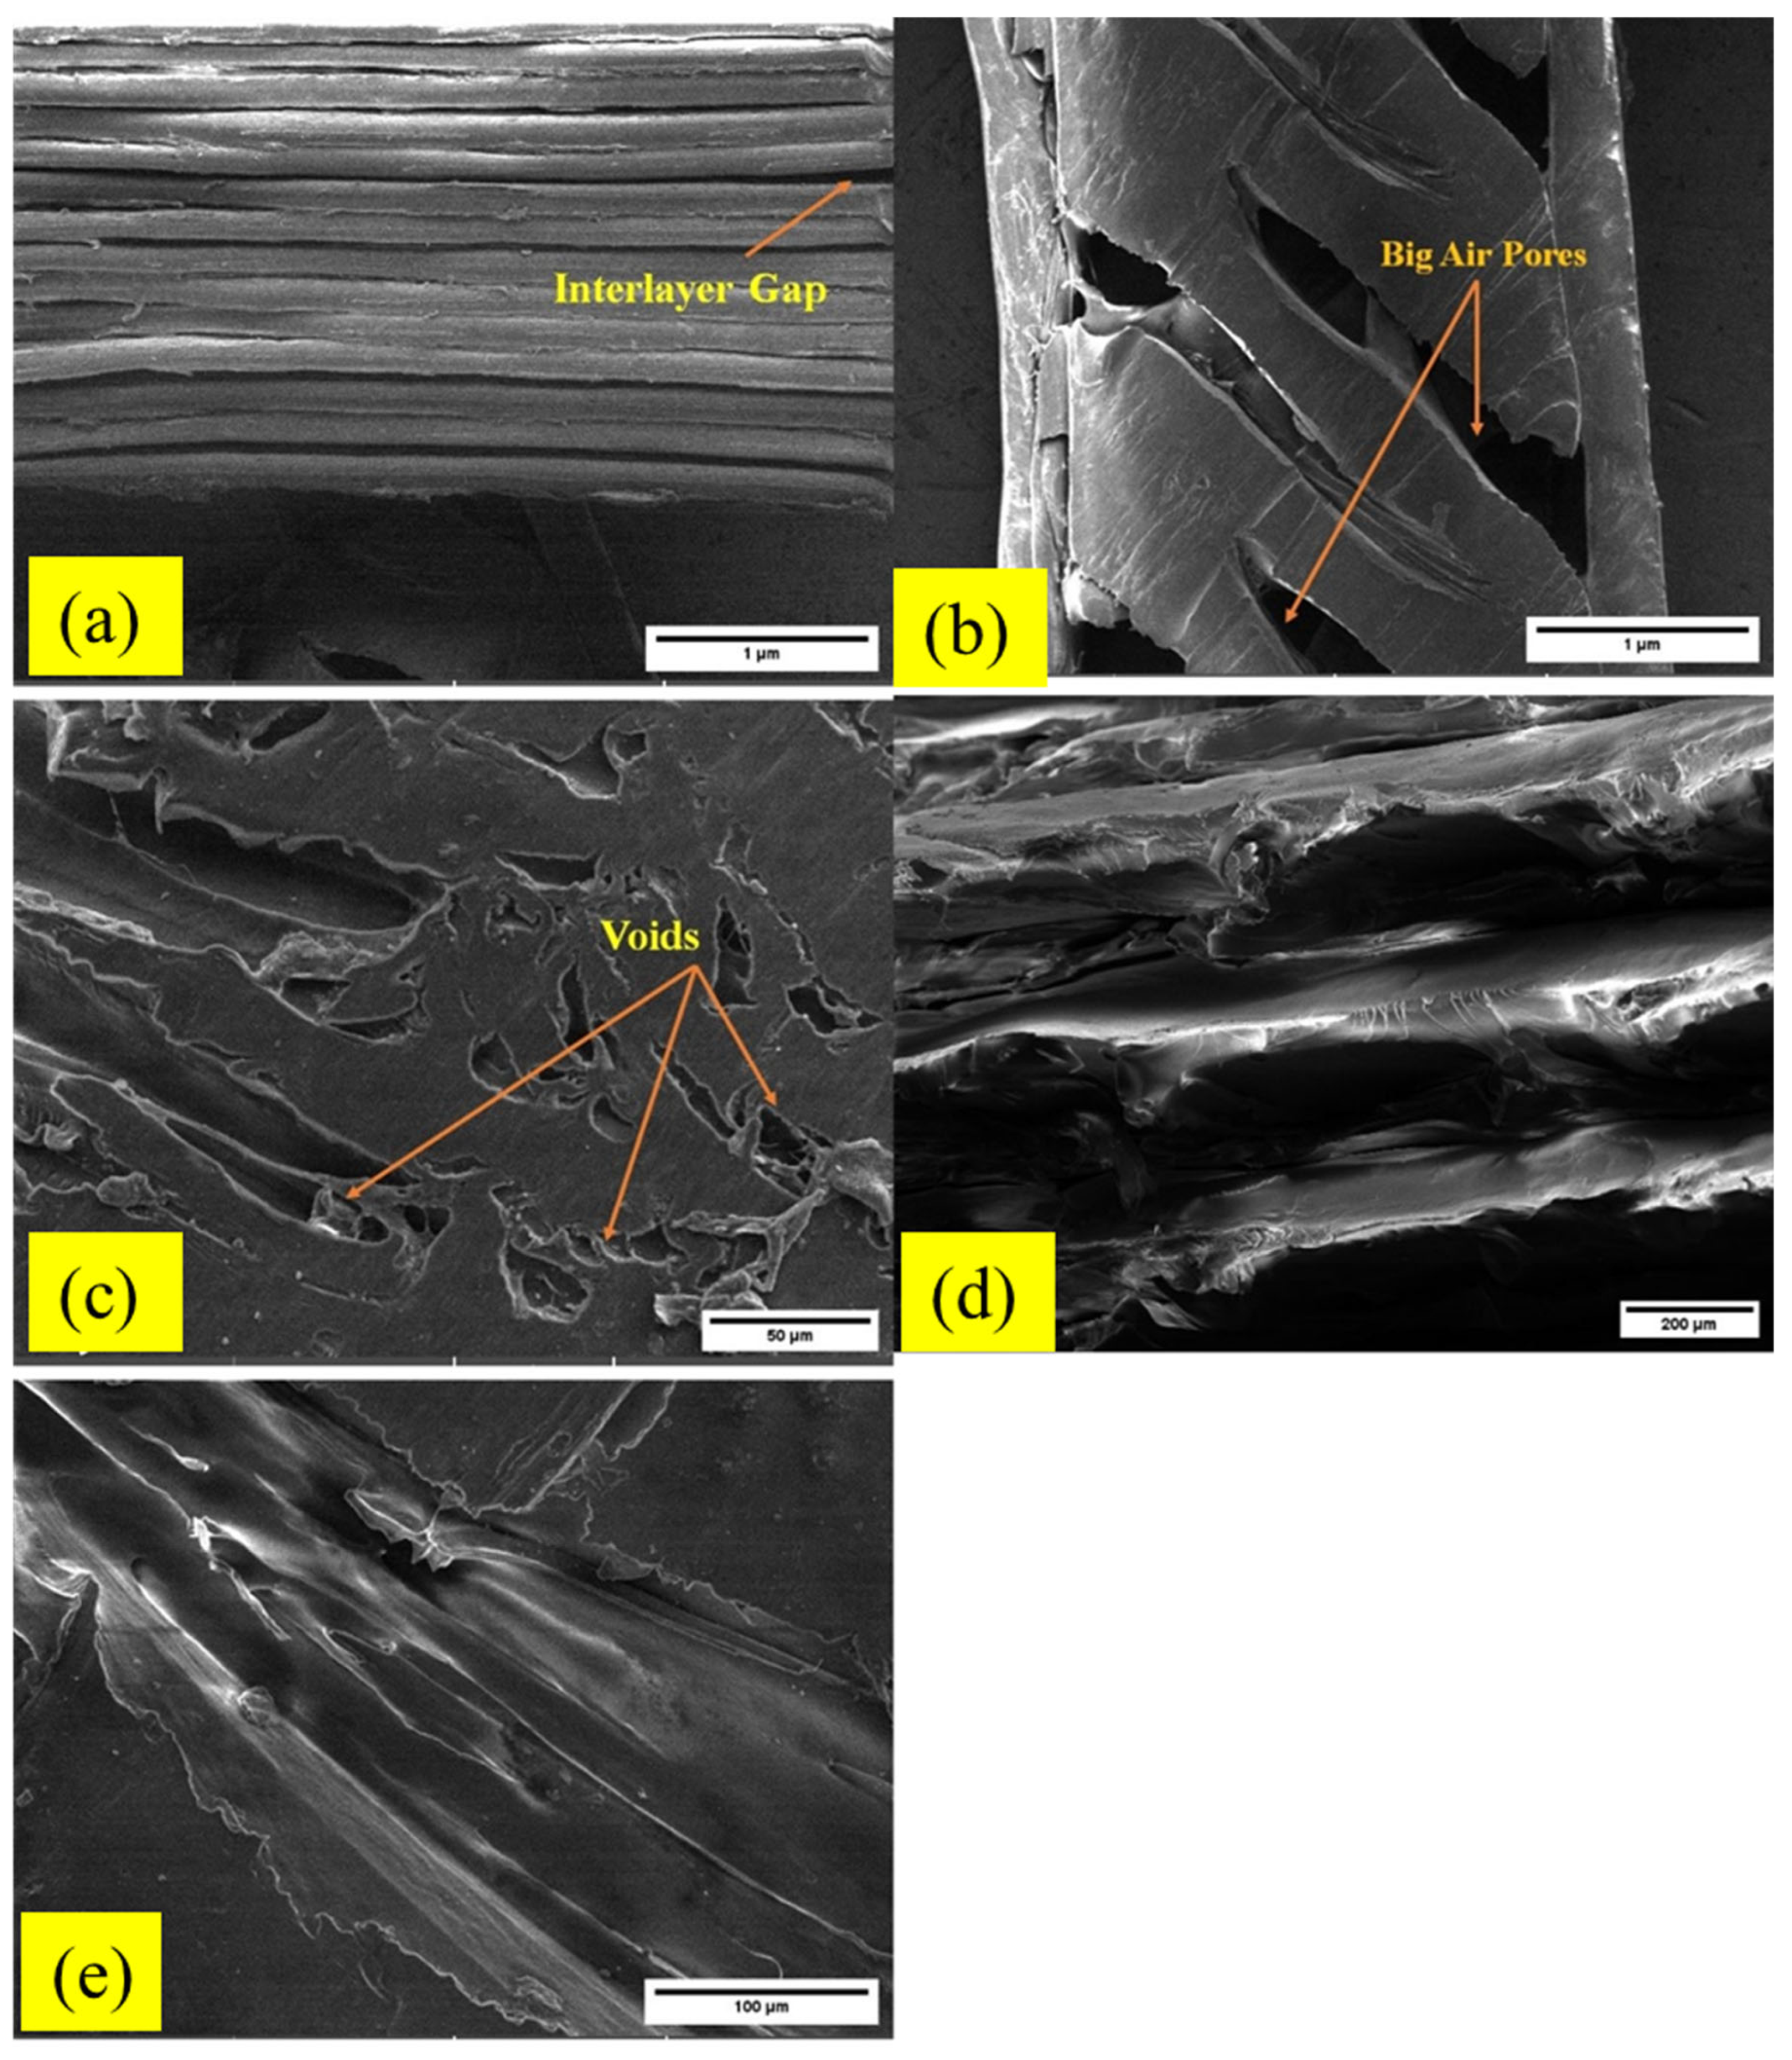
3.5. Scanning Electron Microscopy

To analyze the morphology of 3D-printed PEEK components, fracture surfaces of tensile specimens are examined. In compression testing, different failure modes were observed among the specimens. Some samples exhibited layer delamination, where the individual printed layers separated due to insufficient adhesion or excessive internal stresses. This failure mode is commonly seen in anisotropic materials like 3D-printed PEEK, where weak interlayer bonding can lead to structural failure under compressive loads. Other specimens, however, did not rupture completely but experienced progressive deformation, where the layers deteriorated and bulged outward instead of fracturing. The red arrows in Figure 8a,b highlight these bulging effects, which indicate plastic deformation under high compressive stress. This type of failure is influenced by printing parameters such as nozzle temperature, cooling rate, and layer adhesion. Similar findings were reported by Ren [37], confirming that compression failure in PEEK parts is highly dependent on process parameters and layer bonding quality. For tensile testing, Samples 1 and 8 were selected to analyze the impact of process parameters on mechanical performance. Figure 8 shows the fractured PEEK specimens post tensile testing, highlighting the differences in failure modes. Lower strength specimens (Figure 8a–c) exhibit defects such as voids, interlayer separation, and weak fusion lines. These defects arise due to insufficient nozzle temperature, which leads to incomplete melting and poor filament adhesion. Additionally, micro-voids and uneven material distribution can occur, further weakening the printed structure. Higher strength specimens (Figure 8d,e) show superior bonding and fewer defects. The use of higher nozzle temperatures improves material fluidity, allowing better fusion between layers and stronger filament-to-filament bonding. This leads to enhanced tensile properties, as the interlayer adhesion can withstand higher loads before failure.

4. Conclusions

The mechanical performance and structural integrity of 3D-printed PEEK components are significantly influenced by process parameters such as nozzle temperature, platform temperature, layer thickness, and infill rate. This study systematically evaluated these parameters to determine their effects on tensile and compression strength, strain behavior, warpage, and fracture characteristics.
  • Optimal tensile performance was achieved with a nozzle temperature of 420 °C, a platform temperature of 130 °C, and an 80–100% infill rate, resulting in improved interlayer bonding and higher tensile strength (71.4 MPa). Compression strength was maximized at 167 MPa with higher nozzle temperatures, which facilitated better filament fusion. Warpage analysis revealed that dimensional stability was enhanced by optimizing temperature settings, with minimal distortion occurring at lower warpage values. Multi-objective optimization ranked Sample 1 as the best-performing specimen due to its balanced mechanical properties, minimal deformation, and enhanced fracture resistance.
  • The highest warpage was observed in Sample 5, which exhibited the highest linear warpage (7.89 mm at corner D) and angular warpage (23.2° at corner D), indicating strong sensitivity to high nozzle temperature (410 °C) and low infill rate (60%). Sample 1 showed the lowest warpage, with values as low as 0.61 mm (corner D) and 3.3° (corner A), demonstrating optimal dimensional stability under reduced temperature and thicker layers. Carbon fiber-reinforced PEEK reduced warpage significantly, with maximum values of 1.32 mm and 5.21°, confirming enhanced thermal stability over neat PEEK.
  • Fracture image analysis confirmed that higher-strength specimens exhibited fewer voids, better fusion, and stronger bonding, while lower-strength specimens displayed interlayer separation and weak adhesion. Additionally, the inclusion of 10% carbon fiber reinforcement improved tensile properties and dimensional stability, while reducing ductility, with no significant effect on compression strength.
  • These findings provide key insights into optimizing 3D printing parameters for PEEK and its composites, ensuring improved mechanical performance and structural integrity for advanced engineering applications.

5. Key Takeaways and Future Recommendations

Higher nozzle temperatures improve interlayer bonding and reduce defects.
Optimized cooling strategies can further enhance structural integrity.
Post-processing treatments such as annealing may enhance mechanical properties.
Future studies should explore hybrid infill patterns to balance strength and weight.

Author Contributions

Methodology, S.H.A. and M.N.; Software, S.H.A.; Formal analysis, S.H.A. and M.N.; Data curation, S.H.A. and M.N.; Writing—original draft, S.H.A.; Writing—review & editing, S.H.A. and M.N.; Supervision, S.H.A.; Project administration, S.H.A.; Funding acquisition, M.N. All authors have read and agreed to the published version of the manuscript.

Funding

The authors wish to acknowledge the financial support received from the Science and Engineering Research Board—Department of Science and Technology (EEQ/2021/000763), New Delhi, Government of India, and the IDEA2PoC Grant Scheme (Elevate-Unnati 2021) of Karnataka Startup Policy, KITS, Dept. of Electronics, IT, Bt and S&T Govt. of Karnataka.

Data Availability Statement

The original contributions presented in this study are included in the article. Further inquiries can be directed to the corresponding author.

Conflicts of Interest

The authors declare no conflict of interest.

References

  1. Sapata, A.; Šinka, M.; Šahmenko, G.; Korat Bensa, L.; Hanžič, L.; Šter, K.; Ručevskis, S.; Bajāre, D.; Bos, F.P. Establishing Benchmark Properties for 3D-Printed Concrete: A Study of Printability, Strength, and Durability. J. Compos. Sci. 2025, 9, 74. [Google Scholar] [CrossRef]
  2. Indreș, A.I.; Constantinescu, D.M.; Mocian, O.A.; Sorohan, Ș. Particularities on the Low-Velocity Impact Be-havior of 3D-Printed Sandwich Panels with Re-Entrant and Honeycomb Core Topologies. J. Compos. Sci. 2024, 8, 426. [Google Scholar] [CrossRef]
  3. Anwajler, B.; Szulc, P. The Impact of 3D Printing Technology on the Improvement of External Wall Thermal Efficiency—An Experimental Study. J. Compos. Sci. 2024, 8, 389. [Google Scholar] [CrossRef]
  4. Ogaili, A.A.F.; Basem, A.; Kadhim, M.S.; Al-Sharify, Z.T.; Jaber, A.A.; Njim, E.K.; Al-Haddad, L.A.; Hamzah, M.N.; Al-Ameen, E.S. The Effect of Chopped Carbon Fibers on the Mechanical Properties and Fracture Tough-ness of 3D-Printed PLA Parts: An Experimental and Simulation Study. J. Compos. Sci. 2024, 8, 273. [Google Scholar] [CrossRef]
  5. Kyriakidis, I.F.; Kladovasilakis, N.; Pechlivani, E.M.; Tsongas, K. Mechanical Performance of Recycled 3D Printed Sustainable Polymer-Based Composites: A Literature Review. J. Compos. Sci. 2024, 8, 215. [Google Scholar] [CrossRef]
  6. Lecoublet, M.; Ragoubi, M.; Leblanc, N.; Koubaa, A. Investigation of Thermomechanical and Dielectric Prop-erties of PLA-CA 3D-Printed Biobased Materials. J. Compos. Sci. 2024, 8, 197. [Google Scholar] [CrossRef]
  7. Raziyan, M.S.; Palevicius, A.; Perkowski, D.; Urbaite, S.; Janusas, G. Development and Evaluation of 3D-Printed PLA/PHA/PHB/HA Composite Scaffolds for Enhanced Tissue-Engineering Applications. J. Compos. Sci. 2024, 8, 226. [Google Scholar] [CrossRef]
  8. Jawad, H.H.; Kordani, N.; Bagheri, A.; Derazkola, H.A. Optimization of 3D Printing Parameters for En-hanced Mechanical Strength: Effects of Glass Fiber Reinforcement and Fill Ratio Using RSM and ANOVA. J. Compos. Sci. 2025, 9, 63. [Google Scholar] [CrossRef]
  9. Papageorgiou, V.; Tsongas, K.; Mansour, M.T.; Tzetzis, D.; Mansour, G. Mechanical Properties and Vibra-tional Behavior of 3D-Printed Carbon Fiber-Reinforced Polyphenylene Sulfide and Polyamide-6 Composites with Different Infill Types. J. Compos. Sci. 2025, 9, 59. [Google Scholar] [CrossRef]
  10. Li, M.; Stokes-Griffin, C.; Compston, P. Post-Forming of Carbon Fibre-Reinforced PEEK Thermoplastic Tubu-lar Structures. J. Compos. Sci. 2024, 8, 335. [Google Scholar] [CrossRef]
  11. Ceddia, M.; Solarino, G.; Giannini, G.; De Giosa, G.; Tucci, M.; Trentadue, B. A Finite Element Analysis Study of Influence of Femoral Stem Material in Stress Shielding in a Model of Uncemented Total Hip Arthroplasty: Ti-6Al-4V versus Carbon Fibre-Reinforced PEEK Composite. J. Compos. Sci. 2024, 8, 254. [Google Scholar] [CrossRef]
  12. Campos, D.; Maimí, P.; Martín, A. Characterization of Interlaminar Friction during the Forming Processes of High-Performance Thermoplastic Composites. J. Compos. Sci. 2024, 8, 38. [Google Scholar] [CrossRef]
  13. Dederichs, M.; Lackner, O.; Kuepper, H.; Decker, M.; Viebranz, S.; Hennig, C.-L.; Guentsch, A.; Kuepper, C. An Explorative Evaluation on the Influence of Filler Content of Polyetheretherketone (PEEK) on Adhesive Bond to Different Luting Resin Cements. J. Compos. Sci. 2023, 7, 456. [Google Scholar] [CrossRef]
  14. Stawarczyk, B.; Beuer, F.; Wimmer, T.; Jahn, D.; Sener, B.; Roos, M.; Schmidlin, P.R. Polyetheretherketone—A suitable material for fixed dental prostheses? J. Biomed. Mater. Res.—Part B Appl. Biomater. 2013, 101, 1209–1216. [Google Scholar] [CrossRef]
  15. Margolis, J.M. Engineering Thermoplastics; Marcel Dekker, Inc.: New York, NY, USA, 2020. [Google Scholar]
  16. Kurtz, S.M.; Devine, J.N. PEEK biomaterials in trauma, orthopedic, and spinal implants. Biomaterials 2007, 28, 4845–4869. [Google Scholar] [CrossRef]
  17. Lee, W.T.; Koak, J.Y.; Lim, Y.J.; Kim, S.K.; Kwon, H.B.; Kim, M.J. Stress shielding and fatigue limits of poly-ether-ether-ketone dental implants. J. Biomed. Mater. Res.—Part B Appl. Biomater. 2012, 100, 1044–1052. [Google Scholar] [CrossRef]
  18. Di Maggio, B.; Sessa, P.; Mantelli, P.; Maniscalco, P.; Rivera, F.; Calori, G.M.; Bisogno, L.; Scaravilli, G.; Caforio, M. PEEK radiolucent plate for distal radius fractures: Multicentre clinical results at 12 months follow up. Injury 2017, 48, S34–S38. [Google Scholar] [CrossRef]
  19. Gibson, I.; Rosen, D.W.; Stucker, B. Additive Manufacturing Technologies: 3D Printing, Rapid Pro-Totyping, and Direct Digital Manufacturing; Springer: Berlin/Heidelberg, Germany, 2021. [Google Scholar]
  20. Turner, B.N.; Strong, R.; Gold, S.A. A review of melt extrusion additive manufacturing processes: I. Process design and modeling. Rapid Prototyp. J. 2015, 21, 250–261. [Google Scholar] [CrossRef]
  21. Mohamed, O.A.; Masood, S.H.; Bhowmik, J.L. Optimization of fused deposition modeling process parameters: A review of current research and future prospects. Adv. Manuf. 2016, 4, 42–53. [Google Scholar] [CrossRef]
  22. Wang, W.; Wang, T. Anisotropic shrinkage and warpage of polymer parts in fused deposition modeling. Mater. Des. 2017, 135, 350–360. [Google Scholar]
  23. Singh, R.; Sandhu, A.; Kumar, R. Moisture absorption effect on the mechanical performance of FDM-printed parts. J. Thermoplast. Compos. Mater. 2018, 31, 1678–1695. [Google Scholar]
  24. Zhao, Y.; Zhang, S.; Zhao, X. Influence of composite filament properties on FDM-printed part per-formance: A review. J. Manuf. Process. 2019, 42, 101–117. [Google Scholar]
  25. Li, X.; Zhang, Y.; Chou, Y.K. Effects of process parameters on warping deformation of FDM printed parts. Int. J. Adv. Manuf. Technol. 2020, 106, 3767–3779. [Google Scholar]
  26. Yap, Y.L.; Yeong, W.Y.; Tan, C.S. Investigating the effects of nozzle temperature on mechanical properties of 3D-printed PEEK using fused deposition modeling. Mater. Des. 2017, 130, 70–79. [Google Scholar]
  27. Kuznetsov, V.E.; Solonin, A.N.; Urzhumtsev, O.D.; Schilling, R.; Tavitov, A.G. Strength anisotropy of 3D-printed specimens: Experimental characterization and numerical modeling. Mater. Des. 2018, 160, 79–89. [Google Scholar]
  28. Chacón, J.M.; Caminero, M.A.; García-Plaza, E.; Núñez, P.J. Additive manufacturing of PLA structures using fused deposition modelling: Effect of process parameters on mechanical properties and their optimal selection. Mater. Des. 2017, 124, 143–157. [Google Scholar] [CrossRef]
  29. Lee, J.; An, J.; Chua, C.K. Fundamentals and applications of 3D printing for novel materials. Appl. Mater. Today 2019, 15, 100571. [Google Scholar] [CrossRef]
  30. Mendes, L.A.; Neto, R.J.; Alves, J.L. Annealing effect on 3D printed parts: An experimental and numerical investigation. Polym. Test. 2021, 100, 107278. [Google Scholar]
  31. Lan, H.; Ding, Y.; Hong, J. Adaptive slicing for fused deposition modeling based on part geometry and build orientation. J. Manuf. Process. 2020, 49, 151–163. [Google Scholar]
  32. Gao, W.; Zhang, Y.; Ramanujan, D.; Ramani, K.; Chen, Y.; Williams, C.B.; Wang, C.C.L.; Shin, Y.C.; Zhang, S.; Zavattieri, P.D. The status, challenges, and future of additive manufacturing in engineering. Comput.-Aided Des. 2018, 69, 65–89. [Google Scholar] [CrossRef]
  33. Mohan, N.; Senthil, P.; Vinodh, S.; Jayanth, N. A review on influence of process parameters in addi-tive manufacturing using fused filament fabrication. Mater. Today Proc. 2021, 45, 6518–6524. [Google Scholar]
  34. Hussain, S.; Shakor, P.; Safaei, B. Self-healing materials for additive manufacturing: A review of re-cent advancements and challenges. Mater. Today Commun. 2022, 31, 103573. [Google Scholar]
  35. Dey, A.; Ashok, A.; Bose, S. Hybrid additive manufacturing: Merging different fabrication tech-niques for enhanced properties. Addit. Manuf. 2023, 47, 101241. [Google Scholar]
  36. Zhang, J.; Li, Z.; Li, Y. AI-driven real-time monitoring and control of warping in fused deposition modeling. Addit. Manuf. 2023, 54, 102847. [Google Scholar]
  37. Ren, Y.; Sikder, P.; Lin, B.; Bhaduri, S.B. Microwave assisted coating of bioactive amorphous magnesium phosphate (AMP) on polyetheretherketone (PEEK). Mater. Sci. Eng. C 2018, 85, 107–113. [Google Scholar] [CrossRef] [PubMed]
Figure 1. Methodology for evaluating tensile, compression, and warpage properties.
Jcs 09 00208 g001
Figure 2. Three-dimensionally printed PEEK samples: (a) tensile specimens, (b) compression specimens.
Jcs 09 00208 g002
Figure 3. Warpage deformation and its method of measurement at each corner.
Jcs 09 00208 g003
Figure 4. (a) Warpage of Sample 9 showing different corners. (b) Warpage measurement in degrees using ImageJ software.
Jcs 09 00208 g004
Figure 5. Warpage at each corner of the samples in mm.
Jcs 09 00208 g005
Figure 6. Warpage at each corner of the samples in degrees.
Jcs 09 00208 g006
Figure 7. Warpage analysis of samples with respect to X and Y directions.
Jcs 09 00208 g007
Figure 8. SEM micrographs of the tensile fracture surface of 3D-printed PEEK at (ac) 400 °C and (d,e) 420 °C.
Jcs 09 00208 g008
Table 1. Technical parameters of the composite 3D printer used in the present study.
ParameterHydra 16 AS
Hot End TypeBowden type and dual nozzle
Print ProcessFused filament fabrication or fused deposition modeling
ResolutionAlong the XY platform (15 μm) and along the Z direction (5 μm)
Minimum Layer Thickness50 μm
Print Speed250 mm/s
Build Temperature TypeTemperature-monitored enclosed chamber
Maximum Chamber Temperature90 °C
Maximum Platform Temperature150 °C
Platform LevelingKinematic auto bed leveling
Maximum Extrusion Temperature450 °C
Build PlatformCeramic glass
Filament StorageEnclosed bay with moisture control
Air Filtration UnitHEPA H13 and activated carbon filter
Print MaterialPEEK, PLA, ABS, PETG
Bed Size600 × 400 × 250 mm3
Table 2. Constant parameters.
ParameterFDM (Fused Deposition Modeling)
Filament Diameter1.75 mm
Nozzle Diameter0.4 mm
Material TypePEEK
File CompatibilitySTL and G-code
Print Speed20 mm/s
Raster Angle±45°
Chamber Temperature60 °C
Printing Size (l × b × h)100 × 30 × 5 mm
Internal (Infill) StructureRectilinear
Table 3. Control factors and their levels.
Level NumberNozzle Temperature (°C)Layer Height (mm)Platform Temperature (°C)Infill Ratio
(%)
14000.1613060
24100.1814080
34200.20150100
Table 4. Process parameter selection for desktop FDM 3D printer unit.
Run/Sample NumberNozzle
Temperature (°C)
Layer
Thickness (mm)
Platform
Temperature (°C)
Infill Rate (%)
14000.1613060
24000.1814080
34000.2150100
44100.16140100
54100.1815060
64100.213080
74200.1615080
84200.18130100
94200.214060
Table 5. Tensile stress and strain.
Run/Sample No.Tensile Stress at Break (MPa)Strain at Break (%)
AverageMinimumMaximumStandard DeviationAverageMinimumMaximumStandard Deviation
145.3647.2431.70129.43425.53.343
263.264.561.51.3588.261061.545
368.270661.6057.41051.935
466.0467.2641.31611.71592.387
554.556531.2028.541162.170
659.4661581.2487.1941.981
752.245450.51.3838.51161.904
871.473701.2948.24105.51.799
950.452491.29427.535205.590
Table 6. Compressive stress and strain.
Run/
Sample No.
Compression Stress at Break (MPa)Strain at Break (%)
AverageMinimumMaximumStandard DeviationAverageMinimumMaximumStandard Deviation
1104.21081003.09421.73015.55.805
2116.21191132.5643441.527.56.548
3120.6123.51182.16232.139227.215
41671731604.95078906510.368
5113.41161111.98144.455358.112
6116.11181141.5174355309.906
7115.81181132.08028.238188.438
8164.41681603.45373856010.368
972.575702.06225.835186.723
Table 7. Variance and standard deviation in tensile and compressive loading for various samples.
GroupsCountTensile LoadingCompressive Loading
Stress (MPa)Strain (%)Stress (MPa)Strain (%)
SumAverageVarianceSumAverageVarianceSumAverageVarianceSumAverageVariance
15226.845.362.89314729.411.175521104.29.575108.521.733.7
2531663.21.84541.38.262.388581116.26.5751703442.875
3534168.22.575377.43.745603120.64.675160.532.152.05
45330.266.041.73358.511.75.783516724.539078107.5
55272.554.51.44542.78.544.708567113.43.92522244.465.8
65297.359.461.55835.57.13.925580.5116.12.32154398.125
75261.252.241.91342.58.53.625579115.84.32514128.271.2
8535771.41.67541.28.243.238822164.411.92536573107.5
9525250.41.675137.527.531.25362.572.54.2512925.845.2
Table 8. Warpage at each corner of the samples in mm.
Sample No.Corner ACorner BCorner CCorner DAverage
11.461.300.830.611.05
21.802.731.780.971.82
36.096.432.062.074.16
44.534.473.702.873.89
56.022.956.637.895.87
63.433.111.721.102.34
71.441.381.651.471.49
84.974.423.854.544.45
94.483.822.082.153.13
Average3.803.402.702.63
Table 9. Warpage at each corner of the samples in degrees.
Sample No.Corner ACorner BCorner CCorner DAverage
13.36.31.62.23.35
24.97.54.42.14.72
320.713.48.85.512.10
419.615.511.211.514.45
517.212.821.623.218.70
610.810.67.65.98.72
76.05.76.45.55.90
821.912.013.521.117.12
922.011.79.611.413.67
Average14.0410.619.419.82
Table 10. Weight calculation for each objective parameter.
NameCjWeights
TensileStress2.5732640.069236
Strain3.4983580.094127
CompressionStress2.6743970.071957
Strain5.8037760.156157
Warpage at each corner in mmA2.6304220.070774
B2.2691630.061054
C2.3259580.062582
D2.4746880.066584
Warpage at each corner in degreesA2.9064780.078202
B2.3545170.063351
C4.8249570.129821
D2.8303650.076154
Sum of weights1
Table 11. Multi-objective optimization methods and their ranking.
Run/Sample NumberNozzle
Temperature (°C)
Layer
Thickness (mm)
Platform
Temperature (°C)
Infill Rate (%)Ranks
14000.16130601
24000.18140803
34000.21501005
44100.161401007
54100.18150608
64100.2130804
74200.16150802
84200.181301006
94200.2140609
Disclaimer/Publisher’s Note: The statements, opinions and data contained in all publications are solely those of the individual author(s) and contributor(s) and not of MDPI and/or the editor(s). MDPI and/or the editor(s) disclaim responsibility for any injury to people or property resulting from any ideas, methods, instructions or products referred to in the content.

